Marlborough, MO Map & Demographics
Marlborough Map
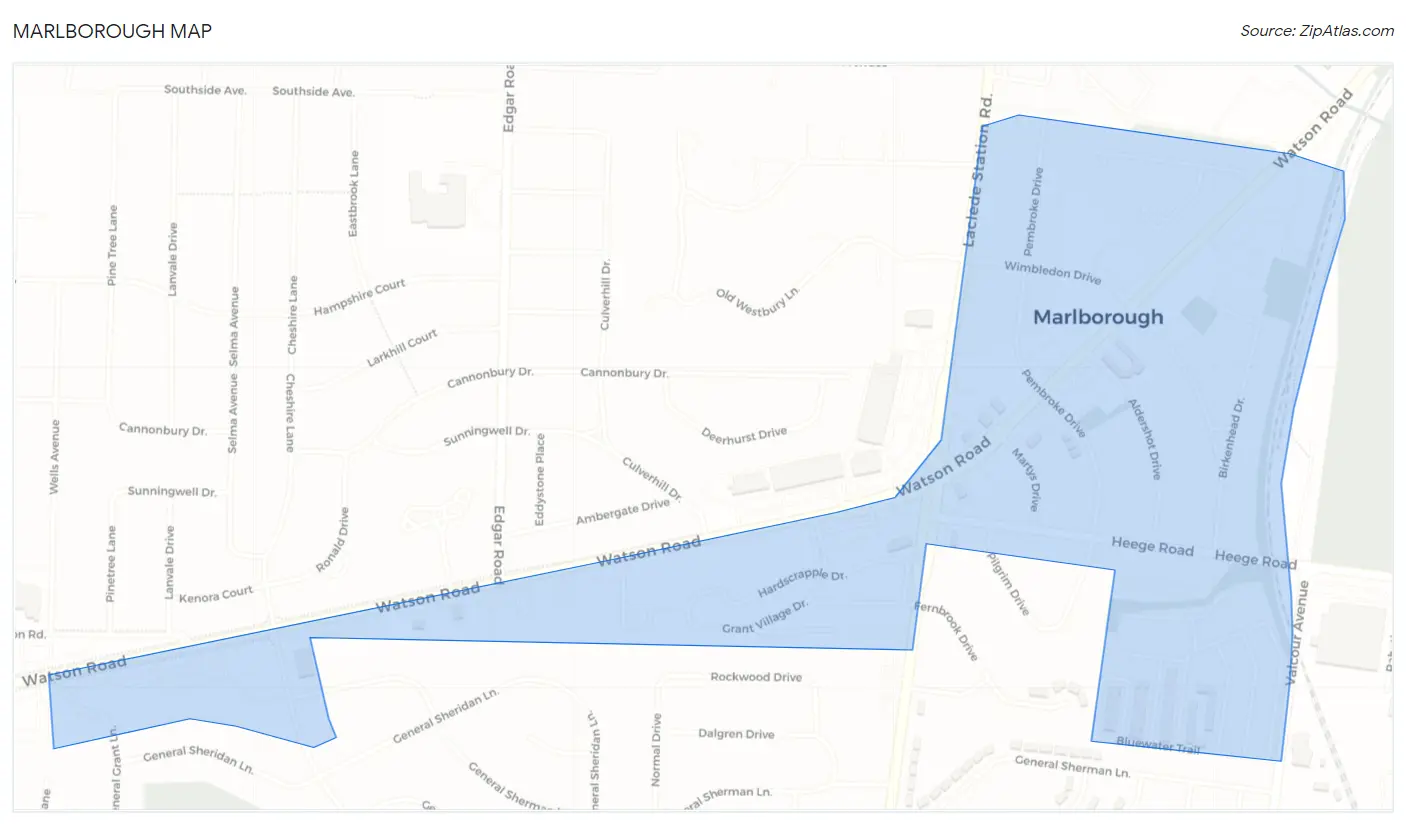
Marlborough Overview
$35,071
PER CAPITA INCOME
$90,347
AVG FAMILY INCOME
$50,000
AVG HOUSEHOLD INCOME
7.4%
WAGE / INCOME GAP [ % ]
92.6¢/ $1
WAGE / INCOME GAP [ $ ]
0.35
INEQUALITY / GINI INDEX
2,492
TOTAL POPULATION
1,258
MALE POPULATION
1,234
FEMALE POPULATION
101.94
MALES / 100 FEMALES
98.09
FEMALES / 100 MALES
30.0
MEDIAN AGE
2.3
AVG FAMILY SIZE
1.6
AVG HOUSEHOLD SIZE
1,952
LABOR FORCE [ PEOPLE ]
83.2%
PERCENT IN LABOR FORCE
8.0%
UNEMPLOYMENT RATE
Marlborough Area Codes
Income in Marlborough
Income Overview in Marlborough
Per Capita Income in Marlborough is $35,071, while median incomes of families and households are $90,347 and $50,000 respectively.
| Characteristic | Number | Measure |
| Per Capita Income | 2,492 | $35,071 |
| Median Family Income | 511 | $90,347 |
| Mean Family Income | 511 | $84,842 |
| Median Household Income | 1,546 | $50,000 |
| Mean Household Income | 1,546 | $55,683 |
| Income Deficit | 511 | $0 |
| Wage / Income Gap (%) | 2,492 | 7.43% |
| Wage / Income Gap ($) | 2,492 | 92.57¢ per $1 |
| Gini / Inequality Index | 2,492 | 0.35 |
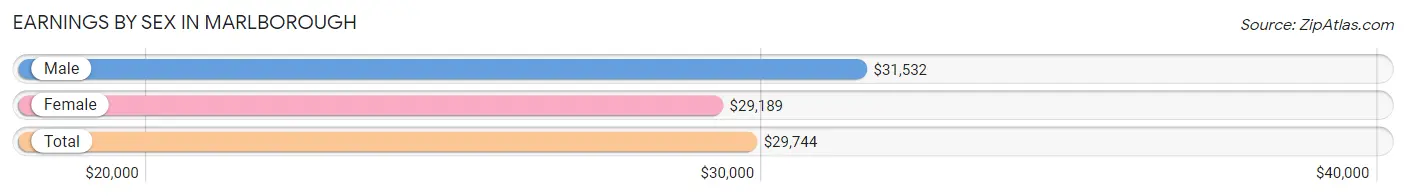
Earnings by Sex in Marlborough
Average Earnings in Marlborough are $29,744, $31,532 for men and $29,189 for women, a difference of 7.4%.
| Sex | Number | Average Earnings |
| Male | 970 (48.3%) | $31,532 |
| Female | 1,037 (51.7%) | $29,189 |
| Total | 2,007 (100.0%) | $29,744 |
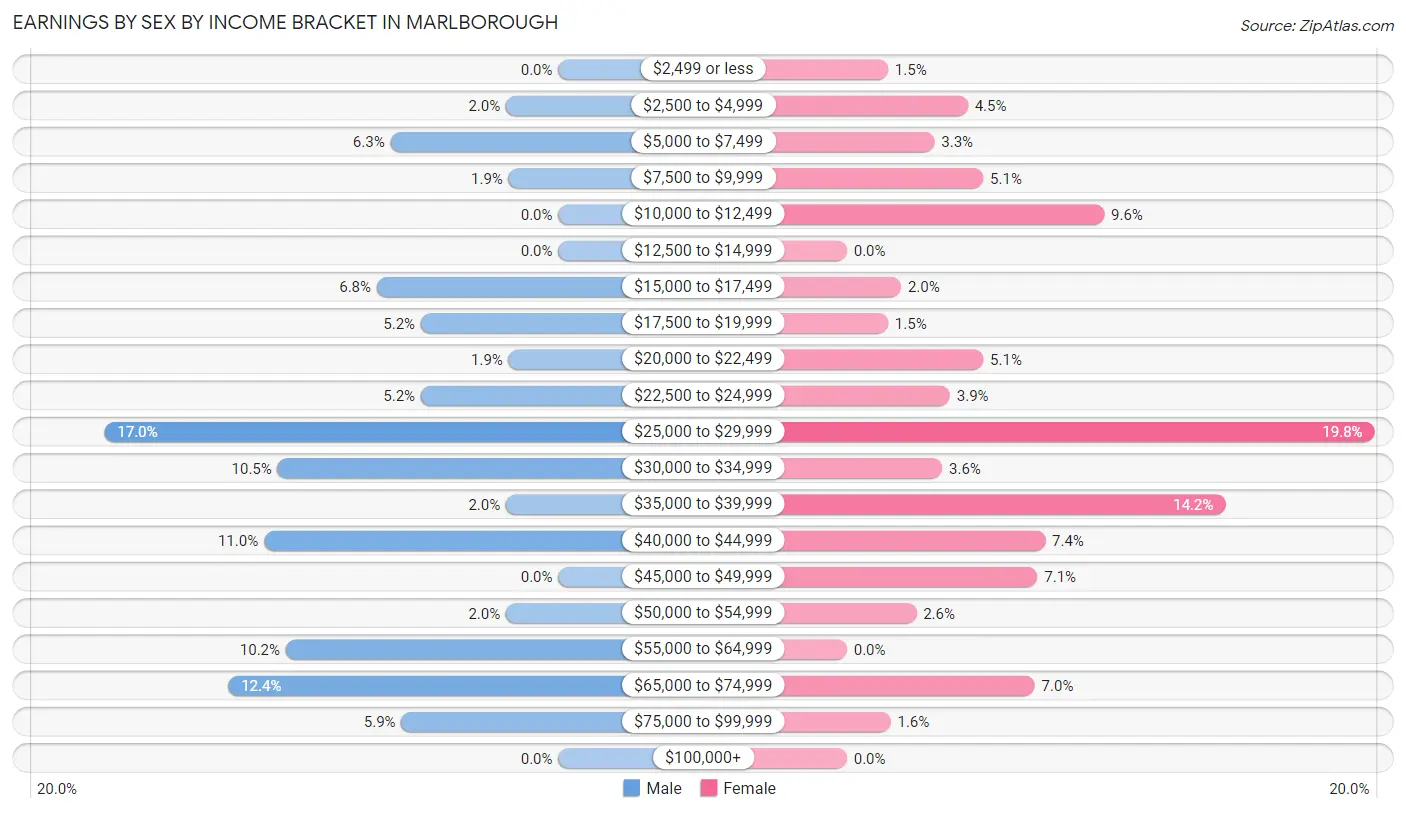
Earnings by Sex by Income Bracket in Marlborough
The most common earnings brackets in Marlborough are $25,000 to $29,999 for men (165 | 17.0%) and $25,000 to $29,999 for women (205 | 19.8%).
| Income | Male | Female |
| $2,499 or less | 0 (0.0%) | 16 (1.5%) |
| $2,500 to $4,999 | 19 (2.0%) | 47 (4.5%) |
| $5,000 to $7,499 | 61 (6.3%) | 34 (3.3%) |
| $7,500 to $9,999 | 18 (1.9%) | 53 (5.1%) |
| $10,000 to $12,499 | 0 (0.0%) | 100 (9.6%) |
| $12,500 to $14,999 | 0 (0.0%) | 0 (0.0%) |
| $15,000 to $17,499 | 66 (6.8%) | 21 (2.0%) |
| $17,500 to $19,999 | 50 (5.1%) | 16 (1.5%) |
| $20,000 to $22,499 | 18 (1.9%) | 53 (5.1%) |
| $22,500 to $24,999 | 50 (5.1%) | 40 (3.9%) |
| $25,000 to $29,999 | 165 (17.0%) | 205 (19.8%) |
| $30,000 to $34,999 | 102 (10.5%) | 37 (3.6%) |
| $35,000 to $39,999 | 19 (2.0%) | 147 (14.2%) |
| $40,000 to $44,999 | 107 (11.0%) | 77 (7.4%) |
| $45,000 to $49,999 | 0 (0.0%) | 74 (7.1%) |
| $50,000 to $54,999 | 19 (2.0%) | 27 (2.6%) |
| $55,000 to $64,999 | 99 (10.2%) | 0 (0.0%) |
| $65,000 to $74,999 | 120 (12.4%) | 73 (7.0%) |
| $75,000 to $99,999 | 57 (5.9%) | 17 (1.6%) |
| $100,000+ | 0 (0.0%) | 0 (0.0%) |
| Total | 970 (100.0%) | 1,037 (100.0%) |
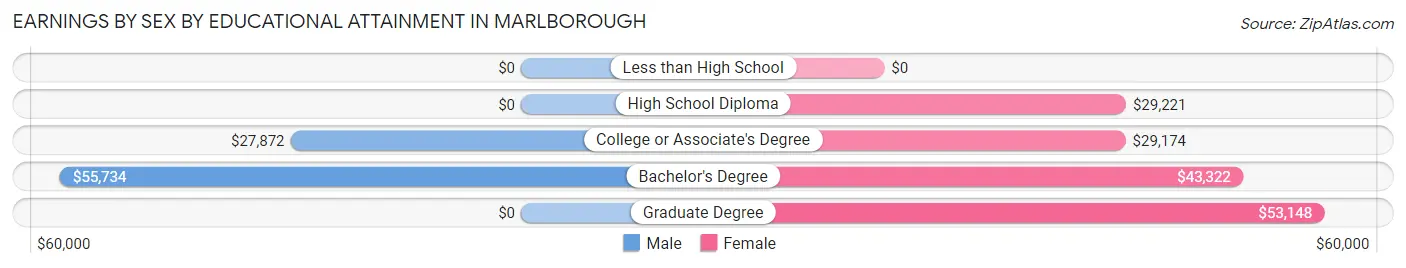
Earnings by Sex by Educational Attainment in Marlborough
Average earnings in Marlborough are $40,365 for men and $29,921 for women, a difference of 25.9%. Men with an educational attainment of bachelor's degree enjoy the highest average annual earnings of $55,734, while those with college or associate's degree education earn the least with $27,872. Women with an educational attainment of graduate degree earn the most with the average annual earnings of $53,148, while those with college or associate's degree education have the smallest earnings of $29,174.
| Educational Attainment | Male Income | Female Income |
| Less than High School | - | - |
| High School Diploma | - | - |
| College or Associate's Degree | $27,872 | $29,174 |
| Bachelor's Degree | $55,734 | $43,322 |
| Graduate Degree | - | - |
| Total | $40,365 | $29,921 |
Family Income in Marlborough
Family Income Brackets in Marlborough
According to the Marlborough family income data, there are 200 families falling into the $100,000 to $149,999 income range, which is the most common income bracket and makes up 39.1% of all families.
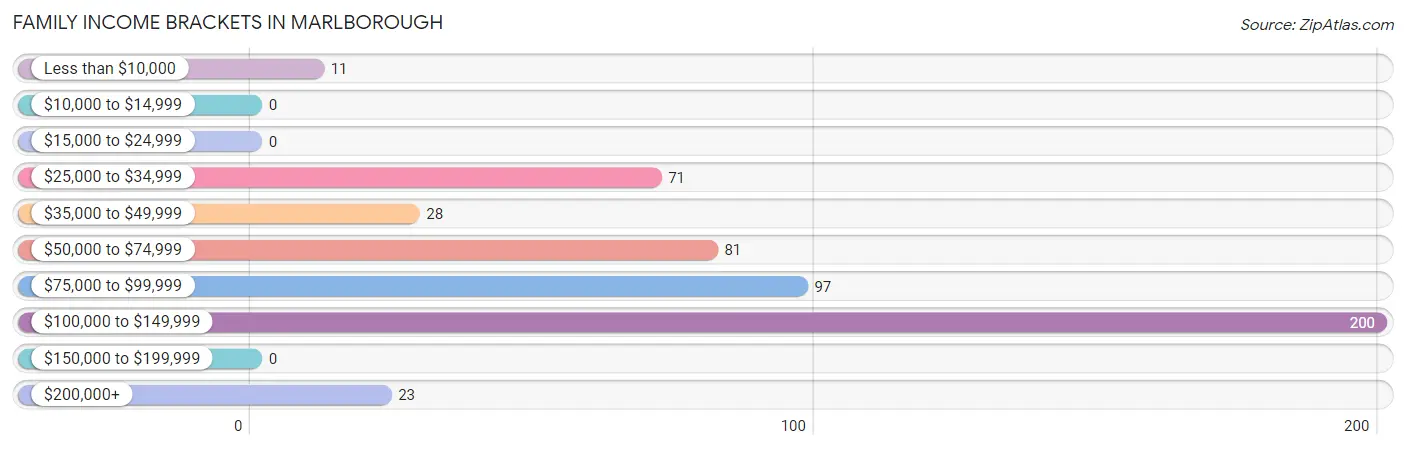
| Income Bracket | # Families | % Families |
| Less than $10,000 | 11 | 2.2% |
| $10,000 to $14,999 | 0 | 0.0% |
| $15,000 to $24,999 | 0 | 0.0% |
| $25,000 to $34,999 | 71 | 13.9% |
| $35,000 to $49,999 | 28 | 5.5% |
| $50,000 to $74,999 | 81 | 15.9% |
| $75,000 to $99,999 | 97 | 19.0% |
| $100,000 to $149,999 | 200 | 39.1% |
| $150,000 to $199,999 | 0 | 0.0% |
| $200,000+ | 23 | 4.5% |
Family Income by Famaliy Size in Marlborough
2-person families (418 | 81.8%) account for the highest median family income in Marlborough with $91,250 per family, while 2-person families (418 | 81.8%) have the highest median income of $45,625 per family member.
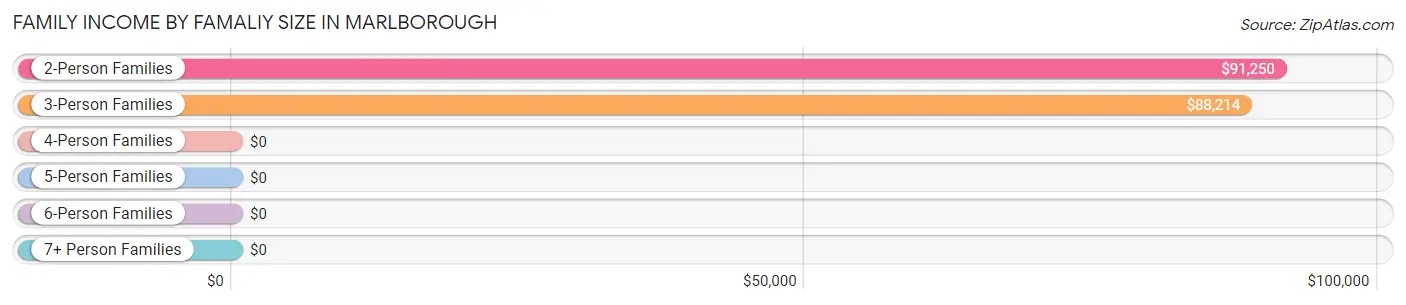
| Income Bracket | # Families | Median Income |
| 2-Person Families | 418 (81.8%) | $91,250 |
| 3-Person Families | 76 (14.9%) | $88,214 |
| 4-Person Families | 17 (3.3%) | $0 |
| 5-Person Families | 0 (0.0%) | $0 |
| 6-Person Families | 0 (0.0%) | $0 |
| 7+ Person Families | 0 (0.0%) | $0 |
| Total | 511 (100.0%) | $90,347 |
Family Income by Number of Earners in Marlborough
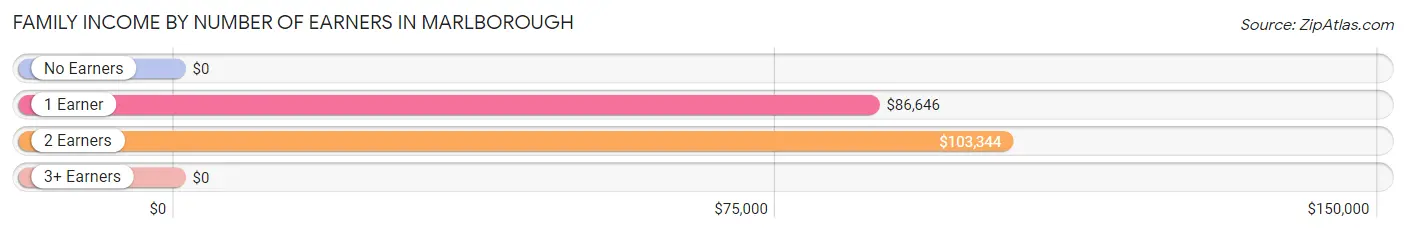
| Number of Earners | # Families | Median Income |
| No Earners | 27 (5.3%) | $0 |
| 1 Earner | 218 (42.7%) | $86,646 |
| 2 Earners | 245 (47.9%) | $103,344 |
| 3+ Earners | 21 (4.1%) | $0 |
| Total | 511 (100.0%) | $90,347 |
Household Income in Marlborough
Household Income Brackets in Marlborough
With 356 households falling in the category, the $50,000 to $74,999 income range is the most frequent in Marlborough, accounting for 23.0% of all households.
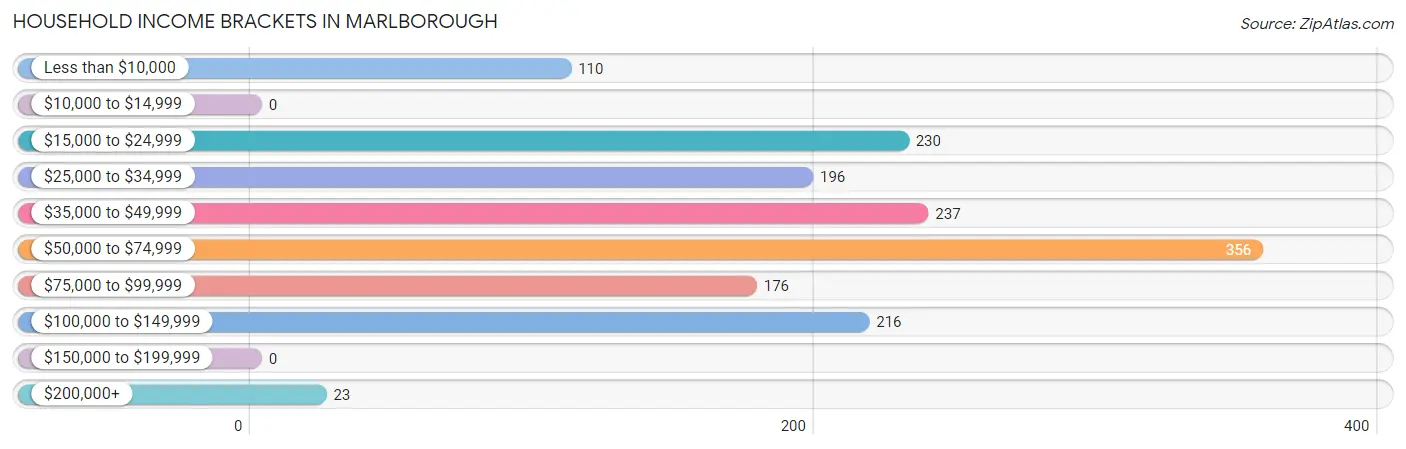
| Income Bracket | # Households | % Households |
| Less than $10,000 | 110 | 7.1% |
| $10,000 to $14,999 | 0 | 0.0% |
| $15,000 to $24,999 | 230 | 14.9% |
| $25,000 to $34,999 | 196 | 12.7% |
| $35,000 to $49,999 | 237 | 15.3% |
| $50,000 to $74,999 | 356 | 23.0% |
| $75,000 to $99,999 | 176 | 11.4% |
| $100,000 to $149,999 | 216 | 14.0% |
| $150,000 to $199,999 | 0 | 0.0% |
| $200,000+ | 23 | 1.5% |
Household Income by Householder Age in Marlborough
The median household income in Marlborough is $50,000, with the highest median household income of $59,222 found in the 45 to 64 years age bracket for the primary householder. A total of 215 households (13.9%) fall into this category. Meanwhile, the 15 to 24 years age bracket for the primary householder has the lowest median household income of $0, with 328 households (21.2%) in this group.
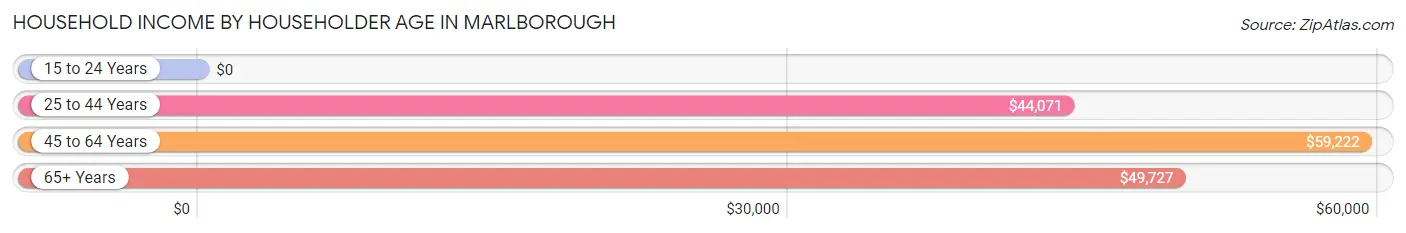
| Income Bracket | # Households | Median Income |
| 15 to 24 Years | 328 (21.2%) | $0 |
| 25 to 44 Years | 738 (47.7%) | $44,071 |
| 45 to 64 Years | 215 (13.9%) | $59,222 |
| 65+ Years | 265 (17.1%) | $49,727 |
| Total | 1,546 (100.0%) | $50,000 |
Poverty in Marlborough
Income Below Poverty by Sex and Age in Marlborough
With 7.5% poverty level for males and 9.2% for females among the residents of Marlborough, 18 to 24 year old males and 18 to 24 year old females are the most vulnerable to poverty, with 80 males (35.2%) and 83 females (30.3%) in their respective age groups living below the poverty level.
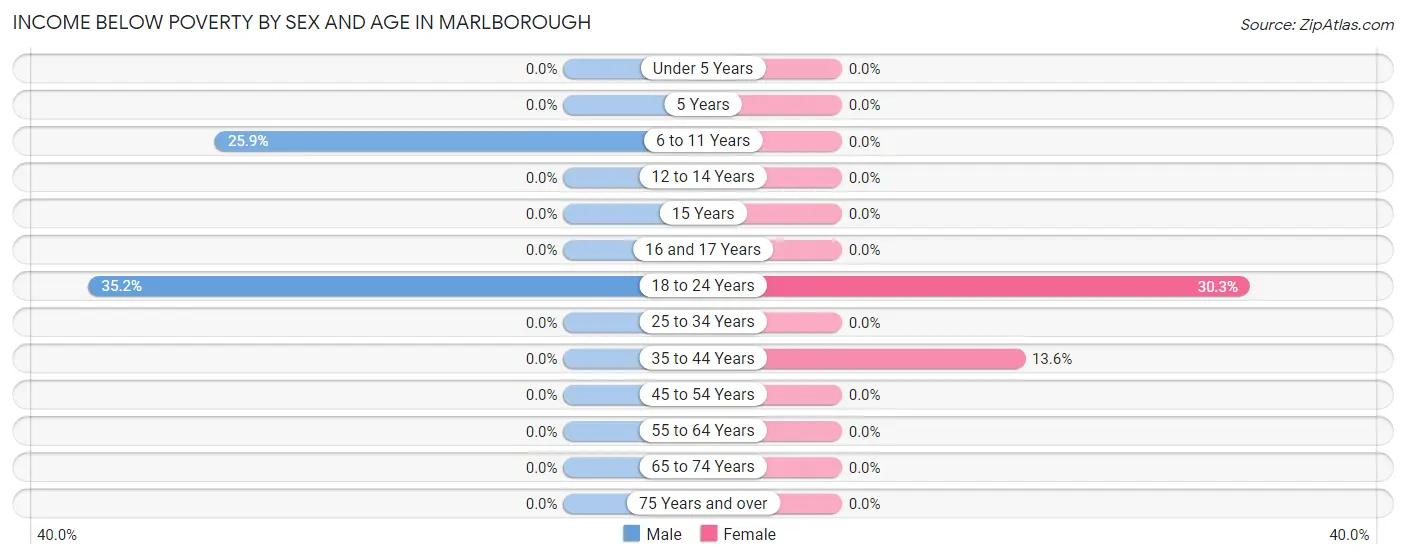
| Age Bracket | Male | Female |
| Under 5 Years | 0 (0.0%) | 0 (0.0%) |
| 5 Years | 0 (0.0%) | 0 (0.0%) |
| 6 to 11 Years | 15 (25.9%) | 0 (0.0%) |
| 12 to 14 Years | 0 (0.0%) | 0 (0.0%) |
| 15 Years | 0 (0.0%) | 0 (0.0%) |
| 16 and 17 Years | 0 (0.0%) | 0 (0.0%) |
| 18 to 24 Years | 80 (35.2%) | 83 (30.3%) |
| 25 to 34 Years | 0 (0.0%) | 0 (0.0%) |
| 35 to 44 Years | 0 (0.0%) | 31 (13.6%) |
| 45 to 54 Years | 0 (0.0%) | 0 (0.0%) |
| 55 to 64 Years | 0 (0.0%) | 0 (0.0%) |
| 65 to 74 Years | 0 (0.0%) | 0 (0.0%) |
| 75 Years and over | 0 (0.0%) | 0 (0.0%) |
| Total | 95 (7.5%) | 114 (9.2%) |
Income Above Poverty by Sex and Age in Marlborough
According to the poverty statistics in Marlborough, males aged under 5 years and females aged under 5 years are the age groups that are most secure financially, with 100.0% of males and 100.0% of females in these age groups living above the poverty line.
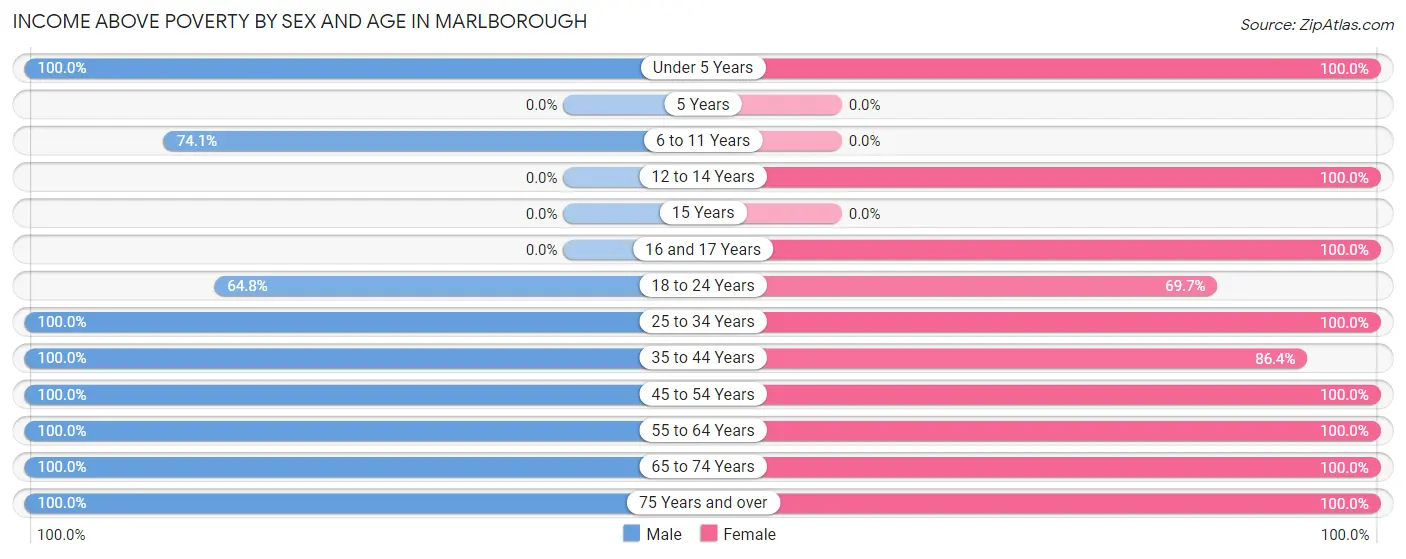
| Age Bracket | Male | Female |
| Under 5 Years | 34 (100.0%) | 17 (100.0%) |
| 5 Years | 0 (0.0%) | 0 (0.0%) |
| 6 to 11 Years | 43 (74.1%) | 0 (0.0%) |
| 12 to 14 Years | 0 (0.0%) | 37 (100.0%) |
| 15 Years | 0 (0.0%) | 0 (0.0%) |
| 16 and 17 Years | 0 (0.0%) | 68 (100.0%) |
| 18 to 24 Years | 147 (64.8%) | 191 (69.7%) |
| 25 to 34 Years | 449 (100.0%) | 257 (100.0%) |
| 35 to 44 Years | 212 (100.0%) | 197 (86.4%) |
| 45 to 54 Years | 11 (100.0%) | 130 (100.0%) |
| 55 to 64 Years | 94 (100.0%) | 52 (100.0%) |
| 65 to 74 Years | 104 (100.0%) | 124 (100.0%) |
| 75 Years and over | 69 (100.0%) | 47 (100.0%) |
| Total | 1,163 (92.4%) | 1,120 (90.8%) |
Income Below Poverty Among Married-Couple Families in Marlborough
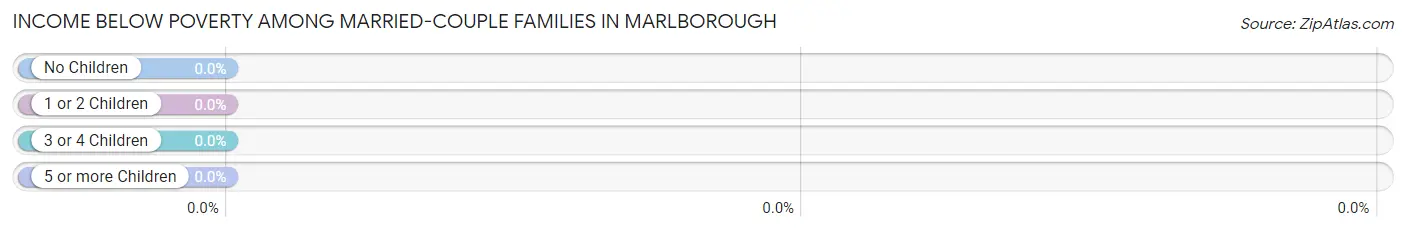
| Children | Above Poverty | Below Poverty |
| No Children | 311 (100.0%) | 0 (0.0%) |
| 1 or 2 Children | 17 (100.0%) | 0 (0.0%) |
| 3 or 4 Children | 0 (0.0%) | 0 (0.0%) |
| 5 or more Children | 0 (0.0%) | 0 (0.0%) |
| Total | 328 (100.0%) | 0 (0.0%) |
Income Below Poverty Among Single-Parent Households in Marlborough
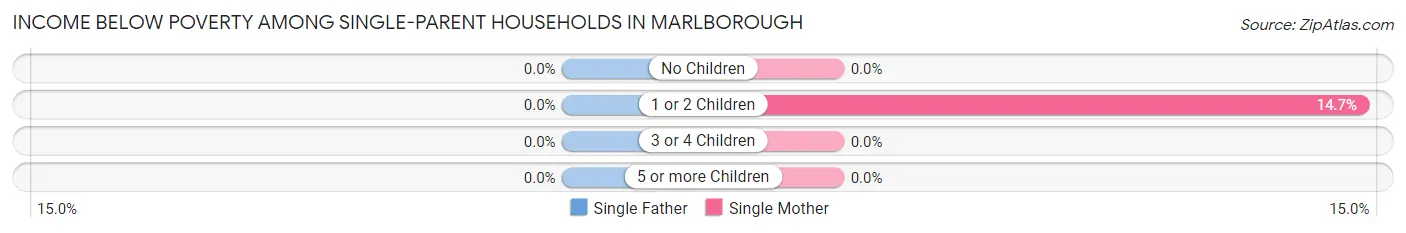
| Children | Single Father | Single Mother |
| No Children | 0 (0.0%) | 0 (0.0%) |
| 1 or 2 Children | 0 (0.0%) | 11 (14.7%) |
| 3 or 4 Children | 0 (0.0%) | 0 (0.0%) |
| 5 or more Children | 0 (0.0%) | 0 (0.0%) |
| Total | 0 (0.0%) | 11 (9.8%) |
Income Below Poverty Among Married-Couple vs Single-Parent Households in Marlborough
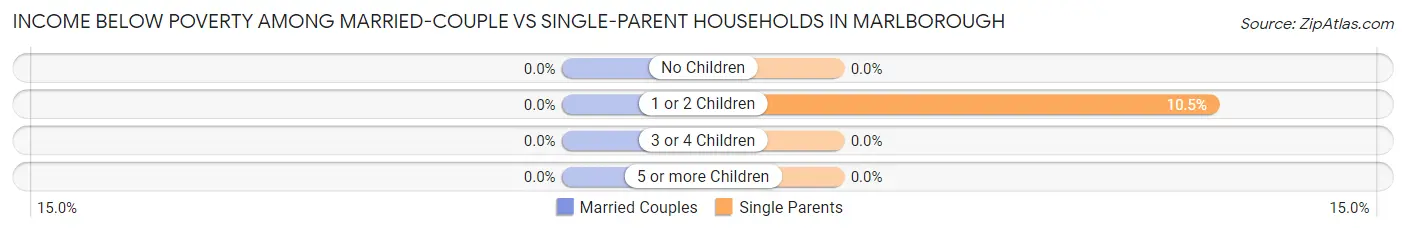
| Children | Married-Couple Families | Single-Parent Households |
| No Children | 0 (0.0%) | 0 (0.0%) |
| 1 or 2 Children | 0 (0.0%) | 11 (10.5%) |
| 3 or 4 Children | 0 (0.0%) | 0 (0.0%) |
| 5 or more Children | 0 (0.0%) | 0 (0.0%) |
| Total | 0 (0.0%) | 11 (6.0%) |
Race in Marlborough
The most populous races in Marlborough are White / Caucasian (2,040 | 81.9%), Two or more Races (222 | 8.9%), and Hispanic or Latino (194 | 7.8%).
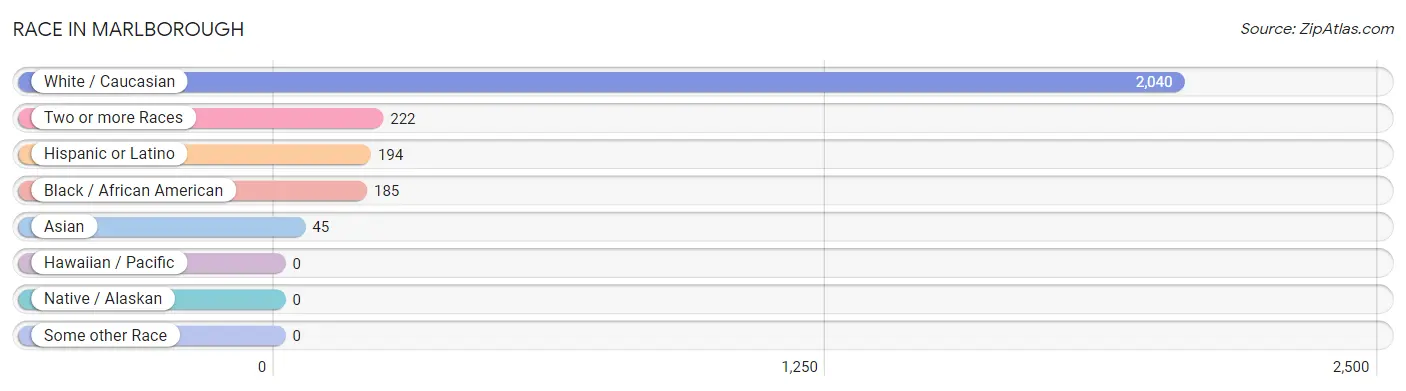
| Race | # Population | % Population |
| Asian | 45 | 1.8% |
| Black / African American | 185 | 7.4% |
| Hawaiian / Pacific | 0 | 0.0% |
| Hispanic or Latino | 194 | 7.8% |
| Native / Alaskan | 0 | 0.0% |
| White / Caucasian | 2,040 | 81.9% |
| Two or more Races | 222 | 8.9% |
| Some other Race | 0 | 0.0% |
| Total | 2,492 | 100.0% |
Ancestry in Marlborough
The most populous ancestries reported in Marlborough are German (637 | 25.6%), Irish (479 | 19.2%), English (402 | 16.1%), Italian (217 | 8.7%), and American (175 | 7.0%), together accounting for 76.6% of all Marlborough residents.
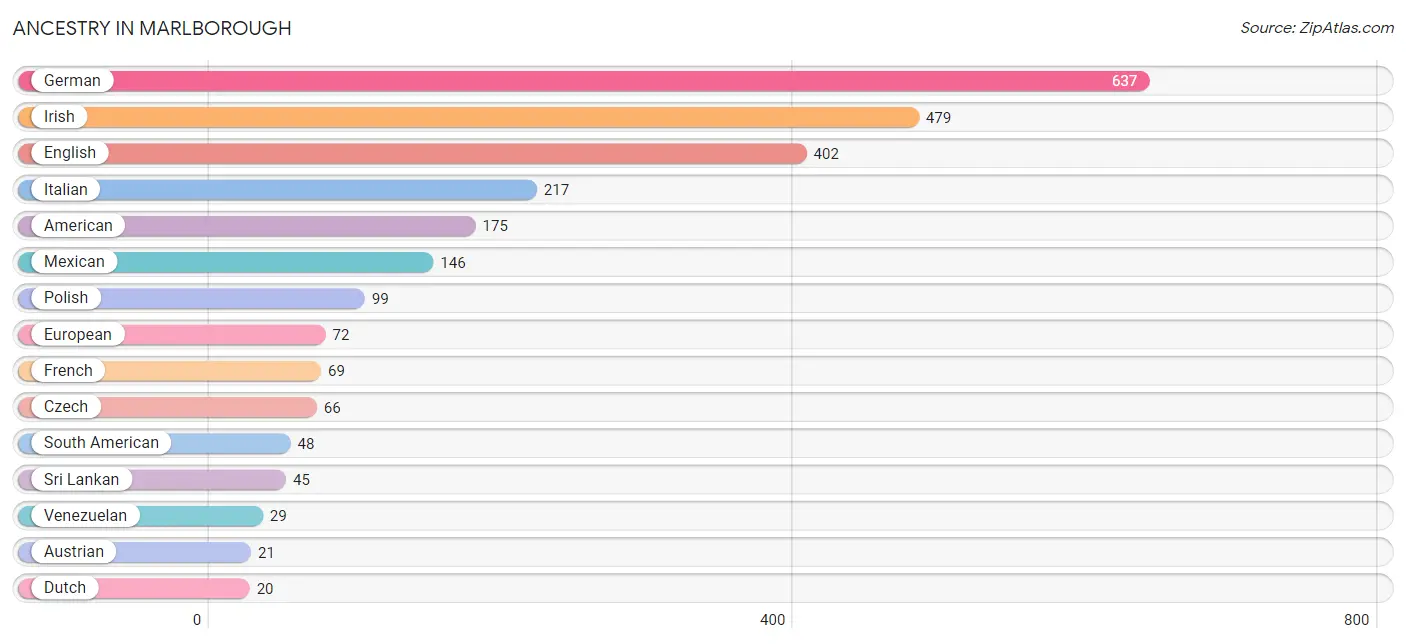
| Ancestry | # Population | % Population |
| American | 175 | 7.0% |
| Australian | 15 | 0.6% |
| Austrian | 21 | 0.8% |
| Czech | 66 | 2.6% |
| Dutch | 20 | 0.8% |
| Ecuadorian | 19 | 0.8% |
| English | 402 | 16.1% |
| European | 72 | 2.9% |
| French | 69 | 2.8% |
| German | 637 | 25.6% |
| Irish | 479 | 19.2% |
| Italian | 217 | 8.7% |
| Mexican | 146 | 5.9% |
| Northern European | 18 | 0.7% |
| Polish | 99 | 4.0% |
| Scotch-Irish | 15 | 0.6% |
| South American | 48 | 1.9% |
| Sri Lankan | 45 | 1.8% |
| Venezuelan | 29 | 1.2% | View All 19 Rows |
Immigrants in Marlborough
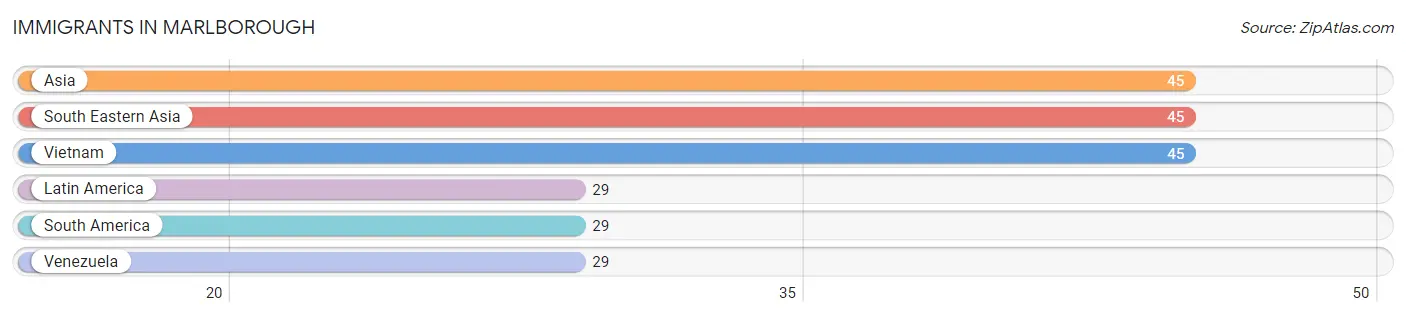
The most numerous immigrant groups reported in Marlborough came from Asia (45 | 1.8%), South Eastern Asia (45 | 1.8%), Vietnam (45 | 1.8%), Latin America (29 | 1.2%), and South America (29 | 1.2%), together accounting for 7.7% of all Marlborough residents.
| Immigration Origin | # Population | % Population |
| Asia | 45 | 1.8% |
| Latin America | 29 | 1.2% |
| South America | 29 | 1.2% |
| South Eastern Asia | 45 | 1.8% |
| Venezuela | 29 | 1.2% |
| Vietnam | 45 | 1.8% | View All 6 Rows |
Sex and Age in Marlborough
Sex and Age in Marlborough
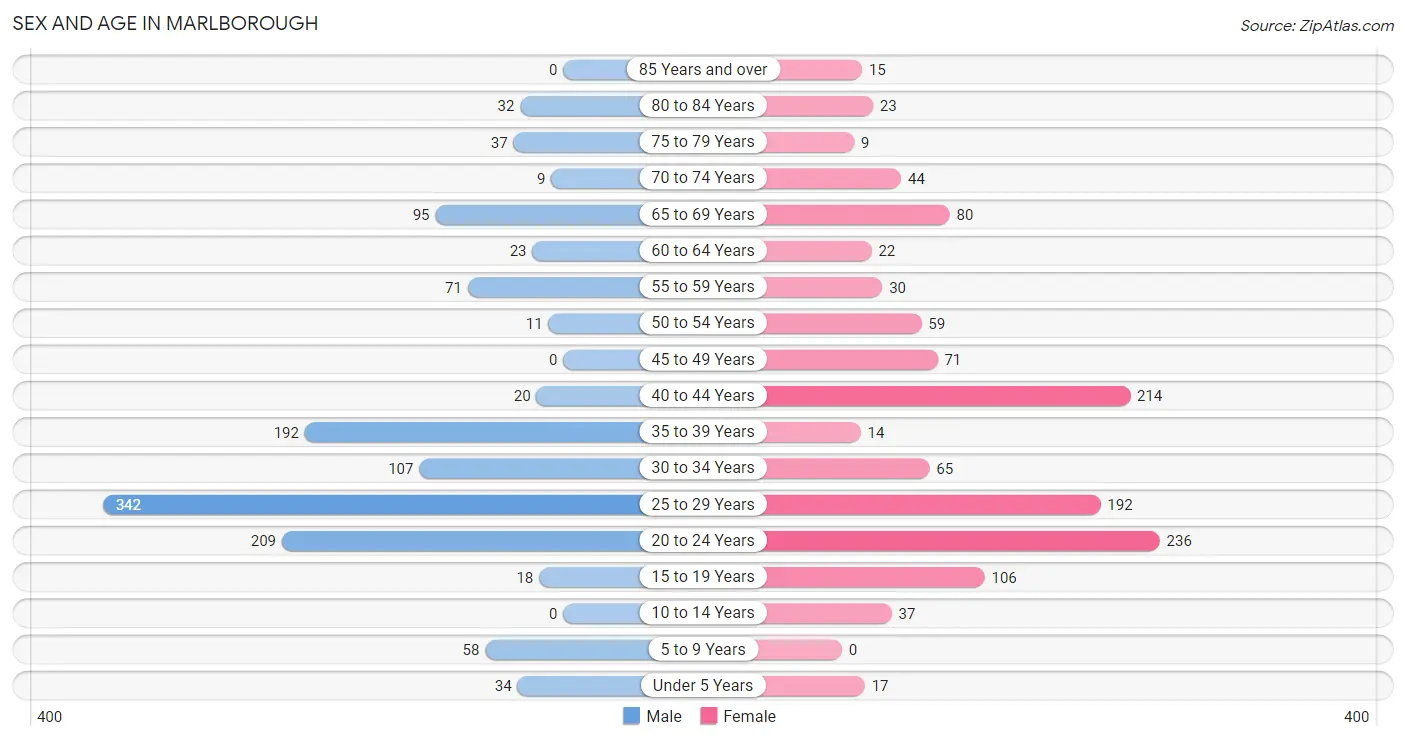
The most populous age groups in Marlborough are 25 to 29 Years (342 | 27.2%) for men and 20 to 24 Years (236 | 19.1%) for women.
| Age Bracket | Male | Female |
| Under 5 Years | 34 (2.7%) | 17 (1.4%) |
| 5 to 9 Years | 58 (4.6%) | 0 (0.0%) |
| 10 to 14 Years | 0 (0.0%) | 37 (3.0%) |
| 15 to 19 Years | 18 (1.4%) | 106 (8.6%) |
| 20 to 24 Years | 209 (16.6%) | 236 (19.1%) |
| 25 to 29 Years | 342 (27.2%) | 192 (15.6%) |
| 30 to 34 Years | 107 (8.5%) | 65 (5.3%) |
| 35 to 39 Years | 192 (15.3%) | 14 (1.1%) |
| 40 to 44 Years | 20 (1.6%) | 214 (17.3%) |
| 45 to 49 Years | 0 (0.0%) | 71 (5.8%) |
| 50 to 54 Years | 11 (0.9%) | 59 (4.8%) |
| 55 to 59 Years | 71 (5.6%) | 30 (2.4%) |
| 60 to 64 Years | 23 (1.8%) | 22 (1.8%) |
| 65 to 69 Years | 95 (7.5%) | 80 (6.5%) |
| 70 to 74 Years | 9 (0.7%) | 44 (3.6%) |
| 75 to 79 Years | 37 (2.9%) | 9 (0.7%) |
| 80 to 84 Years | 32 (2.5%) | 23 (1.9%) |
| 85 Years and over | 0 (0.0%) | 15 (1.2%) |
| Total | 1,258 (100.0%) | 1,234 (100.0%) |
Families and Households in Marlborough
Median Family Size in Marlborough
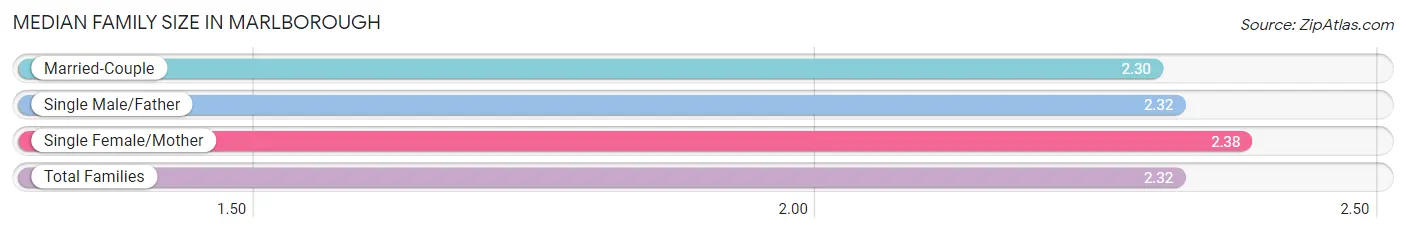
The median family size in Marlborough is 2.32 persons per family, with single female/mother families (112 | 21.9%) accounting for the largest median family size of 2.38 persons per family. On the other hand, married-couple families (328 | 64.2%) represent the smallest median family size with 2.30 persons per family.
| Family Type | # Families | Family Size |
| Married-Couple | 328 (64.2%) | 2.30 |
| Single Male/Father | 71 (13.9%) | 2.32 |
| Single Female/Mother | 112 (21.9%) | 2.38 |
| Total Families | 511 (100.0%) | 2.32 |
Median Household Size in Marlborough
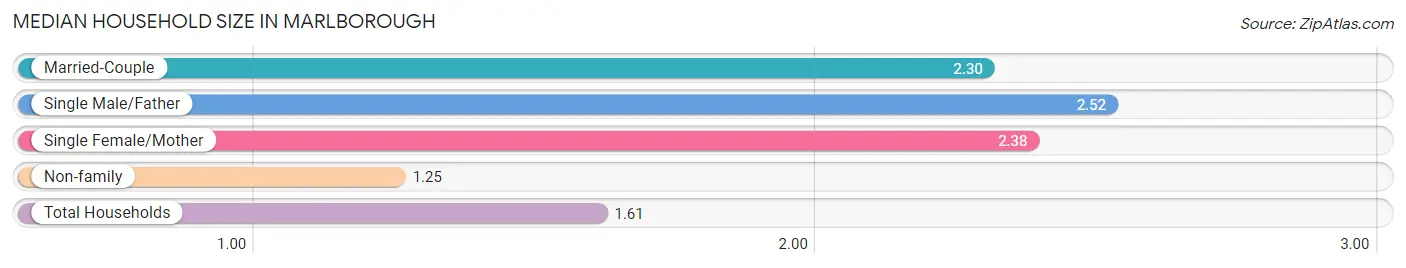
The median household size in Marlborough is 1.61 persons per household, with single male/father households (71 | 4.6%) accounting for the largest median household size of 2.52 persons per household. non-family households (1,035 | 66.9%) represent the smallest median household size with 1.25 persons per household.
| Household Type | # Households | Household Size |
| Married-Couple | 328 (21.2%) | 2.30 |
| Single Male/Father | 71 (4.6%) | 2.52 |
| Single Female/Mother | 112 (7.2%) | 2.38 |
| Non-family | 1,035 (66.9%) | 1.25 |
| Total Households | 1,546 (100.0%) | 1.61 |
Household Size by Marriage Status in Marlborough
Out of a total of 1,546 households in Marlborough, 511 (33.1%) are family households, while 1,035 (66.9%) are nonfamily households. The most numerous type of family households are 2-person households, comprising 418, and the most common type of nonfamily households are 1-person households, comprising 783.
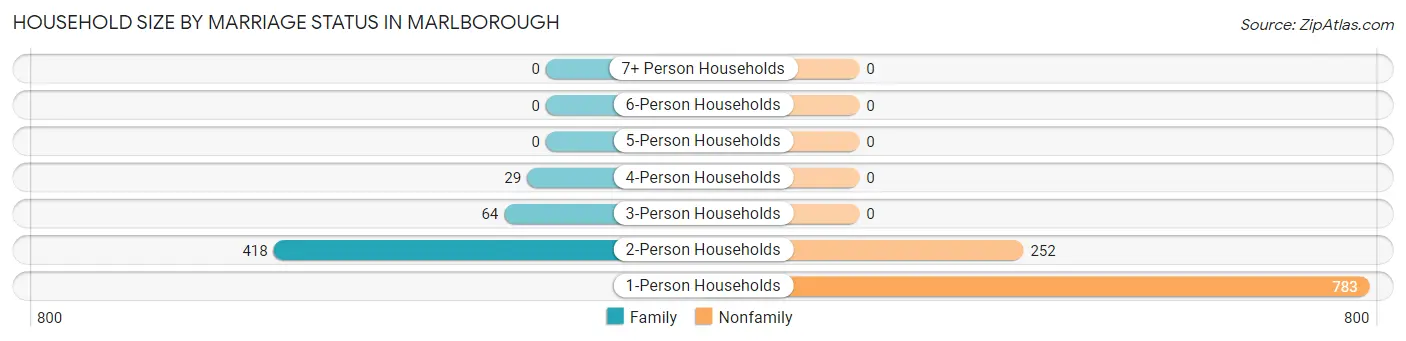
| Household Size | Family Households | Nonfamily Households |
| 1-Person Households | - | 783 (50.6%) |
| 2-Person Households | 418 (27.0%) | 252 (16.3%) |
| 3-Person Households | 64 (4.1%) | 0 (0.0%) |
| 4-Person Households | 29 (1.9%) | 0 (0.0%) |
| 5-Person Households | 0 (0.0%) | 0 (0.0%) |
| 6-Person Households | 0 (0.0%) | 0 (0.0%) |
| 7+ Person Households | 0 (0.0%) | 0 (0.0%) |
| Total | 511 (33.1%) | 1,035 (66.9%) |
Female Fertility in Marlborough
Fertility by Age in Marlborough
Average fertility rate in Marlborough is 20.0 births per 1,000 women. Women in the age bracket of 20 to 34 years have the highest fertility rate with 37.0 births per 1,000 women. Women in the age bracket of 20 to 34 years acount for 100.0% of all women with births.
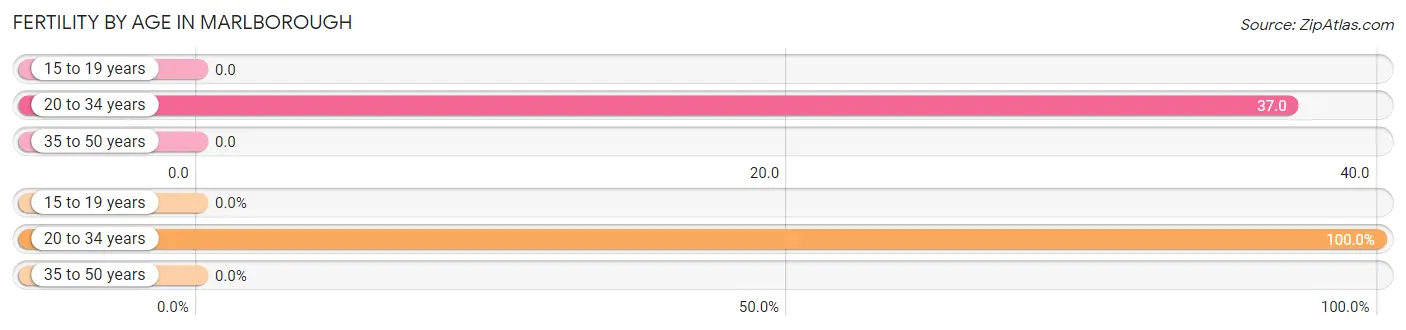
| Age Bracket | Women with Births | Births / 1,000 Women |
| 15 to 19 years | 0 (0.0%) | 0.0 |
| 20 to 34 years | 18 (100.0%) | 37.0 |
| 35 to 50 years | 0 (0.0%) | 0.0 |
| Total | 18 (100.0%) | 20.0 |
Fertility by Age by Marriage Status in Marlborough
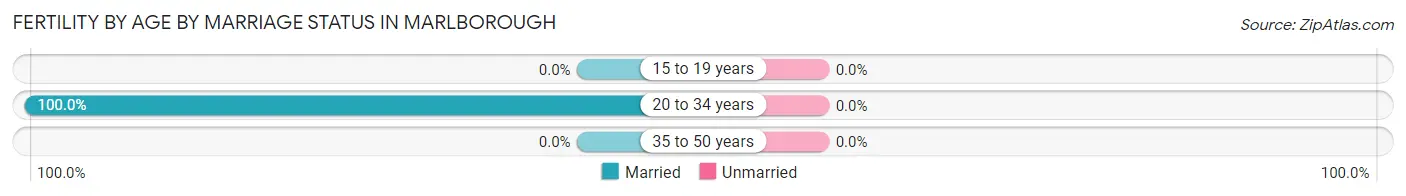
| Age Bracket | Married | Unmarried |
| 15 to 19 years | 0 (0.0%) | 0 (0.0%) |
| 20 to 34 years | 18 (100.0%) | 0 (0.0%) |
| 35 to 50 years | 0 (0.0%) | 0 (0.0%) |
| Total | 18 (100.0%) | 0 (0.0%) |
Fertility by Education in Marlborough
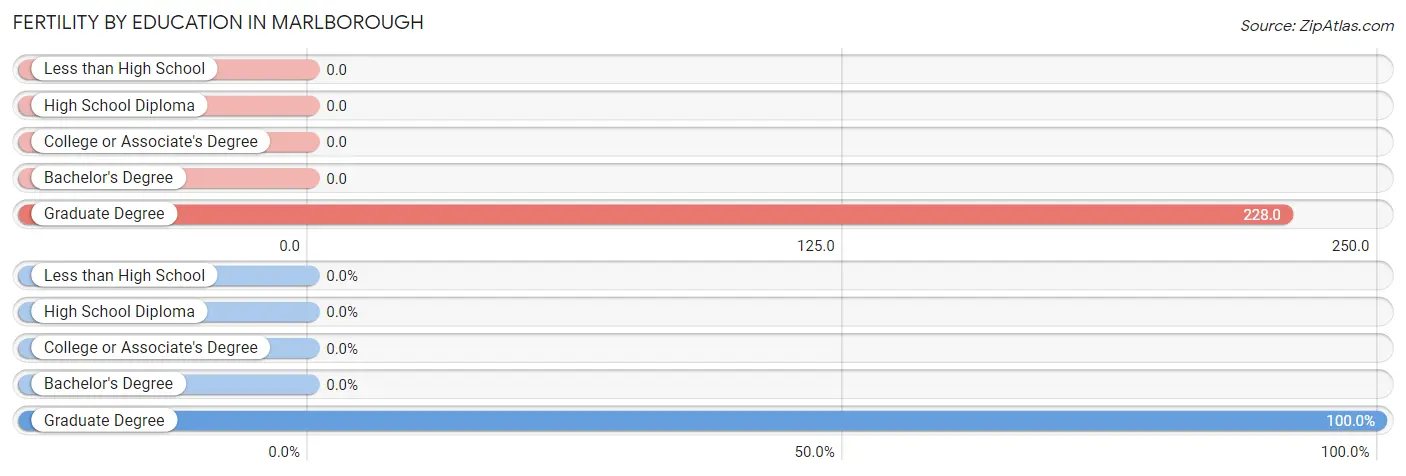
| Educational Attainment | Women with Births | Births / 1,000 Women |
| Less than High School | 0 (0.0%) | 0.0 |
| High School Diploma | 0 (0.0%) | 0.0 |
| College or Associate's Degree | 0 (0.0%) | 0.0 |
| Bachelor's Degree | 0 (0.0%) | 0.0 |
| Graduate Degree | 18 (100.0%) | 228.0 |
| Total | 18 (100.0%) | 20.0 |
Fertility by Education by Marriage Status in Marlborough
| Educational Attainment | Married | Unmarried |
| Less than High School | 0 (0.0%) | 0 (0.0%) |
| High School Diploma | 0 (0.0%) | 0 (0.0%) |
| College or Associate's Degree | 0 (0.0%) | 0 (0.0%) |
| Bachelor's Degree | 0 (0.0%) | 0 (0.0%) |
| Graduate Degree | 18 (100.0%) | 0 (0.0%) |
| Total | 18 (100.0%) | 0 (0.0%) |
Employment Characteristics in Marlborough
Employment by Class of Employer in Marlborough
Among the 1,780 employed individuals in Marlborough, private company employees (1,287 | 72.3%), not-for-profit organizations (328 | 18.4%), and local government employees (120 | 6.7%) make up the most common classes of employment.
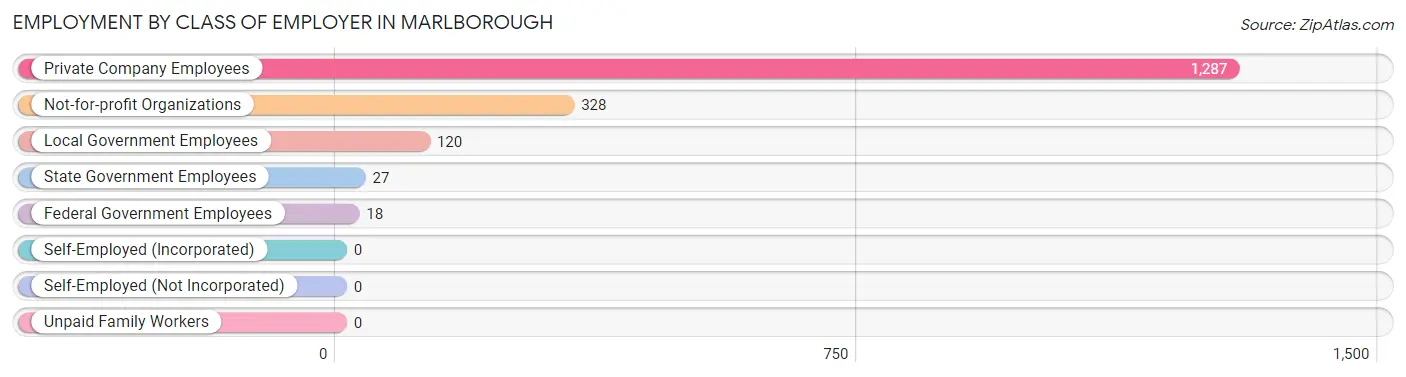
| Employer Class | # Employees | % Employees |
| Private Company Employees | 1,287 | 72.3% |
| Self-Employed (Incorporated) | 0 | 0.0% |
| Self-Employed (Not Incorporated) | 0 | 0.0% |
| Not-for-profit Organizations | 328 | 18.4% |
| Local Government Employees | 120 | 6.7% |
| State Government Employees | 27 | 1.5% |
| Federal Government Employees | 18 | 1.0% |
| Unpaid Family Workers | 0 | 0.0% |
| Total | 1,780 | 100.0% |
Employment Status by Age in Marlborough
According to the labor force statistics for Marlborough, out of the total population over 16 years of age (2,346), 83.2% or 1,952 individuals are in the labor force, with 8.0% or 156 of them unemployed. The age group with the highest labor force participation rate is 20 to 24 years, with 100.0% or 445 individuals in the labor force. Within the labor force, the 55 to 59 years age range has the highest percentage of unemployed individuals, with 52.5% or 53 of them being unemployed.
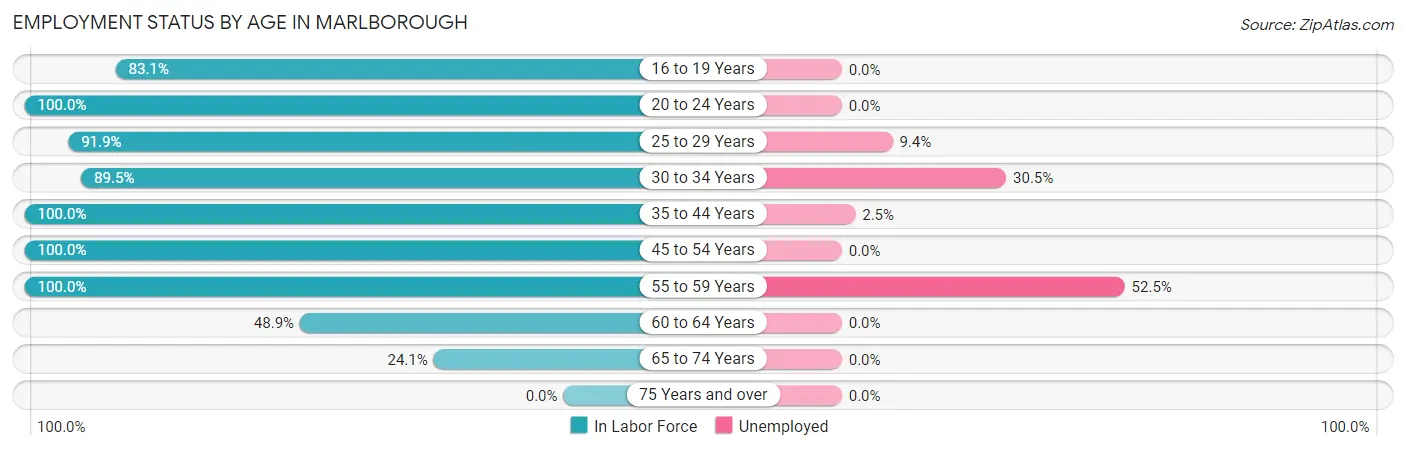
| Age Bracket | In Labor Force | Unemployed |
| 16 to 19 Years | 103 (83.1%) | 0 (0.0%) |
| 20 to 24 Years | 445 (100.0%) | 0 (0.0%) |
| 25 to 29 Years | 491 (91.9%) | 46 (9.4%) |
| 30 to 34 Years | 154 (89.5%) | 47 (30.5%) |
| 35 to 44 Years | 440 (100.0%) | 11 (2.5%) |
| 45 to 54 Years | 141 (100.0%) | 0 (0.0%) |
| 55 to 59 Years | 101 (100.0%) | 53 (52.5%) |
| 60 to 64 Years | 22 (48.9%) | 0 (0.0%) |
| 65 to 74 Years | 55 (24.1%) | 0 (0.0%) |
| 75 Years and over | 0 (0.0%) | 0 (0.0%) |
| Total | 1,952 (83.2%) | 156 (8.0%) |
Employment Status by Educational Attainment in Marlborough
According to labor force statistics for Marlborough, 94.1% of individuals (1,348) out of the total population between 25 and 64 years of age (1,433) are in the labor force, with 11.6% or 156 of them being unemployed. The group with the highest labor force participation rate are those with the educational attainment of less than high school, with 100.0% or 20 individuals in the labor force. Within the labor force, individuals with bachelor's degree or higher education have the highest percentage of unemployment, with 24.7% or 110 of them being unemployed.
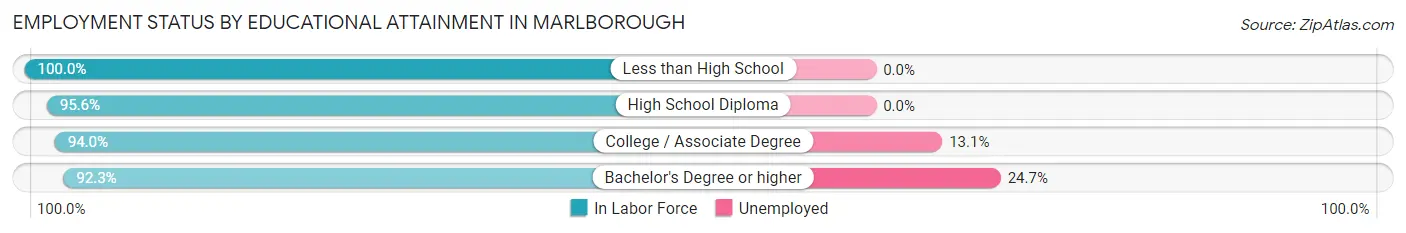
| Educational Attainment | In Labor Force | Unemployed |
| Less than High School | 20 (100.0%) | 0 (0.0%) |
| High School Diploma | 524 (95.6%) | 0 (0.0%) |
| College / Associate Degree | 359 (94.0%) | 50 (13.1%) |
| Bachelor's Degree or higher | 446 (92.3%) | 119 (24.7%) |
| Total | 1,348 (94.1%) | 166 (11.6%) |
Employment Occupations by Sex in Marlborough
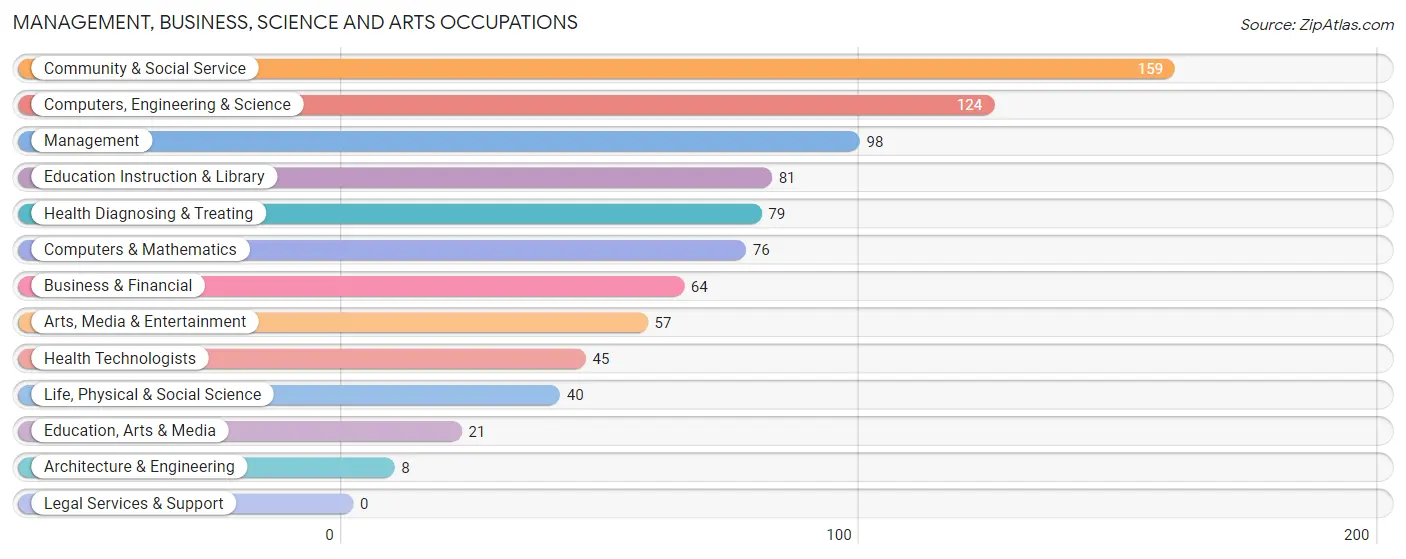
Management, Business, Science and Arts Occupations
The most common Management, Business, Science and Arts occupations in Marlborough are Community & Social Service (159 | 8.9%), Computers, Engineering & Science (124 | 6.9%), Management (98 | 5.5%), Education Instruction & Library (81 | 4.5%), and Health Diagnosing & Treating (79 | 4.4%).
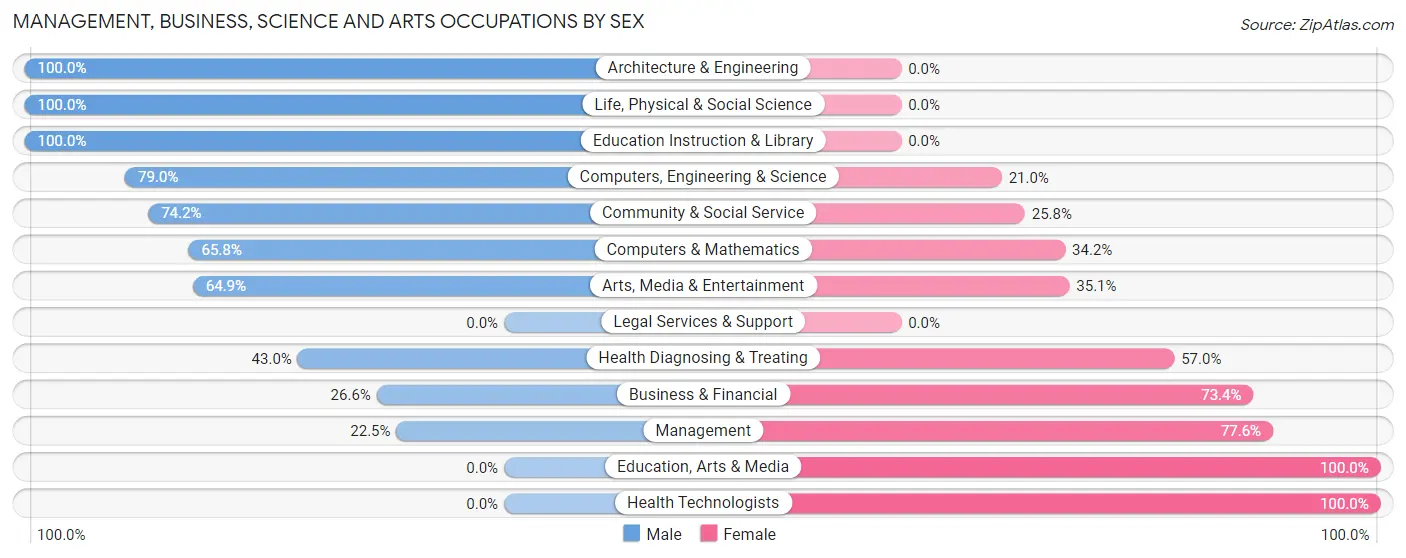
Management, Business, Science and Arts Occupations by Sex
Within the Management, Business, Science and Arts occupations in Marlborough, the most male-oriented occupations are Architecture & Engineering (100.0%), Life, Physical & Social Science (100.0%), and Education Instruction & Library (100.0%), while the most female-oriented occupations are Education, Arts & Media (100.0%), Health Technologists (100.0%), and Management (77.5%).
| Occupation | Male | Female |
| Management | 22 (22.5%) | 76 (77.5%) |
| Business & Financial | 17 (26.6%) | 47 (73.4%) |
| Computers, Engineering & Science | 98 (79.0%) | 26 (21.0%) |
| Computers & Mathematics | 50 (65.8%) | 26 (34.2%) |
| Architecture & Engineering | 8 (100.0%) | 0 (0.0%) |
| Life, Physical & Social Science | 40 (100.0%) | 0 (0.0%) |
| Community & Social Service | 118 (74.2%) | 41 (25.8%) |
| Education, Arts & Media | 0 (0.0%) | 21 (100.0%) |
| Legal Services & Support | 0 (0.0%) | 0 (0.0%) |
| Education Instruction & Library | 81 (100.0%) | 0 (0.0%) |
| Arts, Media & Entertainment | 37 (64.9%) | 20 (35.1%) |
| Health Diagnosing & Treating | 34 (43.0%) | 45 (57.0%) |
| Health Technologists | 0 (0.0%) | 45 (100.0%) |
| Total (Category) | 289 (55.1%) | 235 (44.9%) |
| Total (Overall) | 824 (45.9%) | 971 (54.1%) |
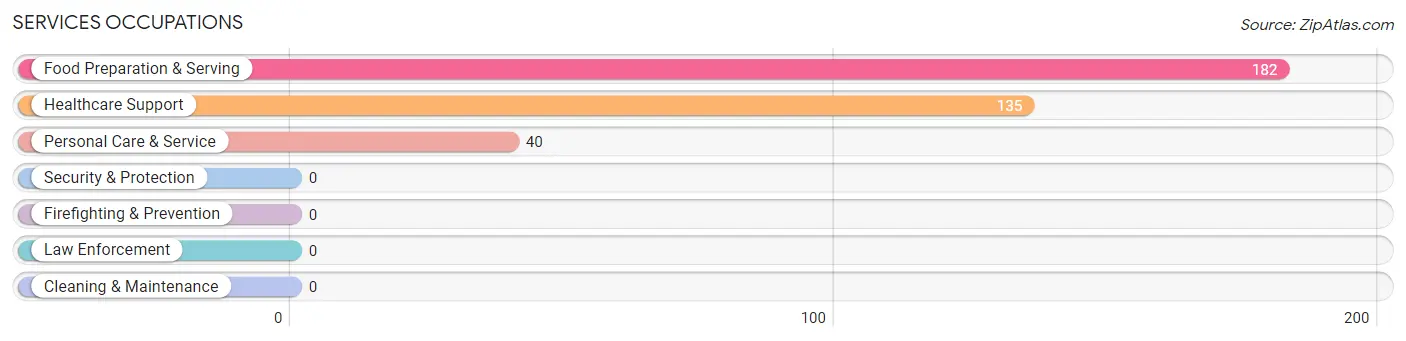
Services Occupations
The most common Services occupations in Marlborough are Food Preparation & Serving (182 | 10.1%), Healthcare Support (135 | 7.5%), and Personal Care & Service (40 | 2.2%).
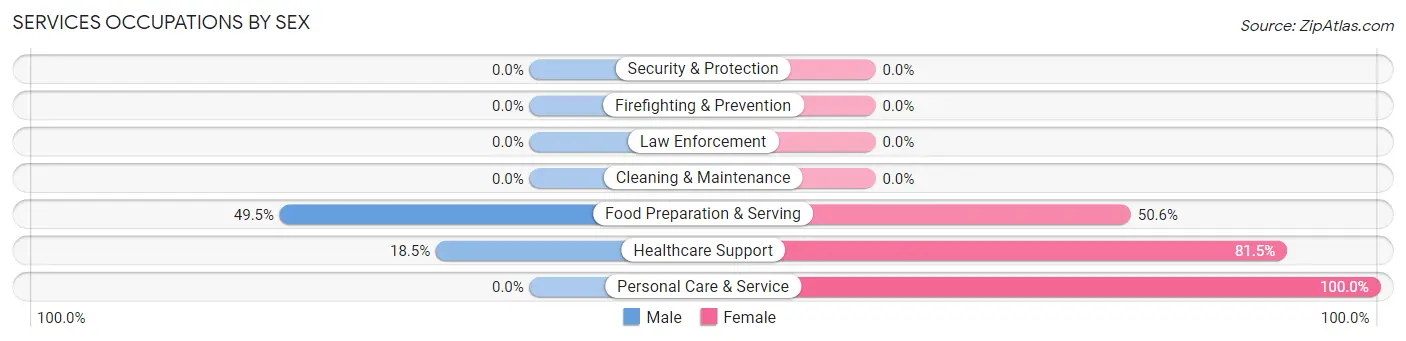
Services Occupations by Sex
Within the Services occupations in Marlborough, the most male-oriented occupations are Food Preparation & Serving (49.4%), and Healthcare Support (18.5%), while the most female-oriented occupations are Personal Care & Service (100.0%), Healthcare Support (81.5%), and Food Preparation & Serving (50.5%).
| Occupation | Male | Female |
| Healthcare Support | 25 (18.5%) | 110 (81.5%) |
| Security & Protection | 0 (0.0%) | 0 (0.0%) |
| Firefighting & Prevention | 0 (0.0%) | 0 (0.0%) |
| Law Enforcement | 0 (0.0%) | 0 (0.0%) |
| Food Preparation & Serving | 90 (49.4%) | 92 (50.5%) |
| Cleaning & Maintenance | 0 (0.0%) | 0 (0.0%) |
| Personal Care & Service | 0 (0.0%) | 40 (100.0%) |
| Total (Category) | 115 (32.2%) | 242 (67.8%) |
| Total (Overall) | 824 (45.9%) | 971 (54.1%) |
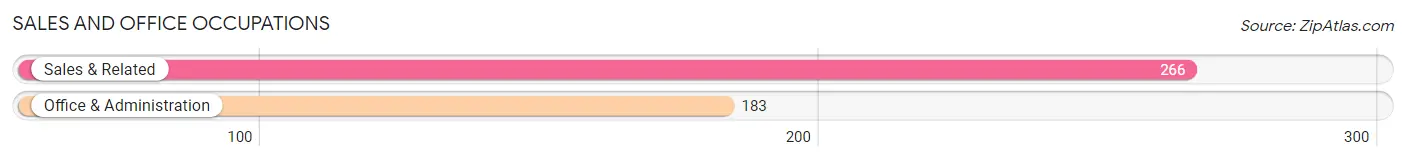
Sales and Office Occupations
The most common Sales and Office occupations in Marlborough are Sales & Related (266 | 14.8%), and Office & Administration (183 | 10.2%).
Sales and Office Occupations by Sex
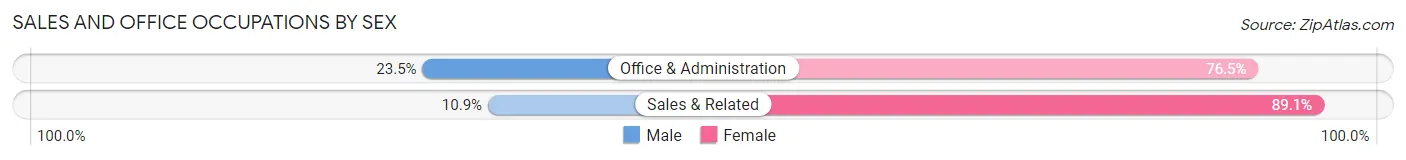
| Occupation | Male | Female |
| Sales & Related | 29 (10.9%) | 237 (89.1%) |
| Office & Administration | 43 (23.5%) | 140 (76.5%) |
| Total (Category) | 72 (16.0%) | 377 (84.0%) |
| Total (Overall) | 824 (45.9%) | 971 (54.1%) |
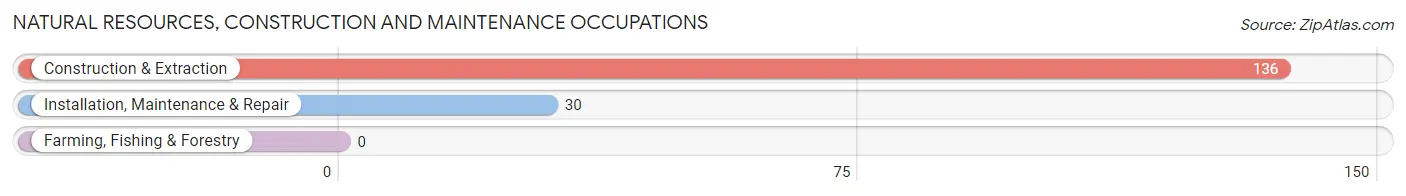
Natural Resources, Construction and Maintenance Occupations
The most common Natural Resources, Construction and Maintenance occupations in Marlborough are Construction & Extraction (136 | 7.6%), and Installation, Maintenance & Repair (30 | 1.7%).
Natural Resources, Construction and Maintenance Occupations by Sex
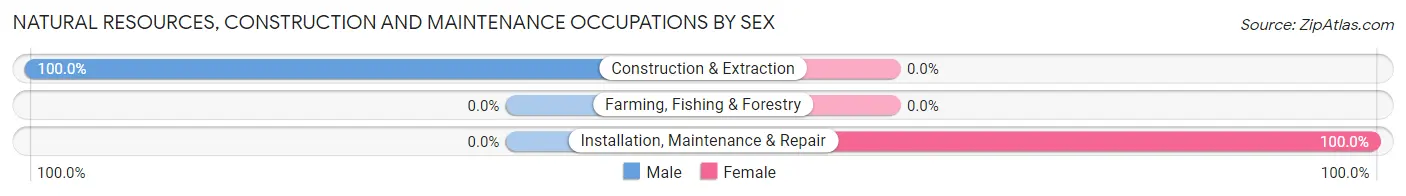
| Occupation | Male | Female |
| Farming, Fishing & Forestry | 0 (0.0%) | 0 (0.0%) |
| Construction & Extraction | 136 (100.0%) | 0 (0.0%) |
| Installation, Maintenance & Repair | 0 (0.0%) | 30 (100.0%) |
| Total (Category) | 136 (81.9%) | 30 (18.1%) |
| Total (Overall) | 824 (45.9%) | 971 (54.1%) |
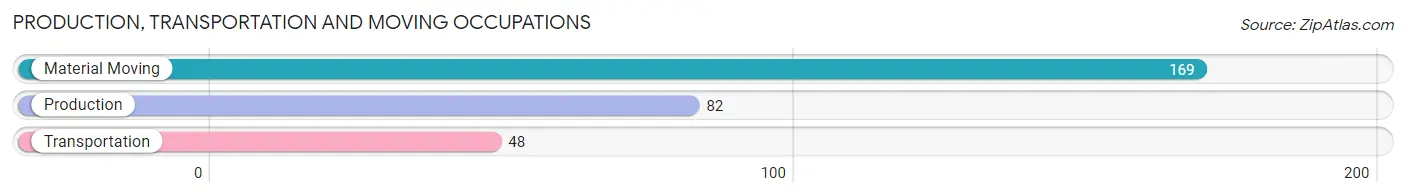
Production, Transportation and Moving Occupations
The most common Production, Transportation and Moving occupations in Marlborough are Material Moving (169 | 9.4%), Production (82 | 4.6%), and Transportation (48 | 2.7%).
Production, Transportation and Moving Occupations by Sex
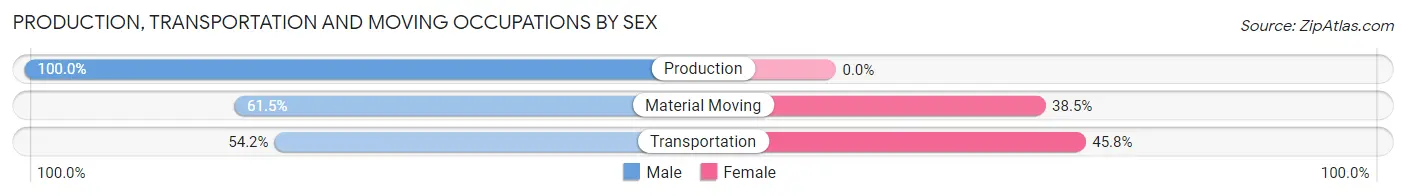
| Occupation | Male | Female |
| Production | 82 (100.0%) | 0 (0.0%) |
| Transportation | 26 (54.2%) | 22 (45.8%) |
| Material Moving | 104 (61.5%) | 65 (38.5%) |
| Total (Category) | 212 (70.9%) | 87 (29.1%) |
| Total (Overall) | 824 (45.9%) | 971 (54.1%) |
Employment Industries by Sex in Marlborough
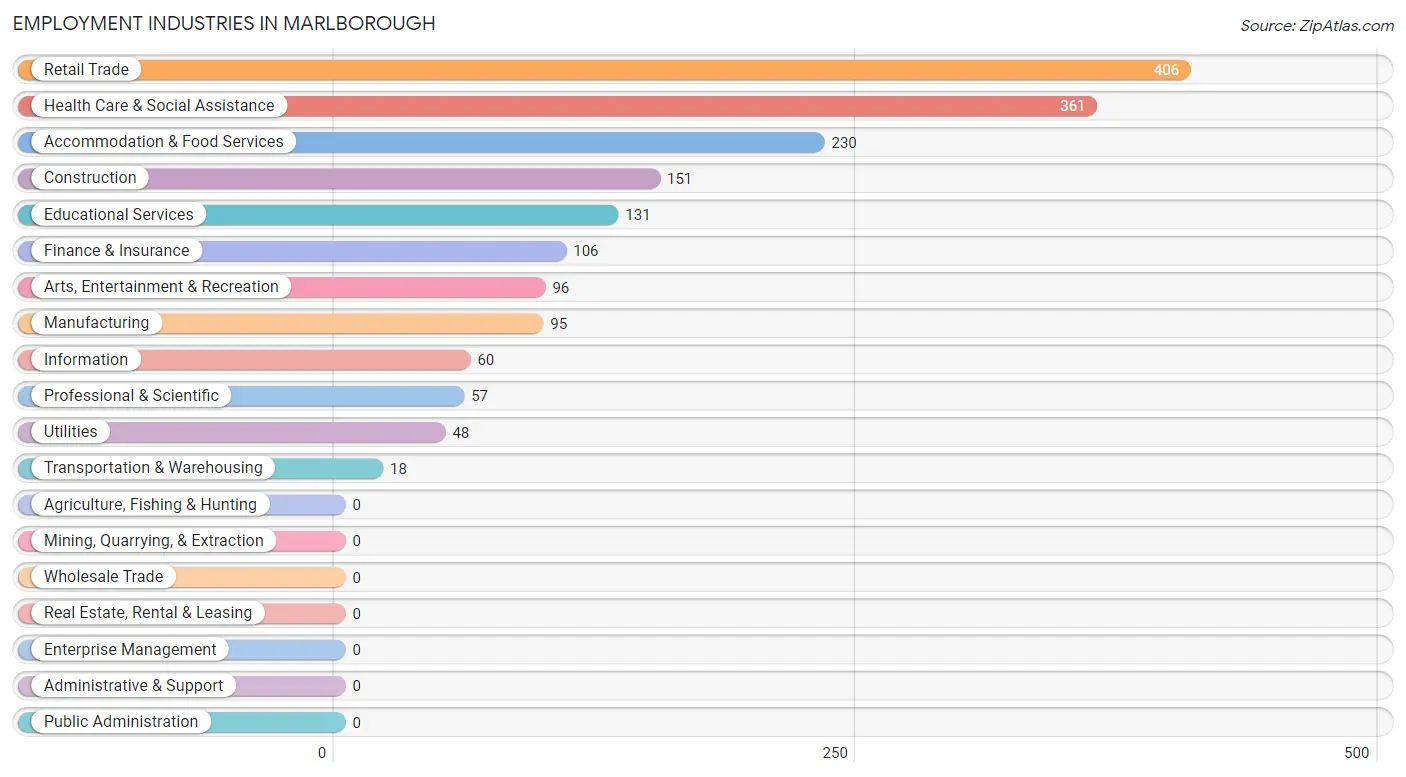
Employment Industries in Marlborough
The major employment industries in Marlborough include Retail Trade (406 | 22.6%), Health Care & Social Assistance (361 | 20.1%), Accommodation & Food Services (230 | 12.8%), Construction (151 | 8.4%), and Educational Services (131 | 7.3%).
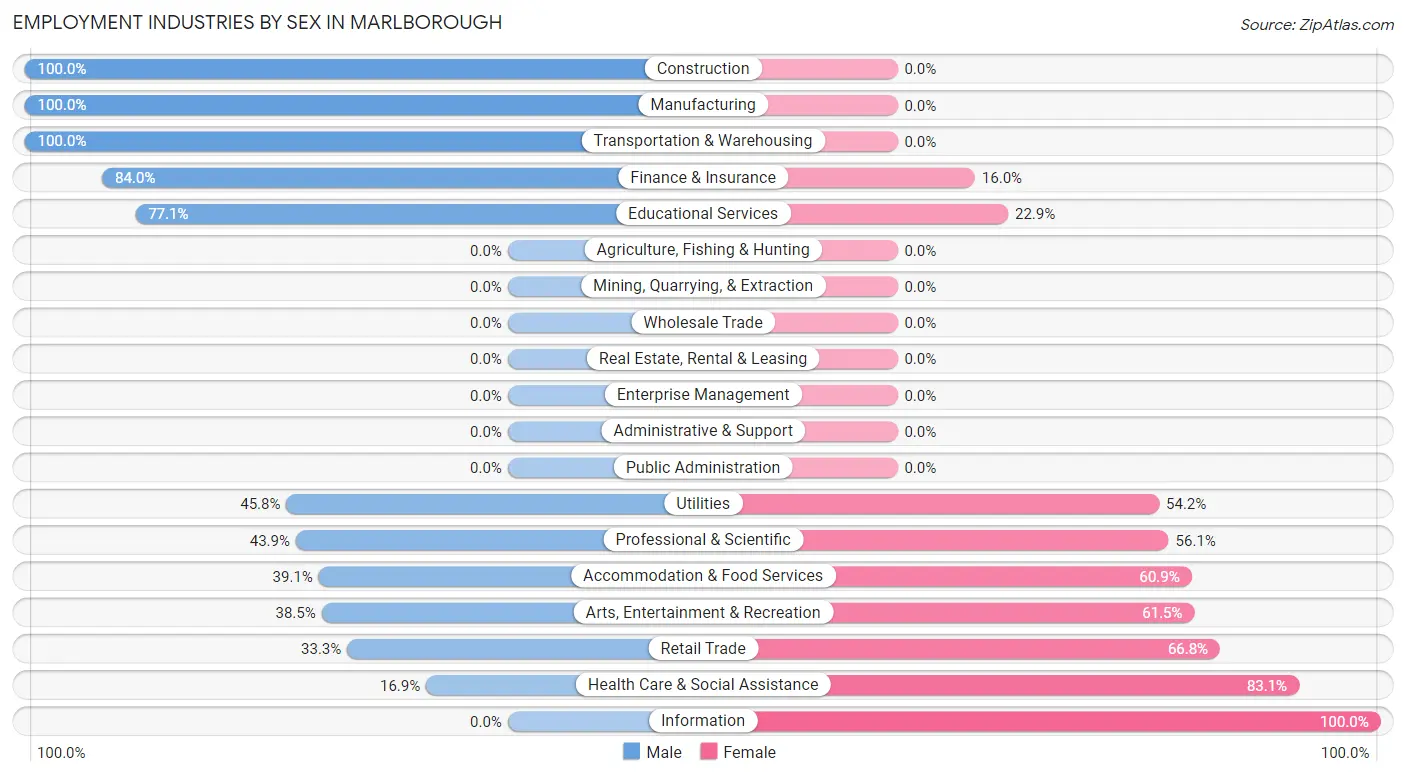
Employment Industries by Sex in Marlborough
The Marlborough industries that see more men than women are Construction (100.0%), Manufacturing (100.0%), and Transportation & Warehousing (100.0%), whereas the industries that tend to have a higher number of women are Information (100.0%), Health Care & Social Assistance (83.1%), and Retail Trade (66.7%).
| Industry | Male | Female |
| Agriculture, Fishing & Hunting | 0 (0.0%) | 0 (0.0%) |
| Mining, Quarrying, & Extraction | 0 (0.0%) | 0 (0.0%) |
| Construction | 151 (100.0%) | 0 (0.0%) |
| Manufacturing | 95 (100.0%) | 0 (0.0%) |
| Wholesale Trade | 0 (0.0%) | 0 (0.0%) |
| Retail Trade | 135 (33.3%) | 271 (66.7%) |
| Transportation & Warehousing | 18 (100.0%) | 0 (0.0%) |
| Utilities | 22 (45.8%) | 26 (54.2%) |
| Information | 0 (0.0%) | 60 (100.0%) |
| Finance & Insurance | 89 (84.0%) | 17 (16.0%) |
| Real Estate, Rental & Leasing | 0 (0.0%) | 0 (0.0%) |
| Professional & Scientific | 25 (43.9%) | 32 (56.1%) |
| Enterprise Management | 0 (0.0%) | 0 (0.0%) |
| Administrative & Support | 0 (0.0%) | 0 (0.0%) |
| Educational Services | 101 (77.1%) | 30 (22.9%) |
| Health Care & Social Assistance | 61 (16.9%) | 300 (83.1%) |
| Arts, Entertainment & Recreation | 37 (38.5%) | 59 (61.5%) |
| Accommodation & Food Services | 90 (39.1%) | 140 (60.9%) |
| Public Administration | 0 (0.0%) | 0 (0.0%) |
| Total | 824 (45.9%) | 971 (54.1%) |
Education in Marlborough
School Enrollment in Marlborough
The most common levels of schooling among the 601 students in Marlborough are college / undergraduate (399 | 66.4%), high school (68 | 11.3%), and elementary school (51 | 8.5%).
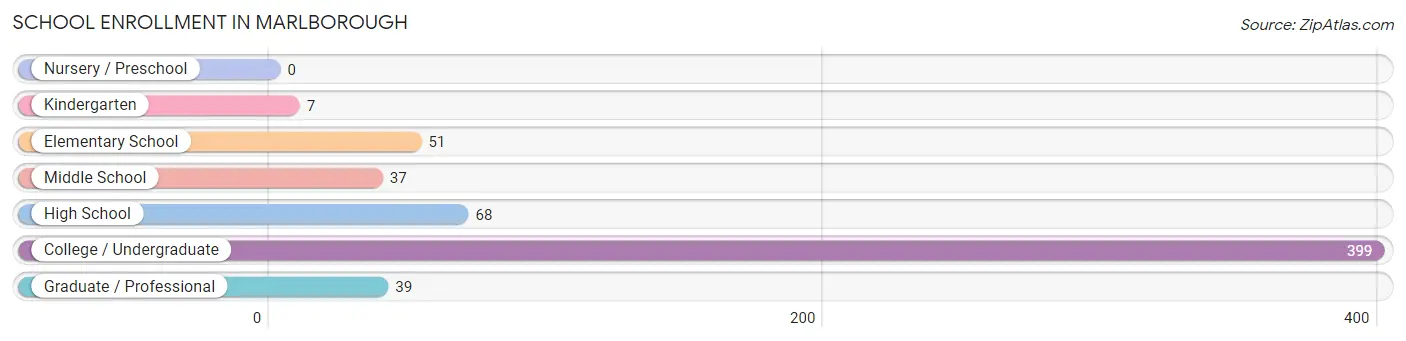
| School Level | # Students | % Students |
| Nursery / Preschool | 0 | 0.0% |
| Kindergarten | 7 | 1.2% |
| Elementary School | 51 | 8.5% |
| Middle School | 37 | 6.2% |
| High School | 68 | 11.3% |
| College / Undergraduate | 399 | 66.4% |
| Graduate / Professional | 39 | 6.5% |
| Total | 601 | 100.0% |
School Enrollment by Age by Funding Source in Marlborough
Out of a total of 601 students who are enrolled in schools in Marlborough, 219 (36.4%) attend a private institution, while the remaining 382 (63.6%) are enrolled in public schools. The age group of 18 to 19 year olds has the highest likelihood of being enrolled in private schools, with 56 (100.0% in the age bracket) enrolled. Conversely, the age group of 5 to 9 year old has the lowest likelihood of being enrolled in a private school, with 58 (100.0% in the age bracket) attending a public institution.
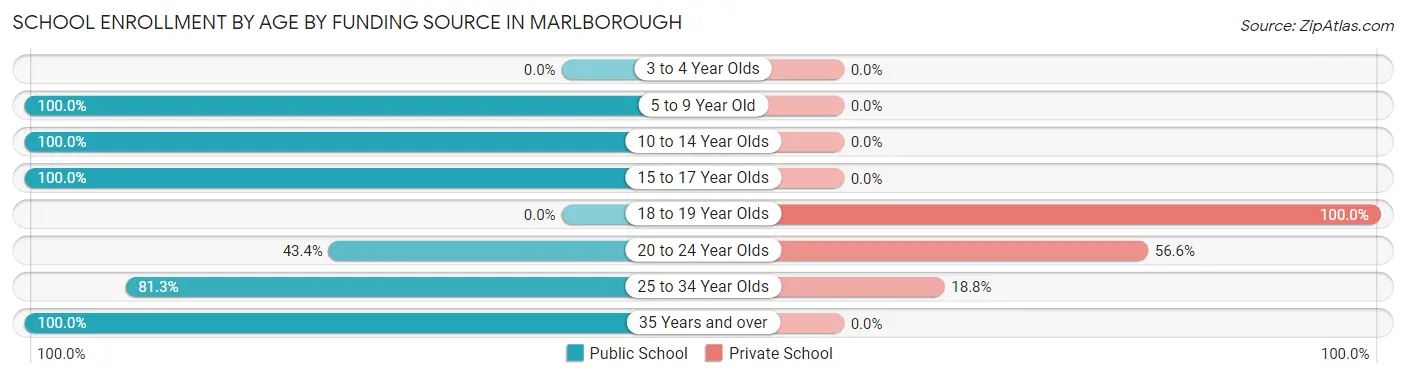
| Age Bracket | Public School | Private School |
| 3 to 4 Year Olds | 0 (0.0%) | 0 (0.0%) |
| 5 to 9 Year Old | 58 (100.0%) | 0 (0.0%) |
| 10 to 14 Year Olds | 37 (100.0%) | 0 (0.0%) |
| 15 to 17 Year Olds | 68 (100.0%) | 0 (0.0%) |
| 18 to 19 Year Olds | 0 (0.0%) | 56 (100.0%) |
| 20 to 24 Year Olds | 111 (43.4%) | 145 (56.6%) |
| 25 to 34 Year Olds | 78 (81.2%) | 18 (18.8%) |
| 35 Years and over | 30 (100.0%) | 0 (0.0%) |
| Total | 382 (63.6%) | 219 (36.4%) |
Educational Attainment by Field of Study in Marlborough
Social sciences (127 | 21.7%), business (121 | 20.7%), communications (113 | 19.3%), science & technology (66 | 11.3%), and arts & humanities (34 | 5.8%) are the most common fields of study among 585 individuals in Marlborough who have obtained a bachelor's degree or higher.
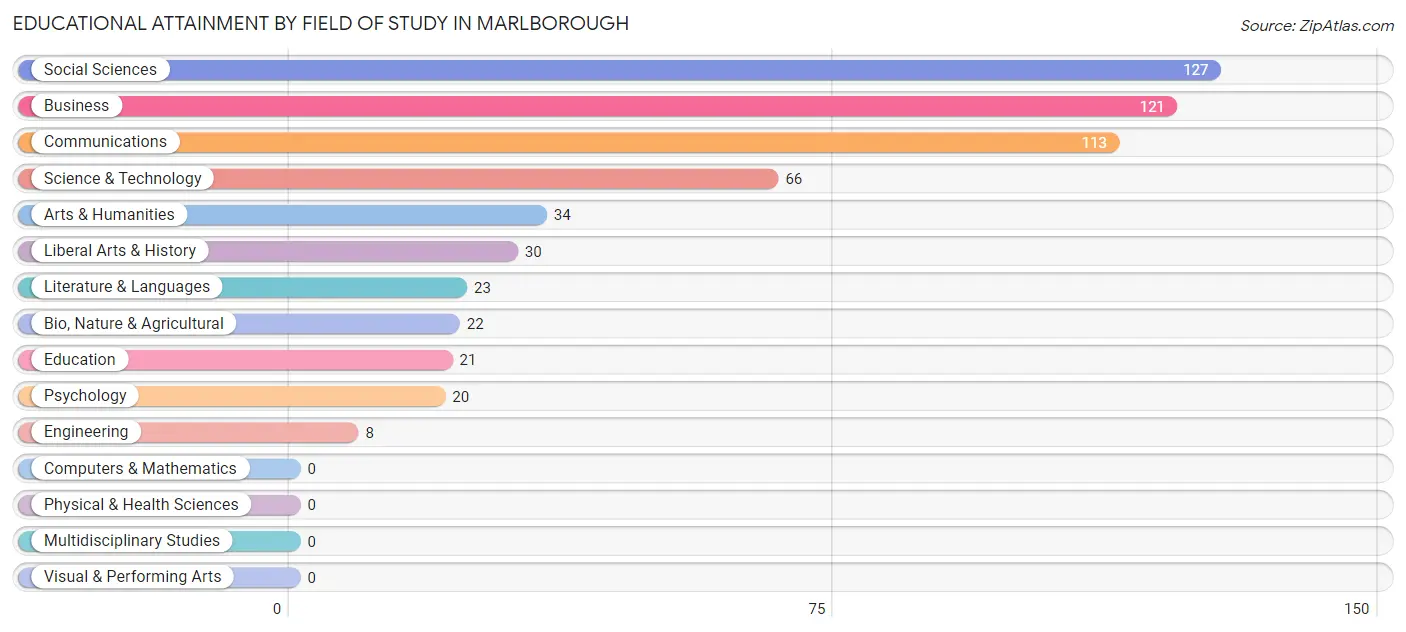
| Field of Study | # Graduates | % Graduates |
| Computers & Mathematics | 0 | 0.0% |
| Bio, Nature & Agricultural | 22 | 3.8% |
| Physical & Health Sciences | 0 | 0.0% |
| Psychology | 20 | 3.4% |
| Social Sciences | 127 | 21.7% |
| Engineering | 8 | 1.4% |
| Multidisciplinary Studies | 0 | 0.0% |
| Science & Technology | 66 | 11.3% |
| Business | 121 | 20.7% |
| Education | 21 | 3.6% |
| Literature & Languages | 23 | 3.9% |
| Liberal Arts & History | 30 | 5.1% |
| Visual & Performing Arts | 0 | 0.0% |
| Communications | 113 | 19.3% |
| Arts & Humanities | 34 | 5.8% |
| Total | 585 | 100.0% |
Transportation & Commute in Marlborough
Vehicle Availability by Sex in Marlborough
The most prevalent vehicle ownership categories in Marlborough are males with 1 vehicle (405, accounting for 49.1%) and females with 1 vehicle (453, making up 42.4%).
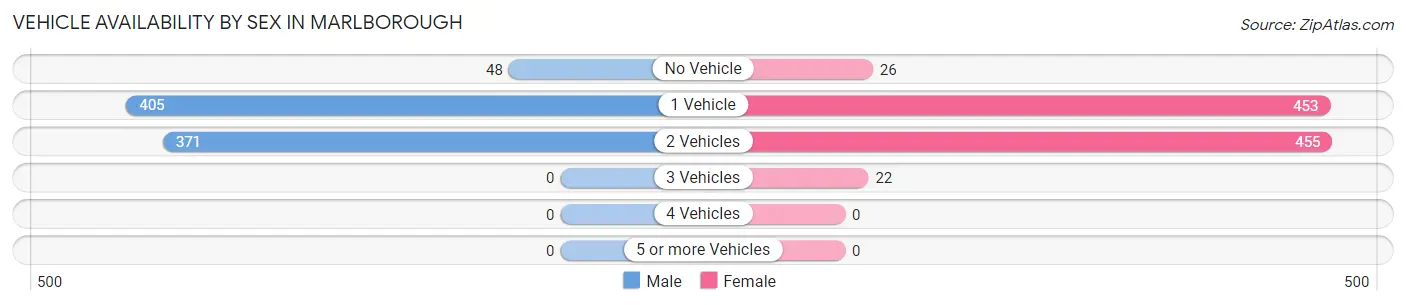
| Vehicles Available | Male | Female |
| No Vehicle | 48 (5.8%) | 26 (2.7%) |
| 1 Vehicle | 405 (49.1%) | 453 (47.4%) |
| 2 Vehicles | 371 (45.0%) | 455 (47.6%) |
| 3 Vehicles | 0 (0.0%) | 22 (2.3%) |
| 4 Vehicles | 0 (0.0%) | 0 (0.0%) |
| 5 or more Vehicles | 0 (0.0%) | 0 (0.0%) |
| Total | 824 (100.0%) | 956 (100.0%) |
Commute Time in Marlborough
The most frequently occuring commute durations in Marlborough are 30 to 34 minutes (321 commuters, 19.7%), 25 to 29 minutes (263 commuters, 16.2%), and 20 to 24 minutes (262 commuters, 16.1%).
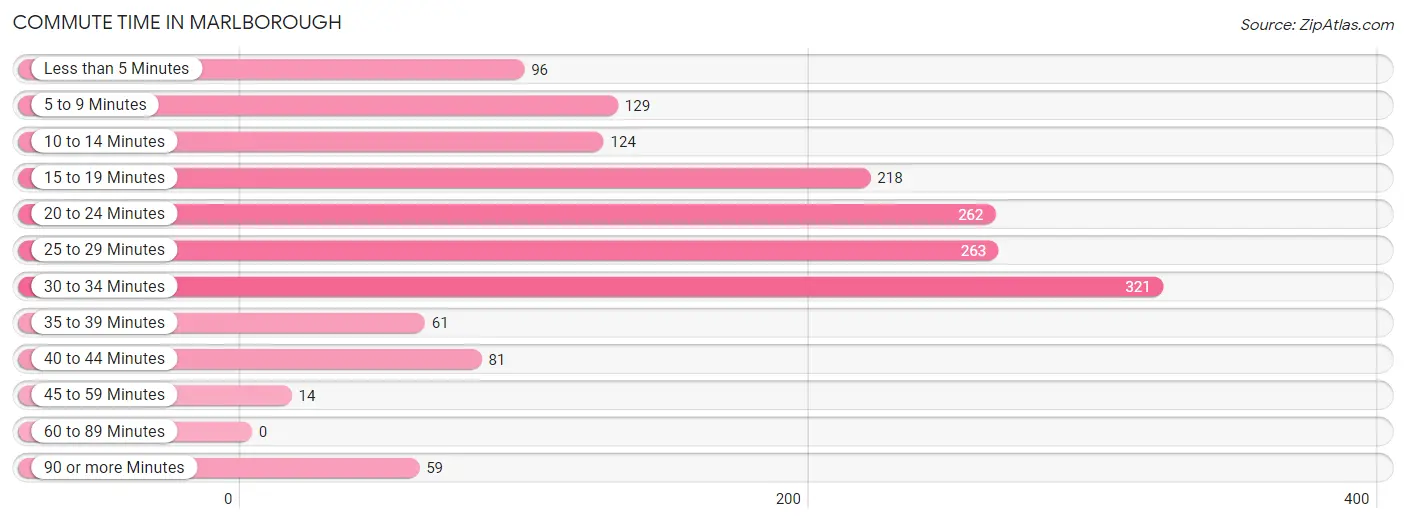
| Commute Time | # Commuters | % Commuters |
| Less than 5 Minutes | 96 | 5.9% |
| 5 to 9 Minutes | 129 | 7.9% |
| 10 to 14 Minutes | 124 | 7.6% |
| 15 to 19 Minutes | 218 | 13.4% |
| 20 to 24 Minutes | 262 | 16.1% |
| 25 to 29 Minutes | 263 | 16.2% |
| 30 to 34 Minutes | 321 | 19.7% |
| 35 to 39 Minutes | 61 | 3.7% |
| 40 to 44 Minutes | 81 | 5.0% |
| 45 to 59 Minutes | 14 | 0.9% |
| 60 to 89 Minutes | 0 | 0.0% |
| 90 or more Minutes | 59 | 3.6% |
Commute Time by Sex in Marlborough
The most common commute times in Marlborough are 25 to 29 minutes (194 commuters, 25.8%) for males and 30 to 34 minutes (285 commuters, 32.5%) for females.
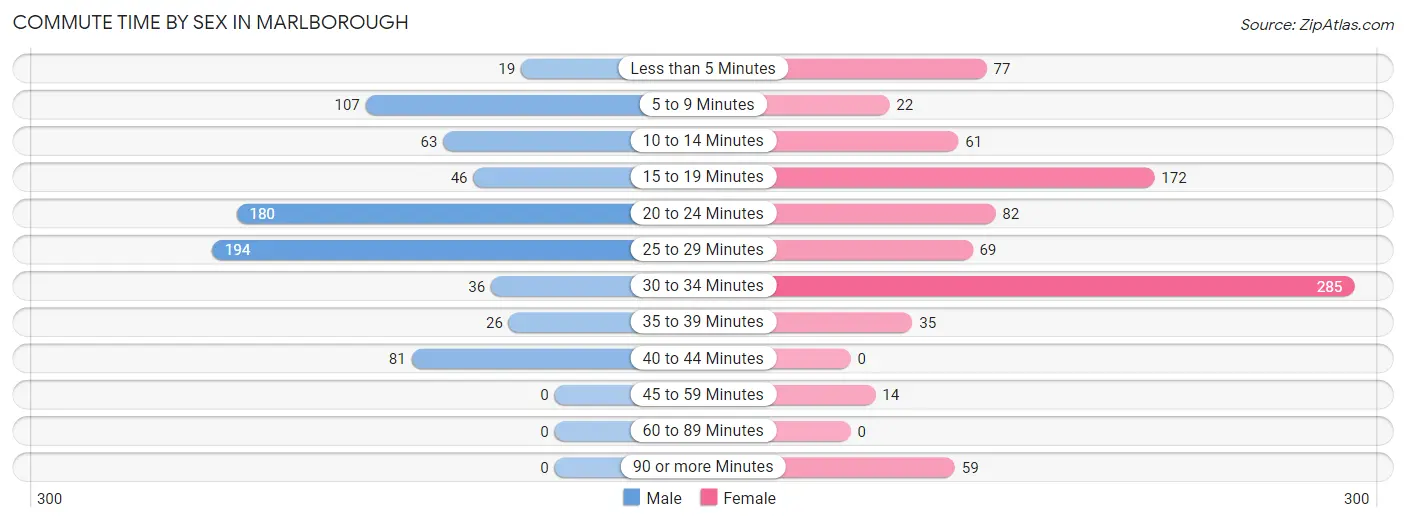
| Commute Time | Male | Female |
| Less than 5 Minutes | 19 (2.5%) | 77 (8.8%) |
| 5 to 9 Minutes | 107 (14.2%) | 22 (2.5%) |
| 10 to 14 Minutes | 63 (8.4%) | 61 (7.0%) |
| 15 to 19 Minutes | 46 (6.1%) | 172 (19.6%) |
| 20 to 24 Minutes | 180 (23.9%) | 82 (9.4%) |
| 25 to 29 Minutes | 194 (25.8%) | 69 (7.9%) |
| 30 to 34 Minutes | 36 (4.8%) | 285 (32.5%) |
| 35 to 39 Minutes | 26 (3.5%) | 35 (4.0%) |
| 40 to 44 Minutes | 81 (10.8%) | 0 (0.0%) |
| 45 to 59 Minutes | 0 (0.0%) | 14 (1.6%) |
| 60 to 89 Minutes | 0 (0.0%) | 0 (0.0%) |
| 90 or more Minutes | 0 (0.0%) | 59 (6.7%) |
Time of Departure to Work by Sex in Marlborough
The most frequent times of departure to work in Marlborough are 12:00 PM to 3:59 PM (181, 24.1%) for males and 12:00 PM to 3:59 PM (234, 26.7%) for females.
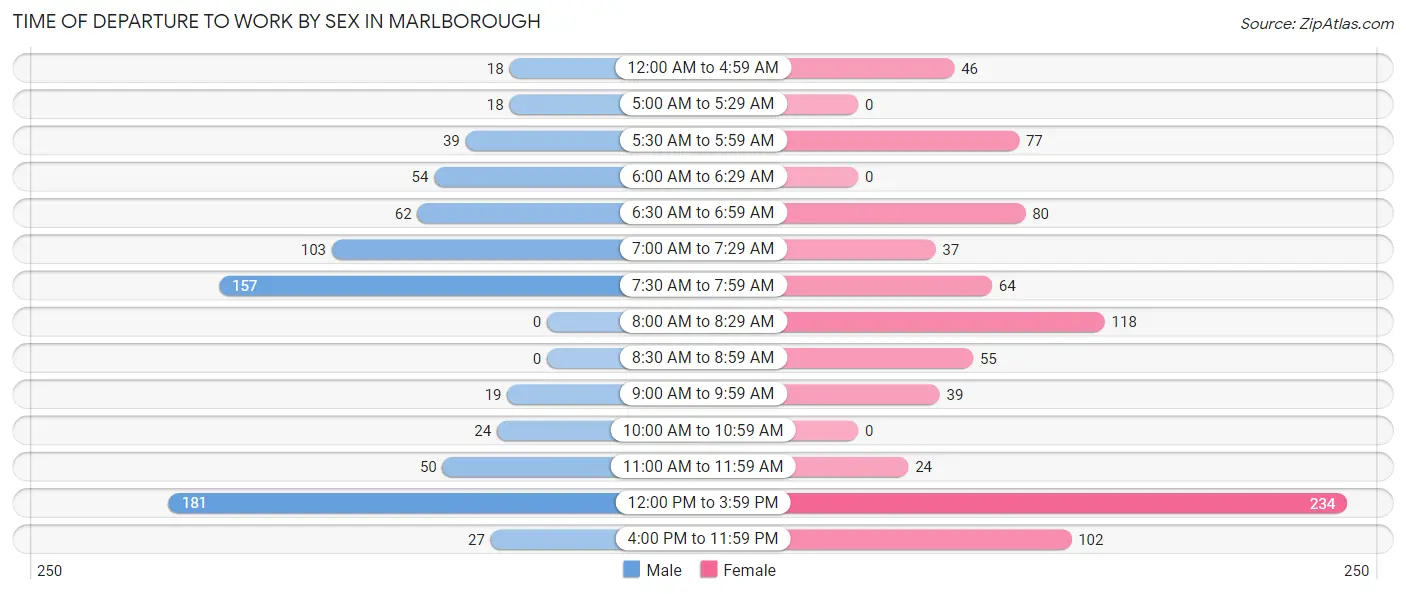
| Time of Departure | Male | Female |
| 12:00 AM to 4:59 AM | 18 (2.4%) | 46 (5.2%) |
| 5:00 AM to 5:29 AM | 18 (2.4%) | 0 (0.0%) |
| 5:30 AM to 5:59 AM | 39 (5.2%) | 77 (8.8%) |
| 6:00 AM to 6:29 AM | 54 (7.2%) | 0 (0.0%) |
| 6:30 AM to 6:59 AM | 62 (8.2%) | 80 (9.1%) |
| 7:00 AM to 7:29 AM | 103 (13.7%) | 37 (4.2%) |
| 7:30 AM to 7:59 AM | 157 (20.9%) | 64 (7.3%) |
| 8:00 AM to 8:29 AM | 0 (0.0%) | 118 (13.5%) |
| 8:30 AM to 8:59 AM | 0 (0.0%) | 55 (6.3%) |
| 9:00 AM to 9:59 AM | 19 (2.5%) | 39 (4.4%) |
| 10:00 AM to 10:59 AM | 24 (3.2%) | 0 (0.0%) |
| 11:00 AM to 11:59 AM | 50 (6.7%) | 24 (2.7%) |
| 12:00 PM to 3:59 PM | 181 (24.1%) | 234 (26.7%) |
| 4:00 PM to 11:59 PM | 27 (3.6%) | 102 (11.6%) |
| Total | 752 (100.0%) | 876 (100.0%) |
Housing Occupancy in Marlborough
Occupancy by Ownership in Marlborough
Of the total 1,546 dwellings in Marlborough, owner-occupied units account for 107 (6.9%), while renter-occupied units make up 1,439 (93.1%).
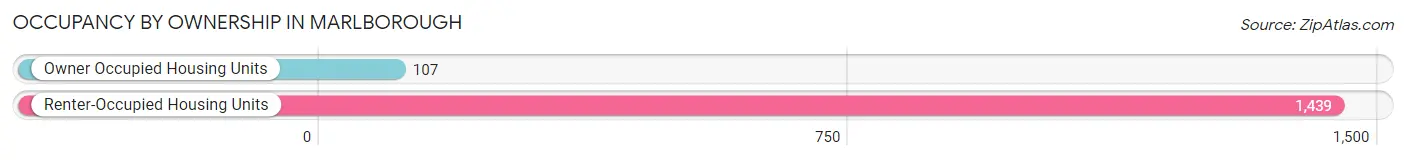
| Occupancy | # Housing Units | % Housing Units |
| Owner Occupied Housing Units | 107 | 6.9% |
| Renter-Occupied Housing Units | 1,439 | 93.1% |
| Total Occupied Housing Units | 1,546 | 100.0% |
Occupancy by Household Size in Marlborough
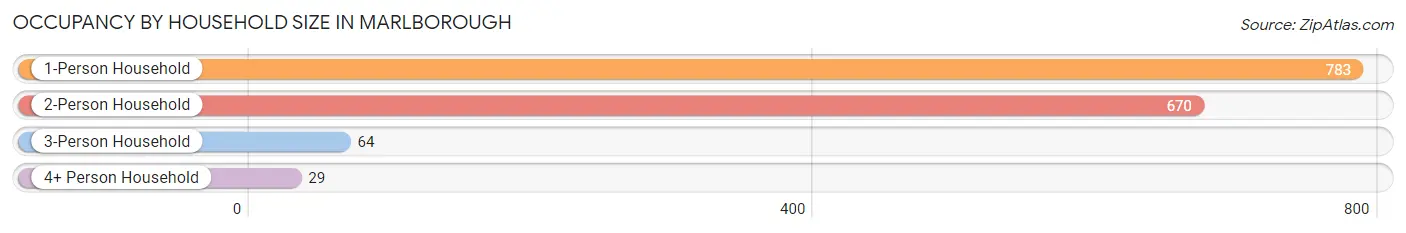
| Household Size | # Housing Units | % Housing Units |
| 1-Person Household | 783 | 50.6% |
| 2-Person Household | 670 | 43.3% |
| 3-Person Household | 64 | 4.1% |
| 4+ Person Household | 29 | 1.9% |
| Total Housing Units | 1,546 | 100.0% |
Occupancy by Ownership by Household Size in Marlborough
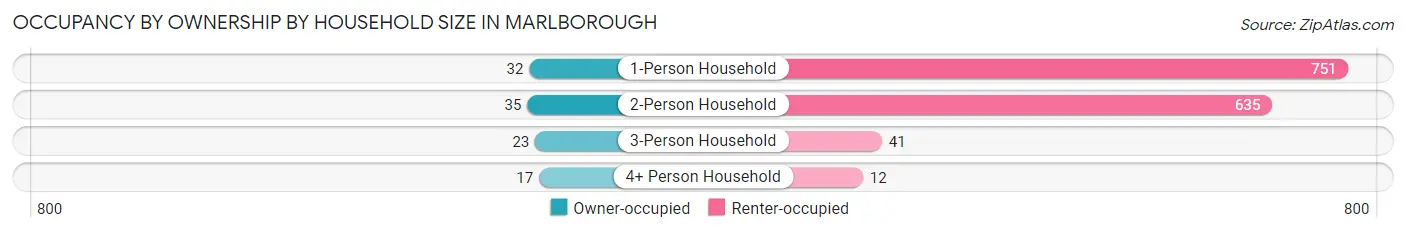
| Household Size | Owner-occupied | Renter-occupied |
| 1-Person Household | 32 (4.1%) | 751 (95.9%) |
| 2-Person Household | 35 (5.2%) | 635 (94.8%) |
| 3-Person Household | 23 (35.9%) | 41 (64.1%) |
| 4+ Person Household | 17 (58.6%) | 12 (41.4%) |
| Total Housing Units | 107 (6.9%) | 1,439 (93.1%) |
Occupancy by Educational Attainment in Marlborough
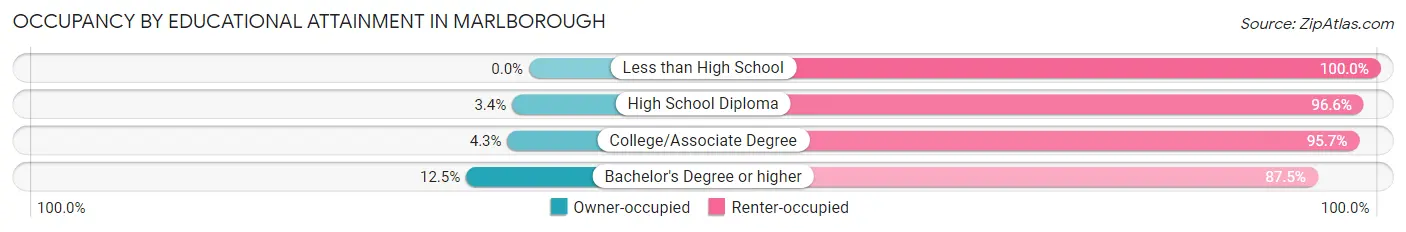
| Household Size | Owner-occupied | Renter-occupied |
| Less than High School | 0 (0.0%) | 9 (100.0%) |
| High School Diploma | 15 (3.4%) | 431 (96.6%) |
| College/Associate Degree | 23 (4.3%) | 515 (95.7%) |
| Bachelor's Degree or higher | 69 (12.5%) | 484 (87.5%) |
Occupancy by Age of Householder in Marlborough
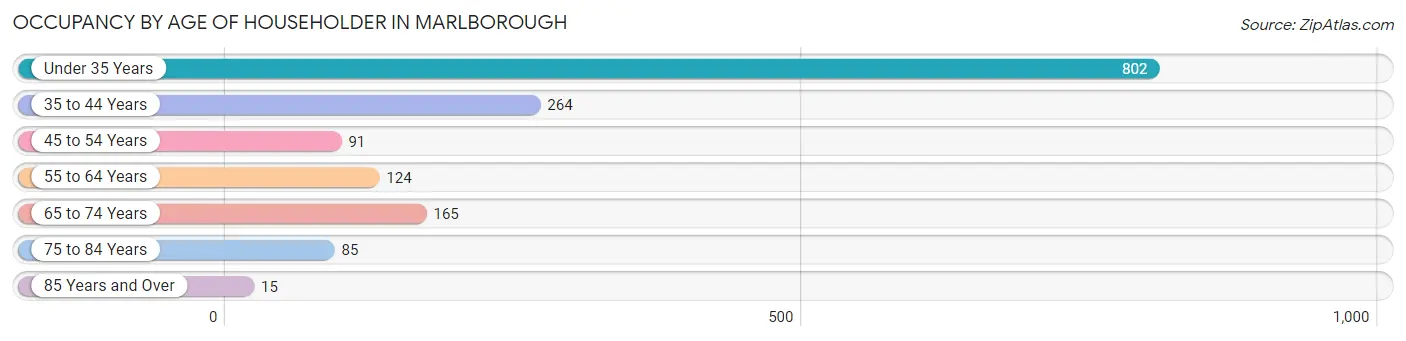
| Age Bracket | # Households | % Households |
| Under 35 Years | 802 | 51.9% |
| 35 to 44 Years | 264 | 17.1% |
| 45 to 54 Years | 91 | 5.9% |
| 55 to 64 Years | 124 | 8.0% |
| 65 to 74 Years | 165 | 10.7% |
| 75 to 84 Years | 85 | 5.5% |
| 85 Years and Over | 15 | 1.0% |
| Total | 1,546 | 100.0% |
Housing Finances in Marlborough
Median Income by Occupancy in Marlborough
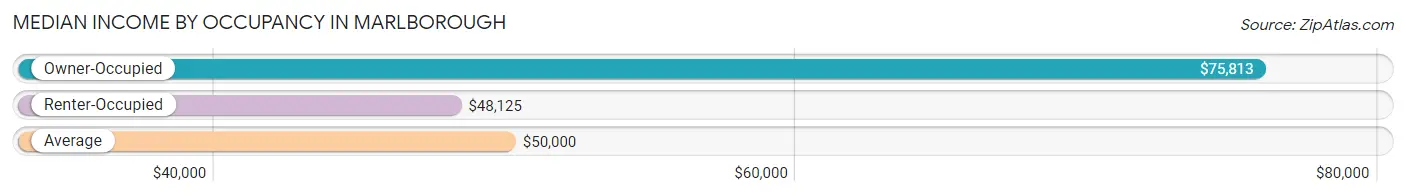
| Occupancy Type | # Households | Median Income |
| Owner-Occupied | 107 (6.9%) | $75,813 |
| Renter-Occupied | 1,439 (93.1%) | $48,125 |
| Average | 1,546 (100.0%) | $50,000 |
Occupancy by Householder Income Bracket in Marlborough
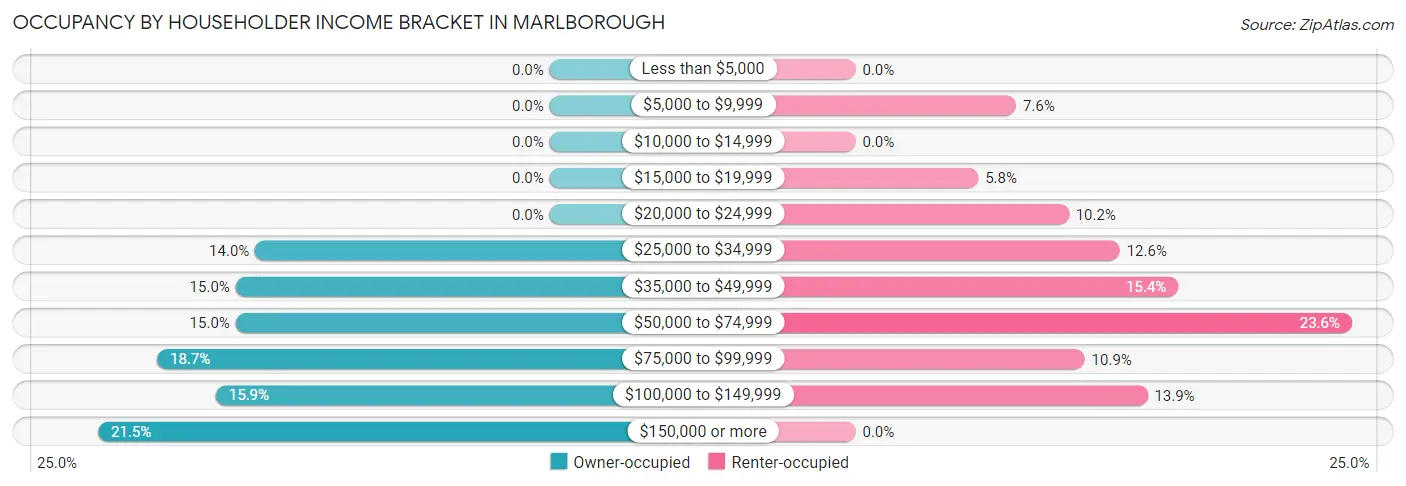
| Income Bracket | Owner-occupied | Renter-occupied |
| Less than $5,000 | 0 (0.0%) | 0 (0.0%) |
| $5,000 to $9,999 | 0 (0.0%) | 110 (7.6%) |
| $10,000 to $14,999 | 0 (0.0%) | 0 (0.0%) |
| $15,000 to $19,999 | 0 (0.0%) | 84 (5.8%) |
| $20,000 to $24,999 | 0 (0.0%) | 146 (10.2%) |
| $25,000 to $34,999 | 15 (14.0%) | 181 (12.6%) |
| $35,000 to $49,999 | 16 (14.9%) | 221 (15.4%) |
| $50,000 to $74,999 | 16 (14.9%) | 340 (23.6%) |
| $75,000 to $99,999 | 20 (18.7%) | 157 (10.9%) |
| $100,000 to $149,999 | 17 (15.9%) | 200 (13.9%) |
| $150,000 or more | 23 (21.5%) | 0 (0.0%) |
| Total | 107 (100.0%) | 1,439 (100.0%) |
Monthly Housing Cost Tiers in Marlborough
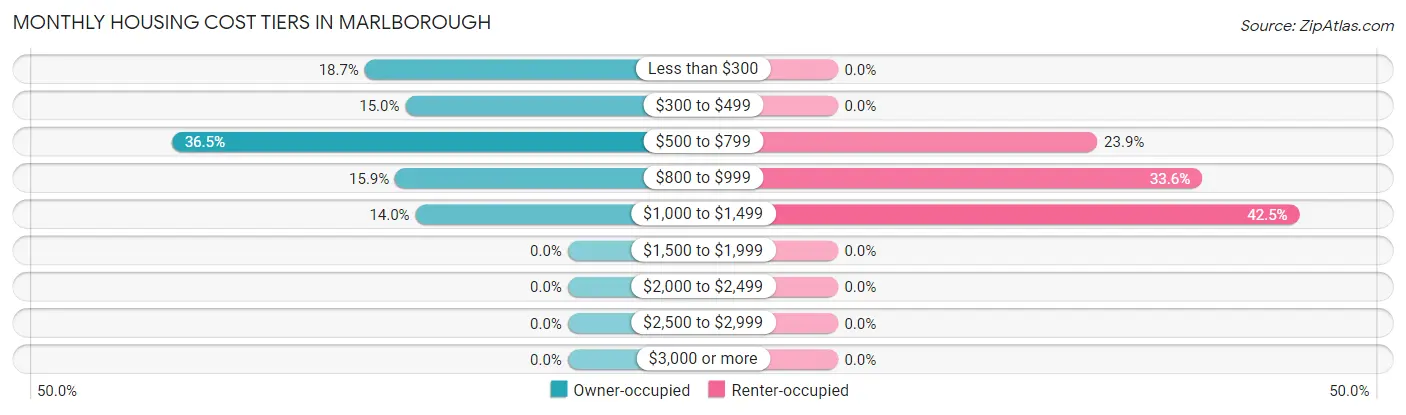
| Monthly Cost | Owner-occupied | Renter-occupied |
| Less than $300 | 20 (18.7%) | 0 (0.0%) |
| $300 to $499 | 16 (14.9%) | 0 (0.0%) |
| $500 to $799 | 39 (36.4%) | 344 (23.9%) |
| $800 to $999 | 17 (15.9%) | 483 (33.6%) |
| $1,000 to $1,499 | 15 (14.0%) | 612 (42.5%) |
| $1,500 to $1,999 | 0 (0.0%) | 0 (0.0%) |
| $2,000 to $2,499 | 0 (0.0%) | 0 (0.0%) |
| $2,500 to $2,999 | 0 (0.0%) | 0 (0.0%) |
| $3,000 or more | 0 (0.0%) | 0 (0.0%) |
| Total | 107 (100.0%) | 1,439 (100.0%) |
Physical Housing Characteristics in Marlborough
Housing Structures in Marlborough
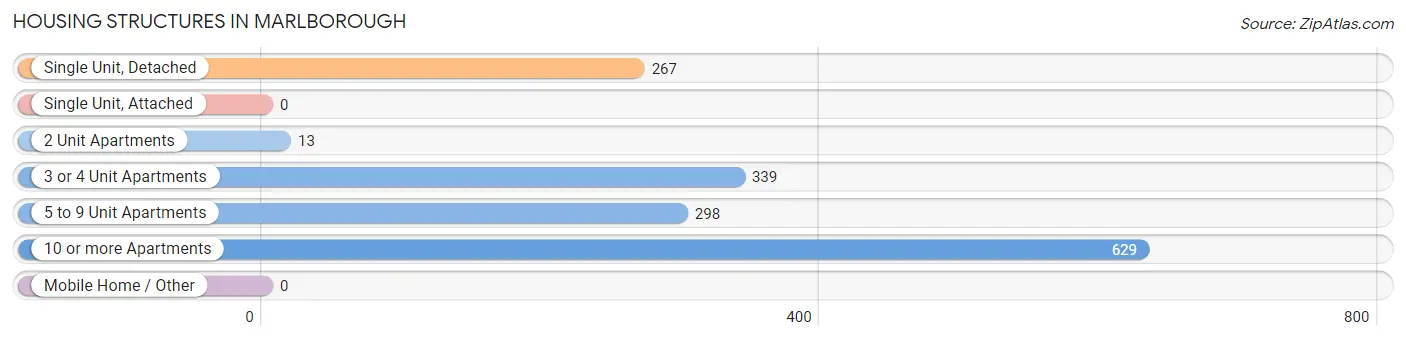
| Structure Type | # Housing Units | % Housing Units |
| Single Unit, Detached | 267 | 17.3% |
| Single Unit, Attached | 0 | 0.0% |
| 2 Unit Apartments | 13 | 0.8% |
| 3 or 4 Unit Apartments | 339 | 21.9% |
| 5 to 9 Unit Apartments | 298 | 19.3% |
| 10 or more Apartments | 629 | 40.7% |
| Mobile Home / Other | 0 | 0.0% |
| Total | 1,546 | 100.0% |
Housing Structures by Occupancy in Marlborough
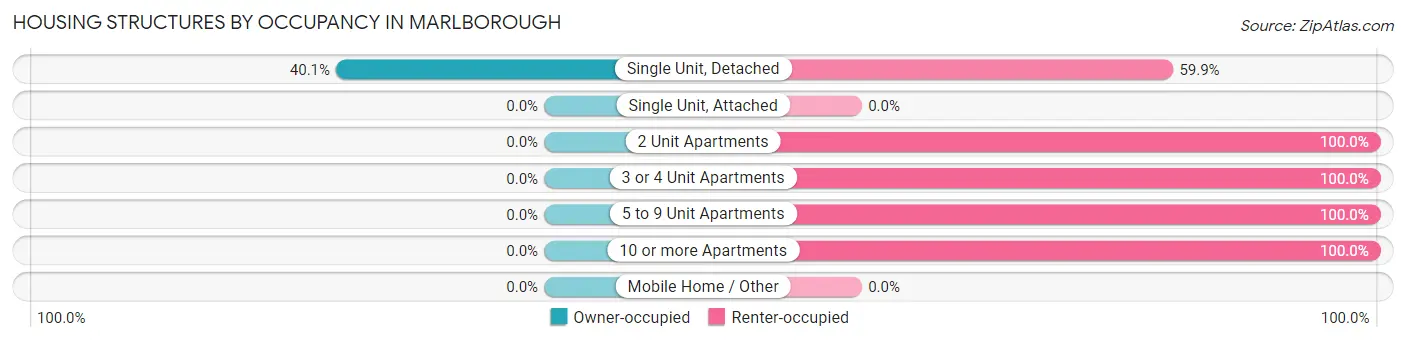
| Structure Type | Owner-occupied | Renter-occupied |
| Single Unit, Detached | 107 (40.1%) | 160 (59.9%) |
| Single Unit, Attached | 0 (0.0%) | 0 (0.0%) |
| 2 Unit Apartments | 0 (0.0%) | 13 (100.0%) |
| 3 or 4 Unit Apartments | 0 (0.0%) | 339 (100.0%) |
| 5 to 9 Unit Apartments | 0 (0.0%) | 298 (100.0%) |
| 10 or more Apartments | 0 (0.0%) | 629 (100.0%) |
| Mobile Home / Other | 0 (0.0%) | 0 (0.0%) |
| Total | 107 (6.9%) | 1,439 (93.1%) |
Housing Structures by Number of Rooms in Marlborough
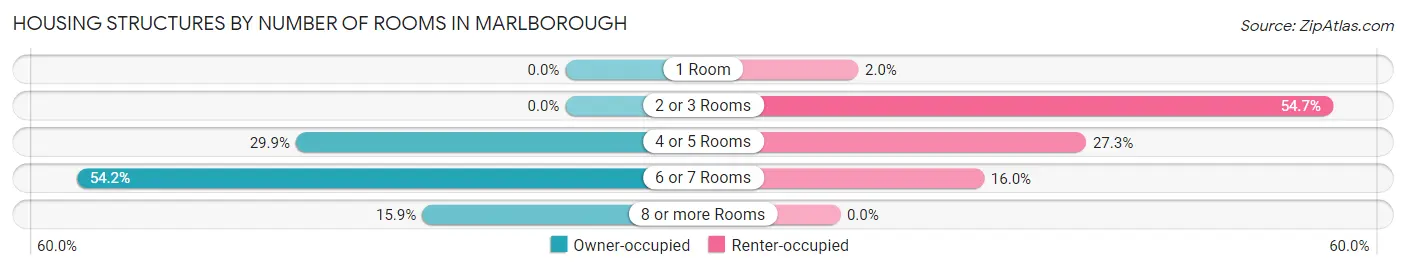
| Number of Rooms | Owner-occupied | Renter-occupied |
| 1 Room | 0 (0.0%) | 29 (2.0%) |
| 2 or 3 Rooms | 0 (0.0%) | 787 (54.7%) |
| 4 or 5 Rooms | 32 (29.9%) | 393 (27.3%) |
| 6 or 7 Rooms | 58 (54.2%) | 230 (16.0%) |
| 8 or more Rooms | 17 (15.9%) | 0 (0.0%) |
| Total | 107 (100.0%) | 1,439 (100.0%) |
Housing Structure by Heating Type in Marlborough
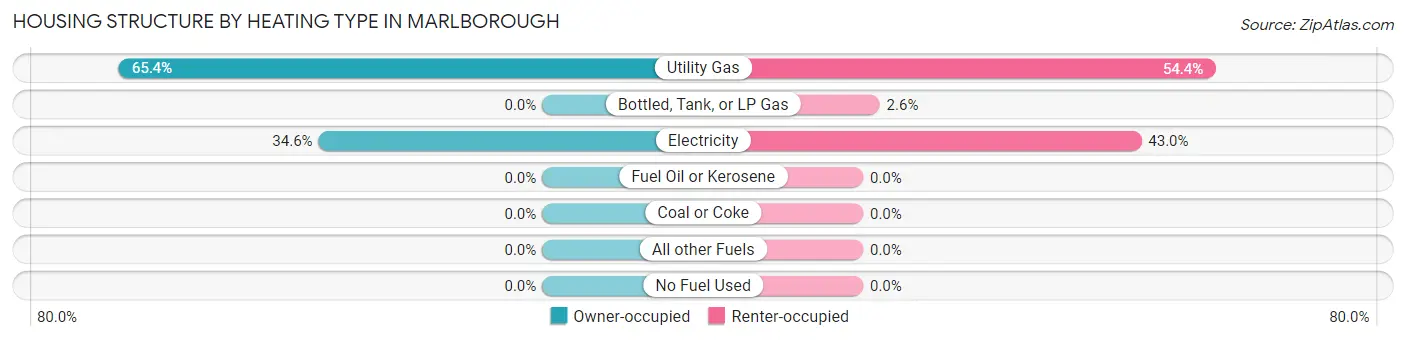
| Heating Type | Owner-occupied | Renter-occupied |
| Utility Gas | 70 (65.4%) | 783 (54.4%) |
| Bottled, Tank, or LP Gas | 0 (0.0%) | 37 (2.6%) |
| Electricity | 37 (34.6%) | 619 (43.0%) |
| Fuel Oil or Kerosene | 0 (0.0%) | 0 (0.0%) |
| Coal or Coke | 0 (0.0%) | 0 (0.0%) |
| All other Fuels | 0 (0.0%) | 0 (0.0%) |
| No Fuel Used | 0 (0.0%) | 0 (0.0%) |
| Total | 107 (100.0%) | 1,439 (100.0%) |
Household Vehicle Usage in Marlborough
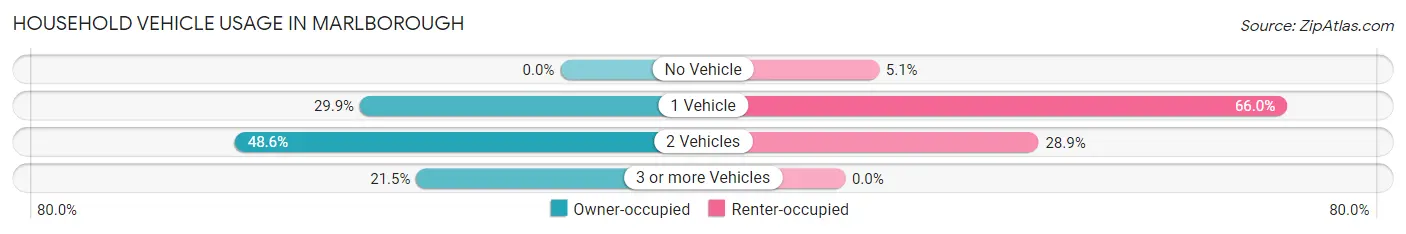
| Vehicles per Household | Owner-occupied | Renter-occupied |
| No Vehicle | 0 (0.0%) | 73 (5.1%) |
| 1 Vehicle | 32 (29.9%) | 950 (66.0%) |
| 2 Vehicles | 52 (48.6%) | 416 (28.9%) |
| 3 or more Vehicles | 23 (21.5%) | 0 (0.0%) |
| Total | 107 (100.0%) | 1,439 (100.0%) |
Real Estate & Mortgages in Marlborough
Real Estate and Mortgage Overview in Marlborough
| Characteristic | Without Mortgage | With Mortgage |
| Housing Units | 92 | 15 |
| Median Property Value | $169,500 | $0 |
| Median Household Income | $76,750 | $0 |
| Monthly Housing Costs | $543 | $0 |
| Real Estate Taxes | - | - |
Property Value by Mortgage Status in Marlborough
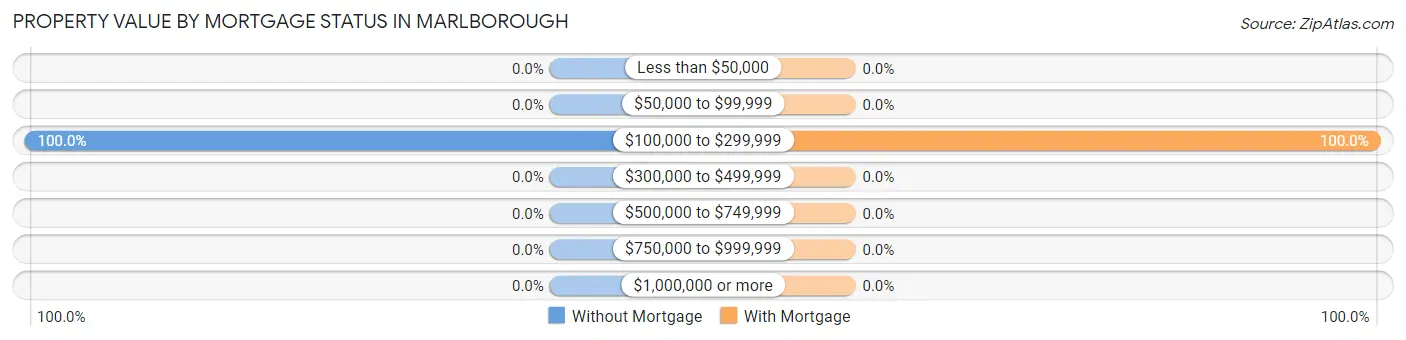
| Property Value | Without Mortgage | With Mortgage |
| Less than $50,000 | 0 (0.0%) | 0 (0.0%) |
| $50,000 to $99,999 | 0 (0.0%) | 0 (0.0%) |
| $100,000 to $299,999 | 92 (100.0%) | 15 (100.0%) |
| $300,000 to $499,999 | 0 (0.0%) | 0 (0.0%) |
| $500,000 to $749,999 | 0 (0.0%) | 0 (0.0%) |
| $750,000 to $999,999 | 0 (0.0%) | 0 (0.0%) |
| $1,000,000 or more | 0 (0.0%) | 0 (0.0%) |
| Total | 92 (100.0%) | 15 (100.0%) |
Household Income by Mortgage Status in Marlborough
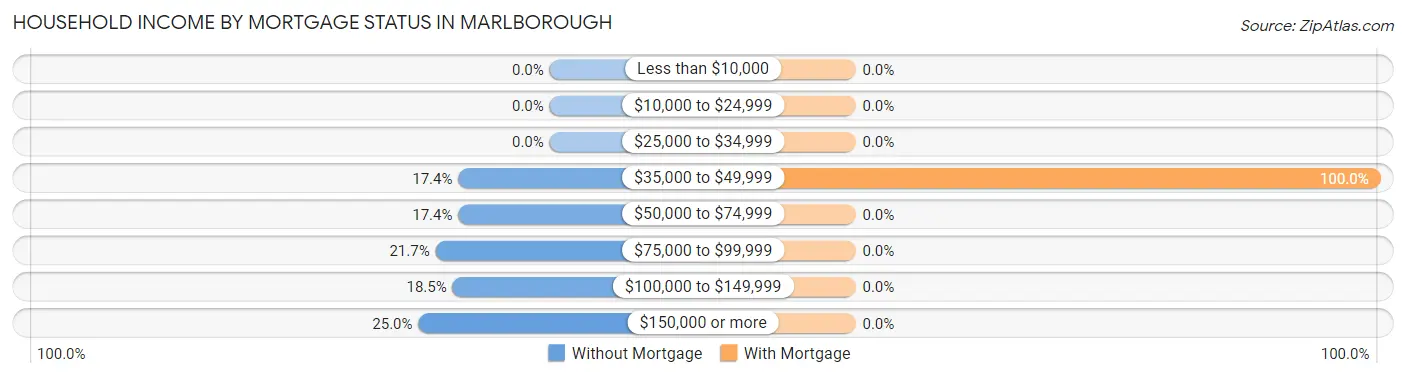
| Household Income | Without Mortgage | With Mortgage |
| Less than $10,000 | 0 (0.0%) | 0 (0.0%) |
| $10,000 to $24,999 | 0 (0.0%) | 0 (0.0%) |
| $25,000 to $34,999 | 0 (0.0%) | 0 (0.0%) |
| $35,000 to $49,999 | 16 (17.4%) | 15 (100.0%) |
| $50,000 to $74,999 | 16 (17.4%) | 0 (0.0%) |
| $75,000 to $99,999 | 20 (21.7%) | 0 (0.0%) |
| $100,000 to $149,999 | 17 (18.5%) | 0 (0.0%) |
| $150,000 or more | 23 (25.0%) | 0 (0.0%) |
| Total | 92 (100.0%) | 15 (100.0%) |
Property Value to Household Income Ratio in Marlborough
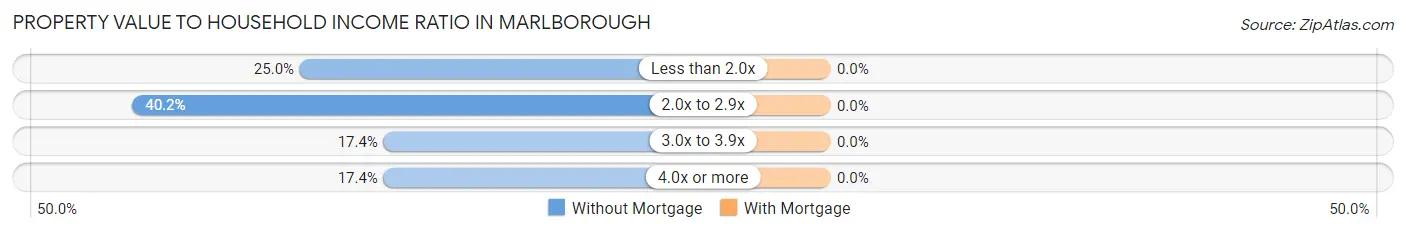
| Value-to-Income Ratio | Without Mortgage | With Mortgage |
| Less than 2.0x | 23 (25.0%) | 0 (0.0%) |
| 2.0x to 2.9x | 37 (40.2%) | 0 (0.0%) |
| 3.0x to 3.9x | 16 (17.4%) | 0 (0.0%) |
| 4.0x or more | 16 (17.4%) | 0 (0.0%) |
| Total | 92 (100.0%) | 15 (100.0%) |
Real Estate Taxes by Mortgage Status in Marlborough
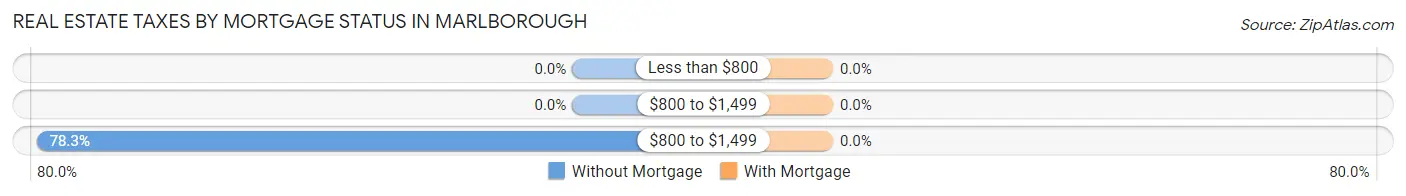
| Property Taxes | Without Mortgage | With Mortgage |
| Less than $800 | 0 (0.0%) | 0 (0.0%) |
| $800 to $1,499 | 0 (0.0%) | 0 (0.0%) |
| $800 to $1,499 | 72 (78.3%) | 0 (0.0%) |
| Total | 92 (100.0%) | 15 (100.0%) |
Health & Disability in Marlborough
Health Insurance Coverage by Age in Marlborough
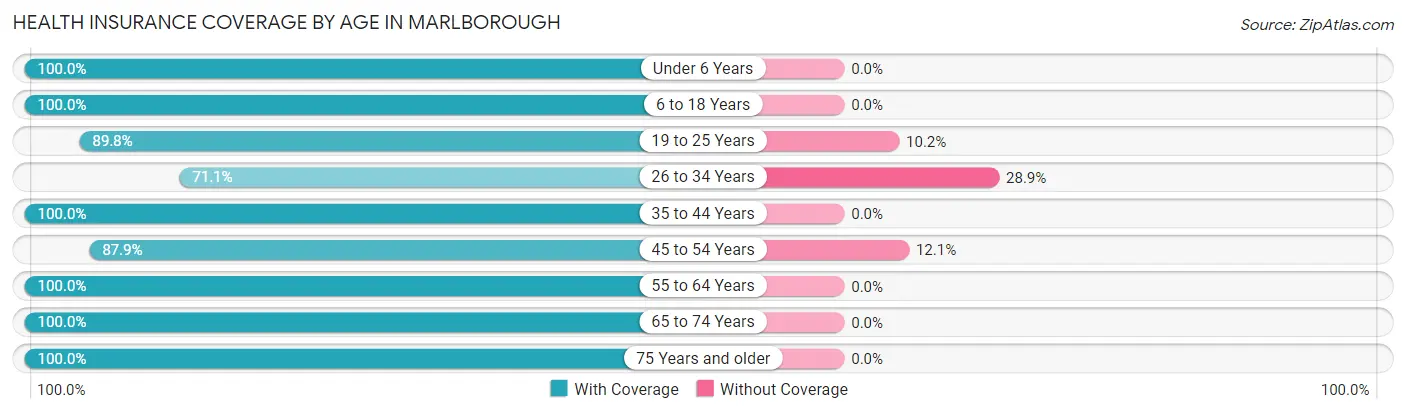
| Age Bracket | With Coverage | Without Coverage |
| Under 6 Years | 51 (100.0%) | 0 (0.0%) |
| 6 to 18 Years | 163 (100.0%) | 0 (0.0%) |
| 19 to 25 Years | 527 (89.8%) | 60 (10.2%) |
| 26 to 34 Years | 441 (71.1%) | 179 (28.9%) |
| 35 to 44 Years | 440 (100.0%) | 0 (0.0%) |
| 45 to 54 Years | 124 (87.9%) | 17 (12.1%) |
| 55 to 64 Years | 146 (100.0%) | 0 (0.0%) |
| 65 to 74 Years | 228 (100.0%) | 0 (0.0%) |
| 75 Years and older | 116 (100.0%) | 0 (0.0%) |
| Total | 2,236 (89.7%) | 256 (10.3%) |
Health Insurance Coverage by Citizenship Status in Marlborough
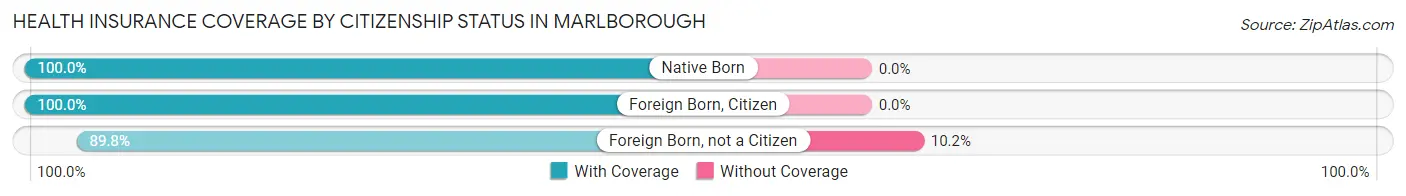
| Citizenship Status | With Coverage | Without Coverage |
| Native Born | 51 (100.0%) | 0 (0.0%) |
| Foreign Born, Citizen | 163 (100.0%) | 0 (0.0%) |
| Foreign Born, not a Citizen | 527 (89.8%) | 60 (10.2%) |
Health Insurance Coverage by Household Income in Marlborough
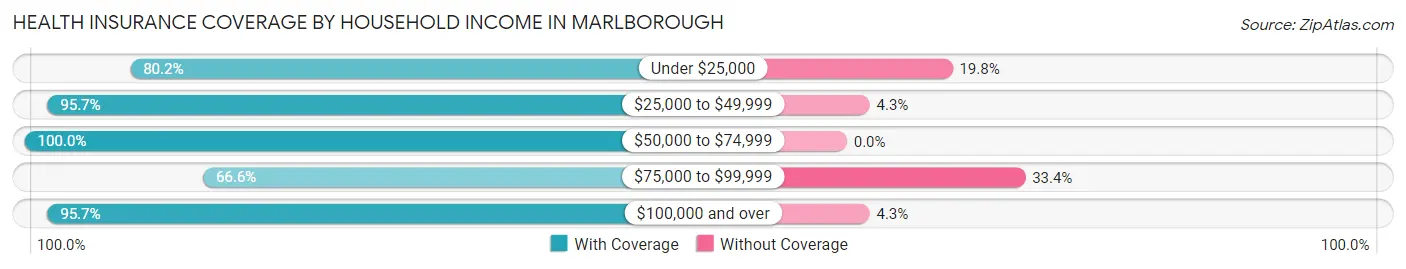
| Household Income | With Coverage | Without Coverage |
| Under $25,000 | 320 (80.2%) | 79 (19.8%) |
| $25,000 to $49,999 | 583 (95.7%) | 26 (4.3%) |
| $50,000 to $74,999 | 541 (100.0%) | 0 (0.0%) |
| $75,000 to $99,999 | 253 (66.6%) | 127 (33.4%) |
| $100,000 and over | 539 (95.7%) | 24 (4.3%) |
Public vs Private Health Insurance Coverage by Age in Marlborough
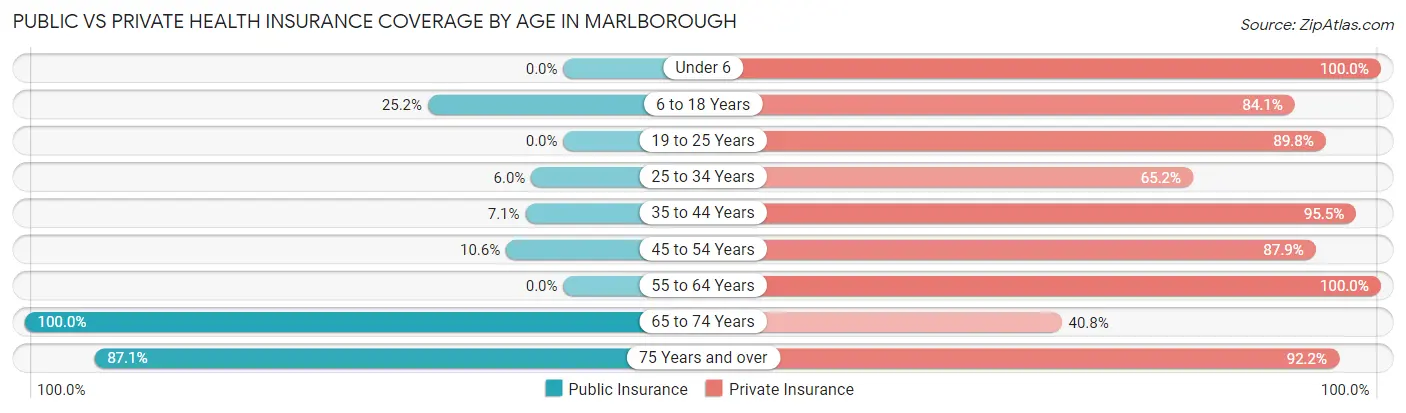
| Age Bracket | Public Insurance | Private Insurance |
| Under 6 | 0 (0.0%) | 51 (100.0%) |
| 6 to 18 Years | 41 (25.2%) | 137 (84.1%) |
| 19 to 25 Years | 0 (0.0%) | 527 (89.8%) |
| 25 to 34 Years | 37 (6.0%) | 404 (65.2%) |
| 35 to 44 Years | 31 (7.0%) | 420 (95.5%) |
| 45 to 54 Years | 15 (10.6%) | 124 (87.9%) |
| 55 to 64 Years | 0 (0.0%) | 146 (100.0%) |
| 65 to 74 Years | 228 (100.0%) | 93 (40.8%) |
| 75 Years and over | 101 (87.1%) | 107 (92.2%) |
| Total | 453 (18.2%) | 2,009 (80.6%) |
Disability Status by Sex by Age in Marlborough
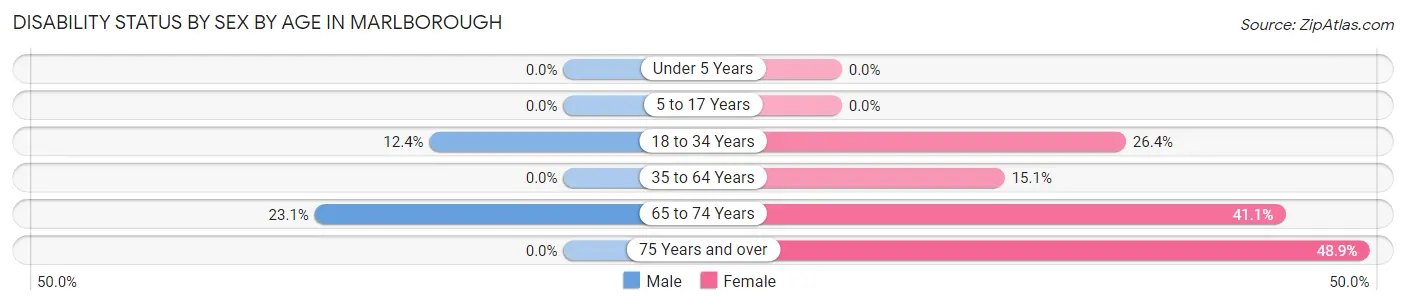
| Age Bracket | Male | Female |
| Under 5 Years | 0 (0.0%) | 0 (0.0%) |
| 5 to 17 Years | 0 (0.0%) | 0 (0.0%) |
| 18 to 34 Years | 84 (12.4%) | 140 (26.4%) |
| 35 to 64 Years | 0 (0.0%) | 62 (15.1%) |
| 65 to 74 Years | 24 (23.1%) | 51 (41.1%) |
| 75 Years and over | 0 (0.0%) | 23 (48.9%) |
Disability Class by Sex by Age in Marlborough
Disability Class: Hearing Difficulty
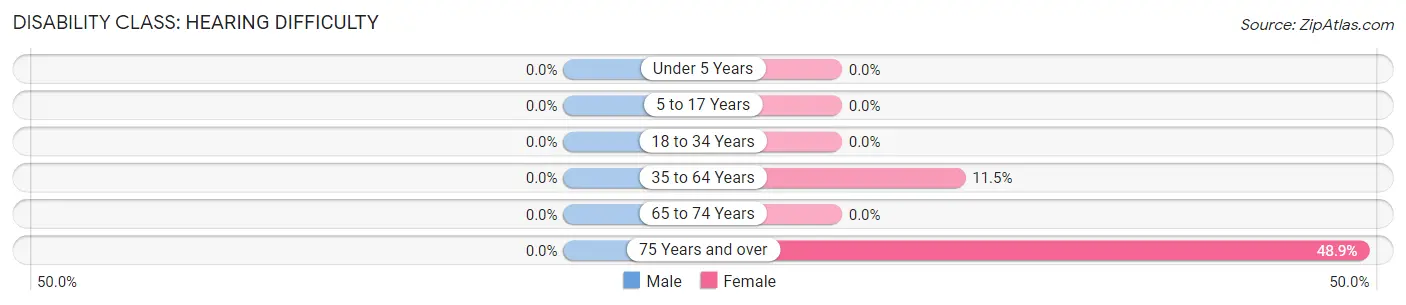
| Age Bracket | Male | Female |
| Under 5 Years | 0 (0.0%) | 0 (0.0%) |
| 5 to 17 Years | 0 (0.0%) | 0 (0.0%) |
| 18 to 34 Years | 0 (0.0%) | 0 (0.0%) |
| 35 to 64 Years | 0 (0.0%) | 47 (11.5%) |
| 65 to 74 Years | 0 (0.0%) | 0 (0.0%) |
| 75 Years and over | 0 (0.0%) | 23 (48.9%) |
Disability Class: Vision Difficulty
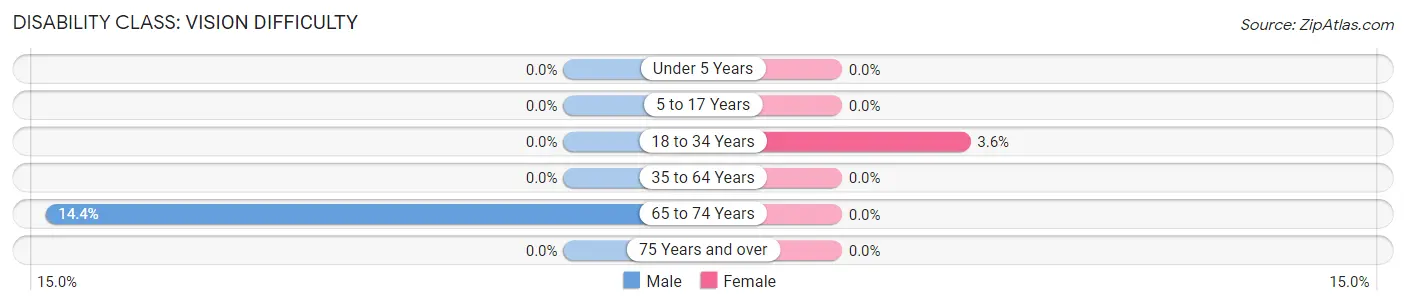
| Age Bracket | Male | Female |
| Under 5 Years | 0 (0.0%) | 0 (0.0%) |
| 5 to 17 Years | 0 (0.0%) | 0 (0.0%) |
| 18 to 34 Years | 0 (0.0%) | 19 (3.6%) |
| 35 to 64 Years | 0 (0.0%) | 0 (0.0%) |
| 65 to 74 Years | 15 (14.4%) | 0 (0.0%) |
| 75 Years and over | 0 (0.0%) | 0 (0.0%) |
Disability Class: Cognitive Difficulty
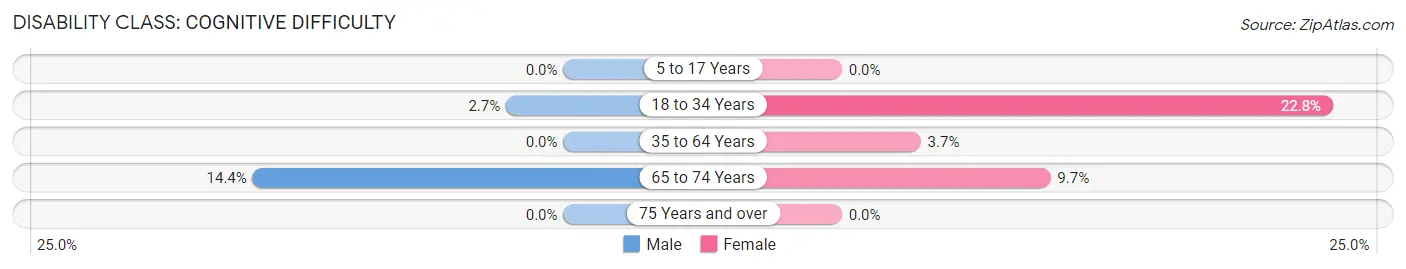
| Age Bracket | Male | Female |
| 5 to 17 Years | 0 (0.0%) | 0 (0.0%) |
| 18 to 34 Years | 18 (2.7%) | 121 (22.8%) |
| 35 to 64 Years | 0 (0.0%) | 15 (3.7%) |
| 65 to 74 Years | 15 (14.4%) | 12 (9.7%) |
| 75 Years and over | 0 (0.0%) | 0 (0.0%) |
Disability Class: Ambulatory Difficulty
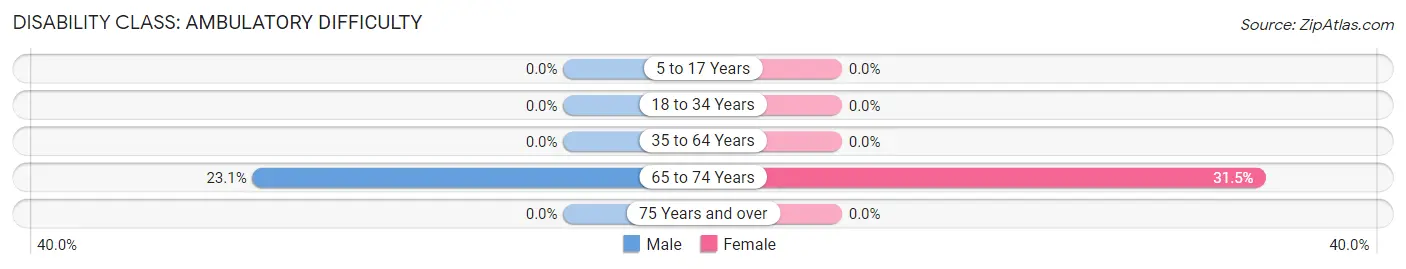
| Age Bracket | Male | Female |
| 5 to 17 Years | 0 (0.0%) | 0 (0.0%) |
| 18 to 34 Years | 0 (0.0%) | 0 (0.0%) |
| 35 to 64 Years | 0 (0.0%) | 0 (0.0%) |
| 65 to 74 Years | 24 (23.1%) | 39 (31.5%) |
| 75 Years and over | 0 (0.0%) | 0 (0.0%) |
Disability Class: Self-Care Difficulty
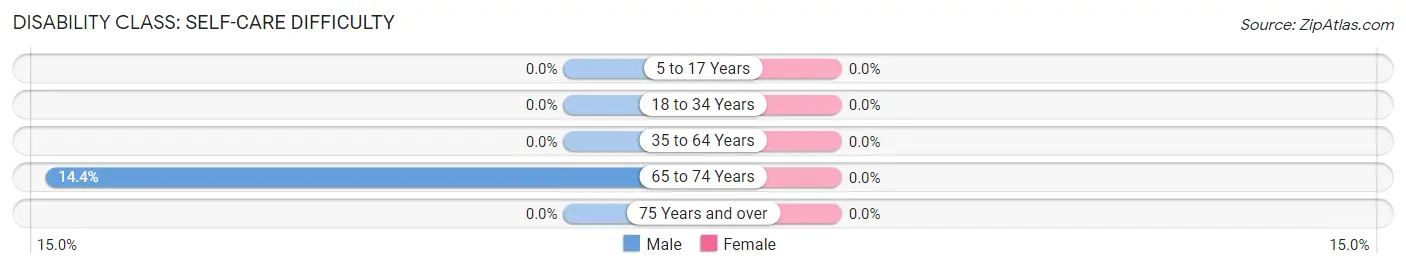
| Age Bracket | Male | Female |
| 5 to 17 Years | 0 (0.0%) | 0 (0.0%) |
| 18 to 34 Years | 0 (0.0%) | 0 (0.0%) |
| 35 to 64 Years | 0 (0.0%) | 0 (0.0%) |
| 65 to 74 Years | 15 (14.4%) | 0 (0.0%) |
| 75 Years and over | 0 (0.0%) | 0 (0.0%) |
Technology Access in Marlborough
Computing Device Access in Marlborough
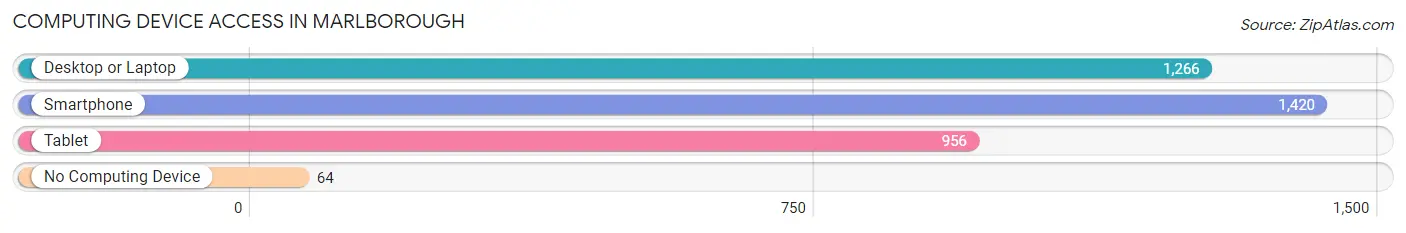
| Device Type | # Households | % Households |
| Desktop or Laptop | 1,266 | 81.9% |
| Smartphone | 1,420 | 91.8% |
| Tablet | 956 | 61.8% |
| No Computing Device | 64 | 4.1% |
| Total | 1,546 | 100.0% |
Internet Access in Marlborough
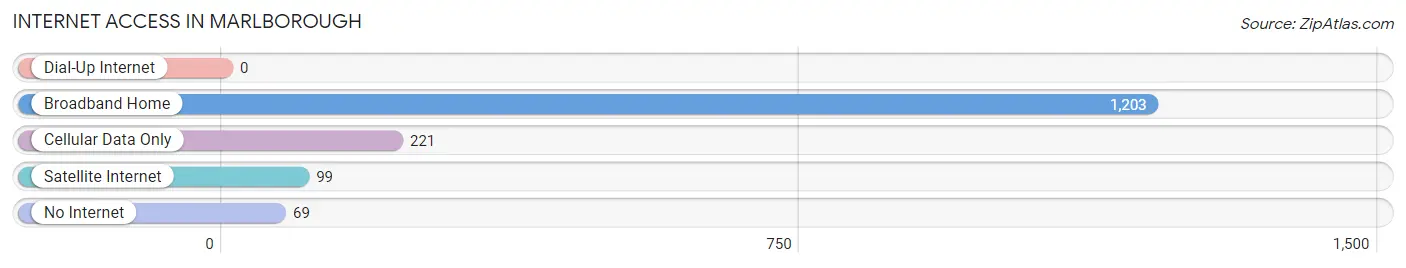
| Internet Type | # Households | % Households |
| Dial-Up Internet | 0 | 0.0% |
| Broadband Home | 1,203 | 77.8% |
| Cellular Data Only | 221 | 14.3% |
| Satellite Internet | 99 | 6.4% |
| No Internet | 69 | 4.5% |
| Total | 1,546 | 100.0% |
Marlborough Summary
Marlborough is a small city located in St. Louis County, Missouri, United States. The city is situated on the banks of the Missouri River, and is part of the Greater St. Louis metropolitan area. As of the 2010 census, the city had a population of 1,945.
History
Marlborough was founded in 1867 by German immigrants who had settled in the area. The city was named after Marlborough, Massachusetts, which was the hometown of one of the founders. The city was incorporated in 1876.
In the late 19th century, Marlborough was a thriving industrial center, with several factories and mills located in the city. The city was also home to a large number of German immigrants, who established churches, schools, and businesses in the area.
In the early 20th century, Marlborough experienced a period of decline, as many of the factories and mills closed down. The city was also affected by the Great Depression, and many of the residents left the area in search of work.
Geography
Marlborough is located in St. Louis County, Missouri, at the intersection of Interstate 70 and Interstate 270. The city is situated on the banks of the Missouri River, and is part of the Greater St. Louis metropolitan area.
The city has a total area of 1.3 square miles, all of which is land. The city is located in a hilly area, and is surrounded by forests and farmland.
Economy
Marlborough's economy is largely based on manufacturing and retail. The city is home to several factories and mills, including a paper mill, a steel mill, and a plastics factory. The city is also home to several retail stores, including a grocery store, a hardware store, and a pharmacy.
Demographics
As of the 2010 census, there were 1,945 people, 790 households, and 517 families residing in the city. The population density was 1,521.2 people per square mile. The racial makeup of the city was 87.2% White, 8.2% African American, 0.3% Native American, 0.7% Asian, 0.1% Pacific Islander, 1.2% from other races, and 2.3% from two or more races. Hispanic or Latino of any race were 3.2% of the population.
The median income for a household in the city was $41,250, and the median income for a family was $50,000. The per capita income for the city was $20,945. About 8.2% of families and 10.2% of the population were below the poverty line, including 14.2% of those under age 18 and 8.3% of those age 65 or over.
Common Questions
What is Per Capita Income in Marlborough?
Per Capita income in Marlborough is $35,071.
What is the Median Family Income in Marlborough?
Median Family Income in Marlborough is $90,347.
What is the Median Household income in Marlborough?
Median Household Income in Marlborough is $50,000.
What is Income or Wage Gap in Marlborough?
Income or Wage Gap in Marlborough is 7.4%.
Women in Marlborough earn 92.6 cents for every dollar earned by a man.
What is Inequality or Gini Index in Marlborough?
Inequality or Gini Index in Marlborough is 0.35.
What is the Total Population of Marlborough?
Total Population of Marlborough is 2,492.
What is the Total Male Population of Marlborough?
Total Male Population of Marlborough is 1,258.
What is the Total Female Population of Marlborough?
Total Female Population of Marlborough is 1,234.
What is the Ratio of Males per 100 Females in Marlborough?
There are 101.94 Males per 100 Females in Marlborough.
What is the Ratio of Females per 100 Males in Marlborough?
There are 98.09 Females per 100 Males in Marlborough.
What is the Median Population Age in Marlborough?
Median Population Age in Marlborough is 30.0 Years.
What is the Average Family Size in Marlborough
Average Family Size in Marlborough is 2.3 People.
What is the Average Household Size in Marlborough
Average Household Size in Marlborough is 1.6 People.
How Large is the Labor Force in Marlborough?
There are 1,952 People in the Labor Forcein in Marlborough.
What is the Percentage of People in the Labor Force in Marlborough?
83.2% of People are in the Labor Force in Marlborough.
What is the Unemployment Rate in Marlborough?
Unemployment Rate in Marlborough is 8.0%.