White Sands, NM Map & Demographics
White Sands Map
White Sands Overview
$29,225
PER CAPITA INCOME
$98,750
AVG FAMILY INCOME
$88,750
AVG HOUSEHOLD INCOME
9.2%
WAGE / INCOME GAP [ % ]
90.8¢/ $1
WAGE / INCOME GAP [ $ ]
0.31
INEQUALITY / GINI INDEX
1,449
TOTAL POPULATION
885
MALE POPULATION
564
FEMALE POPULATION
156.91
MALES / 100 FEMALES
63.73
FEMALES / 100 MALES
21.9
MEDIAN AGE
3.5
AVG FAMILY SIZE
3.1
AVG HOUSEHOLD SIZE
894
LABOR FORCE [ PEOPLE ]
84.3%
PERCENT IN LABOR FORCE
White Sands Area Codes
Income in White Sands
Income Overview in White Sands
Per Capita Income in White Sands is $29,225, while median incomes of families and households are $98,750 and $88,750 respectively.
| Characteristic | Number | Measure |
| Per Capita Income | 1,449 | $29,225 |
| Median Family Income | 263 | $98,750 |
| Mean Family Income | 263 | $108,221 |
| Median Household Income | 341 | $88,750 |
| Mean Household Income | 341 | $98,465 |
| Income Deficit | 263 | $0 |
| Wage / Income Gap (%) | 1,449 | 9.21% |
| Wage / Income Gap ($) | 1,449 | 90.79¢ per $1 |
| Gini / Inequality Index | 1,449 | 0.31 |
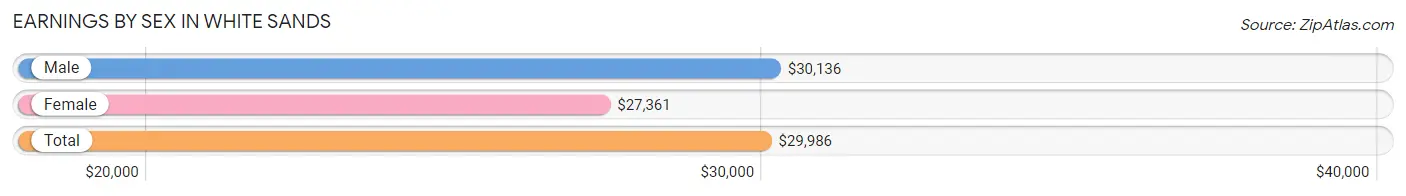
Earnings by Sex in White Sands
Average Earnings in White Sands are $29,986, $30,136 for men and $27,361 for women, a difference of 9.2%.
| Sex | Number | Average Earnings |
| Male | 641 (71.3%) | $30,136 |
| Female | 258 (28.7%) | $27,361 |
| Total | 899 (100.0%) | $29,986 |
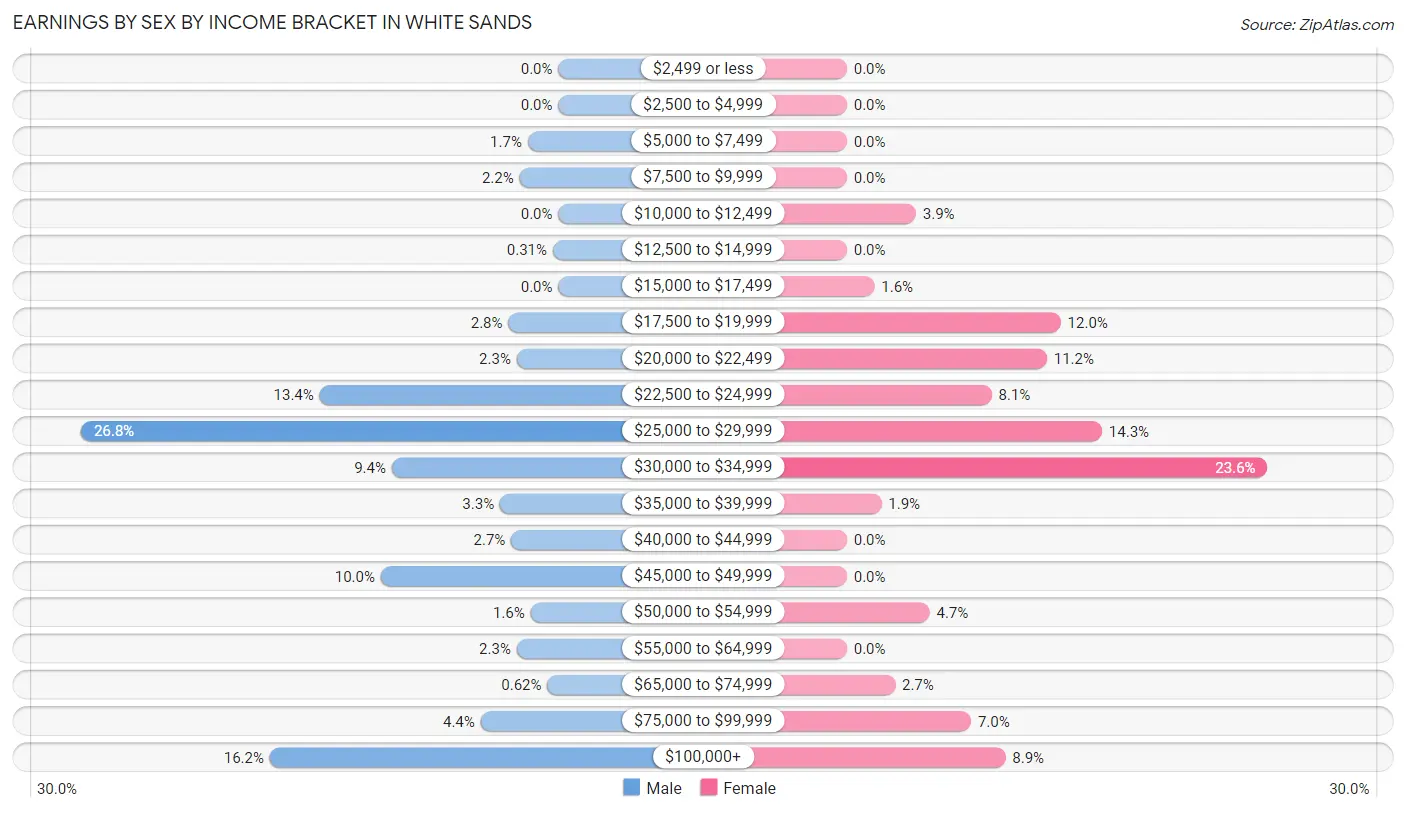
Earnings by Sex by Income Bracket in White Sands
The most common earnings brackets in White Sands are $25,000 to $29,999 for men (172 | 26.8%) and $30,000 to $34,999 for women (61 | 23.6%).
| Income | Male | Female |
| $2,499 or less | 0 (0.0%) | 0 (0.0%) |
| $2,500 to $4,999 | 0 (0.0%) | 0 (0.0%) |
| $5,000 to $7,499 | 11 (1.7%) | 0 (0.0%) |
| $7,500 to $9,999 | 14 (2.2%) | 0 (0.0%) |
| $10,000 to $12,499 | 0 (0.0%) | 10 (3.9%) |
| $12,500 to $14,999 | 2 (0.3%) | 0 (0.0%) |
| $15,000 to $17,499 | 0 (0.0%) | 4 (1.5%) |
| $17,500 to $19,999 | 18 (2.8%) | 31 (12.0%) |
| $20,000 to $22,499 | 15 (2.3%) | 29 (11.2%) |
| $22,500 to $24,999 | 86 (13.4%) | 21 (8.1%) |
| $25,000 to $29,999 | 172 (26.8%) | 37 (14.3%) |
| $30,000 to $34,999 | 60 (9.4%) | 61 (23.6%) |
| $35,000 to $39,999 | 21 (3.3%) | 5 (1.9%) |
| $40,000 to $44,999 | 17 (2.6%) | 0 (0.0%) |
| $45,000 to $49,999 | 64 (10.0%) | 0 (0.0%) |
| $50,000 to $54,999 | 10 (1.6%) | 12 (4.6%) |
| $55,000 to $64,999 | 15 (2.3%) | 0 (0.0%) |
| $65,000 to $74,999 | 4 (0.6%) | 7 (2.7%) |
| $75,000 to $99,999 | 28 (4.4%) | 18 (7.0%) |
| $100,000+ | 104 (16.2%) | 23 (8.9%) |
| Total | 641 (100.0%) | 258 (100.0%) |
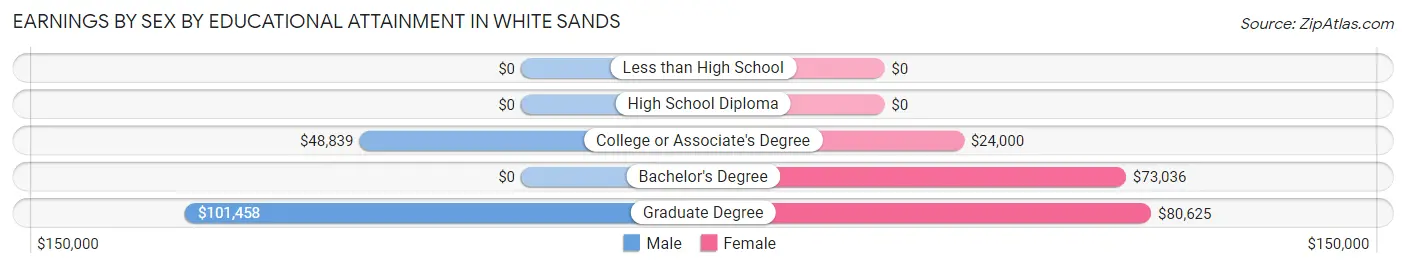
Earnings by Sex by Educational Attainment in White Sands
Average earnings in White Sands are $80,833 for men and $34,250 for women, a difference of 57.6%. Men with an educational attainment of graduate degree enjoy the highest average annual earnings of $101,458, while those with college or associate's degree education earn the least with $48,839. Women with an educational attainment of graduate degree earn the most with the average annual earnings of $80,625, while those with college or associate's degree education have the smallest earnings of $24,000.
| Educational Attainment | Male Income | Female Income |
| Less than High School | - | - |
| High School Diploma | - | - |
| College or Associate's Degree | $48,839 | $24,000 |
| Bachelor's Degree | - | - |
| Graduate Degree | $101,458 | $80,625 |
| Total | $80,833 | $34,250 |
Family Income in White Sands
Family Income Brackets in White Sands
According to the White Sands family income data, there are 91 families falling into the $50,000 to $74,999 income range, which is the most common income bracket and makes up 34.6% of all families.
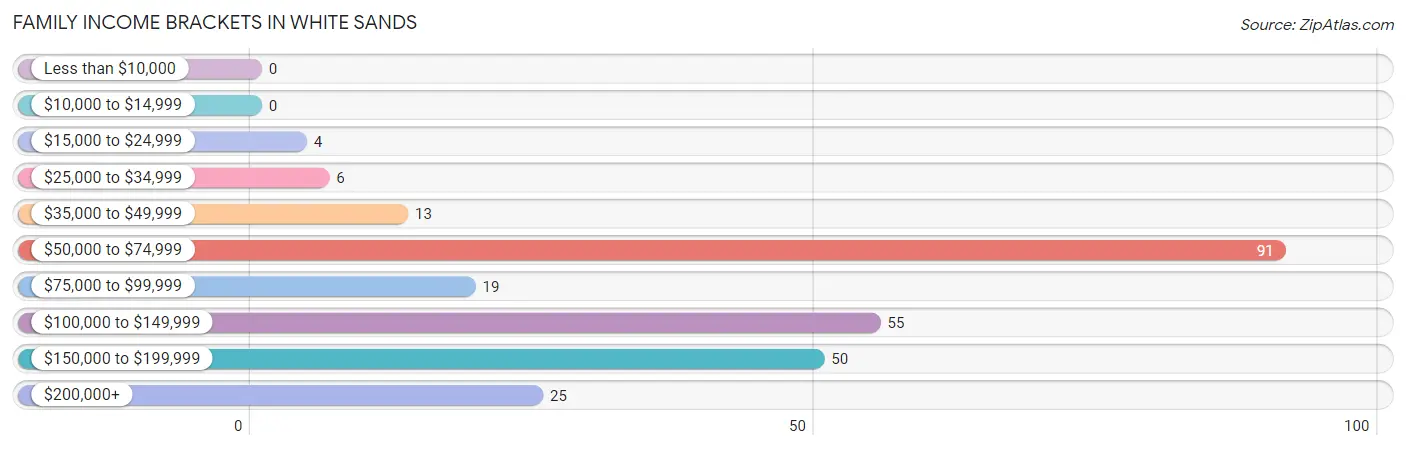
| Income Bracket | # Families | % Families |
| Less than $10,000 | 0 | 0.0% |
| $10,000 to $14,999 | 0 | 0.0% |
| $15,000 to $24,999 | 4 | 1.5% |
| $25,000 to $34,999 | 6 | 2.3% |
| $35,000 to $49,999 | 13 | 4.9% |
| $50,000 to $74,999 | 91 | 34.6% |
| $75,000 to $99,999 | 19 | 7.2% |
| $100,000 to $149,999 | 55 | 20.9% |
| $150,000 to $199,999 | 50 | 19.0% |
| $200,000+ | 25 | 9.5% |
Family Income by Famaliy Size in White Sands
2-person families (98 | 37.3%) account for the highest median family income in White Sands with $119,833 per family, while 2-person families (98 | 37.3%) have the highest median income of $59,916 per family member.
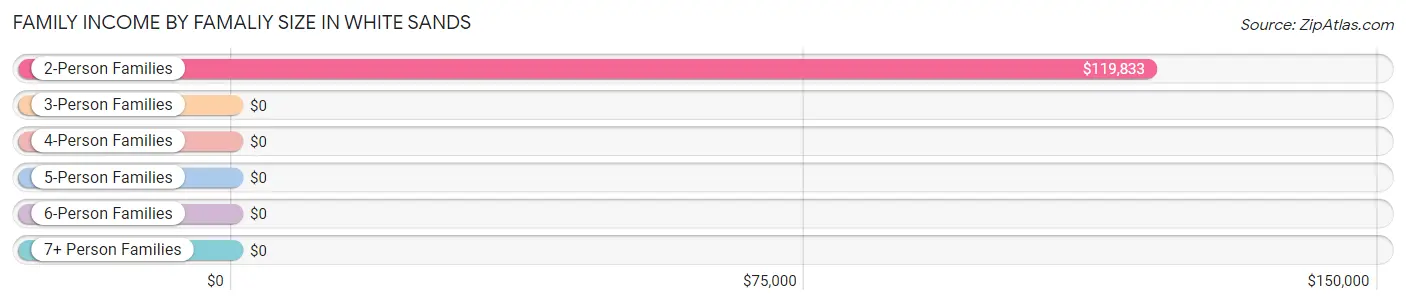
| Income Bracket | # Families | Median Income |
| 2-Person Families | 98 (37.3%) | $119,833 |
| 3-Person Families | 28 (10.6%) | $0 |
| 4-Person Families | 90 (34.2%) | $0 |
| 5-Person Families | 19 (7.2%) | $0 |
| 6-Person Families | 26 (9.9%) | $0 |
| 7+ Person Families | 2 (0.8%) | $0 |
| Total | 263 (100.0%) | $98,750 |
Family Income by Number of Earners in White Sands
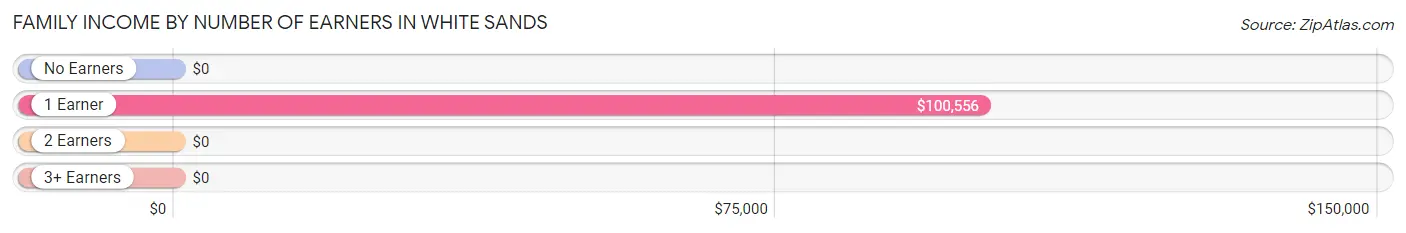
| Number of Earners | # Families | Median Income |
| No Earners | 4 (1.5%) | $0 |
| 1 Earner | 76 (28.9%) | $100,556 |
| 2 Earners | 180 (68.4%) | $0 |
| 3+ Earners | 3 (1.1%) | $0 |
| Total | 263 (100.0%) | $98,750 |
Household Income in White Sands
Household Income Brackets in White Sands
With 91 households falling in the category, the $50,000 to $74,999 income range is the most frequent in White Sands, accounting for 26.7% of all households.
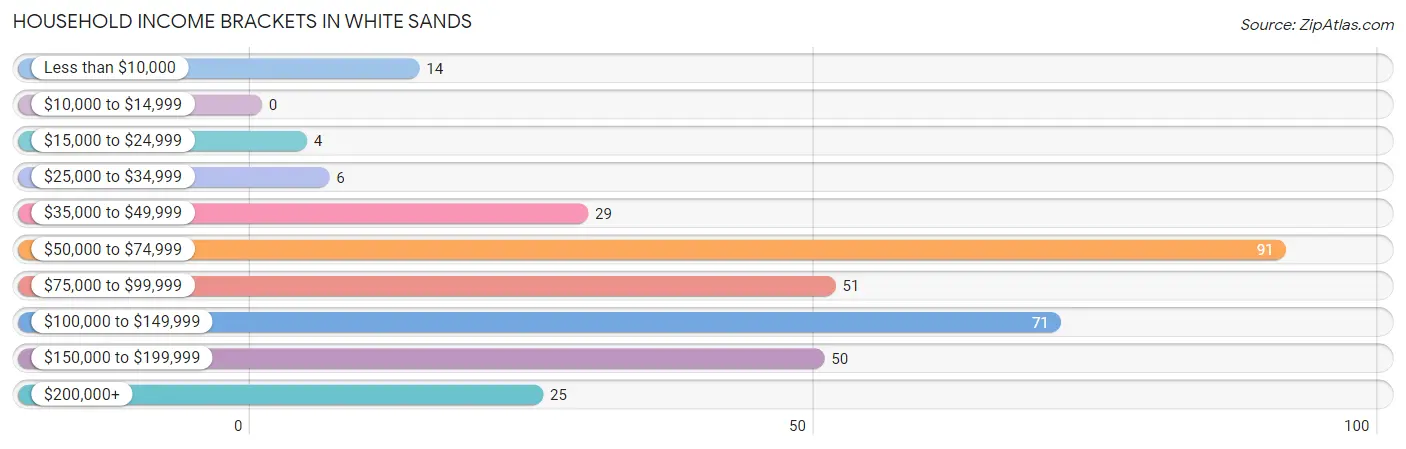
| Income Bracket | # Households | % Households |
| Less than $10,000 | 14 | 4.1% |
| $10,000 to $14,999 | 0 | 0.0% |
| $15,000 to $24,999 | 4 | 1.2% |
| $25,000 to $34,999 | 6 | 1.8% |
| $35,000 to $49,999 | 29 | 8.5% |
| $50,000 to $74,999 | 91 | 26.7% |
| $75,000 to $99,999 | 51 | 15.0% |
| $100,000 to $149,999 | 71 | 20.8% |
| $150,000 to $199,999 | 50 | 14.7% |
| $200,000+ | 25 | 7.3% |
Household Income by Householder Age in White Sands
The median household income in White Sands is $88,750, with the highest median household income of $119,250 found in the 45 to 64 years age bracket for the primary householder. A total of 109 households (32.0%) fall into this category. Meanwhile, the 65+ years age bracket for the primary householder has the lowest median household income of $0, with 20 households (5.9%) in this group.
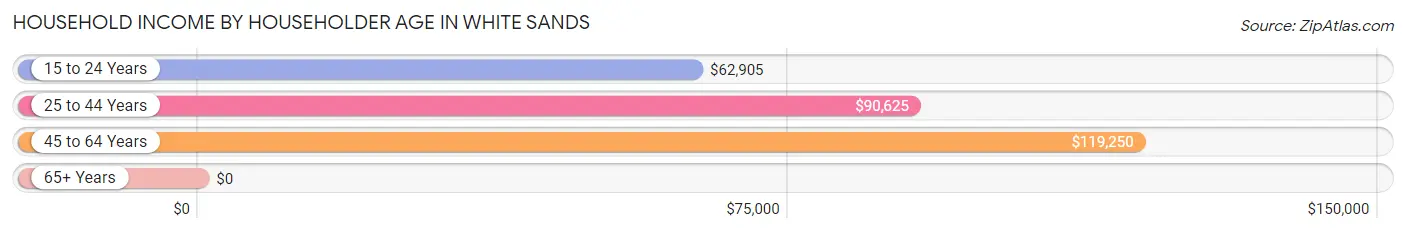
| Income Bracket | # Households | Median Income |
| 15 to 24 Years | 62 (18.2%) | $62,905 |
| 25 to 44 Years | 150 (44.0%) | $90,625 |
| 45 to 64 Years | 109 (32.0%) | $119,250 |
| 65+ Years | 20 (5.9%) | $0 |
| Total | 341 (100.0%) | $88,750 |
Poverty in White Sands
Income Below Poverty by Sex and Age in White Sands
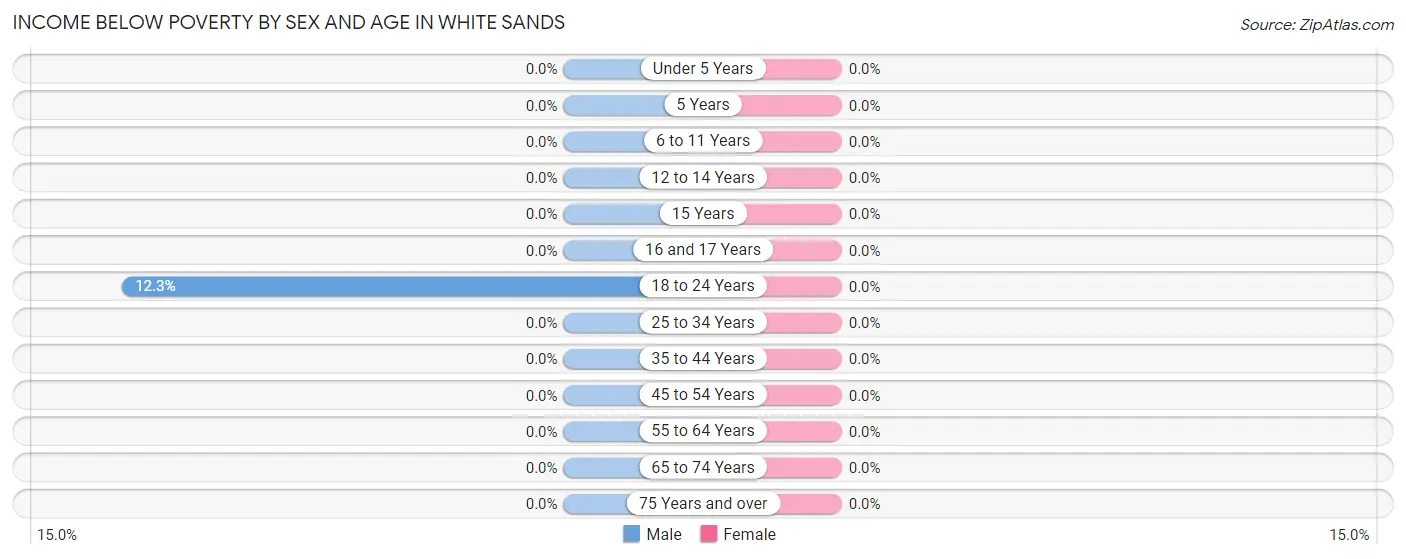
| Age Bracket | Male | Female |
| Under 5 Years | 0 (0.0%) | 0 (0.0%) |
| 5 Years | 0 (0.0%) | 0 (0.0%) |
| 6 to 11 Years | 0 (0.0%) | 0 (0.0%) |
| 12 to 14 Years | 0 (0.0%) | 0 (0.0%) |
| 15 Years | 0 (0.0%) | 0 (0.0%) |
| 16 and 17 Years | 0 (0.0%) | 0 (0.0%) |
| 18 to 24 Years | 14 (12.3%) | 0 (0.0%) |
| 25 to 34 Years | 0 (0.0%) | 0 (0.0%) |
| 35 to 44 Years | 0 (0.0%) | 0 (0.0%) |
| 45 to 54 Years | 0 (0.0%) | 0 (0.0%) |
| 55 to 64 Years | 0 (0.0%) | 0 (0.0%) |
| 65 to 74 Years | 0 (0.0%) | 0 (0.0%) |
| 75 Years and over | 0 (0.0%) | 0 (0.0%) |
| Total | 14 (2.9%) | 0 (0.0%) |
Income Above Poverty by Sex and Age in White Sands
According to the poverty statistics in White Sands, males aged under 5 years and females aged under 5 years are the age groups that are most secure financially, with 100.0% of males and 100.0% of females in these age groups living above the poverty line.
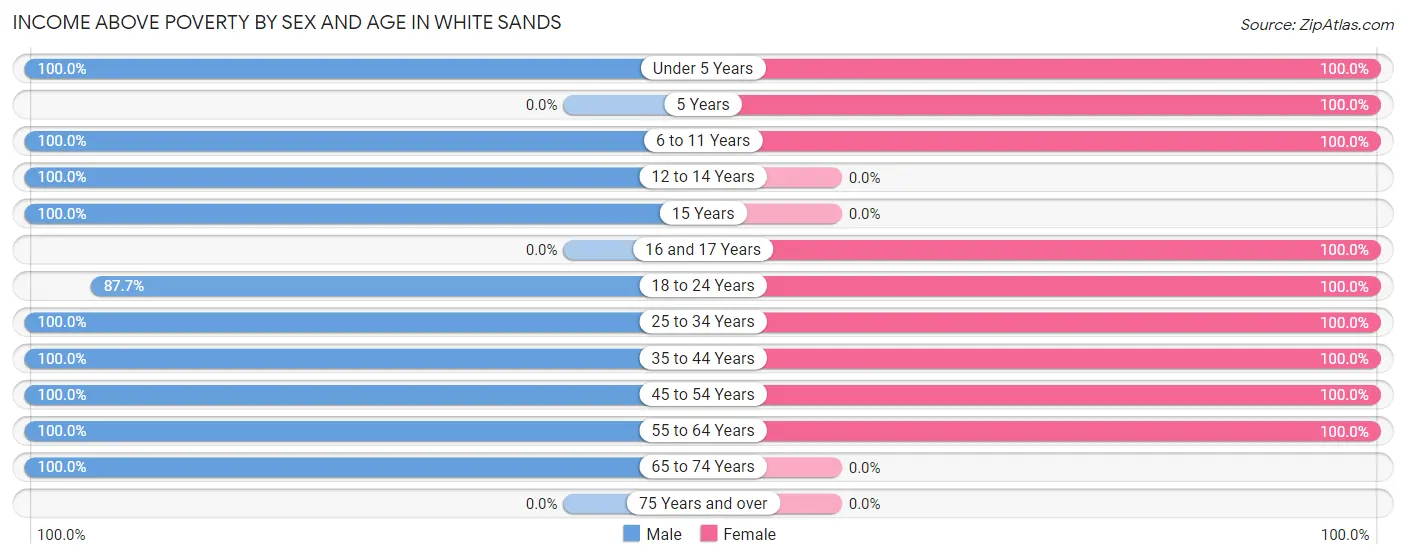
| Age Bracket | Male | Female |
| Under 5 Years | 29 (100.0%) | 136 (100.0%) |
| 5 Years | 0 (0.0%) | 29 (100.0%) |
| 6 to 11 Years | 69 (100.0%) | 37 (100.0%) |
| 12 to 14 Years | 24 (100.0%) | 0 (0.0%) |
| 15 Years | 3 (100.0%) | 0 (0.0%) |
| 16 and 17 Years | 0 (0.0%) | 11 (100.0%) |
| 18 to 24 Years | 100 (87.7%) | 67 (100.0%) |
| 25 to 34 Years | 61 (100.0%) | 91 (100.0%) |
| 35 to 44 Years | 60 (100.0%) | 86 (100.0%) |
| 45 to 54 Years | 60 (100.0%) | 13 (100.0%) |
| 55 to 64 Years | 42 (100.0%) | 41 (100.0%) |
| 65 to 74 Years | 20 (100.0%) | 0 (0.0%) |
| 75 Years and over | 0 (0.0%) | 0 (0.0%) |
| Total | 468 (97.1%) | 511 (100.0%) |
Income Below Poverty Among Married-Couple Families in White Sands
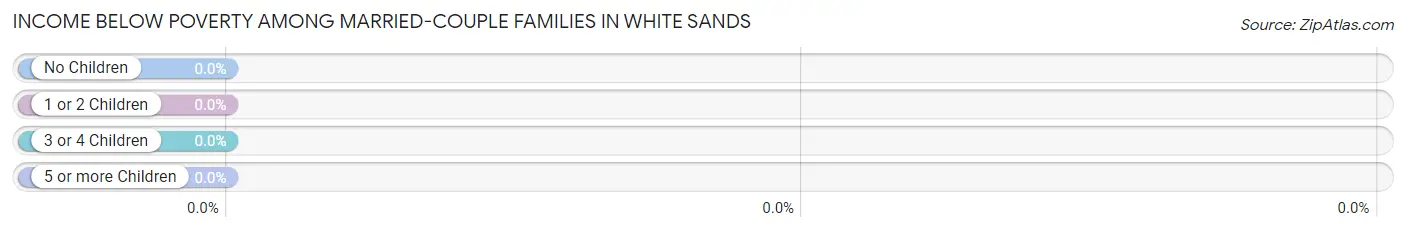
| Children | Above Poverty | Below Poverty |
| No Children | 117 (100.0%) | 0 (0.0%) |
| 1 or 2 Children | 85 (100.0%) | 0 (0.0%) |
| 3 or 4 Children | 47 (100.0%) | 0 (0.0%) |
| 5 or more Children | 0 (0.0%) | 0 (0.0%) |
| Total | 249 (100.0%) | 0 (0.0%) |
Income Below Poverty Among Single-Parent Households in White Sands
| Children | Single Father | Single Mother |
| No Children | 0 (0.0%) | 0 (0.0%) |
| 1 or 2 Children | 0 (0.0%) | 0 (0.0%) |
| 3 or 4 Children | 0 (0.0%) | 0 (0.0%) |
| 5 or more Children | 0 (0.0%) | 0 (0.0%) |
| Total | 0 (0.0%) | 0 (0.0%) |
Income Below Poverty Among Married-Couple vs Single-Parent Households in White Sands
| Children | Married-Couple Families | Single-Parent Households |
| No Children | 0 (0.0%) | 0 (0.0%) |
| 1 or 2 Children | 0 (0.0%) | 0 (0.0%) |
| 3 or 4 Children | 0 (0.0%) | 0 (0.0%) |
| 5 or more Children | 0 (0.0%) | 0 (0.0%) |
| Total | 0 (0.0%) | 0 (0.0%) |
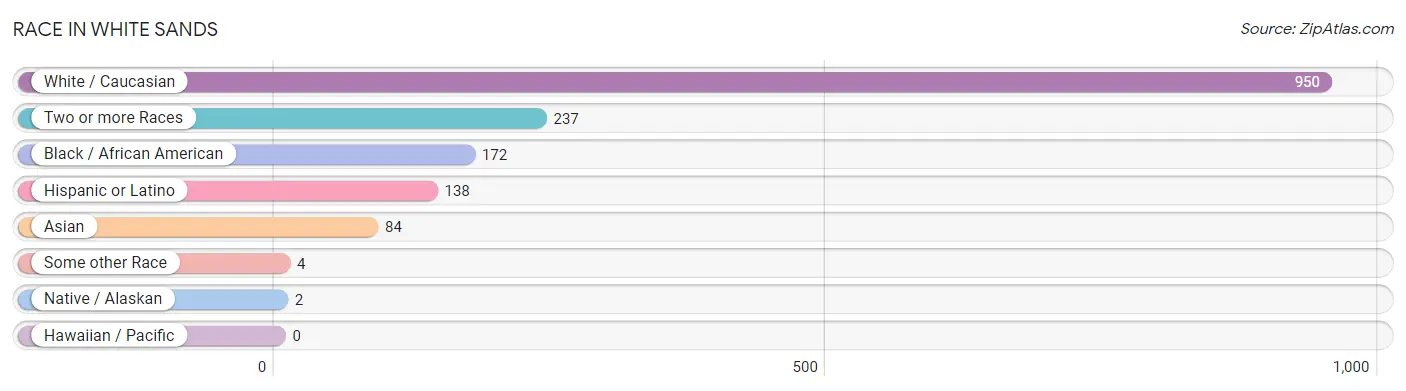
Race in White Sands
The most populous races in White Sands are White / Caucasian (950 | 65.6%), Two or more Races (237 | 16.4%), and Black / African American (172 | 11.9%).
| Race | # Population | % Population |
| Asian | 84 | 5.8% |
| Black / African American | 172 | 11.9% |
| Hawaiian / Pacific | 0 | 0.0% |
| Hispanic or Latino | 138 | 9.5% |
| Native / Alaskan | 2 | 0.1% |
| White / Caucasian | 950 | 65.6% |
| Two or more Races | 237 | 16.4% |
| Some other Race | 4 | 0.3% |
| Total | 1,449 | 100.0% |
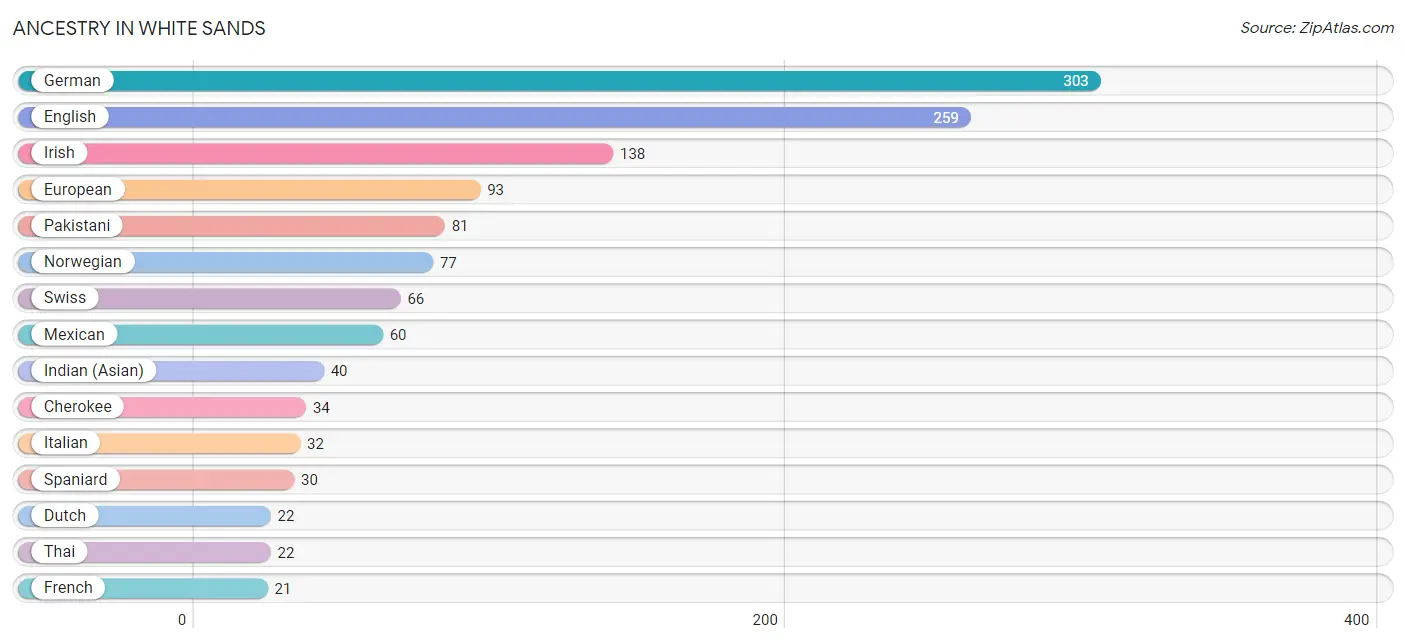
Ancestry in White Sands
The most populous ancestries reported in White Sands are German (303 | 20.9%), English (259 | 17.9%), Irish (138 | 9.5%), European (93 | 6.4%), and Pakistani (81 | 5.6%), together accounting for 60.3% of all White Sands residents.
| Ancestry | # Population | % Population |
| African | 3 | 0.2% |
| American | 20 | 1.4% |
| Cherokee | 34 | 2.4% |
| Dutch | 22 | 1.5% |
| English | 259 | 17.9% |
| European | 93 | 6.4% |
| French | 21 | 1.5% |
| German | 303 | 20.9% |
| Hopi | 2 | 0.1% |
| Indian (Asian) | 40 | 2.8% |
| Indonesian | 4 | 0.3% |
| Irish | 138 | 9.5% |
| Italian | 32 | 2.2% |
| Japanese | 9 | 0.6% |
| Kenyan | 1 | 0.1% |
| Korean | 6 | 0.4% |
| Mexican | 60 | 4.1% |
| Norwegian | 77 | 5.3% |
| Pakistani | 81 | 5.6% |
| Polish | 7 | 0.5% |
| Puerto Rican | 1 | 0.1% |
| Scandinavian | 8 | 0.5% |
| Scottish | 15 | 1.0% |
| Spaniard | 30 | 2.1% |
| Spanish | 15 | 1.0% |
| Sri Lankan | 6 | 0.4% |
| Subsaharan African | 4 | 0.3% |
| Swiss | 66 | 4.5% |
| Thai | 22 | 1.5% |
| Welsh | 6 | 0.4% | View All 30 Rows |
Immigrants in White Sands
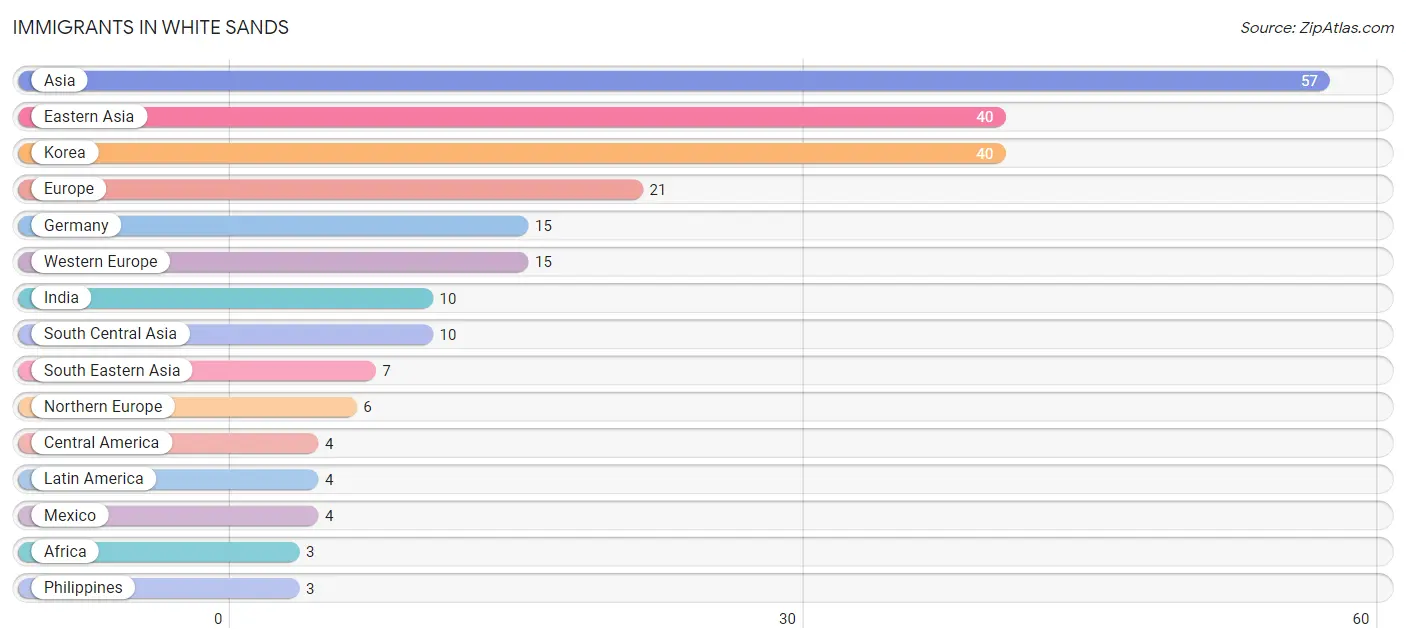
The most numerous immigrant groups reported in White Sands came from Asia (57 | 3.9%), Eastern Asia (40 | 2.8%), Korea (40 | 2.8%), Europe (21 | 1.5%), and Germany (15 | 1.0%), together accounting for 11.9% of all White Sands residents.
| Immigration Origin | # Population | % Population |
| Africa | 3 | 0.2% |
| Asia | 57 | 3.9% |
| Central America | 4 | 0.3% |
| Eastern Asia | 40 | 2.8% |
| Europe | 21 | 1.5% |
| Germany | 15 | 1.0% |
| India | 10 | 0.7% |
| Korea | 40 | 2.8% |
| Latin America | 4 | 0.3% |
| Mexico | 4 | 0.3% |
| Northern Europe | 6 | 0.4% |
| Philippines | 3 | 0.2% |
| South Central Asia | 10 | 0.7% |
| South Eastern Asia | 7 | 0.5% |
| Western Africa | 3 | 0.2% |
| Western Europe | 15 | 1.0% | View All 16 Rows |
Sex and Age in White Sands
Sex and Age in White Sands
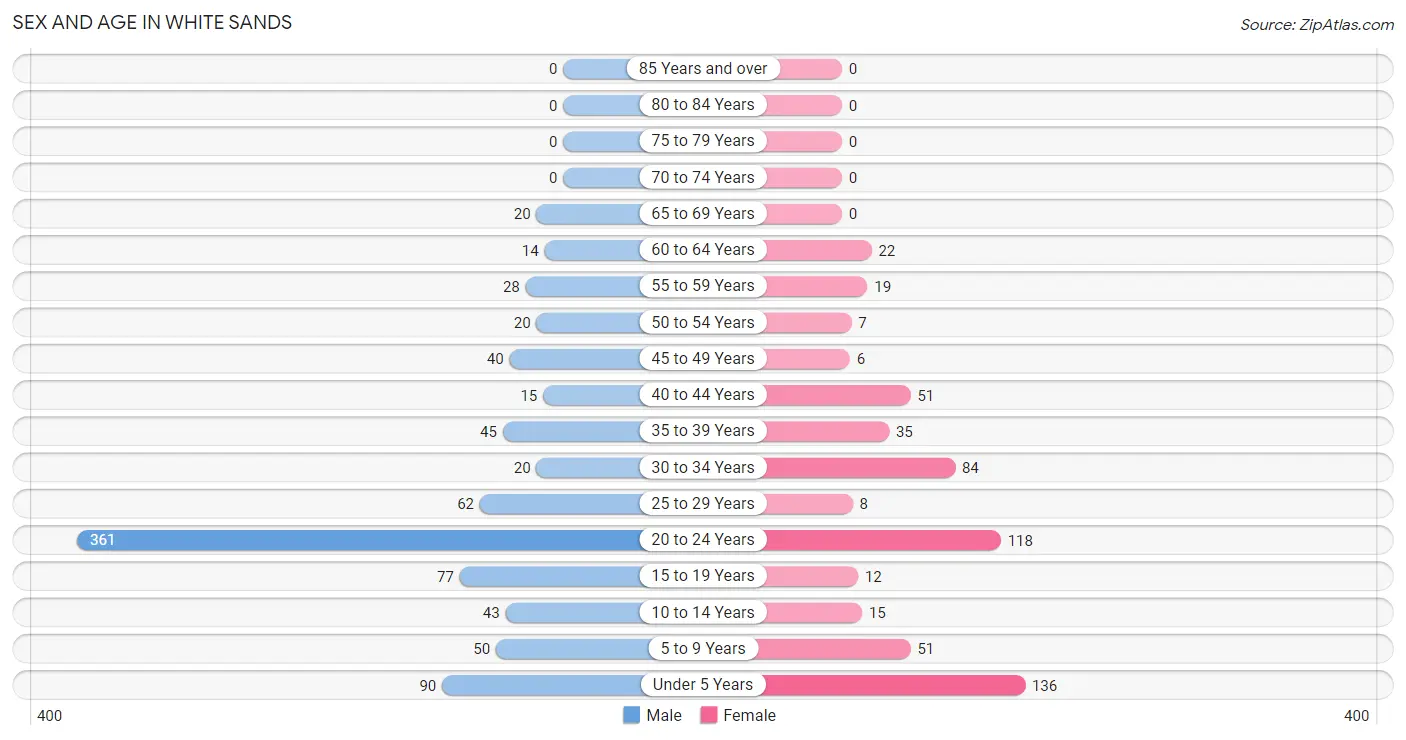
The most populous age groups in White Sands are 20 to 24 Years (361 | 40.8%) for men and Under 5 Years (136 | 24.1%) for women.
| Age Bracket | Male | Female |
| Under 5 Years | 90 (10.2%) | 136 (24.1%) |
| 5 to 9 Years | 50 (5.7%) | 51 (9.0%) |
| 10 to 14 Years | 43 (4.9%) | 15 (2.7%) |
| 15 to 19 Years | 77 (8.7%) | 12 (2.1%) |
| 20 to 24 Years | 361 (40.8%) | 118 (20.9%) |
| 25 to 29 Years | 62 (7.0%) | 8 (1.4%) |
| 30 to 34 Years | 20 (2.3%) | 84 (14.9%) |
| 35 to 39 Years | 45 (5.1%) | 35 (6.2%) |
| 40 to 44 Years | 15 (1.7%) | 51 (9.0%) |
| 45 to 49 Years | 40 (4.5%) | 6 (1.1%) |
| 50 to 54 Years | 20 (2.3%) | 7 (1.2%) |
| 55 to 59 Years | 28 (3.2%) | 19 (3.4%) |
| 60 to 64 Years | 14 (1.6%) | 22 (3.9%) |
| 65 to 69 Years | 20 (2.3%) | 0 (0.0%) |
| 70 to 74 Years | 0 (0.0%) | 0 (0.0%) |
| 75 to 79 Years | 0 (0.0%) | 0 (0.0%) |
| 80 to 84 Years | 0 (0.0%) | 0 (0.0%) |
| 85 Years and over | 0 (0.0%) | 0 (0.0%) |
| Total | 885 (100.0%) | 564 (100.0%) |
Families and Households in White Sands
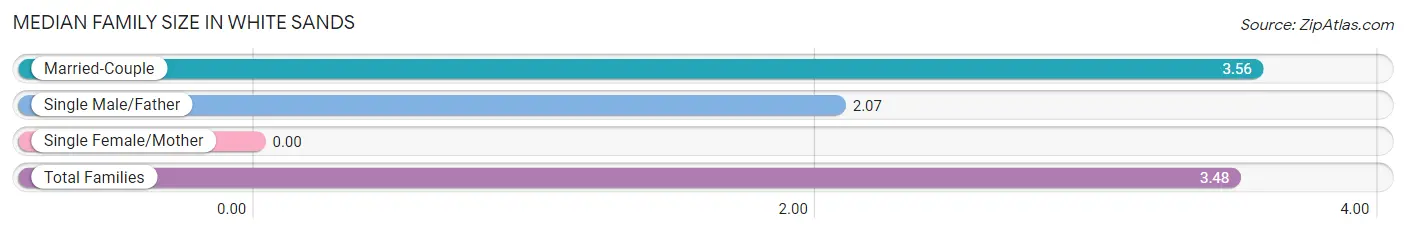
Median Family Size in White Sands
| Family Type | # Families | Family Size |
| Married-Couple | 249 (94.7%) | 3.56 |
| Single Male/Father | 14 (5.3%) | 2.07 |
| Single Female/Mother | 0 (0.0%) | - |
| Total Families | 263 (100.0%) | 3.48 |
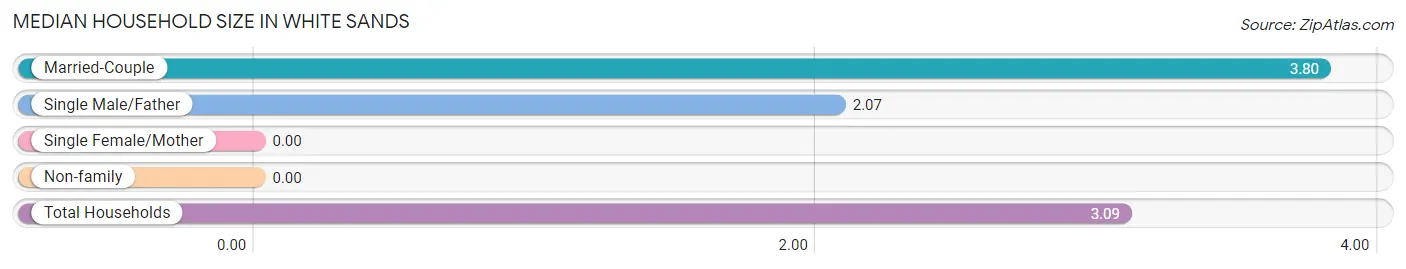
Median Household Size in White Sands
| Household Type | # Households | Household Size |
| Married-Couple | 249 (73.0%) | 3.80 |
| Single Male/Father | 14 (4.1%) | 2.07 |
| Single Female/Mother | 0 (0.0%) | - |
| Non-family | 78 (22.9%) | - |
| Total Households | 341 (100.0%) | 3.09 |
Household Size by Marriage Status in White Sands
Out of a total of 341 households in White Sands, 263 (77.1%) are family households, while 78 (22.9%) are nonfamily households. The most numerous type of family households are 2-person households, comprising 98, and the most common type of nonfamily households are 1-person households, comprising 78.
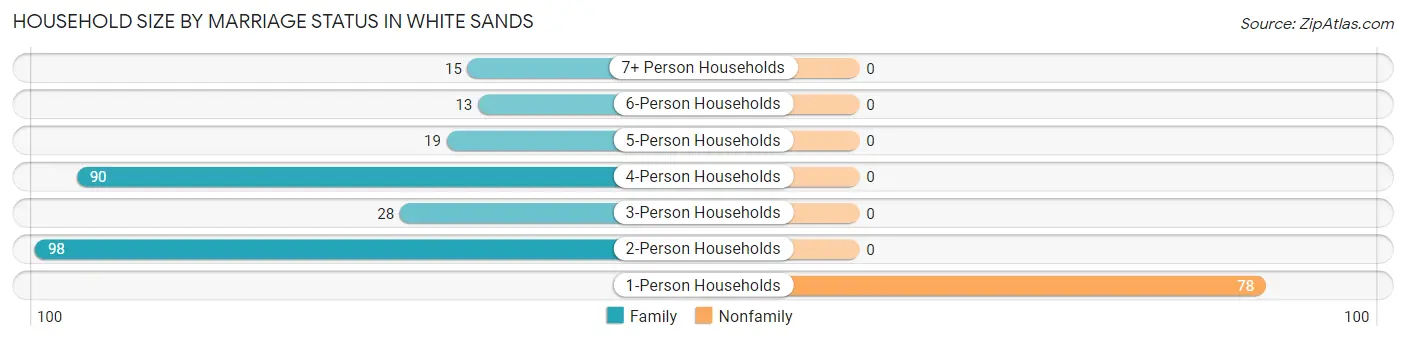
| Household Size | Family Households | Nonfamily Households |
| 1-Person Households | - | 78 (22.9%) |
| 2-Person Households | 98 (28.7%) | 0 (0.0%) |
| 3-Person Households | 28 (8.2%) | 0 (0.0%) |
| 4-Person Households | 90 (26.4%) | 0 (0.0%) |
| 5-Person Households | 19 (5.6%) | 0 (0.0%) |
| 6-Person Households | 13 (3.8%) | 0 (0.0%) |
| 7+ Person Households | 15 (4.4%) | 0 (0.0%) |
| Total | 263 (77.1%) | 78 (22.9%) |
Female Fertility in White Sands
Fertility by Age in White Sands
Average fertility rate in White Sands is 96.0 births per 1,000 women. Women in the age bracket of 20 to 34 years have the highest fertility rate with 143.0 births per 1,000 women. Women in the age bracket of 20 to 34 years acount for 100.0% of all women with births.
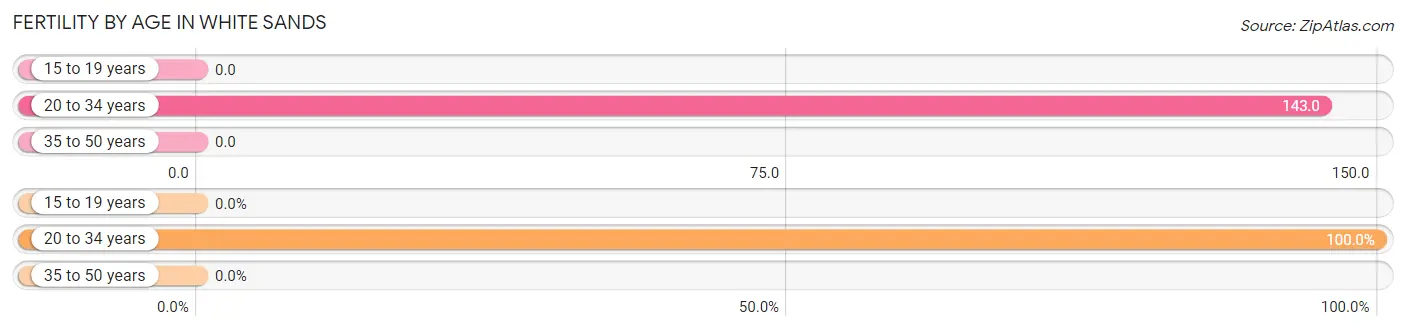
| Age Bracket | Women with Births | Births / 1,000 Women |
| 15 to 19 years | 0 (0.0%) | 0.0 |
| 20 to 34 years | 30 (100.0%) | 143.0 |
| 35 to 50 years | 0 (0.0%) | 0.0 |
| Total | 30 (100.0%) | 96.0 |
Fertility by Age by Marriage Status in White Sands
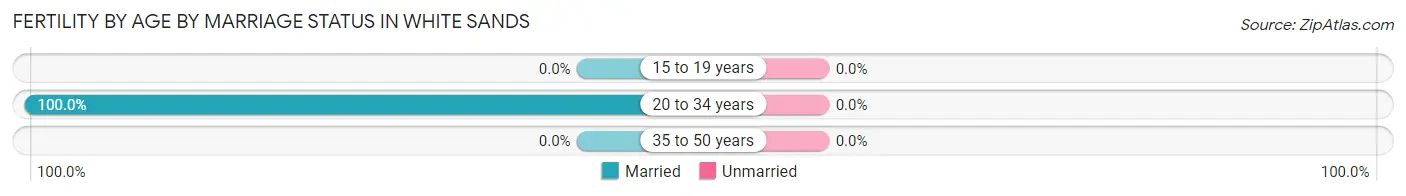
| Age Bracket | Married | Unmarried |
| 15 to 19 years | 0 (0.0%) | 0 (0.0%) |
| 20 to 34 years | 30 (100.0%) | 0 (0.0%) |
| 35 to 50 years | 0 (0.0%) | 0 (0.0%) |
| Total | 30 (100.0%) | 0 (0.0%) |
Fertility by Education in White Sands
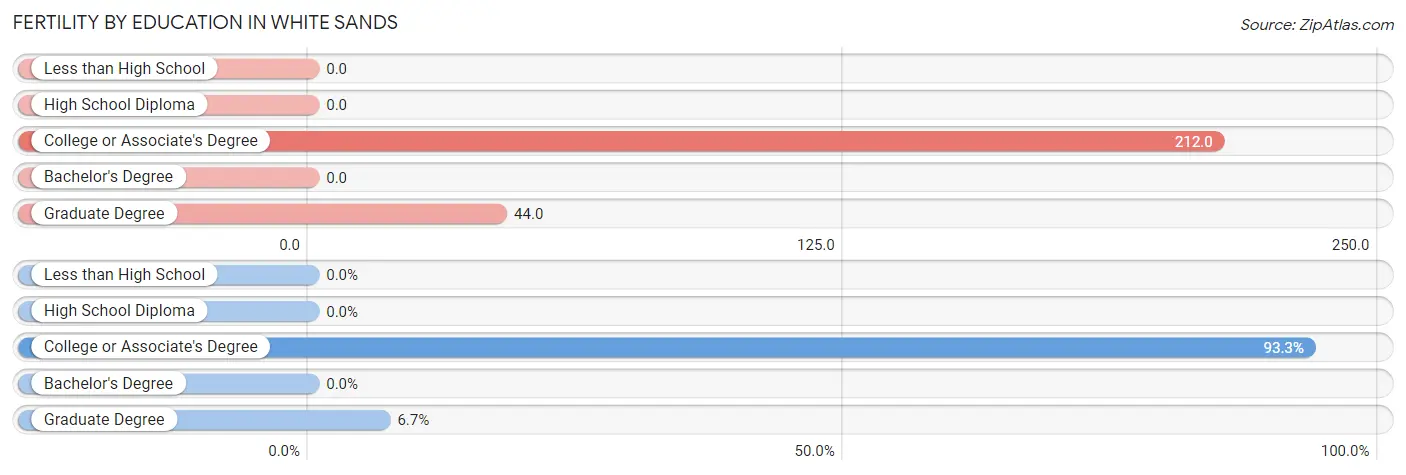
| Educational Attainment | Women with Births | Births / 1,000 Women |
| Less than High School | 0 (0.0%) | 0.0 |
| High School Diploma | 0 (0.0%) | 0.0 |
| College or Associate's Degree | 28 (93.3%) | 212.0 |
| Bachelor's Degree | 0 (0.0%) | 0.0 |
| Graduate Degree | 2 (6.7%) | 44.0 |
| Total | 30 (100.0%) | 96.0 |
Fertility by Education by Marriage Status in White Sands
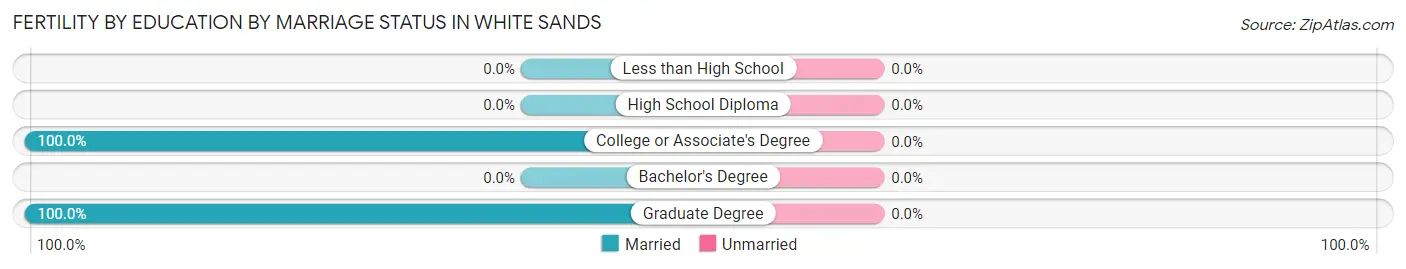
| Educational Attainment | Married | Unmarried |
| Less than High School | 0 (0.0%) | 0 (0.0%) |
| High School Diploma | 0 (0.0%) | 0 (0.0%) |
| College or Associate's Degree | 28 (100.0%) | 0 (0.0%) |
| Bachelor's Degree | 0 (0.0%) | 0 (0.0%) |
| Graduate Degree | 2 (100.0%) | 0 (0.0%) |
| Total | 30 (100.0%) | 0 (0.0%) |
Employment Characteristics in White Sands
Employment by Class of Employer in White Sands
Among the 894 employed individuals in White Sands, federal government employees (817 | 91.4%), private company employees (66 | 7.4%), and state government employees (7 | 0.8%) make up the most common classes of employment.
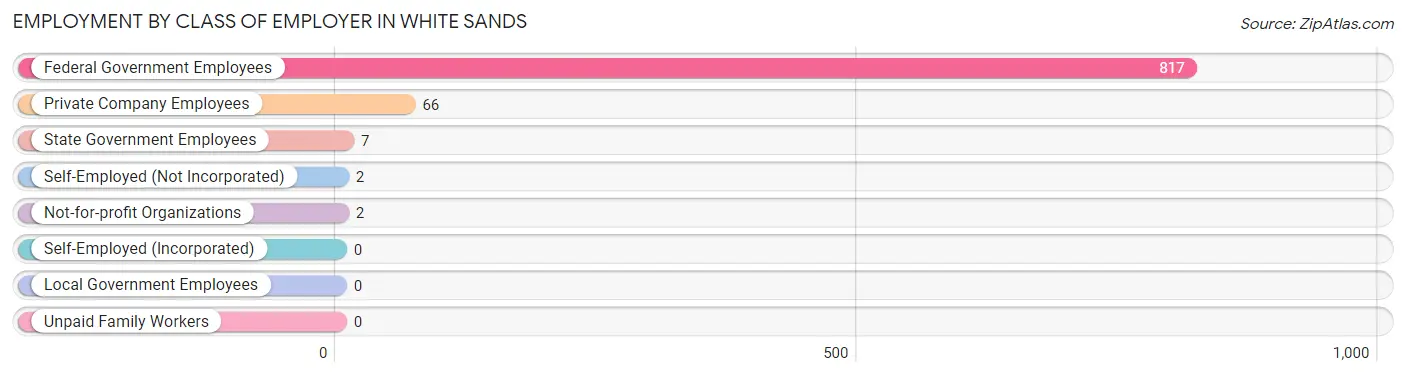
| Employer Class | # Employees | % Employees |
| Private Company Employees | 66 | 7.4% |
| Self-Employed (Incorporated) | 0 | 0.0% |
| Self-Employed (Not Incorporated) | 2 | 0.2% |
| Not-for-profit Organizations | 2 | 0.2% |
| Local Government Employees | 0 | 0.0% |
| State Government Employees | 7 | 0.8% |
| Federal Government Employees | 817 | 91.4% |
| Unpaid Family Workers | 0 | 0.0% |
| Total | 894 | 100.0% |
Employment Status by Age in White Sands
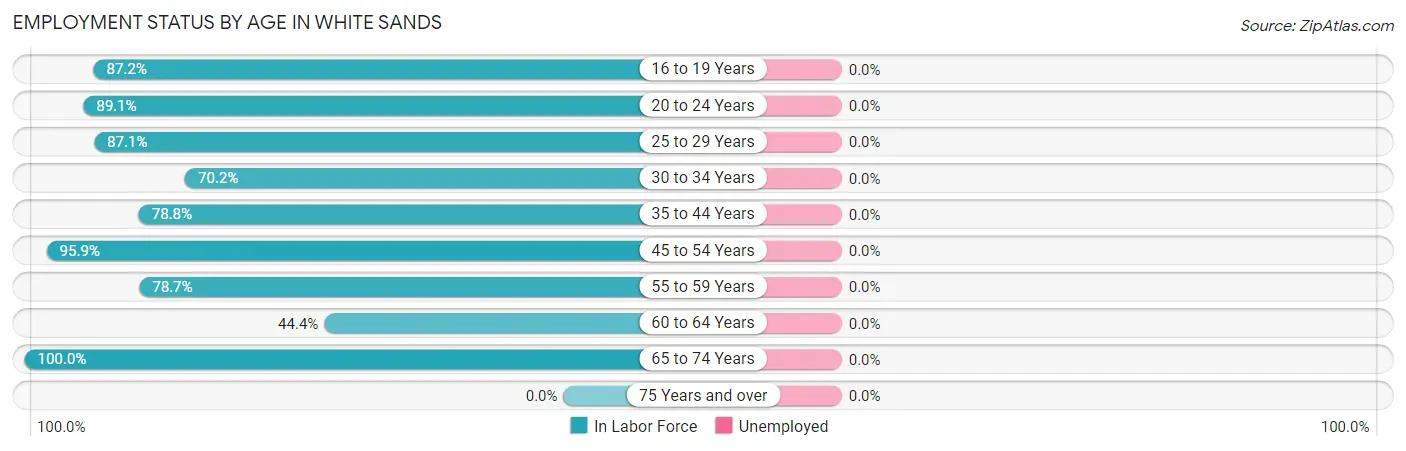
| Age Bracket | In Labor Force | Unemployed |
| 16 to 19 Years | 75 (87.2%) | 0 (0.0%) |
| 20 to 24 Years | 427 (89.1%) | 0 (0.0%) |
| 25 to 29 Years | 61 (87.1%) | 0 (0.0%) |
| 30 to 34 Years | 73 (70.2%) | 0 (0.0%) |
| 35 to 44 Years | 115 (78.8%) | 0 (0.0%) |
| 45 to 54 Years | 70 (95.9%) | 0 (0.0%) |
| 55 to 59 Years | 37 (78.7%) | 0 (0.0%) |
| 60 to 64 Years | 16 (44.4%) | 0 (0.0%) |
| 65 to 74 Years | 20 (100.0%) | 0 (0.0%) |
| 75 Years and over | 0 (0.0%) | 0 (0.0%) |
| Total | 894 (84.3%) | 0 (0.0%) |
Employment Status by Educational Attainment in White Sands
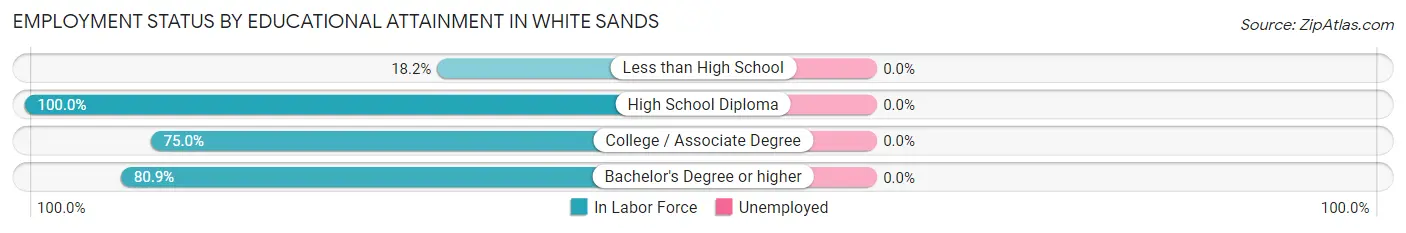
| Educational Attainment | In Labor Force | Unemployed |
| Less than High School | 2 (18.2%) | 0 (0.0%) |
| High School Diploma | 37 (100.0%) | 0 (0.0%) |
| College / Associate Degree | 168 (75.0%) | 0 (0.0%) |
| Bachelor's Degree or higher | 165 (80.9%) | 0 (0.0%) |
| Total | 372 (78.2%) | 0 (0.0%) |
Employment Occupations by Sex in White Sands
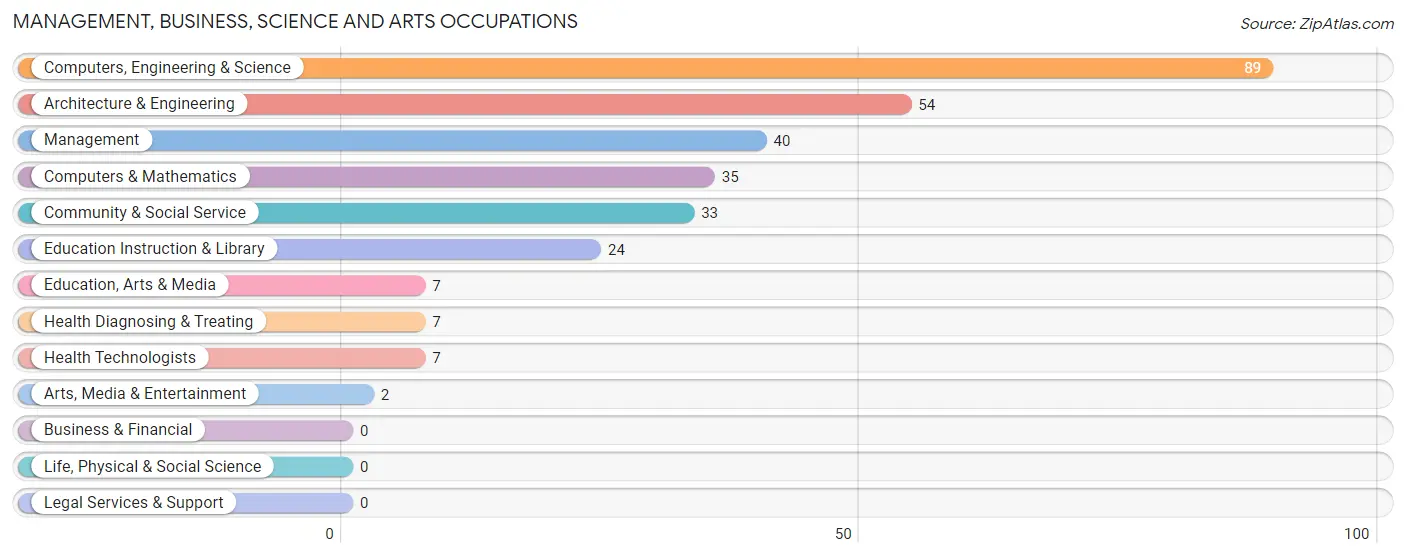
Management, Business, Science and Arts Occupations
The most common Management, Business, Science and Arts occupations in White Sands are Computers, Engineering & Science (89 | 26.8%), Architecture & Engineering (54 | 16.3%), Management (40 | 12.0%), Computers & Mathematics (35 | 10.5%), and Community & Social Service (33 | 9.9%).
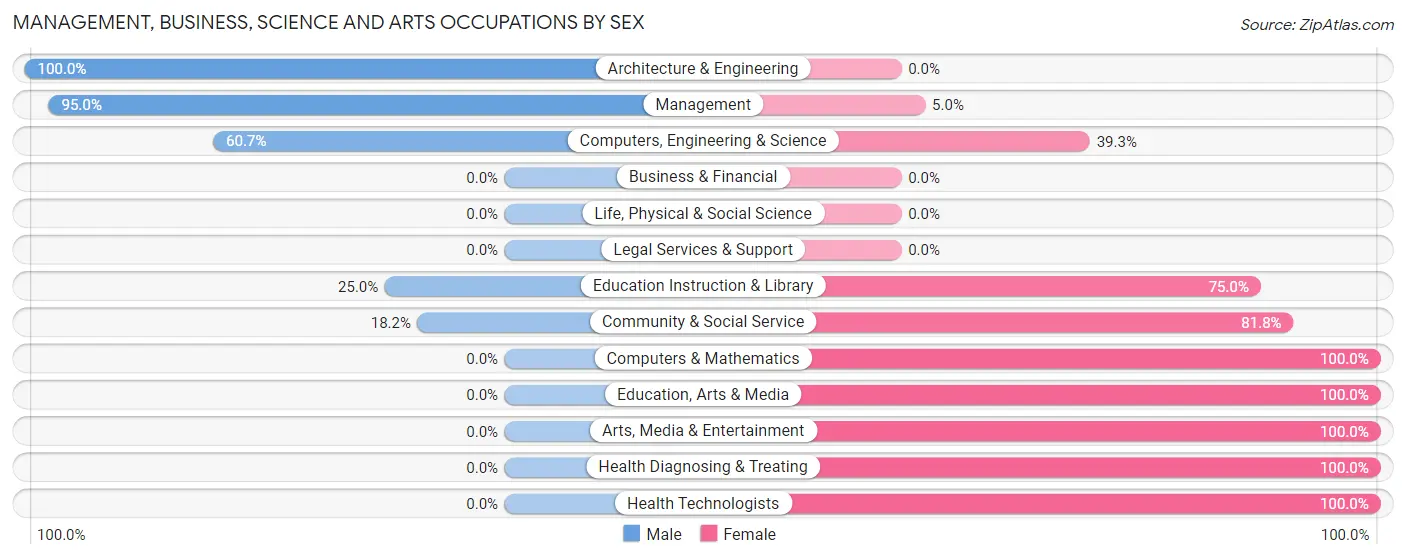
Management, Business, Science and Arts Occupations by Sex
Within the Management, Business, Science and Arts occupations in White Sands, the most male-oriented occupations are Architecture & Engineering (100.0%), Management (95.0%), and Computers, Engineering & Science (60.7%), while the most female-oriented occupations are Computers & Mathematics (100.0%), Education, Arts & Media (100.0%), and Arts, Media & Entertainment (100.0%).
| Occupation | Male | Female |
| Management | 38 (95.0%) | 2 (5.0%) |
| Business & Financial | 0 (0.0%) | 0 (0.0%) |
| Computers, Engineering & Science | 54 (60.7%) | 35 (39.3%) |
| Computers & Mathematics | 0 (0.0%) | 35 (100.0%) |
| Architecture & Engineering | 54 (100.0%) | 0 (0.0%) |
| Life, Physical & Social Science | 0 (0.0%) | 0 (0.0%) |
| Community & Social Service | 6 (18.2%) | 27 (81.8%) |
| Education, Arts & Media | 0 (0.0%) | 7 (100.0%) |
| Legal Services & Support | 0 (0.0%) | 0 (0.0%) |
| Education Instruction & Library | 6 (25.0%) | 18 (75.0%) |
| Arts, Media & Entertainment | 0 (0.0%) | 2 (100.0%) |
| Health Diagnosing & Treating | 0 (0.0%) | 7 (100.0%) |
| Health Technologists | 0 (0.0%) | 7 (100.0%) |
| Total (Category) | 98 (58.0%) | 71 (42.0%) |
| Total (Overall) | 160 (48.2%) | 172 (51.8%) |
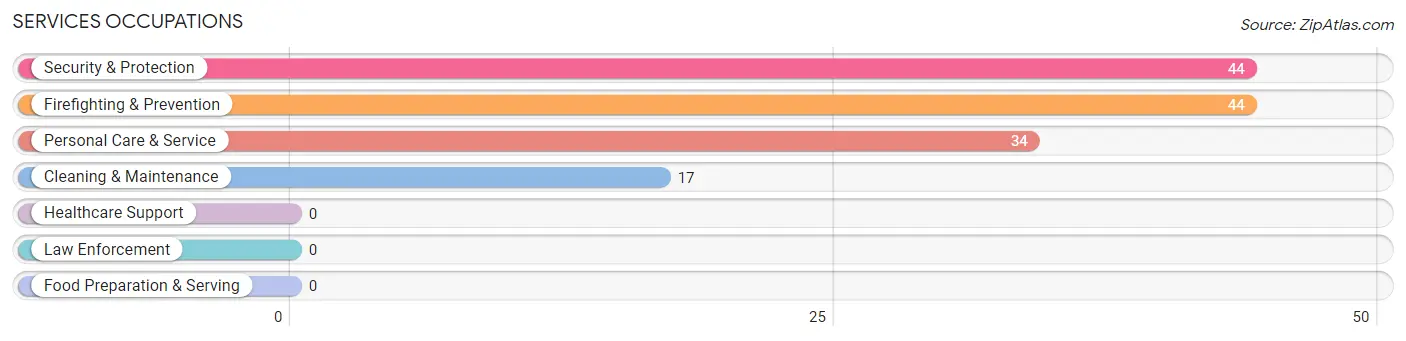
Services Occupations
The most common Services occupations in White Sands are Security & Protection (44 | 13.3%), Firefighting & Prevention (44 | 13.3%), Personal Care & Service (34 | 10.2%), and Cleaning & Maintenance (17 | 5.1%).
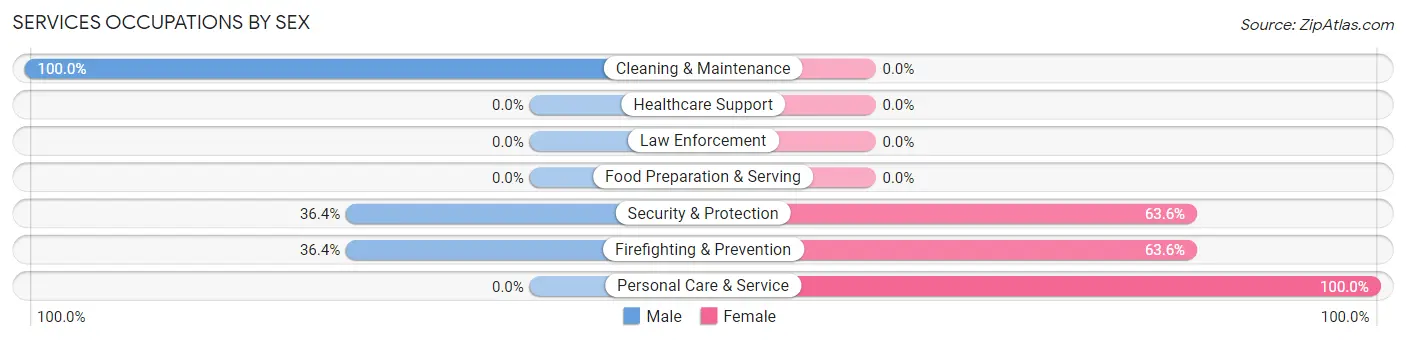
Services Occupations by Sex
Within the Services occupations in White Sands, the most male-oriented occupations are Cleaning & Maintenance (100.0%), Security & Protection (36.4%), and Firefighting & Prevention (36.4%), while the most female-oriented occupations are Personal Care & Service (100.0%), Security & Protection (63.6%), and Firefighting & Prevention (63.6%).
| Occupation | Male | Female |
| Healthcare Support | 0 (0.0%) | 0 (0.0%) |
| Security & Protection | 16 (36.4%) | 28 (63.6%) |
| Firefighting & Prevention | 16 (36.4%) | 28 (63.6%) |
| Law Enforcement | 0 (0.0%) | 0 (0.0%) |
| Food Preparation & Serving | 0 (0.0%) | 0 (0.0%) |
| Cleaning & Maintenance | 17 (100.0%) | 0 (0.0%) |
| Personal Care & Service | 0 (0.0%) | 34 (100.0%) |
| Total (Category) | 33 (34.7%) | 62 (65.3%) |
| Total (Overall) | 160 (48.2%) | 172 (51.8%) |
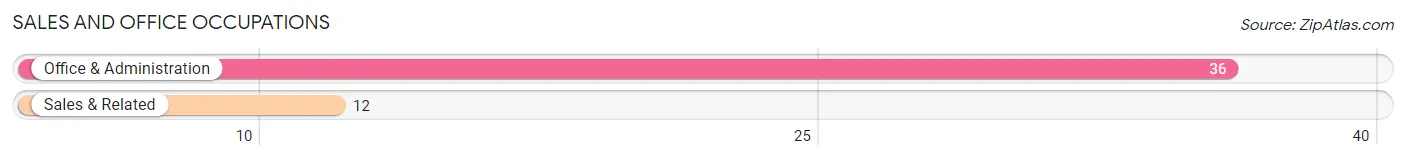
Sales and Office Occupations
The most common Sales and Office occupations in White Sands are Office & Administration (36 | 10.8%), and Sales & Related (12 | 3.6%).
Sales and Office Occupations by Sex
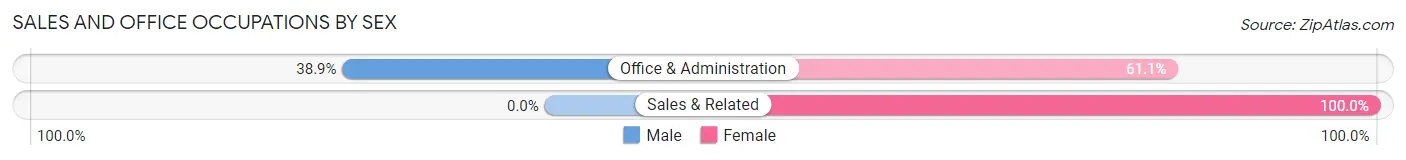
| Occupation | Male | Female |
| Sales & Related | 0 (0.0%) | 12 (100.0%) |
| Office & Administration | 14 (38.9%) | 22 (61.1%) |
| Total (Category) | 14 (29.2%) | 34 (70.8%) |
| Total (Overall) | 160 (48.2%) | 172 (51.8%) |
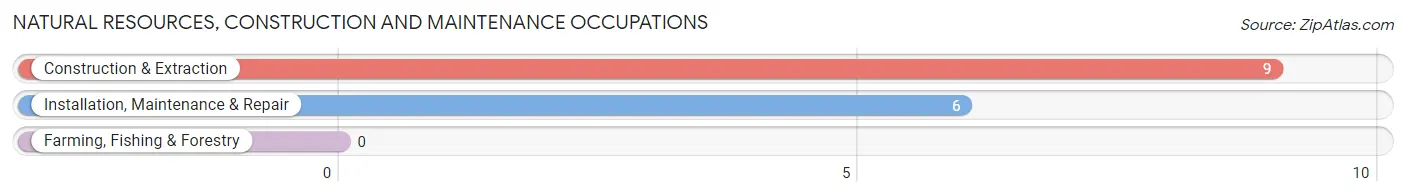
Natural Resources, Construction and Maintenance Occupations
The most common Natural Resources, Construction and Maintenance occupations in White Sands are Construction & Extraction (9 | 2.7%), and Installation, Maintenance & Repair (6 | 1.8%).
Natural Resources, Construction and Maintenance Occupations by Sex
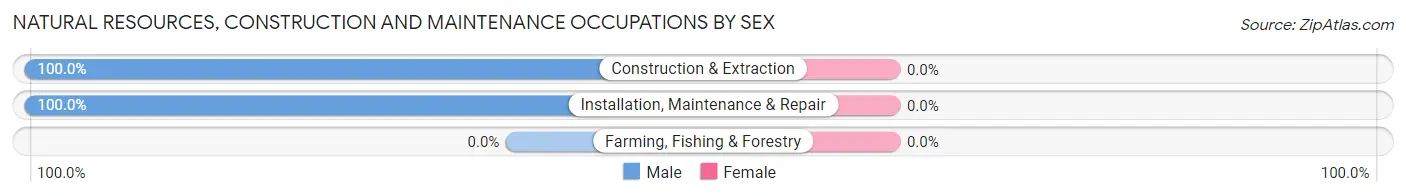
| Occupation | Male | Female |
| Farming, Fishing & Forestry | 0 (0.0%) | 0 (0.0%) |
| Construction & Extraction | 9 (100.0%) | 0 (0.0%) |
| Installation, Maintenance & Repair | 6 (100.0%) | 0 (0.0%) |
| Total (Category) | 15 (100.0%) | 0 (0.0%) |
| Total (Overall) | 160 (48.2%) | 172 (51.8%) |
Production, Transportation and Moving Occupations
The most common Production, Transportation and Moving occupations in White Sands are , and Transportation (5 | 1.5%).
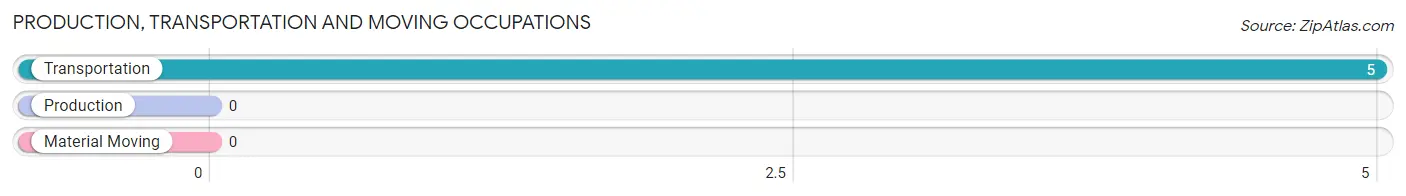
Production, Transportation and Moving Occupations by Sex
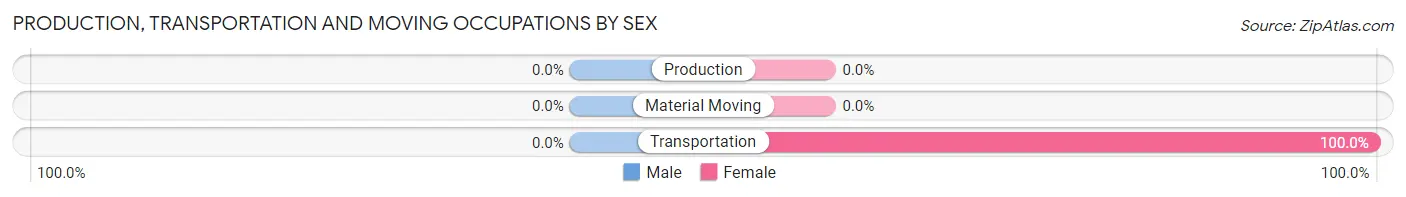
| Occupation | Male | Female |
| Production | 0 (0.0%) | 0 (0.0%) |
| Transportation | 0 (0.0%) | 5 (100.0%) |
| Material Moving | 0 (0.0%) | 0 (0.0%) |
| Total (Category) | 0 (0.0%) | 5 (100.0%) |
| Total (Overall) | 160 (48.2%) | 172 (51.8%) |
Employment Industries by Sex in White Sands
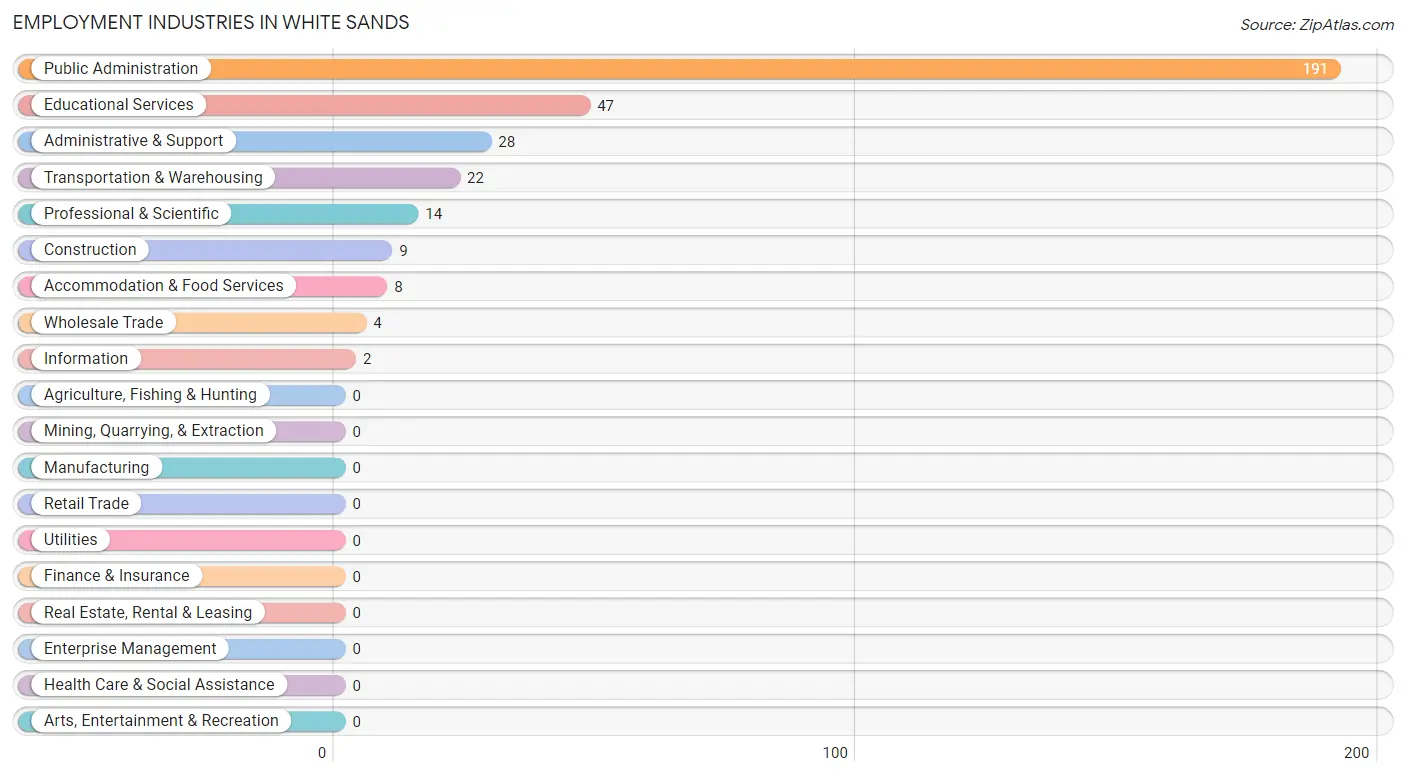
Employment Industries in White Sands
The major employment industries in White Sands include Public Administration (191 | 57.5%), Educational Services (47 | 14.2%), Administrative & Support (28 | 8.4%), Transportation & Warehousing (22 | 6.6%), and Professional & Scientific (14 | 4.2%).
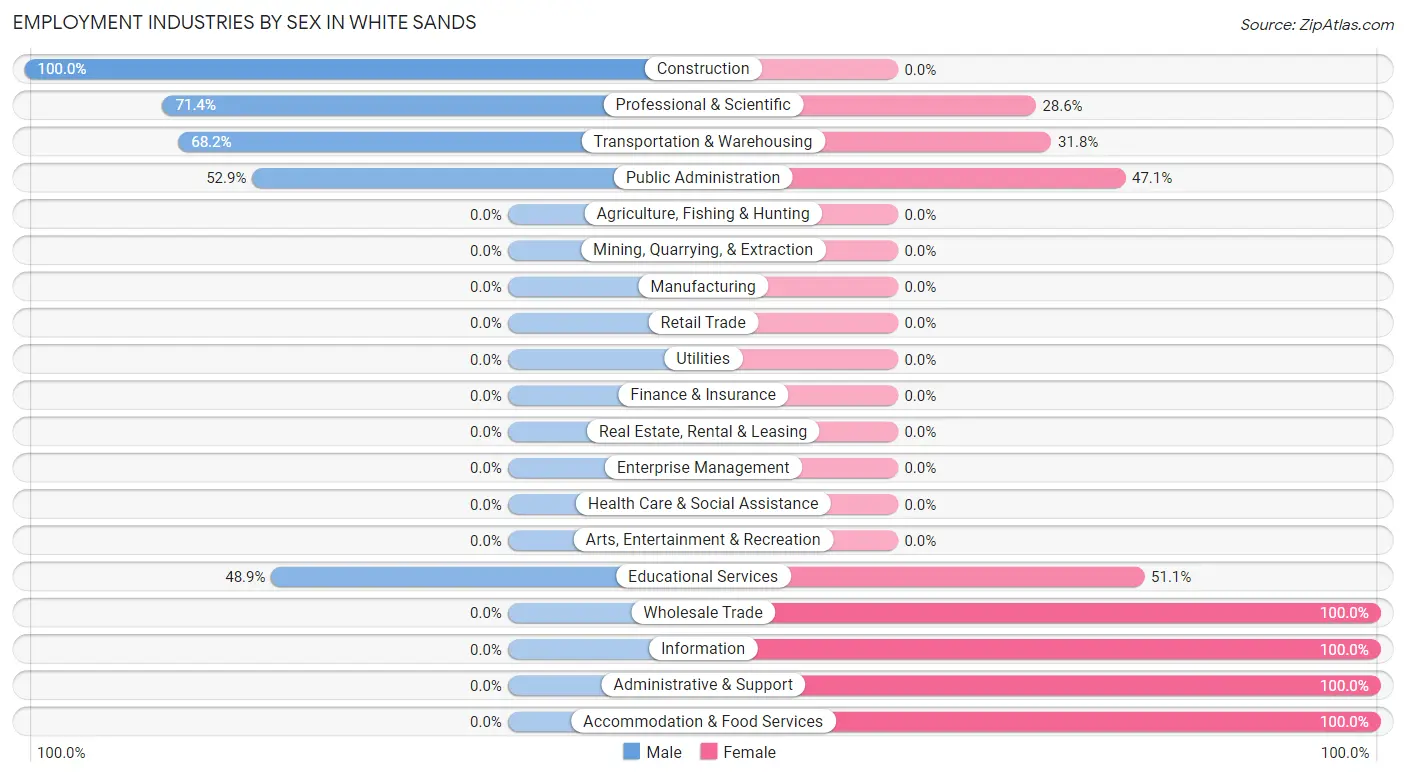
Employment Industries by Sex in White Sands
The White Sands industries that see more men than women are Construction (100.0%), Professional & Scientific (71.4%), and Transportation & Warehousing (68.2%), whereas the industries that tend to have a higher number of women are Wholesale Trade (100.0%), Information (100.0%), and Administrative & Support (100.0%).
| Industry | Male | Female |
| Agriculture, Fishing & Hunting | 0 (0.0%) | 0 (0.0%) |
| Mining, Quarrying, & Extraction | 0 (0.0%) | 0 (0.0%) |
| Construction | 9 (100.0%) | 0 (0.0%) |
| Manufacturing | 0 (0.0%) | 0 (0.0%) |
| Wholesale Trade | 0 (0.0%) | 4 (100.0%) |
| Retail Trade | 0 (0.0%) | 0 (0.0%) |
| Transportation & Warehousing | 15 (68.2%) | 7 (31.8%) |
| Utilities | 0 (0.0%) | 0 (0.0%) |
| Information | 0 (0.0%) | 2 (100.0%) |
| Finance & Insurance | 0 (0.0%) | 0 (0.0%) |
| Real Estate, Rental & Leasing | 0 (0.0%) | 0 (0.0%) |
| Professional & Scientific | 10 (71.4%) | 4 (28.6%) |
| Enterprise Management | 0 (0.0%) | 0 (0.0%) |
| Administrative & Support | 0 (0.0%) | 28 (100.0%) |
| Educational Services | 23 (48.9%) | 24 (51.1%) |
| Health Care & Social Assistance | 0 (0.0%) | 0 (0.0%) |
| Arts, Entertainment & Recreation | 0 (0.0%) | 0 (0.0%) |
| Accommodation & Food Services | 0 (0.0%) | 8 (100.0%) |
| Public Administration | 101 (52.9%) | 90 (47.1%) |
| Total | 160 (48.2%) | 172 (51.8%) |
Education in White Sands
School Enrollment in White Sands
The most common levels of schooling among the 315 students in White Sands are elementary school (85 | 27.0%), nursery / preschool (79 | 25.1%), and high school (38 | 12.1%).
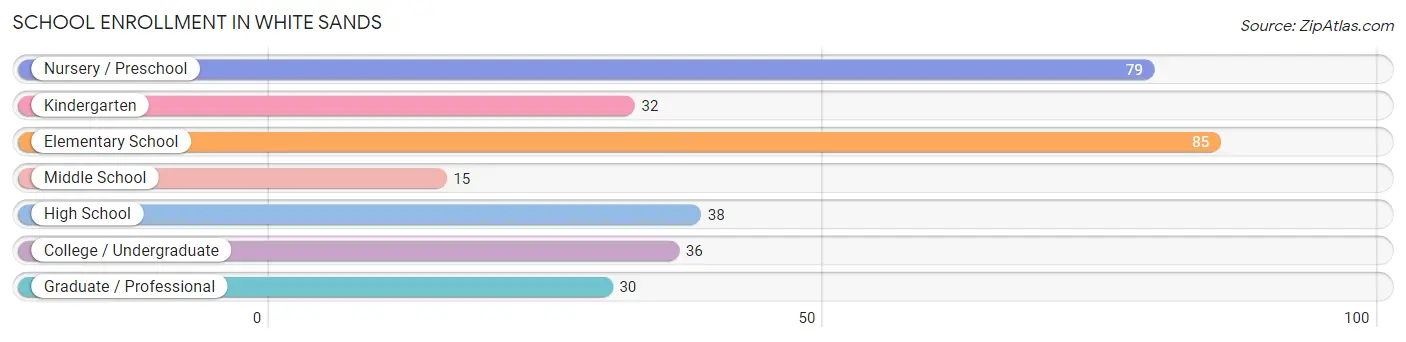
| School Level | # Students | % Students |
| Nursery / Preschool | 79 | 25.1% |
| Kindergarten | 32 | 10.2% |
| Elementary School | 85 | 27.0% |
| Middle School | 15 | 4.8% |
| High School | 38 | 12.1% |
| College / Undergraduate | 36 | 11.4% |
| Graduate / Professional | 30 | 9.5% |
| Total | 315 | 100.0% |
School Enrollment by Age by Funding Source in White Sands
Out of a total of 315 students who are enrolled in schools in White Sands, 100 (31.7%) attend a private institution, while the remaining 215 (68.3%) are enrolled in public schools. The age group of 15 to 17 year olds has the highest likelihood of being enrolled in private schools, with 11 (78.6% in the age bracket) enrolled. Conversely, the age group of 3 to 4 year olds has the lowest likelihood of being enrolled in a private school, with 76 (100.0% in the age bracket) attending a public institution.
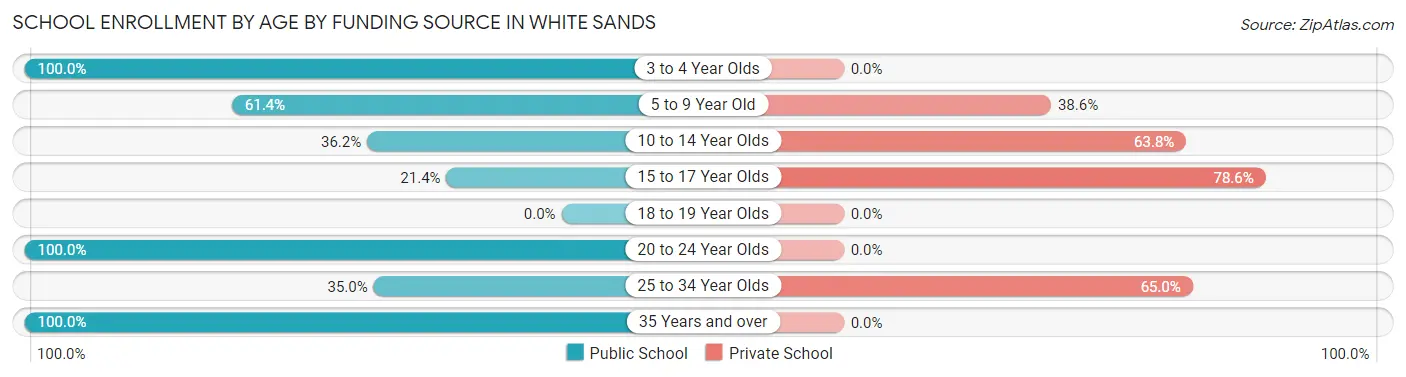
| Age Bracket | Public School | Private School |
| 3 to 4 Year Olds | 76 (100.0%) | 0 (0.0%) |
| 5 to 9 Year Old | 62 (61.4%) | 39 (38.6%) |
| 10 to 14 Year Olds | 21 (36.2%) | 37 (63.8%) |
| 15 to 17 Year Olds | 3 (21.4%) | 11 (78.6%) |
| 18 to 19 Year Olds | 0 (0.0%) | 0 (0.0%) |
| 20 to 24 Year Olds | 27 (100.0%) | 0 (0.0%) |
| 25 to 34 Year Olds | 7 (35.0%) | 13 (65.0%) |
| 35 Years and over | 19 (100.0%) | 0 (0.0%) |
| Total | 215 (68.3%) | 100 (31.7%) |
Educational Attainment by Field of Study in White Sands
Engineering (45 | 20.1%), business (45 | 20.1%), social sciences (26 | 11.6%), science & technology (26 | 11.6%), and education (21 | 9.4%) are the most common fields of study among 224 individuals in White Sands who have obtained a bachelor's degree or higher.
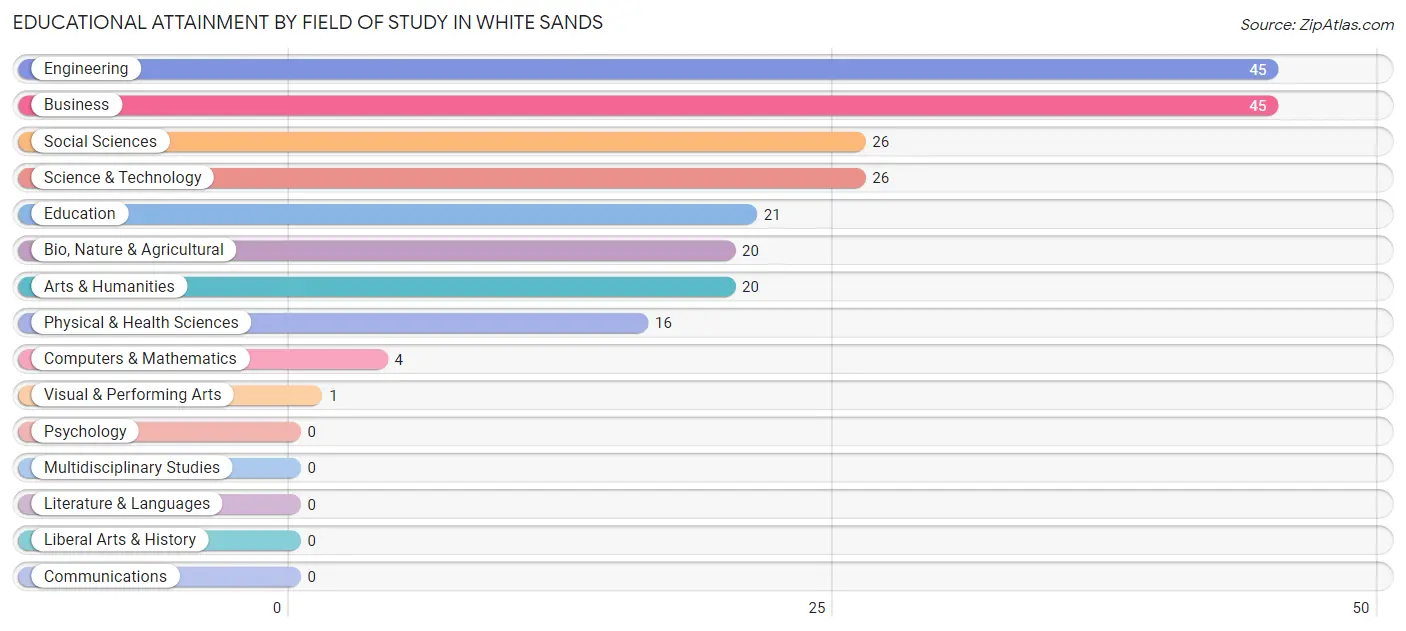
| Field of Study | # Graduates | % Graduates |
| Computers & Mathematics | 4 | 1.8% |
| Bio, Nature & Agricultural | 20 | 8.9% |
| Physical & Health Sciences | 16 | 7.1% |
| Psychology | 0 | 0.0% |
| Social Sciences | 26 | 11.6% |
| Engineering | 45 | 20.1% |
| Multidisciplinary Studies | 0 | 0.0% |
| Science & Technology | 26 | 11.6% |
| Business | 45 | 20.1% |
| Education | 21 | 9.4% |
| Literature & Languages | 0 | 0.0% |
| Liberal Arts & History | 0 | 0.0% |
| Visual & Performing Arts | 1 | 0.4% |
| Communications | 0 | 0.0% |
| Arts & Humanities | 20 | 8.9% |
| Total | 224 | 100.0% |
Transportation & Commute in White Sands
Vehicle Availability by Sex in White Sands
The most prevalent vehicle ownership categories in White Sands are males with 2 vehicles (187, accounting for 62.5%) and females with 2 vehicles (97, making up 92.1%).
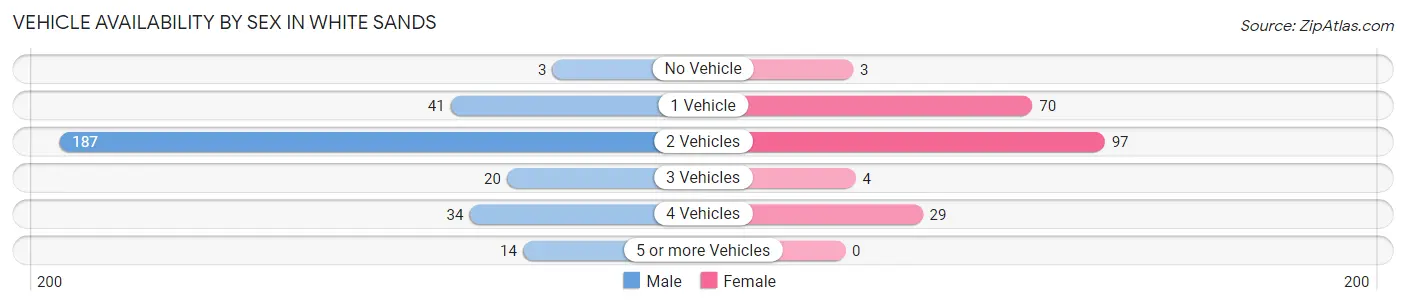
| Vehicles Available | Male | Female |
| No Vehicle | 3 (1.0%) | 3 (1.5%) |
| 1 Vehicle | 41 (13.7%) | 70 (34.5%) |
| 2 Vehicles | 187 (62.5%) | 97 (47.8%) |
| 3 Vehicles | 20 (6.7%) | 4 (2.0%) |
| 4 Vehicles | 34 (11.4%) | 29 (14.3%) |
| 5 or more Vehicles | 14 (4.7%) | 0 (0.0%) |
| Total | 299 (100.0%) | 203 (100.0%) |
Commute Time in White Sands
The most frequently occuring commute durations in White Sands are 5 to 9 minutes (479 commuters, 55.5%), 10 to 14 minutes (143 commuters, 16.6%), and less than 5 minutes (134 commuters, 15.5%).
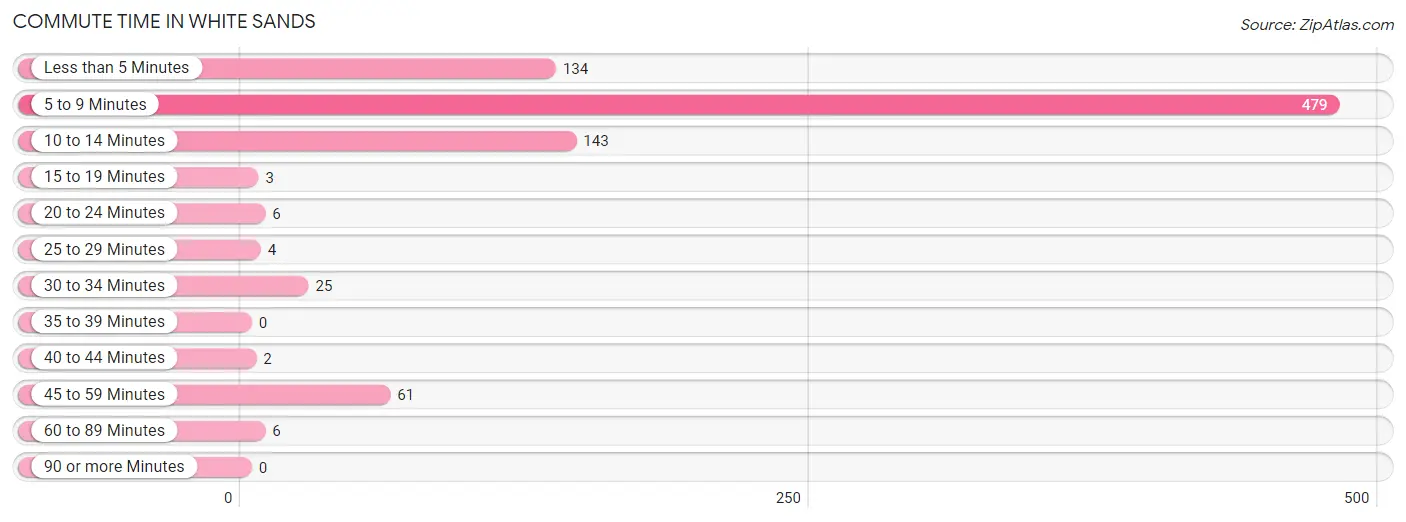
| Commute Time | # Commuters | % Commuters |
| Less than 5 Minutes | 134 | 15.5% |
| 5 to 9 Minutes | 479 | 55.5% |
| 10 to 14 Minutes | 143 | 16.6% |
| 15 to 19 Minutes | 3 | 0.4% |
| 20 to 24 Minutes | 6 | 0.7% |
| 25 to 29 Minutes | 4 | 0.5% |
| 30 to 34 Minutes | 25 | 2.9% |
| 35 to 39 Minutes | 0 | 0.0% |
| 40 to 44 Minutes | 2 | 0.2% |
| 45 to 59 Minutes | 61 | 7.1% |
| 60 to 89 Minutes | 6 | 0.7% |
| 90 or more Minutes | 0 | 0.0% |
Commute Time by Sex in White Sands
The most common commute times in White Sands are 5 to 9 minutes (349 commuters, 54.9%) for males and 5 to 9 minutes (130 commuters, 57.3%) for females.
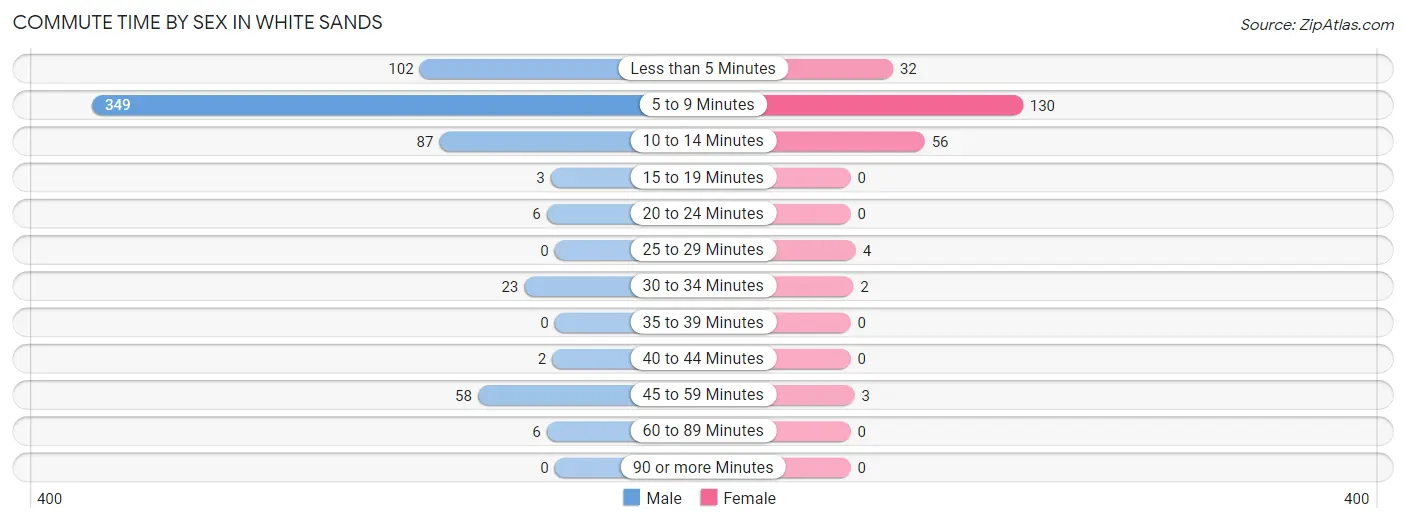
| Commute Time | Male | Female |
| Less than 5 Minutes | 102 (16.0%) | 32 (14.1%) |
| 5 to 9 Minutes | 349 (54.9%) | 130 (57.3%) |
| 10 to 14 Minutes | 87 (13.7%) | 56 (24.7%) |
| 15 to 19 Minutes | 3 (0.5%) | 0 (0.0%) |
| 20 to 24 Minutes | 6 (0.9%) | 0 (0.0%) |
| 25 to 29 Minutes | 0 (0.0%) | 4 (1.8%) |
| 30 to 34 Minutes | 23 (3.6%) | 2 (0.9%) |
| 35 to 39 Minutes | 0 (0.0%) | 0 (0.0%) |
| 40 to 44 Minutes | 2 (0.3%) | 0 (0.0%) |
| 45 to 59 Minutes | 58 (9.1%) | 3 (1.3%) |
| 60 to 89 Minutes | 6 (0.9%) | 0 (0.0%) |
| 90 or more Minutes | 0 (0.0%) | 0 (0.0%) |
Time of Departure to Work by Sex in White Sands
The most frequent times of departure to work in White Sands are 6:30 AM to 6:59 AM (142, 22.3%) for males and 6:30 AM to 6:59 AM (107, 47.1%) for females.
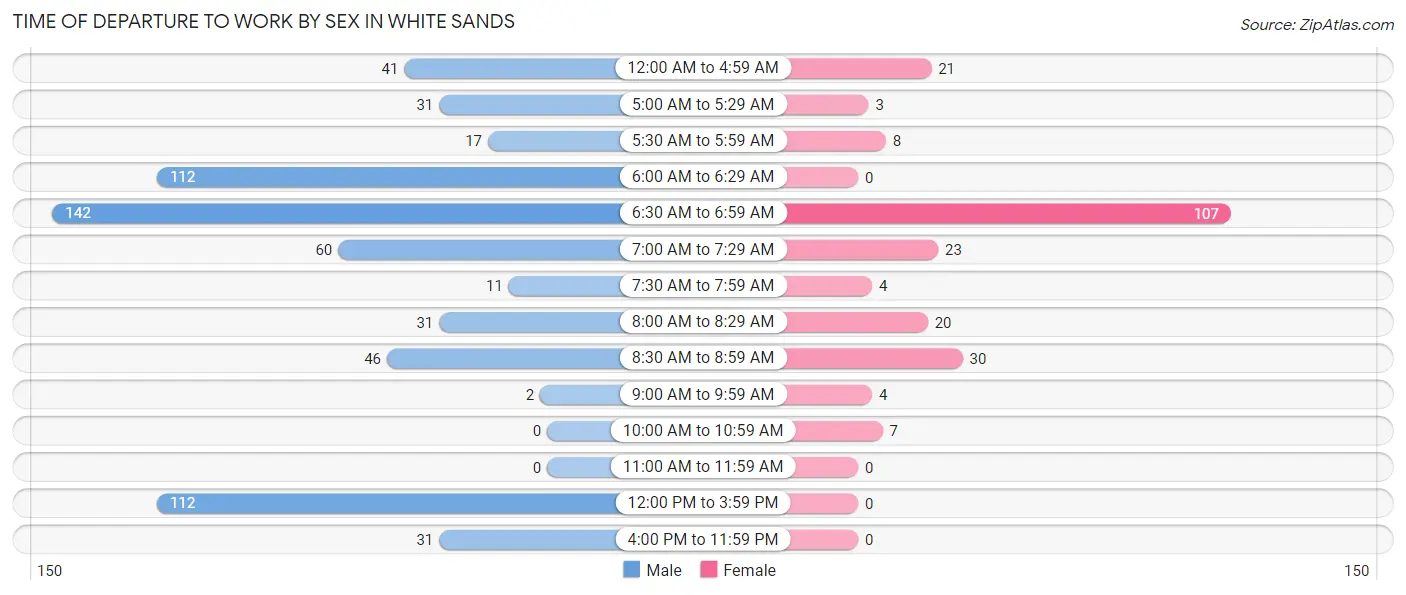
| Time of Departure | Male | Female |
| 12:00 AM to 4:59 AM | 41 (6.5%) | 21 (9.2%) |
| 5:00 AM to 5:29 AM | 31 (4.9%) | 3 (1.3%) |
| 5:30 AM to 5:59 AM | 17 (2.7%) | 8 (3.5%) |
| 6:00 AM to 6:29 AM | 112 (17.6%) | 0 (0.0%) |
| 6:30 AM to 6:59 AM | 142 (22.3%) | 107 (47.1%) |
| 7:00 AM to 7:29 AM | 60 (9.4%) | 23 (10.1%) |
| 7:30 AM to 7:59 AM | 11 (1.7%) | 4 (1.8%) |
| 8:00 AM to 8:29 AM | 31 (4.9%) | 20 (8.8%) |
| 8:30 AM to 8:59 AM | 46 (7.2%) | 30 (13.2%) |
| 9:00 AM to 9:59 AM | 2 (0.3%) | 4 (1.8%) |
| 10:00 AM to 10:59 AM | 0 (0.0%) | 7 (3.1%) |
| 11:00 AM to 11:59 AM | 0 (0.0%) | 0 (0.0%) |
| 12:00 PM to 3:59 PM | 112 (17.6%) | 0 (0.0%) |
| 4:00 PM to 11:59 PM | 31 (4.9%) | 0 (0.0%) |
| Total | 636 (100.0%) | 227 (100.0%) |
Housing Occupancy in White Sands
Occupancy by Ownership in White Sands
Of the total 341 dwellings in White Sands, owner-occupied units account for 14 (4.1%), while renter-occupied units make up 327 (95.9%).
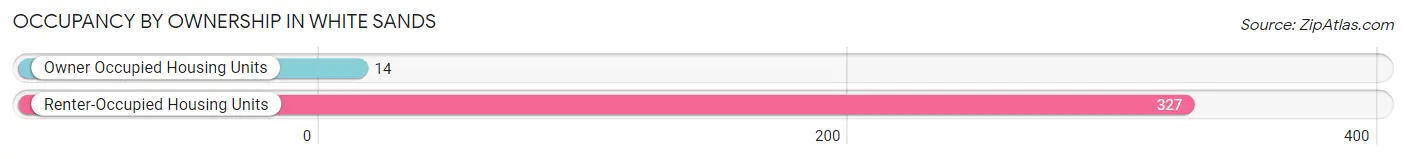
| Occupancy | # Housing Units | % Housing Units |
| Owner Occupied Housing Units | 14 | 4.1% |
| Renter-Occupied Housing Units | 327 | 95.9% |
| Total Occupied Housing Units | 341 | 100.0% |
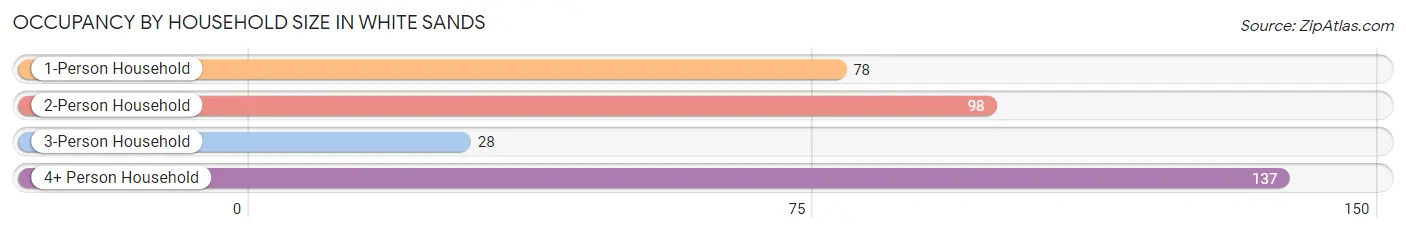
Occupancy by Household Size in White Sands
| Household Size | # Housing Units | % Housing Units |
| 1-Person Household | 78 | 22.9% |
| 2-Person Household | 98 | 28.7% |
| 3-Person Household | 28 | 8.2% |
| 4+ Person Household | 137 | 40.2% |
| Total Housing Units | 341 | 100.0% |
Occupancy by Ownership by Household Size in White Sands
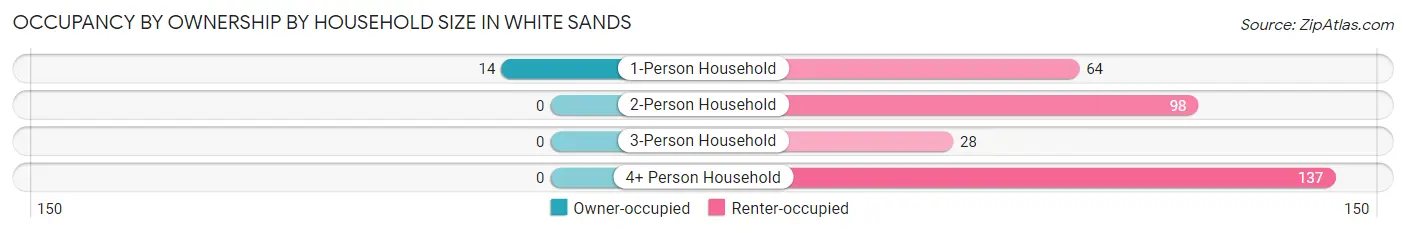
| Household Size | Owner-occupied | Renter-occupied |
| 1-Person Household | 14 (17.9%) | 64 (82.1%) |
| 2-Person Household | 0 (0.0%) | 98 (100.0%) |
| 3-Person Household | 0 (0.0%) | 28 (100.0%) |
| 4+ Person Household | 0 (0.0%) | 137 (100.0%) |
| Total Housing Units | 14 (4.1%) | 327 (95.9%) |
Occupancy by Educational Attainment in White Sands
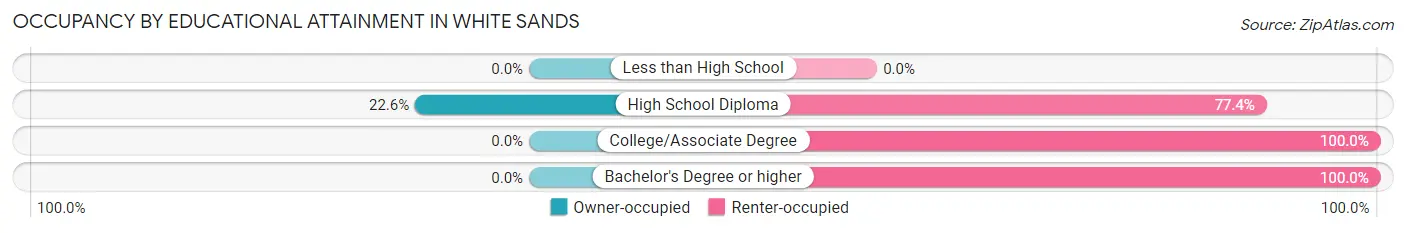
| Household Size | Owner-occupied | Renter-occupied |
| Less than High School | 0 (0.0%) | 0 (0.0%) |
| High School Diploma | 14 (22.6%) | 48 (77.4%) |
| College/Associate Degree | 0 (0.0%) | 137 (100.0%) |
| Bachelor's Degree or higher | 0 (0.0%) | 142 (100.0%) |
Occupancy by Age of Householder in White Sands
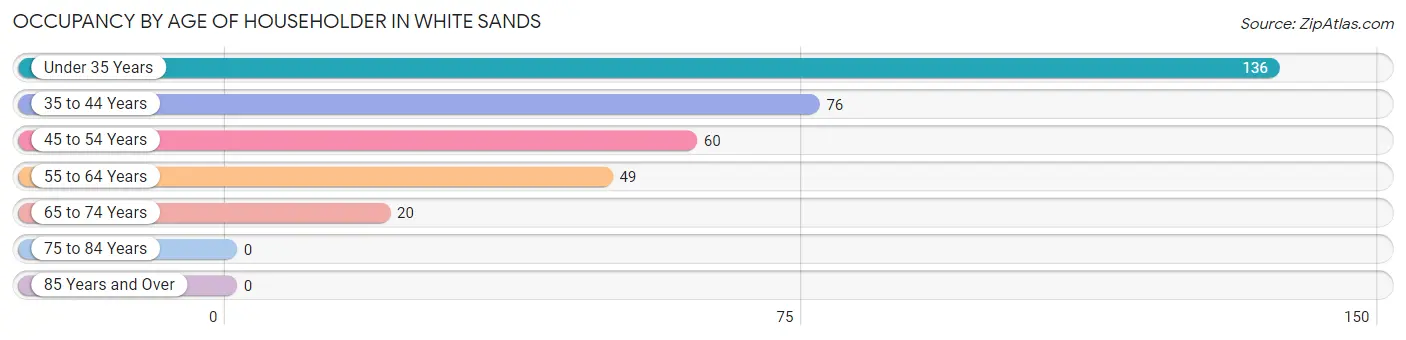
| Age Bracket | # Households | % Households |
| Under 35 Years | 136 | 39.9% |
| 35 to 44 Years | 76 | 22.3% |
| 45 to 54 Years | 60 | 17.6% |
| 55 to 64 Years | 49 | 14.4% |
| 65 to 74 Years | 20 | 5.9% |
| 75 to 84 Years | 0 | 0.0% |
| 85 Years and Over | 0 | 0.0% |
| Total | 341 | 100.0% |
Housing Finances in White Sands
Median Income by Occupancy in White Sands
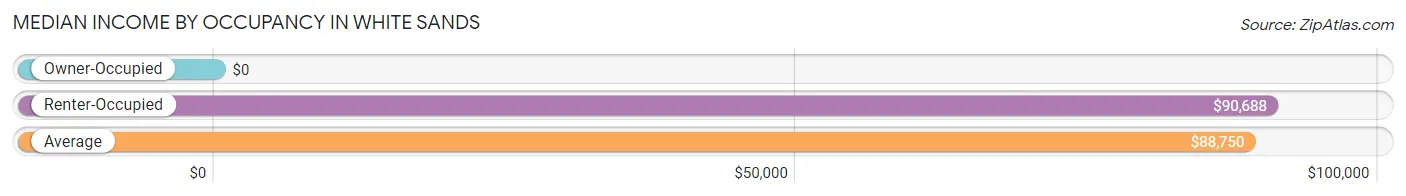
| Occupancy Type | # Households | Median Income |
| Owner-Occupied | 14 (4.1%) | $0 |
| Renter-Occupied | 327 (95.9%) | $90,688 |
| Average | 341 (100.0%) | $88,750 |
Occupancy by Householder Income Bracket in White Sands
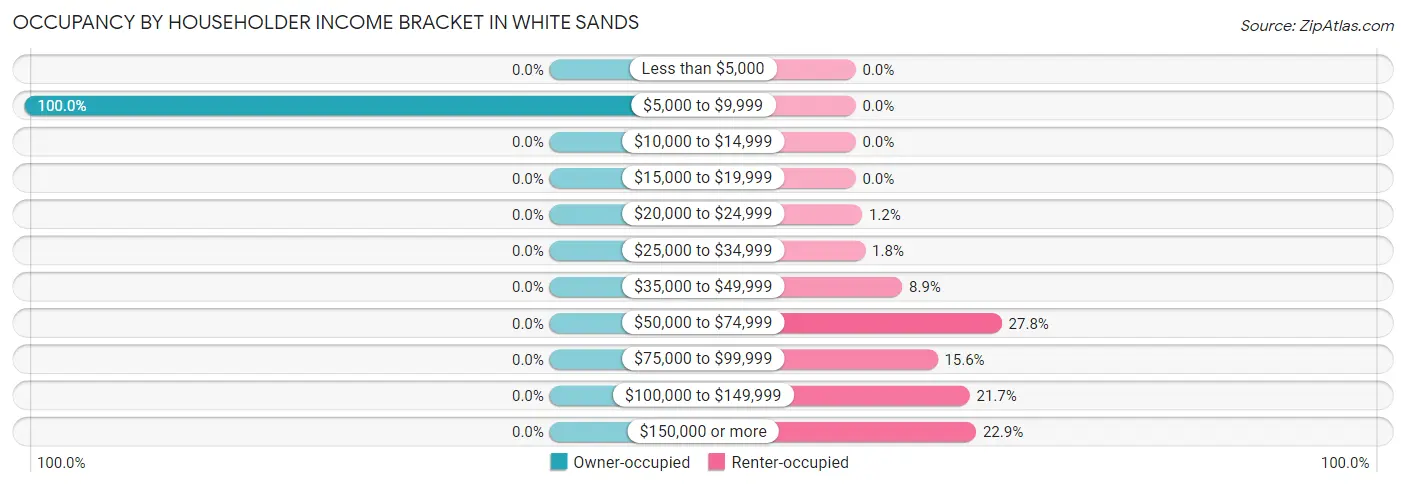
| Income Bracket | Owner-occupied | Renter-occupied |
| Less than $5,000 | 0 (0.0%) | 0 (0.0%) |
| $5,000 to $9,999 | 14 (100.0%) | 0 (0.0%) |
| $10,000 to $14,999 | 0 (0.0%) | 0 (0.0%) |
| $15,000 to $19,999 | 0 (0.0%) | 0 (0.0%) |
| $20,000 to $24,999 | 0 (0.0%) | 4 (1.2%) |
| $25,000 to $34,999 | 0 (0.0%) | 6 (1.8%) |
| $35,000 to $49,999 | 0 (0.0%) | 29 (8.9%) |
| $50,000 to $74,999 | 0 (0.0%) | 91 (27.8%) |
| $75,000 to $99,999 | 0 (0.0%) | 51 (15.6%) |
| $100,000 to $149,999 | 0 (0.0%) | 71 (21.7%) |
| $150,000 or more | 0 (0.0%) | 75 (22.9%) |
| Total | 14 (100.0%) | 327 (100.0%) |
Monthly Housing Cost Tiers in White Sands
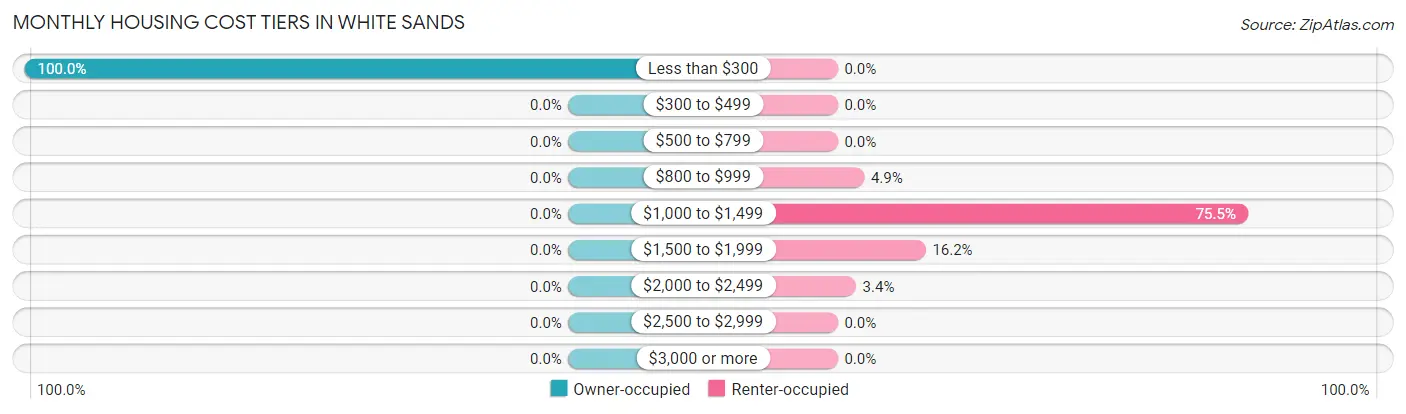
| Monthly Cost | Owner-occupied | Renter-occupied |
| Less than $300 | 14 (100.0%) | 0 (0.0%) |
| $300 to $499 | 0 (0.0%) | 0 (0.0%) |
| $500 to $799 | 0 (0.0%) | 0 (0.0%) |
| $800 to $999 | 0 (0.0%) | 16 (4.9%) |
| $1,000 to $1,499 | 0 (0.0%) | 247 (75.5%) |
| $1,500 to $1,999 | 0 (0.0%) | 53 (16.2%) |
| $2,000 to $2,499 | 0 (0.0%) | 11 (3.4%) |
| $2,500 to $2,999 | 0 (0.0%) | 0 (0.0%) |
| $3,000 or more | 0 (0.0%) | 0 (0.0%) |
| Total | 14 (100.0%) | 327 (100.0%) |
Physical Housing Characteristics in White Sands
Housing Structures in White Sands
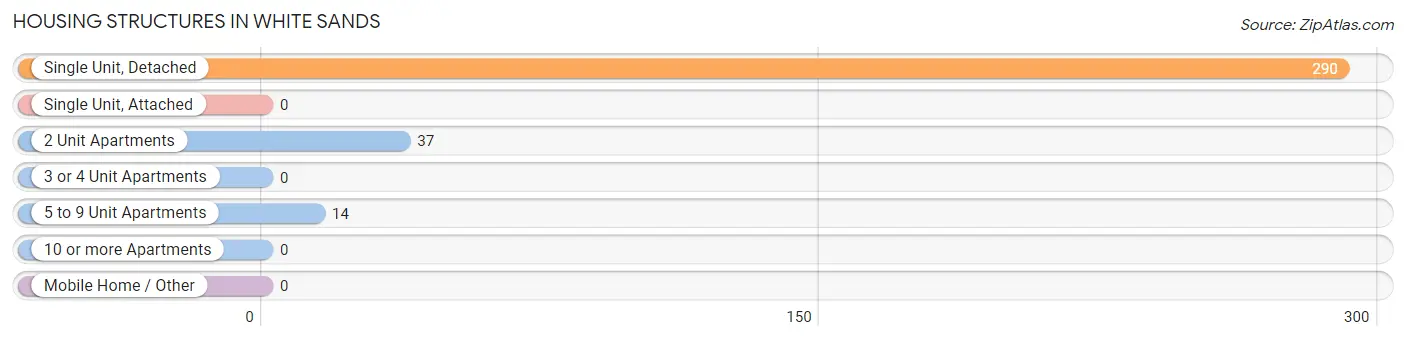
| Structure Type | # Housing Units | % Housing Units |
| Single Unit, Detached | 290 | 85.0% |
| Single Unit, Attached | 0 | 0.0% |
| 2 Unit Apartments | 37 | 10.8% |
| 3 or 4 Unit Apartments | 0 | 0.0% |
| 5 to 9 Unit Apartments | 14 | 4.1% |
| 10 or more Apartments | 0 | 0.0% |
| Mobile Home / Other | 0 | 0.0% |
| Total | 341 | 100.0% |
Housing Structures by Occupancy in White Sands
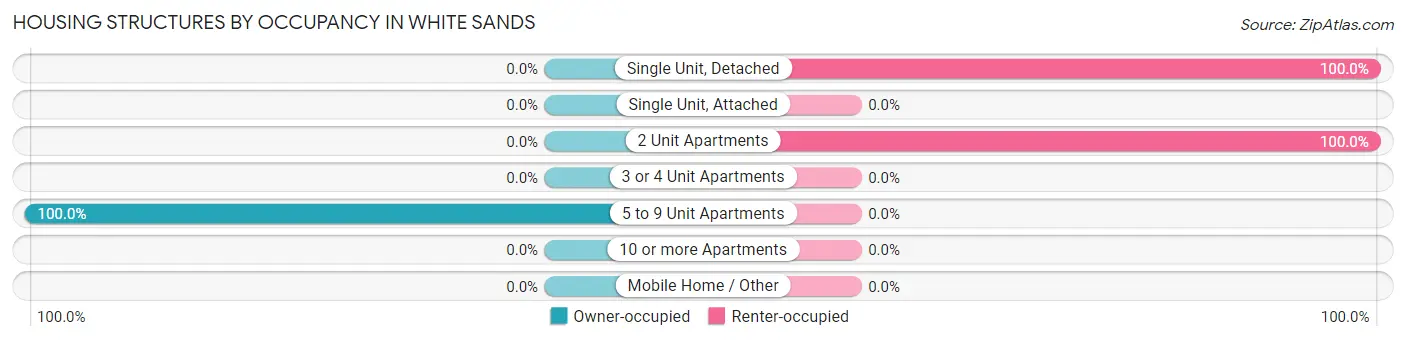
| Structure Type | Owner-occupied | Renter-occupied |
| Single Unit, Detached | 0 (0.0%) | 290 (100.0%) |
| Single Unit, Attached | 0 (0.0%) | 0 (0.0%) |
| 2 Unit Apartments | 0 (0.0%) | 37 (100.0%) |
| 3 or 4 Unit Apartments | 0 (0.0%) | 0 (0.0%) |
| 5 to 9 Unit Apartments | 14 (100.0%) | 0 (0.0%) |
| 10 or more Apartments | 0 (0.0%) | 0 (0.0%) |
| Mobile Home / Other | 0 (0.0%) | 0 (0.0%) |
| Total | 14 (4.1%) | 327 (95.9%) |
Housing Structures by Number of Rooms in White Sands
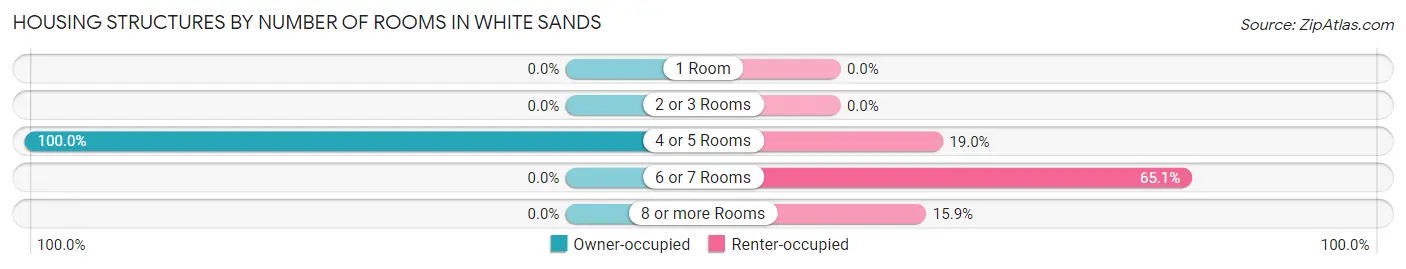
| Number of Rooms | Owner-occupied | Renter-occupied |
| 1 Room | 0 (0.0%) | 0 (0.0%) |
| 2 or 3 Rooms | 0 (0.0%) | 0 (0.0%) |
| 4 or 5 Rooms | 14 (100.0%) | 62 (19.0%) |
| 6 or 7 Rooms | 0 (0.0%) | 213 (65.1%) |
| 8 or more Rooms | 0 (0.0%) | 52 (15.9%) |
| Total | 14 (100.0%) | 327 (100.0%) |
Housing Structure by Heating Type in White Sands
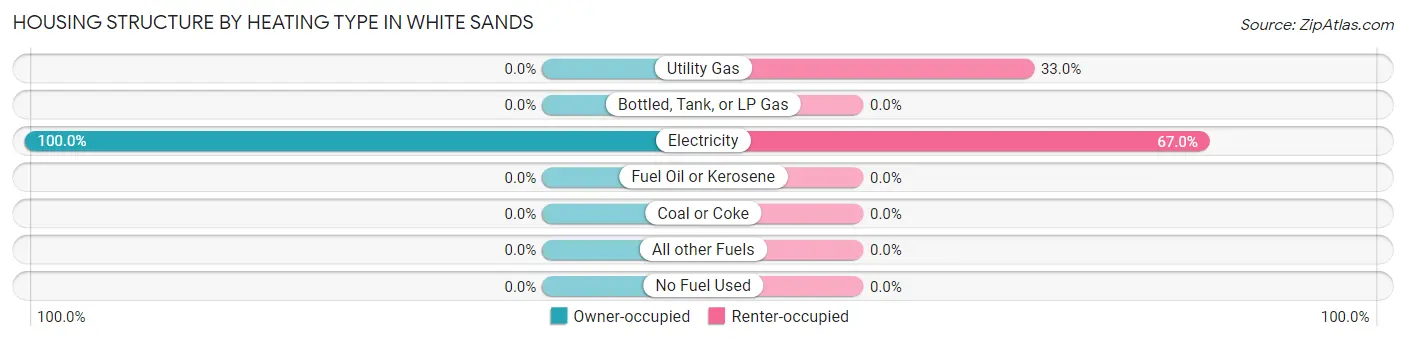
| Heating Type | Owner-occupied | Renter-occupied |
| Utility Gas | 0 (0.0%) | 108 (33.0%) |
| Bottled, Tank, or LP Gas | 0 (0.0%) | 0 (0.0%) |
| Electricity | 14 (100.0%) | 219 (67.0%) |
| Fuel Oil or Kerosene | 0 (0.0%) | 0 (0.0%) |
| Coal or Coke | 0 (0.0%) | 0 (0.0%) |
| All other Fuels | 0 (0.0%) | 0 (0.0%) |
| No Fuel Used | 0 (0.0%) | 0 (0.0%) |
| Total | 14 (100.0%) | 327 (100.0%) |
Household Vehicle Usage in White Sands
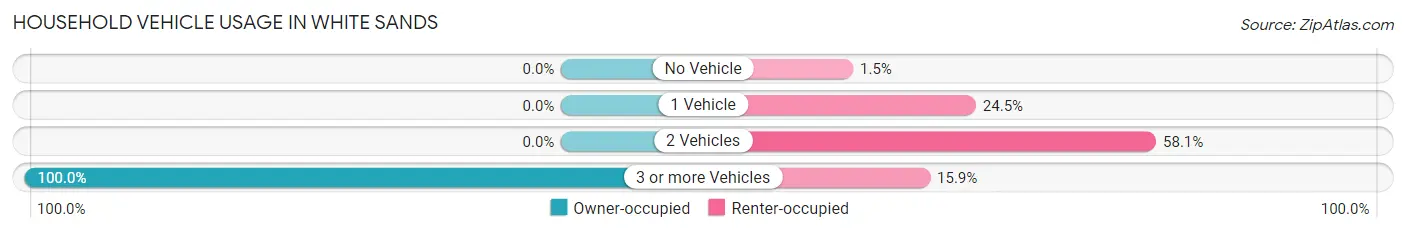
| Vehicles per Household | Owner-occupied | Renter-occupied |
| No Vehicle | 0 (0.0%) | 5 (1.5%) |
| 1 Vehicle | 0 (0.0%) | 80 (24.5%) |
| 2 Vehicles | 0 (0.0%) | 190 (58.1%) |
| 3 or more Vehicles | 14 (100.0%) | 52 (15.9%) |
| Total | 14 (100.0%) | 327 (100.0%) |
Real Estate & Mortgages in White Sands
Real Estate and Mortgage Overview in White Sands
| Characteristic | Without Mortgage | With Mortgage |
| Housing Units | 14 | 0 |
| Median Property Value | - | - |
| Median Household Income | - | - |
| Monthly Housing Costs | - | - |
| Real Estate Taxes | - | - |
Property Value by Mortgage Status in White Sands
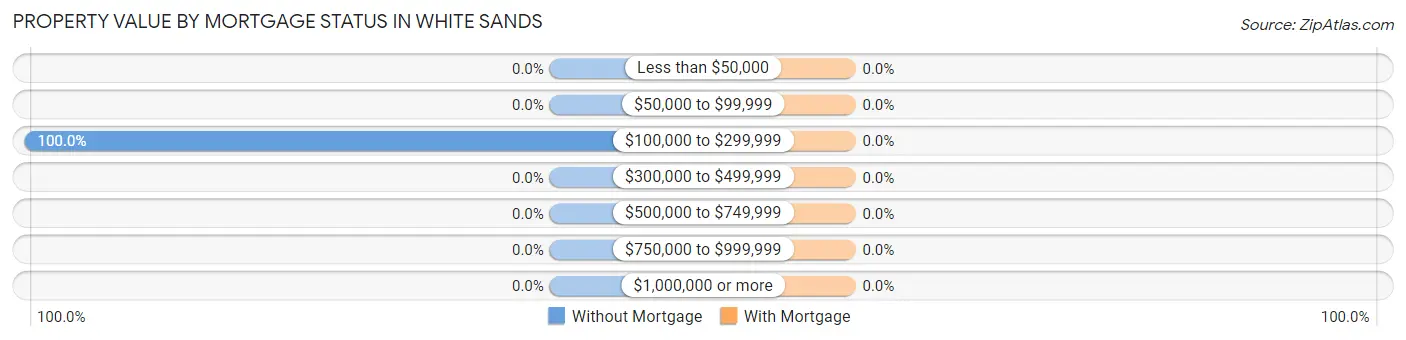
| Property Value | Without Mortgage | With Mortgage |
| Less than $50,000 | 0 (0.0%) | 0 (0.0%) |
| $50,000 to $99,999 | 0 (0.0%) | 0 (0.0%) |
| $100,000 to $299,999 | 14 (100.0%) | 0 (0.0%) |
| $300,000 to $499,999 | 0 (0.0%) | 0 (0.0%) |
| $500,000 to $749,999 | 0 (0.0%) | 0 (0.0%) |
| $750,000 to $999,999 | 0 (0.0%) | 0 (0.0%) |
| $1,000,000 or more | 0 (0.0%) | 0 (0.0%) |
| Total | 14 (100.0%) | 0 (0.0%) |
Household Income by Mortgage Status in White Sands
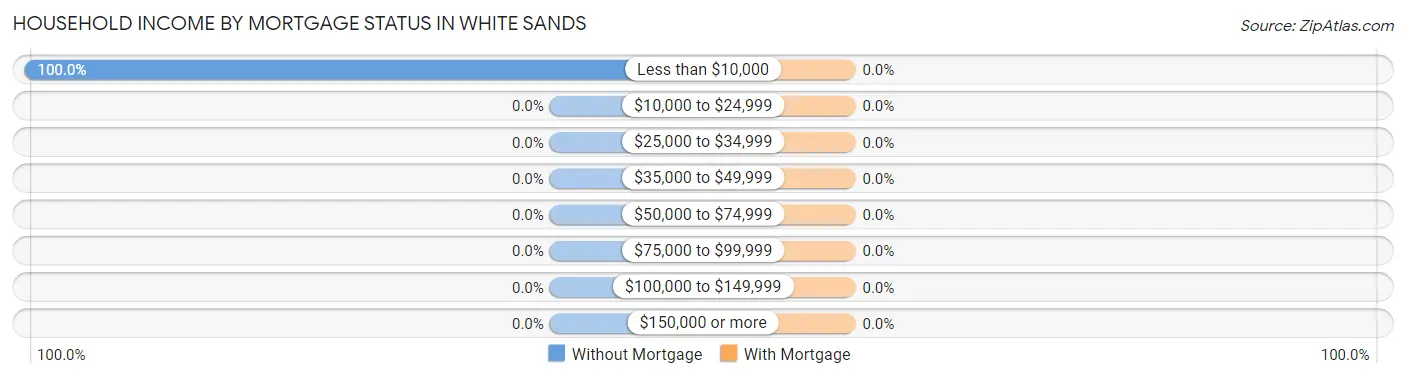
| Household Income | Without Mortgage | With Mortgage |
| Less than $10,000 | 14 (100.0%) | 0 (0.0%) |
| $10,000 to $24,999 | 0 (0.0%) | 0 (0.0%) |
| $25,000 to $34,999 | 0 (0.0%) | 0 (0.0%) |
| $35,000 to $49,999 | 0 (0.0%) | 0 (0.0%) |
| $50,000 to $74,999 | 0 (0.0%) | 0 (0.0%) |
| $75,000 to $99,999 | 0 (0.0%) | 0 (0.0%) |
| $100,000 to $149,999 | 0 (0.0%) | 0 (0.0%) |
| $150,000 or more | 0 (0.0%) | 0 (0.0%) |
| Total | 14 (100.0%) | 0 (0.0%) |
Property Value to Household Income Ratio in White Sands
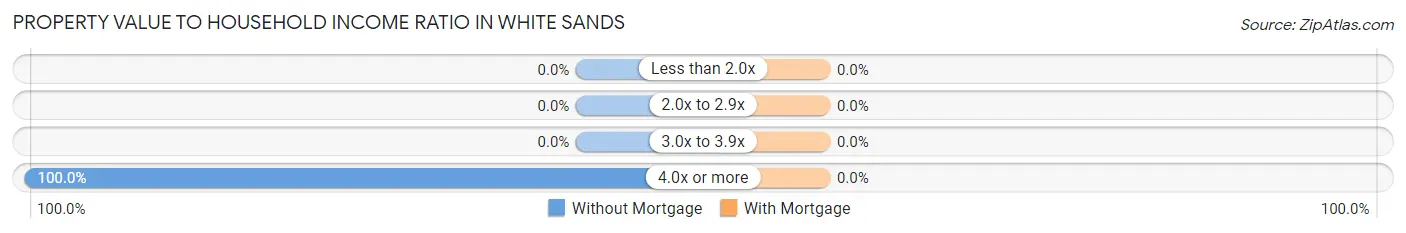
| Value-to-Income Ratio | Without Mortgage | With Mortgage |
| Less than 2.0x | 0 (0.0%) | 0 (0.0%) |
| 2.0x to 2.9x | 0 (0.0%) | 0 (0.0%) |
| 3.0x to 3.9x | 0 (0.0%) | 0 (0.0%) |
| 4.0x or more | 14 (100.0%) | 0 (0.0%) |
| Total | 14 (100.0%) | 0 (0.0%) |
Real Estate Taxes by Mortgage Status in White Sands
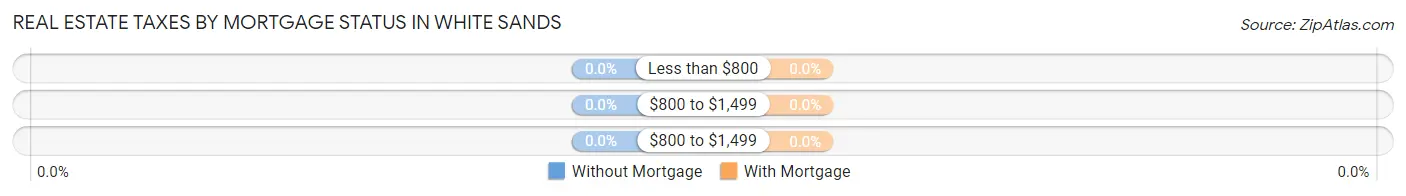
| Property Taxes | Without Mortgage | With Mortgage |
| Less than $800 | 0 (0.0%) | 0 (0.0%) |
| $800 to $1,499 | 0 (0.0%) | 0 (0.0%) |
| $800 to $1,499 | 0 (0.0%) | 0 (0.0%) |
| Total | 14 (100.0%) | 0 (0.0%) |
Health & Disability in White Sands
Health Insurance Coverage by Age in White Sands
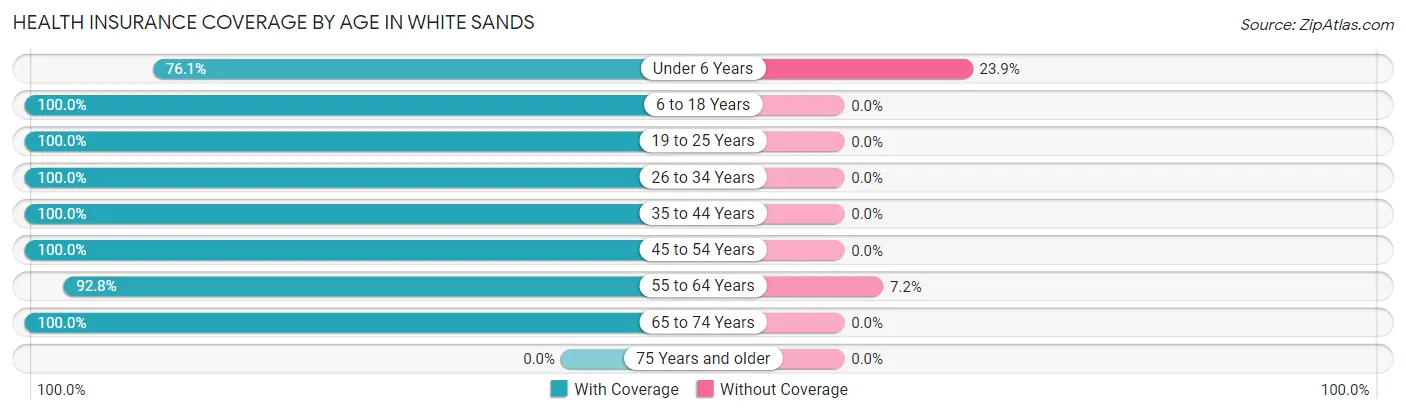
| Age Bracket | With Coverage | Without Coverage |
| Under 6 Years | 194 (76.1%) | 61 (23.9%) |
| 6 to 18 Years | 144 (100.0%) | 0 (0.0%) |
| 19 to 25 Years | 119 (100.0%) | 0 (0.0%) |
| 26 to 34 Years | 81 (100.0%) | 0 (0.0%) |
| 35 to 44 Years | 93 (100.0%) | 0 (0.0%) |
| 45 to 54 Years | 73 (100.0%) | 0 (0.0%) |
| 55 to 64 Years | 77 (92.8%) | 6 (7.2%) |
| 65 to 74 Years | 20 (100.0%) | 0 (0.0%) |
| 75 Years and older | 0 (0.0%) | 0 (0.0%) |
| Total | 801 (92.3%) | 67 (7.7%) |
Health Insurance Coverage by Citizenship Status in White Sands
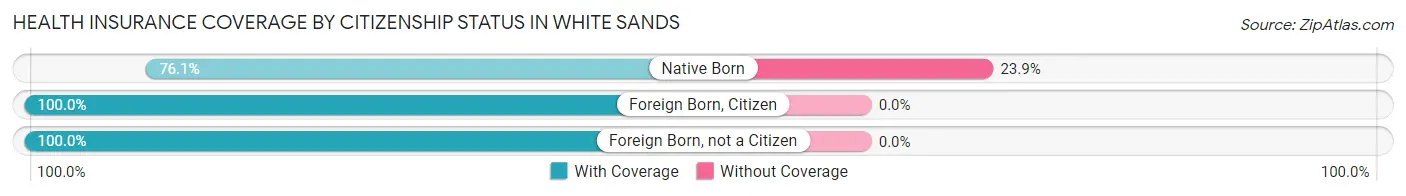
| Citizenship Status | With Coverage | Without Coverage |
| Native Born | 194 (76.1%) | 61 (23.9%) |
| Foreign Born, Citizen | 144 (100.0%) | 0 (0.0%) |
| Foreign Born, not a Citizen | 119 (100.0%) | 0 (0.0%) |
Health Insurance Coverage by Household Income in White Sands
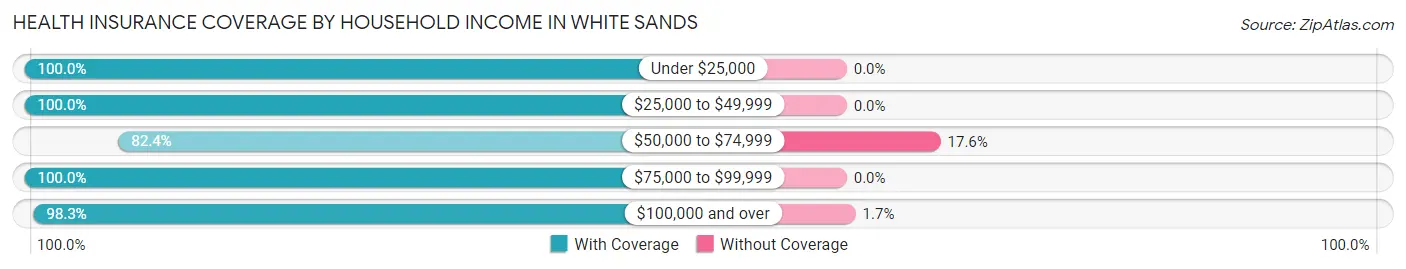
| Household Income | With Coverage | Without Coverage |
| Under $25,000 | 8 (100.0%) | 0 (0.0%) |
| $25,000 to $49,999 | 31 (100.0%) | 0 (0.0%) |
| $50,000 to $74,999 | 286 (82.4%) | 61 (17.6%) |
| $75,000 to $99,999 | 120 (100.0%) | 0 (0.0%) |
| $100,000 and over | 356 (98.3%) | 6 (1.7%) |
Public vs Private Health Insurance Coverage by Age in White Sands
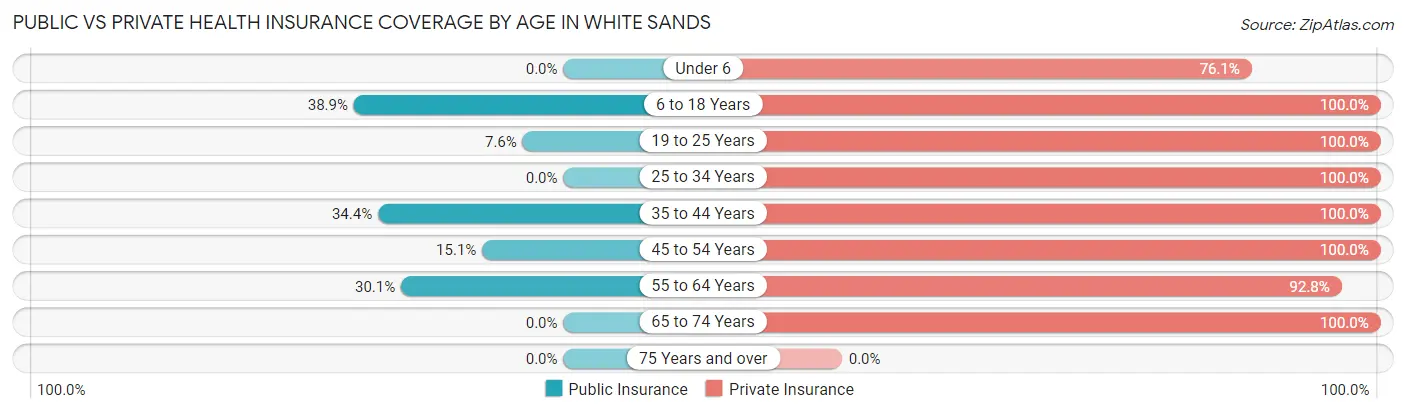
| Age Bracket | Public Insurance | Private Insurance |
| Under 6 | 0 (0.0%) | 194 (76.1%) |
| 6 to 18 Years | 56 (38.9%) | 144 (100.0%) |
| 19 to 25 Years | 9 (7.6%) | 119 (100.0%) |
| 25 to 34 Years | 0 (0.0%) | 81 (100.0%) |
| 35 to 44 Years | 32 (34.4%) | 93 (100.0%) |
| 45 to 54 Years | 11 (15.1%) | 73 (100.0%) |
| 55 to 64 Years | 25 (30.1%) | 77 (92.8%) |
| 65 to 74 Years | 0 (0.0%) | 20 (100.0%) |
| 75 Years and over | 0 (0.0%) | 0 (0.0%) |
| Total | 133 (15.3%) | 801 (92.3%) |
Disability Status by Sex by Age in White Sands
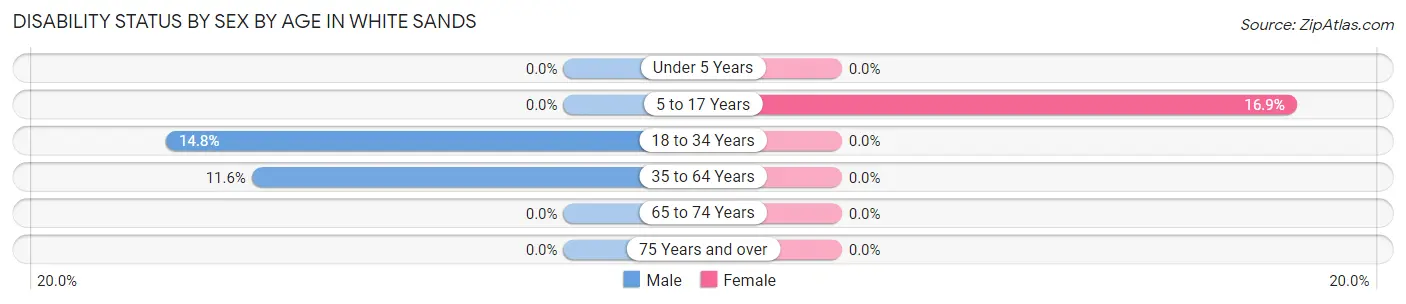
| Age Bracket | Male | Female |
| Under 5 Years | 0 (0.0%) | 0 (0.0%) |
| 5 to 17 Years | 0 (0.0%) | 13 (16.9%) |
| 18 to 34 Years | 9 (14.7%) | 0 (0.0%) |
| 35 to 64 Years | 14 (11.6%) | 0 (0.0%) |
| 65 to 74 Years | 0 (0.0%) | 0 (0.0%) |
| 75 Years and over | 0 (0.0%) | 0 (0.0%) |
Disability Class by Sex by Age in White Sands
Disability Class: Hearing Difficulty
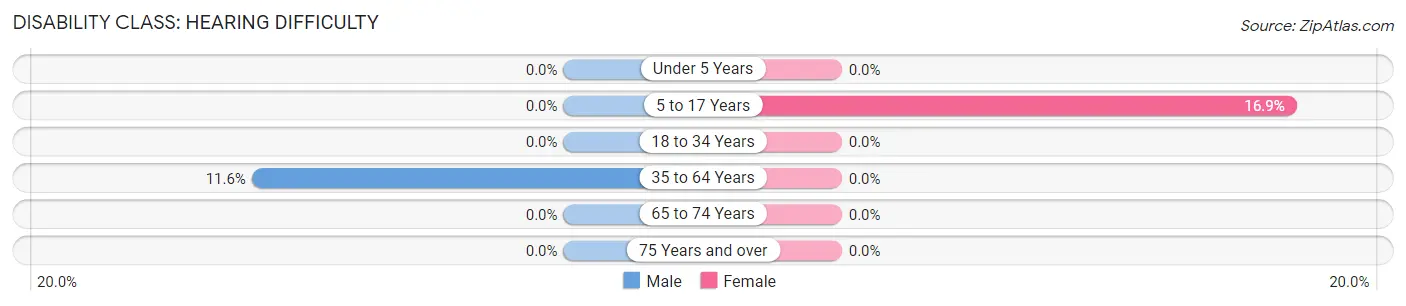
| Age Bracket | Male | Female |
| Under 5 Years | 0 (0.0%) | 0 (0.0%) |
| 5 to 17 Years | 0 (0.0%) | 13 (16.9%) |
| 18 to 34 Years | 0 (0.0%) | 0 (0.0%) |
| 35 to 64 Years | 14 (11.6%) | 0 (0.0%) |
| 65 to 74 Years | 0 (0.0%) | 0 (0.0%) |
| 75 Years and over | 0 (0.0%) | 0 (0.0%) |
Disability Class: Vision Difficulty
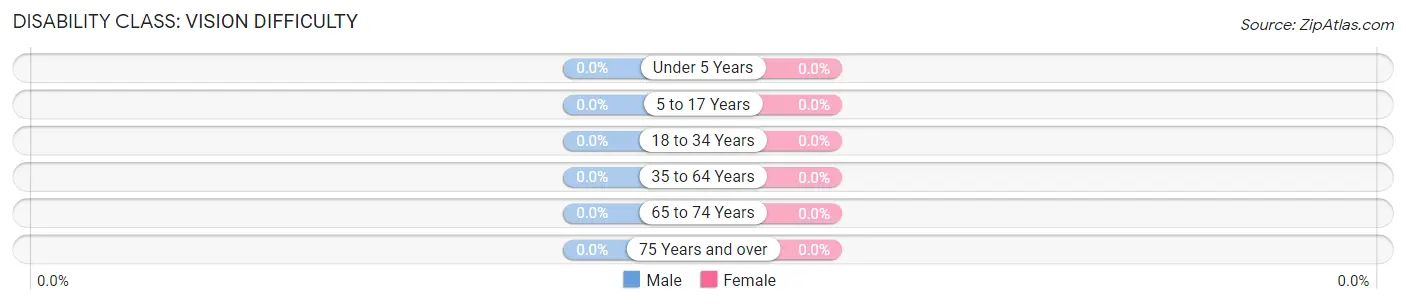
| Age Bracket | Male | Female |
| Under 5 Years | 0 (0.0%) | 0 (0.0%) |
| 5 to 17 Years | 0 (0.0%) | 0 (0.0%) |
| 18 to 34 Years | 0 (0.0%) | 0 (0.0%) |
| 35 to 64 Years | 0 (0.0%) | 0 (0.0%) |
| 65 to 74 Years | 0 (0.0%) | 0 (0.0%) |
| 75 Years and over | 0 (0.0%) | 0 (0.0%) |
Disability Class: Cognitive Difficulty
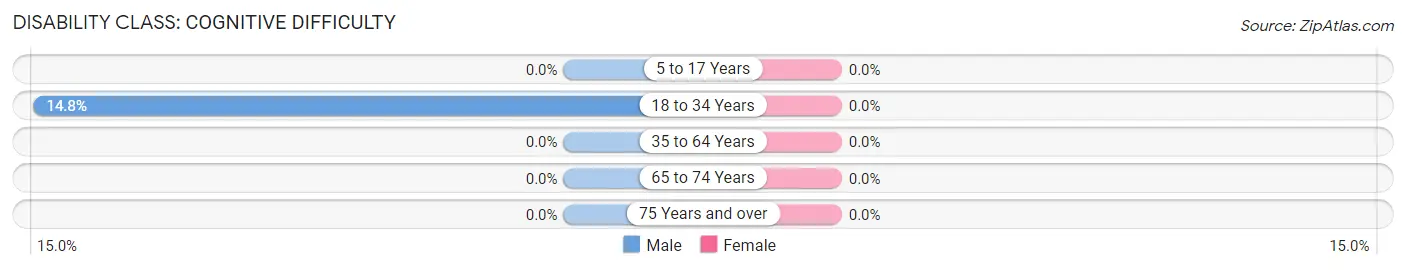
| Age Bracket | Male | Female |
| 5 to 17 Years | 0 (0.0%) | 0 (0.0%) |
| 18 to 34 Years | 9 (14.7%) | 0 (0.0%) |
| 35 to 64 Years | 0 (0.0%) | 0 (0.0%) |
| 65 to 74 Years | 0 (0.0%) | 0 (0.0%) |
| 75 Years and over | 0 (0.0%) | 0 (0.0%) |
Disability Class: Ambulatory Difficulty
| Age Bracket | Male | Female |
| 5 to 17 Years | 0 (0.0%) | 0 (0.0%) |
| 18 to 34 Years | 0 (0.0%) | 0 (0.0%) |
| 35 to 64 Years | 0 (0.0%) | 0 (0.0%) |
| 65 to 74 Years | 0 (0.0%) | 0 (0.0%) |
| 75 Years and over | 0 (0.0%) | 0 (0.0%) |
Disability Class: Self-Care Difficulty
| Age Bracket | Male | Female |
| 5 to 17 Years | 0 (0.0%) | 0 (0.0%) |
| 18 to 34 Years | 0 (0.0%) | 0 (0.0%) |
| 35 to 64 Years | 0 (0.0%) | 0 (0.0%) |
| 65 to 74 Years | 0 (0.0%) | 0 (0.0%) |
| 75 Years and over | 0 (0.0%) | 0 (0.0%) |
Technology Access in White Sands
Computing Device Access in White Sands
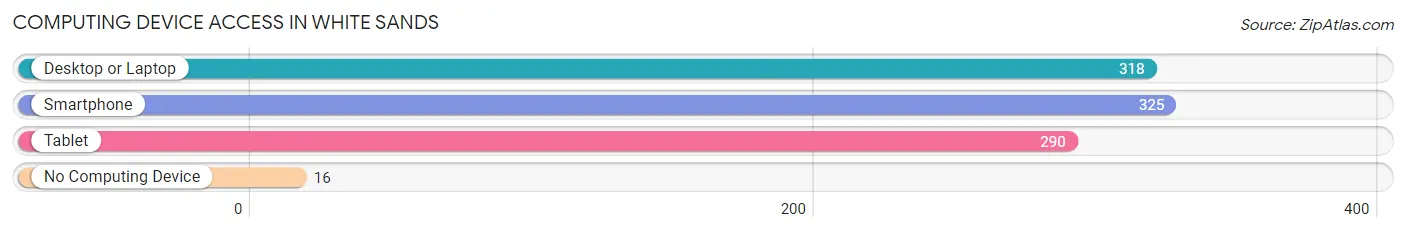
| Device Type | # Households | % Households |
| Desktop or Laptop | 318 | 93.3% |
| Smartphone | 325 | 95.3% |
| Tablet | 290 | 85.0% |
| No Computing Device | 16 | 4.7% |
| Total | 341 | 100.0% |
Internet Access in White Sands
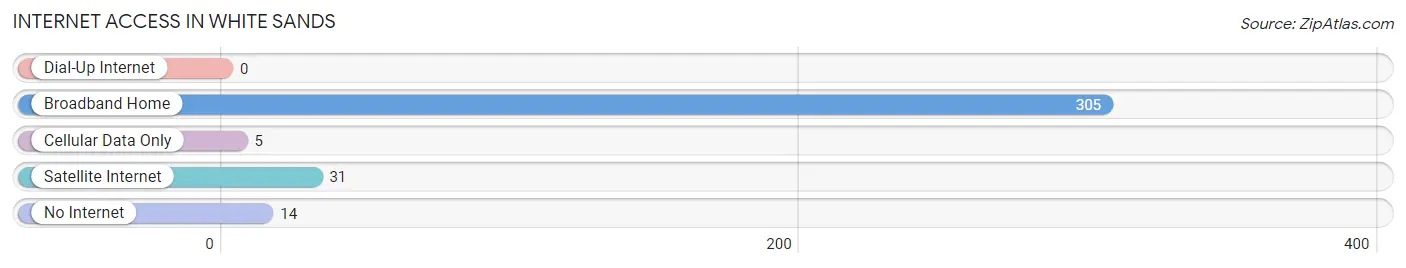
| Internet Type | # Households | % Households |
| Dial-Up Internet | 0 | 0.0% |
| Broadband Home | 305 | 89.4% |
| Cellular Data Only | 5 | 1.5% |
| Satellite Internet | 31 | 9.1% |
| No Internet | 14 | 4.1% |
| Total | 341 | 100.0% |
White Sands Summary
History
White Sands, New Mexico is a small town located in the Tularosa Basin of the Chihuahuan Desert. It is known for its white sand dunes, which are the largest in the world. The area has been inhabited for thousands of years by Native American tribes, including the Mescalero Apache, Jumano, and Comanche. The first Europeans to visit the area were Spanish explorers in the late 1500s. The area was later settled by ranchers and farmers in the late 1800s.
The town of White Sands was founded in 1899 by rancher Charles B. Eddy. He named the town after the white sand dunes that surrounded it. The town quickly grew and by 1910, it had a population of over 500 people. The town was incorporated in 1912 and continued to grow throughout the 20th century.
Geography
White Sands is located in the Tularosa Basin of the Chihuahuan Desert in Otero County, New Mexico. The town is situated at an elevation of 4,235 feet and is surrounded by the White Sands National Monument. The monument is home to the world’s largest gypsum dune field, which covers 275 square miles. The dunes are composed of white gypsum sand and are constantly shifting due to the wind.
The town is located near the San Andres Mountains, which are part of the Sacramento Mountains. The mountains are home to a variety of wildlife, including mule deer, coyotes, and mountain lions. The area is also home to a variety of plants, including creosote bush, yucca, and cacti.
Economy
White Sands has a small but diverse economy. The town is home to a variety of businesses, including restaurants, retail stores, and hotels. The town is also home to a number of government agencies, including the White Sands Missile Range and the White Sands National Monument.
The town is also home to a number of tourist attractions, including the White Sands National Monument, the White Sands Missile Range Museum, and the White Sands National Wildlife Refuge. Tourism is a major source of income for the town, as visitors come to see the unique white sand dunes.
Demographics
As of the 2010 census, White Sands had a population of 1,651 people. The population is predominantly white (90.2%) and Hispanic (7.3%). The median household income is $37,917 and the median age is 37. The town has a high rate of poverty, with 24.3% of the population living below the poverty line.
White Sands is a small but vibrant town with a rich history and a unique landscape. The town is home to a variety of businesses, government agencies, and tourist attractions. The town is also home to a diverse population, with a majority of the population being white and Hispanic. The town has a high rate of poverty, but it is still a great place to live and visit.
Common Questions
What is Per Capita Income in White Sands?
Per Capita income in White Sands is $29,225.
What is the Median Family Income in White Sands?
Median Family Income in White Sands is $98,750.
What is the Median Household income in White Sands?
Median Household Income in White Sands is $88,750.
What is Income or Wage Gap in White Sands?
Income or Wage Gap in White Sands is 9.2%.
Women in White Sands earn 90.8 cents for every dollar earned by a man.
What is Inequality or Gini Index in White Sands?
Inequality or Gini Index in White Sands is 0.31.
What is the Total Population of White Sands?
Total Population of White Sands is 1,449.
What is the Total Male Population of White Sands?
Total Male Population of White Sands is 885.
What is the Total Female Population of White Sands?
Total Female Population of White Sands is 564.
What is the Ratio of Males per 100 Females in White Sands?
There are 156.91 Males per 100 Females in White Sands.
What is the Ratio of Females per 100 Males in White Sands?
There are 63.73 Females per 100 Males in White Sands.
What is the Median Population Age in White Sands?
Median Population Age in White Sands is 21.9 Years.
What is the Average Family Size in White Sands
Average Family Size in White Sands is 3.5 People.
What is the Average Household Size in White Sands
Average Household Size in White Sands is 3.1 People.
How Large is the Labor Force in White Sands?
There are 894 People in the Labor Forcein in White Sands.
What is the Percentage of People in the Labor Force in White Sands?
84.3% of People are in the Labor Force in White Sands.