Allen, SD Map & Demographics
Allen Map
Allen Overview
$6,147
PER CAPITA INCOME
$21,924
FAMILY INCOME DEFICIT
0.40
INEQUALITY / GINI INDEX
926
TOTAL POPULATION
376
MALE POPULATION
550
FEMALE POPULATION
68.36
MALES / 100 FEMALES
146.28
FEMALES / 100 MALES
17.6
MEDIAN AGE
7.0
AVG FAMILY SIZE
6.7
AVG HOUSEHOLD SIZE
135
LABOR FORCE [ PEOPLE ]
28.0%
PERCENT IN LABOR FORCE
13.3%
UNEMPLOYMENT RATE
Allen Zip Codes
Allen Area Codes
Income in Allen
Income Overview in Allen
| Characteristic | Number | Measure |
| Per Capita Income | 926 | $6,147 |
| Median Family Income | 129 | $0 |
| Mean Family Income | 129 | $35,474 |
| Median Household Income | 138 | $0 |
| Mean Household Income | 138 | $36,693 |
| Income Deficit | 129 | $21,924 |
| Wage / Income Gap (%) | 926 | 0.00% |
| Wage / Income Gap ($) | 926 | 100.00¢ per $1 |
| Gini / Inequality Index | 926 | 0.40 |
Earnings by Sex in Allen
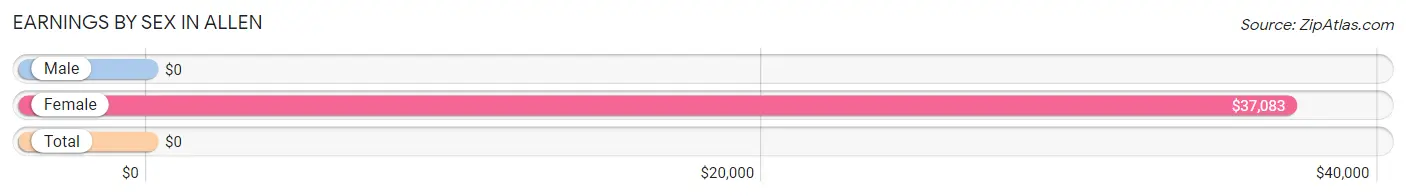
| Sex | Number | Average Earnings |
| Male | 88 (54.3%) | $0 |
| Female | 74 (45.7%) | $37,083 |
| Total | 162 (100.0%) | $0 |
Earnings by Sex by Income Bracket in Allen
The most common earnings brackets in Allen are $2,499 or less for men (25 | 28.4%) and $35,000 to $39,999 for women (29 | 39.2%).
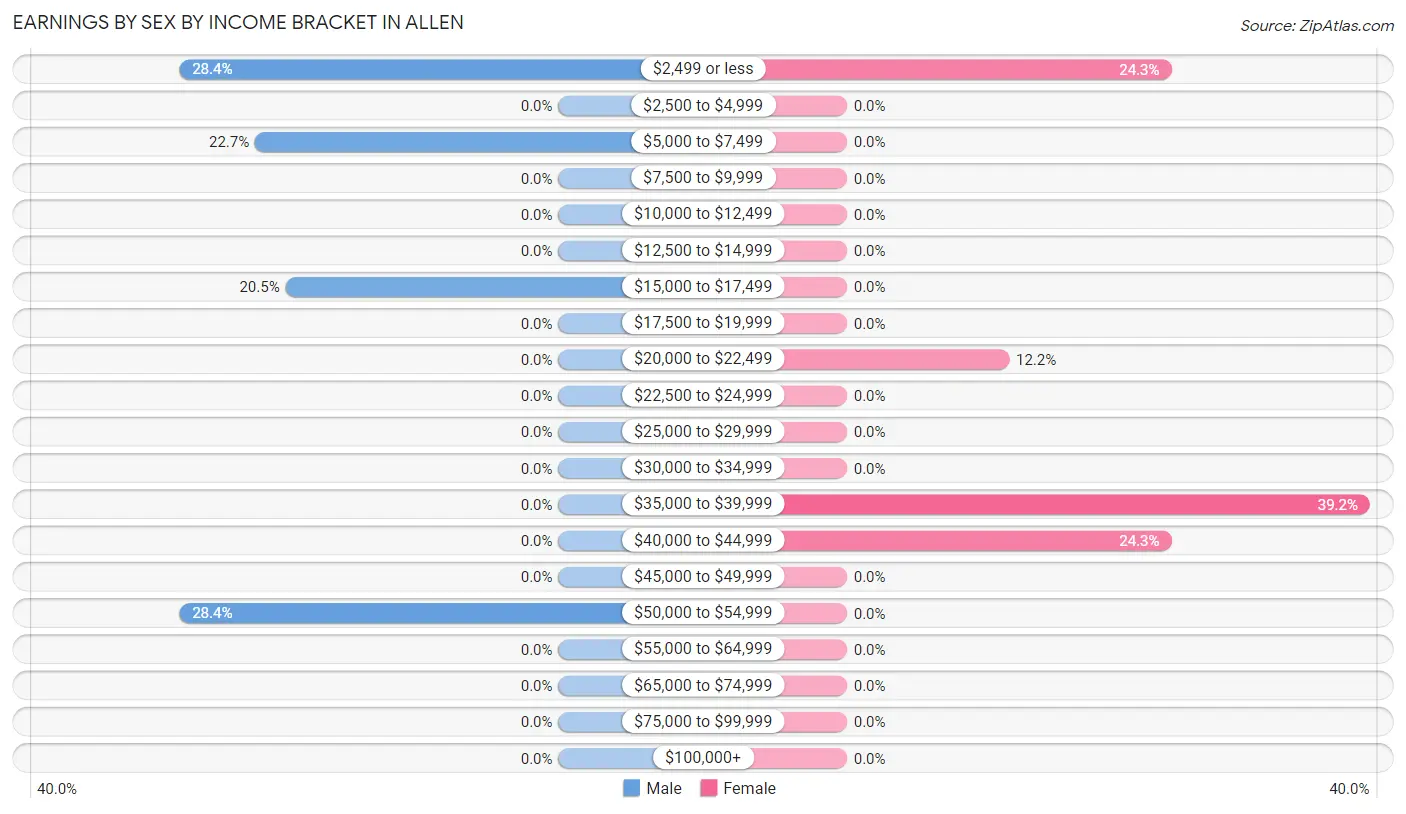
| Income | Male | Female |
| $2,499 or less | 25 (28.4%) | 18 (24.3%) |
| $2,500 to $4,999 | 0 (0.0%) | 0 (0.0%) |
| $5,000 to $7,499 | 20 (22.7%) | 0 (0.0%) |
| $7,500 to $9,999 | 0 (0.0%) | 0 (0.0%) |
| $10,000 to $12,499 | 0 (0.0%) | 0 (0.0%) |
| $12,500 to $14,999 | 0 (0.0%) | 0 (0.0%) |
| $15,000 to $17,499 | 18 (20.4%) | 0 (0.0%) |
| $17,500 to $19,999 | 0 (0.0%) | 0 (0.0%) |
| $20,000 to $22,499 | 0 (0.0%) | 9 (12.2%) |
| $22,500 to $24,999 | 0 (0.0%) | 0 (0.0%) |
| $25,000 to $29,999 | 0 (0.0%) | 0 (0.0%) |
| $30,000 to $34,999 | 0 (0.0%) | 0 (0.0%) |
| $35,000 to $39,999 | 0 (0.0%) | 29 (39.2%) |
| $40,000 to $44,999 | 0 (0.0%) | 18 (24.3%) |
| $45,000 to $49,999 | 0 (0.0%) | 0 (0.0%) |
| $50,000 to $54,999 | 25 (28.4%) | 0 (0.0%) |
| $55,000 to $64,999 | 0 (0.0%) | 0 (0.0%) |
| $65,000 to $74,999 | 0 (0.0%) | 0 (0.0%) |
| $75,000 to $99,999 | 0 (0.0%) | 0 (0.0%) |
| $100,000+ | 0 (0.0%) | 0 (0.0%) |
| Total | 88 (100.0%) | 74 (100.0%) |
Earnings by Sex by Educational Attainment in Allen
| Educational Attainment | Male Income | Female Income |
| Less than High School | - | - |
| High School Diploma | - | - |
| College or Associate's Degree | - | - |
| Bachelor's Degree | - | - |
| Graduate Degree | - | - |
| Total | - | - |
Family Income in Allen
Family Income Brackets in Allen
According to the Allen family income data, there are 32 families falling into the $50,000 to $74,999 income range, which is the most common income bracket and makes up 24.8% of all families.
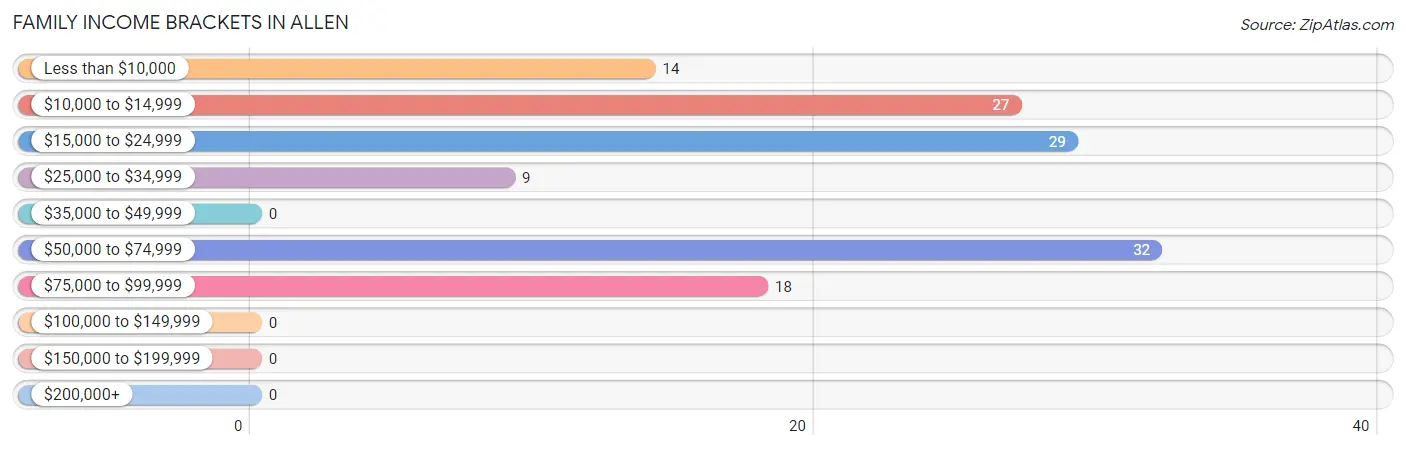
| Income Bracket | # Families | % Families |
| Less than $10,000 | 14 | 10.9% |
| $10,000 to $14,999 | 27 | 20.9% |
| $15,000 to $24,999 | 29 | 22.5% |
| $25,000 to $34,999 | 9 | 7.0% |
| $35,000 to $49,999 | 0 | 0.0% |
| $50,000 to $74,999 | 32 | 24.8% |
| $75,000 to $99,999 | 18 | 14.0% |
| $100,000 to $149,999 | 0 | 0.0% |
| $150,000 to $199,999 | 0 | 0.0% |
| $200,000+ | 0 | 0.0% |
Family Income by Famaliy Size in Allen
| Income Bracket | # Families | Median Income |
| 2-Person Families | 22 (17.1%) | $0 |
| 3-Person Families | 38 (29.5%) | $0 |
| 4-Person Families | 0 (0.0%) | $0 |
| 5-Person Families | 0 (0.0%) | $0 |
| 6-Person Families | 23 (17.8%) | $0 |
| 7+ Person Families | 46 (35.7%) | $0 |
| Total | 129 (100.0%) | $0 |
Family Income by Number of Earners in Allen
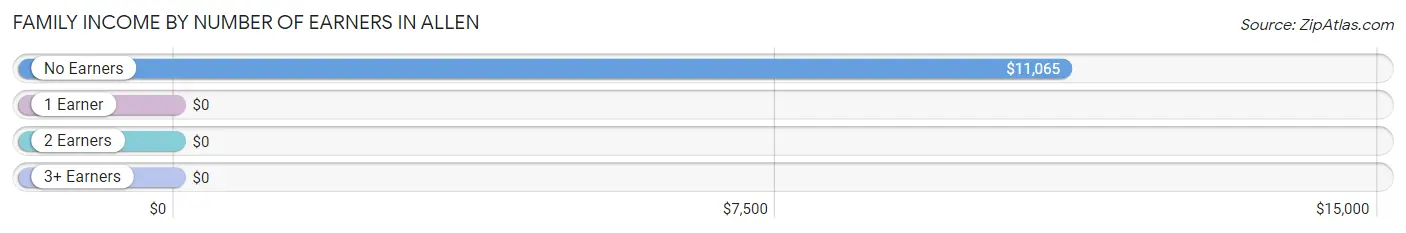
| Number of Earners | # Families | Median Income |
| No Earners | 51 (39.5%) | $11,065 |
| 1 Earner | 21 (16.3%) | $0 |
| 2 Earners | 57 (44.2%) | $0 |
| 3+ Earners | 0 (0.0%) | $0 |
| Total | 129 (100.0%) | $0 |
Household Income in Allen
Household Income Brackets in Allen
With 32 households falling in the category, the $50,000 to $74,999 income range is the most frequent in Allen, accounting for 23.2% of all households.
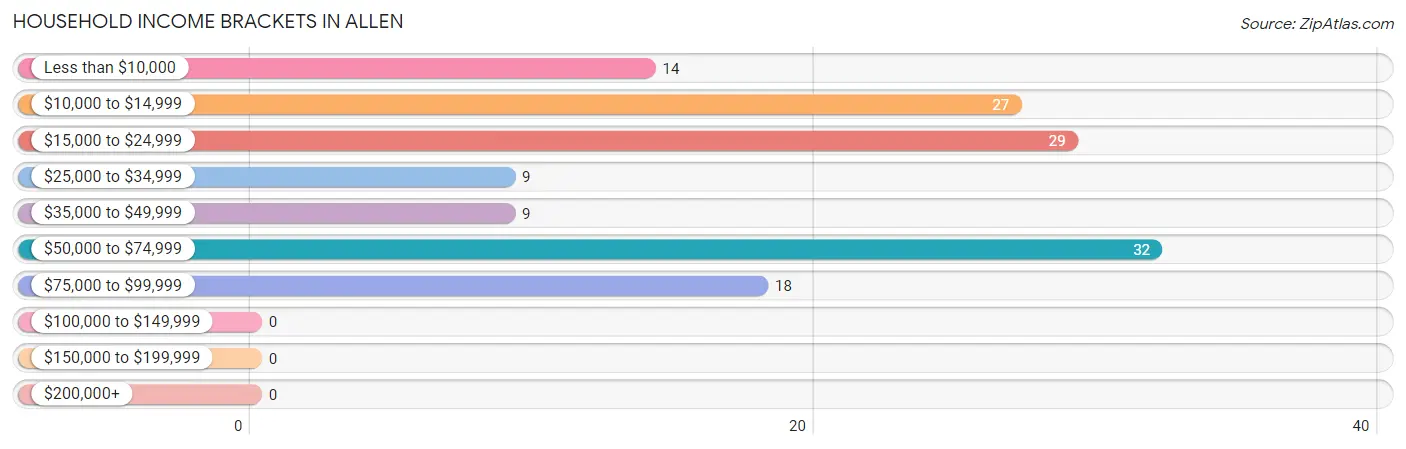
| Income Bracket | # Households | % Households |
| Less than $10,000 | 14 | 10.1% |
| $10,000 to $14,999 | 27 | 19.6% |
| $15,000 to $24,999 | 29 | 21.0% |
| $25,000 to $34,999 | 9 | 6.5% |
| $35,000 to $49,999 | 9 | 6.5% |
| $50,000 to $74,999 | 32 | 23.2% |
| $75,000 to $99,999 | 18 | 13.0% |
| $100,000 to $149,999 | 0 | 0.0% |
| $150,000 to $199,999 | 0 | 0.0% |
| $200,000+ | 0 | 0.0% |
Household Income by Householder Age in Allen
The median household income in Allen is $0, with the highest median household income of $63,958 found in the 65+ years age bracket for the primary householder. A total of 50 households (36.2%) fall into this category.
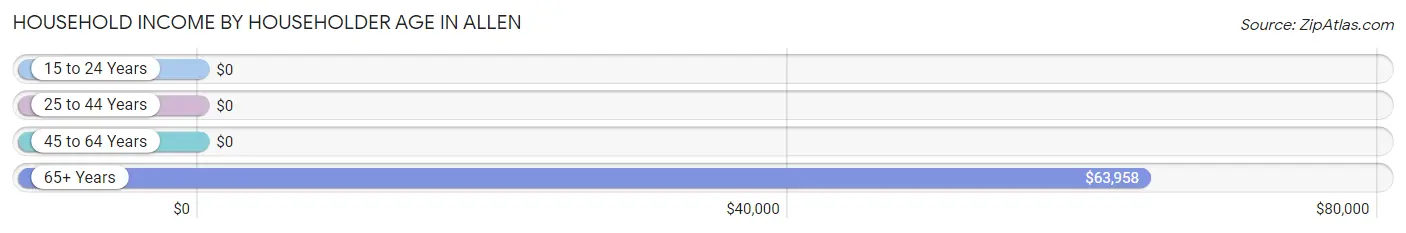
| Income Bracket | # Households | Median Income |
| 15 to 24 Years | 0 (0.0%) | $0 |
| 25 to 44 Years | 43 (31.2%) | $0 |
| 45 to 64 Years | 45 (32.6%) | $0 |
| 65+ Years | 50 (36.2%) | $63,958 |
| Total | 138 (100.0%) | $0 |
Poverty in Allen
Income Below Poverty by Sex and Age in Allen
With 37.8% poverty level for males and 52.7% for females among the residents of Allen, 5 year old males and under 5 year old females are the most vulnerable to poverty, with 14 males (100.0%) and 30 females (100.0%) in their respective age groups living below the poverty level.
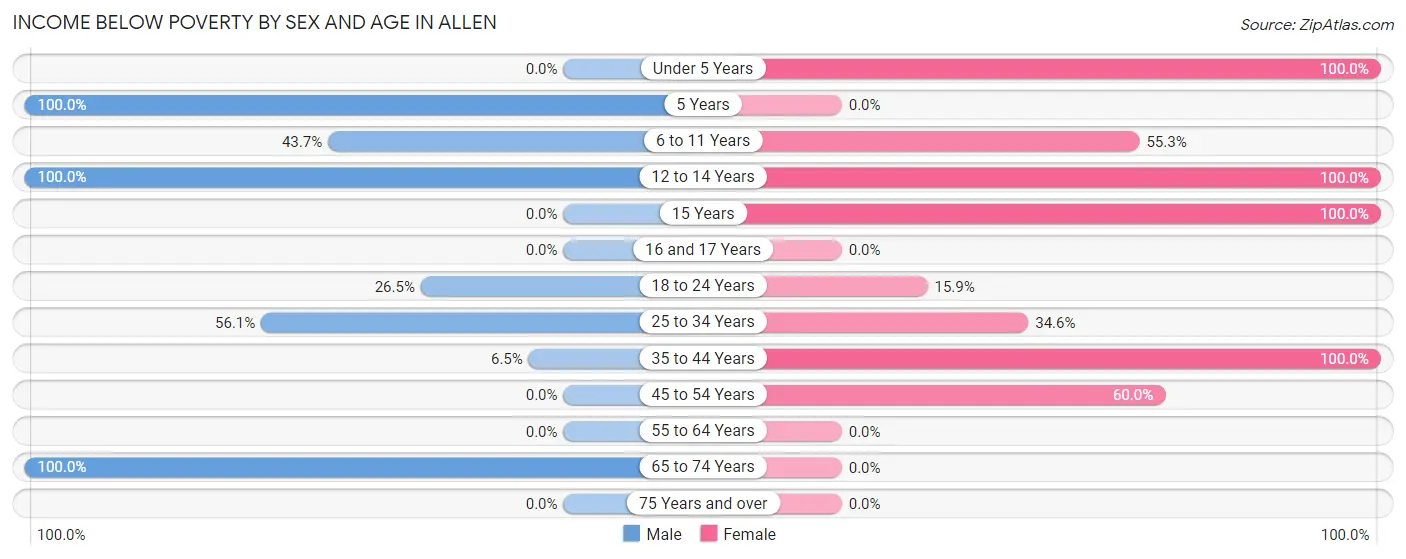
| Age Bracket | Male | Female |
| Under 5 Years | 0 (0.0%) | 30 (100.0%) |
| 5 Years | 14 (100.0%) | 0 (0.0%) |
| 6 to 11 Years | 45 (43.7%) | 42 (55.3%) |
| 12 to 14 Years | 30 (100.0%) | 46 (100.0%) |
| 15 Years | 0 (0.0%) | 70 (100.0%) |
| 16 and 17 Years | 0 (0.0%) | 0 (0.0%) |
| 18 to 24 Years | 18 (26.5%) | 14 (15.9%) |
| 25 to 34 Years | 23 (56.1%) | 18 (34.6%) |
| 35 to 44 Years | 2 (6.5%) | 43 (100.0%) |
| 45 to 54 Years | 0 (0.0%) | 27 (60.0%) |
| 55 to 64 Years | 0 (0.0%) | 0 (0.0%) |
| 65 to 74 Years | 10 (100.0%) | 0 (0.0%) |
| 75 Years and over | 0 (0.0%) | 0 (0.0%) |
| Total | 142 (37.8%) | 290 (52.7%) |
Income Above Poverty by Sex and Age in Allen
According to the poverty statistics in Allen, males aged under 5 years and females aged 5 years are the age groups that are most secure financially, with 100.0% of males and 100.0% of females in these age groups living above the poverty line.
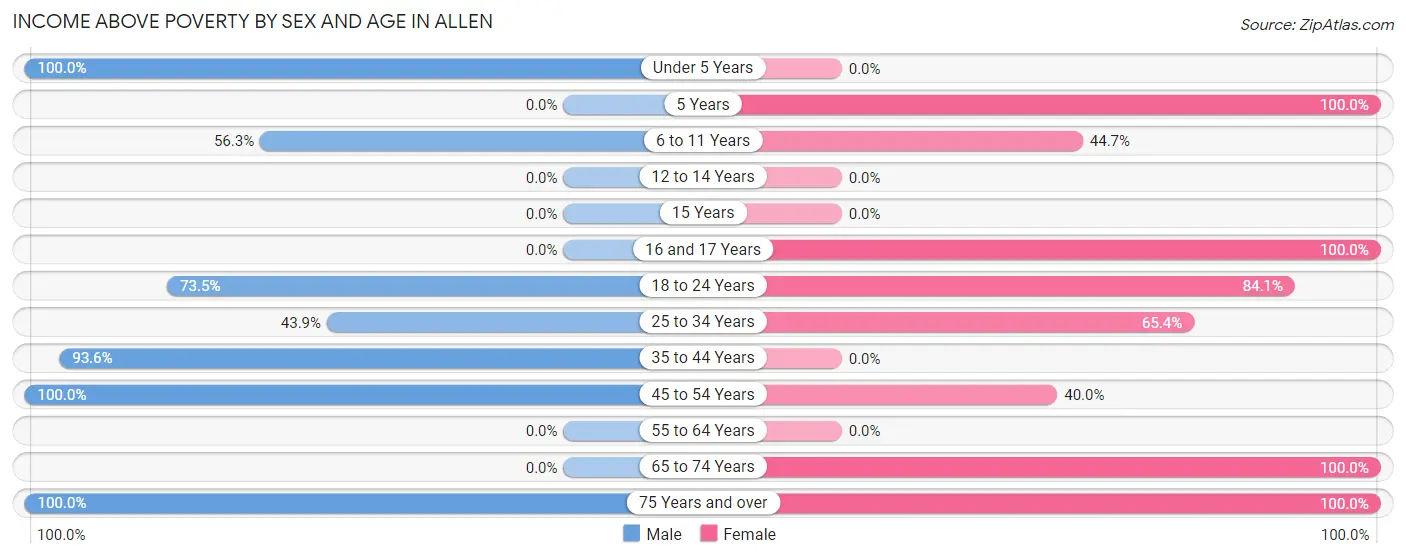
| Age Bracket | Male | Female |
| Under 5 Years | 56 (100.0%) | 0 (0.0%) |
| 5 Years | 0 (0.0%) | 19 (100.0%) |
| 6 to 11 Years | 58 (56.3%) | 34 (44.7%) |
| 12 to 14 Years | 0 (0.0%) | 0 (0.0%) |
| 15 Years | 0 (0.0%) | 0 (0.0%) |
| 16 and 17 Years | 0 (0.0%) | 31 (100.0%) |
| 18 to 24 Years | 50 (73.5%) | 74 (84.1%) |
| 25 to 34 Years | 18 (43.9%) | 34 (65.4%) |
| 35 to 44 Years | 29 (93.5%) | 0 (0.0%) |
| 45 to 54 Years | 17 (100.0%) | 18 (40.0%) |
| 55 to 64 Years | 0 (0.0%) | 0 (0.0%) |
| 65 to 74 Years | 0 (0.0%) | 40 (100.0%) |
| 75 Years and over | 6 (100.0%) | 10 (100.0%) |
| Total | 234 (62.2%) | 260 (47.3%) |
Income Below Poverty Among Married-Couple Families in Allen
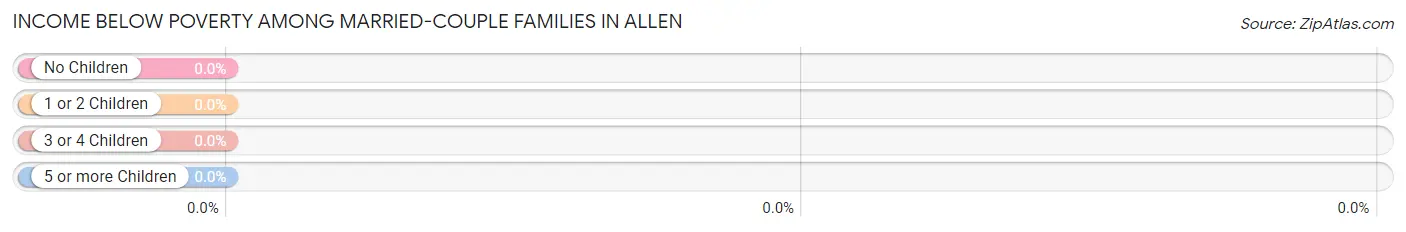
| Children | Above Poverty | Below Poverty |
| No Children | 10 (100.0%) | 0 (0.0%) |
| 1 or 2 Children | 0 (0.0%) | 0 (0.0%) |
| 3 or 4 Children | 0 (0.0%) | 0 (0.0%) |
| 5 or more Children | 18 (100.0%) | 0 (0.0%) |
| Total | 28 (100.0%) | 0 (0.0%) |
Income Below Poverty Among Single-Parent Households in Allen
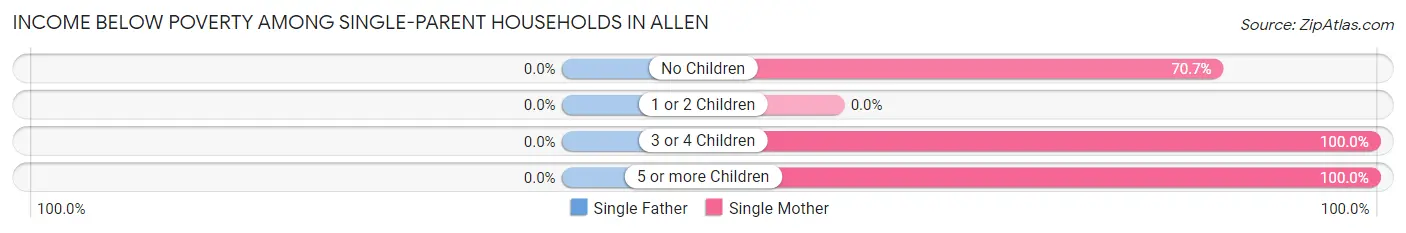
| Children | Single Father | Single Mother |
| No Children | 0 (0.0%) | 29 (70.7%) |
| 1 or 2 Children | 0 (0.0%) | 0 (0.0%) |
| 3 or 4 Children | 0 (0.0%) | 27 (100.0%) |
| 5 or more Children | 0 (0.0%) | 14 (100.0%) |
| Total | 0 (0.0%) | 70 (69.3%) |
Income Below Poverty Among Married-Couple vs Single-Parent Households in Allen
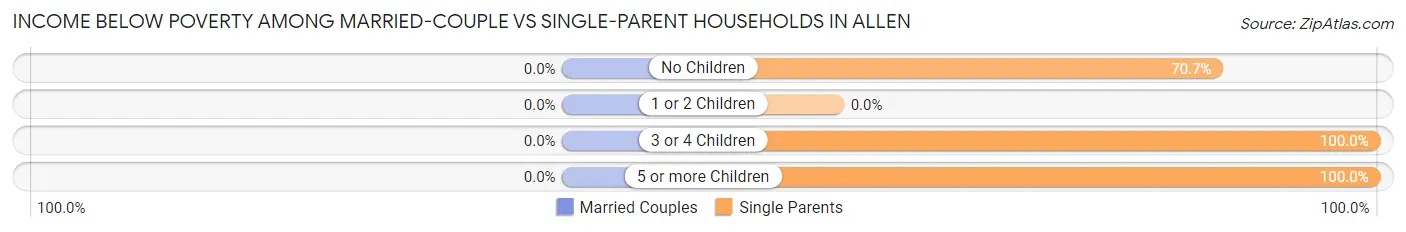
| Children | Married-Couple Families | Single-Parent Households |
| No Children | 0 (0.0%) | 29 (70.7%) |
| 1 or 2 Children | 0 (0.0%) | 0 (0.0%) |
| 3 or 4 Children | 0 (0.0%) | 27 (100.0%) |
| 5 or more Children | 0 (0.0%) | 14 (100.0%) |
| Total | 0 (0.0%) | 70 (69.3%) |
Race in Allen
The most populous races in Allen are Native / Alaskan (926 | 100.0%), and Hispanic or Latino (116 | 12.5%).
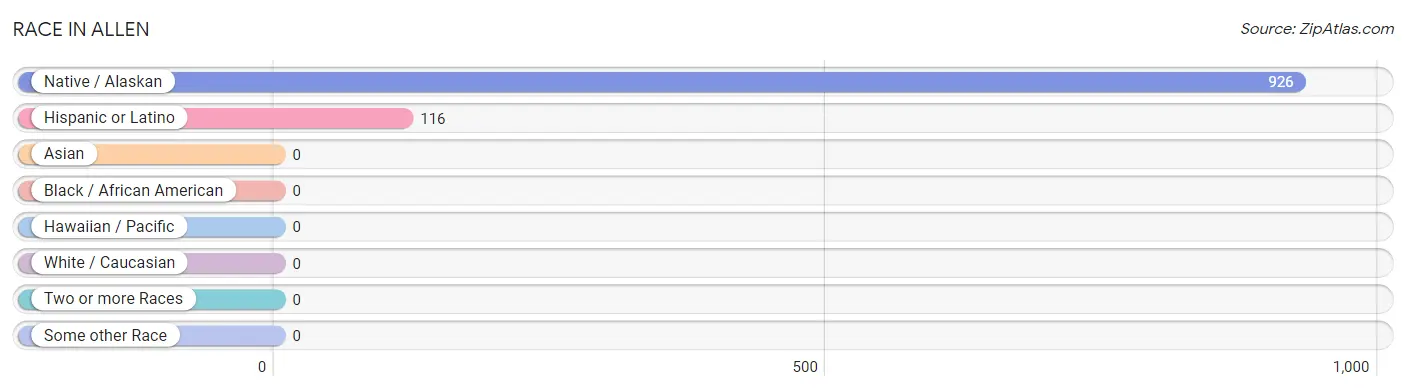
| Race | # Population | % Population |
| Asian | 0 | 0.0% |
| Black / African American | 0 | 0.0% |
| Hawaiian / Pacific | 0 | 0.0% |
| Hispanic or Latino | 116 | 12.5% |
| Native / Alaskan | 926 | 100.0% |
| White / Caucasian | 0 | 0.0% |
| Two or more Races | 0 | 0.0% |
| Some other Race | 0 | 0.0% |
| Total | 926 | 100.0% |
Ancestry in Allen
The most populous ancestries reported in Allen are Sioux (575 | 62.1%), Puerto Rican (116 | 12.5%), Crow (39 | 4.2%), and American (9 | 1.0%), together accounting for 79.8% of all Allen residents.
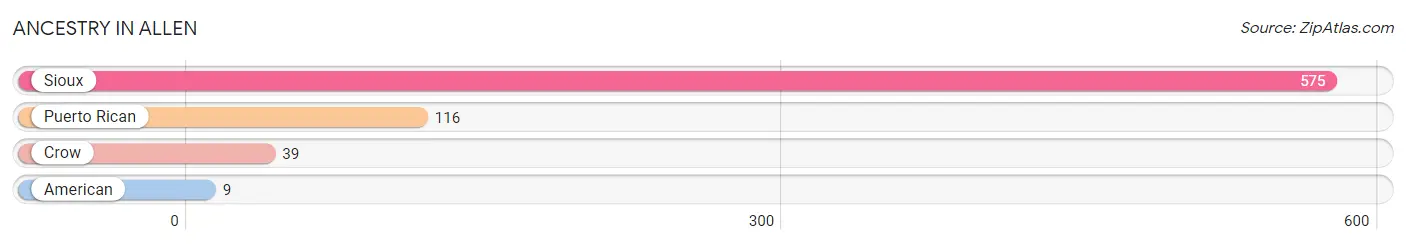
| Ancestry | # Population | % Population |
| American | 9 | 1.0% |
| Crow | 39 | 4.2% |
| Puerto Rican | 116 | 12.5% |
| Sioux | 575 | 62.1% | View All 4 Rows |
Immigrants in Allen

| Immigration Origin | # Population | % Population | View All 0 Rows |
Sex and Age in Allen
Sex and Age in Allen
The most populous age groups in Allen are 5 to 9 Years (117 | 31.1%) for men and 15 to 19 Years (112 | 20.4%) for women.
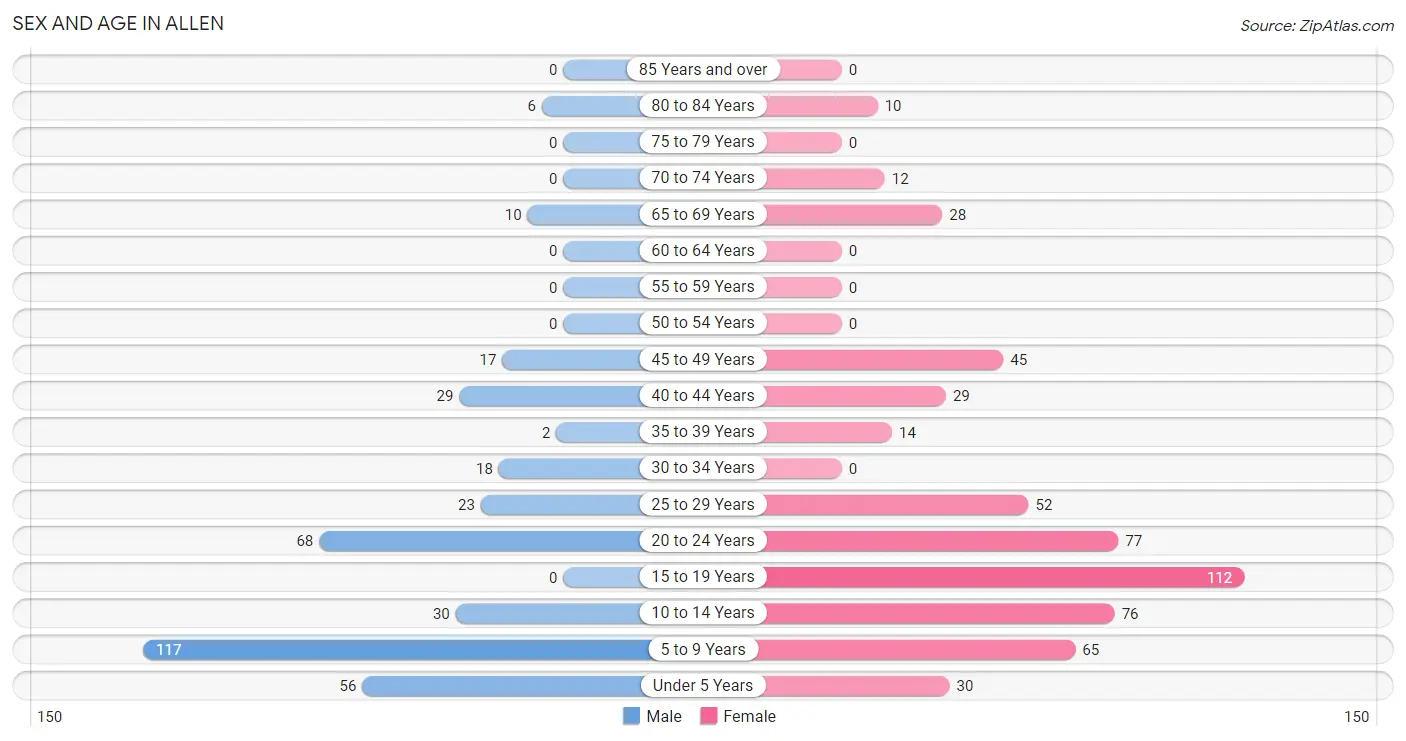
| Age Bracket | Male | Female |
| Under 5 Years | 56 (14.9%) | 30 (5.4%) |
| 5 to 9 Years | 117 (31.1%) | 65 (11.8%) |
| 10 to 14 Years | 30 (8.0%) | 76 (13.8%) |
| 15 to 19 Years | 0 (0.0%) | 112 (20.4%) |
| 20 to 24 Years | 68 (18.1%) | 77 (14.0%) |
| 25 to 29 Years | 23 (6.1%) | 52 (9.5%) |
| 30 to 34 Years | 18 (4.8%) | 0 (0.0%) |
| 35 to 39 Years | 2 (0.5%) | 14 (2.5%) |
| 40 to 44 Years | 29 (7.7%) | 29 (5.3%) |
| 45 to 49 Years | 17 (4.5%) | 45 (8.2%) |
| 50 to 54 Years | 0 (0.0%) | 0 (0.0%) |
| 55 to 59 Years | 0 (0.0%) | 0 (0.0%) |
| 60 to 64 Years | 0 (0.0%) | 0 (0.0%) |
| 65 to 69 Years | 10 (2.7%) | 28 (5.1%) |
| 70 to 74 Years | 0 (0.0%) | 12 (2.2%) |
| 75 to 79 Years | 0 (0.0%) | 0 (0.0%) |
| 80 to 84 Years | 6 (1.6%) | 10 (1.8%) |
| 85 Years and over | 0 (0.0%) | 0 (0.0%) |
| Total | 376 (100.0%) | 550 (100.0%) |
Families and Households in Allen
Median Family Size in Allen
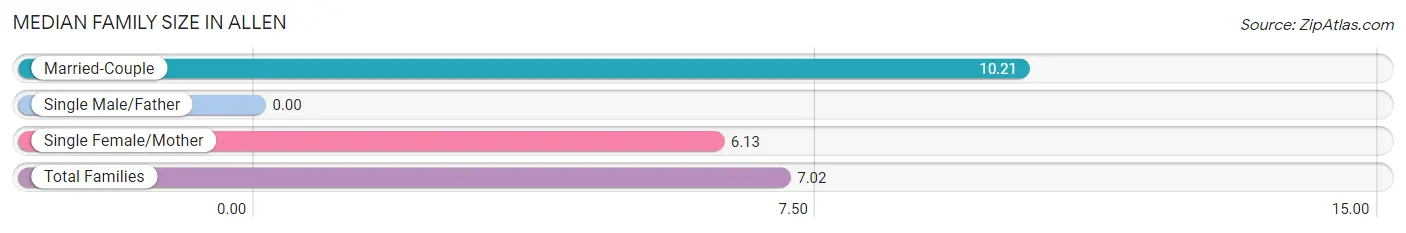
| Family Type | # Families | Family Size |
| Married-Couple | 28 (21.7%) | 10.21 |
| Single Male/Father | 0 (0.0%) | - |
| Single Female/Mother | 101 (78.3%) | 6.13 |
| Total Families | 129 (100.0%) | 7.02 |
Median Household Size in Allen
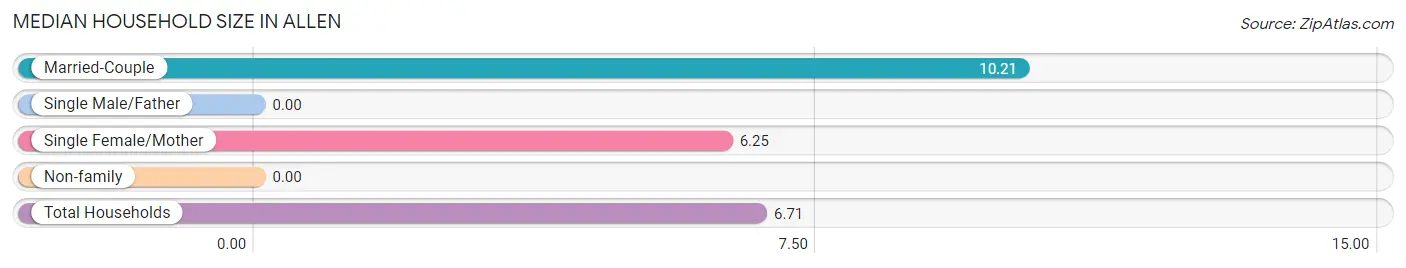
| Household Type | # Households | Household Size |
| Married-Couple | 28 (20.3%) | 10.21 |
| Single Male/Father | 0 (0.0%) | - |
| Single Female/Mother | 101 (73.2%) | 6.25 |
| Non-family | 9 (6.5%) | - |
| Total Households | 138 (100.0%) | 6.71 |
Household Size by Marriage Status in Allen
Out of a total of 138 households in Allen, 129 (93.5%) are family households, while 9 (6.5%) are nonfamily households. The most numerous type of family households are 3-person households, comprising 50, and the most common type of nonfamily households are 1-person households, comprising 9.
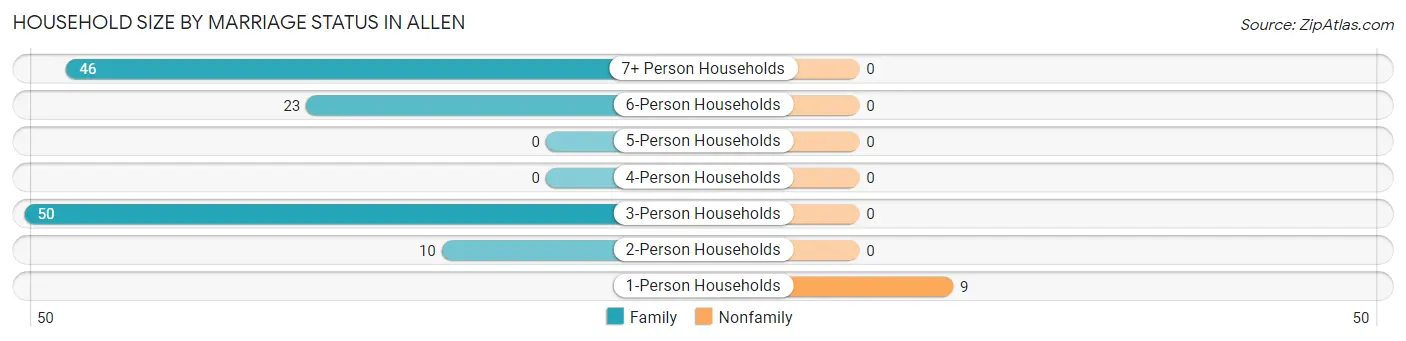
| Household Size | Family Households | Nonfamily Households |
| 1-Person Households | - | 9 (6.5%) |
| 2-Person Households | 10 (7.2%) | 0 (0.0%) |
| 3-Person Households | 50 (36.2%) | 0 (0.0%) |
| 4-Person Households | 0 (0.0%) | 0 (0.0%) |
| 5-Person Households | 0 (0.0%) | 0 (0.0%) |
| 6-Person Households | 23 (16.7%) | 0 (0.0%) |
| 7+ Person Households | 46 (33.3%) | 0 (0.0%) |
| Total | 129 (93.5%) | 9 (6.5%) |
Female Fertility in Allen
Fertility by Age in Allen
Average fertility rate in Allen is 9.0 births per 1,000 women. Women in the age bracket of 20 to 34 years have the highest fertility rate with 23.0 births per 1,000 women. Women in the age bracket of 20 to 34 years acount for 100.0% of all women with births.
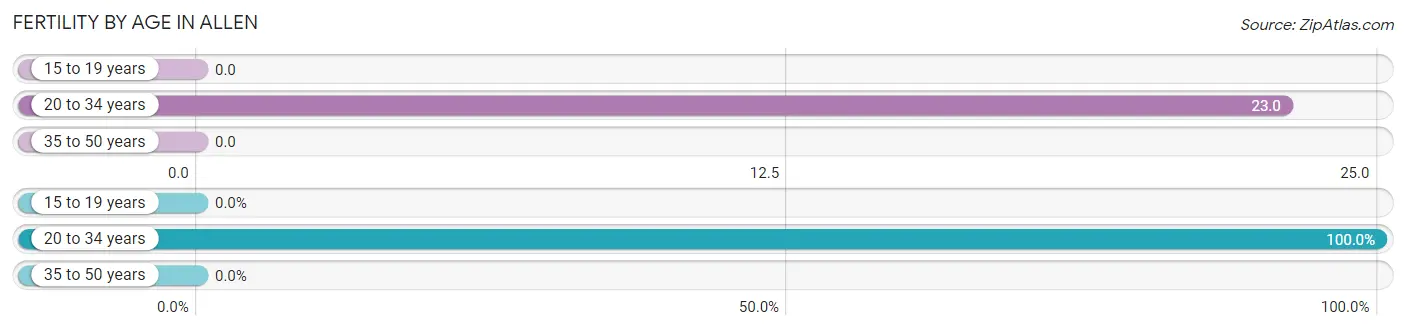
| Age Bracket | Women with Births | Births / 1,000 Women |
| 15 to 19 years | 0 (0.0%) | 0.0 |
| 20 to 34 years | 3 (100.0%) | 23.0 |
| 35 to 50 years | 0 (0.0%) | 0.0 |
| Total | 3 (100.0%) | 9.0 |
Fertility by Age by Marriage Status in Allen
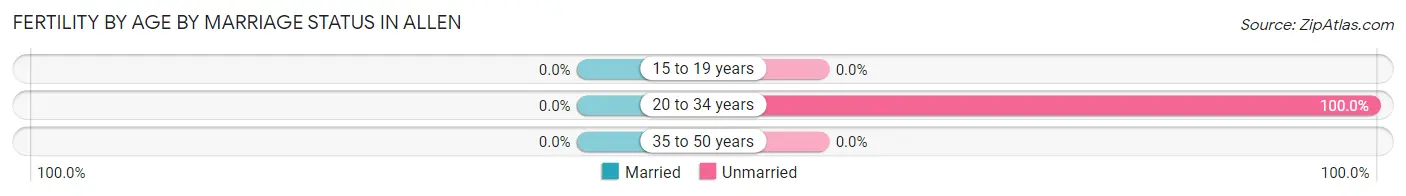
| Age Bracket | Married | Unmarried |
| 15 to 19 years | 0 (0.0%) | 0 (0.0%) |
| 20 to 34 years | 0 (0.0%) | 3 (100.0%) |
| 35 to 50 years | 0 (0.0%) | 0 (0.0%) |
| Total | 0 (0.0%) | 3 (100.0%) |
Fertility by Education in Allen
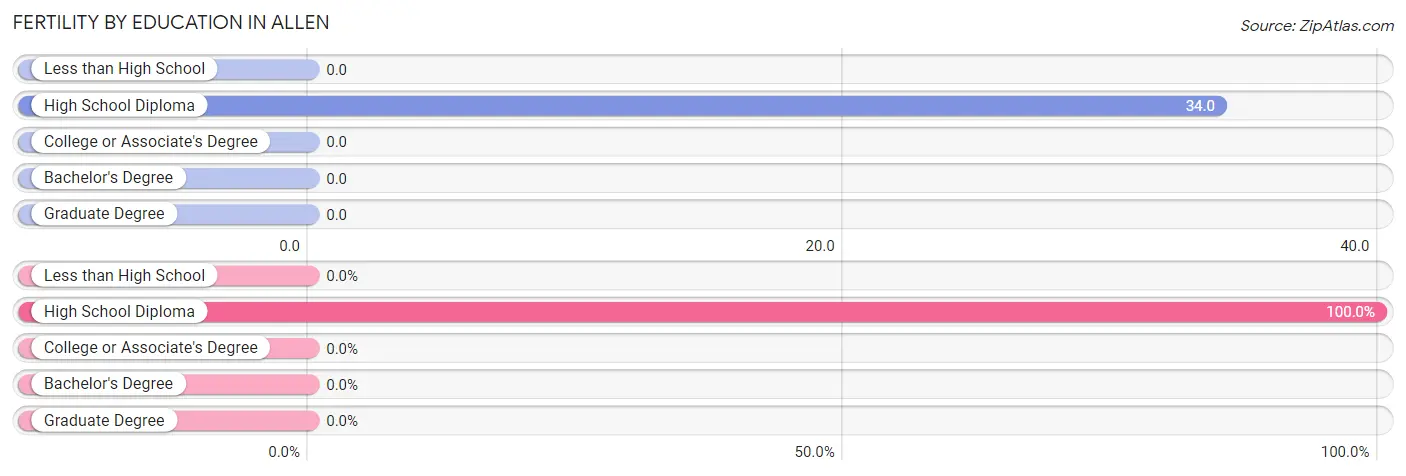
| Educational Attainment | Women with Births | Births / 1,000 Women |
| Less than High School | 0 (0.0%) | 0.0 |
| High School Diploma | 3 (100.0%) | 34.0 |
| College or Associate's Degree | 0 (0.0%) | 0.0 |
| Bachelor's Degree | 0 (0.0%) | 0.0 |
| Graduate Degree | 0 (0.0%) | 0.0 |
| Total | 3 (100.0%) | 9.0 |
Fertility by Education by Marriage Status in Allen
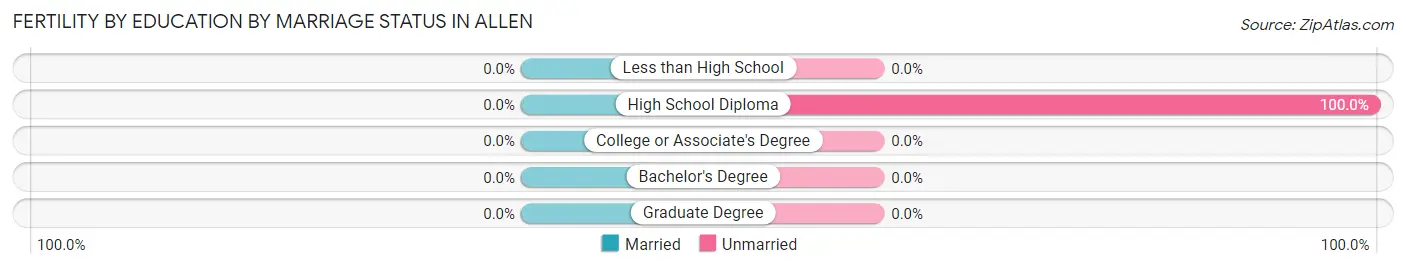
| Educational Attainment | Married | Unmarried |
| Less than High School | 0 (0.0%) | 0 (0.0%) |
| High School Diploma | 0 (0.0%) | 3 (100.0%) |
| College or Associate's Degree | 0 (0.0%) | 0 (0.0%) |
| Bachelor's Degree | 0 (0.0%) | 0 (0.0%) |
| Graduate Degree | 0 (0.0%) | 0 (0.0%) |
| Total | 0 (0.0%) | 3 (100.0%) |
Employment Characteristics in Allen
Employment by Class of Employer in Allen
Among the 117 employed individuals in Allen, local government employees (92 | 78.6%), and private company employees (25 | 21.4%) make up the most common classes of employment.
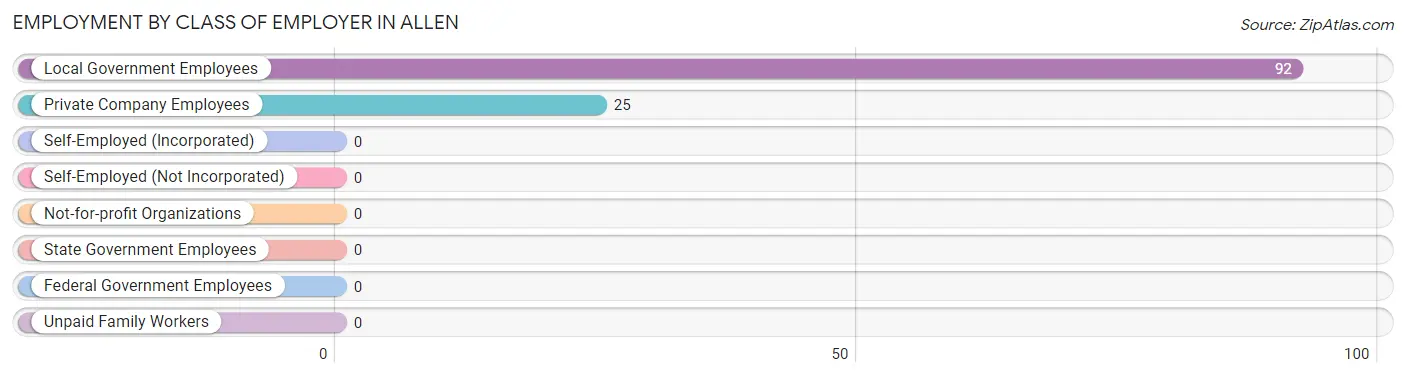
| Employer Class | # Employees | % Employees |
| Private Company Employees | 25 | 21.4% |
| Self-Employed (Incorporated) | 0 | 0.0% |
| Self-Employed (Not Incorporated) | 0 | 0.0% |
| Not-for-profit Organizations | 0 | 0.0% |
| Local Government Employees | 92 | 78.6% |
| State Government Employees | 0 | 0.0% |
| Federal Government Employees | 0 | 0.0% |
| Unpaid Family Workers | 0 | 0.0% |
| Total | 117 | 100.0% |
Employment Status by Age in Allen
According to the labor force statistics for Allen, out of the total population over 16 years of age (482), 28.0% or 135 individuals are in the labor force, with 13.3% or 18 of them unemployed. The age group with the highest labor force participation rate is 25 to 29 years, with 73.3% or 55 individuals in the labor force. Within the labor force, the 25 to 29 years age range has the highest percentage of unemployed individuals, with 32.7% or 18 of them being unemployed.
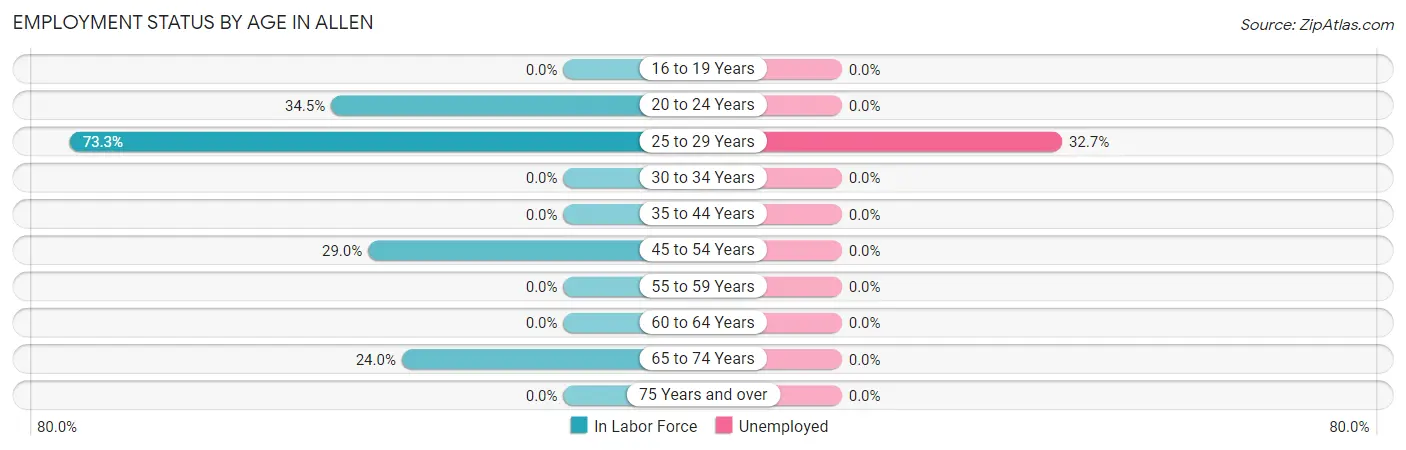
| Age Bracket | In Labor Force | Unemployed |
| 16 to 19 Years | 0 (0.0%) | 0 (0.0%) |
| 20 to 24 Years | 50 (34.5%) | 0 (0.0%) |
| 25 to 29 Years | 55 (73.3%) | 18 (32.7%) |
| 30 to 34 Years | 0 (0.0%) | 0 (0.0%) |
| 35 to 44 Years | 0 (0.0%) | 0 (0.0%) |
| 45 to 54 Years | 18 (29.0%) | 0 (0.0%) |
| 55 to 59 Years | 0 (0.0%) | 0 (0.0%) |
| 60 to 64 Years | 0 (0.0%) | 0 (0.0%) |
| 65 to 74 Years | 12 (24.0%) | 0 (0.0%) |
| 75 Years and over | 0 (0.0%) | 0 (0.0%) |
| Total | 135 (28.0%) | 18 (13.3%) |
Employment Status by Educational Attainment in Allen
According to labor force statistics for Allen, 31.9% of individuals (73) out of the total population between 25 and 64 years of age (229) are in the labor force, with 24.7% or 18 of them being unemployed. The group with the highest labor force participation rate are those with the educational attainment of college / associate degree, with 39.1% or 36 individuals in the labor force. Within the labor force, individuals with college / associate degree education have the highest percentage of unemployment, with 50.0% or 18 of them being unemployed.
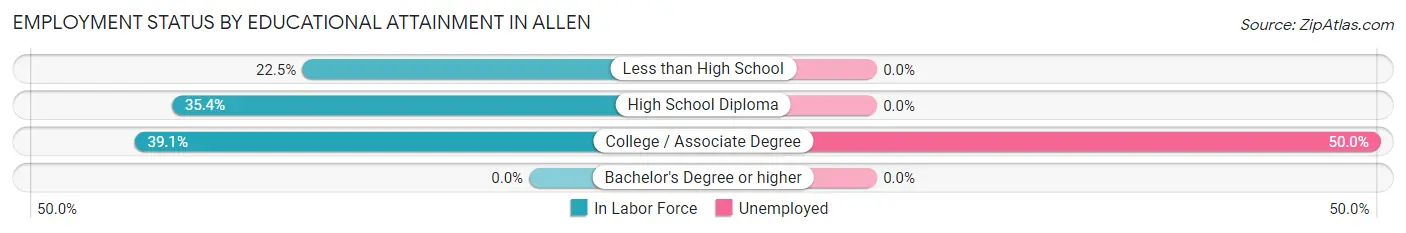
| Educational Attainment | In Labor Force | Unemployed |
| Less than High School | 20 (22.5%) | 0 (0.0%) |
| High School Diploma | 17 (35.4%) | 0 (0.0%) |
| College / Associate Degree | 36 (39.1%) | 46 (50.0%) |
| Bachelor's Degree or higher | 0 (0.0%) | 0 (0.0%) |
| Total | 73 (31.9%) | 57 (24.7%) |
Employment Occupations by Sex in Allen
Management, Business, Science and Arts Occupations
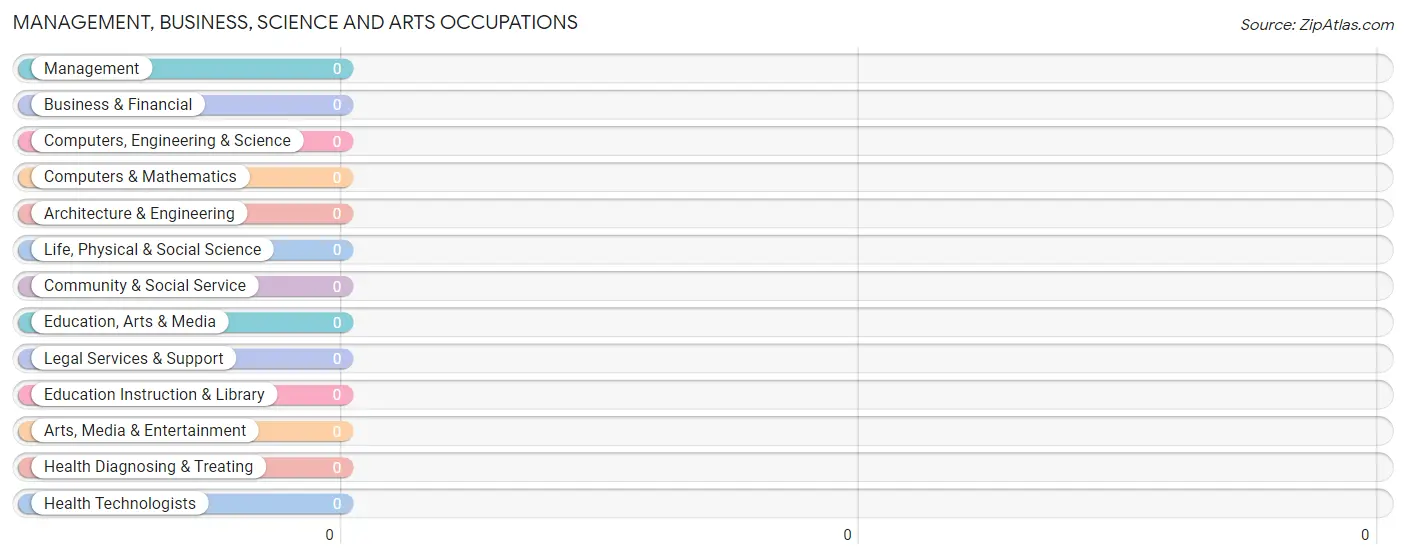
Management, Business, Science and Arts Occupations by Sex
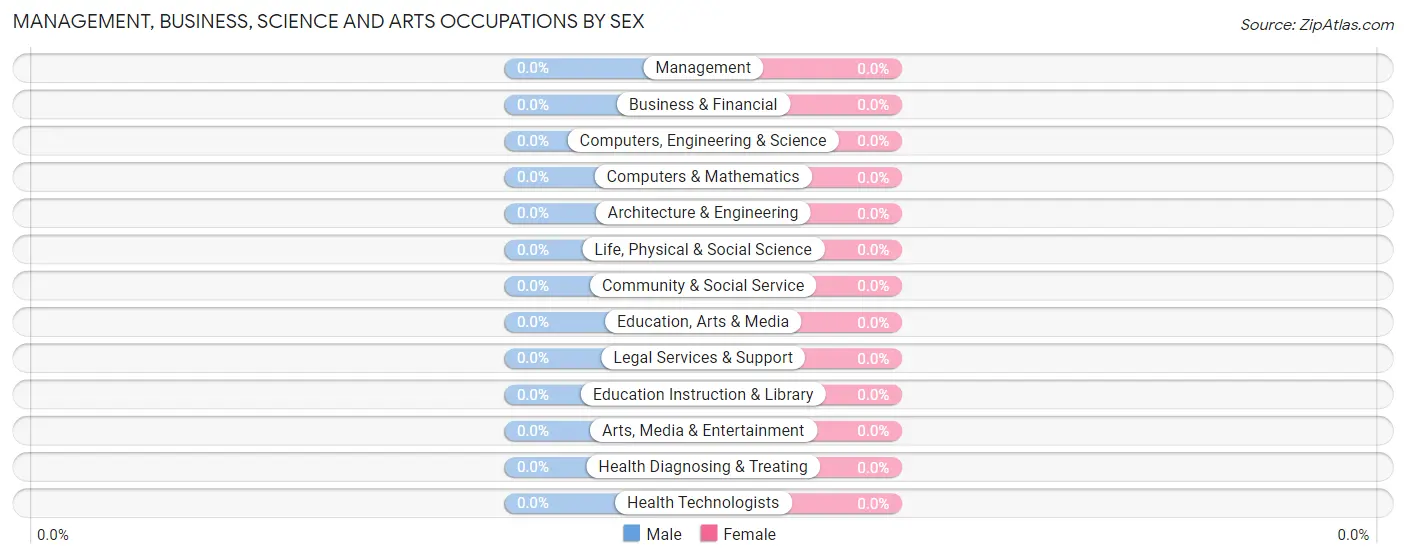
| Occupation | Male | Female |
| Management | 0 (0.0%) | 0 (0.0%) |
| Business & Financial | 0 (0.0%) | 0 (0.0%) |
| Computers, Engineering & Science | 0 (0.0%) | 0 (0.0%) |
| Computers & Mathematics | 0 (0.0%) | 0 (0.0%) |
| Architecture & Engineering | 0 (0.0%) | 0 (0.0%) |
| Life, Physical & Social Science | 0 (0.0%) | 0 (0.0%) |
| Community & Social Service | 0 (0.0%) | 0 (0.0%) |
| Education, Arts & Media | 0 (0.0%) | 0 (0.0%) |
| Legal Services & Support | 0 (0.0%) | 0 (0.0%) |
| Education Instruction & Library | 0 (0.0%) | 0 (0.0%) |
| Arts, Media & Entertainment | 0 (0.0%) | 0 (0.0%) |
| Health Diagnosing & Treating | 0 (0.0%) | 0 (0.0%) |
| Health Technologists | 0 (0.0%) | 0 (0.0%) |
| Total (Category) | 0 (0.0%) | 0 (0.0%) |
| Total (Overall) | 70 (59.8%) | 47 (40.2%) |
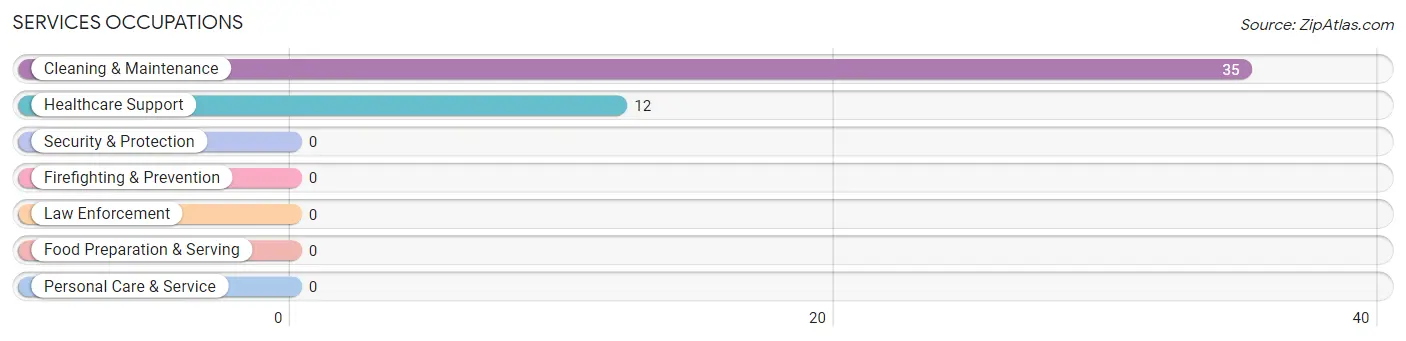
Services Occupations
The most common Services occupations in Allen are Cleaning & Maintenance (35 | 29.9%), and Healthcare Support (12 | 10.3%).
Services Occupations by Sex
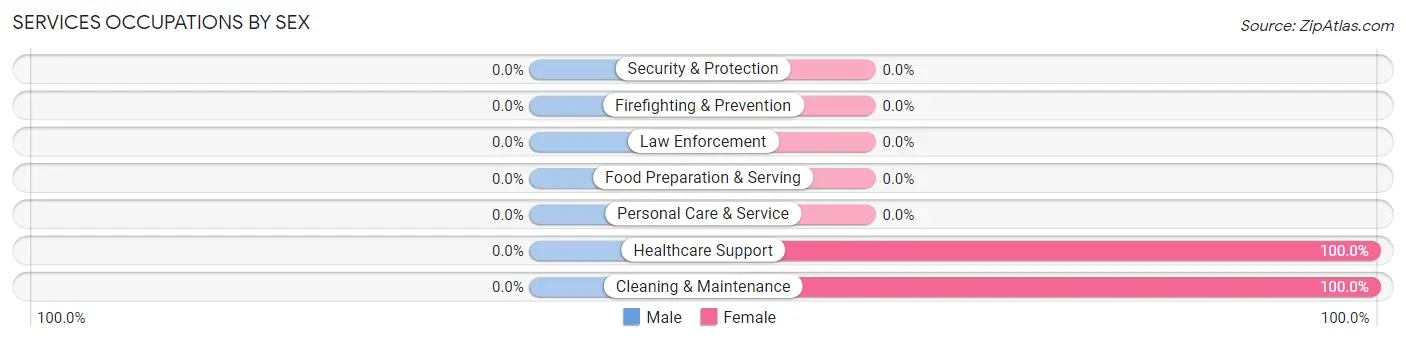
| Occupation | Male | Female |
| Healthcare Support | 0 (0.0%) | 12 (100.0%) |
| Security & Protection | 0 (0.0%) | 0 (0.0%) |
| Firefighting & Prevention | 0 (0.0%) | 0 (0.0%) |
| Law Enforcement | 0 (0.0%) | 0 (0.0%) |
| Food Preparation & Serving | 0 (0.0%) | 0 (0.0%) |
| Cleaning & Maintenance | 0 (0.0%) | 35 (100.0%) |
| Personal Care & Service | 0 (0.0%) | 0 (0.0%) |
| Total (Category) | 0 (0.0%) | 47 (100.0%) |
| Total (Overall) | 70 (59.8%) | 47 (40.2%) |
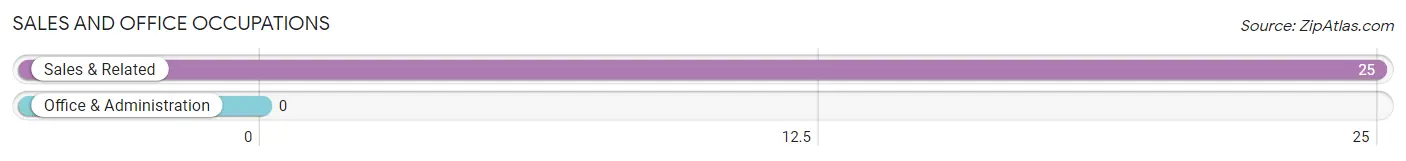
Sales and Office Occupations
The most common Sales and Office occupations in Allen are , and Sales & Related (25 | 21.4%).
Sales and Office Occupations by Sex
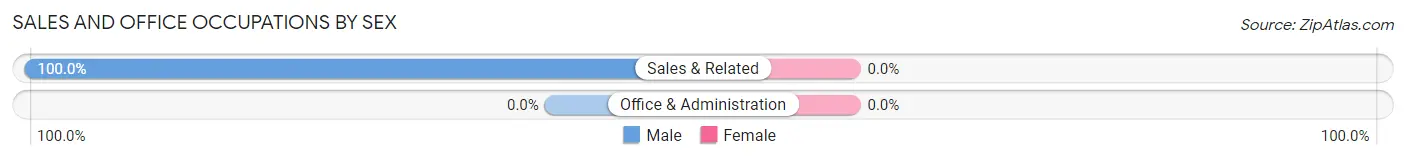
| Occupation | Male | Female |
| Sales & Related | 25 (100.0%) | 0 (0.0%) |
| Office & Administration | 0 (0.0%) | 0 (0.0%) |
| Total (Category) | 25 (100.0%) | 0 (0.0%) |
| Total (Overall) | 70 (59.8%) | 47 (40.2%) |
Natural Resources, Construction and Maintenance Occupations
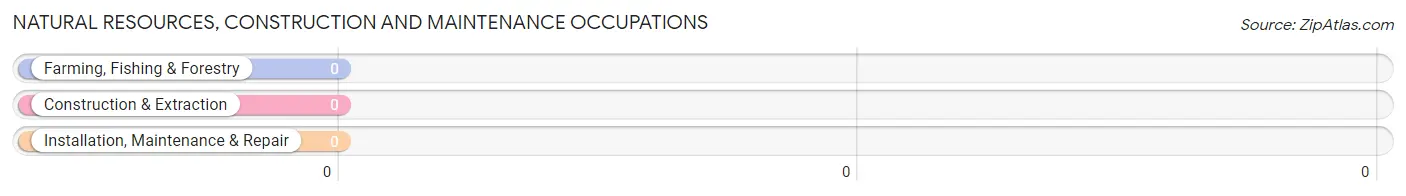
Natural Resources, Construction and Maintenance Occupations by Sex
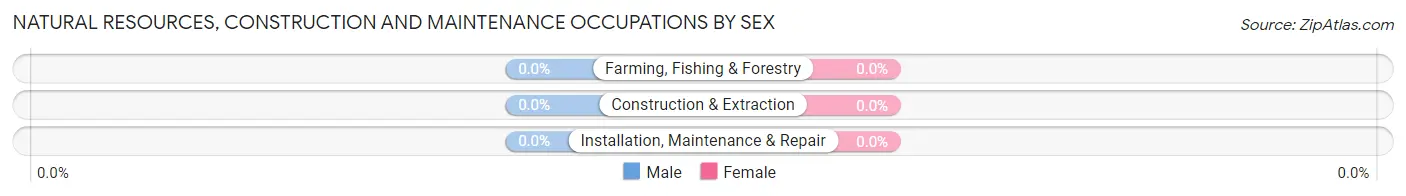
| Occupation | Male | Female |
| Farming, Fishing & Forestry | 0 (0.0%) | 0 (0.0%) |
| Construction & Extraction | 0 (0.0%) | 0 (0.0%) |
| Installation, Maintenance & Repair | 0 (0.0%) | 0 (0.0%) |
| Total (Category) | 0 (0.0%) | 0 (0.0%) |
| Total (Overall) | 70 (59.8%) | 47 (40.2%) |
Production, Transportation and Moving Occupations
The most common Production, Transportation and Moving occupations in Allen are Production (25 | 21.4%), and Material Moving (20 | 17.1%).
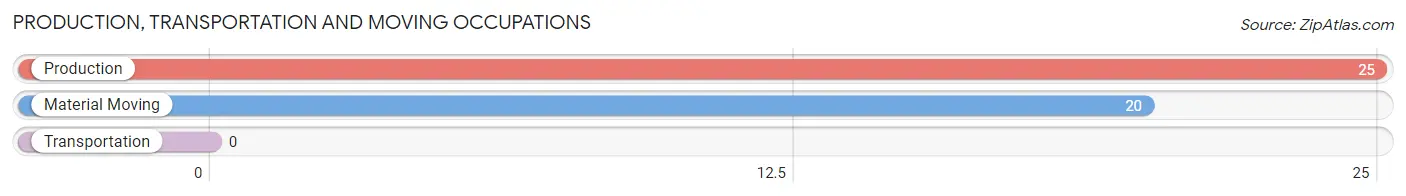
Production, Transportation and Moving Occupations by Sex
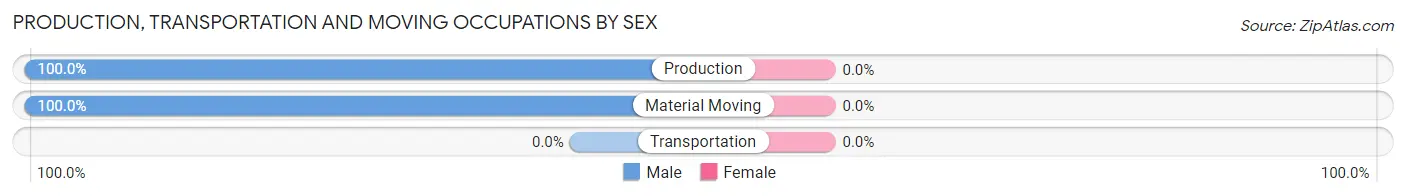
| Occupation | Male | Female |
| Production | 25 (100.0%) | 0 (0.0%) |
| Transportation | 0 (0.0%) | 0 (0.0%) |
| Material Moving | 20 (100.0%) | 0 (0.0%) |
| Total (Category) | 45 (100.0%) | 0 (0.0%) |
| Total (Overall) | 70 (59.8%) | 47 (40.2%) |
Employment Industries by Sex in Allen
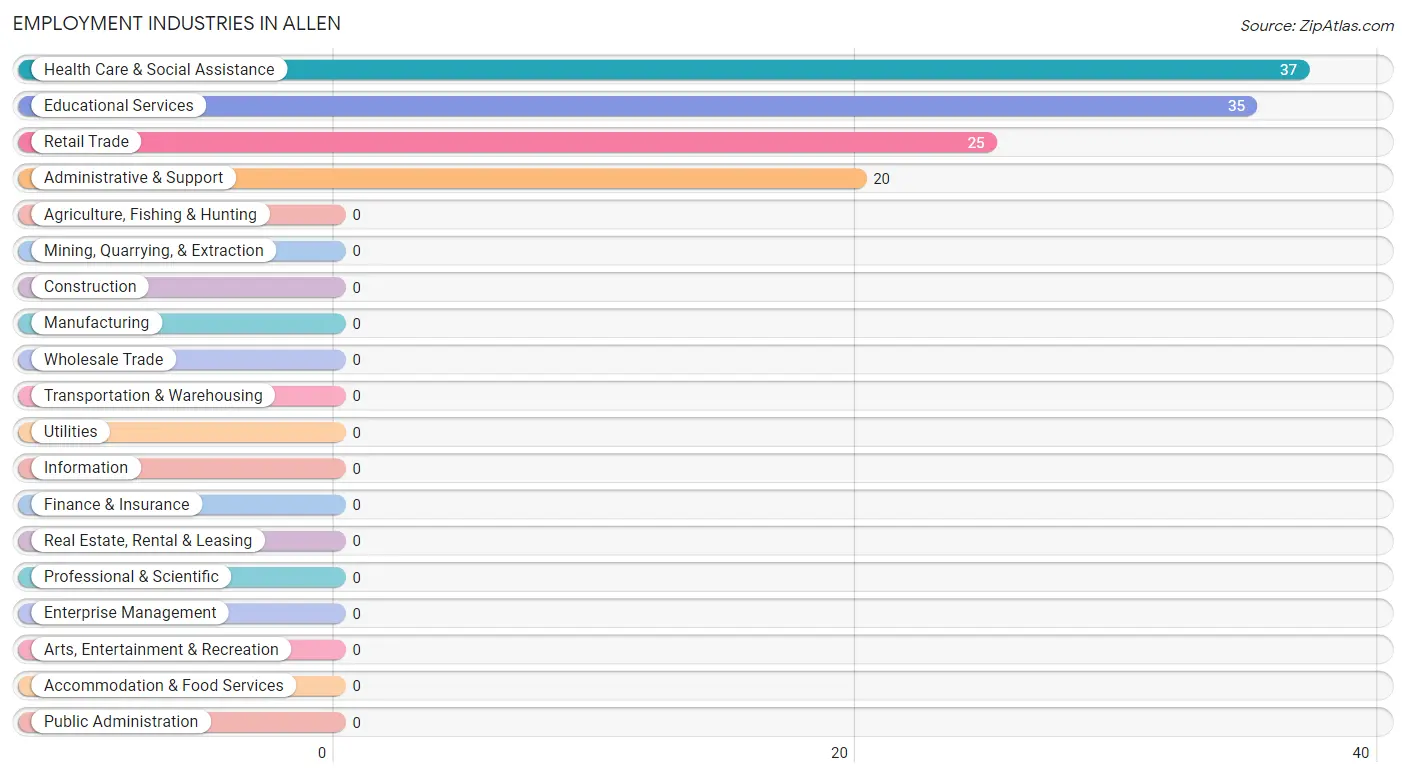
Employment Industries in Allen
The major employment industries in Allen include Health Care & Social Assistance (37 | 31.6%), Educational Services (35 | 29.9%), Retail Trade (25 | 21.4%), and Administrative & Support (20 | 17.1%).
Employment Industries by Sex in Allen
The Allen industries that see more men than women are Retail Trade (100.0%), Administrative & Support (100.0%), and Health Care & Social Assistance (67.6%), whereas the industries that tend to have a higher number of women are Educational Services (100.0%), and Health Care & Social Assistance (32.4%).
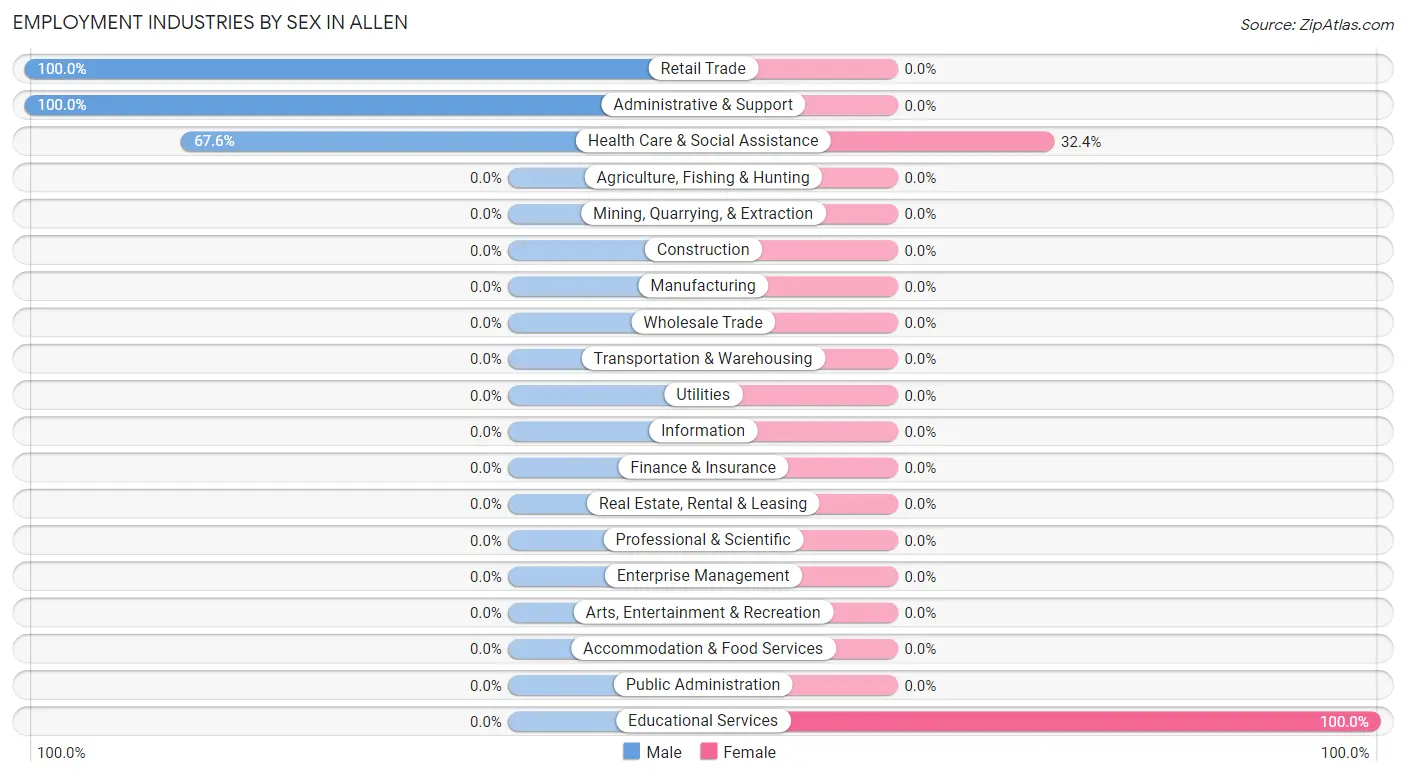
| Industry | Male | Female |
| Agriculture, Fishing & Hunting | 0 (0.0%) | 0 (0.0%) |
| Mining, Quarrying, & Extraction | 0 (0.0%) | 0 (0.0%) |
| Construction | 0 (0.0%) | 0 (0.0%) |
| Manufacturing | 0 (0.0%) | 0 (0.0%) |
| Wholesale Trade | 0 (0.0%) | 0 (0.0%) |
| Retail Trade | 25 (100.0%) | 0 (0.0%) |
| Transportation & Warehousing | 0 (0.0%) | 0 (0.0%) |
| Utilities | 0 (0.0%) | 0 (0.0%) |
| Information | 0 (0.0%) | 0 (0.0%) |
| Finance & Insurance | 0 (0.0%) | 0 (0.0%) |
| Real Estate, Rental & Leasing | 0 (0.0%) | 0 (0.0%) |
| Professional & Scientific | 0 (0.0%) | 0 (0.0%) |
| Enterprise Management | 0 (0.0%) | 0 (0.0%) |
| Administrative & Support | 20 (100.0%) | 0 (0.0%) |
| Educational Services | 0 (0.0%) | 35 (100.0%) |
| Health Care & Social Assistance | 25 (67.6%) | 12 (32.4%) |
| Arts, Entertainment & Recreation | 0 (0.0%) | 0 (0.0%) |
| Accommodation & Food Services | 0 (0.0%) | 0 (0.0%) |
| Public Administration | 0 (0.0%) | 0 (0.0%) |
| Total | 70 (59.8%) | 47 (40.2%) |
Education in Allen
School Enrollment in Allen
The most common levels of schooling among the 384 students in Allen are elementary school (154 | 40.1%), middle school (106 | 27.6%), and high school (96 | 25.0%).
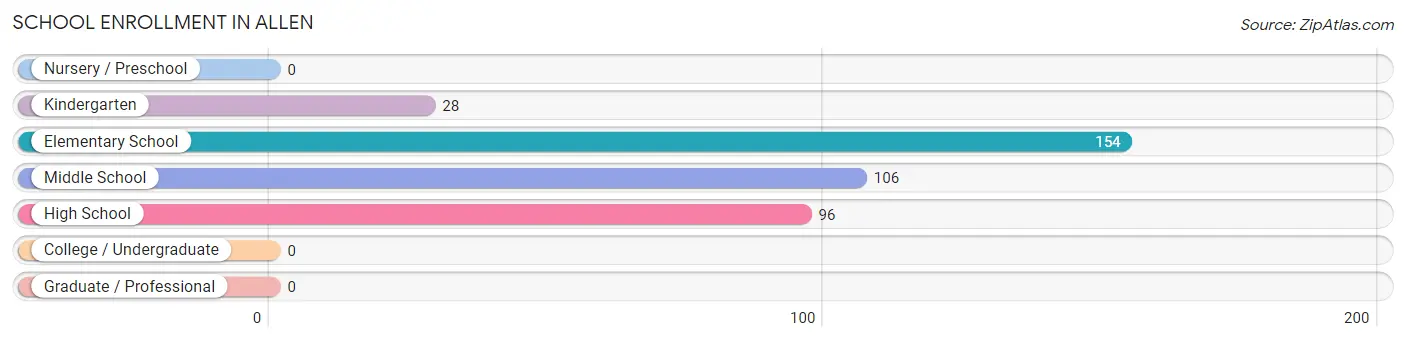
| School Level | # Students | % Students |
| Nursery / Preschool | 0 | 0.0% |
| Kindergarten | 28 | 7.3% |
| Elementary School | 154 | 40.1% |
| Middle School | 106 | 27.6% |
| High School | 96 | 25.0% |
| College / Undergraduate | 0 | 0.0% |
| Graduate / Professional | 0 | 0.0% |
| Total | 384 | 100.0% |
School Enrollment by Age by Funding Source in Allen
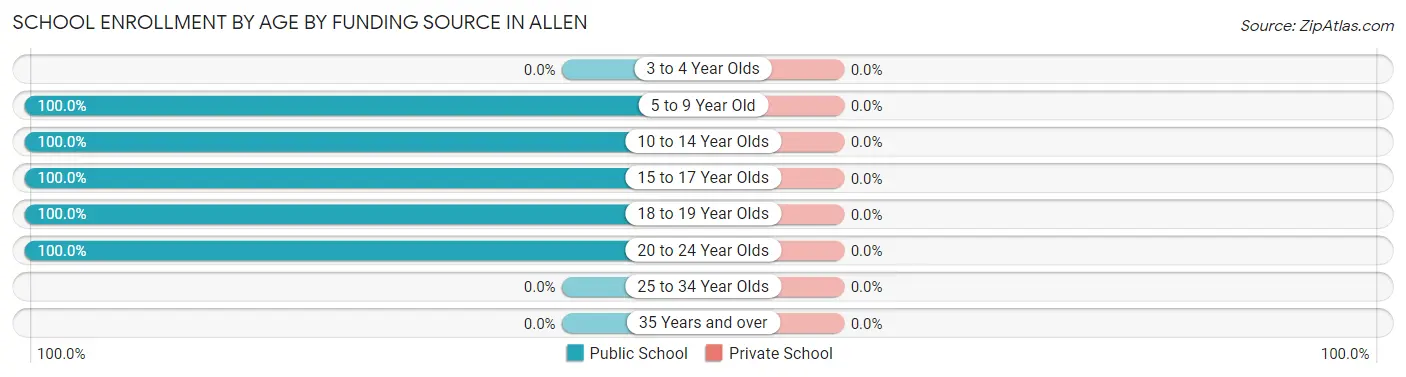
| Age Bracket | Public School | Private School |
| 3 to 4 Year Olds | 0 (0.0%) | 0 (0.0%) |
| 5 to 9 Year Old | 182 (100.0%) | 0 (0.0%) |
| 10 to 14 Year Olds | 106 (100.0%) | 0 (0.0%) |
| 15 to 17 Year Olds | 66 (100.0%) | 0 (0.0%) |
| 18 to 19 Year Olds | 11 (100.0%) | 0 (0.0%) |
| 20 to 24 Year Olds | 19 (100.0%) | 0 (0.0%) |
| 25 to 34 Year Olds | 0 (0.0%) | 0 (0.0%) |
| 35 Years and over | 0 (0.0%) | 0 (0.0%) |
| Total | 384 (100.0%) | 0 (0.0%) |
Educational Attainment by Field of Study in Allen
| Field of Study | # Graduates | % Graduates |
| Computers & Mathematics | 0 | 0.0% |
| Bio, Nature & Agricultural | 0 | 0.0% |
| Physical & Health Sciences | 0 | 0.0% |
| Psychology | 0 | 0.0% |
| Social Sciences | 0 | 0.0% |
| Engineering | 0 | 0.0% |
| Multidisciplinary Studies | 0 | 0.0% |
| Science & Technology | 0 | 0.0% |
| Business | 0 | 0.0% |
| Education | 0 | 0.0% |
| Literature & Languages | 0 | 0.0% |
| Liberal Arts & History | 0 | 0.0% |
| Visual & Performing Arts | 0 | 0.0% |
| Communications | 0 | 0.0% |
| Arts & Humanities | 0 | 0.0% |
| Total | 0 | 0.0% |
Transportation & Commute in Allen
Vehicle Availability by Sex in Allen
The most prevalent vehicle ownership categories in Allen are males with 1 vehicle (50, accounting for 71.4%) and females with 1 vehicle (35, making up 106.4%).
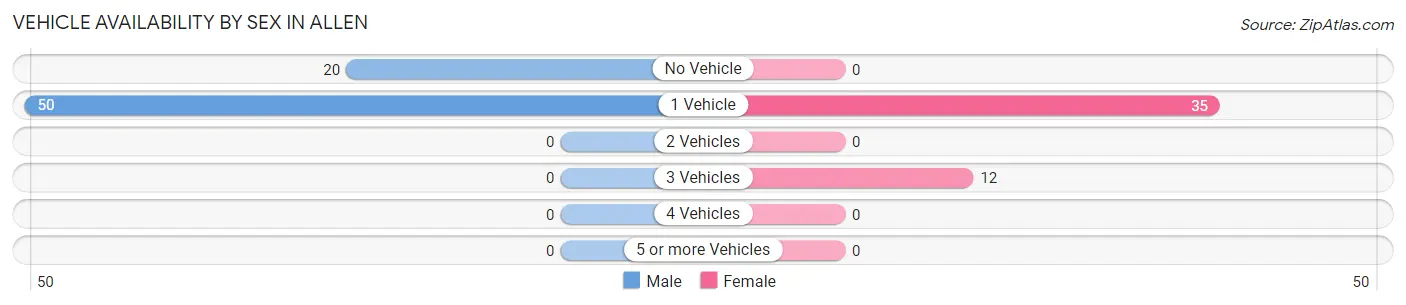
| Vehicles Available | Male | Female |
| No Vehicle | 20 (28.6%) | 0 (0.0%) |
| 1 Vehicle | 50 (71.4%) | 35 (74.5%) |
| 2 Vehicles | 0 (0.0%) | 0 (0.0%) |
| 3 Vehicles | 0 (0.0%) | 12 (25.5%) |
| 4 Vehicles | 0 (0.0%) | 0 (0.0%) |
| 5 or more Vehicles | 0 (0.0%) | 0 (0.0%) |
| Total | 70 (100.0%) | 47 (100.0%) |
Commute Time in Allen
The most frequently occuring commute durations in Allen are 5 to 9 minutes (80 commuters, 68.4%), 25 to 29 minutes (25 commuters, 21.4%), and less than 5 minutes (12 commuters, 10.3%).
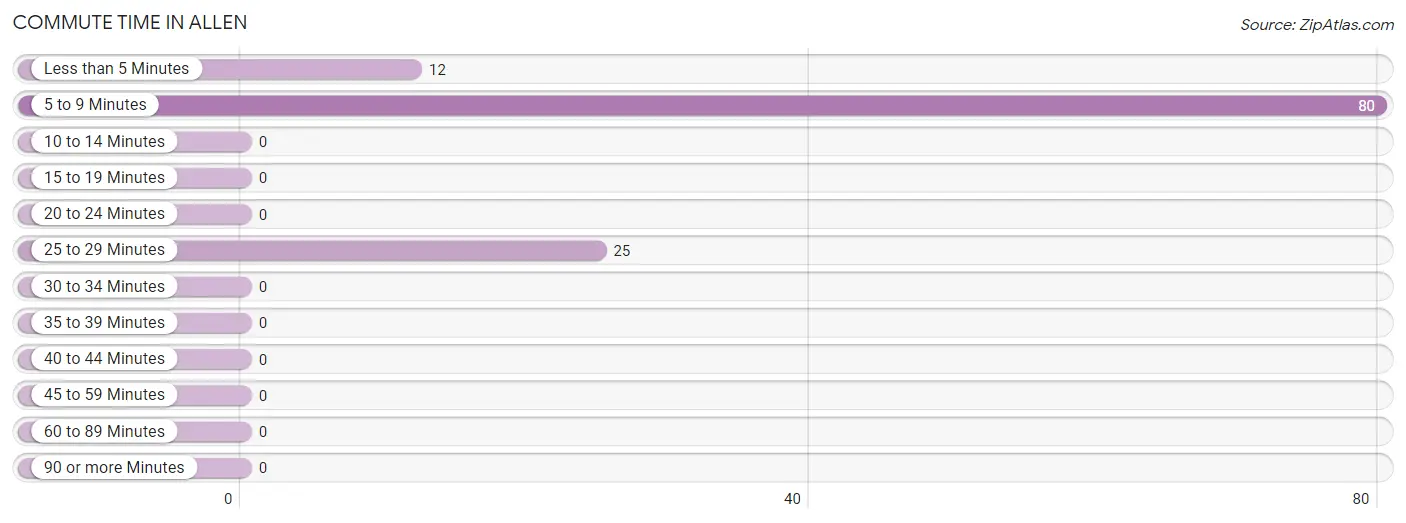
| Commute Time | # Commuters | % Commuters |
| Less than 5 Minutes | 12 | 10.3% |
| 5 to 9 Minutes | 80 | 68.4% |
| 10 to 14 Minutes | 0 | 0.0% |
| 15 to 19 Minutes | 0 | 0.0% |
| 20 to 24 Minutes | 0 | 0.0% |
| 25 to 29 Minutes | 25 | 21.4% |
| 30 to 34 Minutes | 0 | 0.0% |
| 35 to 39 Minutes | 0 | 0.0% |
| 40 to 44 Minutes | 0 | 0.0% |
| 45 to 59 Minutes | 0 | 0.0% |
| 60 to 89 Minutes | 0 | 0.0% |
| 90 or more Minutes | 0 | 0.0% |
Commute Time by Sex in Allen
The most common commute times in Allen are 5 to 9 minutes (45 commuters, 64.3%) for males and 5 to 9 minutes (35 commuters, 74.5%) for females.
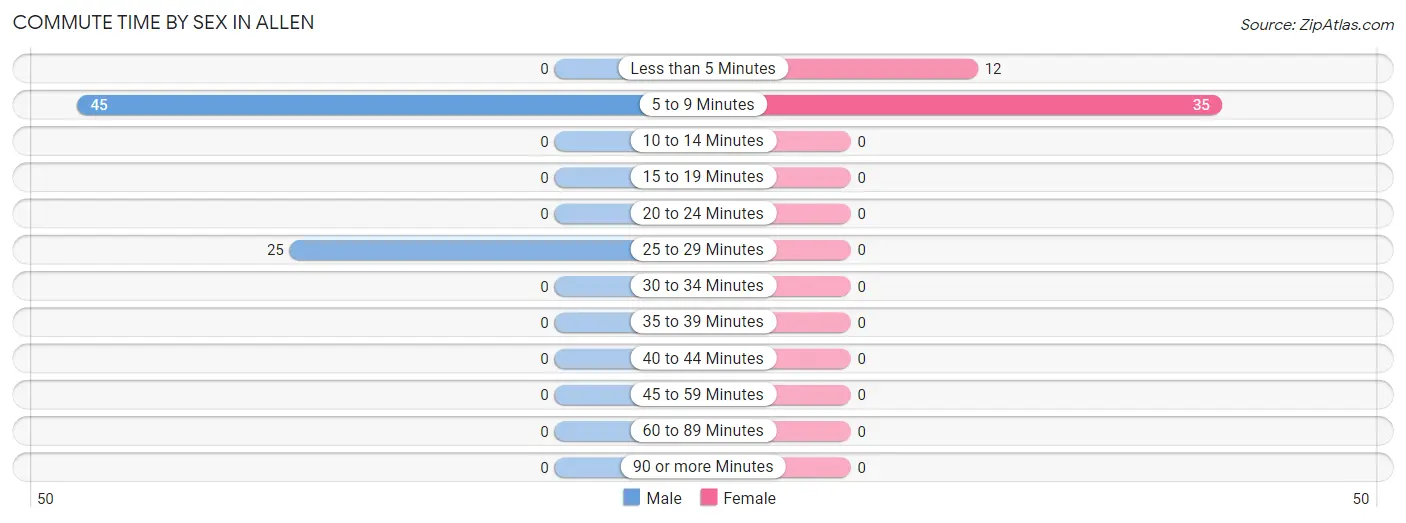
| Commute Time | Male | Female |
| Less than 5 Minutes | 0 (0.0%) | 12 (25.5%) |
| 5 to 9 Minutes | 45 (64.3%) | 35 (74.5%) |
| 10 to 14 Minutes | 0 (0.0%) | 0 (0.0%) |
| 15 to 19 Minutes | 0 (0.0%) | 0 (0.0%) |
| 20 to 24 Minutes | 0 (0.0%) | 0 (0.0%) |
| 25 to 29 Minutes | 25 (35.7%) | 0 (0.0%) |
| 30 to 34 Minutes | 0 (0.0%) | 0 (0.0%) |
| 35 to 39 Minutes | 0 (0.0%) | 0 (0.0%) |
| 40 to 44 Minutes | 0 (0.0%) | 0 (0.0%) |
| 45 to 59 Minutes | 0 (0.0%) | 0 (0.0%) |
| 60 to 89 Minutes | 0 (0.0%) | 0 (0.0%) |
| 90 or more Minutes | 0 (0.0%) | 0 (0.0%) |
Time of Departure to Work by Sex in Allen
The most frequent times of departure to work in Allen are 7:00 AM to 7:29 AM (50, 71.4%) for males and 6:30 AM to 6:59 AM (18, 38.3%) for females.
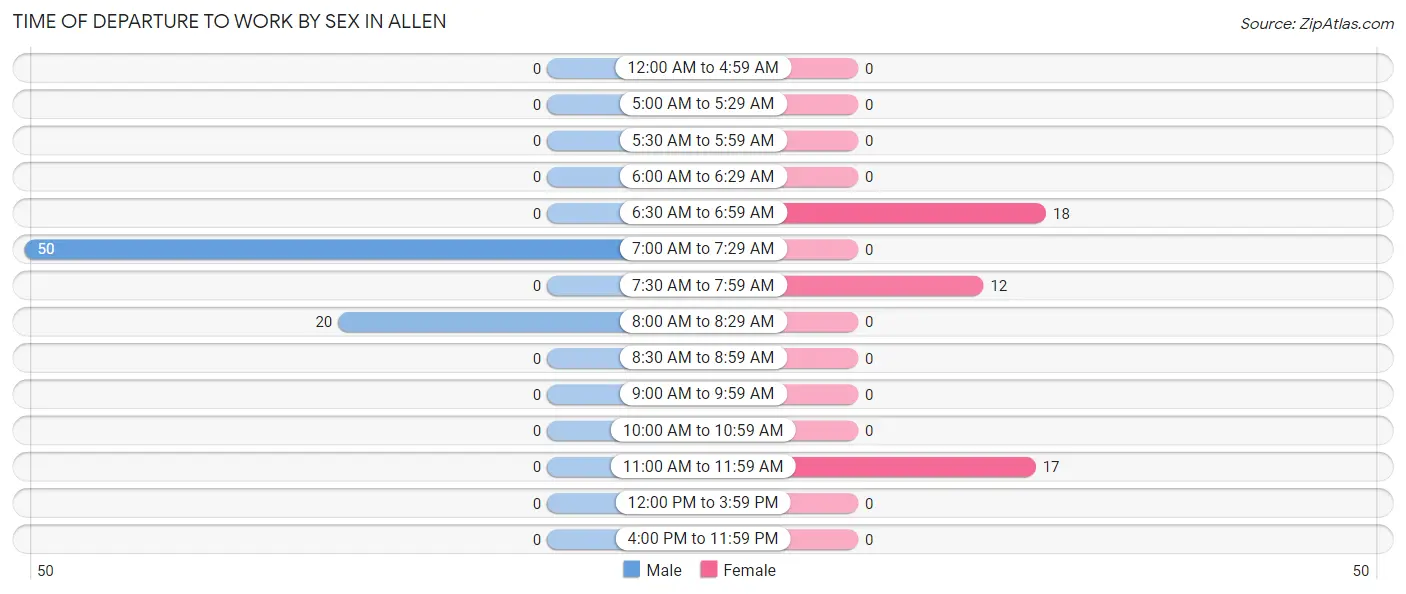
| Time of Departure | Male | Female |
| 12:00 AM to 4:59 AM | 0 (0.0%) | 0 (0.0%) |
| 5:00 AM to 5:29 AM | 0 (0.0%) | 0 (0.0%) |
| 5:30 AM to 5:59 AM | 0 (0.0%) | 0 (0.0%) |
| 6:00 AM to 6:29 AM | 0 (0.0%) | 0 (0.0%) |
| 6:30 AM to 6:59 AM | 0 (0.0%) | 18 (38.3%) |
| 7:00 AM to 7:29 AM | 50 (71.4%) | 0 (0.0%) |
| 7:30 AM to 7:59 AM | 0 (0.0%) | 12 (25.5%) |
| 8:00 AM to 8:29 AM | 20 (28.6%) | 0 (0.0%) |
| 8:30 AM to 8:59 AM | 0 (0.0%) | 0 (0.0%) |
| 9:00 AM to 9:59 AM | 0 (0.0%) | 0 (0.0%) |
| 10:00 AM to 10:59 AM | 0 (0.0%) | 0 (0.0%) |
| 11:00 AM to 11:59 AM | 0 (0.0%) | 17 (36.2%) |
| 12:00 PM to 3:59 PM | 0 (0.0%) | 0 (0.0%) |
| 4:00 PM to 11:59 PM | 0 (0.0%) | 0 (0.0%) |
| Total | 70 (100.0%) | 47 (100.0%) |
Housing Occupancy in Allen
Occupancy by Ownership in Allen
Of the total 138 dwellings in Allen, owner-occupied units account for 10 (7.2%), while renter-occupied units make up 128 (92.7%).
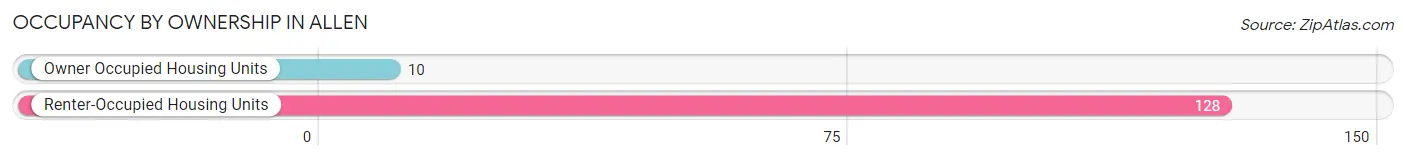
| Occupancy | # Housing Units | % Housing Units |
| Owner Occupied Housing Units | 10 | 7.2% |
| Renter-Occupied Housing Units | 128 | 92.7% |
| Total Occupied Housing Units | 138 | 100.0% |
Occupancy by Household Size in Allen
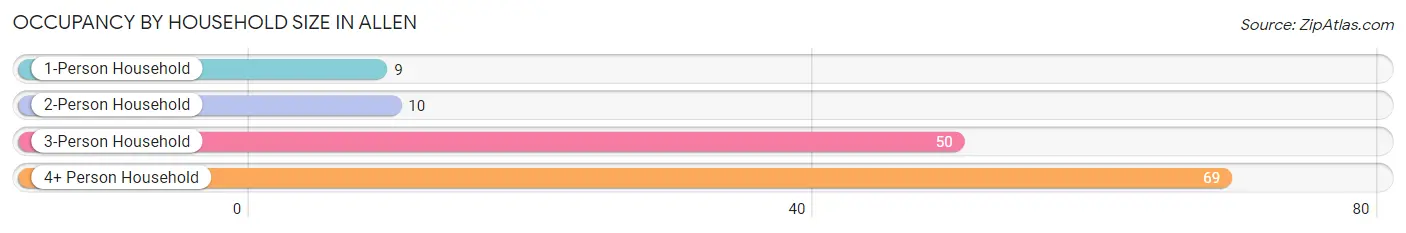
| Household Size | # Housing Units | % Housing Units |
| 1-Person Household | 9 | 6.5% |
| 2-Person Household | 10 | 7.2% |
| 3-Person Household | 50 | 36.2% |
| 4+ Person Household | 69 | 50.0% |
| Total Housing Units | 138 | 100.0% |
Occupancy by Ownership by Household Size in Allen
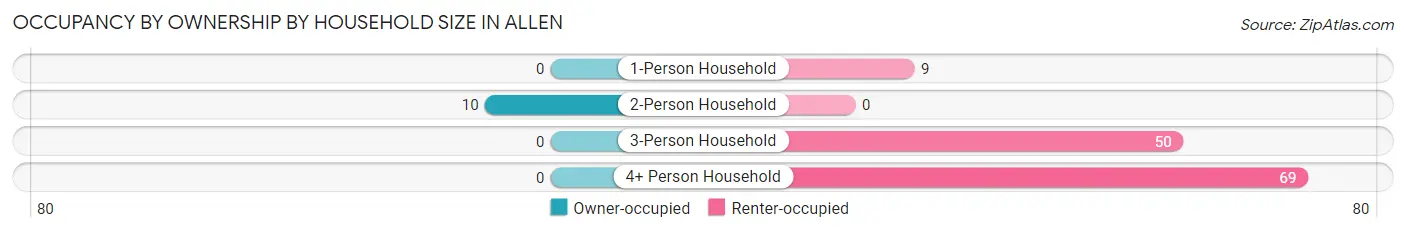
| Household Size | Owner-occupied | Renter-occupied |
| 1-Person Household | 0 (0.0%) | 9 (100.0%) |
| 2-Person Household | 10 (100.0%) | 0 (0.0%) |
| 3-Person Household | 0 (0.0%) | 50 (100.0%) |
| 4+ Person Household | 0 (0.0%) | 69 (100.0%) |
| Total Housing Units | 10 (7.2%) | 128 (92.7%) |
Occupancy by Educational Attainment in Allen
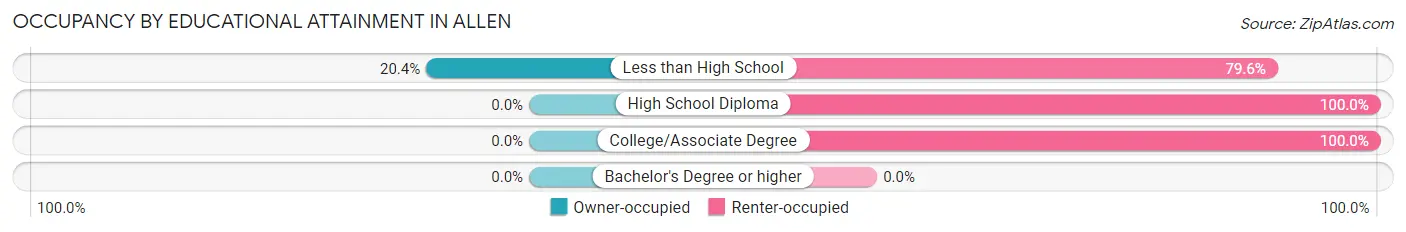
| Household Size | Owner-occupied | Renter-occupied |
| Less than High School | 10 (20.4%) | 39 (79.6%) |
| High School Diploma | 0 (0.0%) | 32 (100.0%) |
| College/Associate Degree | 0 (0.0%) | 57 (100.0%) |
| Bachelor's Degree or higher | 0 (0.0%) | 0 (0.0%) |
Occupancy by Age of Householder in Allen
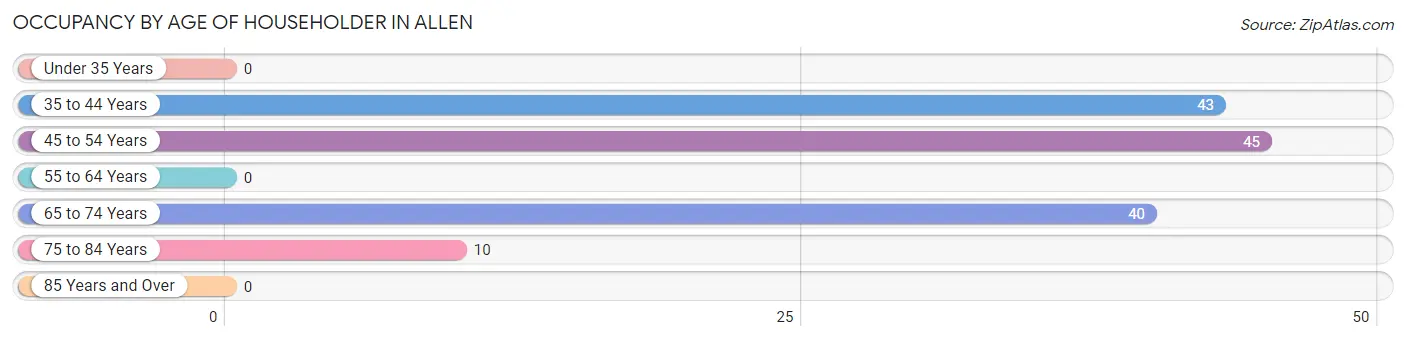
| Age Bracket | # Households | % Households |
| Under 35 Years | 0 | 0.0% |
| 35 to 44 Years | 43 | 31.2% |
| 45 to 54 Years | 45 | 32.6% |
| 55 to 64 Years | 0 | 0.0% |
| 65 to 74 Years | 40 | 29.0% |
| 75 to 84 Years | 10 | 7.2% |
| 85 Years and Over | 0 | 0.0% |
| Total | 138 | 100.0% |
Housing Finances in Allen
Median Income by Occupancy in Allen
| Occupancy Type | # Households | Median Income |
| Owner-Occupied | 10 (7.2%) | $0 |
| Renter-Occupied | 128 (92.7%) | $0 |
| Average | 138 (100.0%) | $0 |
Occupancy by Householder Income Bracket in Allen
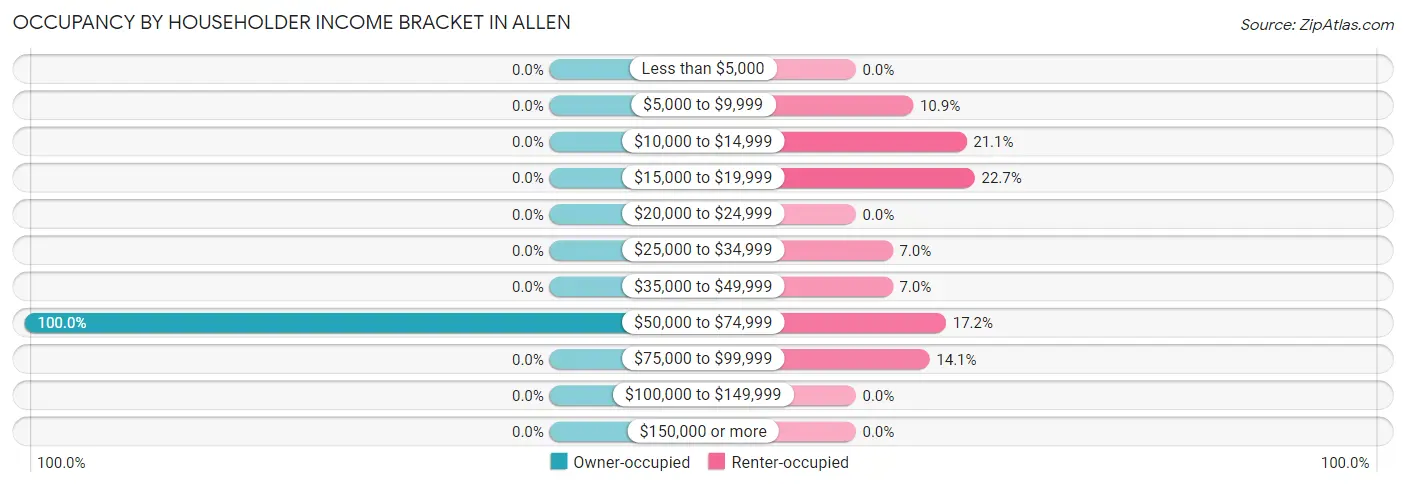
| Income Bracket | Owner-occupied | Renter-occupied |
| Less than $5,000 | 0 (0.0%) | 0 (0.0%) |
| $5,000 to $9,999 | 0 (0.0%) | 14 (10.9%) |
| $10,000 to $14,999 | 0 (0.0%) | 27 (21.1%) |
| $15,000 to $19,999 | 0 (0.0%) | 29 (22.7%) |
| $20,000 to $24,999 | 0 (0.0%) | 0 (0.0%) |
| $25,000 to $34,999 | 0 (0.0%) | 9 (7.0%) |
| $35,000 to $49,999 | 0 (0.0%) | 9 (7.0%) |
| $50,000 to $74,999 | 10 (100.0%) | 22 (17.2%) |
| $75,000 to $99,999 | 0 (0.0%) | 18 (14.1%) |
| $100,000 to $149,999 | 0 (0.0%) | 0 (0.0%) |
| $150,000 or more | 0 (0.0%) | 0 (0.0%) |
| Total | 10 (100.0%) | 128 (100.0%) |
Monthly Housing Cost Tiers in Allen
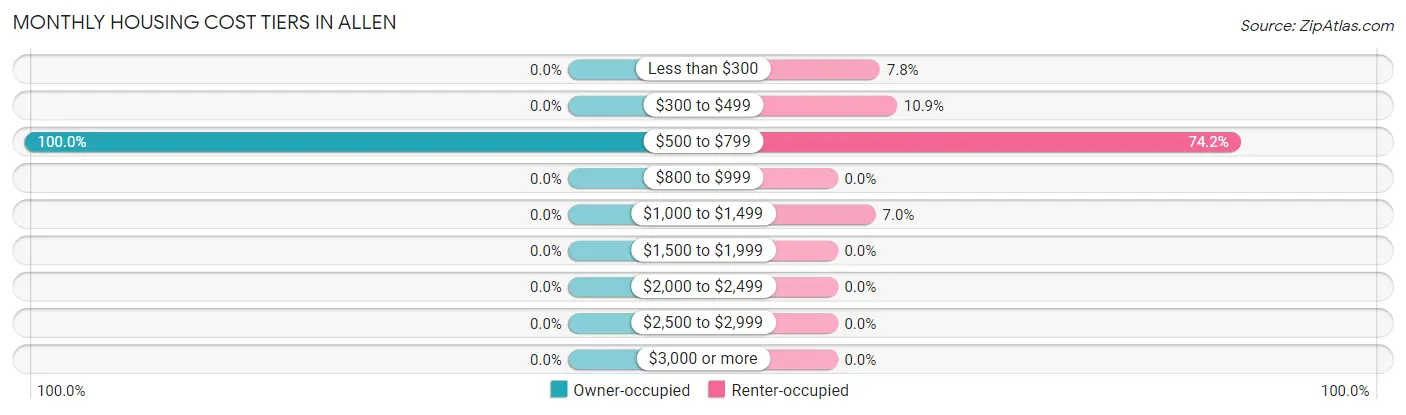
| Monthly Cost | Owner-occupied | Renter-occupied |
| Less than $300 | 0 (0.0%) | 10 (7.8%) |
| $300 to $499 | 0 (0.0%) | 14 (10.9%) |
| $500 to $799 | 10 (100.0%) | 95 (74.2%) |
| $800 to $999 | 0 (0.0%) | 0 (0.0%) |
| $1,000 to $1,499 | 0 (0.0%) | 9 (7.0%) |
| $1,500 to $1,999 | 0 (0.0%) | 0 (0.0%) |
| $2,000 to $2,499 | 0 (0.0%) | 0 (0.0%) |
| $2,500 to $2,999 | 0 (0.0%) | 0 (0.0%) |
| $3,000 or more | 0 (0.0%) | 0 (0.0%) |
| Total | 10 (100.0%) | 128 (100.0%) |
Physical Housing Characteristics in Allen
Housing Structures in Allen
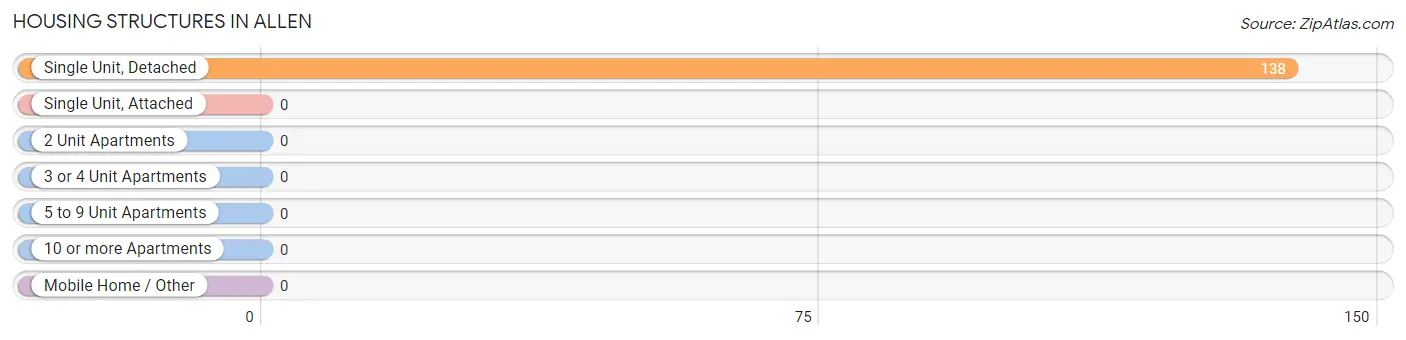
| Structure Type | # Housing Units | % Housing Units |
| Single Unit, Detached | 138 | 100.0% |
| Single Unit, Attached | 0 | 0.0% |
| 2 Unit Apartments | 0 | 0.0% |
| 3 or 4 Unit Apartments | 0 | 0.0% |
| 5 to 9 Unit Apartments | 0 | 0.0% |
| 10 or more Apartments | 0 | 0.0% |
| Mobile Home / Other | 0 | 0.0% |
| Total | 138 | 100.0% |
Housing Structures by Occupancy in Allen
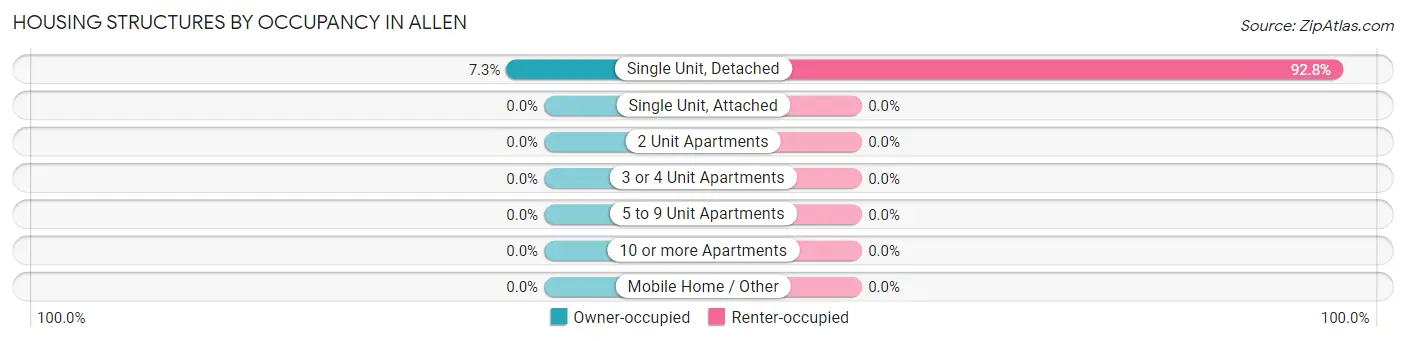
| Structure Type | Owner-occupied | Renter-occupied |
| Single Unit, Detached | 10 (7.2%) | 128 (92.7%) |
| Single Unit, Attached | 0 (0.0%) | 0 (0.0%) |
| 2 Unit Apartments | 0 (0.0%) | 0 (0.0%) |
| 3 or 4 Unit Apartments | 0 (0.0%) | 0 (0.0%) |
| 5 to 9 Unit Apartments | 0 (0.0%) | 0 (0.0%) |
| 10 or more Apartments | 0 (0.0%) | 0 (0.0%) |
| Mobile Home / Other | 0 (0.0%) | 0 (0.0%) |
| Total | 10 (7.2%) | 128 (92.7%) |
Housing Structures by Number of Rooms in Allen
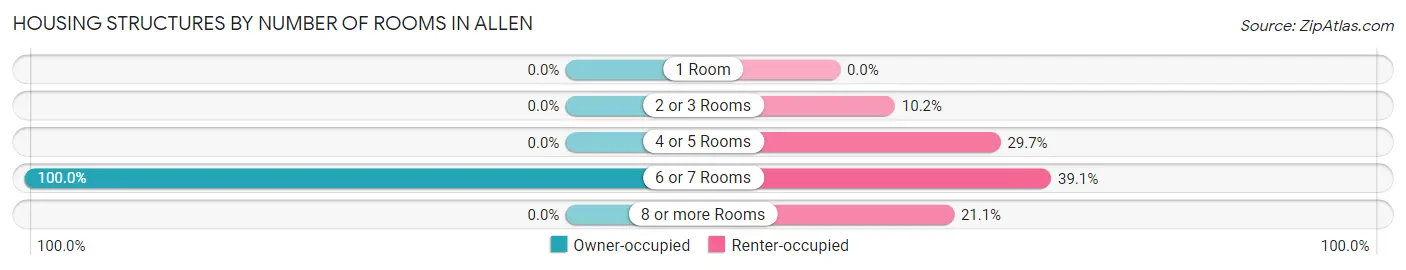
| Number of Rooms | Owner-occupied | Renter-occupied |
| 1 Room | 0 (0.0%) | 0 (0.0%) |
| 2 or 3 Rooms | 0 (0.0%) | 13 (10.2%) |
| 4 or 5 Rooms | 0 (0.0%) | 38 (29.7%) |
| 6 or 7 Rooms | 10 (100.0%) | 50 (39.1%) |
| 8 or more Rooms | 0 (0.0%) | 27 (21.1%) |
| Total | 10 (100.0%) | 128 (100.0%) |
Housing Structure by Heating Type in Allen
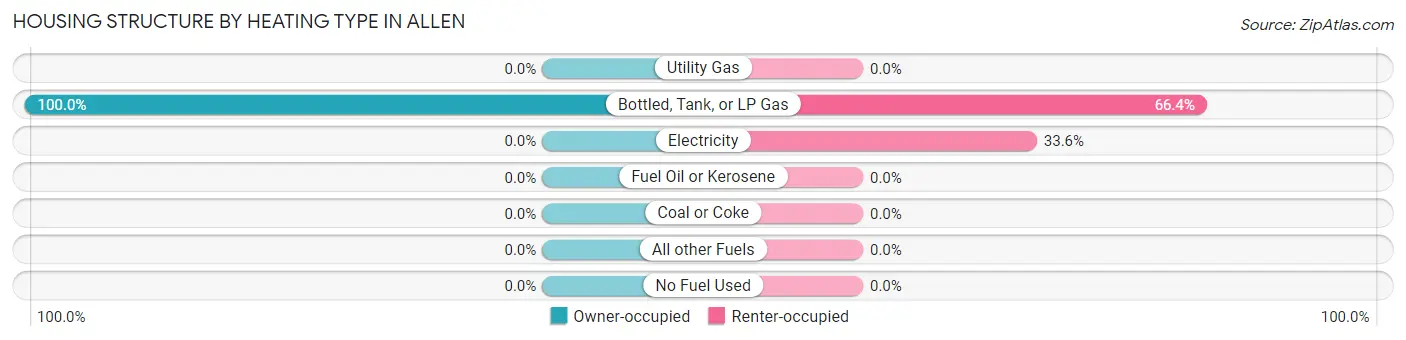
| Heating Type | Owner-occupied | Renter-occupied |
| Utility Gas | 0 (0.0%) | 0 (0.0%) |
| Bottled, Tank, or LP Gas | 10 (100.0%) | 85 (66.4%) |
| Electricity | 0 (0.0%) | 43 (33.6%) |
| Fuel Oil or Kerosene | 0 (0.0%) | 0 (0.0%) |
| Coal or Coke | 0 (0.0%) | 0 (0.0%) |
| All other Fuels | 0 (0.0%) | 0 (0.0%) |
| No Fuel Used | 0 (0.0%) | 0 (0.0%) |
| Total | 10 (100.0%) | 128 (100.0%) |
Household Vehicle Usage in Allen
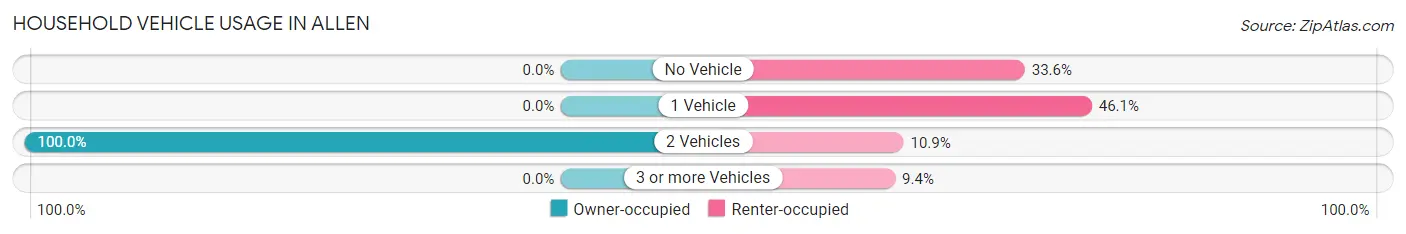
| Vehicles per Household | Owner-occupied | Renter-occupied |
| No Vehicle | 0 (0.0%) | 43 (33.6%) |
| 1 Vehicle | 0 (0.0%) | 59 (46.1%) |
| 2 Vehicles | 10 (100.0%) | 14 (10.9%) |
| 3 or more Vehicles | 0 (0.0%) | 12 (9.4%) |
| Total | 10 (100.0%) | 128 (100.0%) |
Real Estate & Mortgages in Allen
Real Estate and Mortgage Overview in Allen
| Characteristic | Without Mortgage | With Mortgage |
| Housing Units | 10 | 0 |
| Median Property Value | - | - |
| Median Household Income | - | - |
| Monthly Housing Costs | - | - |
| Real Estate Taxes | - | - |
Property Value by Mortgage Status in Allen
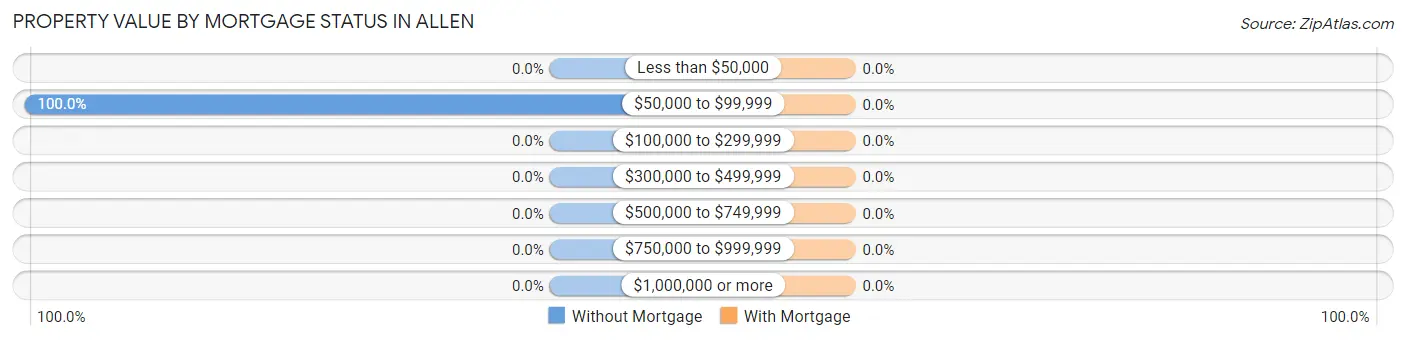
| Property Value | Without Mortgage | With Mortgage |
| Less than $50,000 | 0 (0.0%) | 0 (0.0%) |
| $50,000 to $99,999 | 10 (100.0%) | 0 (0.0%) |
| $100,000 to $299,999 | 0 (0.0%) | 0 (0.0%) |
| $300,000 to $499,999 | 0 (0.0%) | 0 (0.0%) |
| $500,000 to $749,999 | 0 (0.0%) | 0 (0.0%) |
| $750,000 to $999,999 | 0 (0.0%) | 0 (0.0%) |
| $1,000,000 or more | 0 (0.0%) | 0 (0.0%) |
| Total | 10 (100.0%) | 0 (0.0%) |
Household Income by Mortgage Status in Allen
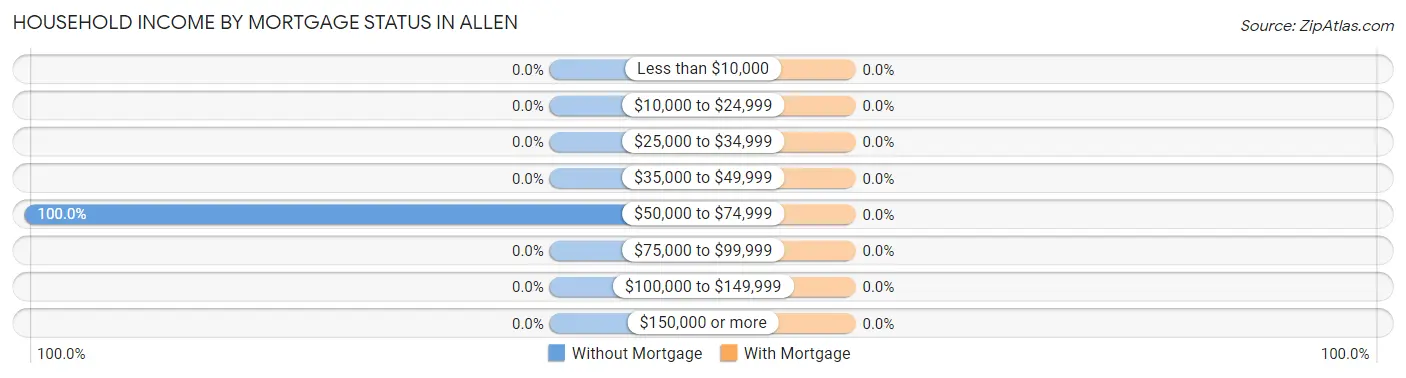
| Household Income | Without Mortgage | With Mortgage |
| Less than $10,000 | 0 (0.0%) | 0 (0.0%) |
| $10,000 to $24,999 | 0 (0.0%) | 0 (0.0%) |
| $25,000 to $34,999 | 0 (0.0%) | 0 (0.0%) |
| $35,000 to $49,999 | 0 (0.0%) | 0 (0.0%) |
| $50,000 to $74,999 | 10 (100.0%) | 0 (0.0%) |
| $75,000 to $99,999 | 0 (0.0%) | 0 (0.0%) |
| $100,000 to $149,999 | 0 (0.0%) | 0 (0.0%) |
| $150,000 or more | 0 (0.0%) | 0 (0.0%) |
| Total | 10 (100.0%) | 0 (0.0%) |
Property Value to Household Income Ratio in Allen
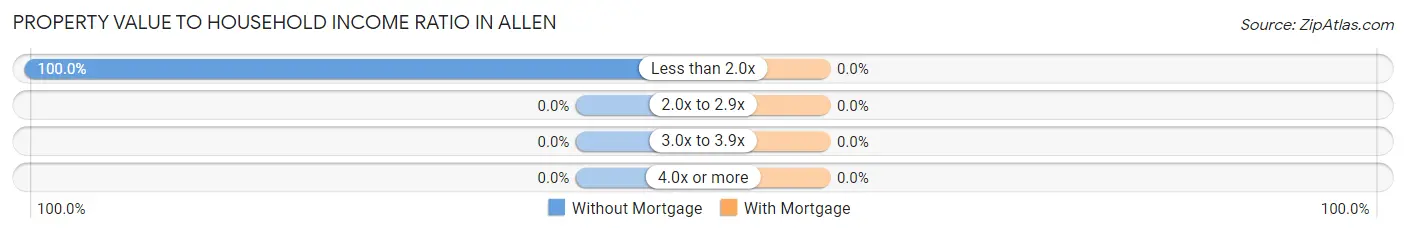
| Value-to-Income Ratio | Without Mortgage | With Mortgage |
| Less than 2.0x | 10 (100.0%) | 0 (0.0%) |
| 2.0x to 2.9x | 0 (0.0%) | 0 (0.0%) |
| 3.0x to 3.9x | 0 (0.0%) | 0 (0.0%) |
| 4.0x or more | 0 (0.0%) | 0 (0.0%) |
| Total | 10 (100.0%) | 0 (0.0%) |
Real Estate Taxes by Mortgage Status in Allen
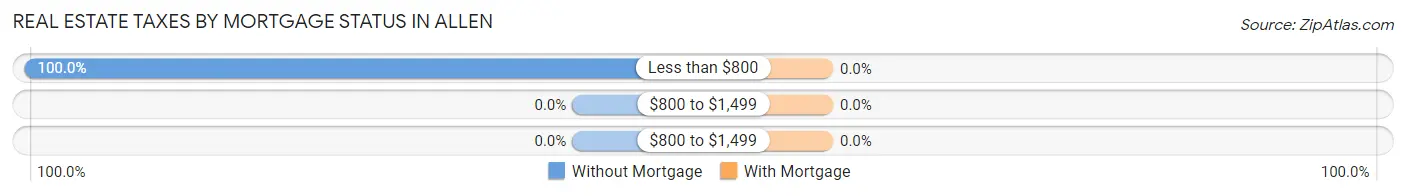
| Property Taxes | Without Mortgage | With Mortgage |
| Less than $800 | 10 (100.0%) | 0 (0.0%) |
| $800 to $1,499 | 0 (0.0%) | 0 (0.0%) |
| $800 to $1,499 | 0 (0.0%) | 0 (0.0%) |
| Total | 10 (100.0%) | 0 (0.0%) |
Health & Disability in Allen
Health Insurance Coverage by Age in Allen
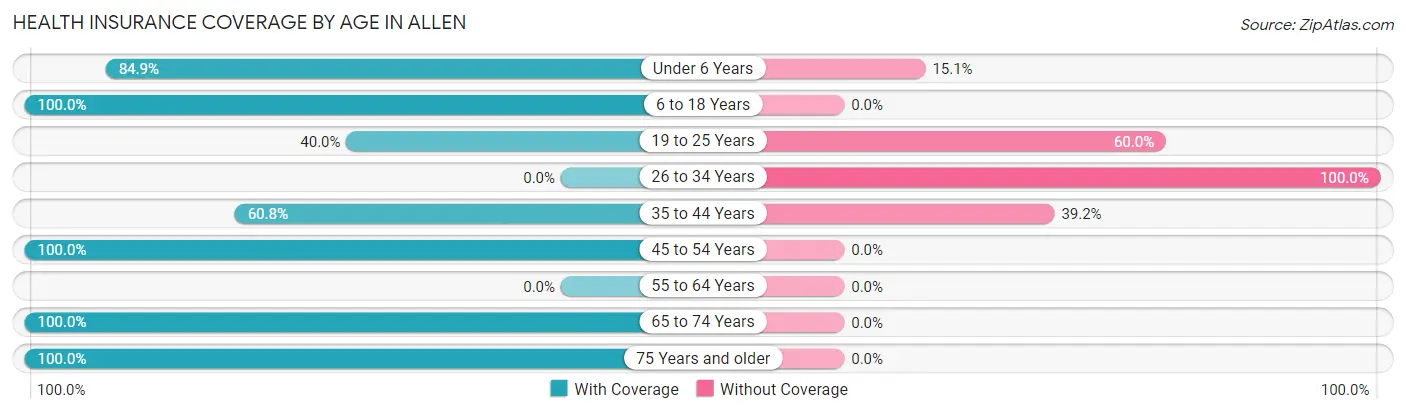
| Age Bracket | With Coverage | Without Coverage |
| Under 6 Years | 101 (84.9%) | 18 (15.1%) |
| 6 to 18 Years | 367 (100.0%) | 0 (0.0%) |
| 19 to 25 Years | 72 (40.0%) | 108 (60.0%) |
| 26 to 34 Years | 0 (0.0%) | 58 (100.0%) |
| 35 to 44 Years | 45 (60.8%) | 29 (39.2%) |
| 45 to 54 Years | 62 (100.0%) | 0 (0.0%) |
| 55 to 64 Years | 0 (0.0%) | 0 (0.0%) |
| 65 to 74 Years | 50 (100.0%) | 0 (0.0%) |
| 75 Years and older | 16 (100.0%) | 0 (0.0%) |
| Total | 713 (77.0%) | 213 (23.0%) |
Health Insurance Coverage by Citizenship Status in Allen
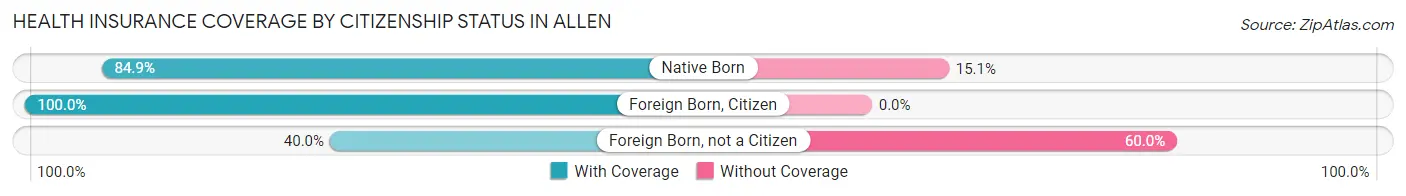
| Citizenship Status | With Coverage | Without Coverage |
| Native Born | 101 (84.9%) | 18 (15.1%) |
| Foreign Born, Citizen | 367 (100.0%) | 0 (0.0%) |
| Foreign Born, not a Citizen | 72 (40.0%) | 108 (60.0%) |
Health Insurance Coverage by Household Income in Allen
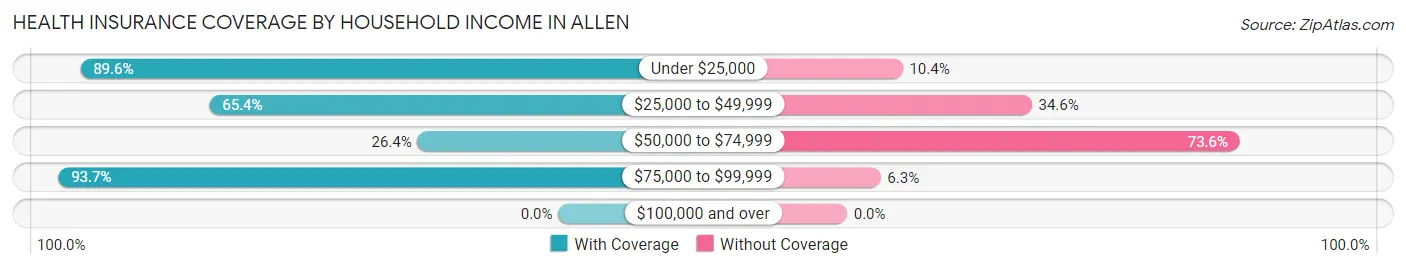
| Household Income | With Coverage | Without Coverage |
| Under $25,000 | 378 (89.6%) | 44 (10.4%) |
| $25,000 to $49,999 | 34 (65.4%) | 18 (34.6%) |
| $50,000 to $74,999 | 48 (26.4%) | 134 (73.6%) |
| $75,000 to $99,999 | 253 (93.7%) | 17 (6.3%) |
| $100,000 and over | 0 (0.0%) | 0 (0.0%) |
Public vs Private Health Insurance Coverage by Age in Allen
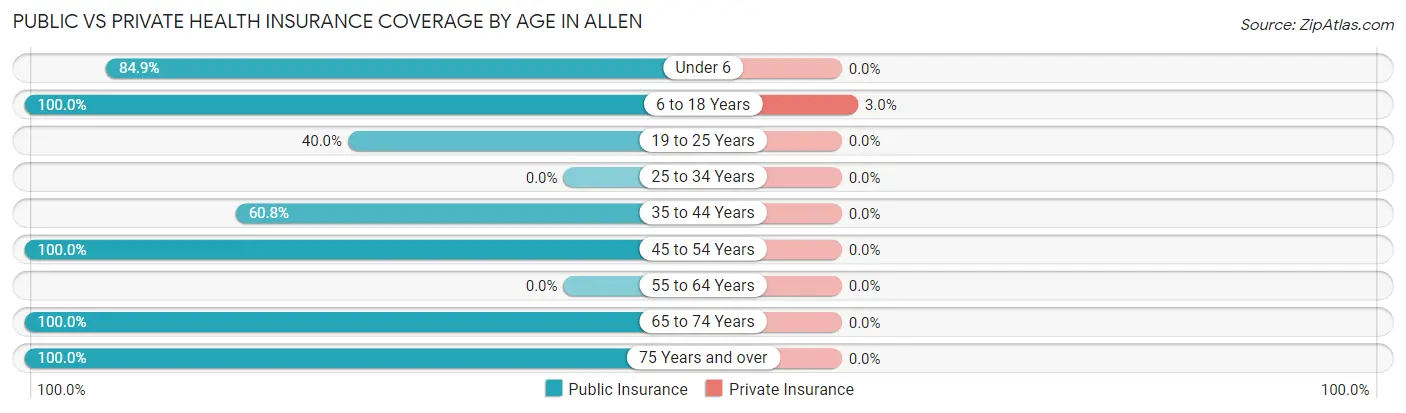
| Age Bracket | Public Insurance | Private Insurance |
| Under 6 | 101 (84.9%) | 0 (0.0%) |
| 6 to 18 Years | 367 (100.0%) | 11 (3.0%) |
| 19 to 25 Years | 72 (40.0%) | 0 (0.0%) |
| 25 to 34 Years | 0 (0.0%) | 0 (0.0%) |
| 35 to 44 Years | 45 (60.8%) | 0 (0.0%) |
| 45 to 54 Years | 62 (100.0%) | 0 (0.0%) |
| 55 to 64 Years | 0 (0.0%) | 0 (0.0%) |
| 65 to 74 Years | 50 (100.0%) | 0 (0.0%) |
| 75 Years and over | 16 (100.0%) | 0 (0.0%) |
| Total | 713 (77.0%) | 11 (1.2%) |
Disability Status by Sex by Age in Allen
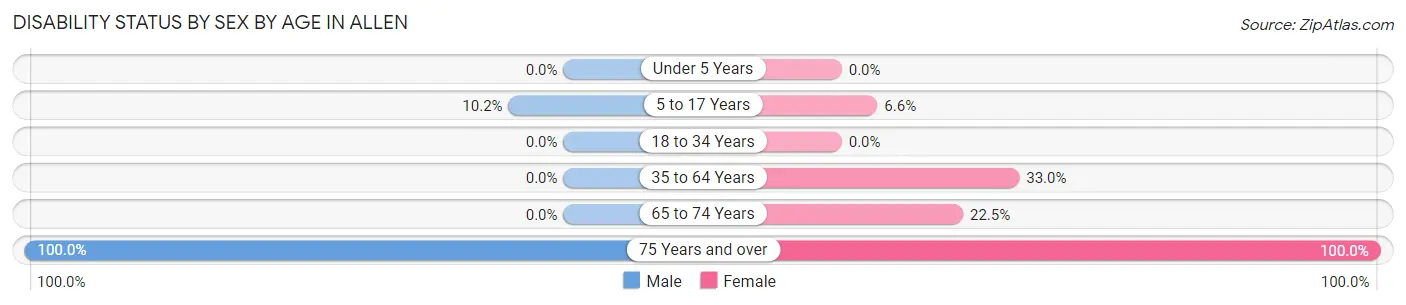
| Age Bracket | Male | Female |
| Under 5 Years | 0 (0.0%) | 0 (0.0%) |
| 5 to 17 Years | 15 (10.2%) | 16 (6.6%) |
| 18 to 34 Years | 0 (0.0%) | 0 (0.0%) |
| 35 to 64 Years | 0 (0.0%) | 29 (33.0%) |
| 65 to 74 Years | 0 (0.0%) | 9 (22.5%) |
| 75 Years and over | 6 (100.0%) | 10 (100.0%) |
Disability Class by Sex by Age in Allen
Disability Class: Hearing Difficulty
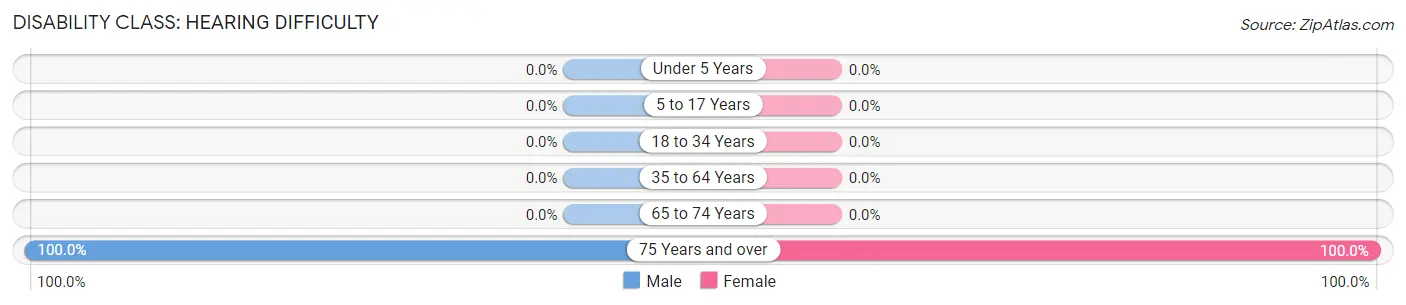
| Age Bracket | Male | Female |
| Under 5 Years | 0 (0.0%) | 0 (0.0%) |
| 5 to 17 Years | 0 (0.0%) | 0 (0.0%) |
| 18 to 34 Years | 0 (0.0%) | 0 (0.0%) |
| 35 to 64 Years | 0 (0.0%) | 0 (0.0%) |
| 65 to 74 Years | 0 (0.0%) | 0 (0.0%) |
| 75 Years and over | 6 (100.0%) | 10 (100.0%) |
Disability Class: Vision Difficulty
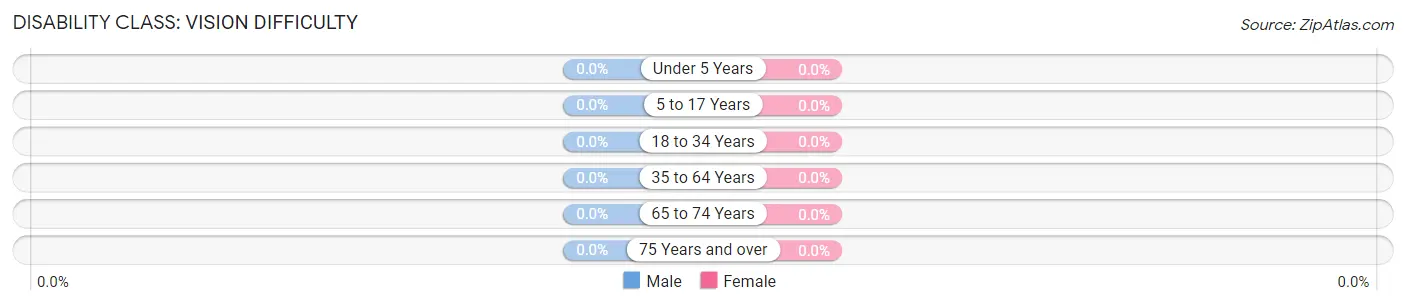
| Age Bracket | Male | Female |
| Under 5 Years | 0 (0.0%) | 0 (0.0%) |
| 5 to 17 Years | 0 (0.0%) | 0 (0.0%) |
| 18 to 34 Years | 0 (0.0%) | 0 (0.0%) |
| 35 to 64 Years | 0 (0.0%) | 0 (0.0%) |
| 65 to 74 Years | 0 (0.0%) | 0 (0.0%) |
| 75 Years and over | 0 (0.0%) | 0 (0.0%) |
Disability Class: Cognitive Difficulty
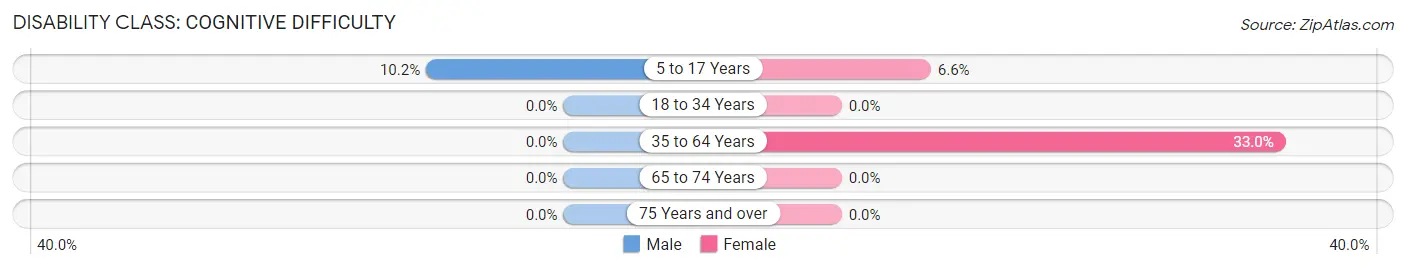
| Age Bracket | Male | Female |
| 5 to 17 Years | 15 (10.2%) | 16 (6.6%) |
| 18 to 34 Years | 0 (0.0%) | 0 (0.0%) |
| 35 to 64 Years | 0 (0.0%) | 29 (33.0%) |
| 65 to 74 Years | 0 (0.0%) | 0 (0.0%) |
| 75 Years and over | 0 (0.0%) | 0 (0.0%) |
Disability Class: Ambulatory Difficulty
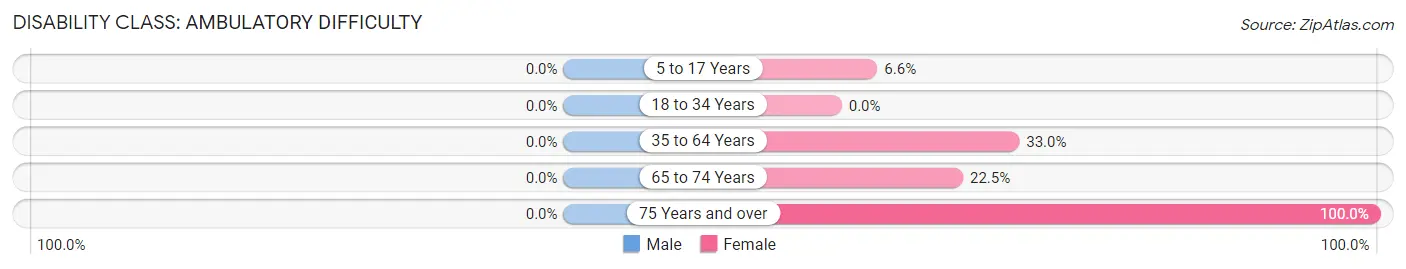
| Age Bracket | Male | Female |
| 5 to 17 Years | 0 (0.0%) | 16 (6.6%) |
| 18 to 34 Years | 0 (0.0%) | 0 (0.0%) |
| 35 to 64 Years | 0 (0.0%) | 29 (33.0%) |
| 65 to 74 Years | 0 (0.0%) | 9 (22.5%) |
| 75 Years and over | 0 (0.0%) | 10 (100.0%) |
Disability Class: Self-Care Difficulty
| Age Bracket | Male | Female |
| 5 to 17 Years | 0 (0.0%) | 16 (6.6%) |
| 18 to 34 Years | 0 (0.0%) | 0 (0.0%) |
| 35 to 64 Years | 0 (0.0%) | 0 (0.0%) |
| 65 to 74 Years | 0 (0.0%) | 9 (22.5%) |
| 75 Years and over | 0 (0.0%) | 10 (100.0%) |
Technology Access in Allen
Computing Device Access in Allen
| Device Type | # Households | % Households |
| Desktop or Laptop | 43 | 31.2% |
| Smartphone | 96 | 69.6% |
| Tablet | 14 | 10.1% |
| No Computing Device | 42 | 30.4% |
| Total | 138 | 100.0% |
Internet Access in Allen
| Internet Type | # Households | % Households |
| Dial-Up Internet | 0 | 0.0% |
| Broadband Home | 36 | 26.1% |
| Cellular Data Only | 9 | 6.5% |
| Satellite Internet | 0 | 0.0% |
| No Internet | 93 | 67.4% |
| Total | 138 | 100.0% |
Allen Summary
Allen, South Dakota is a small town located in the southeastern corner of the state. It is situated in the rolling hills of the Missouri River Valley, and is surrounded by the scenic beauty of the Black Hills. The town has a population of just over 1,000 people, and is the county seat of Union County.
The town of Allen was founded in 1883, when the Union Pacific Railroad was extended to the area. The town was named after the Allen family, who were among the first settlers in the area. The town quickly grew, and by the turn of the century, it had become a thriving agricultural and commercial center.
Geographically, Allen is located in the Missouri River Valley, and is surrounded by the Black Hills. The town is situated at an elevation of 2,845 feet, and is located at the intersection of US Highway 14 and South Dakota Highway 34. The town is located approximately 30 miles from the state capital of Pierre, and is within easy driving distance of Rapid City, Sioux Falls, and other major cities in the region.
The economy of Allen is largely based on agriculture. The town is home to several large farms, and the surrounding area is known for its production of corn, wheat, and other grains. In addition, the town is home to several small businesses, including a grocery store, a hardware store, and a few restaurants.
The demographics of Allen are largely rural. The town is predominantly white, with a small percentage of African Americans and Native Americans. The median household income is approximately $35,000, and the median age is around 40 years old.
Allen is a small town with a rich history and a bright future. It is a great place to live, work, and raise a family. The town is surrounded by beautiful scenery, and offers a variety of recreational activities. With its friendly people and strong economy, Allen is a great place to call home.
Common Questions
What is Per Capita Income in Allen?
Per Capita income in Allen is $6,147.
What is Family Income Deficit in Allen?
Family Income Deficit in Allen is $21,924.
Families that are below poverty line in Allen earn $21,924 less on average than the poverty threshold level.
What is Inequality or Gini Index in Allen?
Inequality or Gini Index in Allen is 0.40.
What is the Total Population of Allen?
Total Population of Allen is 926.
What is the Total Male Population of Allen?
Total Male Population of Allen is 376.
What is the Total Female Population of Allen?
Total Female Population of Allen is 550.
What is the Ratio of Males per 100 Females in Allen?
There are 68.36 Males per 100 Females in Allen.
What is the Ratio of Females per 100 Males in Allen?
There are 146.28 Females per 100 Males in Allen.
What is the Median Population Age in Allen?
Median Population Age in Allen is 17.6 Years.
What is the Average Family Size in Allen
Average Family Size in Allen is 7.0 People.
What is the Average Household Size in Allen
Average Household Size in Allen is 6.7 People.
How Large is the Labor Force in Allen?
There are 135 People in the Labor Forcein in Allen.
What is the Percentage of People in the Labor Force in Allen?
28.0% of People are in the Labor Force in Allen.
What is the Unemployment Rate in Allen?
Unemployment Rate in Allen is 13.3%.