Unity Village, MO Map & Demographics
Unity Village Map
Unity Village Overview
$31,215
PER CAPITA INCOME
$51,250
AVG HOUSEHOLD INCOME
0.30
INEQUALITY / GINI INDEX
65
TOTAL POPULATION
18
MALE POPULATION
47
FEMALE POPULATION
38.30
MALES / 100 FEMALES
261.11
FEMALES / 100 MALES
36.4
MEDIAN AGE
2.2
AVG FAMILY SIZE
1.2
AVG HOUSEHOLD SIZE
36
LABOR FORCE [ PEOPLE ]
57.1%
PERCENT IN LABOR FORCE
2.8%
UNEMPLOYMENT RATE
Unity Village Area Codes
Income in Unity Village
Income Overview in Unity Village
| Characteristic | Number | Measure |
| Per Capita Income | 65 | $31,215 |
| Median Family Income | 5 | $0 |
| Mean Family Income | 5 | $92,680 |
| Median Household Income | 32 | $51,250 |
| Mean Household Income | 32 | $60,231 |
| Income Deficit | 5 | $0 |
| Wage / Income Gap (%) | 65 | 0.00% |
| Wage / Income Gap ($) | 65 | 100.00¢ per $1 |
| Gini / Inequality Index | 65 | 0.30 |
Earnings by Sex in Unity Village
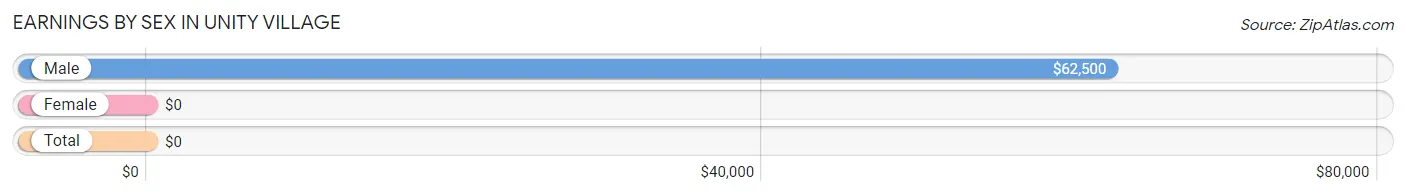
| Sex | Number | Average Earnings |
| Male | 14 (24.6%) | $62,500 |
| Female | 43 (75.4%) | $0 |
| Total | 57 (100.0%) | $0 |
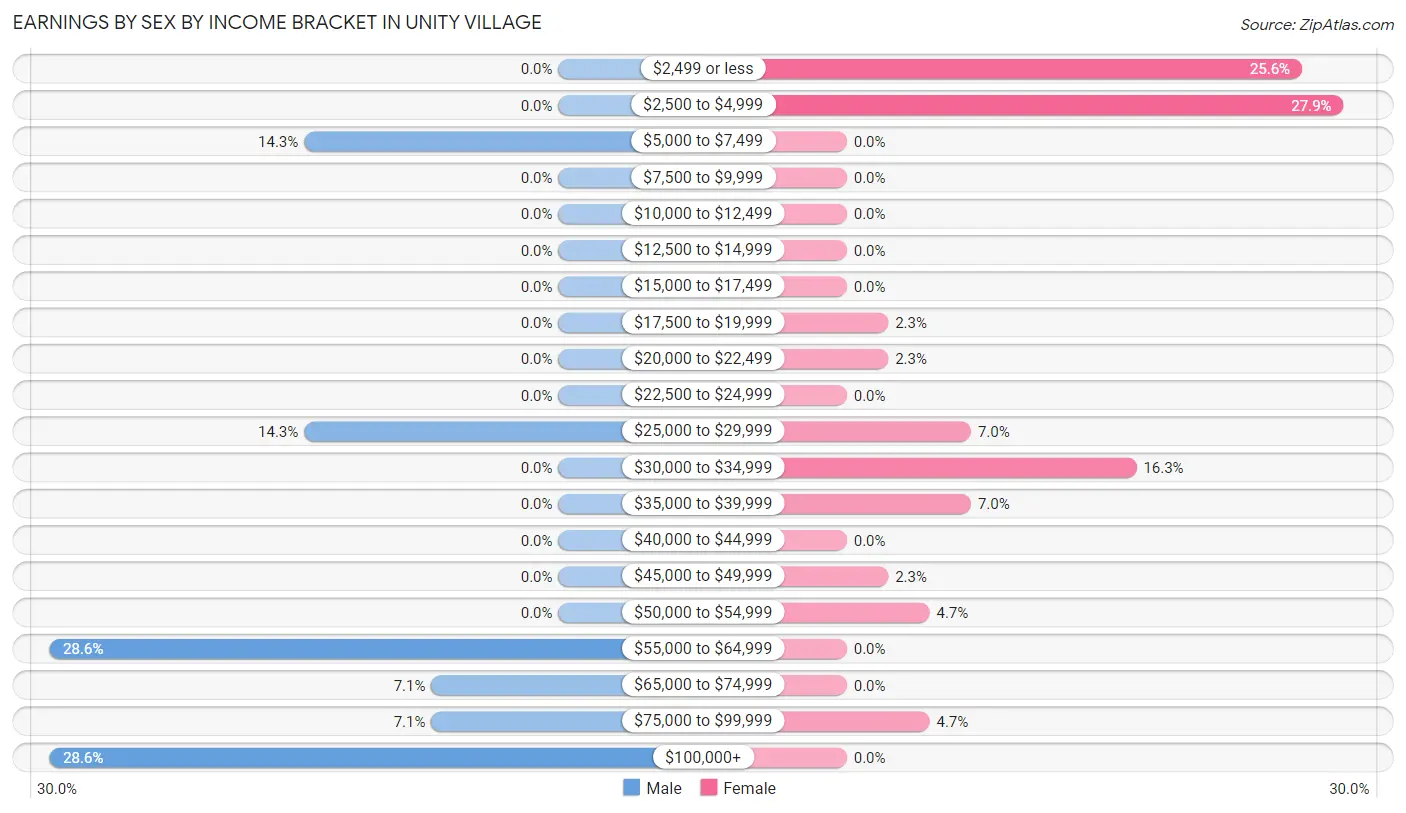
Earnings by Sex by Income Bracket in Unity Village
The most common earnings brackets in Unity Village are $55,000 to $64,999 for men (4 | 28.6%) and $2,500 to $4,999 for women (12 | 27.9%).
| Income | Male | Female |
| $2,499 or less | 0 (0.0%) | 11 (25.6%) |
| $2,500 to $4,999 | 0 (0.0%) | 12 (27.9%) |
| $5,000 to $7,499 | 2 (14.3%) | 0 (0.0%) |
| $7,500 to $9,999 | 0 (0.0%) | 0 (0.0%) |
| $10,000 to $12,499 | 0 (0.0%) | 0 (0.0%) |
| $12,500 to $14,999 | 0 (0.0%) | 0 (0.0%) |
| $15,000 to $17,499 | 0 (0.0%) | 0 (0.0%) |
| $17,500 to $19,999 | 0 (0.0%) | 1 (2.3%) |
| $20,000 to $22,499 | 0 (0.0%) | 1 (2.3%) |
| $22,500 to $24,999 | 0 (0.0%) | 0 (0.0%) |
| $25,000 to $29,999 | 2 (14.3%) | 3 (7.0%) |
| $30,000 to $34,999 | 0 (0.0%) | 7 (16.3%) |
| $35,000 to $39,999 | 0 (0.0%) | 3 (7.0%) |
| $40,000 to $44,999 | 0 (0.0%) | 0 (0.0%) |
| $45,000 to $49,999 | 0 (0.0%) | 1 (2.3%) |
| $50,000 to $54,999 | 0 (0.0%) | 2 (4.6%) |
| $55,000 to $64,999 | 4 (28.6%) | 0 (0.0%) |
| $65,000 to $74,999 | 1 (7.1%) | 0 (0.0%) |
| $75,000 to $99,999 | 1 (7.1%) | 2 (4.6%) |
| $100,000+ | 4 (28.6%) | 0 (0.0%) |
| Total | 14 (100.0%) | 43 (100.0%) |
Earnings by Sex by Educational Attainment in Unity Village
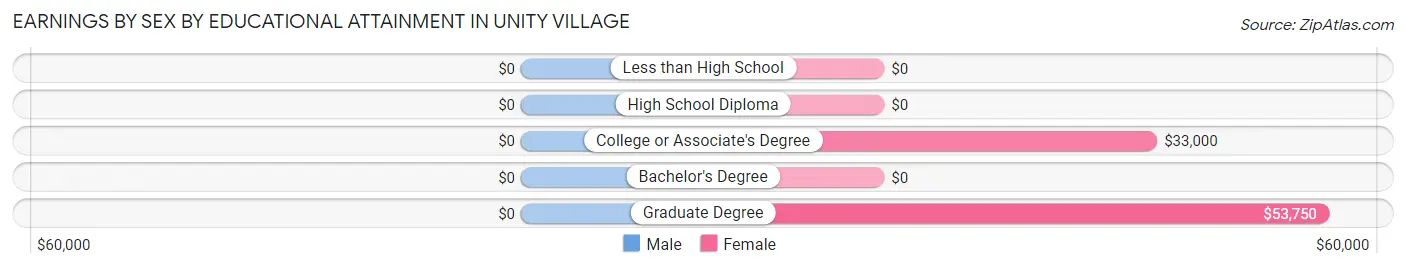
| Educational Attainment | Male Income | Female Income |
| Less than High School | - | - |
| High School Diploma | - | - |
| College or Associate's Degree | - | - |
| Bachelor's Degree | - | - |
| Graduate Degree | - | - |
| Total | $63,750 | $34,000 |
Family Income in Unity Village
Family Income Brackets in Unity Village
According to the Unity Village family income data, there are 2 families falling into the $150,000 to $199,999 income range, which is the most common income bracket and makes up 40.0% of all families.
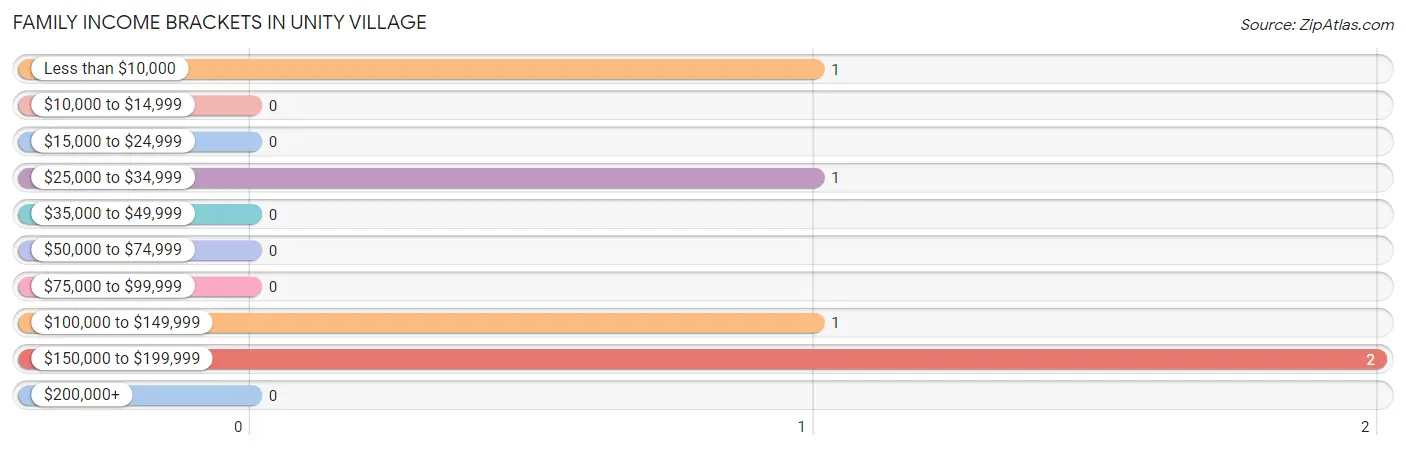
| Income Bracket | # Families | % Families |
| Less than $10,000 | 1 | 20.0% |
| $10,000 to $14,999 | 0 | 0.0% |
| $15,000 to $24,999 | 0 | 0.0% |
| $25,000 to $34,999 | 1 | 20.0% |
| $35,000 to $49,999 | 0 | 0.0% |
| $50,000 to $74,999 | 0 | 0.0% |
| $75,000 to $99,999 | 0 | 0.0% |
| $100,000 to $149,999 | 1 | 20.0% |
| $150,000 to $199,999 | 2 | 40.0% |
| $200,000+ | 0 | 0.0% |
Family Income by Famaliy Size in Unity Village
| Income Bracket | # Families | Median Income |
| 2-Person Families | 5 (100.0%) | $0 |
| 3-Person Families | 0 (0.0%) | $0 |
| 4-Person Families | 0 (0.0%) | $0 |
| 5-Person Families | 0 (0.0%) | $0 |
| 6-Person Families | 0 (0.0%) | $0 |
| 7+ Person Families | 0 (0.0%) | $0 |
| Total | 5 (100.0%) | $0 |
Family Income by Number of Earners in Unity Village
| Number of Earners | # Families | Median Income |
| No Earners | 1 (20.0%) | $0 |
| 1 Earner | 1 (20.0%) | $0 |
| 2 Earners | 3 (60.0%) | $0 |
| 3+ Earners | 0 (0.0%) | $0 |
| Total | 5 (100.0%) | $0 |
Household Income in Unity Village
Household Income Brackets in Unity Village
With 10 households falling in the category, the $35,000 to $49,999 income range is the most frequent in Unity Village, accounting for 31.2% of all households.
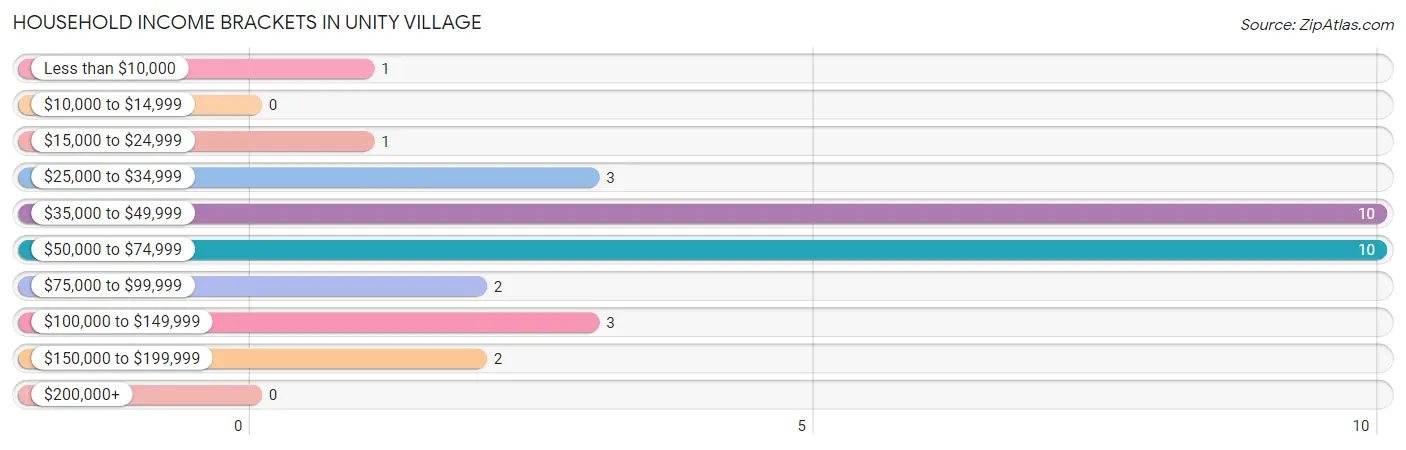
| Income Bracket | # Households | % Households |
| Less than $10,000 | 1 | 3.1% |
| $10,000 to $14,999 | 0 | 0.0% |
| $15,000 to $24,999 | 1 | 3.1% |
| $25,000 to $34,999 | 3 | 9.4% |
| $35,000 to $49,999 | 10 | 31.3% |
| $50,000 to $74,999 | 10 | 31.3% |
| $75,000 to $99,999 | 2 | 6.3% |
| $100,000 to $149,999 | 3 | 9.4% |
| $150,000 to $199,999 | 2 | 6.3% |
| $200,000+ | 0 | 0.0% |
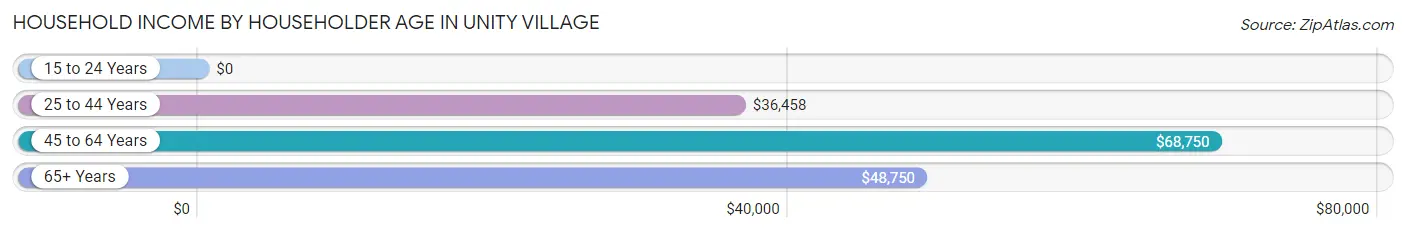
Household Income by Householder Age in Unity Village
The median household income in Unity Village is $51,250, with the highest median household income of $68,750 found in the 45 to 64 years age bracket for the primary householder. A total of 16 households (50.0%) fall into this category. Meanwhile, the 15 to 24 years age bracket for the primary householder has the lowest median household income of $0, with 1 households (3.1%) in this group.
| Income Bracket | # Households | Median Income |
| 15 to 24 Years | 1 (3.1%) | $0 |
| 25 to 44 Years | 9 (28.1%) | $36,458 |
| 45 to 64 Years | 16 (50.0%) | $68,750 |
| 65+ Years | 6 (18.8%) | $48,750 |
| Total | 32 (100.0%) | $51,250 |
Poverty in Unity Village
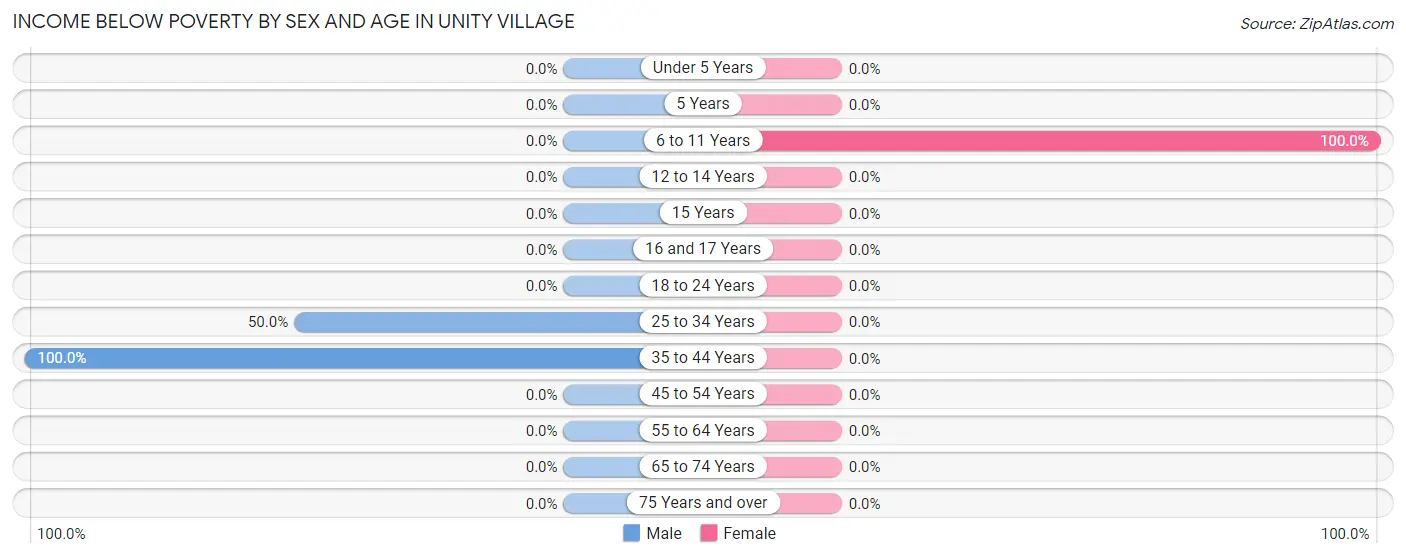
Income Below Poverty by Sex and Age in Unity Village
With 20.0% poverty level for males and 8.0% for females among the residents of Unity Village, 35 to 44 year old males and 6 to 11 year old females are the most vulnerable to poverty, with 2 males (100.0%) and 2 females (100.0%) in their respective age groups living below the poverty level.
| Age Bracket | Male | Female |
| Under 5 Years | 0 (0.0%) | 0 (0.0%) |
| 5 Years | 0 (0.0%) | 0 (0.0%) |
| 6 to 11 Years | 0 (0.0%) | 2 (100.0%) |
| 12 to 14 Years | 0 (0.0%) | 0 (0.0%) |
| 15 Years | 0 (0.0%) | 0 (0.0%) |
| 16 and 17 Years | 0 (0.0%) | 0 (0.0%) |
| 18 to 24 Years | 0 (0.0%) | 0 (0.0%) |
| 25 to 34 Years | 1 (50.0%) | 0 (0.0%) |
| 35 to 44 Years | 2 (100.0%) | 0 (0.0%) |
| 45 to 54 Years | 0 (0.0%) | 0 (0.0%) |
| 55 to 64 Years | 0 (0.0%) | 0 (0.0%) |
| 65 to 74 Years | 0 (0.0%) | 0 (0.0%) |
| 75 Years and over | 0 (0.0%) | 0 (0.0%) |
| Total | 3 (20.0%) | 2 (8.0%) |
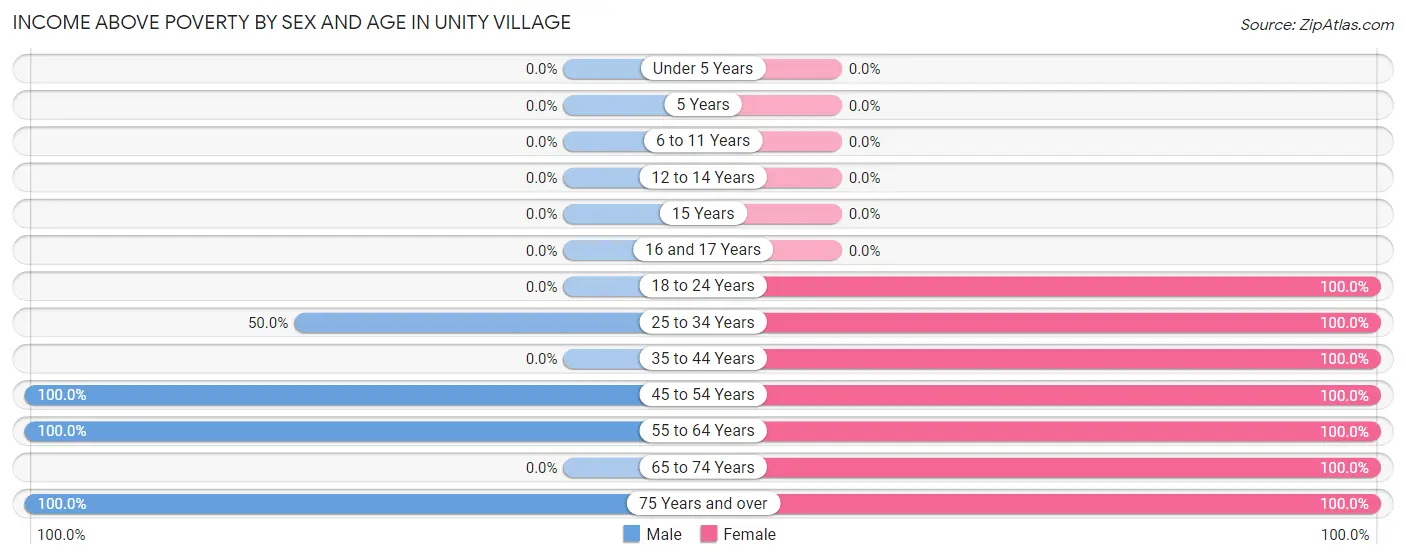
Income Above Poverty by Sex and Age in Unity Village
According to the poverty statistics in Unity Village, males aged 45 to 54 years and females aged 18 to 24 years are the age groups that are most secure financially, with 100.0% of males and 100.0% of females in these age groups living above the poverty line.
| Age Bracket | Male | Female |
| Under 5 Years | 0 (0.0%) | 0 (0.0%) |
| 5 Years | 0 (0.0%) | 0 (0.0%) |
| 6 to 11 Years | 0 (0.0%) | 0 (0.0%) |
| 12 to 14 Years | 0 (0.0%) | 0 (0.0%) |
| 15 Years | 0 (0.0%) | 0 (0.0%) |
| 16 and 17 Years | 0 (0.0%) | 0 (0.0%) |
| 18 to 24 Years | 0 (0.0%) | 1 (100.0%) |
| 25 to 34 Years | 1 (50.0%) | 1 (100.0%) |
| 35 to 44 Years | 0 (0.0%) | 6 (100.0%) |
| 45 to 54 Years | 5 (100.0%) | 2 (100.0%) |
| 55 to 64 Years | 4 (100.0%) | 9 (100.0%) |
| 65 to 74 Years | 0 (0.0%) | 3 (100.0%) |
| 75 Years and over | 2 (100.0%) | 1 (100.0%) |
| Total | 12 (80.0%) | 23 (92.0%) |
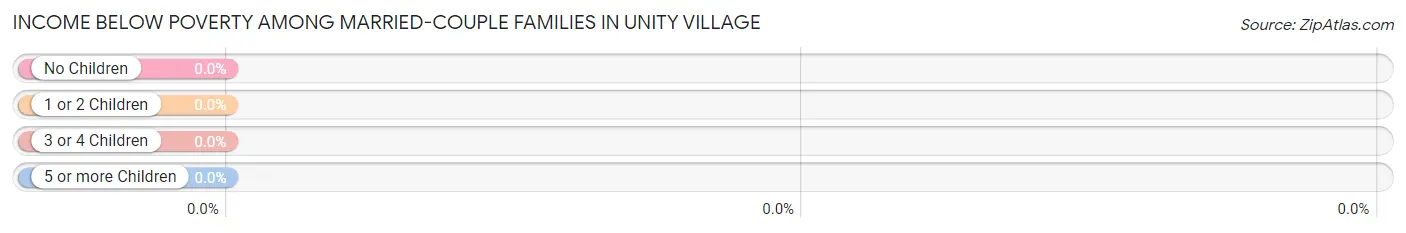
Income Below Poverty Among Married-Couple Families in Unity Village
| Children | Above Poverty | Below Poverty |
| No Children | 3 (100.0%) | 0 (0.0%) |
| 1 or 2 Children | 0 (0.0%) | 0 (0.0%) |
| 3 or 4 Children | 0 (0.0%) | 0 (0.0%) |
| 5 or more Children | 0 (0.0%) | 0 (0.0%) |
| Total | 3 (100.0%) | 0 (0.0%) |
Income Below Poverty Among Single-Parent Households in Unity Village
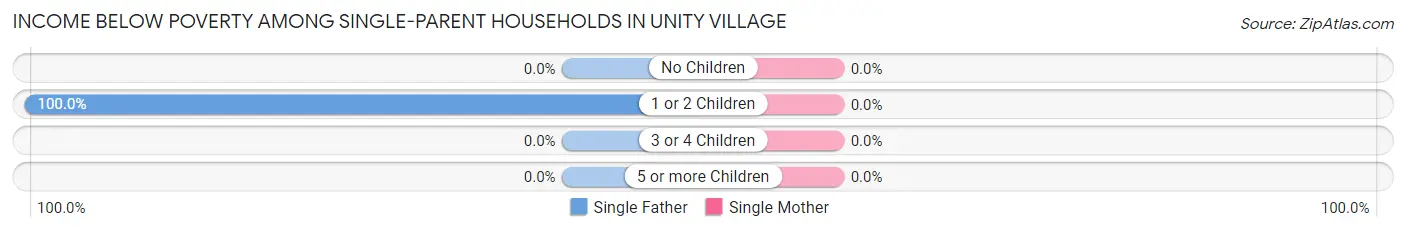
| Children | Single Father | Single Mother |
| No Children | 0 (0.0%) | 0 (0.0%) |
| 1 or 2 Children | 1 (100.0%) | 0 (0.0%) |
| 3 or 4 Children | 0 (0.0%) | 0 (0.0%) |
| 5 or more Children | 0 (0.0%) | 0 (0.0%) |
| Total | 1 (100.0%) | 0 (0.0%) |
Income Below Poverty Among Married-Couple vs Single-Parent Households in Unity Village
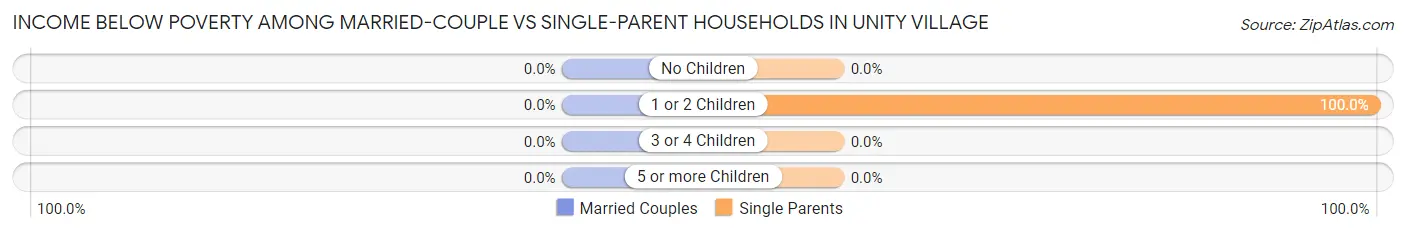
| Children | Married-Couple Families | Single-Parent Households |
| No Children | 0 (0.0%) | 0 (0.0%) |
| 1 or 2 Children | 0 (0.0%) | 1 (100.0%) |
| 3 or 4 Children | 0 (0.0%) | 0 (0.0%) |
| 5 or more Children | 0 (0.0%) | 0 (0.0%) |
| Total | 0 (0.0%) | 1 (50.0%) |
Race in Unity Village
The most populous races in Unity Village are White / Caucasian (58 | 89.2%), Black / African American (3 | 4.6%), and Asian (2 | 3.1%).
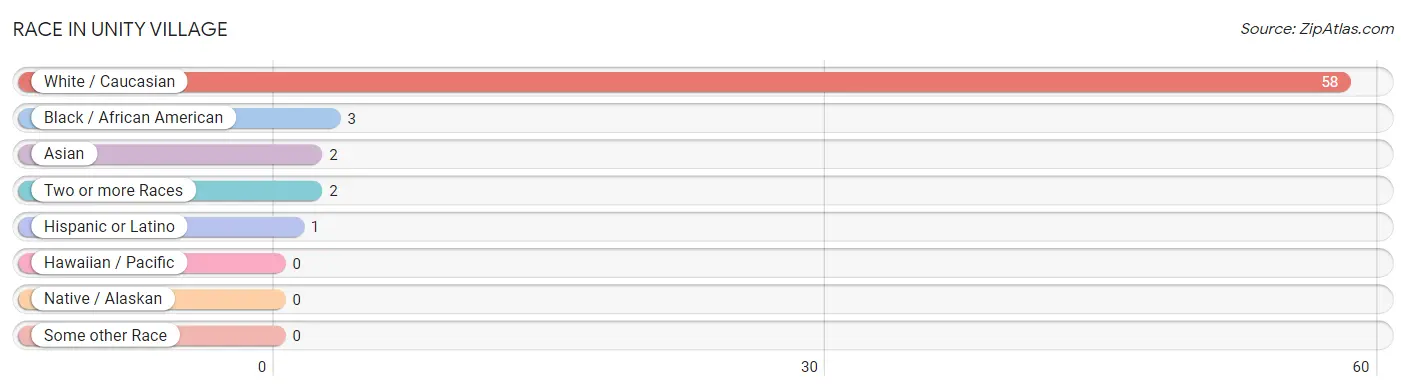
| Race | # Population | % Population |
| Asian | 2 | 3.1% |
| Black / African American | 3 | 4.6% |
| Hawaiian / Pacific | 0 | 0.0% |
| Hispanic or Latino | 1 | 1.5% |
| Native / Alaskan | 0 | 0.0% |
| White / Caucasian | 58 | 89.2% |
| Two or more Races | 2 | 3.1% |
| Some other Race | 0 | 0.0% |
| Total | 65 | 100.0% |
Ancestry in Unity Village
The most populous ancestries reported in Unity Village are German (15 | 23.1%), English (10 | 15.4%), Irish (10 | 15.4%), American (5 | 7.7%), and Scottish (4 | 6.1%), together accounting for 67.7% of all Unity Village residents.
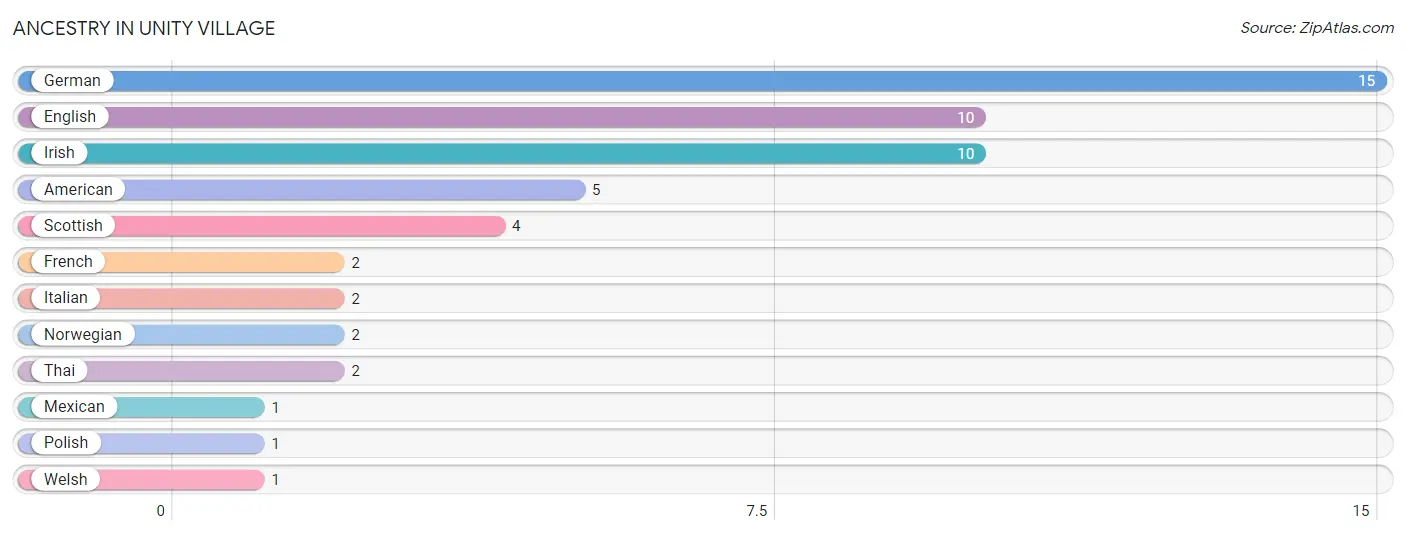
| Ancestry | # Population | % Population |
| American | 5 | 7.7% |
| English | 10 | 15.4% |
| French | 2 | 3.1% |
| German | 15 | 23.1% |
| Irish | 10 | 15.4% |
| Italian | 2 | 3.1% |
| Mexican | 1 | 1.5% |
| Norwegian | 2 | 3.1% |
| Polish | 1 | 1.5% |
| Scottish | 4 | 6.1% |
| Thai | 2 | 3.1% |
| Welsh | 1 | 1.5% | View All 12 Rows |
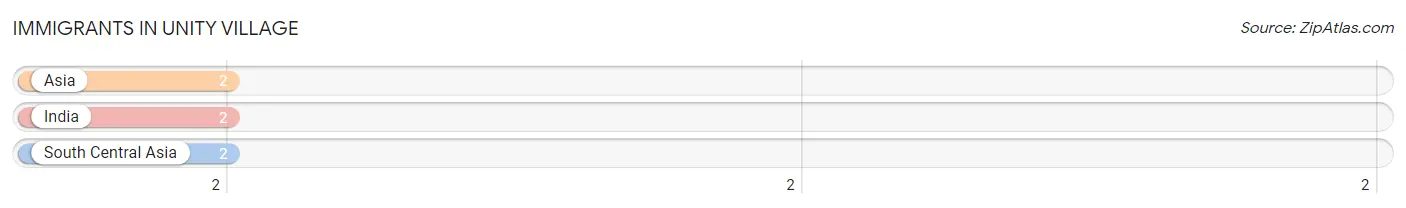
Immigrants in Unity Village
The most numerous immigrant groups reported in Unity Village came from Asia (2 | 3.1%), India (2 | 3.1%), and South Central Asia (2 | 3.1%), together accounting for 9.2% of all Unity Village residents.
| Immigration Origin | # Population | % Population |
| Asia | 2 | 3.1% |
| India | 2 | 3.1% |
| South Central Asia | 2 | 3.1% | View All 3 Rows |
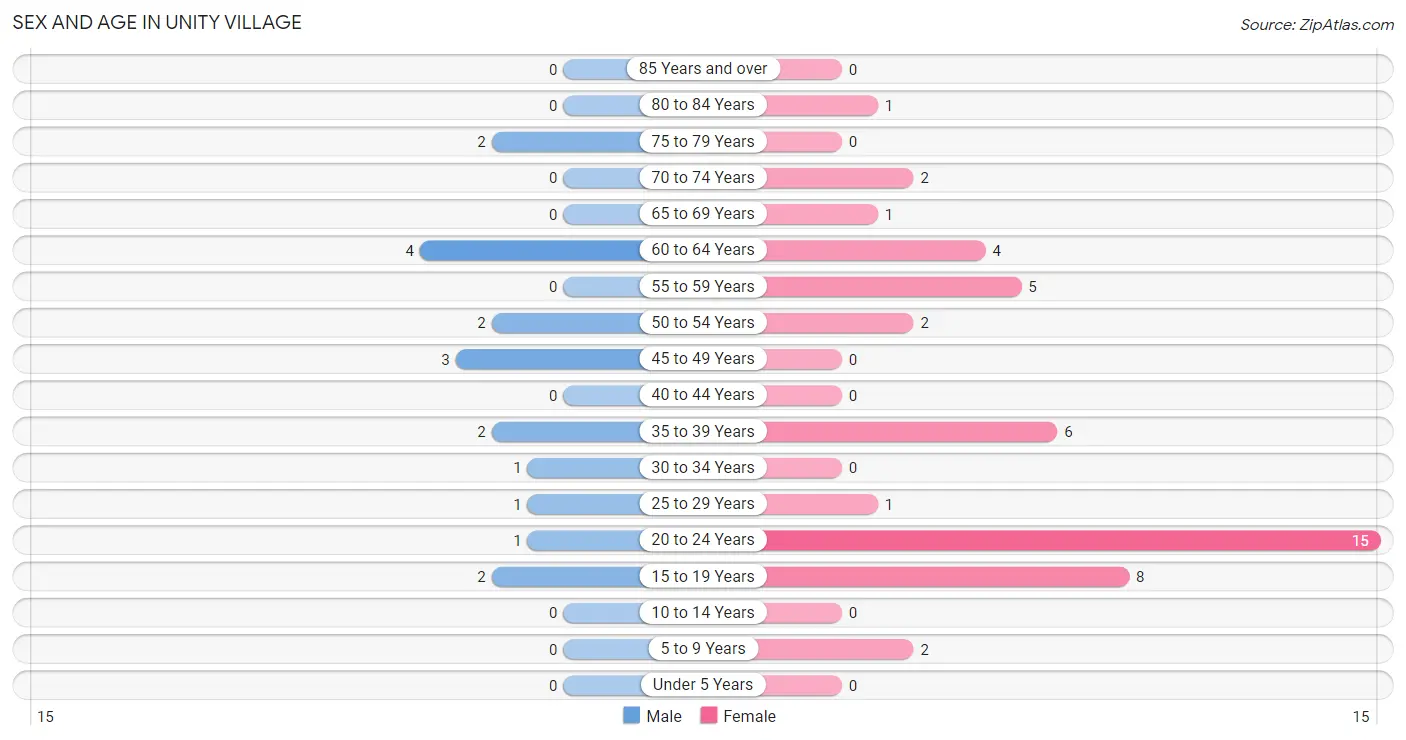
Sex and Age in Unity Village
Sex and Age in Unity Village
The most populous age groups in Unity Village are 60 to 64 Years (4 | 22.2%) for men and 20 to 24 Years (15 | 31.9%) for women.
| Age Bracket | Male | Female |
| Under 5 Years | 0 (0.0%) | 0 (0.0%) |
| 5 to 9 Years | 0 (0.0%) | 2 (4.3%) |
| 10 to 14 Years | 0 (0.0%) | 0 (0.0%) |
| 15 to 19 Years | 2 (11.1%) | 8 (17.0%) |
| 20 to 24 Years | 1 (5.6%) | 15 (31.9%) |
| 25 to 29 Years | 1 (5.6%) | 1 (2.1%) |
| 30 to 34 Years | 1 (5.6%) | 0 (0.0%) |
| 35 to 39 Years | 2 (11.1%) | 6 (12.8%) |
| 40 to 44 Years | 0 (0.0%) | 0 (0.0%) |
| 45 to 49 Years | 3 (16.7%) | 0 (0.0%) |
| 50 to 54 Years | 2 (11.1%) | 2 (4.3%) |
| 55 to 59 Years | 0 (0.0%) | 5 (10.6%) |
| 60 to 64 Years | 4 (22.2%) | 4 (8.5%) |
| 65 to 69 Years | 0 (0.0%) | 1 (2.1%) |
| 70 to 74 Years | 0 (0.0%) | 2 (4.3%) |
| 75 to 79 Years | 2 (11.1%) | 0 (0.0%) |
| 80 to 84 Years | 0 (0.0%) | 1 (2.1%) |
| 85 Years and over | 0 (0.0%) | 0 (0.0%) |
| Total | 18 (100.0%) | 47 (100.0%) |
Families and Households in Unity Village
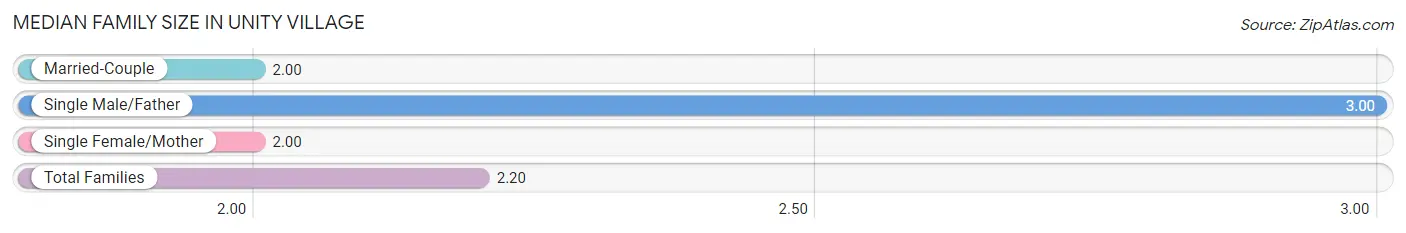
Median Family Size in Unity Village
The median family size in Unity Village is 2.20 persons per family, with single male/father families (1 | 20.0%) accounting for the largest median family size of 3 persons per family. On the other hand, married-couple families (3 | 60.0%) represent the smallest median family size with 2.00 persons per family.
| Family Type | # Families | Family Size |
| Married-Couple | 3 (60.0%) | 2.00 |
| Single Male/Father | 1 (20.0%) | 3.00 |
| Single Female/Mother | 1 (20.0%) | 2.00 |
| Total Families | 5 (100.0%) | 2.20 |
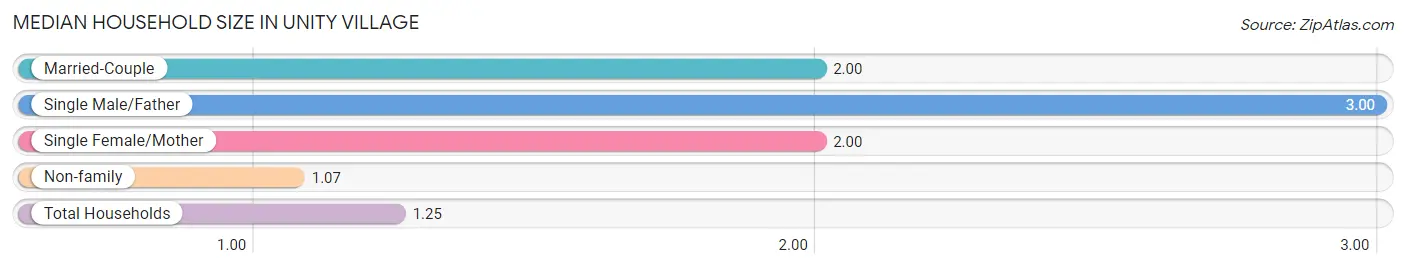
Median Household Size in Unity Village
The median household size in Unity Village is 1.25 persons per household, with single male/father households (1 | 3.1%) accounting for the largest median household size of 3 persons per household. non-family households (27 | 84.4%) represent the smallest median household size with 1.07 persons per household.
| Household Type | # Households | Household Size |
| Married-Couple | 3 (9.4%) | 2.00 |
| Single Male/Father | 1 (3.1%) | 3.00 |
| Single Female/Mother | 1 (3.1%) | 2.00 |
| Non-family | 27 (84.4%) | 1.07 |
| Total Households | 32 (100.0%) | 1.25 |
Household Size by Marriage Status in Unity Village
Out of a total of 32 households in Unity Village, 5 (15.6%) are family households, while 27 (84.4%) are nonfamily households. The most numerous type of family households are 2-person households, comprising 5, and the most common type of nonfamily households are 1-person households, comprising 26.
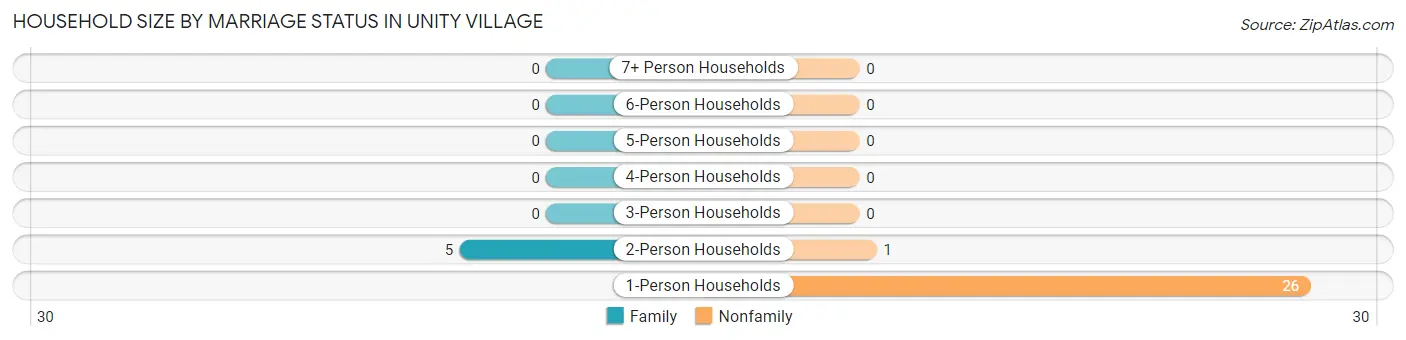
| Household Size | Family Households | Nonfamily Households |
| 1-Person Households | - | 26 (81.2%) |
| 2-Person Households | 5 (15.6%) | 1 (3.1%) |
| 3-Person Households | 0 (0.0%) | 0 (0.0%) |
| 4-Person Households | 0 (0.0%) | 0 (0.0%) |
| 5-Person Households | 0 (0.0%) | 0 (0.0%) |
| 6-Person Households | 0 (0.0%) | 0 (0.0%) |
| 7+ Person Households | 0 (0.0%) | 0 (0.0%) |
| Total | 5 (15.6%) | 27 (84.4%) |
Female Fertility in Unity Village
Fertility by Age in Unity Village
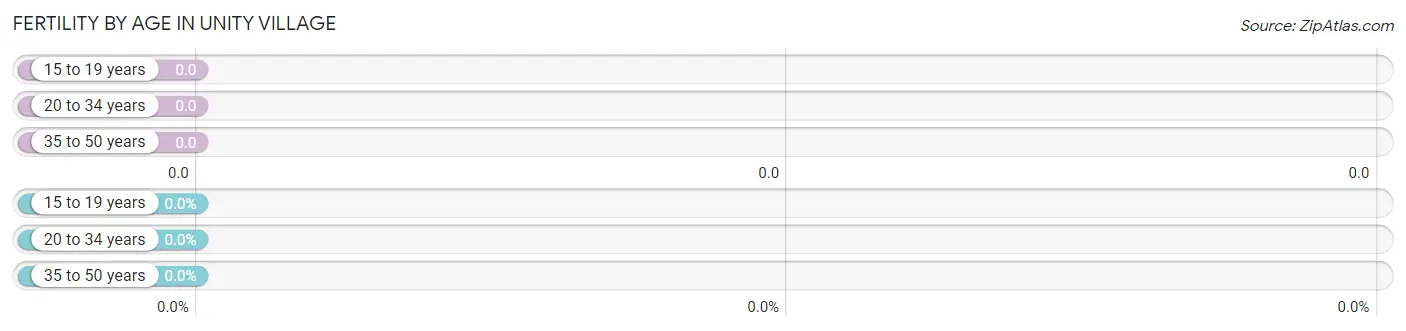
| Age Bracket | Women with Births | Births / 1,000 Women |
| 15 to 19 years | 0 (0.0%) | 0.0 |
| 20 to 34 years | 0 (0.0%) | 0.0 |
| 35 to 50 years | 0 (0.0%) | 0.0 |
| Total | 0 (0.0%) | 0.0 |
Fertility by Age by Marriage Status in Unity Village
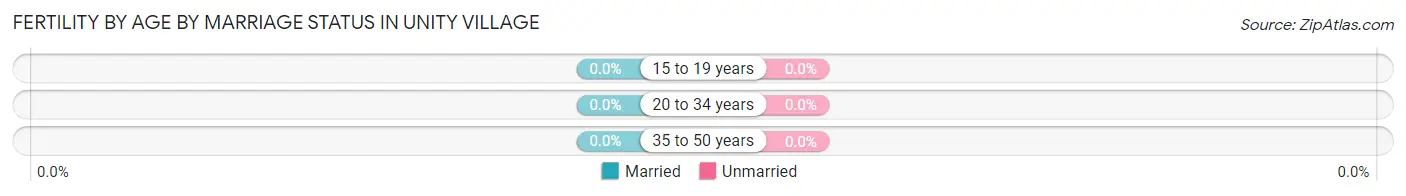
| Age Bracket | Married | Unmarried |
| 15 to 19 years | 0 (0.0%) | 0 (0.0%) |
| 20 to 34 years | 0 (0.0%) | 0 (0.0%) |
| 35 to 50 years | 0 (0.0%) | 0 (0.0%) |
| Total | 0 (0.0%) | 0 (0.0%) |
Fertility by Education in Unity Village
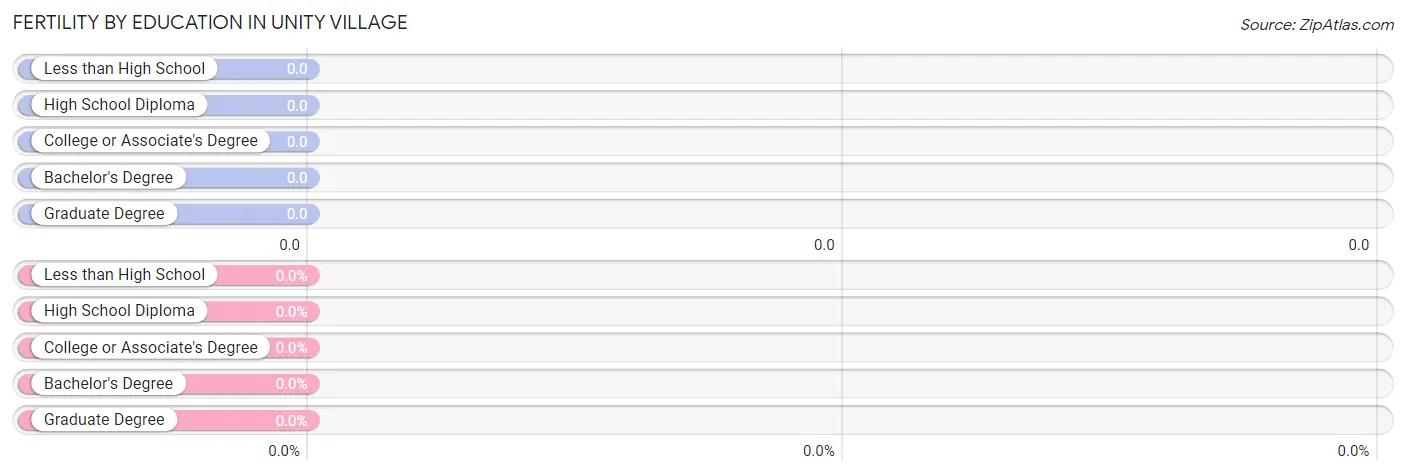
| Educational Attainment | Women with Births | Births / 1,000 Women |
| Less than High School | 0 (0.0%) | 0.0 |
| High School Diploma | 0 (0.0%) | 0.0 |
| College or Associate's Degree | 0 (0.0%) | 0.0 |
| Bachelor's Degree | 0 (0.0%) | 0.0 |
| Graduate Degree | 0 (0.0%) | 0.0 |
| Total | 0 (0.0%) | 0.0 |
Fertility by Education by Marriage Status in Unity Village
| Educational Attainment | Married | Unmarried |
| Less than High School | 0 (0.0%) | 0 (0.0%) |
| High School Diploma | 0 (0.0%) | 0 (0.0%) |
| College or Associate's Degree | 0 (0.0%) | 0 (0.0%) |
| Bachelor's Degree | 0 (0.0%) | 0 (0.0%) |
| Graduate Degree | 0 (0.0%) | 0 (0.0%) |
| Total | 0 (0.0%) | 0 (0.0%) |
Employment Characteristics in Unity Village
Employment by Class of Employer in Unity Village
Among the 35 employed individuals in Unity Village, private company employees (15 | 42.9%), not-for-profit organizations (13 | 37.1%), and federal government employees (4 | 11.4%) make up the most common classes of employment.
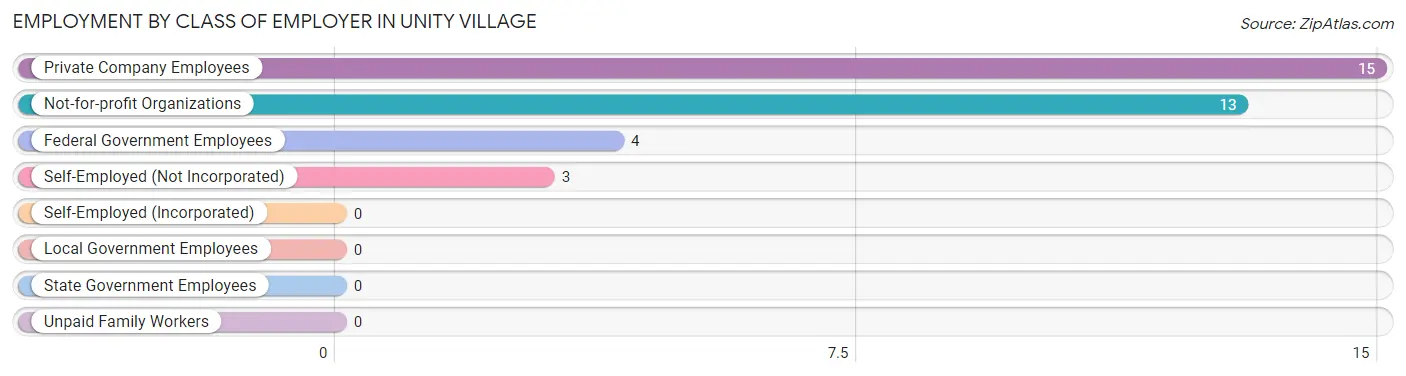
| Employer Class | # Employees | % Employees |
| Private Company Employees | 15 | 42.9% |
| Self-Employed (Incorporated) | 0 | 0.0% |
| Self-Employed (Not Incorporated) | 3 | 8.6% |
| Not-for-profit Organizations | 13 | 37.1% |
| Local Government Employees | 0 | 0.0% |
| State Government Employees | 0 | 0.0% |
| Federal Government Employees | 4 | 11.4% |
| Unpaid Family Workers | 0 | 0.0% |
| Total | 35 | 100.0% |
Employment Status by Age in Unity Village
According to the labor force statistics for Unity Village, out of the total population over 16 years of age (63), 57.1% or 36 individuals are in the labor force, with 2.8% or 1 of them unemployed. The age group with the highest labor force participation rate is 25 to 29 years, with 100.0% or 2 individuals in the labor force. Within the labor force, the 60 to 64 years age range has the highest percentage of unemployed individuals, with 12.5% or 1 of them being unemployed.
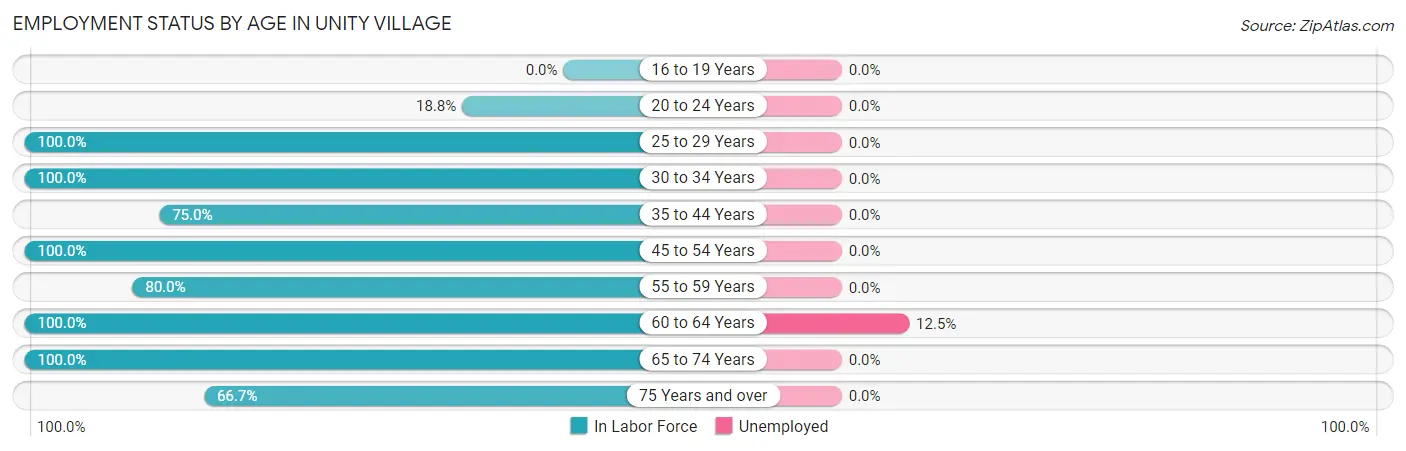
| Age Bracket | In Labor Force | Unemployed |
| 16 to 19 Years | 0 (0.0%) | 0 (0.0%) |
| 20 to 24 Years | 3 (18.8%) | 0 (0.0%) |
| 25 to 29 Years | 2 (100.0%) | 0 (0.0%) |
| 30 to 34 Years | 1 (100.0%) | 0 (0.0%) |
| 35 to 44 Years | 6 (75.0%) | 0 (0.0%) |
| 45 to 54 Years | 7 (100.0%) | 0 (0.0%) |
| 55 to 59 Years | 4 (80.0%) | 0 (0.0%) |
| 60 to 64 Years | 8 (100.0%) | 1 (12.5%) |
| 65 to 74 Years | 3 (100.0%) | 0 (0.0%) |
| 75 Years and over | 2 (66.7%) | 0 (0.0%) |
| Total | 36 (57.1%) | 1 (2.8%) |
Employment Status by Educational Attainment in Unity Village
According to labor force statistics for Unity Village, 90.3% of individuals (28) out of the total population between 25 and 64 years of age (31) are in the labor force, with 3.6% or 1 of them being unemployed. The group with the highest labor force participation rate are those with the educational attainment of high school diploma, with 100.0% or 2 individuals in the labor force. Within the labor force, individuals with college / associate degree education have the highest percentage of unemployment, with 6.7% or 1 of them being unemployed.
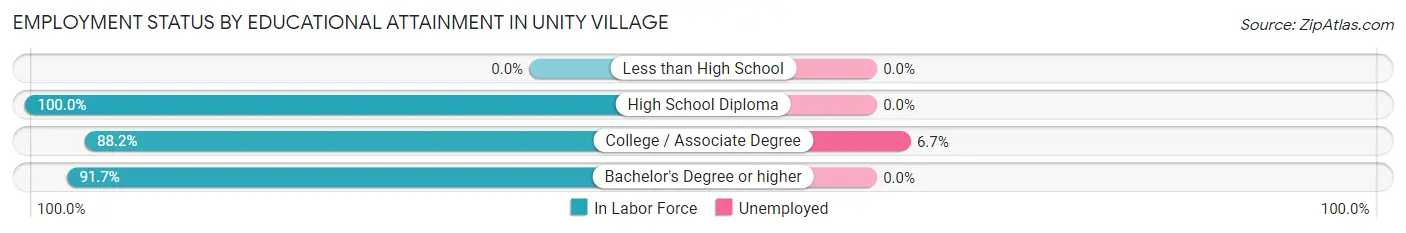
| Educational Attainment | In Labor Force | Unemployed |
| Less than High School | 0 (0.0%) | 0 (0.0%) |
| High School Diploma | 2 (100.0%) | 0 (0.0%) |
| College / Associate Degree | 15 (88.2%) | 1 (6.7%) |
| Bachelor's Degree or higher | 11 (91.7%) | 0 (0.0%) |
| Total | 28 (90.3%) | 1 (3.6%) |
Employment Occupations by Sex in Unity Village
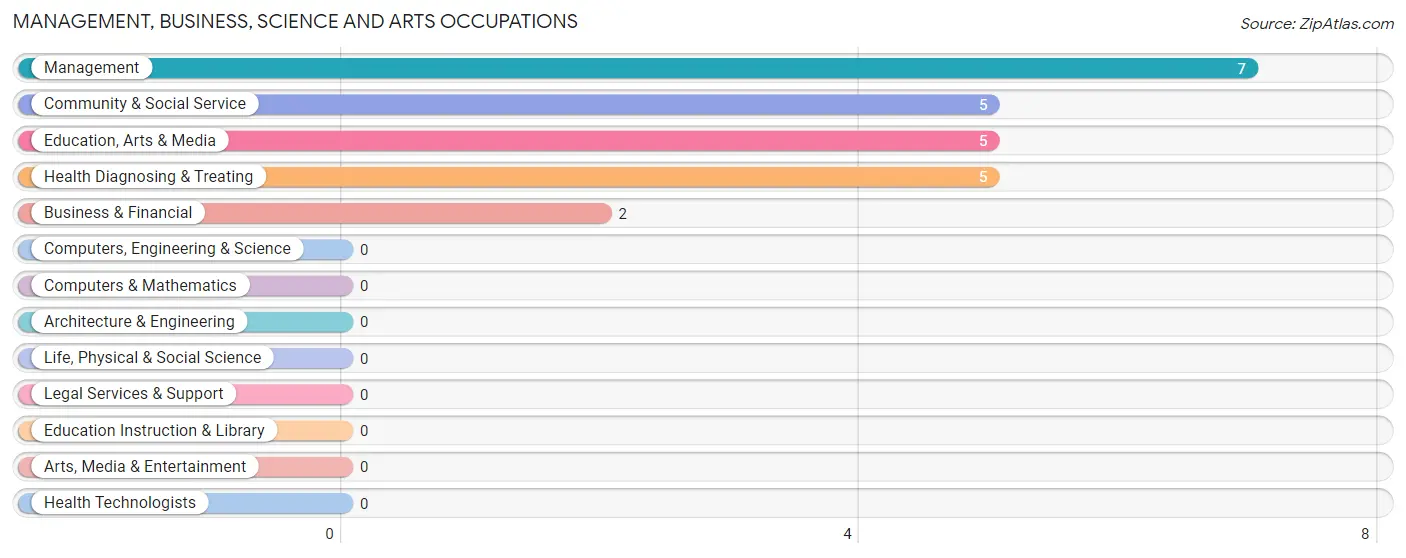
Management, Business, Science and Arts Occupations
The most common Management, Business, Science and Arts occupations in Unity Village are Management (7 | 20.0%), Community & Social Service (5 | 14.3%), Education, Arts & Media (5 | 14.3%), Health Diagnosing & Treating (5 | 14.3%), and Business & Financial (2 | 5.7%).
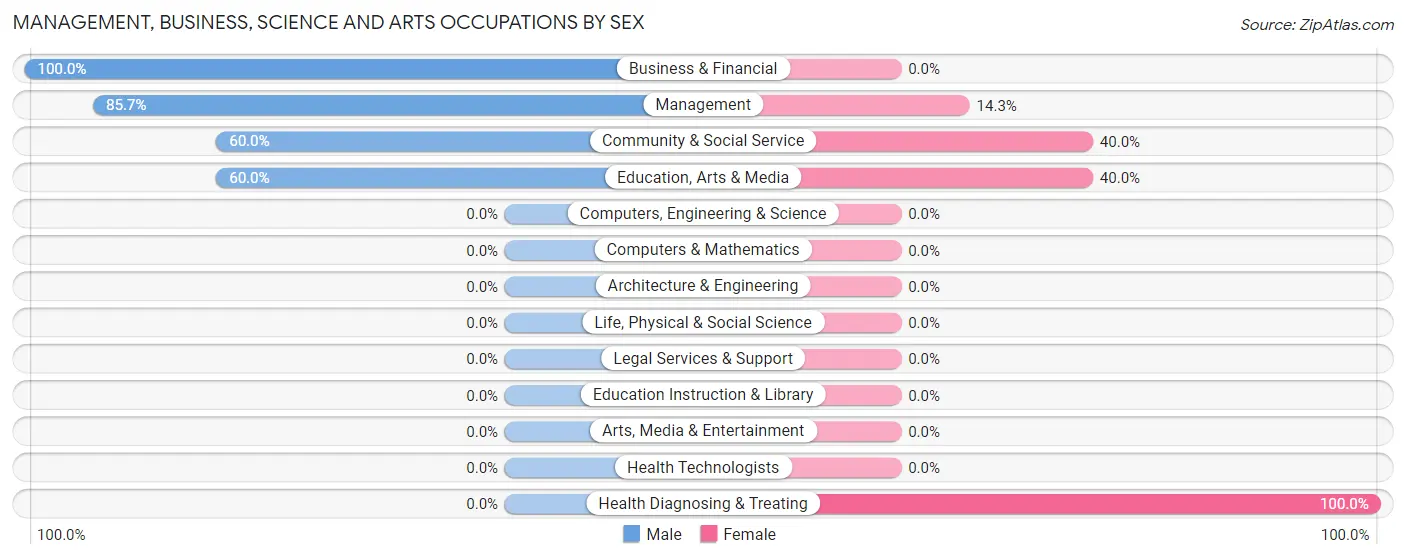
Management, Business, Science and Arts Occupations by Sex
Within the Management, Business, Science and Arts occupations in Unity Village, the most male-oriented occupations are Business & Financial (100.0%), Management (85.7%), and Community & Social Service (60.0%), while the most female-oriented occupations are Health Diagnosing & Treating (100.0%), Community & Social Service (40.0%), and Education, Arts & Media (40.0%).
| Occupation | Male | Female |
| Management | 6 (85.7%) | 1 (14.3%) |
| Business & Financial | 2 (100.0%) | 0 (0.0%) |
| Computers, Engineering & Science | 0 (0.0%) | 0 (0.0%) |
| Computers & Mathematics | 0 (0.0%) | 0 (0.0%) |
| Architecture & Engineering | 0 (0.0%) | 0 (0.0%) |
| Life, Physical & Social Science | 0 (0.0%) | 0 (0.0%) |
| Community & Social Service | 3 (60.0%) | 2 (40.0%) |
| Education, Arts & Media | 3 (60.0%) | 2 (40.0%) |
| Legal Services & Support | 0 (0.0%) | 0 (0.0%) |
| Education Instruction & Library | 0 (0.0%) | 0 (0.0%) |
| Arts, Media & Entertainment | 0 (0.0%) | 0 (0.0%) |
| Health Diagnosing & Treating | 0 (0.0%) | 5 (100.0%) |
| Health Technologists | 0 (0.0%) | 0 (0.0%) |
| Total (Category) | 11 (57.9%) | 8 (42.1%) |
| Total (Overall) | 13 (37.1%) | 22 (62.9%) |
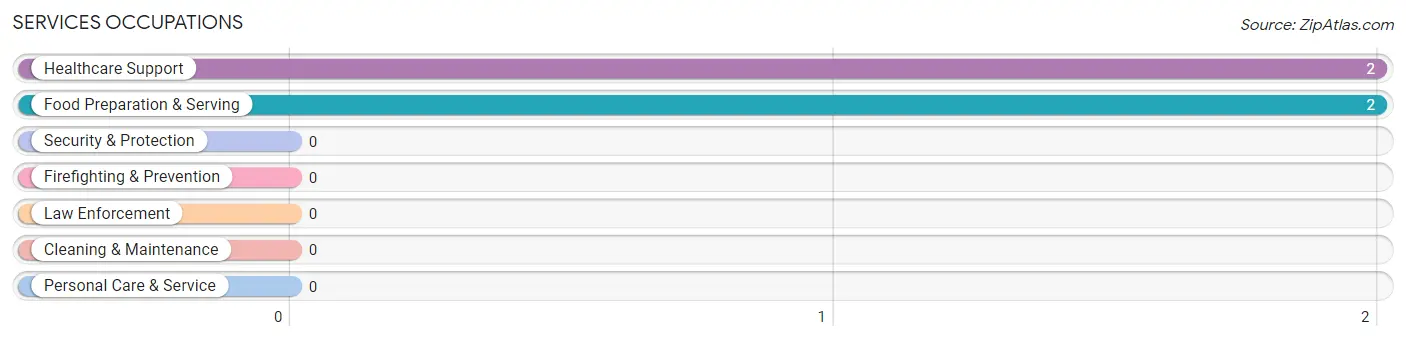
Services Occupations
The most common Services occupations in Unity Village are Healthcare Support (2 | 5.7%), and Food Preparation & Serving (2 | 5.7%).
Services Occupations by Sex
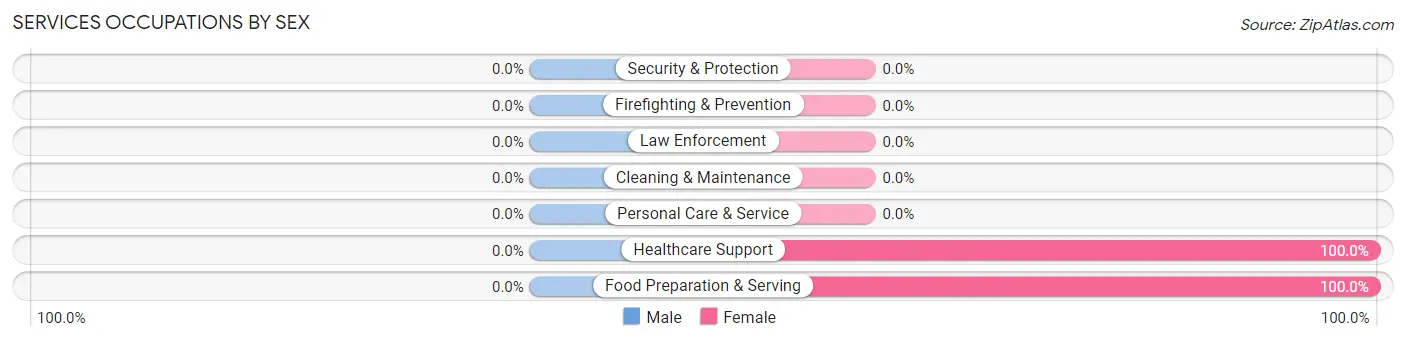
| Occupation | Male | Female |
| Healthcare Support | 0 (0.0%) | 2 (100.0%) |
| Security & Protection | 0 (0.0%) | 0 (0.0%) |
| Firefighting & Prevention | 0 (0.0%) | 0 (0.0%) |
| Law Enforcement | 0 (0.0%) | 0 (0.0%) |
| Food Preparation & Serving | 0 (0.0%) | 2 (100.0%) |
| Cleaning & Maintenance | 0 (0.0%) | 0 (0.0%) |
| Personal Care & Service | 0 (0.0%) | 0 (0.0%) |
| Total (Category) | 0 (0.0%) | 4 (100.0%) |
| Total (Overall) | 13 (37.1%) | 22 (62.9%) |
Sales and Office Occupations
The most common Sales and Office occupations in Unity Village are Office & Administration (7 | 20.0%), and Sales & Related (1 | 2.9%).
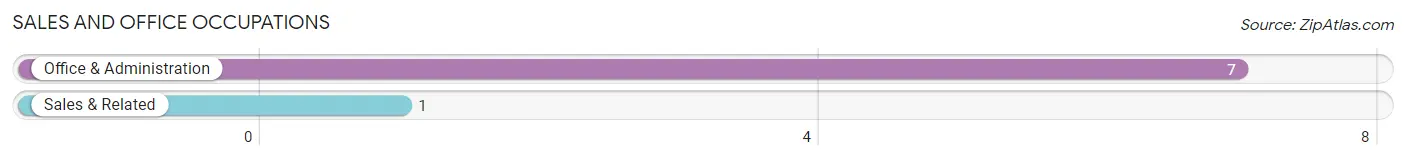
Sales and Office Occupations by Sex
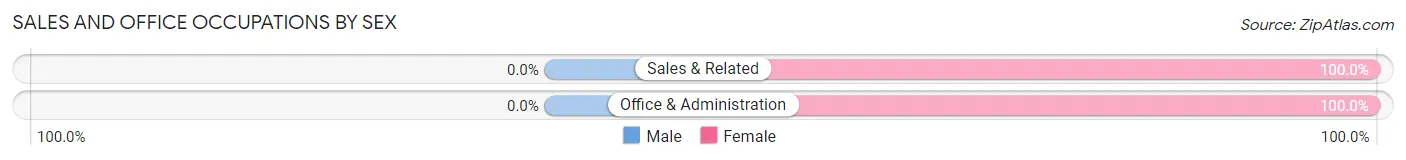
| Occupation | Male | Female |
| Sales & Related | 0 (0.0%) | 1 (100.0%) |
| Office & Administration | 0 (0.0%) | 7 (100.0%) |
| Total (Category) | 0 (0.0%) | 8 (100.0%) |
| Total (Overall) | 13 (37.1%) | 22 (62.9%) |
Natural Resources, Construction and Maintenance Occupations
The most common Natural Resources, Construction and Maintenance occupations in Unity Village are , and Installation, Maintenance & Repair (1 | 2.9%).
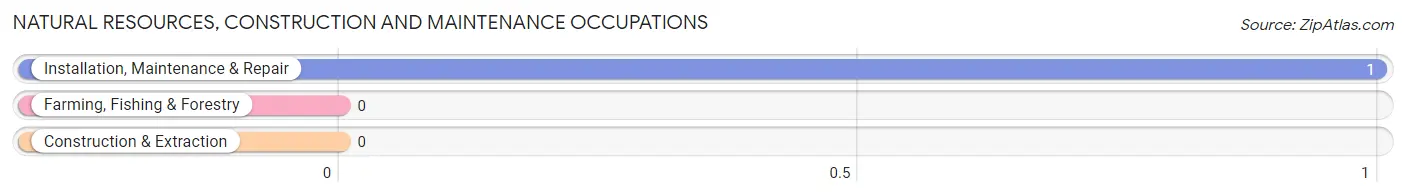
Natural Resources, Construction and Maintenance Occupations by Sex
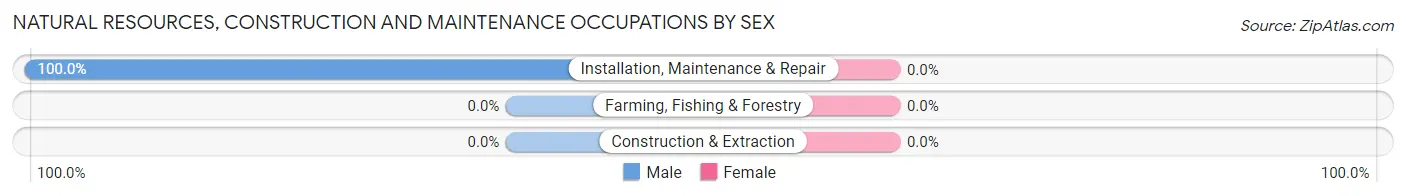
| Occupation | Male | Female |
| Farming, Fishing & Forestry | 0 (0.0%) | 0 (0.0%) |
| Construction & Extraction | 0 (0.0%) | 0 (0.0%) |
| Installation, Maintenance & Repair | 1 (100.0%) | 0 (0.0%) |
| Total (Category) | 1 (100.0%) | 0 (0.0%) |
| Total (Overall) | 13 (37.1%) | 22 (62.9%) |
Production, Transportation and Moving Occupations
The most common Production, Transportation and Moving occupations in Unity Village are , and Material Moving (3 | 8.6%).
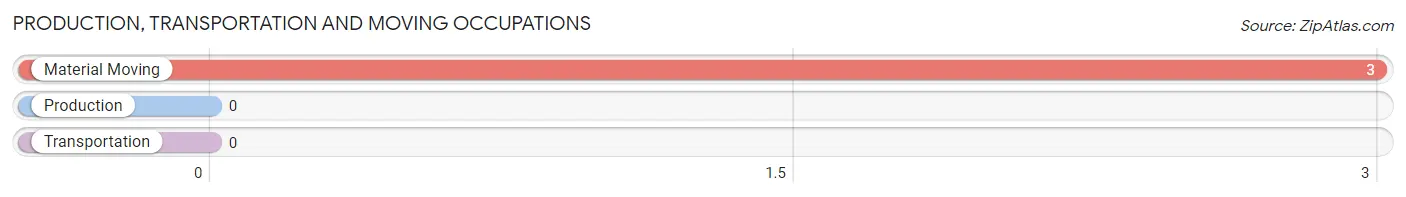
Production, Transportation and Moving Occupations by Sex
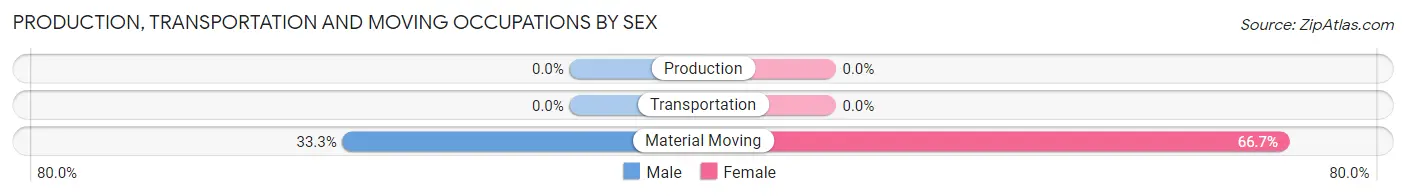
| Occupation | Male | Female |
| Production | 0 (0.0%) | 0 (0.0%) |
| Transportation | 0 (0.0%) | 0 (0.0%) |
| Material Moving | 1 (33.3%) | 2 (66.7%) |
| Total (Category) | 1 (33.3%) | 2 (66.7%) |
| Total (Overall) | 13 (37.1%) | 22 (62.9%) |
Employment Industries by Sex in Unity Village
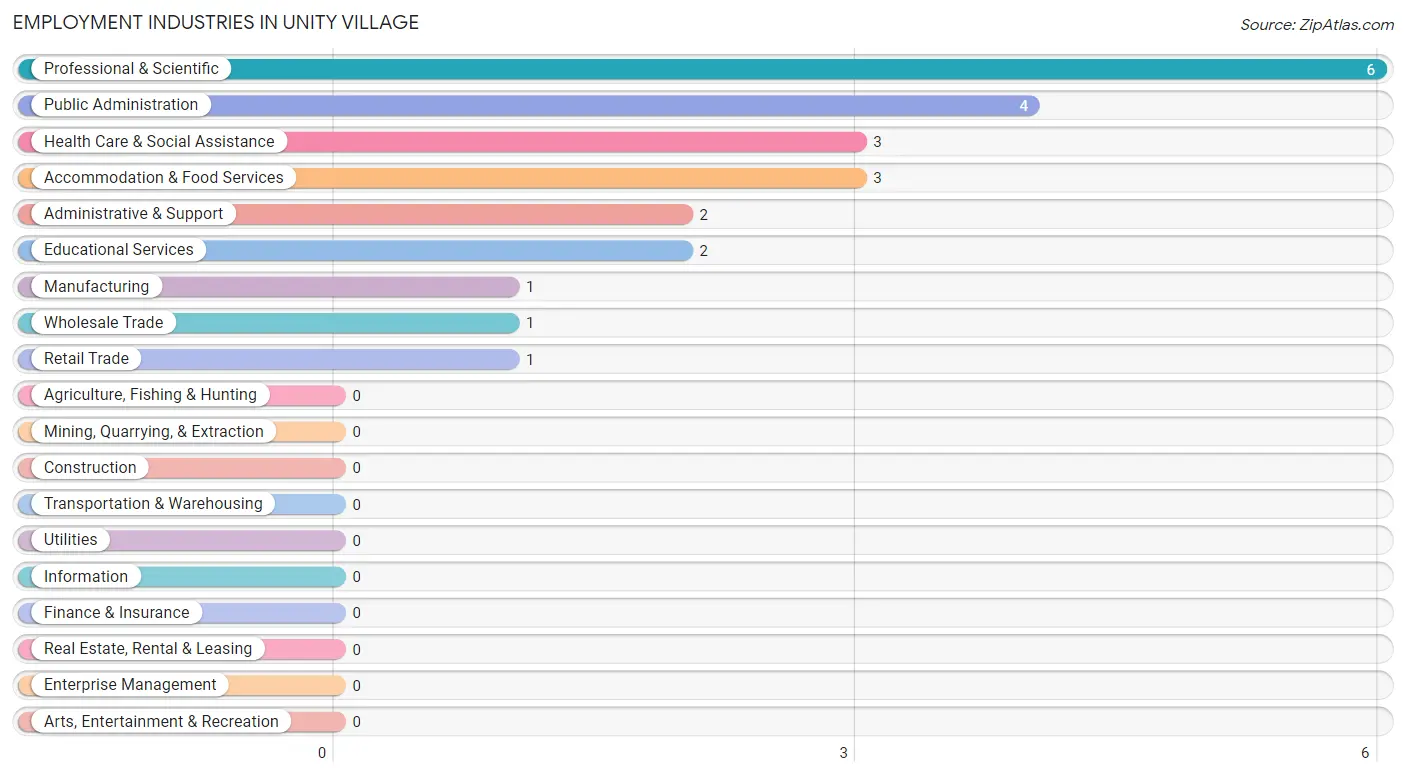
Employment Industries in Unity Village
The major employment industries in Unity Village include Professional & Scientific (6 | 17.1%), Public Administration (4 | 11.4%), Health Care & Social Assistance (3 | 8.6%), Accommodation & Food Services (3 | 8.6%), and Administrative & Support (2 | 5.7%).
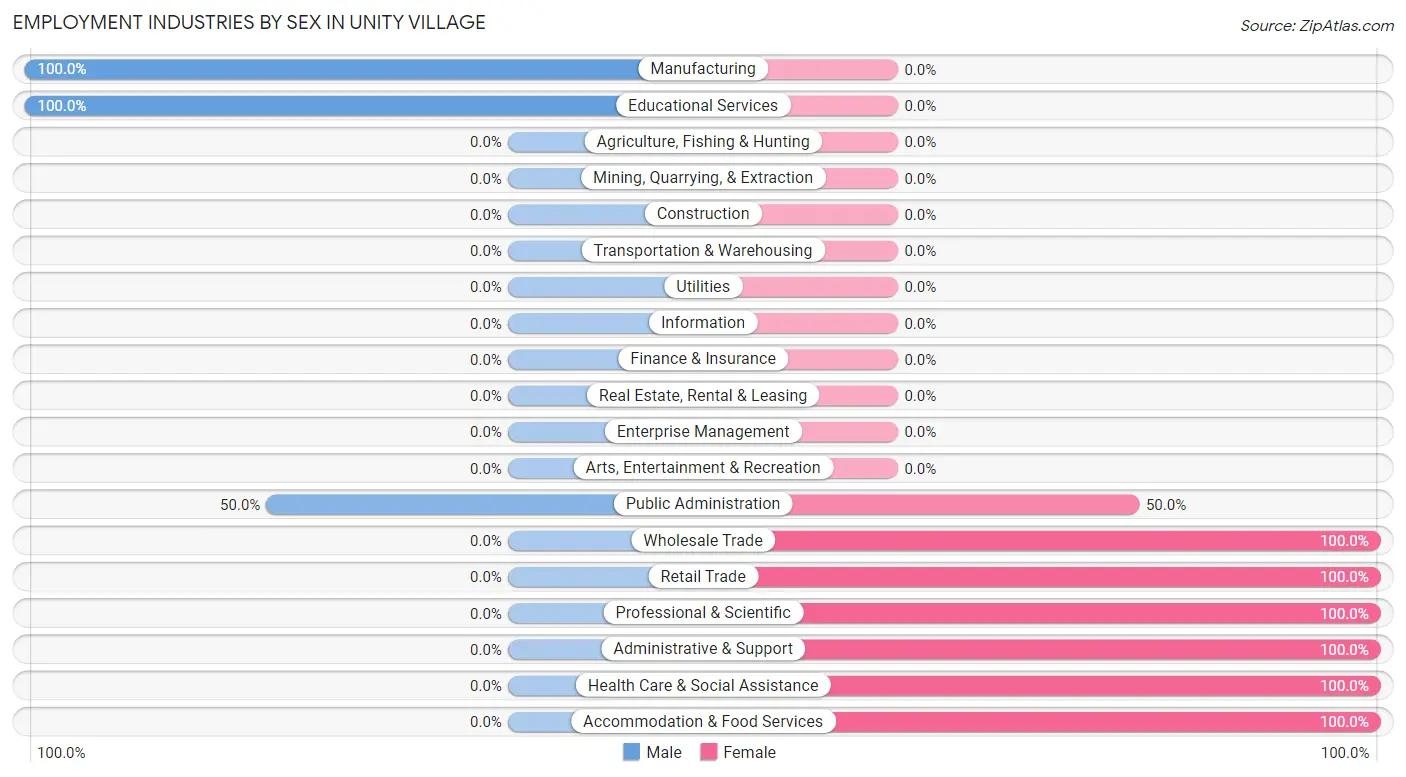
Employment Industries by Sex in Unity Village
The Unity Village industries that see more men than women are Manufacturing (100.0%), Educational Services (100.0%), and Public Administration (50.0%), whereas the industries that tend to have a higher number of women are Wholesale Trade (100.0%), Retail Trade (100.0%), and Professional & Scientific (100.0%).
| Industry | Male | Female |
| Agriculture, Fishing & Hunting | 0 (0.0%) | 0 (0.0%) |
| Mining, Quarrying, & Extraction | 0 (0.0%) | 0 (0.0%) |
| Construction | 0 (0.0%) | 0 (0.0%) |
| Manufacturing | 1 (100.0%) | 0 (0.0%) |
| Wholesale Trade | 0 (0.0%) | 1 (100.0%) |
| Retail Trade | 0 (0.0%) | 1 (100.0%) |
| Transportation & Warehousing | 0 (0.0%) | 0 (0.0%) |
| Utilities | 0 (0.0%) | 0 (0.0%) |
| Information | 0 (0.0%) | 0 (0.0%) |
| Finance & Insurance | 0 (0.0%) | 0 (0.0%) |
| Real Estate, Rental & Leasing | 0 (0.0%) | 0 (0.0%) |
| Professional & Scientific | 0 (0.0%) | 6 (100.0%) |
| Enterprise Management | 0 (0.0%) | 0 (0.0%) |
| Administrative & Support | 0 (0.0%) | 2 (100.0%) |
| Educational Services | 2 (100.0%) | 0 (0.0%) |
| Health Care & Social Assistance | 0 (0.0%) | 3 (100.0%) |
| Arts, Entertainment & Recreation | 0 (0.0%) | 0 (0.0%) |
| Accommodation & Food Services | 0 (0.0%) | 3 (100.0%) |
| Public Administration | 2 (50.0%) | 2 (50.0%) |
| Total | 13 (37.1%) | 22 (62.9%) |
Education in Unity Village
School Enrollment in Unity Village
The most common levels of schooling among the 32 students in Unity Village are college / undergraduate (30 | 93.8%), and elementary school (2 | 6.2%).
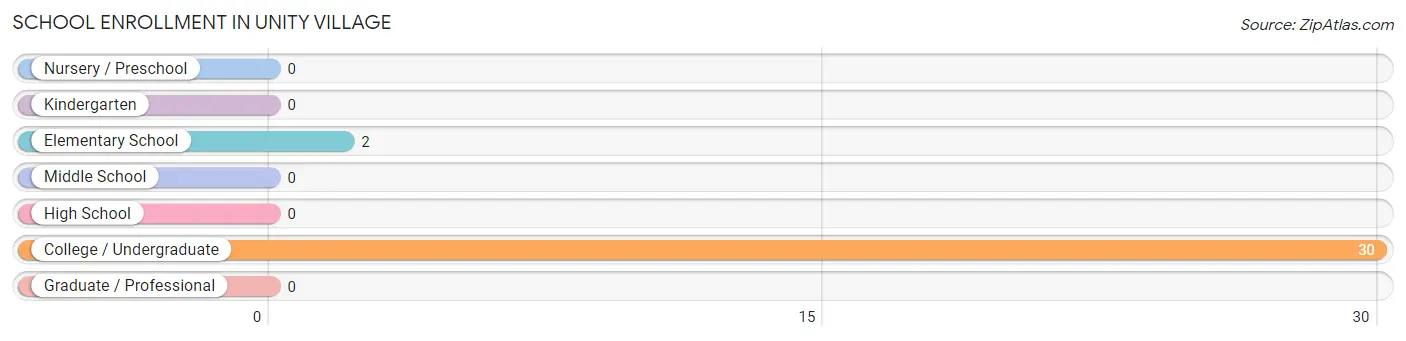
| School Level | # Students | % Students |
| Nursery / Preschool | 0 | 0.0% |
| Kindergarten | 0 | 0.0% |
| Elementary School | 2 | 6.2% |
| Middle School | 0 | 0.0% |
| High School | 0 | 0.0% |
| College / Undergraduate | 30 | 93.8% |
| Graduate / Professional | 0 | 0.0% |
| Total | 32 | 100.0% |
School Enrollment by Age by Funding Source in Unity Village
Out of a total of 32 students who are enrolled in schools in Unity Village, 21 (65.6%) attend a private institution, while the remaining 11 (34.4%) are enrolled in public schools. The age group of 35 years and over has the highest likelihood of being enrolled in private schools, with 4 (100.0% in the age bracket) enrolled. Conversely, the age group of 5 to 9 year old has the lowest likelihood of being enrolled in a private school, with 2 (100.0% in the age bracket) attending a public institution.
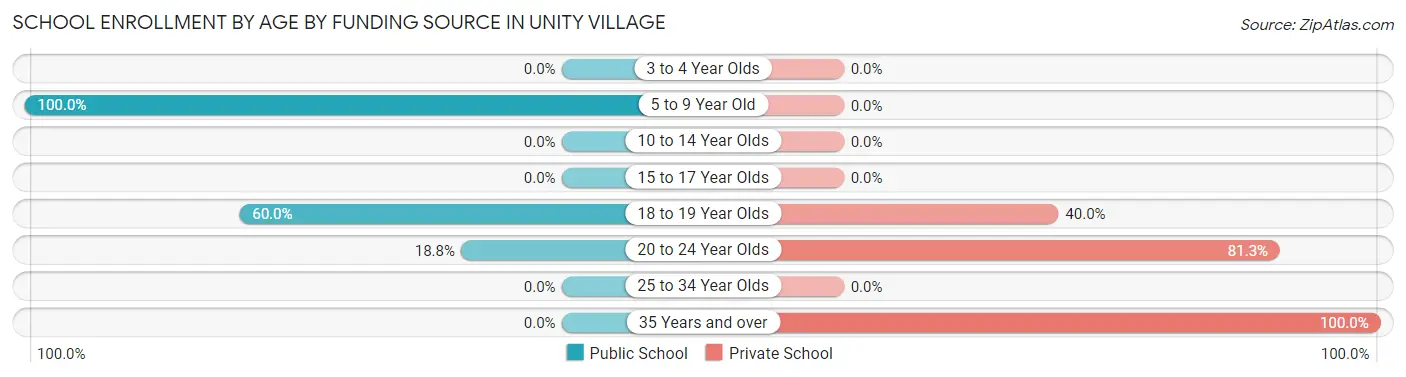
| Age Bracket | Public School | Private School |
| 3 to 4 Year Olds | 0 (0.0%) | 0 (0.0%) |
| 5 to 9 Year Old | 2 (100.0%) | 0 (0.0%) |
| 10 to 14 Year Olds | 0 (0.0%) | 0 (0.0%) |
| 15 to 17 Year Olds | 0 (0.0%) | 0 (0.0%) |
| 18 to 19 Year Olds | 6 (60.0%) | 4 (40.0%) |
| 20 to 24 Year Olds | 3 (18.8%) | 13 (81.2%) |
| 25 to 34 Year Olds | 0 (0.0%) | 0 (0.0%) |
| 35 Years and over | 0 (0.0%) | 4 (100.0%) |
| Total | 11 (34.4%) | 21 (65.6%) |
Educational Attainment by Field of Study in Unity Village
Business (7 | 43.8%), arts & humanities (4 | 25.0%), psychology (2 | 12.5%), social sciences (2 | 12.5%), and liberal arts & history (1 | 6.2%) are the most common fields of study among 16 individuals in Unity Village who have obtained a bachelor's degree or higher.
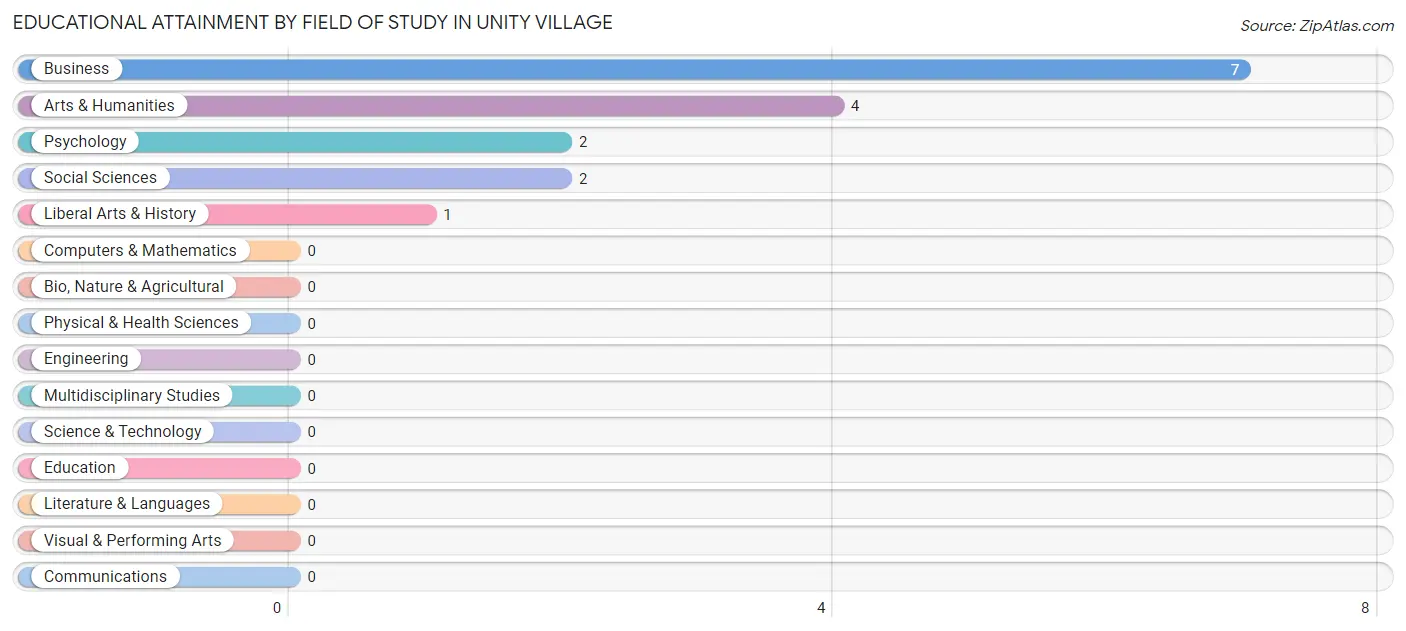
| Field of Study | # Graduates | % Graduates |
| Computers & Mathematics | 0 | 0.0% |
| Bio, Nature & Agricultural | 0 | 0.0% |
| Physical & Health Sciences | 0 | 0.0% |
| Psychology | 2 | 12.5% |
| Social Sciences | 2 | 12.5% |
| Engineering | 0 | 0.0% |
| Multidisciplinary Studies | 0 | 0.0% |
| Science & Technology | 0 | 0.0% |
| Business | 7 | 43.8% |
| Education | 0 | 0.0% |
| Literature & Languages | 0 | 0.0% |
| Liberal Arts & History | 1 | 6.2% |
| Visual & Performing Arts | 0 | 0.0% |
| Communications | 0 | 0.0% |
| Arts & Humanities | 4 | 25.0% |
| Total | 16 | 100.0% |
Transportation & Commute in Unity Village
Vehicle Availability by Sex in Unity Village
The most prevalent vehicle ownership categories in Unity Village are males with 1 vehicle (8, accounting for 61.5%) and females with 1 vehicle (18, making up 40.0%).
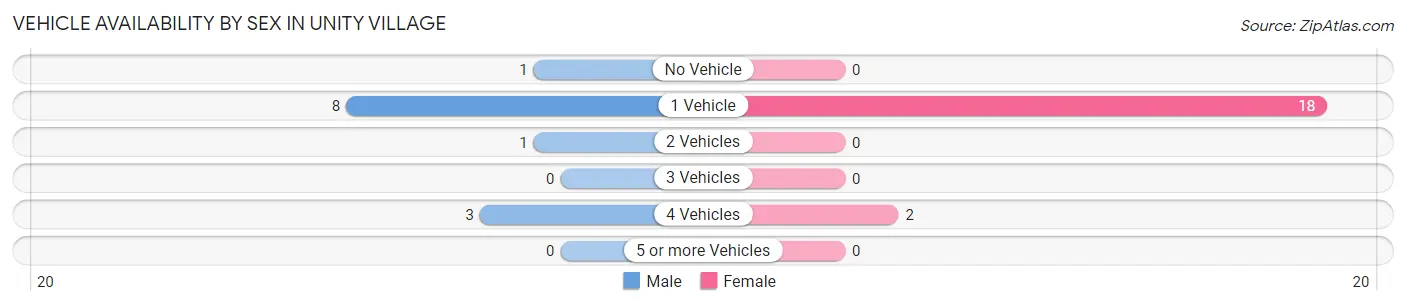
| Vehicles Available | Male | Female |
| No Vehicle | 1 (7.7%) | 0 (0.0%) |
| 1 Vehicle | 8 (61.5%) | 18 (90.0%) |
| 2 Vehicles | 1 (7.7%) | 0 (0.0%) |
| 3 Vehicles | 0 (0.0%) | 0 (0.0%) |
| 4 Vehicles | 3 (23.1%) | 2 (10.0%) |
| 5 or more Vehicles | 0 (0.0%) | 0 (0.0%) |
| Total | 13 (100.0%) | 20 (100.0%) |
Commute Time in Unity Village
The most frequently occuring commute durations in Unity Village are 5 to 9 minutes (8 commuters, 28.6%), less than 5 minutes (7 commuters, 25.0%), and 20 to 24 minutes (6 commuters, 21.4%).
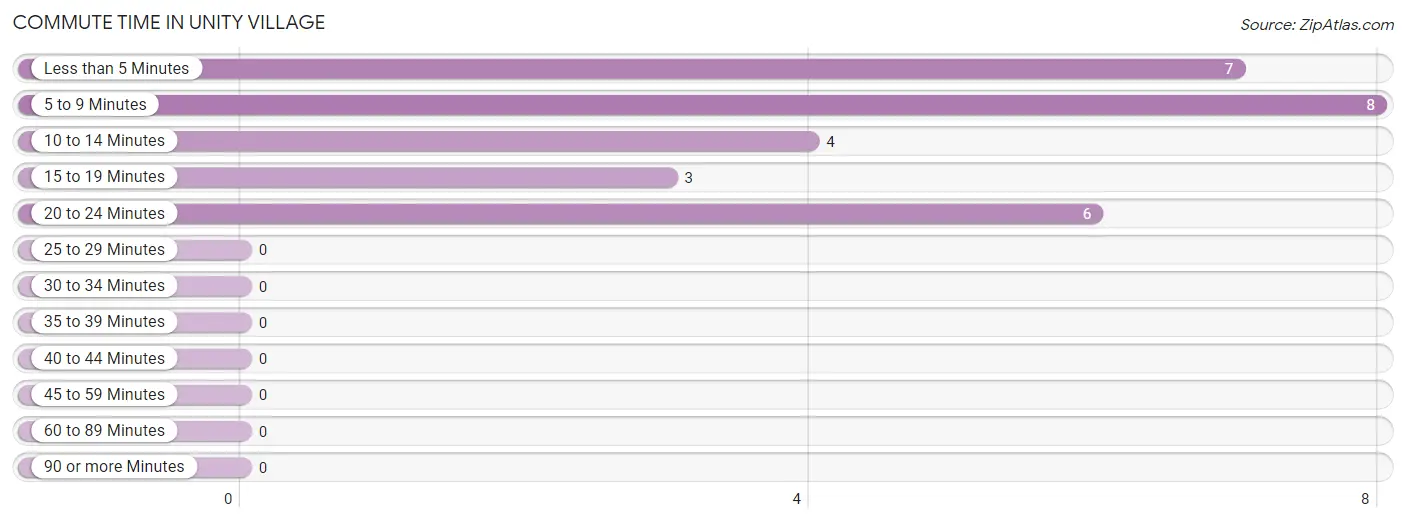
| Commute Time | # Commuters | % Commuters |
| Less than 5 Minutes | 7 | 25.0% |
| 5 to 9 Minutes | 8 | 28.6% |
| 10 to 14 Minutes | 4 | 14.3% |
| 15 to 19 Minutes | 3 | 10.7% |
| 20 to 24 Minutes | 6 | 21.4% |
| 25 to 29 Minutes | 0 | 0.0% |
| 30 to 34 Minutes | 0 | 0.0% |
| 35 to 39 Minutes | 0 | 0.0% |
| 40 to 44 Minutes | 0 | 0.0% |
| 45 to 59 Minutes | 0 | 0.0% |
| 60 to 89 Minutes | 0 | 0.0% |
| 90 or more Minutes | 0 | 0.0% |
Commute Time by Sex in Unity Village
The most common commute times in Unity Village are less than 5 minutes (5 commuters, 45.5%) for males and 5 to 9 minutes (5 commuters, 29.4%) for females.
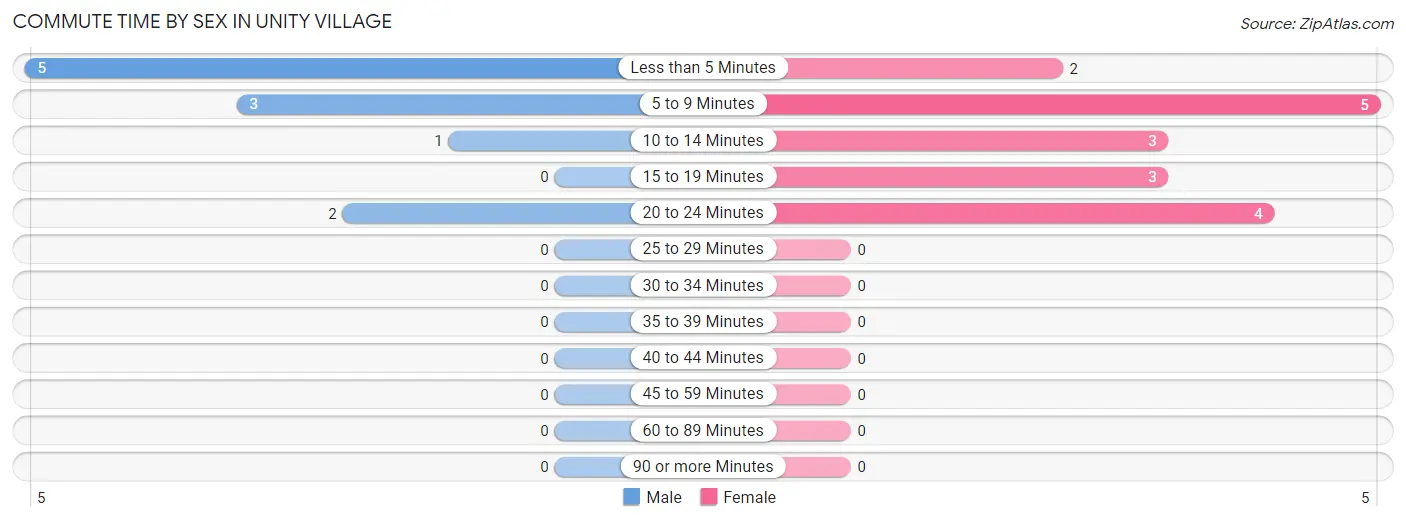
| Commute Time | Male | Female |
| Less than 5 Minutes | 5 (45.5%) | 2 (11.8%) |
| 5 to 9 Minutes | 3 (27.3%) | 5 (29.4%) |
| 10 to 14 Minutes | 1 (9.1%) | 3 (17.6%) |
| 15 to 19 Minutes | 0 (0.0%) | 3 (17.6%) |
| 20 to 24 Minutes | 2 (18.2%) | 4 (23.5%) |
| 25 to 29 Minutes | 0 (0.0%) | 0 (0.0%) |
| 30 to 34 Minutes | 0 (0.0%) | 0 (0.0%) |
| 35 to 39 Minutes | 0 (0.0%) | 0 (0.0%) |
| 40 to 44 Minutes | 0 (0.0%) | 0 (0.0%) |
| 45 to 59 Minutes | 0 (0.0%) | 0 (0.0%) |
| 60 to 89 Minutes | 0 (0.0%) | 0 (0.0%) |
| 90 or more Minutes | 0 (0.0%) | 0 (0.0%) |
Time of Departure to Work by Sex in Unity Village
The most frequent times of departure to work in Unity Village are 7:30 AM to 7:59 AM (4, 36.4%) for males and 12:00 PM to 3:59 PM (5, 29.4%) for females.
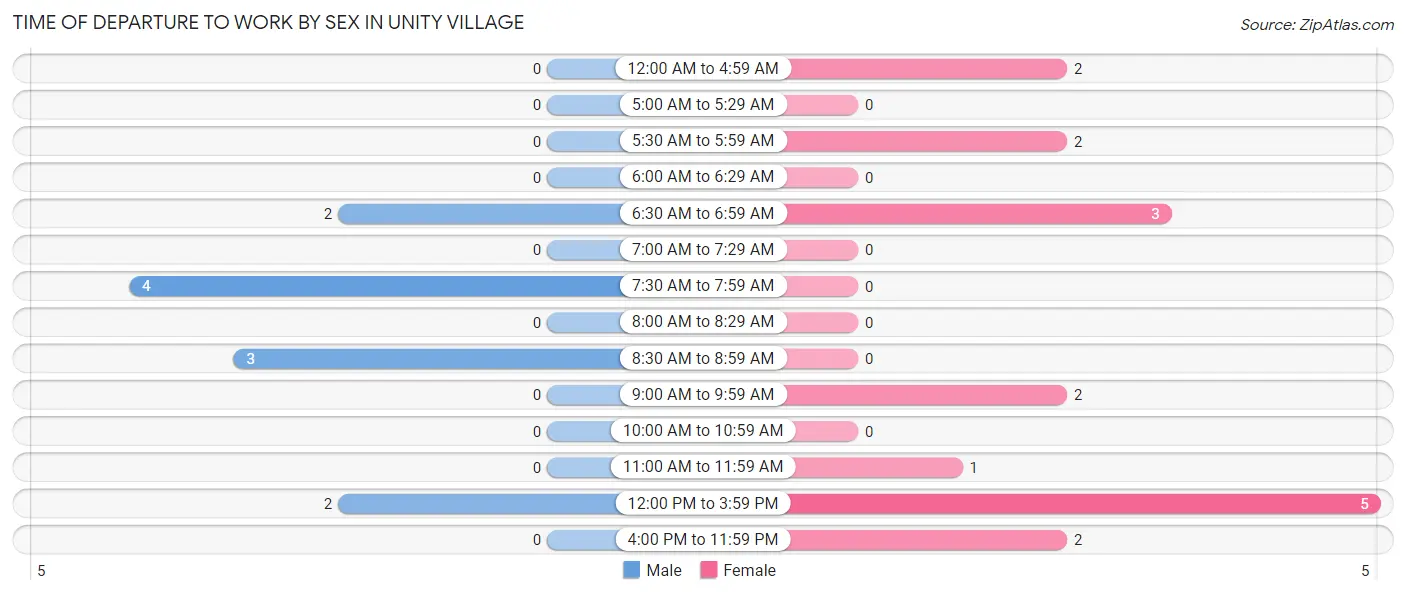
| Time of Departure | Male | Female |
| 12:00 AM to 4:59 AM | 0 (0.0%) | 2 (11.8%) |
| 5:00 AM to 5:29 AM | 0 (0.0%) | 0 (0.0%) |
| 5:30 AM to 5:59 AM | 0 (0.0%) | 2 (11.8%) |
| 6:00 AM to 6:29 AM | 0 (0.0%) | 0 (0.0%) |
| 6:30 AM to 6:59 AM | 2 (18.2%) | 3 (17.6%) |
| 7:00 AM to 7:29 AM | 0 (0.0%) | 0 (0.0%) |
| 7:30 AM to 7:59 AM | 4 (36.4%) | 0 (0.0%) |
| 8:00 AM to 8:29 AM | 0 (0.0%) | 0 (0.0%) |
| 8:30 AM to 8:59 AM | 3 (27.3%) | 0 (0.0%) |
| 9:00 AM to 9:59 AM | 0 (0.0%) | 2 (11.8%) |
| 10:00 AM to 10:59 AM | 0 (0.0%) | 0 (0.0%) |
| 11:00 AM to 11:59 AM | 0 (0.0%) | 1 (5.9%) |
| 12:00 PM to 3:59 PM | 2 (18.2%) | 5 (29.4%) |
| 4:00 PM to 11:59 PM | 0 (0.0%) | 2 (11.8%) |
| Total | 11 (100.0%) | 17 (100.0%) |
Housing Occupancy in Unity Village
Occupancy by Ownership in Unity Village
Of the total 32 dwellings in Unity Village, owner-occupied units account for 1 (3.1%), while renter-occupied units make up 31 (96.9%).
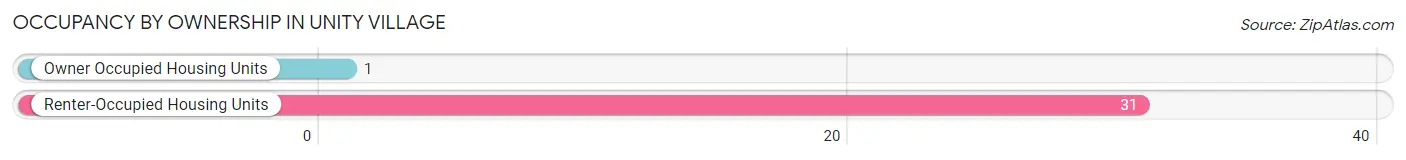
| Occupancy | # Housing Units | % Housing Units |
| Owner Occupied Housing Units | 1 | 3.1% |
| Renter-Occupied Housing Units | 31 | 96.9% |
| Total Occupied Housing Units | 32 | 100.0% |
Occupancy by Household Size in Unity Village
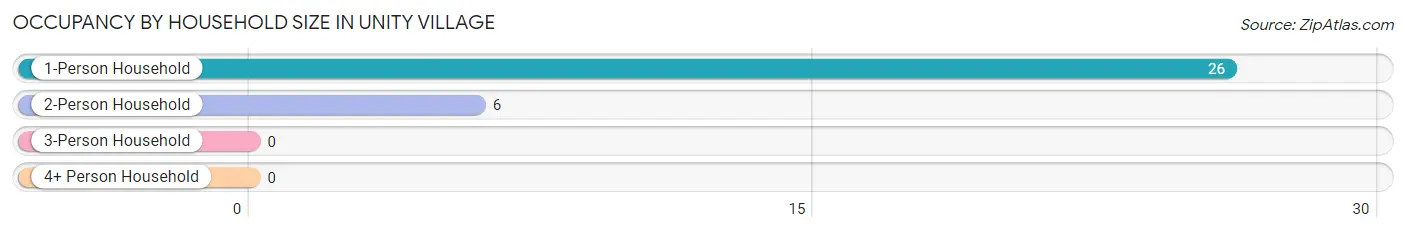
| Household Size | # Housing Units | % Housing Units |
| 1-Person Household | 26 | 81.2% |
| 2-Person Household | 6 | 18.8% |
| 3-Person Household | 0 | 0.0% |
| 4+ Person Household | 0 | 0.0% |
| Total Housing Units | 32 | 100.0% |
Occupancy by Ownership by Household Size in Unity Village
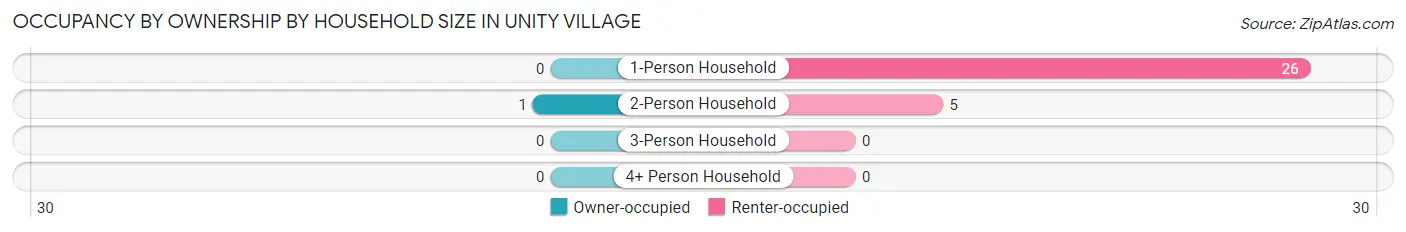
| Household Size | Owner-occupied | Renter-occupied |
| 1-Person Household | 0 (0.0%) | 26 (100.0%) |
| 2-Person Household | 1 (16.7%) | 5 (83.3%) |
| 3-Person Household | 0 (0.0%) | 0 (0.0%) |
| 4+ Person Household | 0 (0.0%) | 0 (0.0%) |
| Total Housing Units | 1 (3.1%) | 31 (96.9%) |
Occupancy by Educational Attainment in Unity Village
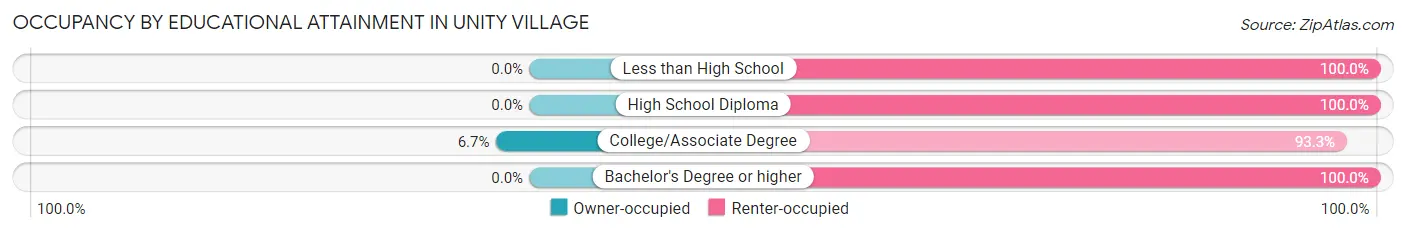
| Household Size | Owner-occupied | Renter-occupied |
| Less than High School | 0 (0.0%) | 1 (100.0%) |
| High School Diploma | 0 (0.0%) | 1 (100.0%) |
| College/Associate Degree | 1 (6.7%) | 14 (93.3%) |
| Bachelor's Degree or higher | 0 (0.0%) | 15 (100.0%) |
Occupancy by Age of Householder in Unity Village
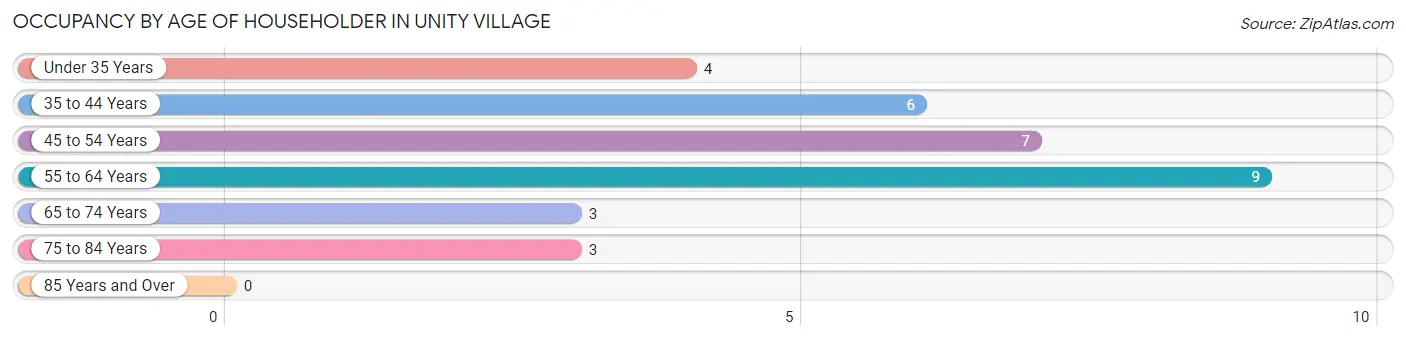
| Age Bracket | # Households | % Households |
| Under 35 Years | 4 | 12.5% |
| 35 to 44 Years | 6 | 18.8% |
| 45 to 54 Years | 7 | 21.9% |
| 55 to 64 Years | 9 | 28.1% |
| 65 to 74 Years | 3 | 9.4% |
| 75 to 84 Years | 3 | 9.4% |
| 85 Years and Over | 0 | 0.0% |
| Total | 32 | 100.0% |
Housing Finances in Unity Village
Median Income by Occupancy in Unity Village
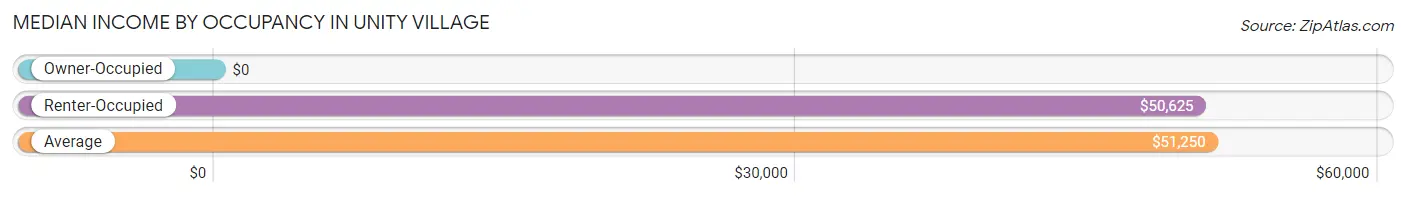
| Occupancy Type | # Households | Median Income |
| Owner-Occupied | 1 (3.1%) | $0 |
| Renter-Occupied | 31 (96.9%) | $50,625 |
| Average | 32 (100.0%) | $51,250 |
Occupancy by Householder Income Bracket in Unity Village
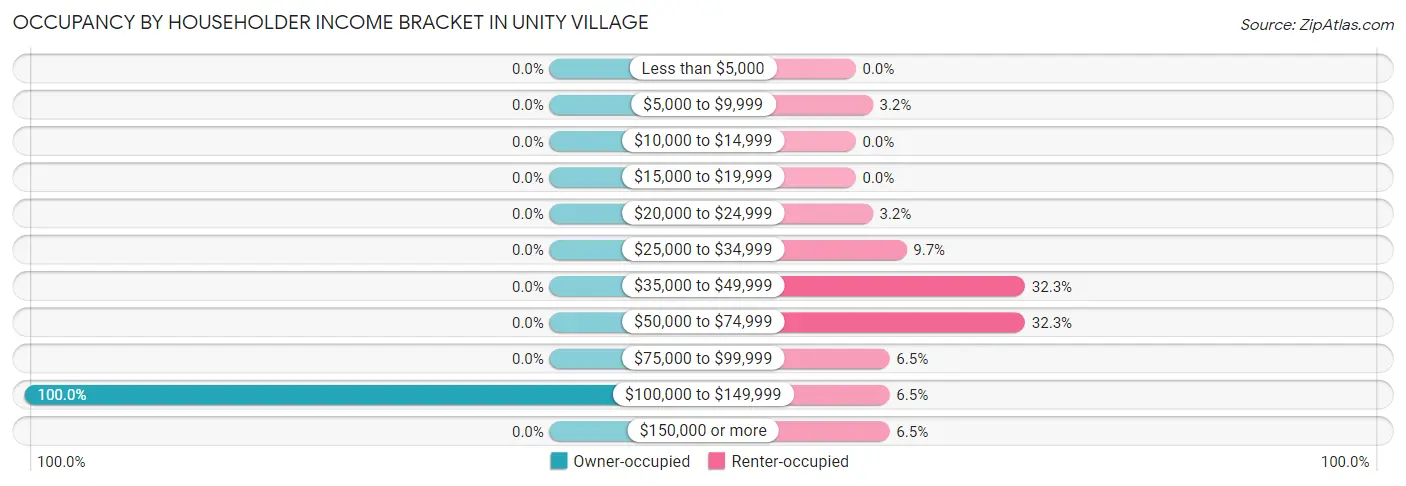
| Income Bracket | Owner-occupied | Renter-occupied |
| Less than $5,000 | 0 (0.0%) | 0 (0.0%) |
| $5,000 to $9,999 | 0 (0.0%) | 1 (3.2%) |
| $10,000 to $14,999 | 0 (0.0%) | 0 (0.0%) |
| $15,000 to $19,999 | 0 (0.0%) | 0 (0.0%) |
| $20,000 to $24,999 | 0 (0.0%) | 1 (3.2%) |
| $25,000 to $34,999 | 0 (0.0%) | 3 (9.7%) |
| $35,000 to $49,999 | 0 (0.0%) | 10 (32.3%) |
| $50,000 to $74,999 | 0 (0.0%) | 10 (32.3%) |
| $75,000 to $99,999 | 0 (0.0%) | 2 (6.5%) |
| $100,000 to $149,999 | 1 (100.0%) | 2 (6.5%) |
| $150,000 or more | 0 (0.0%) | 2 (6.5%) |
| Total | 1 (100.0%) | 31 (100.0%) |
Monthly Housing Cost Tiers in Unity Village
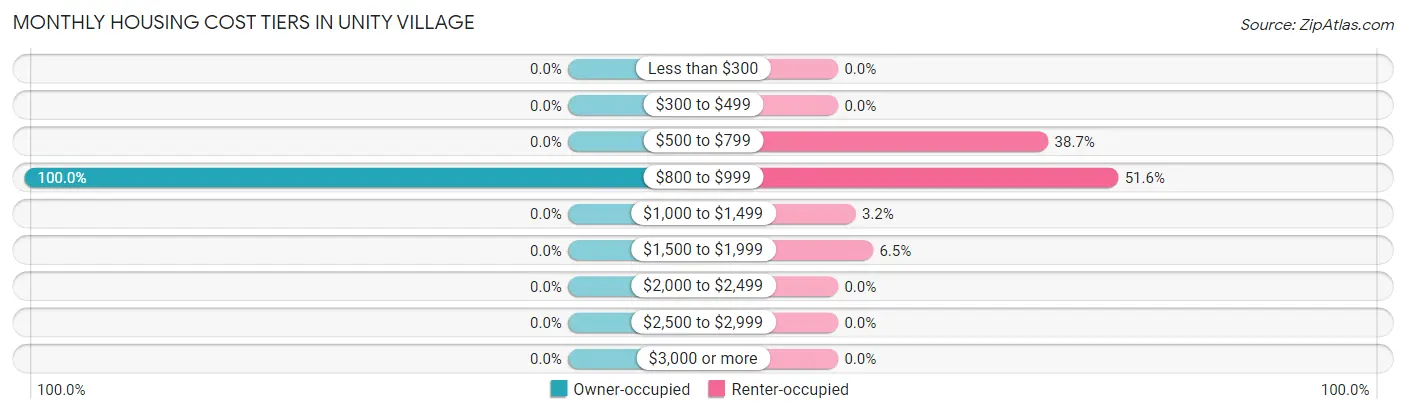
| Monthly Cost | Owner-occupied | Renter-occupied |
| Less than $300 | 0 (0.0%) | 0 (0.0%) |
| $300 to $499 | 0 (0.0%) | 0 (0.0%) |
| $500 to $799 | 0 (0.0%) | 12 (38.7%) |
| $800 to $999 | 1 (100.0%) | 16 (51.6%) |
| $1,000 to $1,499 | 0 (0.0%) | 1 (3.2%) |
| $1,500 to $1,999 | 0 (0.0%) | 2 (6.5%) |
| $2,000 to $2,499 | 0 (0.0%) | 0 (0.0%) |
| $2,500 to $2,999 | 0 (0.0%) | 0 (0.0%) |
| $3,000 or more | 0 (0.0%) | 0 (0.0%) |
| Total | 1 (100.0%) | 31 (100.0%) |
Physical Housing Characteristics in Unity Village
Housing Structures in Unity Village
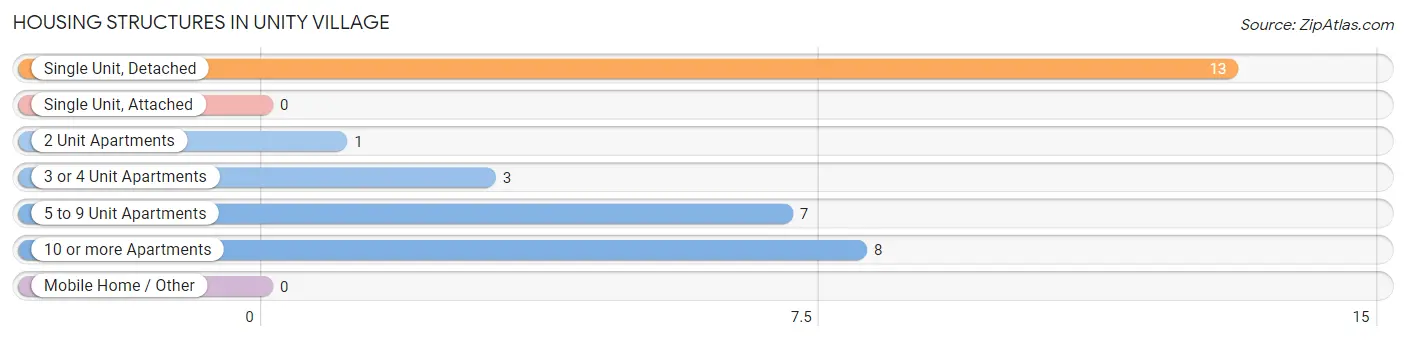
| Structure Type | # Housing Units | % Housing Units |
| Single Unit, Detached | 13 | 40.6% |
| Single Unit, Attached | 0 | 0.0% |
| 2 Unit Apartments | 1 | 3.1% |
| 3 or 4 Unit Apartments | 3 | 9.4% |
| 5 to 9 Unit Apartments | 7 | 21.9% |
| 10 or more Apartments | 8 | 25.0% |
| Mobile Home / Other | 0 | 0.0% |
| Total | 32 | 100.0% |
Housing Structures by Occupancy in Unity Village
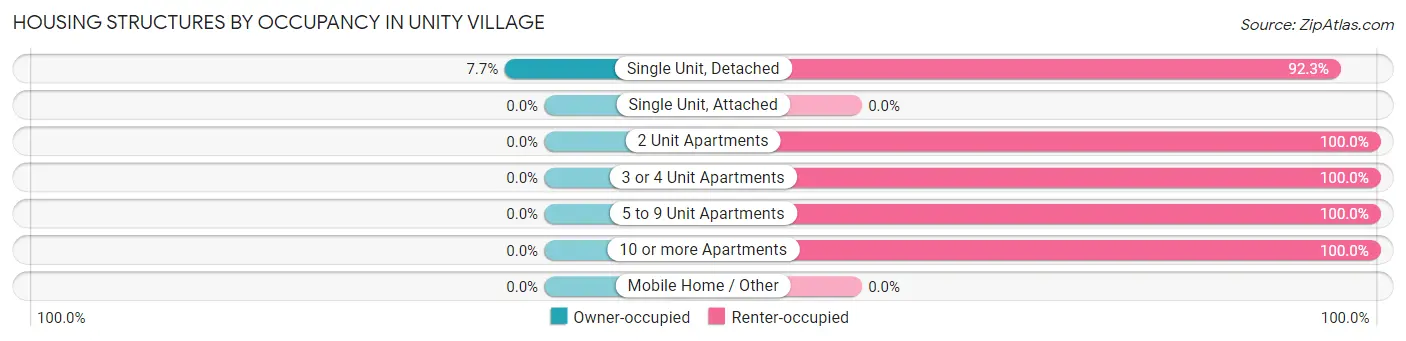
| Structure Type | Owner-occupied | Renter-occupied |
| Single Unit, Detached | 1 (7.7%) | 12 (92.3%) |
| Single Unit, Attached | 0 (0.0%) | 0 (0.0%) |
| 2 Unit Apartments | 0 (0.0%) | 1 (100.0%) |
| 3 or 4 Unit Apartments | 0 (0.0%) | 3 (100.0%) |
| 5 to 9 Unit Apartments | 0 (0.0%) | 7 (100.0%) |
| 10 or more Apartments | 0 (0.0%) | 8 (100.0%) |
| Mobile Home / Other | 0 (0.0%) | 0 (0.0%) |
| Total | 1 (3.1%) | 31 (96.9%) |
Housing Structures by Number of Rooms in Unity Village
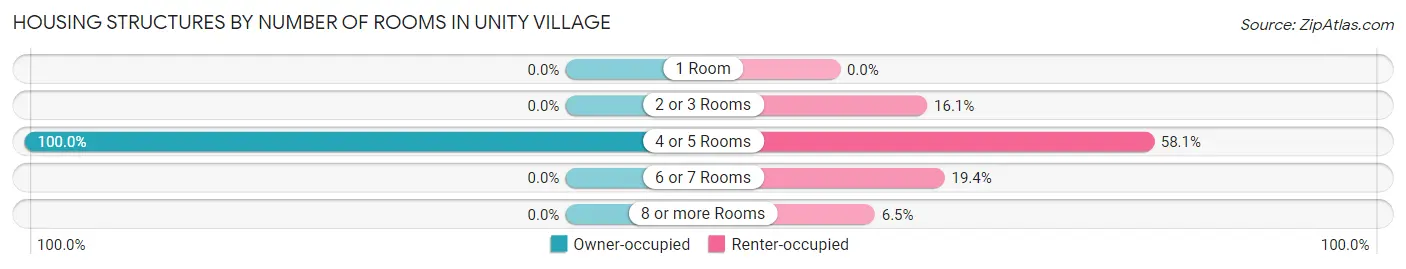
| Number of Rooms | Owner-occupied | Renter-occupied |
| 1 Room | 0 (0.0%) | 0 (0.0%) |
| 2 or 3 Rooms | 0 (0.0%) | 5 (16.1%) |
| 4 or 5 Rooms | 1 (100.0%) | 18 (58.1%) |
| 6 or 7 Rooms | 0 (0.0%) | 6 (19.4%) |
| 8 or more Rooms | 0 (0.0%) | 2 (6.5%) |
| Total | 1 (100.0%) | 31 (100.0%) |
Housing Structure by Heating Type in Unity Village
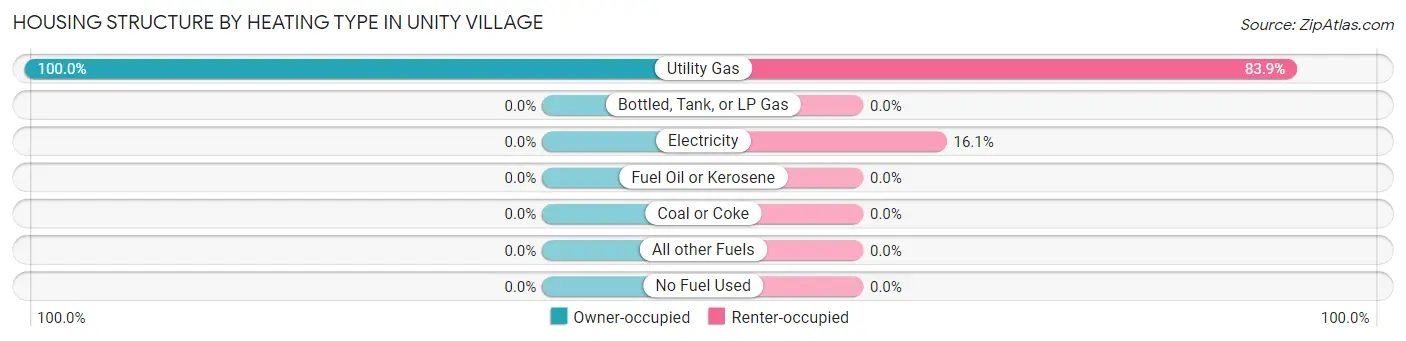
| Heating Type | Owner-occupied | Renter-occupied |
| Utility Gas | 1 (100.0%) | 26 (83.9%) |
| Bottled, Tank, or LP Gas | 0 (0.0%) | 0 (0.0%) |
| Electricity | 0 (0.0%) | 5 (16.1%) |
| Fuel Oil or Kerosene | 0 (0.0%) | 0 (0.0%) |
| Coal or Coke | 0 (0.0%) | 0 (0.0%) |
| All other Fuels | 0 (0.0%) | 0 (0.0%) |
| No Fuel Used | 0 (0.0%) | 0 (0.0%) |
| Total | 1 (100.0%) | 31 (100.0%) |
Household Vehicle Usage in Unity Village
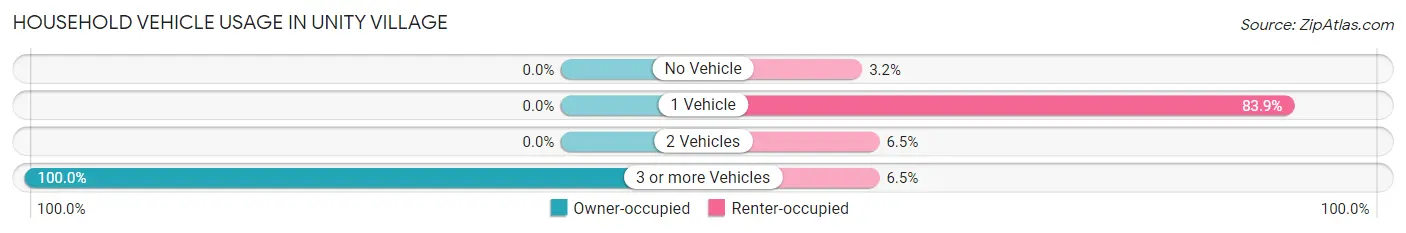
| Vehicles per Household | Owner-occupied | Renter-occupied |
| No Vehicle | 0 (0.0%) | 1 (3.2%) |
| 1 Vehicle | 0 (0.0%) | 26 (83.9%) |
| 2 Vehicles | 0 (0.0%) | 2 (6.5%) |
| 3 or more Vehicles | 1 (100.0%) | 2 (6.5%) |
| Total | 1 (100.0%) | 31 (100.0%) |
Real Estate & Mortgages in Unity Village
Real Estate and Mortgage Overview in Unity Village
| Characteristic | Without Mortgage | With Mortgage |
| Housing Units | 1 | 0 |
| Median Property Value | - | - |
| Median Household Income | - | - |
| Monthly Housing Costs | - | - |
| Real Estate Taxes | - | - |
Property Value by Mortgage Status in Unity Village
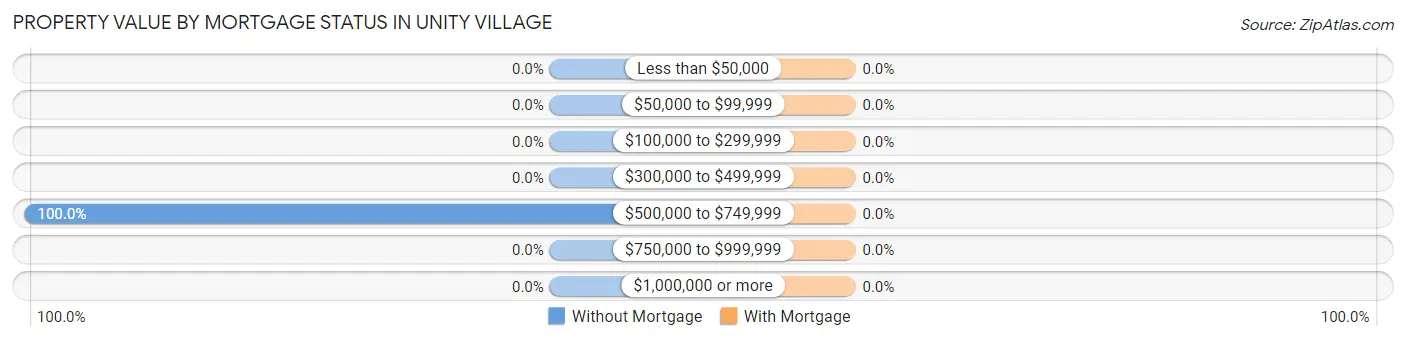
| Property Value | Without Mortgage | With Mortgage |
| Less than $50,000 | 0 (0.0%) | 0 (0.0%) |
| $50,000 to $99,999 | 0 (0.0%) | 0 (0.0%) |
| $100,000 to $299,999 | 0 (0.0%) | 0 (0.0%) |
| $300,000 to $499,999 | 0 (0.0%) | 0 (0.0%) |
| $500,000 to $749,999 | 1 (100.0%) | 0 (0.0%) |
| $750,000 to $999,999 | 0 (0.0%) | 0 (0.0%) |
| $1,000,000 or more | 0 (0.0%) | 0 (0.0%) |
| Total | 1 (100.0%) | 0 (0.0%) |
Household Income by Mortgage Status in Unity Village
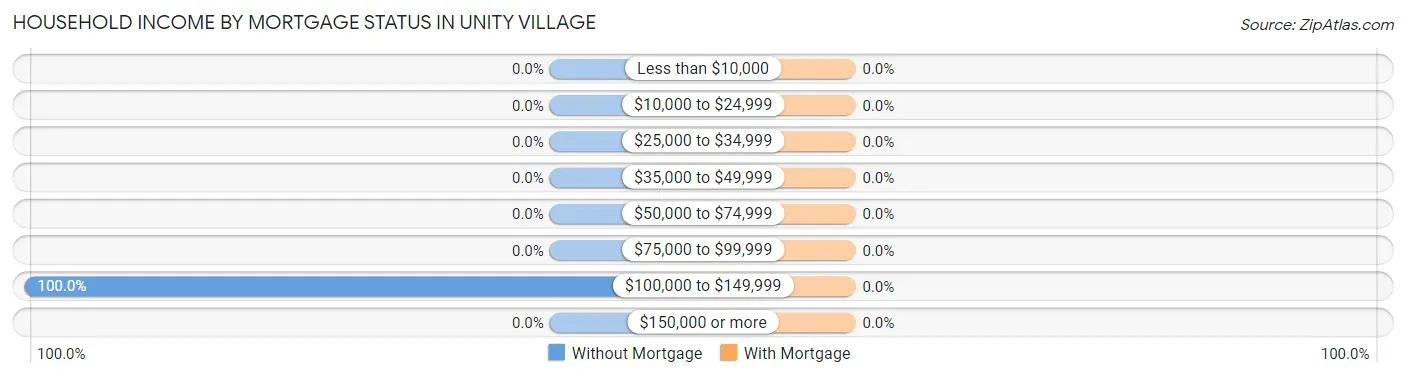
| Household Income | Without Mortgage | With Mortgage |
| Less than $10,000 | 0 (0.0%) | 0 (0.0%) |
| $10,000 to $24,999 | 0 (0.0%) | 0 (0.0%) |
| $25,000 to $34,999 | 0 (0.0%) | 0 (0.0%) |
| $35,000 to $49,999 | 0 (0.0%) | 0 (0.0%) |
| $50,000 to $74,999 | 0 (0.0%) | 0 (0.0%) |
| $75,000 to $99,999 | 0 (0.0%) | 0 (0.0%) |
| $100,000 to $149,999 | 1 (100.0%) | 0 (0.0%) |
| $150,000 or more | 0 (0.0%) | 0 (0.0%) |
| Total | 1 (100.0%) | 0 (0.0%) |
Property Value to Household Income Ratio in Unity Village
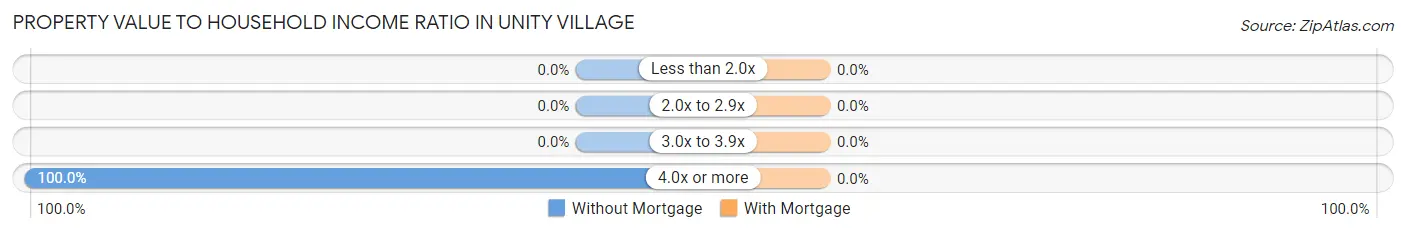
| Value-to-Income Ratio | Without Mortgage | With Mortgage |
| Less than 2.0x | 0 (0.0%) | 0 (0.0%) |
| 2.0x to 2.9x | 0 (0.0%) | 0 (0.0%) |
| 3.0x to 3.9x | 0 (0.0%) | 0 (0.0%) |
| 4.0x or more | 1 (100.0%) | 0 (0.0%) |
| Total | 1 (100.0%) | 0 (0.0%) |
Real Estate Taxes by Mortgage Status in Unity Village
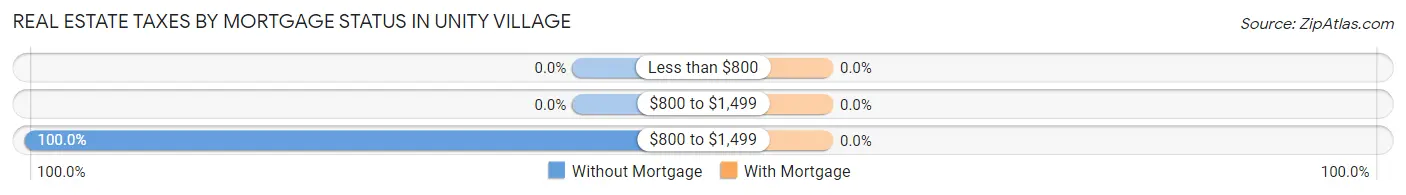
| Property Taxes | Without Mortgage | With Mortgage |
| Less than $800 | 0 (0.0%) | 0 (0.0%) |
| $800 to $1,499 | 0 (0.0%) | 0 (0.0%) |
| $800 to $1,499 | 1 (100.0%) | 0 (0.0%) |
| Total | 1 (100.0%) | 0 (0.0%) |
Health & Disability in Unity Village
Health Insurance Coverage by Age in Unity Village
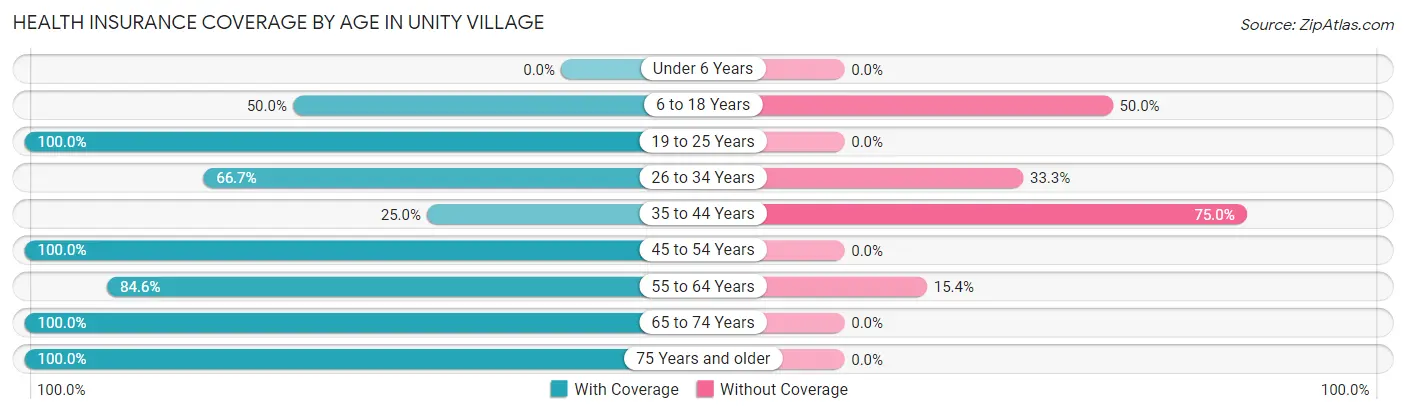
| Age Bracket | With Coverage | Without Coverage |
| Under 6 Years | 0 (0.0%) | 0 (0.0%) |
| 6 to 18 Years | 2 (50.0%) | 2 (50.0%) |
| 19 to 25 Years | 24 (100.0%) | 0 (0.0%) |
| 26 to 34 Years | 2 (66.7%) | 1 (33.3%) |
| 35 to 44 Years | 2 (25.0%) | 6 (75.0%) |
| 45 to 54 Years | 7 (100.0%) | 0 (0.0%) |
| 55 to 64 Years | 11 (84.6%) | 2 (15.4%) |
| 65 to 74 Years | 3 (100.0%) | 0 (0.0%) |
| 75 Years and older | 3 (100.0%) | 0 (0.0%) |
| Total | 54 (83.1%) | 11 (16.9%) |
Health Insurance Coverage by Citizenship Status in Unity Village
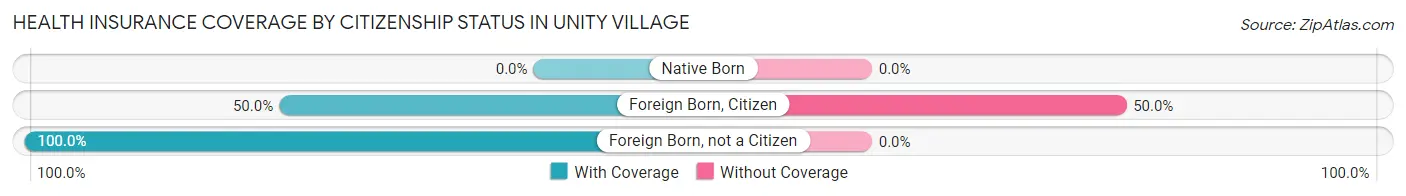
| Citizenship Status | With Coverage | Without Coverage |
| Native Born | 0 (0.0%) | 0 (0.0%) |
| Foreign Born, Citizen | 2 (50.0%) | 2 (50.0%) |
| Foreign Born, not a Citizen | 24 (100.0%) | 0 (0.0%) |
Health Insurance Coverage by Household Income in Unity Village
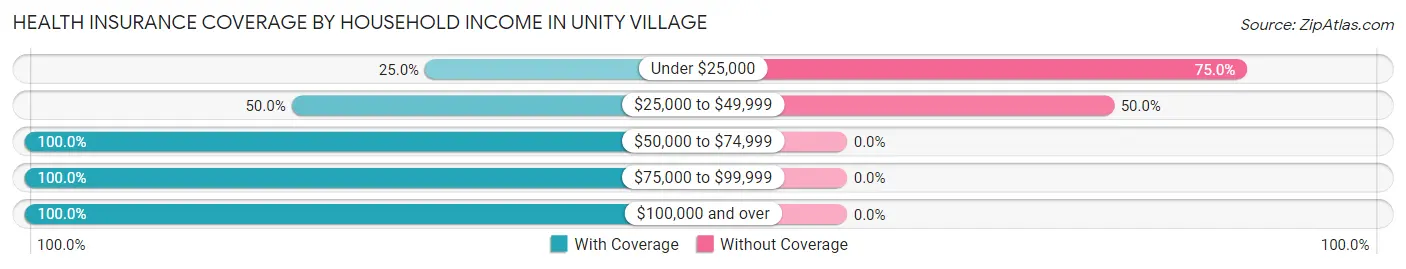
| Household Income | With Coverage | Without Coverage |
| Under $25,000 | 1 (25.0%) | 3 (75.0%) |
| $25,000 to $49,999 | 8 (50.0%) | 8 (50.0%) |
| $50,000 to $74,999 | 10 (100.0%) | 0 (0.0%) |
| $75,000 to $99,999 | 2 (100.0%) | 0 (0.0%) |
| $100,000 and over | 8 (100.0%) | 0 (0.0%) |
Public vs Private Health Insurance Coverage by Age in Unity Village
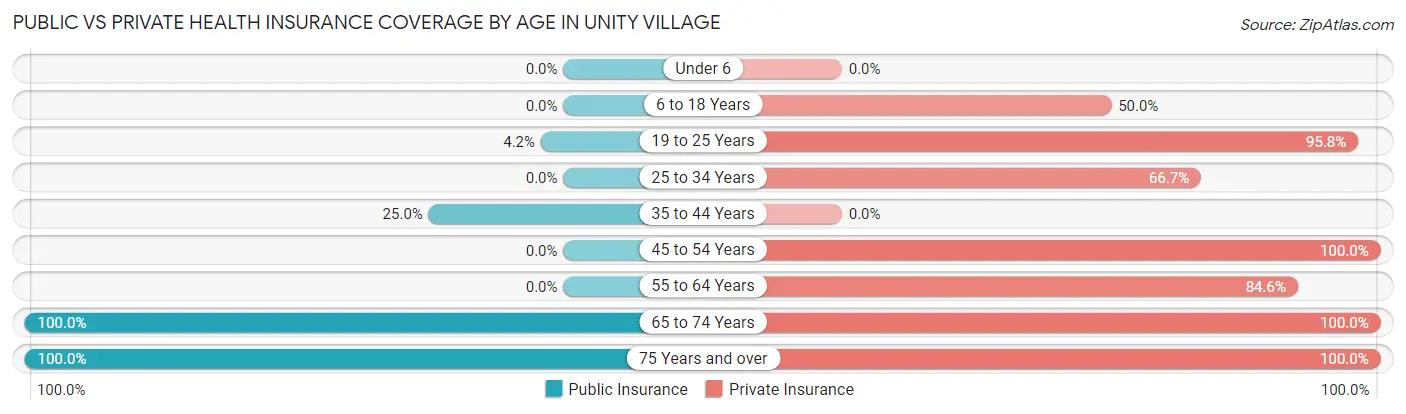
| Age Bracket | Public Insurance | Private Insurance |
| Under 6 | 0 (0.0%) | 0 (0.0%) |
| 6 to 18 Years | 0 (0.0%) | 2 (50.0%) |
| 19 to 25 Years | 1 (4.2%) | 23 (95.8%) |
| 25 to 34 Years | 0 (0.0%) | 2 (66.7%) |
| 35 to 44 Years | 2 (25.0%) | 0 (0.0%) |
| 45 to 54 Years | 0 (0.0%) | 7 (100.0%) |
| 55 to 64 Years | 0 (0.0%) | 11 (84.6%) |
| 65 to 74 Years | 3 (100.0%) | 3 (100.0%) |
| 75 Years and over | 3 (100.0%) | 3 (100.0%) |
| Total | 9 (13.9%) | 51 (78.5%) |
Disability Status by Sex by Age in Unity Village
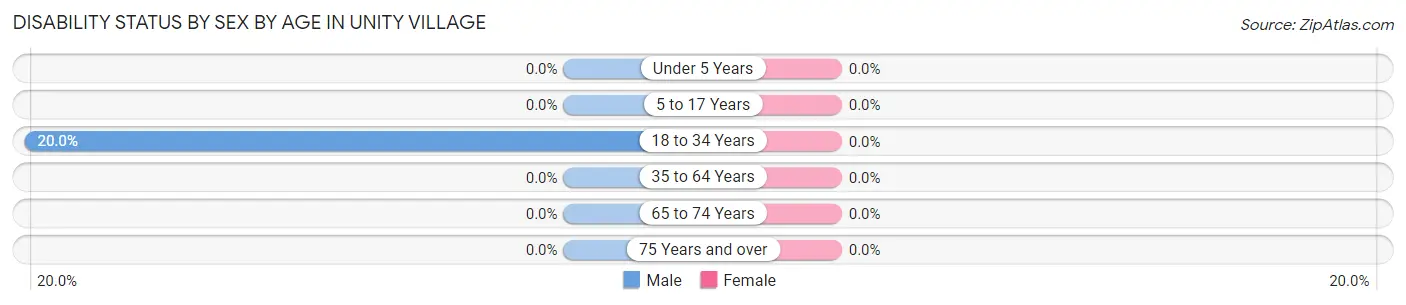
| Age Bracket | Male | Female |
| Under 5 Years | 0 (0.0%) | 0 (0.0%) |
| 5 to 17 Years | 0 (0.0%) | 0 (0.0%) |
| 18 to 34 Years | 1 (20.0%) | 0 (0.0%) |
| 35 to 64 Years | 0 (0.0%) | 0 (0.0%) |
| 65 to 74 Years | 0 (0.0%) | 0 (0.0%) |
| 75 Years and over | 0 (0.0%) | 0 (0.0%) |
Disability Class by Sex by Age in Unity Village
Disability Class: Hearing Difficulty
| Age Bracket | Male | Female |
| Under 5 Years | 0 (0.0%) | 0 (0.0%) |
| 5 to 17 Years | 0 (0.0%) | 0 (0.0%) |
| 18 to 34 Years | 0 (0.0%) | 0 (0.0%) |
| 35 to 64 Years | 0 (0.0%) | 0 (0.0%) |
| 65 to 74 Years | 0 (0.0%) | 0 (0.0%) |
| 75 Years and over | 0 (0.0%) | 0 (0.0%) |
Disability Class: Vision Difficulty
| Age Bracket | Male | Female |
| Under 5 Years | 0 (0.0%) | 0 (0.0%) |
| 5 to 17 Years | 0 (0.0%) | 0 (0.0%) |
| 18 to 34 Years | 0 (0.0%) | 0 (0.0%) |
| 35 to 64 Years | 0 (0.0%) | 0 (0.0%) |
| 65 to 74 Years | 0 (0.0%) | 0 (0.0%) |
| 75 Years and over | 0 (0.0%) | 0 (0.0%) |
Disability Class: Cognitive Difficulty
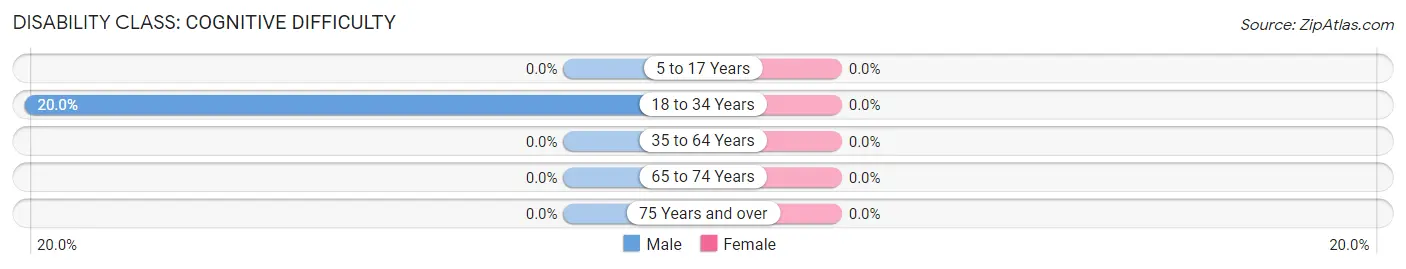
| Age Bracket | Male | Female |
| 5 to 17 Years | 0 (0.0%) | 0 (0.0%) |
| 18 to 34 Years | 1 (20.0%) | 0 (0.0%) |
| 35 to 64 Years | 0 (0.0%) | 0 (0.0%) |
| 65 to 74 Years | 0 (0.0%) | 0 (0.0%) |
| 75 Years and over | 0 (0.0%) | 0 (0.0%) |
Disability Class: Ambulatory Difficulty
| Age Bracket | Male | Female |
| 5 to 17 Years | 0 (0.0%) | 0 (0.0%) |
| 18 to 34 Years | 0 (0.0%) | 0 (0.0%) |
| 35 to 64 Years | 0 (0.0%) | 0 (0.0%) |
| 65 to 74 Years | 0 (0.0%) | 0 (0.0%) |
| 75 Years and over | 0 (0.0%) | 0 (0.0%) |
Disability Class: Self-Care Difficulty
| Age Bracket | Male | Female |
| 5 to 17 Years | 0 (0.0%) | 0 (0.0%) |
| 18 to 34 Years | 0 (0.0%) | 0 (0.0%) |
| 35 to 64 Years | 0 (0.0%) | 0 (0.0%) |
| 65 to 74 Years | 0 (0.0%) | 0 (0.0%) |
| 75 Years and over | 0 (0.0%) | 0 (0.0%) |
Technology Access in Unity Village
Computing Device Access in Unity Village
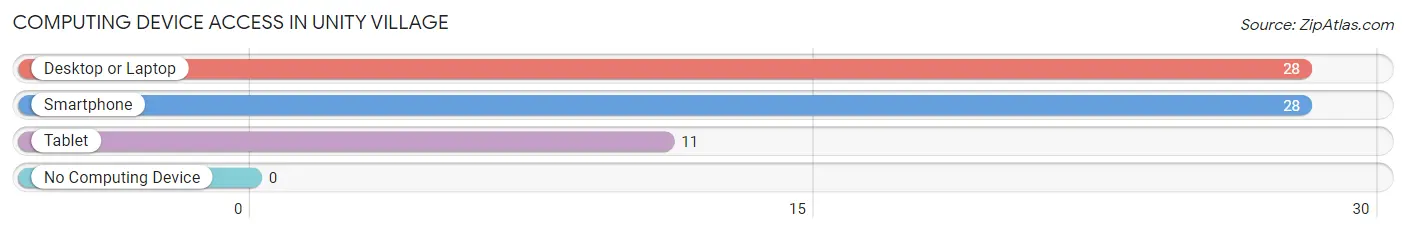
| Device Type | # Households | % Households |
| Desktop or Laptop | 28 | 87.5% |
| Smartphone | 28 | 87.5% |
| Tablet | 11 | 34.4% |
| No Computing Device | 0 | 0.0% |
| Total | 32 | 100.0% |
Internet Access in Unity Village
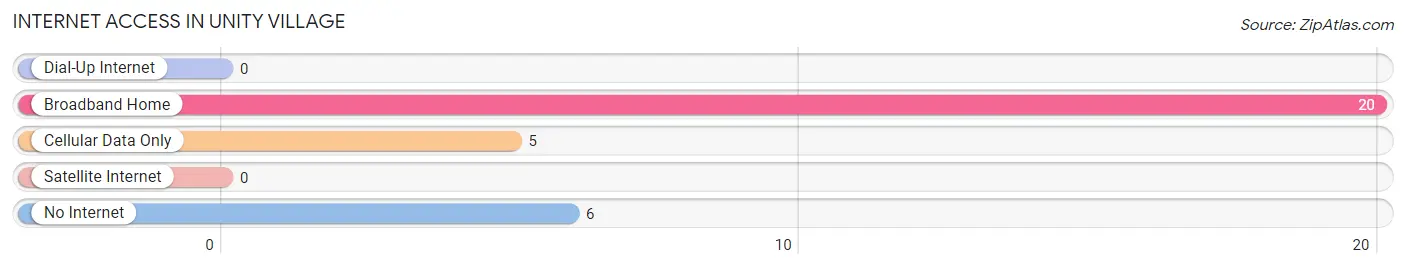
| Internet Type | # Households | % Households |
| Dial-Up Internet | 0 | 0.0% |
| Broadband Home | 20 | 62.5% |
| Cellular Data Only | 5 | 15.6% |
| Satellite Internet | 0 | 0.0% |
| No Internet | 6 | 18.8% |
| Total | 32 | 100.0% |
Unity Village Summary
Village History
Unity Village is a small village located in the state of Missouri, United States. It is located in the eastern part of the state, about 25 miles south of Kansas City. The village was founded in 1883 by a group of Quakers who were looking for a place to practice their faith in peace and harmony. The village was named after the Quaker belief in the unity of all people.
The village was originally a farming community, but it soon became a popular tourist destination. The village was known for its beautiful scenery and peaceful atmosphere. It was also known for its many festivals and events, such as the annual Unity Village Fair.
In the early 1900s, the village began to attract more visitors, and it soon became a popular destination for vacationers. The village was also home to a number of businesses, including a hotel, a general store, and a post office.
In the 1950s, the village began to decline in popularity as more people moved to larger cities. However, in the late 1970s, the village began to experience a revival. The village was designated as a National Historic Landmark in 1979, and it has since become a popular tourist destination once again.
Geography
Unity Village is located in the eastern part of Missouri, about 25 miles south of Kansas City. The village is situated in a rural area, surrounded by rolling hills and farmland. The village is located on the banks of the Missouri River, and it is bordered by the towns of Liberty and Excelsior Springs.
The village has a total area of 0.6 square miles, all of which is land. The village has a humid continental climate, with hot summers and cold winters. The average annual temperature is around 54 degrees Fahrenheit.
Economy
The economy of Unity Village is largely based on tourism. The village is home to a number of attractions, including the Unity Village Fair, which is held annually. The village also has a number of restaurants, shops, and other businesses that cater to tourists.
In addition to tourism, the village also has a number of small businesses, such as a general store, a post office, and a hotel. The village also has a number of farms, which produce a variety of crops, including corn, soybeans, and wheat.
Demographics
As of the 2010 census, the population of Unity Village was 1,092. The village has a population density of 1,743 people per square mile. The median age of the population is 44.7 years, and the median household income is $45,000.
The racial makeup of the village is 97.3% White, 0.7% African American, 0.3% Native American, 0.2% Asian, and 1.5% from other races. The village has a large number of people who identify as Hispanic or Latino, making up 4.2% of the population.
Conclusion
Unity Village is a small village located in the eastern part of Missouri. It was founded in 1883 by a group of Quakers, and it has since become a popular tourist destination. The village has a humid continental climate, and its economy is largely based on tourism. The population of the village is 1,092, and the median age is 44.7 years. The village has a large number of people who identify as Hispanic or Latino, making up 4.2% of the population.
Common Questions
What is Per Capita Income in Unity Village?
Per Capita income in Unity Village is $31,215.
What is the Median Household income in Unity Village?
Median Household Income in Unity Village is $51,250.
What is Inequality or Gini Index in Unity Village?
Inequality or Gini Index in Unity Village is 0.30.
What is the Total Population of Unity Village?
Total Population of Unity Village is 65.
What is the Total Male Population of Unity Village?
Total Male Population of Unity Village is 18.
What is the Total Female Population of Unity Village?
Total Female Population of Unity Village is 47.
What is the Ratio of Males per 100 Females in Unity Village?
There are 38.30 Males per 100 Females in Unity Village.
What is the Ratio of Females per 100 Males in Unity Village?
There are 261.11 Females per 100 Males in Unity Village.
What is the Median Population Age in Unity Village?
Median Population Age in Unity Village is 36.4 Years.
What is the Average Family Size in Unity Village
Average Family Size in Unity Village is 2.2 People.
What is the Average Household Size in Unity Village
Average Household Size in Unity Village is 1.2 People.
How Large is the Labor Force in Unity Village?
There are 36 People in the Labor Forcein in Unity Village.
What is the Percentage of People in the Labor Force in Unity Village?
57.1% of People are in the Labor Force in Unity Village.
What is the Unemployment Rate in Unity Village?
Unemployment Rate in Unity Village is 2.8%.