Navajo, NM Map & Demographics
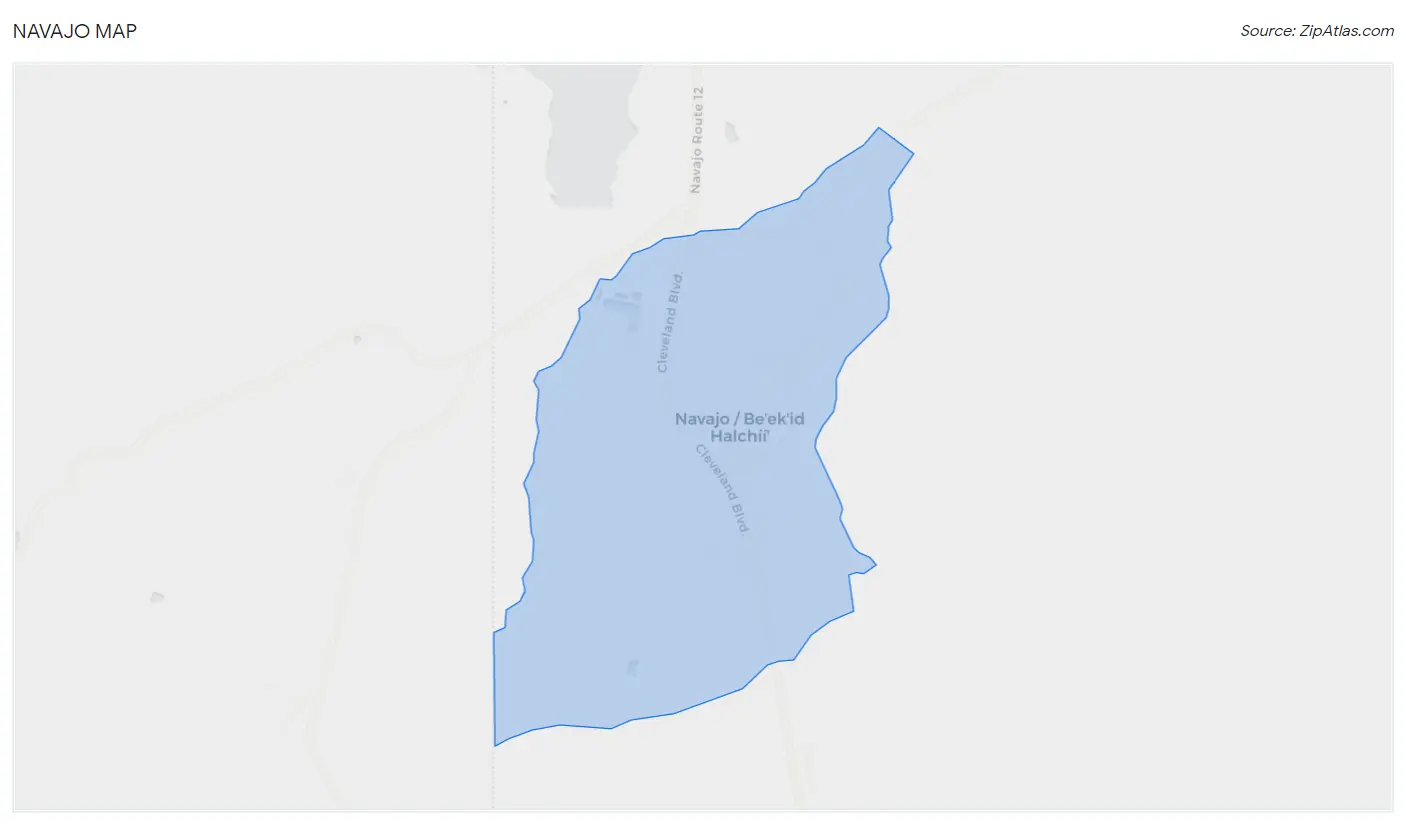
Navajo Map
Navajo Overview
$10,911
PER CAPITA INCOME
$25,938
AVG FAMILY INCOME
$28,160
AVG HOUSEHOLD INCOME
13.3%
WAGE / INCOME GAP [ % ]
86.7¢/ $1
WAGE / INCOME GAP [ $ ]
$16,655
FAMILY INCOME DEFICIT
0.44
INEQUALITY / GINI INDEX
2,071
TOTAL POPULATION
895
MALE POPULATION
1,176
FEMALE POPULATION
76.11
MALES / 100 FEMALES
131.40
FEMALES / 100 MALES
22.0
MEDIAN AGE
3.9
AVG FAMILY SIZE
3.7
AVG HOUSEHOLD SIZE
575
LABOR FORCE [ PEOPLE ]
43.4%
PERCENT IN LABOR FORCE
19.3%
UNEMPLOYMENT RATE
Navajo Zip Codes
Navajo Area Codes
Income in Navajo
Income Overview in Navajo
Per Capita Income in Navajo is $10,911, while median incomes of families and households are $25,938 and $28,160 respectively.
| Characteristic | Number | Measure |
| Per Capita Income | 2,071 | $10,911 |
| Median Family Income | 471 | $25,938 |
| Mean Family Income | 471 | $34,675 |
| Median Household Income | 558 | $28,160 |
| Mean Household Income | 558 | $37,418 |
| Income Deficit | 471 | $16,655 |
| Wage / Income Gap (%) | 2,071 | 13.31% |
| Wage / Income Gap ($) | 2,071 | 86.69¢ per $1 |
| Gini / Inequality Index | 2,071 | 0.44 |
Earnings by Sex in Navajo
Average Earnings in Navajo are $23,476, $20,694 for men and $23,872 for women, a difference of 13.3%.
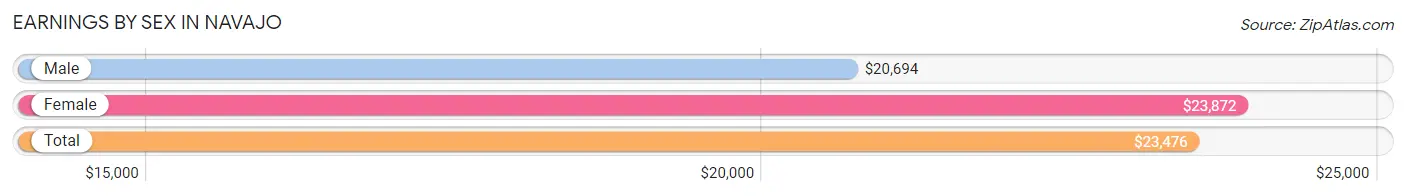
| Sex | Number | Average Earnings |
| Male | 235 (42.1%) | $20,694 |
| Female | 323 (57.9%) | $23,872 |
| Total | 558 (100.0%) | $23,476 |
Earnings by Sex by Income Bracket in Navajo
The most common earnings brackets in Navajo are $30,000 to $34,999 for men (30 | 12.8%) and $22,500 to $24,999 for women (41 | 12.7%).
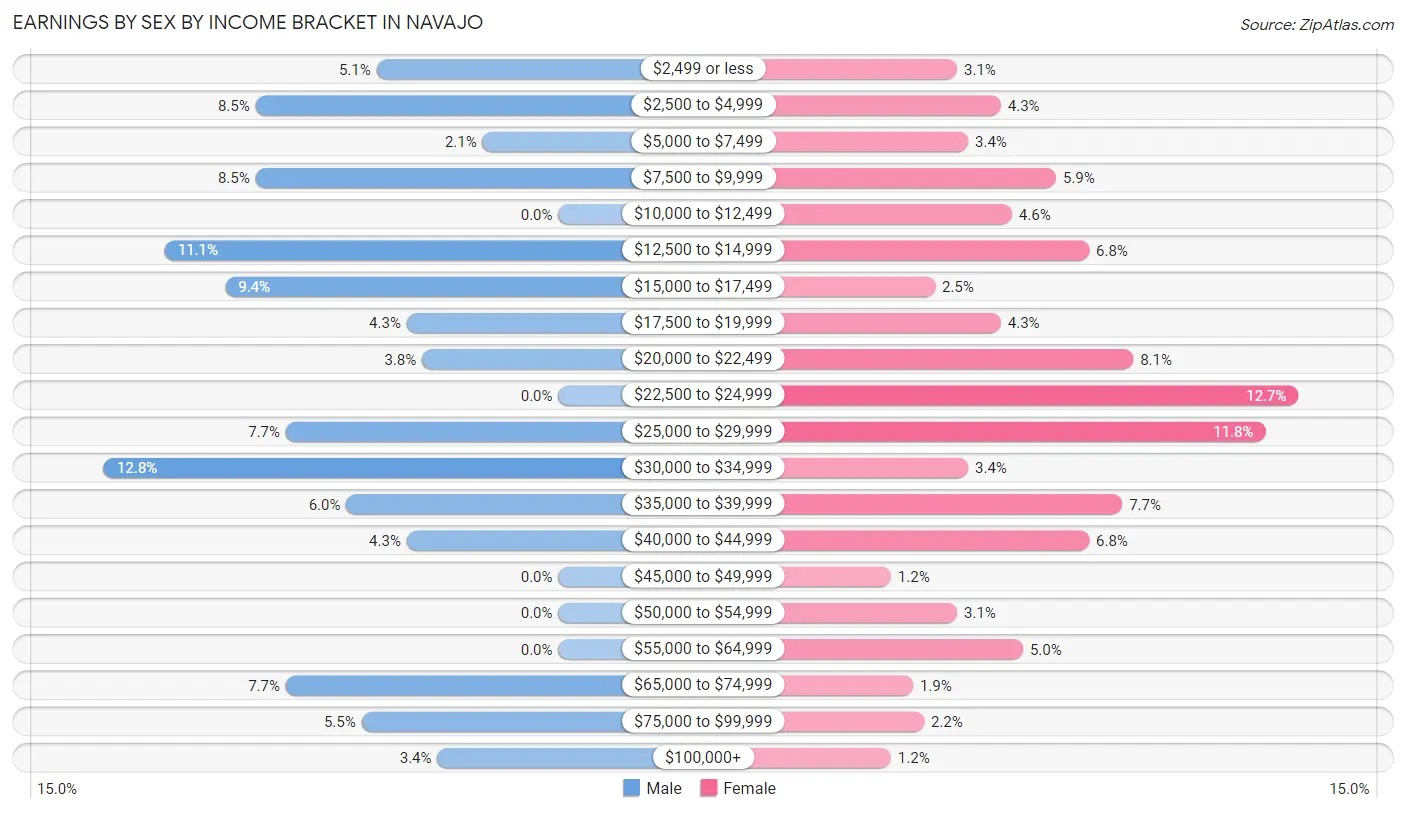
| Income | Male | Female |
| $2,499 or less | 12 (5.1%) | 10 (3.1%) |
| $2,500 to $4,999 | 20 (8.5%) | 14 (4.3%) |
| $5,000 to $7,499 | 5 (2.1%) | 11 (3.4%) |
| $7,500 to $9,999 | 20 (8.5%) | 19 (5.9%) |
| $10,000 to $12,499 | 0 (0.0%) | 15 (4.6%) |
| $12,500 to $14,999 | 26 (11.1%) | 22 (6.8%) |
| $15,000 to $17,499 | 22 (9.4%) | 8 (2.5%) |
| $17,500 to $19,999 | 10 (4.3%) | 14 (4.3%) |
| $20,000 to $22,499 | 9 (3.8%) | 26 (8.1%) |
| $22,500 to $24,999 | 0 (0.0%) | 41 (12.7%) |
| $25,000 to $29,999 | 18 (7.7%) | 38 (11.8%) |
| $30,000 to $34,999 | 30 (12.8%) | 11 (3.4%) |
| $35,000 to $39,999 | 14 (6.0%) | 25 (7.7%) |
| $40,000 to $44,999 | 10 (4.3%) | 22 (6.8%) |
| $45,000 to $49,999 | 0 (0.0%) | 4 (1.2%) |
| $50,000 to $54,999 | 0 (0.0%) | 10 (3.1%) |
| $55,000 to $64,999 | 0 (0.0%) | 16 (5.0%) |
| $65,000 to $74,999 | 18 (7.7%) | 6 (1.9%) |
| $75,000 to $99,999 | 13 (5.5%) | 7 (2.2%) |
| $100,000+ | 8 (3.4%) | 4 (1.2%) |
| Total | 235 (100.0%) | 323 (100.0%) |
Earnings by Sex by Educational Attainment in Navajo
Average earnings in Navajo are $26,667 for men and $24,695 for women, a difference of 7.4%. Men with an educational attainment of less than high school enjoy the highest average annual earnings of $38,438, while those with high school diploma education earn the least with $15,511. Women with an educational attainment of bachelor's degree earn the most with the average annual earnings of $60,000, while those with high school diploma education have the smallest earnings of $19,688.
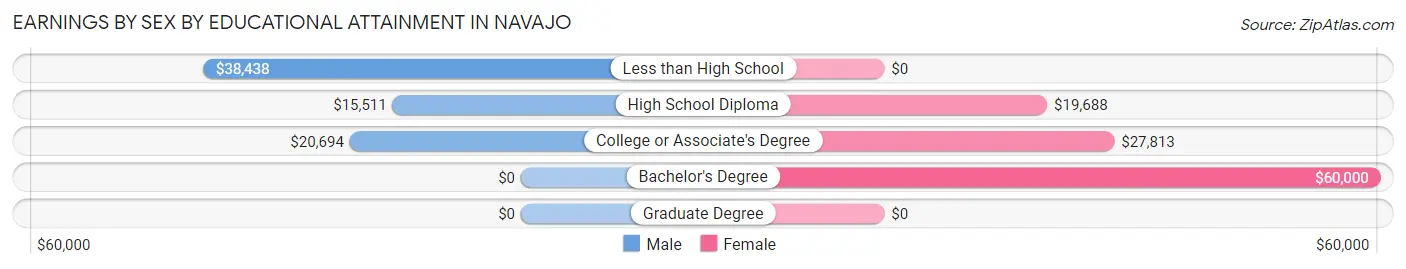
| Educational Attainment | Male Income | Female Income |
| Less than High School | $38,438 | $0 |
| High School Diploma | $15,511 | $19,688 |
| College or Associate's Degree | $20,694 | $27,813 |
| Bachelor's Degree | - | - |
| Graduate Degree | - | - |
| Total | $26,667 | $24,695 |
Family Income in Navajo
Family Income Brackets in Navajo
According to the Navajo family income data, there are 101 families falling into the less than $10,000 income range, which is the most common income bracket and makes up 21.4% of all families.
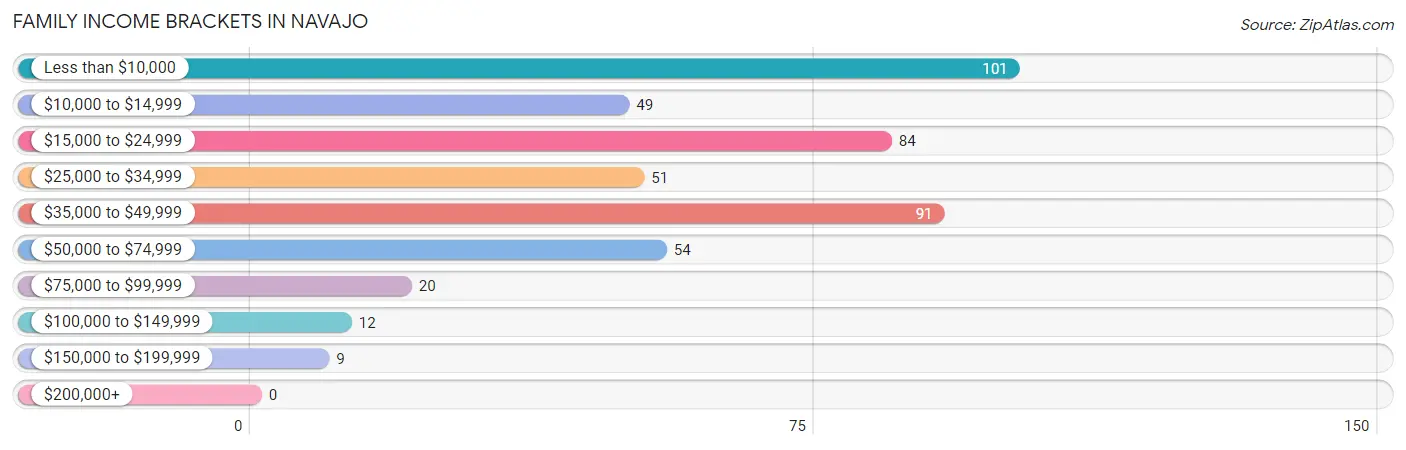
| Income Bracket | # Families | % Families |
| Less than $10,000 | 101 | 21.4% |
| $10,000 to $14,999 | 49 | 10.4% |
| $15,000 to $24,999 | 84 | 17.8% |
| $25,000 to $34,999 | 51 | 10.8% |
| $35,000 to $49,999 | 91 | 19.3% |
| $50,000 to $74,999 | 54 | 11.5% |
| $75,000 to $99,999 | 20 | 4.2% |
| $100,000 to $149,999 | 12 | 2.5% |
| $150,000 to $199,999 | 9 | 1.9% |
| $200,000+ | 0 | 0.0% |
Family Income by Famaliy Size in Navajo
2-person families (134 | 28.4%) account for the highest median family income in Navajo with $43,056 per family, while 2-person families (134 | 28.4%) have the highest median income of $21,528 per family member.
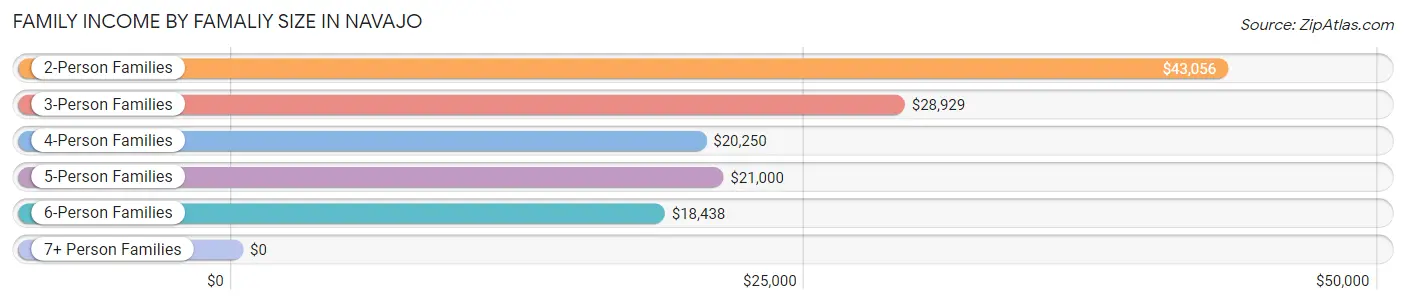
| Income Bracket | # Families | Median Income |
| 2-Person Families | 134 (28.4%) | $43,056 |
| 3-Person Families | 118 (25.1%) | $28,929 |
| 4-Person Families | 150 (31.9%) | $20,250 |
| 5-Person Families | 34 (7.2%) | $21,000 |
| 6-Person Families | 10 (2.1%) | $18,438 |
| 7+ Person Families | 25 (5.3%) | $0 |
| Total | 471 (100.0%) | $25,938 |
Family Income by Number of Earners in Navajo
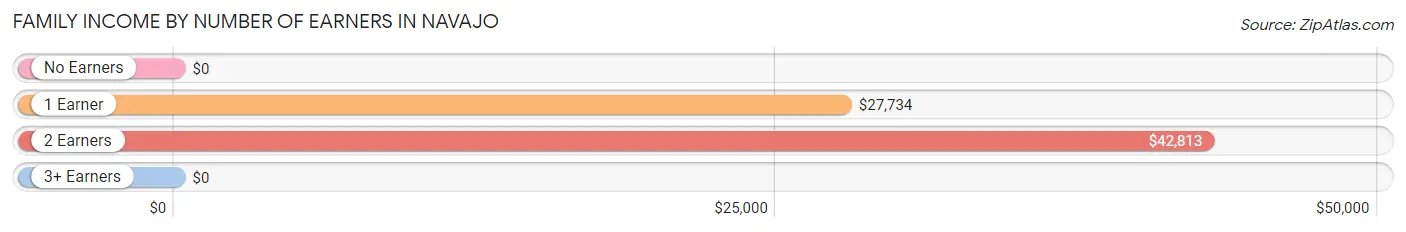
| Number of Earners | # Families | Median Income |
| No Earners | 183 (38.9%) | $0 |
| 1 Earner | 207 (44.0%) | $27,734 |
| 2 Earners | 71 (15.1%) | $42,813 |
| 3+ Earners | 10 (2.1%) | $0 |
| Total | 471 (100.0%) | $25,938 |
Household Income in Navajo
Household Income Brackets in Navajo
With 112 households falling in the category, the $15,000 to $24,999 income range is the most frequent in Navajo, accounting for 20.1% of all households.
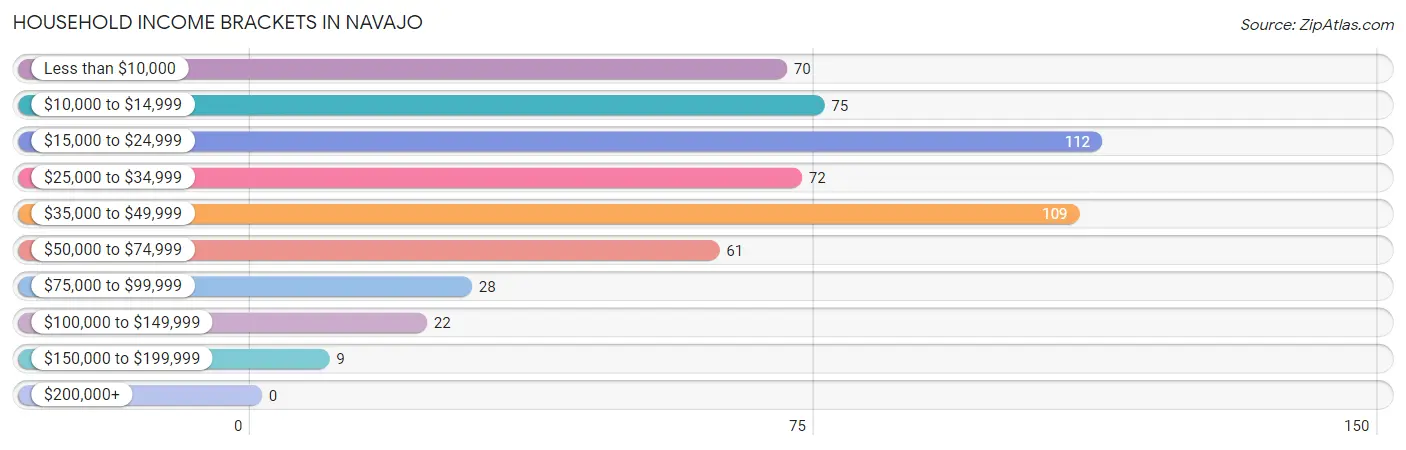
| Income Bracket | # Households | % Households |
| Less than $10,000 | 70 | 12.5% |
| $10,000 to $14,999 | 75 | 13.4% |
| $15,000 to $24,999 | 112 | 20.1% |
| $25,000 to $34,999 | 72 | 12.9% |
| $35,000 to $49,999 | 109 | 19.5% |
| $50,000 to $74,999 | 61 | 10.9% |
| $75,000 to $99,999 | 28 | 5.0% |
| $100,000 to $149,999 | 22 | 3.9% |
| $150,000 to $199,999 | 9 | 1.6% |
| $200,000+ | 0 | 0.0% |
Household Income by Householder Age in Navajo
The median household income in Navajo is $28,160, with the highest median household income of $43,342 found in the 65+ years age bracket for the primary householder. A total of 99 households (17.7%) fall into this category. Meanwhile, the 15 to 24 years age bracket for the primary householder has the lowest median household income of $0, with 16 households (2.9%) in this group.
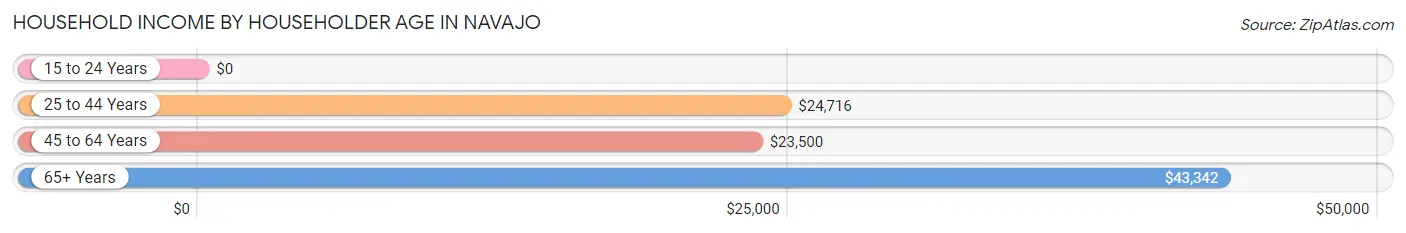
| Income Bracket | # Households | Median Income |
| 15 to 24 Years | 16 (2.9%) | $0 |
| 25 to 44 Years | 249 (44.6%) | $24,716 |
| 45 to 64 Years | 194 (34.8%) | $23,500 |
| 65+ Years | 99 (17.7%) | $43,342 |
| Total | 558 (100.0%) | $28,160 |
Poverty in Navajo
Income Below Poverty by Sex and Age in Navajo
With 46.5% poverty level for males and 62.2% for females among the residents of Navajo, 15 year old males and 16 and 17 year old females are the most vulnerable to poverty, with 9 males (100.0%) and 79 females (91.9%) in their respective age groups living below the poverty level.
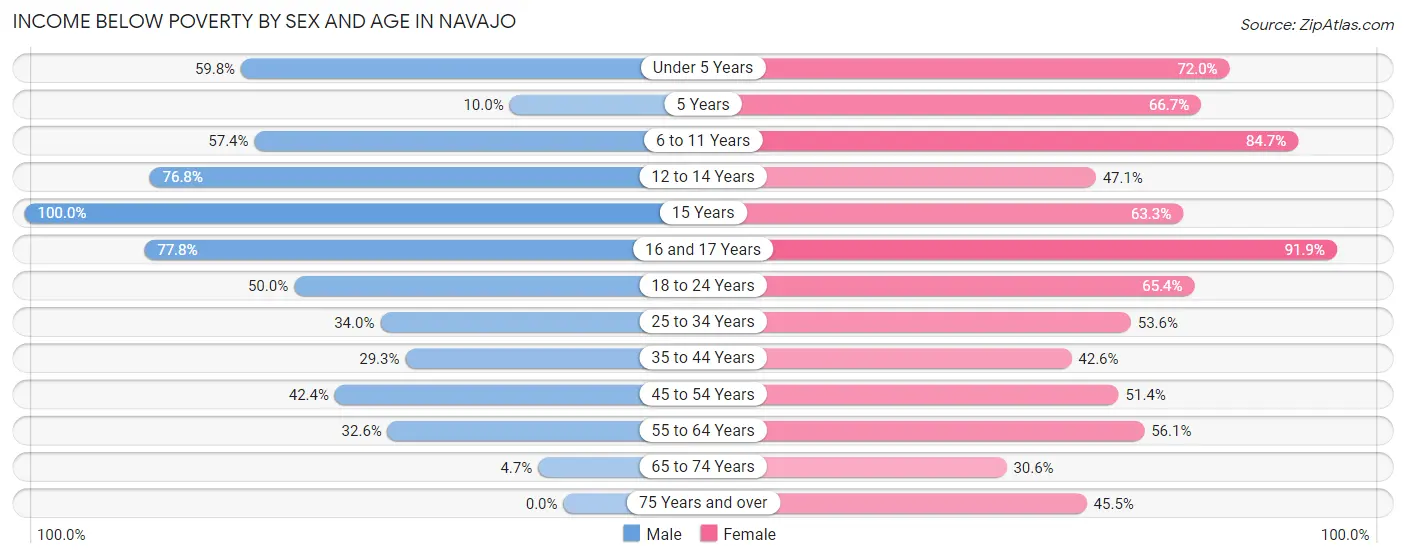
| Age Bracket | Male | Female |
| Under 5 Years | 76 (59.8%) | 59 (72.0%) |
| 5 Years | 1 (10.0%) | 8 (66.7%) |
| 6 to 11 Years | 78 (57.4%) | 166 (84.7%) |
| 12 to 14 Years | 43 (76.8%) | 41 (47.1%) |
| 15 Years | 9 (100.0%) | 19 (63.3%) |
| 16 and 17 Years | 56 (77.8%) | 79 (91.9%) |
| 18 to 24 Years | 33 (50.0%) | 89 (65.4%) |
| 25 to 34 Years | 52 (34.0%) | 81 (53.6%) |
| 35 to 44 Years | 22 (29.3%) | 49 (42.6%) |
| 45 to 54 Years | 28 (42.4%) | 56 (51.4%) |
| 55 to 64 Years | 15 (32.6%) | 64 (56.1%) |
| 65 to 74 Years | 3 (4.7%) | 11 (30.6%) |
| 75 Years and over | 0 (0.0%) | 10 (45.5%) |
| Total | 416 (46.5%) | 732 (62.2%) |
Income Above Poverty by Sex and Age in Navajo
According to the poverty statistics in Navajo, males aged 75 years and over and females aged 65 to 74 years are the age groups that are most secure financially, with 100.0% of males and 69.4% of females in these age groups living above the poverty line.
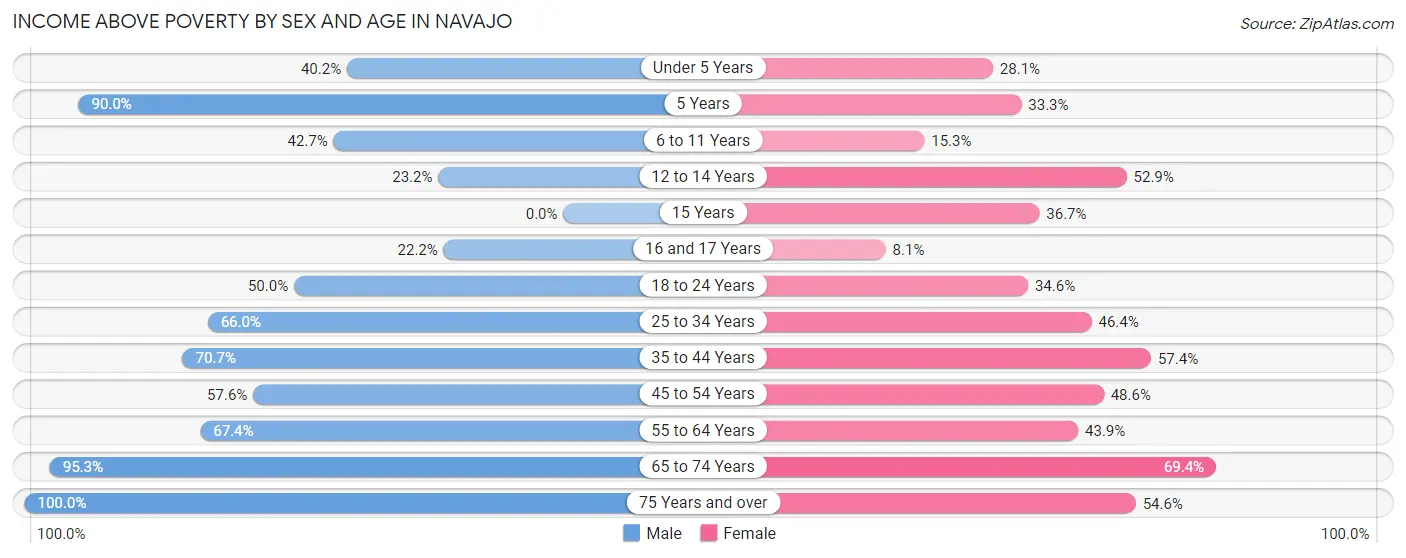
| Age Bracket | Male | Female |
| Under 5 Years | 51 (40.2%) | 23 (28.1%) |
| 5 Years | 9 (90.0%) | 4 (33.3%) |
| 6 to 11 Years | 58 (42.6%) | 30 (15.3%) |
| 12 to 14 Years | 13 (23.2%) | 46 (52.9%) |
| 15 Years | 0 (0.0%) | 11 (36.7%) |
| 16 and 17 Years | 16 (22.2%) | 7 (8.1%) |
| 18 to 24 Years | 33 (50.0%) | 47 (34.6%) |
| 25 to 34 Years | 101 (66.0%) | 70 (46.4%) |
| 35 to 44 Years | 53 (70.7%) | 66 (57.4%) |
| 45 to 54 Years | 38 (57.6%) | 53 (48.6%) |
| 55 to 64 Years | 31 (67.4%) | 50 (43.9%) |
| 65 to 74 Years | 61 (95.3%) | 25 (69.4%) |
| 75 Years and over | 15 (100.0%) | 12 (54.5%) |
| Total | 479 (53.5%) | 444 (37.8%) |
Income Below Poverty Among Married-Couple Families in Navajo
The poverty statistics for married-couple families in Navajo show that 24.8% or 39 of the total 157 families live below the poverty line. Families with 3 or 4 children have the highest poverty rate of 100.0%, comprising of 4 families. On the other hand, families with no children have the lowest poverty rate of 9.9%, which includes 8 families.
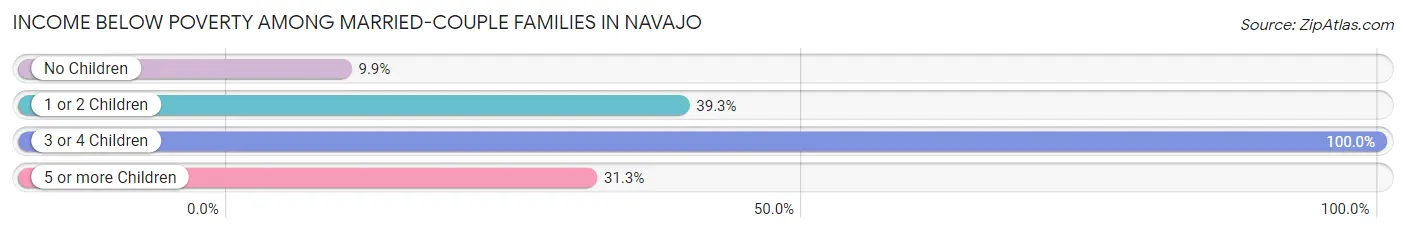
| Children | Above Poverty | Below Poverty |
| No Children | 73 (90.1%) | 8 (9.9%) |
| 1 or 2 Children | 34 (60.7%) | 22 (39.3%) |
| 3 or 4 Children | 0 (0.0%) | 4 (100.0%) |
| 5 or more Children | 11 (68.8%) | 5 (31.2%) |
| Total | 118 (75.2%) | 39 (24.8%) |
Income Below Poverty Among Single-Parent Households in Navajo
According to the poverty data in Navajo, 56.4% or 31 single-father households and 62.5% or 162 single-mother households are living below the poverty line. Among single-father households, those with 3 or 4 children have the highest poverty rate, with 15 households (100.0%) experiencing poverty. Likewise, among single-mother households, those with 5 or more children have the highest poverty rate, with 9 households (100.0%) falling below the poverty line.
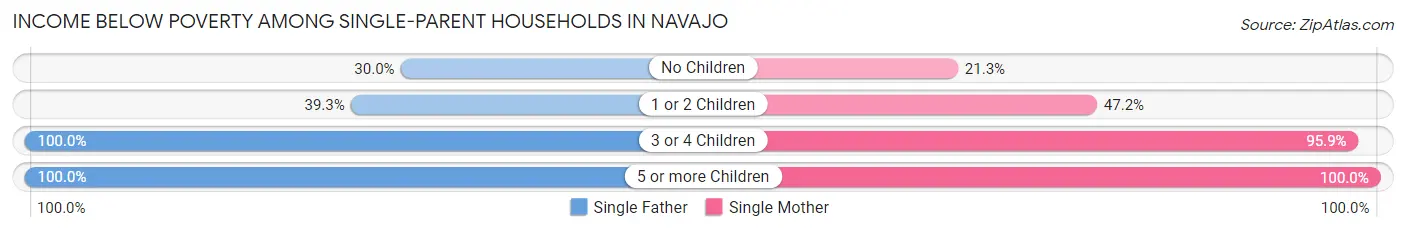
| Children | Single Father | Single Mother |
| No Children | 3 (30.0%) | 10 (21.3%) |
| 1 or 2 Children | 11 (39.3%) | 50 (47.2%) |
| 3 or 4 Children | 15 (100.0%) | 93 (95.9%) |
| 5 or more Children | 2 (100.0%) | 9 (100.0%) |
| Total | 31 (56.4%) | 162 (62.5%) |
Income Below Poverty Among Married-Couple vs Single-Parent Households in Navajo
The poverty data for Navajo shows that 39 of the married-couple family households (24.8%) and 193 of the single-parent households (61.5%) are living below the poverty level. Within the married-couple family households, those with 3 or 4 children have the highest poverty rate, with 4 households (100.0%) falling below the poverty line. Among the single-parent households, those with 5 or more children have the highest poverty rate, with 11 household (100.0%) living below poverty.
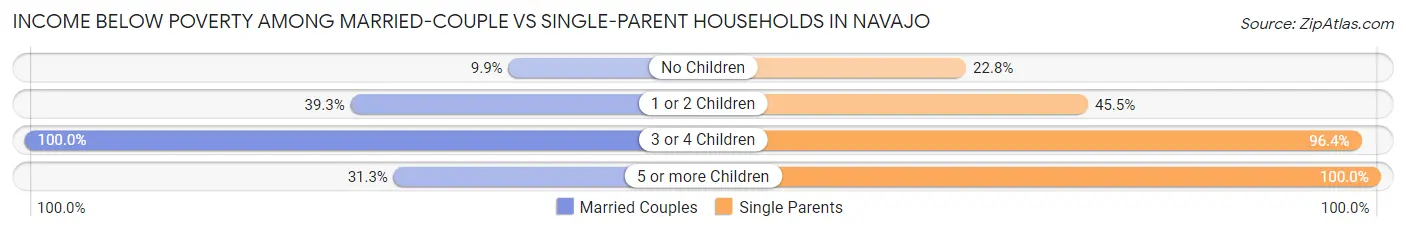
| Children | Married-Couple Families | Single-Parent Households |
| No Children | 8 (9.9%) | 13 (22.8%) |
| 1 or 2 Children | 22 (39.3%) | 61 (45.5%) |
| 3 or 4 Children | 4 (100.0%) | 108 (96.4%) |
| 5 or more Children | 5 (31.2%) | 11 (100.0%) |
| Total | 39 (24.8%) | 193 (61.5%) |
Race in Navajo
The most populous races in Navajo are Native / Alaskan (1,999 | 96.5%), Two or more Races (66 | 3.2%), and Hispanic or Latino (39 | 1.9%).
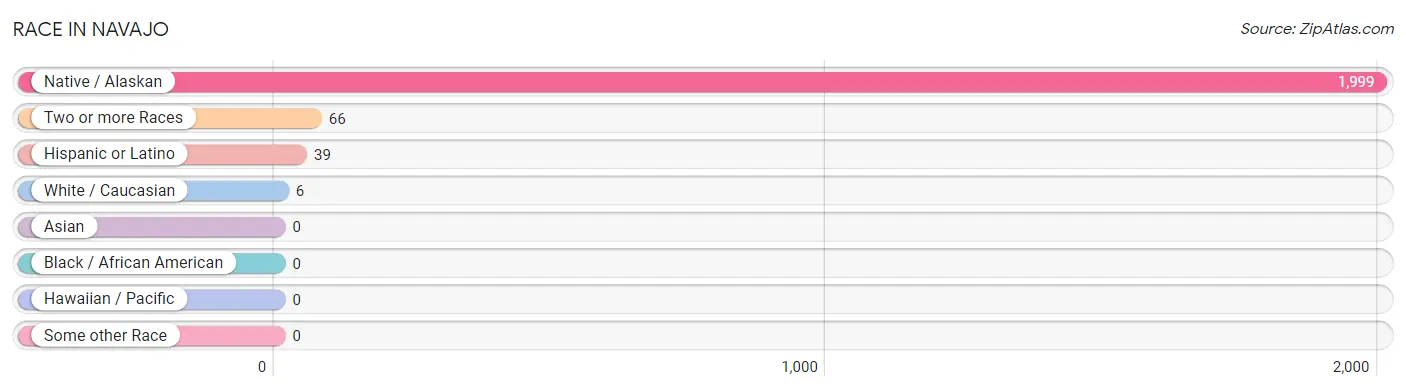
| Race | # Population | % Population |
| Asian | 0 | 0.0% |
| Black / African American | 0 | 0.0% |
| Hawaiian / Pacific | 0 | 0.0% |
| Hispanic or Latino | 39 | 1.9% |
| Native / Alaskan | 1,999 | 96.5% |
| White / Caucasian | 6 | 0.3% |
| Two or more Races | 66 | 3.2% |
| Some other Race | 0 | 0.0% |
| Total | 2,071 | 100.0% |
Ancestry in Navajo
The most populous ancestries reported in Navajo are Navajo (2,057 | 99.3%), Mexican (28 | 1.3%), Irish (15 | 0.7%), Dominican (11 | 0.5%), and English (8 | 0.4%), together accounting for 102.3% of all Navajo residents.
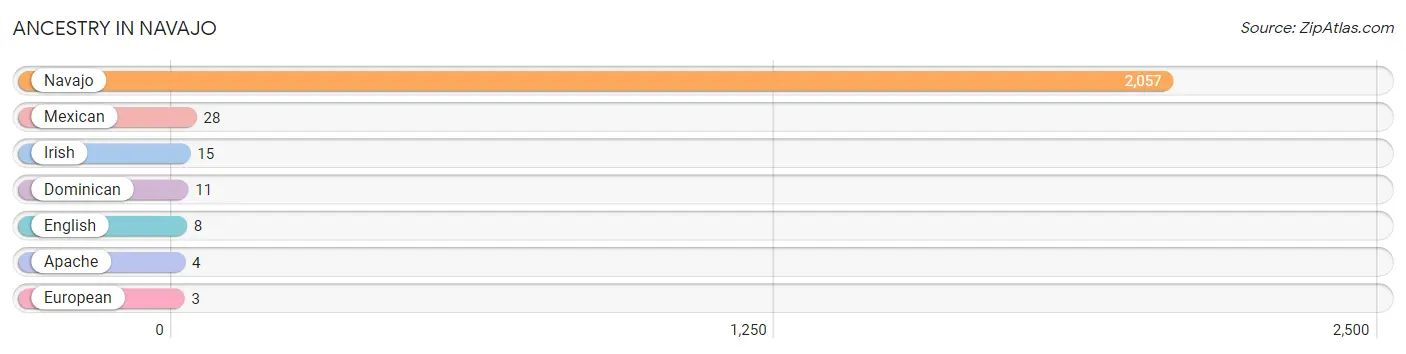
| Ancestry | # Population | % Population |
| Apache | 4 | 0.2% |
| Dominican | 11 | 0.5% |
| English | 8 | 0.4% |
| European | 3 | 0.1% |
| Irish | 15 | 0.7% |
| Mexican | 28 | 1.3% |
| Navajo | 2,057 | 99.3% | View All 7 Rows |
Immigrants in Navajo

| Immigration Origin | # Population | % Population | View All 0 Rows |
Sex and Age in Navajo
Sex and Age in Navajo
The most populous age groups in Navajo are Under 5 Years (127 | 14.2%) for men and 5 to 9 Years (159 | 13.5%) for women.
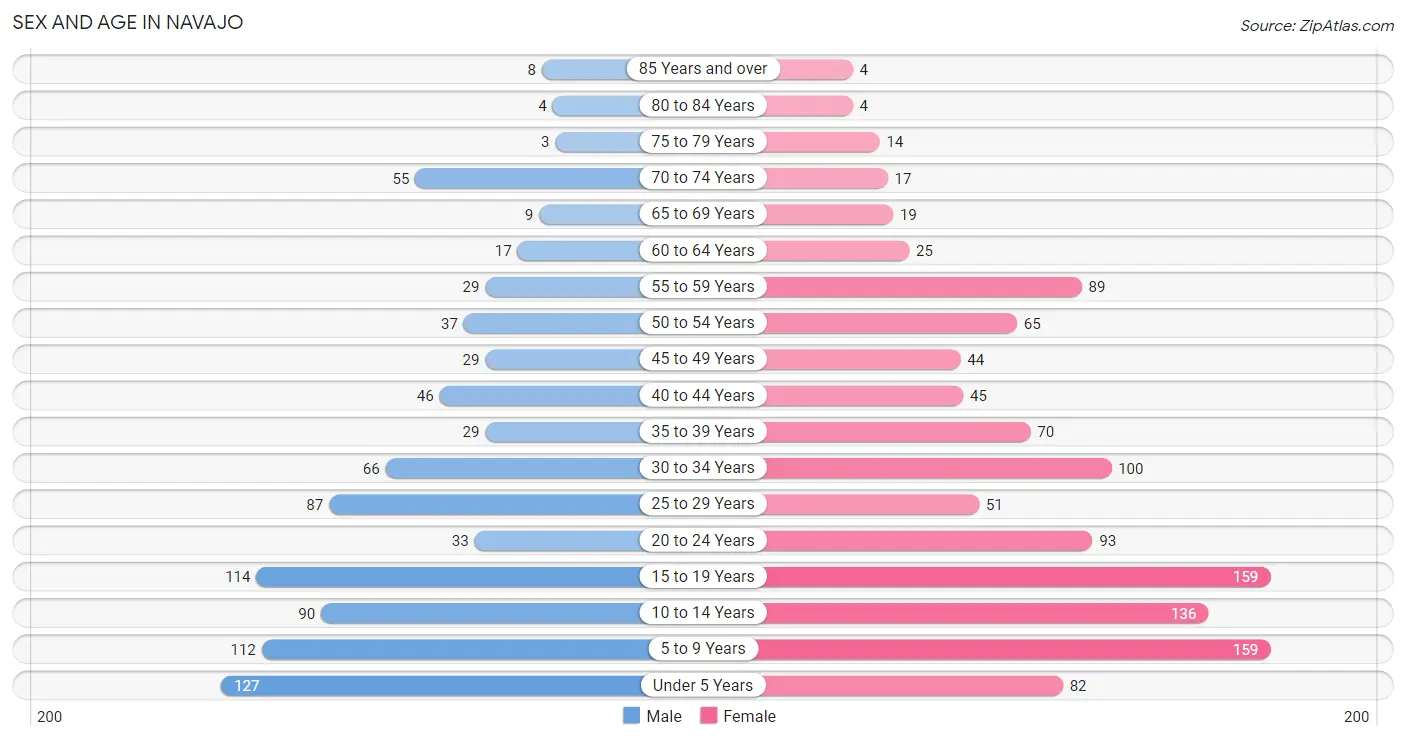
| Age Bracket | Male | Female |
| Under 5 Years | 127 (14.2%) | 82 (7.0%) |
| 5 to 9 Years | 112 (12.5%) | 159 (13.5%) |
| 10 to 14 Years | 90 (10.1%) | 136 (11.6%) |
| 15 to 19 Years | 114 (12.7%) | 159 (13.5%) |
| 20 to 24 Years | 33 (3.7%) | 93 (7.9%) |
| 25 to 29 Years | 87 (9.7%) | 51 (4.3%) |
| 30 to 34 Years | 66 (7.4%) | 100 (8.5%) |
| 35 to 39 Years | 29 (3.2%) | 70 (5.9%) |
| 40 to 44 Years | 46 (5.1%) | 45 (3.8%) |
| 45 to 49 Years | 29 (3.2%) | 44 (3.7%) |
| 50 to 54 Years | 37 (4.1%) | 65 (5.5%) |
| 55 to 59 Years | 29 (3.2%) | 89 (7.6%) |
| 60 to 64 Years | 17 (1.9%) | 25 (2.1%) |
| 65 to 69 Years | 9 (1.0%) | 19 (1.6%) |
| 70 to 74 Years | 55 (6.1%) | 17 (1.5%) |
| 75 to 79 Years | 3 (0.3%) | 14 (1.2%) |
| 80 to 84 Years | 4 (0.4%) | 4 (0.3%) |
| 85 Years and over | 8 (0.9%) | 4 (0.3%) |
| Total | 895 (100.0%) | 1,176 (100.0%) |
Families and Households in Navajo
Median Family Size in Navajo
The median family size in Navajo is 3.93 persons per family, with single female/mother families (259 | 55.0%) accounting for the largest median family size of 4.07 persons per family. On the other hand, single male/father families (55 | 11.7%) represent the smallest median family size with 3.55 persons per family.
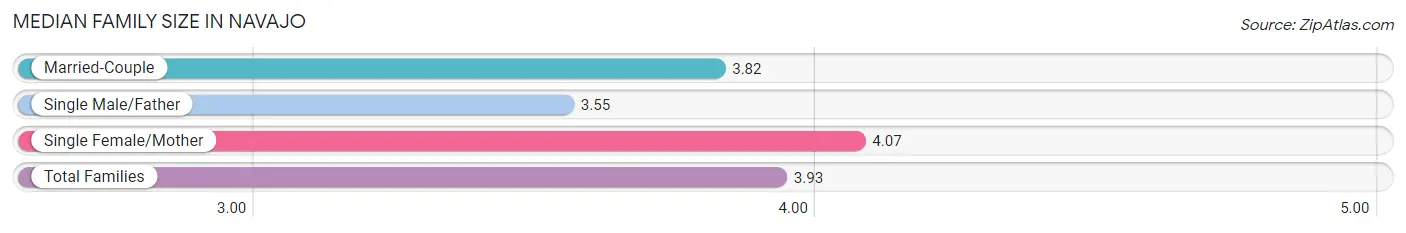
| Family Type | # Families | Family Size |
| Married-Couple | 157 (33.3%) | 3.82 |
| Single Male/Father | 55 (11.7%) | 3.55 |
| Single Female/Mother | 259 (55.0%) | 4.07 |
| Total Families | 471 (100.0%) | 3.93 |
Median Household Size in Navajo
The median household size in Navajo is 3.71 persons per household, with single female/mother households (259 | 46.4%) accounting for the largest median household size of 4.36 persons per household. non-family households (87 | 15.6%) represent the smallest median household size with 1.20 persons per household.
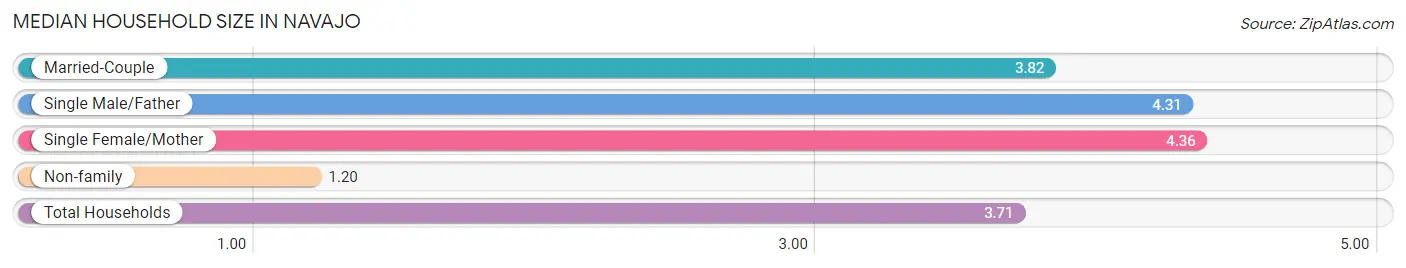
| Household Type | # Households | Household Size |
| Married-Couple | 157 (28.1%) | 3.82 |
| Single Male/Father | 55 (9.9%) | 4.31 |
| Single Female/Mother | 259 (46.4%) | 4.36 |
| Non-family | 87 (15.6%) | 1.20 |
| Total Households | 558 (100.0%) | 3.71 |
Household Size by Marriage Status in Navajo
Out of a total of 558 households in Navajo, 471 (84.4%) are family households, while 87 (15.6%) are nonfamily households. The most numerous type of family households are 4-person households, comprising 153, and the most common type of nonfamily households are 1-person households, comprising 71.
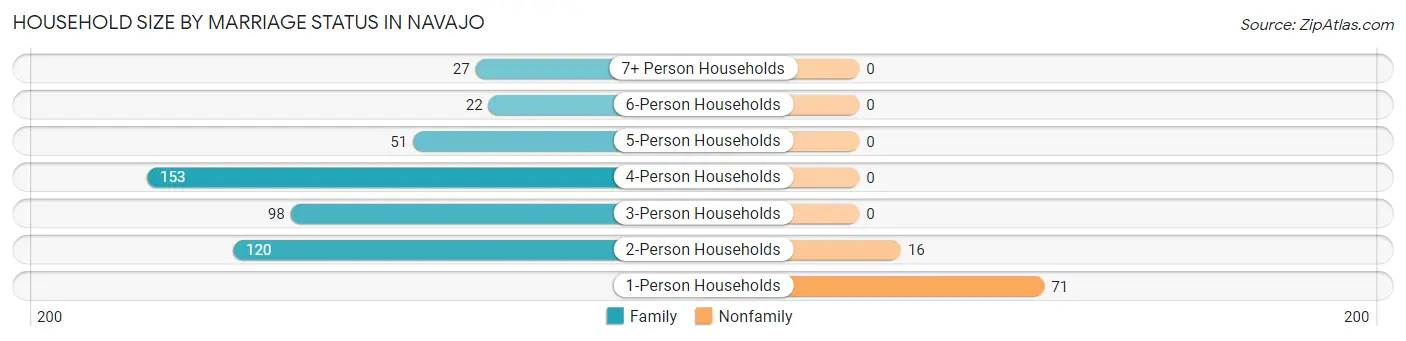
| Household Size | Family Households | Nonfamily Households |
| 1-Person Households | - | 71 (12.7%) |
| 2-Person Households | 120 (21.5%) | 16 (2.9%) |
| 3-Person Households | 98 (17.6%) | 0 (0.0%) |
| 4-Person Households | 153 (27.4%) | 0 (0.0%) |
| 5-Person Households | 51 (9.1%) | 0 (0.0%) |
| 6-Person Households | 22 (3.9%) | 0 (0.0%) |
| 7+ Person Households | 27 (4.8%) | 0 (0.0%) |
| Total | 471 (84.4%) | 87 (15.6%) |
Female Fertility in Navajo
Fertility by Age in Navajo
Average fertility rate in Navajo is 83.0 births per 1,000 women. Women in the age bracket of 20 to 34 years have the highest fertility rate with 189.0 births per 1,000 women. Women in the age bracket of 20 to 34 years acount for 92.0% of all women with births.
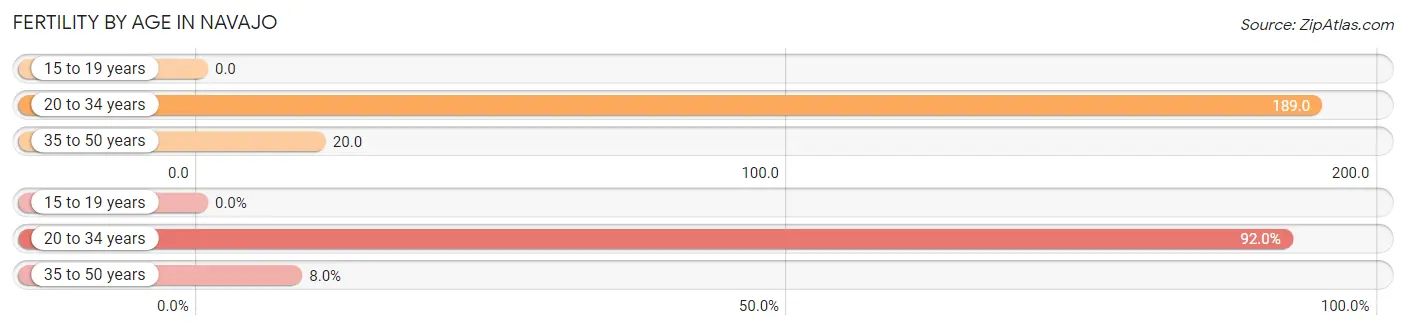
| Age Bracket | Women with Births | Births / 1,000 Women |
| 15 to 19 years | 0 (0.0%) | 0.0 |
| 20 to 34 years | 46 (92.0%) | 189.0 |
| 35 to 50 years | 4 (8.0%) | 20.0 |
| Total | 50 (100.0%) | 83.0 |
Fertility by Age by Marriage Status in Navajo
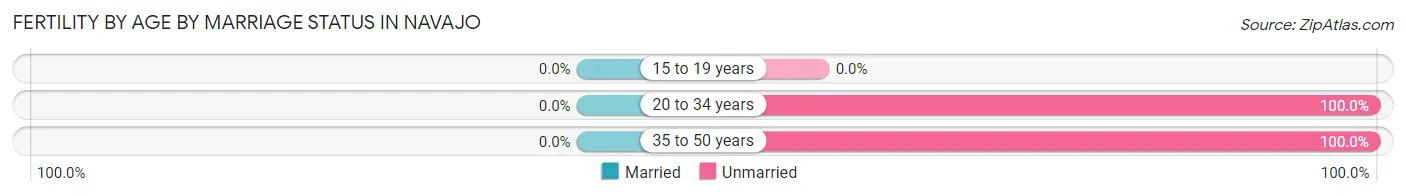
| Age Bracket | Married | Unmarried |
| 15 to 19 years | 0 (0.0%) | 0 (0.0%) |
| 20 to 34 years | 0 (0.0%) | 46 (100.0%) |
| 35 to 50 years | 0 (0.0%) | 4 (100.0%) |
| Total | 0 (0.0%) | 50 (100.0%) |
Fertility by Education in Navajo
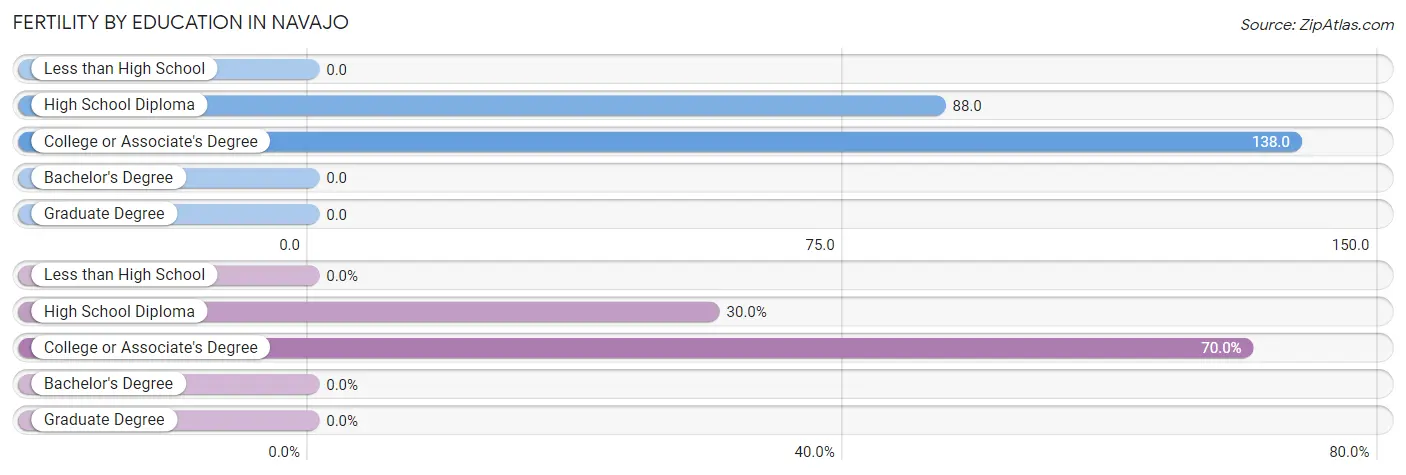
| Educational Attainment | Women with Births | Births / 1,000 Women |
| Less than High School | 0 (0.0%) | 0.0 |
| High School Diploma | 15 (30.0%) | 88.0 |
| College or Associate's Degree | 35 (70.0%) | 138.0 |
| Bachelor's Degree | 0 (0.0%) | 0.0 |
| Graduate Degree | 0 (0.0%) | 0.0 |
| Total | 50 (100.0%) | 83.0 |
Fertility by Education by Marriage Status in Navajo
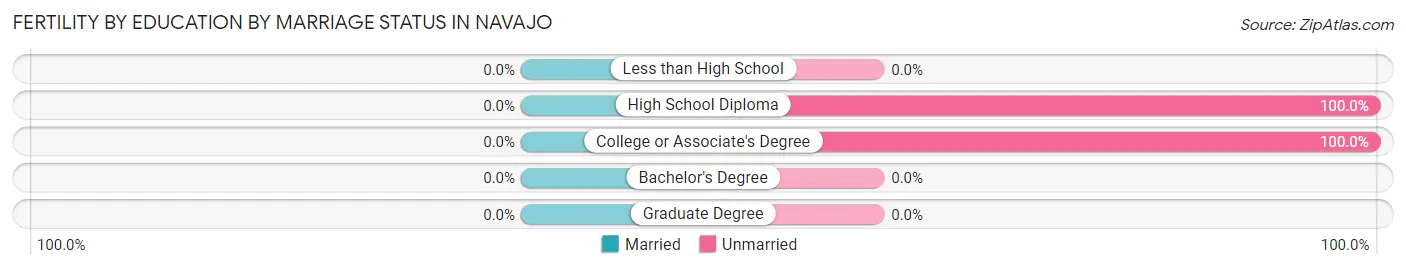
| Educational Attainment | Married | Unmarried |
| Less than High School | 0 (0.0%) | 0 (0.0%) |
| High School Diploma | 0 (0.0%) | 15 (100.0%) |
| College or Associate's Degree | 0 (0.0%) | 35 (100.0%) |
| Bachelor's Degree | 0 (0.0%) | 0 (0.0%) |
| Graduate Degree | 0 (0.0%) | 0 (0.0%) |
| Total | 0 (0.0%) | 50 (100.0%) |
Employment Characteristics in Navajo
Employment by Class of Employer in Navajo
Among the 464 employed individuals in Navajo, private company employees (306 | 65.9%), local government employees (53 | 11.4%), and federal government employees (52 | 11.2%) make up the most common classes of employment.
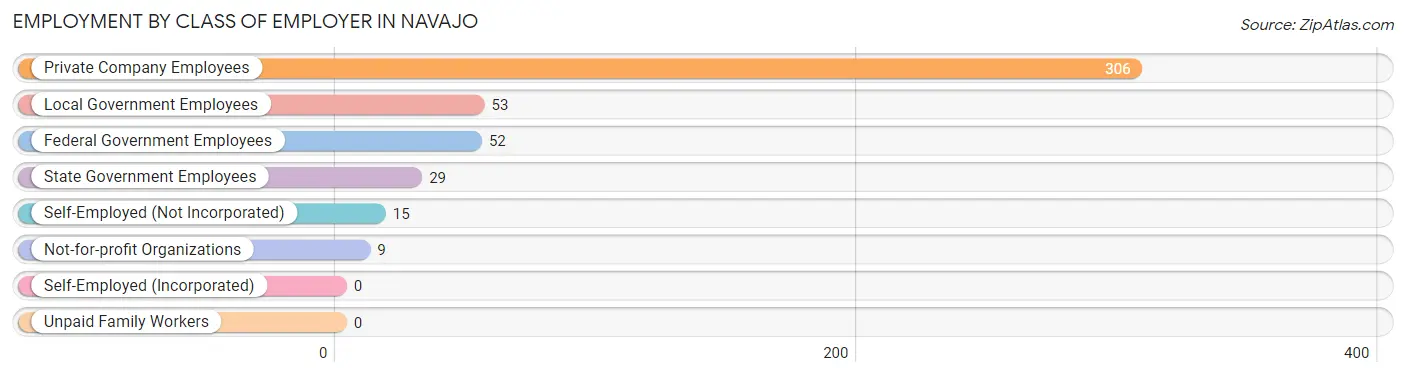
| Employer Class | # Employees | % Employees |
| Private Company Employees | 306 | 65.9% |
| Self-Employed (Incorporated) | 0 | 0.0% |
| Self-Employed (Not Incorporated) | 15 | 3.2% |
| Not-for-profit Organizations | 9 | 1.9% |
| Local Government Employees | 53 | 11.4% |
| State Government Employees | 29 | 6.2% |
| Federal Government Employees | 52 | 11.2% |
| Unpaid Family Workers | 0 | 0.0% |
| Total | 464 | 100.0% |
Employment Status by Age in Navajo
According to the labor force statistics for Navajo, out of the total population over 16 years of age (1,326), 43.4% or 575 individuals are in the labor force, with 19.3% or 111 of them unemployed. The age group with the highest labor force participation rate is 30 to 34 years, with 65.1% or 108 individuals in the labor force. Within the labor force, the 16 to 19 years age range has the highest percentage of unemployed individuals, with 100.0% or 13 of them being unemployed.
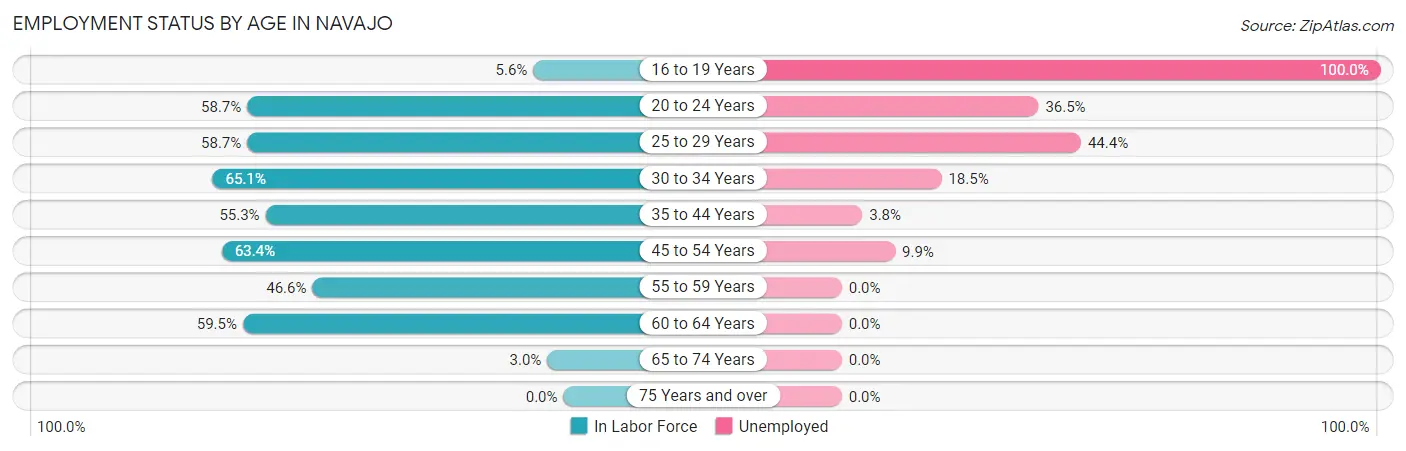
| Age Bracket | In Labor Force | Unemployed |
| 16 to 19 Years | 13 (5.6%) | 13 (100.0%) |
| 20 to 24 Years | 74 (58.7%) | 27 (36.5%) |
| 25 to 29 Years | 81 (58.7%) | 36 (44.4%) |
| 30 to 34 Years | 108 (65.1%) | 20 (18.5%) |
| 35 to 44 Years | 105 (55.3%) | 4 (3.8%) |
| 45 to 54 Years | 111 (63.4%) | 11 (9.9%) |
| 55 to 59 Years | 55 (46.6%) | 0 (0.0%) |
| 60 to 64 Years | 25 (59.5%) | 0 (0.0%) |
| 65 to 74 Years | 3 (3.0%) | 0 (0.0%) |
| 75 Years and over | 0 (0.0%) | 0 (0.0%) |
| Total | 575 (43.4%) | 111 (19.3%) |
Employment Status by Educational Attainment in Navajo
According to labor force statistics for Navajo, 58.5% of individuals (485) out of the total population between 25 and 64 years of age (829) are in the labor force, with 14.6% or 71 of them being unemployed. The group with the highest labor force participation rate are those with the educational attainment of bachelor's degree or higher, with 90.3% or 56 individuals in the labor force. Within the labor force, individuals with bachelor's degree or higher education have the highest percentage of unemployment, with 53.6% or 30 of them being unemployed.
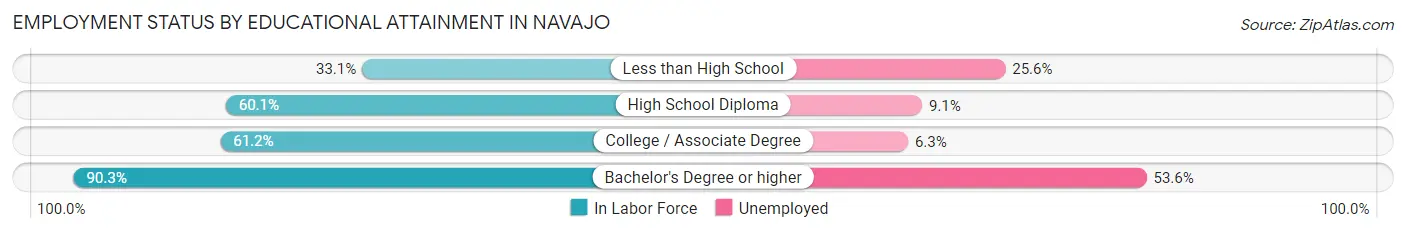
| Educational Attainment | In Labor Force | Unemployed |
| Less than High School | 43 (33.1%) | 33 (25.6%) |
| High School Diploma | 197 (60.1%) | 30 (9.1%) |
| College / Associate Degree | 189 (61.2%) | 19 (6.3%) |
| Bachelor's Degree or higher | 56 (90.3%) | 33 (53.6%) |
| Total | 485 (58.5%) | 121 (14.6%) |
Employment Occupations by Sex in Navajo
Management, Business, Science and Arts Occupations
The most common Management, Business, Science and Arts occupations in Navajo are Community & Social Service (49 | 10.6%), Education Instruction & Library (43 | 9.3%), Management (24 | 5.2%), Business & Financial (12 | 2.6%), and Education, Arts & Media (6 | 1.3%).
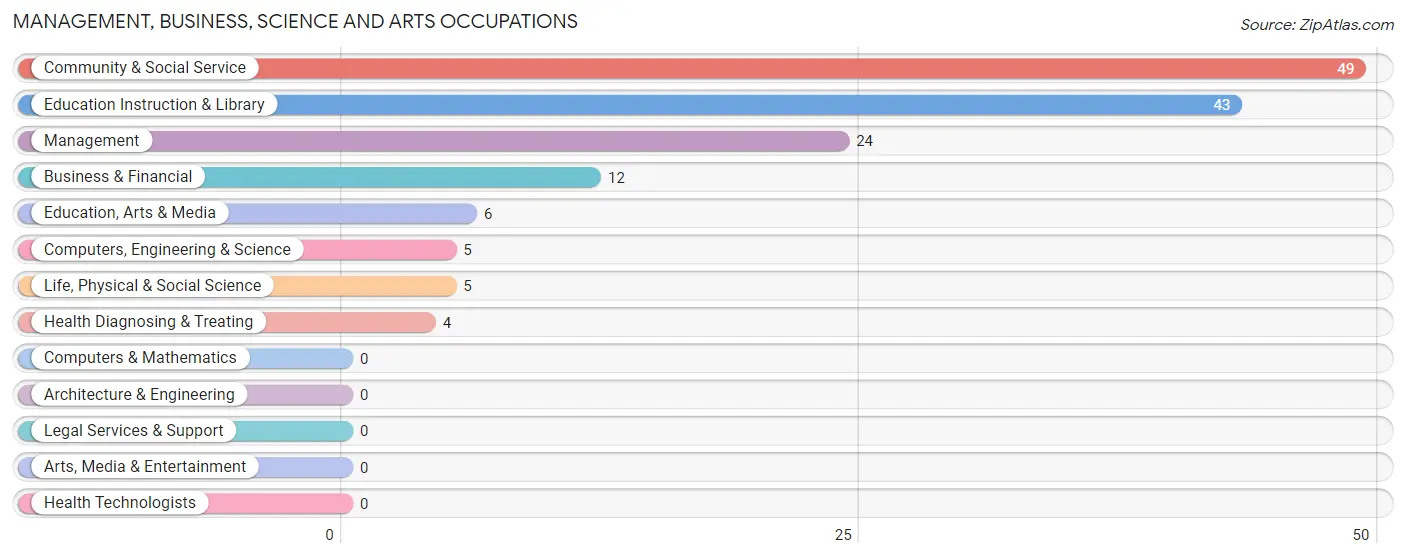
Management, Business, Science and Arts Occupations by Sex
Within the Management, Business, Science and Arts occupations in Navajo, the most male-oriented occupations are Education Instruction & Library (16.3%), and Community & Social Service (14.3%), while the most female-oriented occupations are Management (100.0%), Business & Financial (100.0%), and Computers, Engineering & Science (100.0%).
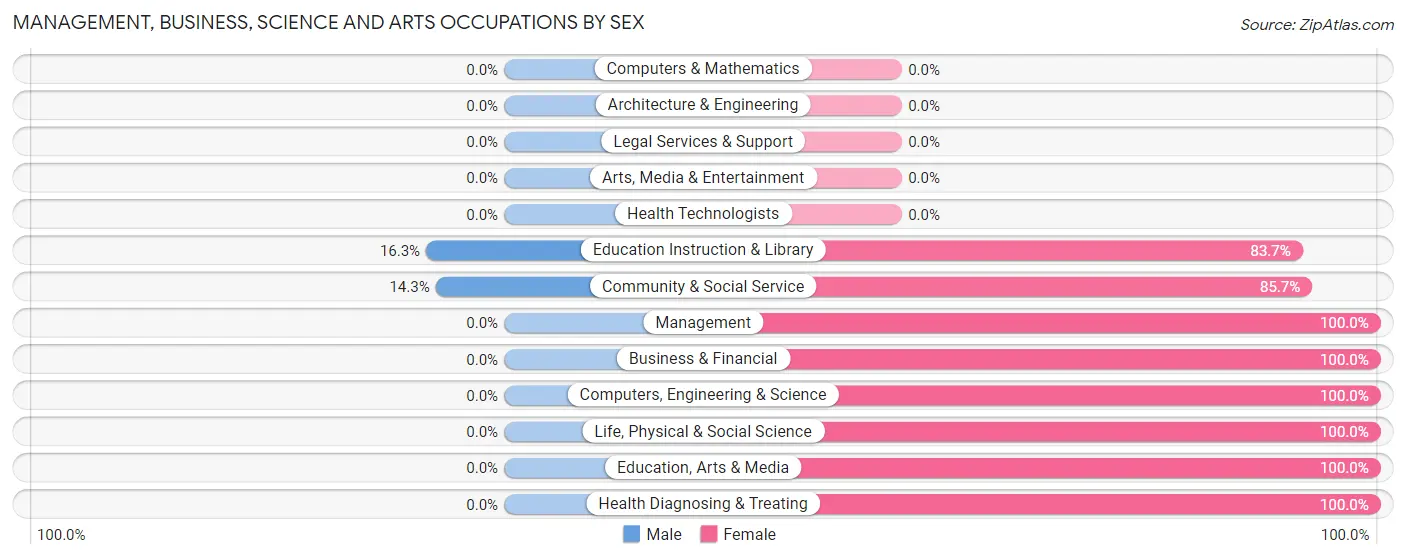
| Occupation | Male | Female |
| Management | 0 (0.0%) | 24 (100.0%) |
| Business & Financial | 0 (0.0%) | 12 (100.0%) |
| Computers, Engineering & Science | 0 (0.0%) | 5 (100.0%) |
| Computers & Mathematics | 0 (0.0%) | 0 (0.0%) |
| Architecture & Engineering | 0 (0.0%) | 0 (0.0%) |
| Life, Physical & Social Science | 0 (0.0%) | 5 (100.0%) |
| Community & Social Service | 7 (14.3%) | 42 (85.7%) |
| Education, Arts & Media | 0 (0.0%) | 6 (100.0%) |
| Legal Services & Support | 0 (0.0%) | 0 (0.0%) |
| Education Instruction & Library | 7 (16.3%) | 36 (83.7%) |
| Arts, Media & Entertainment | 0 (0.0%) | 0 (0.0%) |
| Health Diagnosing & Treating | 0 (0.0%) | 4 (100.0%) |
| Health Technologists | 0 (0.0%) | 0 (0.0%) |
| Total (Category) | 7 (7.4%) | 87 (92.5%) |
| Total (Overall) | 176 (37.9%) | 288 (62.1%) |
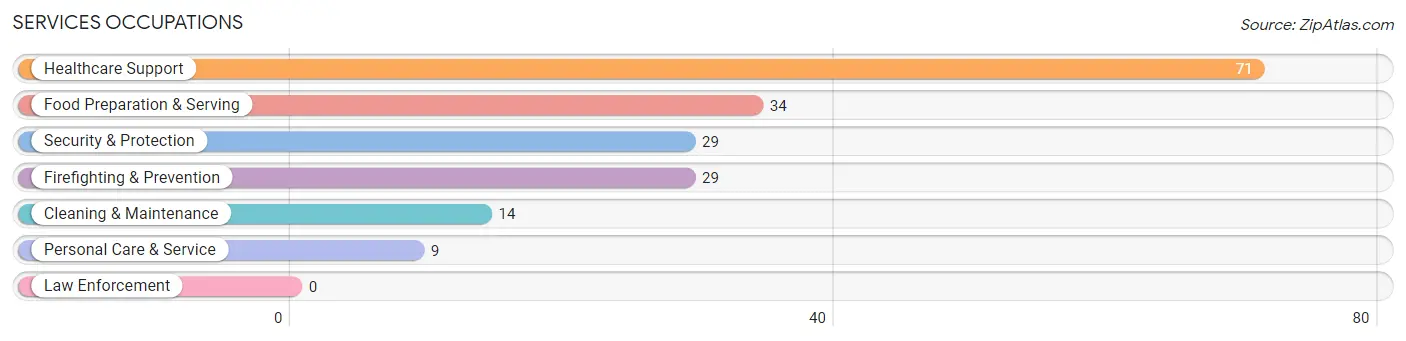
Services Occupations
The most common Services occupations in Navajo are Healthcare Support (71 | 15.3%), Food Preparation & Serving (34 | 7.3%), Security & Protection (29 | 6.2%), Firefighting & Prevention (29 | 6.2%), and Cleaning & Maintenance (14 | 3.0%).
Services Occupations by Sex
Within the Services occupations in Navajo, the most male-oriented occupations are Security & Protection (100.0%), Firefighting & Prevention (100.0%), and Cleaning & Maintenance (42.9%), while the most female-oriented occupations are Personal Care & Service (100.0%), Healthcare Support (87.3%), and Food Preparation & Serving (67.6%).
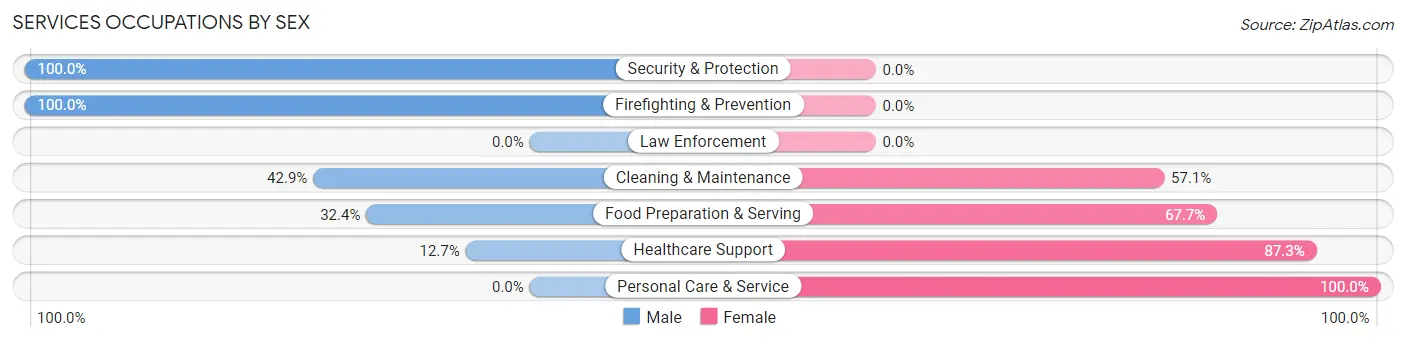
| Occupation | Male | Female |
| Healthcare Support | 9 (12.7%) | 62 (87.3%) |
| Security & Protection | 29 (100.0%) | 0 (0.0%) |
| Firefighting & Prevention | 29 (100.0%) | 0 (0.0%) |
| Law Enforcement | 0 (0.0%) | 0 (0.0%) |
| Food Preparation & Serving | 11 (32.4%) | 23 (67.6%) |
| Cleaning & Maintenance | 6 (42.9%) | 8 (57.1%) |
| Personal Care & Service | 0 (0.0%) | 9 (100.0%) |
| Total (Category) | 55 (35.0%) | 102 (65.0%) |
| Total (Overall) | 176 (37.9%) | 288 (62.1%) |
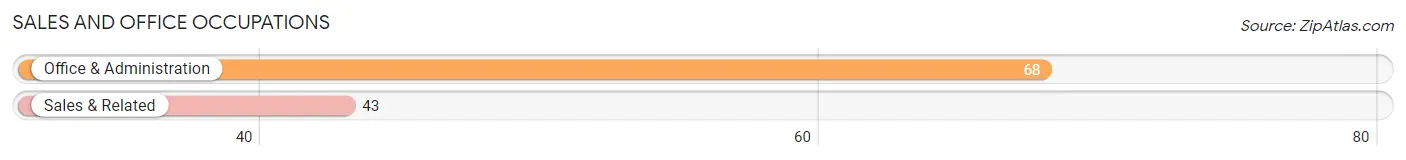
Sales and Office Occupations
The most common Sales and Office occupations in Navajo are Office & Administration (68 | 14.7%), and Sales & Related (43 | 9.3%).
Sales and Office Occupations by Sex
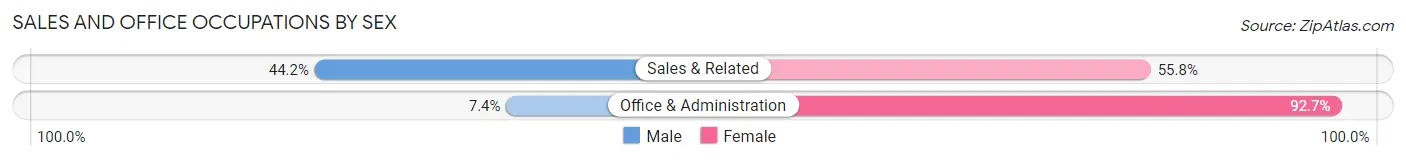
| Occupation | Male | Female |
| Sales & Related | 19 (44.2%) | 24 (55.8%) |
| Office & Administration | 5 (7.3%) | 63 (92.6%) |
| Total (Category) | 24 (21.6%) | 87 (78.4%) |
| Total (Overall) | 176 (37.9%) | 288 (62.1%) |
Natural Resources, Construction and Maintenance Occupations
The most common Natural Resources, Construction and Maintenance occupations in Navajo are Construction & Extraction (34 | 7.3%), and Installation, Maintenance & Repair (10 | 2.2%).
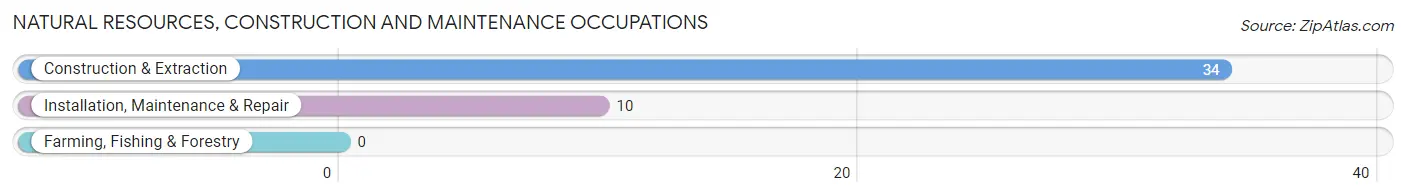
Natural Resources, Construction and Maintenance Occupations by Sex
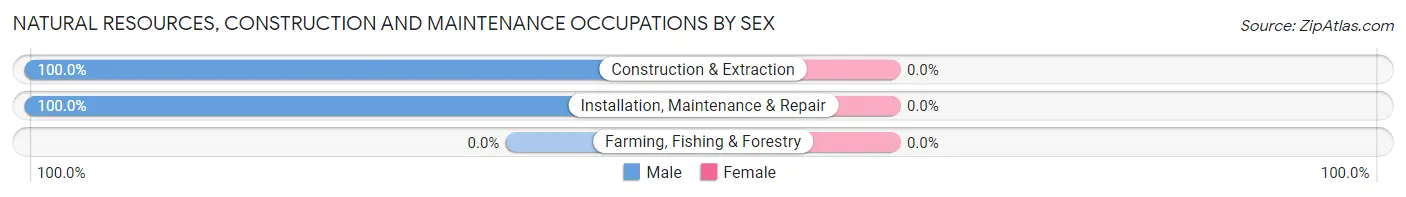
| Occupation | Male | Female |
| Farming, Fishing & Forestry | 0 (0.0%) | 0 (0.0%) |
| Construction & Extraction | 34 (100.0%) | 0 (0.0%) |
| Installation, Maintenance & Repair | 10 (100.0%) | 0 (0.0%) |
| Total (Category) | 44 (100.0%) | 0 (0.0%) |
| Total (Overall) | 176 (37.9%) | 288 (62.1%) |
Production, Transportation and Moving Occupations
The most common Production, Transportation and Moving occupations in Navajo are Transportation (37 | 8.0%), Material Moving (16 | 3.5%), and Production (5 | 1.1%).
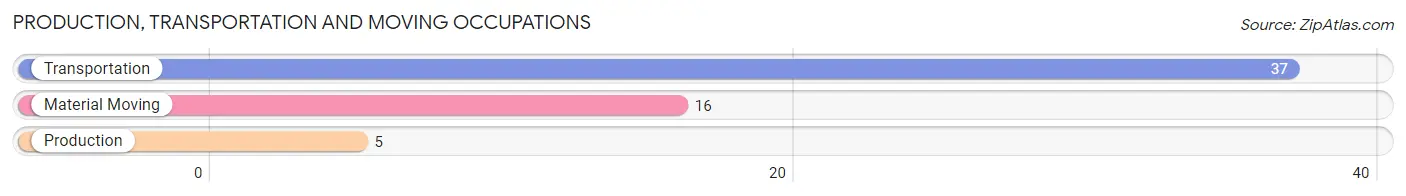
Production, Transportation and Moving Occupations by Sex
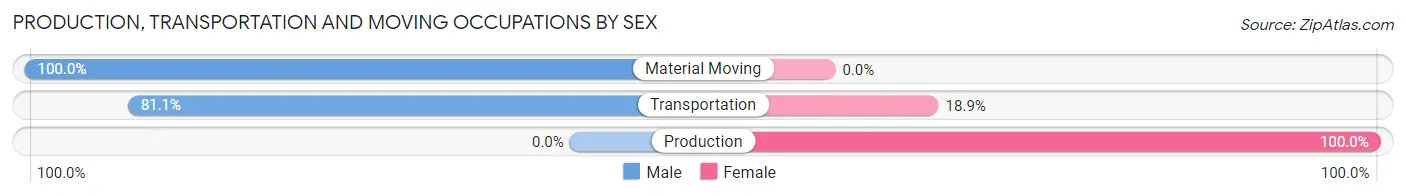
| Occupation | Male | Female |
| Production | 0 (0.0%) | 5 (100.0%) |
| Transportation | 30 (81.1%) | 7 (18.9%) |
| Material Moving | 16 (100.0%) | 0 (0.0%) |
| Total (Category) | 46 (79.3%) | 12 (20.7%) |
| Total (Overall) | 176 (37.9%) | 288 (62.1%) |
Employment Industries by Sex in Navajo
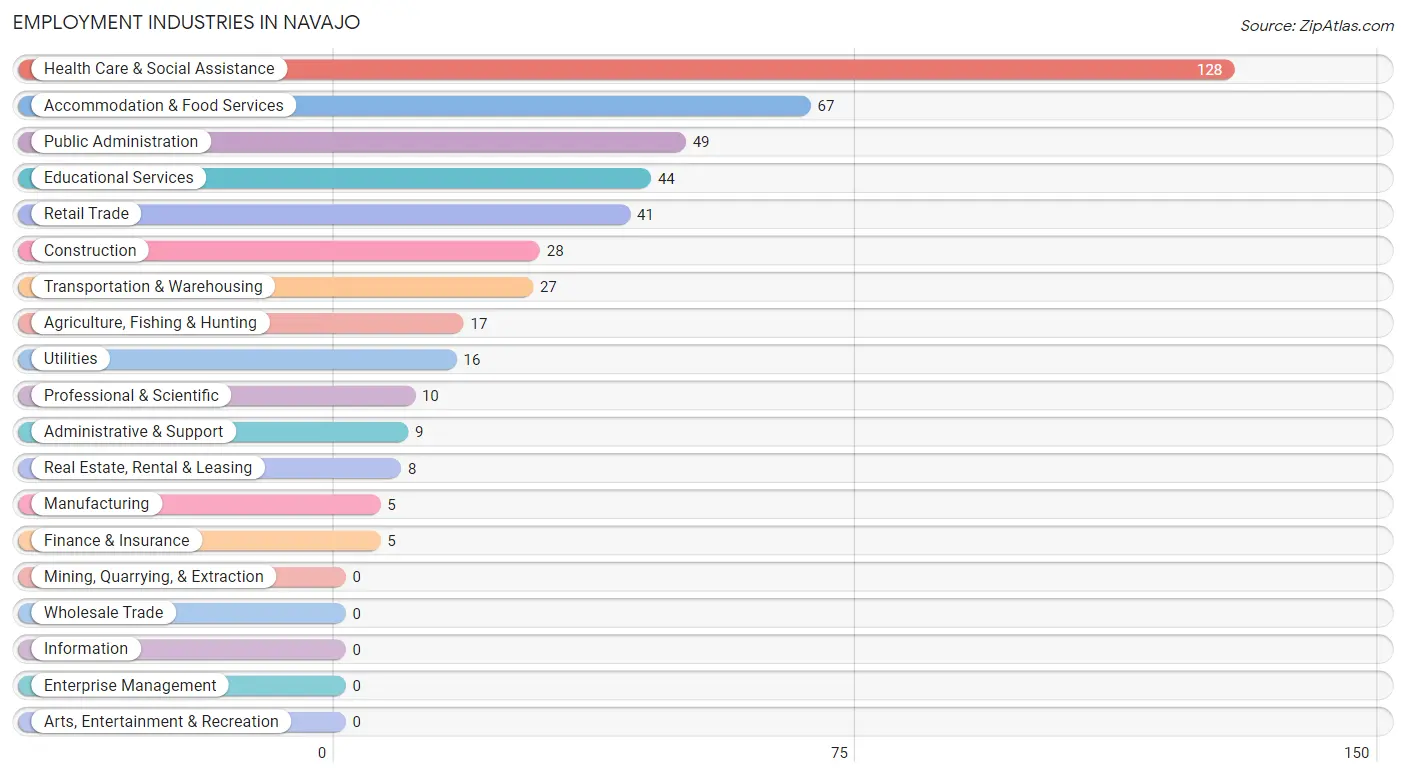
Employment Industries in Navajo
The major employment industries in Navajo include Health Care & Social Assistance (128 | 27.6%), Accommodation & Food Services (67 | 14.4%), Public Administration (49 | 10.6%), Educational Services (44 | 9.5%), and Retail Trade (41 | 8.8%).
Employment Industries by Sex in Navajo
The Navajo industries that see more men than women are Agriculture, Fishing & Hunting (100.0%), Construction (100.0%), and Finance & Insurance (100.0%), whereas the industries that tend to have a higher number of women are Manufacturing (100.0%), Real Estate, Rental & Leasing (100.0%), and Professional & Scientific (100.0%).
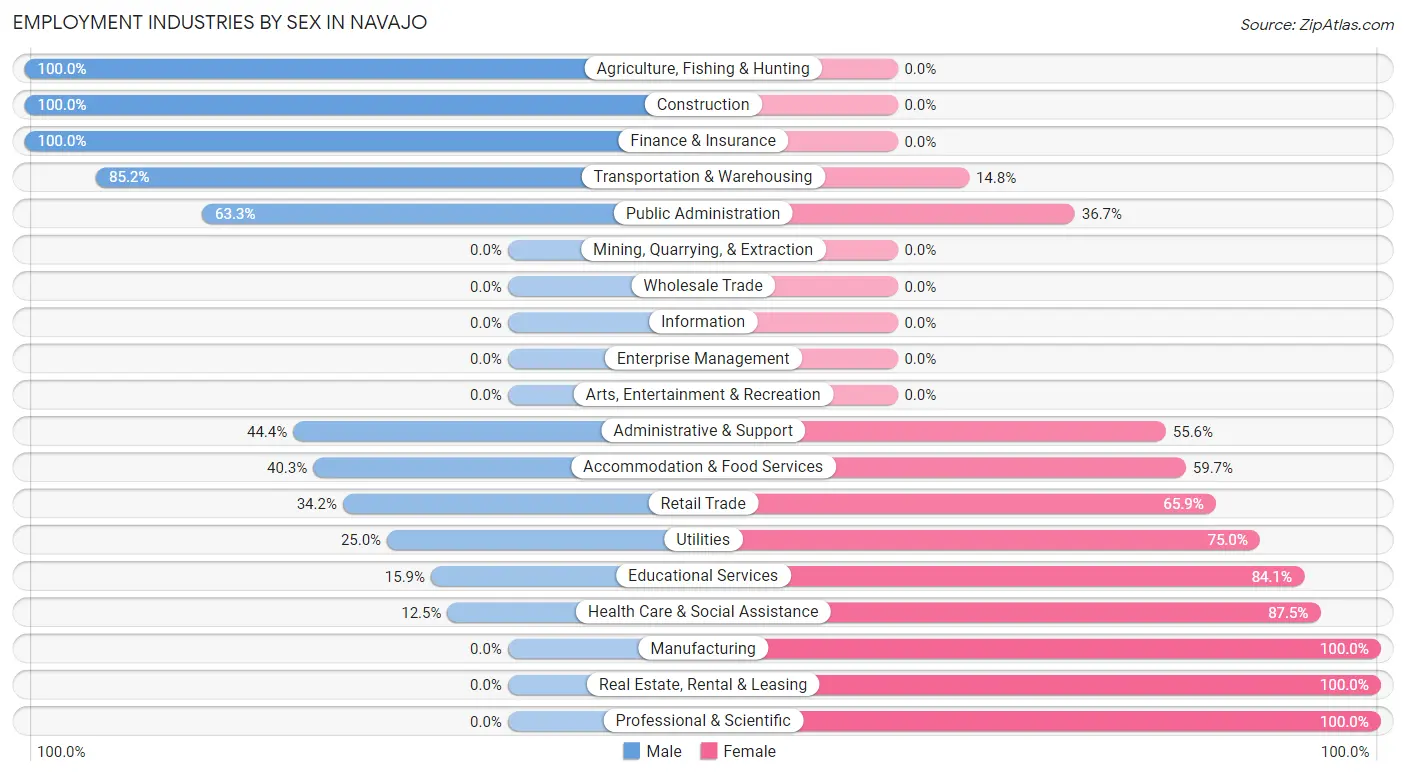
| Industry | Male | Female |
| Agriculture, Fishing & Hunting | 17 (100.0%) | 0 (0.0%) |
| Mining, Quarrying, & Extraction | 0 (0.0%) | 0 (0.0%) |
| Construction | 28 (100.0%) | 0 (0.0%) |
| Manufacturing | 0 (0.0%) | 5 (100.0%) |
| Wholesale Trade | 0 (0.0%) | 0 (0.0%) |
| Retail Trade | 14 (34.2%) | 27 (65.8%) |
| Transportation & Warehousing | 23 (85.2%) | 4 (14.8%) |
| Utilities | 4 (25.0%) | 12 (75.0%) |
| Information | 0 (0.0%) | 0 (0.0%) |
| Finance & Insurance | 5 (100.0%) | 0 (0.0%) |
| Real Estate, Rental & Leasing | 0 (0.0%) | 8 (100.0%) |
| Professional & Scientific | 0 (0.0%) | 10 (100.0%) |
| Enterprise Management | 0 (0.0%) | 0 (0.0%) |
| Administrative & Support | 4 (44.4%) | 5 (55.6%) |
| Educational Services | 7 (15.9%) | 37 (84.1%) |
| Health Care & Social Assistance | 16 (12.5%) | 112 (87.5%) |
| Arts, Entertainment & Recreation | 0 (0.0%) | 0 (0.0%) |
| Accommodation & Food Services | 27 (40.3%) | 40 (59.7%) |
| Public Administration | 31 (63.3%) | 18 (36.7%) |
| Total | 176 (37.9%) | 288 (62.1%) |
Education in Navajo
School Enrollment in Navajo
The most common levels of schooling among the 818 students in Navajo are elementary school (258 | 31.5%), high school (203 | 24.8%), and middle school (186 | 22.7%).
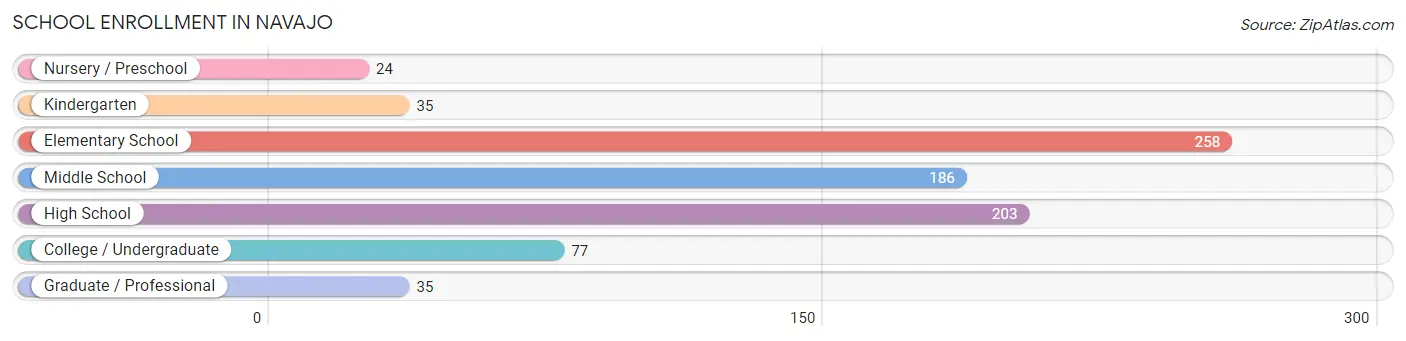
| School Level | # Students | % Students |
| Nursery / Preschool | 24 | 2.9% |
| Kindergarten | 35 | 4.3% |
| Elementary School | 258 | 31.5% |
| Middle School | 186 | 22.7% |
| High School | 203 | 24.8% |
| College / Undergraduate | 77 | 9.4% |
| Graduate / Professional | 35 | 4.3% |
| Total | 818 | 100.0% |
School Enrollment by Age by Funding Source in Navajo
Out of a total of 818 students who are enrolled in schools in Navajo, 13 (1.6%) attend a private institution, while the remaining 805 (98.4%) are enrolled in public schools. The age group of 35 years and over has the highest likelihood of being enrolled in private schools, with 13 (46.4% in the age bracket) enrolled. Conversely, the age group of 3 to 4 year olds has the lowest likelihood of being enrolled in a private school, with 35 (100.0% in the age bracket) attending a public institution.
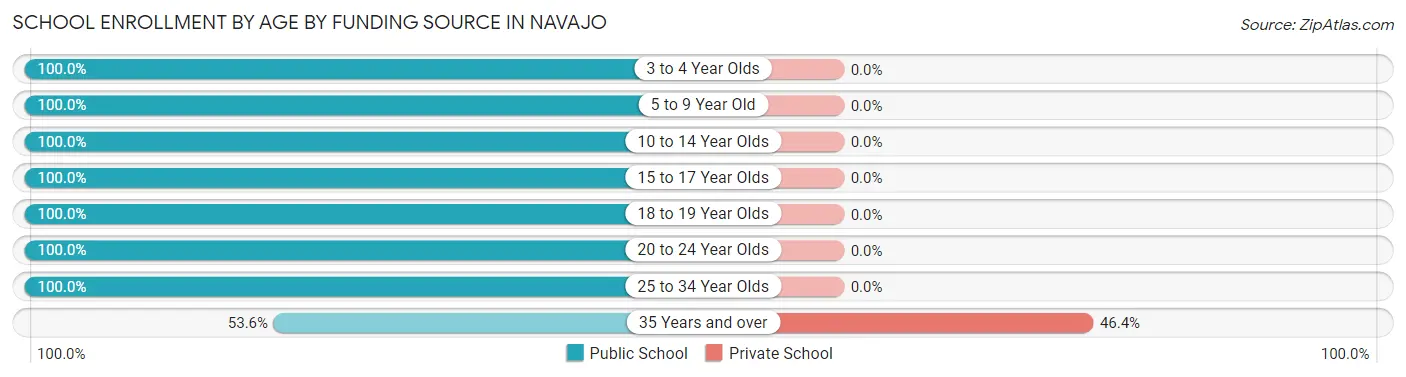
| Age Bracket | Public School | Private School |
| 3 to 4 Year Olds | 35 (100.0%) | 0 (0.0%) |
| 5 to 9 Year Old | 271 (100.0%) | 0 (0.0%) |
| 10 to 14 Year Olds | 208 (100.0%) | 0 (0.0%) |
| 15 to 17 Year Olds | 139 (100.0%) | 0 (0.0%) |
| 18 to 19 Year Olds | 64 (100.0%) | 0 (0.0%) |
| 20 to 24 Year Olds | 27 (100.0%) | 0 (0.0%) |
| 25 to 34 Year Olds | 46 (100.0%) | 0 (0.0%) |
| 35 Years and over | 15 (53.6%) | 13 (46.4%) |
| Total | 805 (98.4%) | 13 (1.6%) |
Educational Attainment by Field of Study in Navajo
Engineering (39 | 58.2%), education (21 | 31.3%), physical & health sciences (4 | 6.0%), and science & technology (3 | 4.5%) are the most common fields of study among 67 individuals in Navajo who have obtained a bachelor's degree or higher.
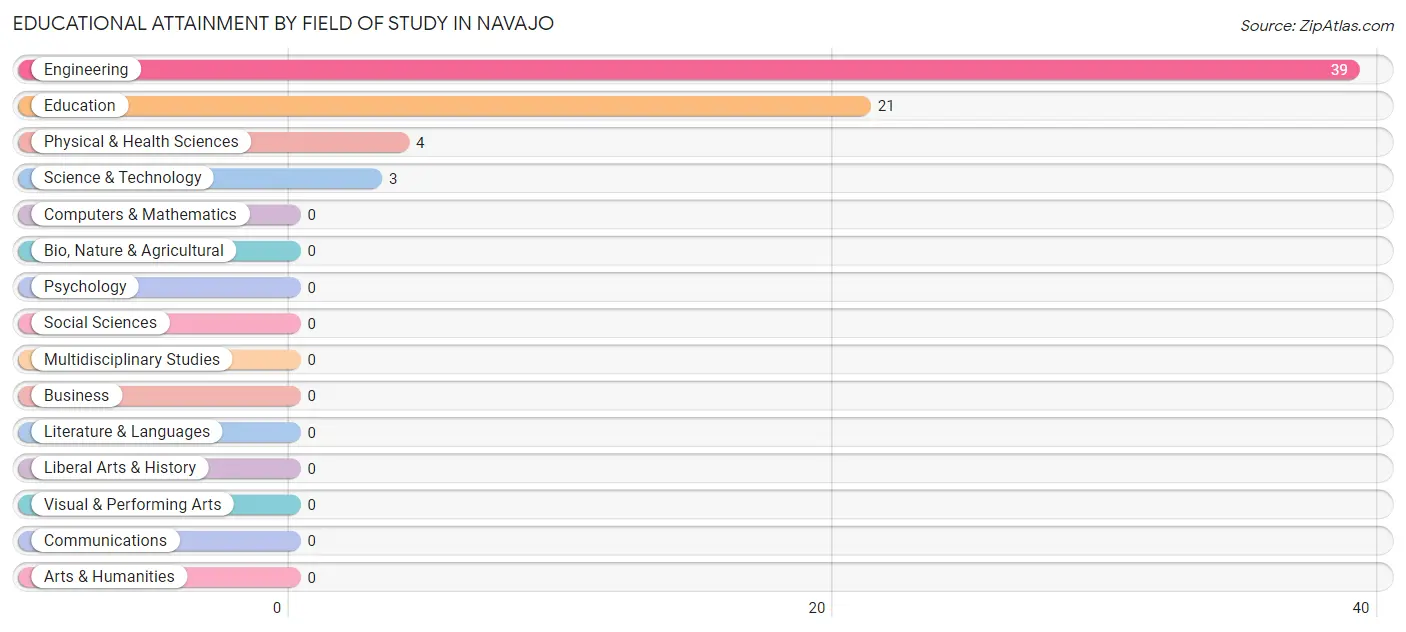
| Field of Study | # Graduates | % Graduates |
| Computers & Mathematics | 0 | 0.0% |
| Bio, Nature & Agricultural | 0 | 0.0% |
| Physical & Health Sciences | 4 | 6.0% |
| Psychology | 0 | 0.0% |
| Social Sciences | 0 | 0.0% |
| Engineering | 39 | 58.2% |
| Multidisciplinary Studies | 0 | 0.0% |
| Science & Technology | 3 | 4.5% |
| Business | 0 | 0.0% |
| Education | 21 | 31.3% |
| Literature & Languages | 0 | 0.0% |
| Liberal Arts & History | 0 | 0.0% |
| Visual & Performing Arts | 0 | 0.0% |
| Communications | 0 | 0.0% |
| Arts & Humanities | 0 | 0.0% |
| Total | 67 | 100.0% |
Transportation & Commute in Navajo
Vehicle Availability by Sex in Navajo
The most prevalent vehicle ownership categories in Navajo are males with 2 vehicles (80, accounting for 45.5%) and females with 2 vehicles (99, making up 27.8%).
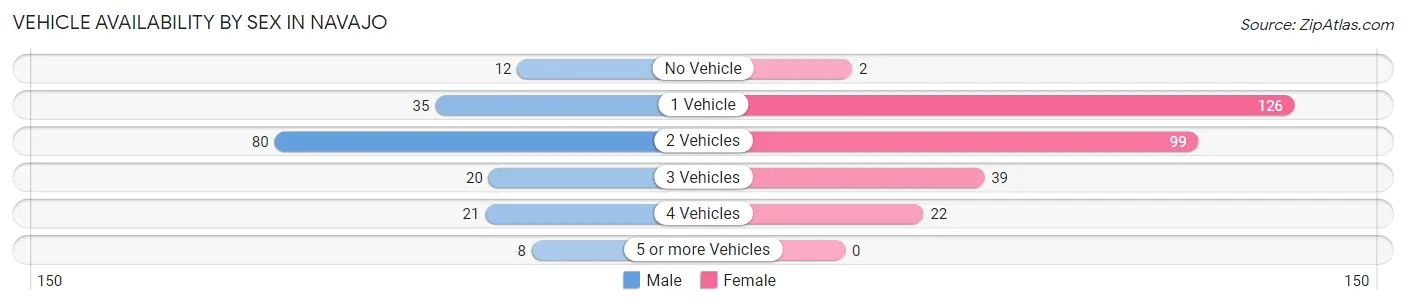
| Vehicles Available | Male | Female |
| No Vehicle | 12 (6.8%) | 2 (0.7%) |
| 1 Vehicle | 35 (19.9%) | 126 (43.8%) |
| 2 Vehicles | 80 (45.5%) | 99 (34.4%) |
| 3 Vehicles | 20 (11.4%) | 39 (13.5%) |
| 4 Vehicles | 21 (11.9%) | 22 (7.6%) |
| 5 or more Vehicles | 8 (4.5%) | 0 (0.0%) |
| Total | 176 (100.0%) | 288 (100.0%) |
Commute Time in Navajo
The most frequently occuring commute durations in Navajo are 10 to 14 minutes (70 commuters, 17.7%), 30 to 34 minutes (68 commuters, 17.2%), and 20 to 24 minutes (65 commuters, 16.4%).
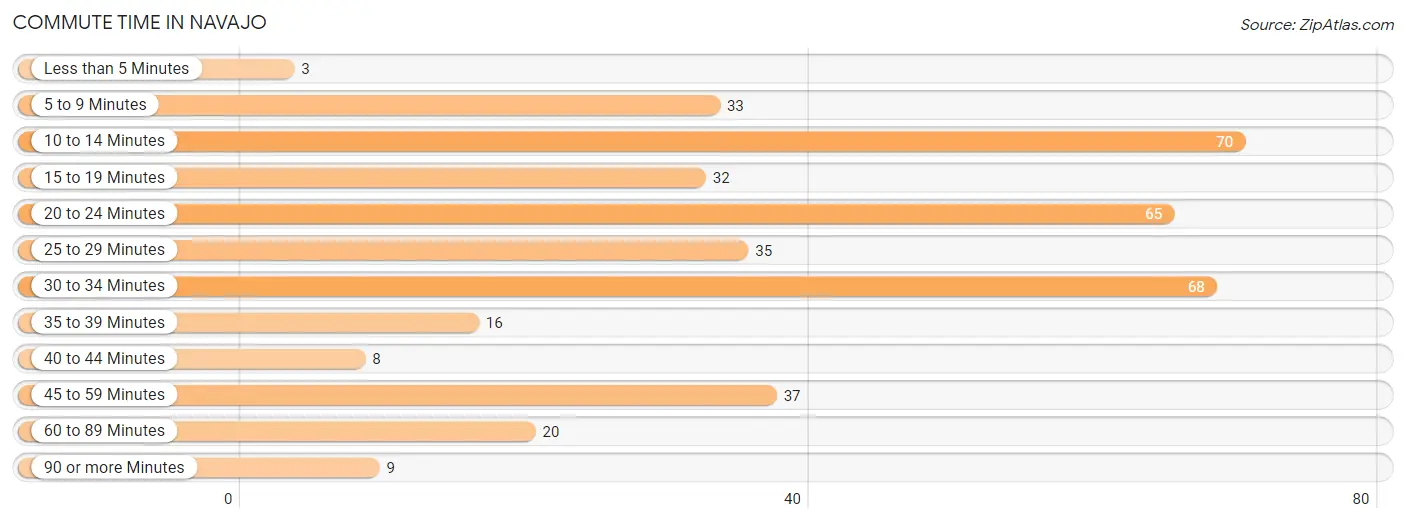
| Commute Time | # Commuters | % Commuters |
| Less than 5 Minutes | 3 | 0.8% |
| 5 to 9 Minutes | 33 | 8.3% |
| 10 to 14 Minutes | 70 | 17.7% |
| 15 to 19 Minutes | 32 | 8.1% |
| 20 to 24 Minutes | 65 | 16.4% |
| 25 to 29 Minutes | 35 | 8.8% |
| 30 to 34 Minutes | 68 | 17.2% |
| 35 to 39 Minutes | 16 | 4.0% |
| 40 to 44 Minutes | 8 | 2.0% |
| 45 to 59 Minutes | 37 | 9.3% |
| 60 to 89 Minutes | 20 | 5.1% |
| 90 or more Minutes | 9 | 2.3% |
Commute Time by Sex in Navajo
The most common commute times in Navajo are 10 to 14 minutes (54 commuters, 35.3%) for males and 20 to 24 minutes (57 commuters, 23.5%) for females.
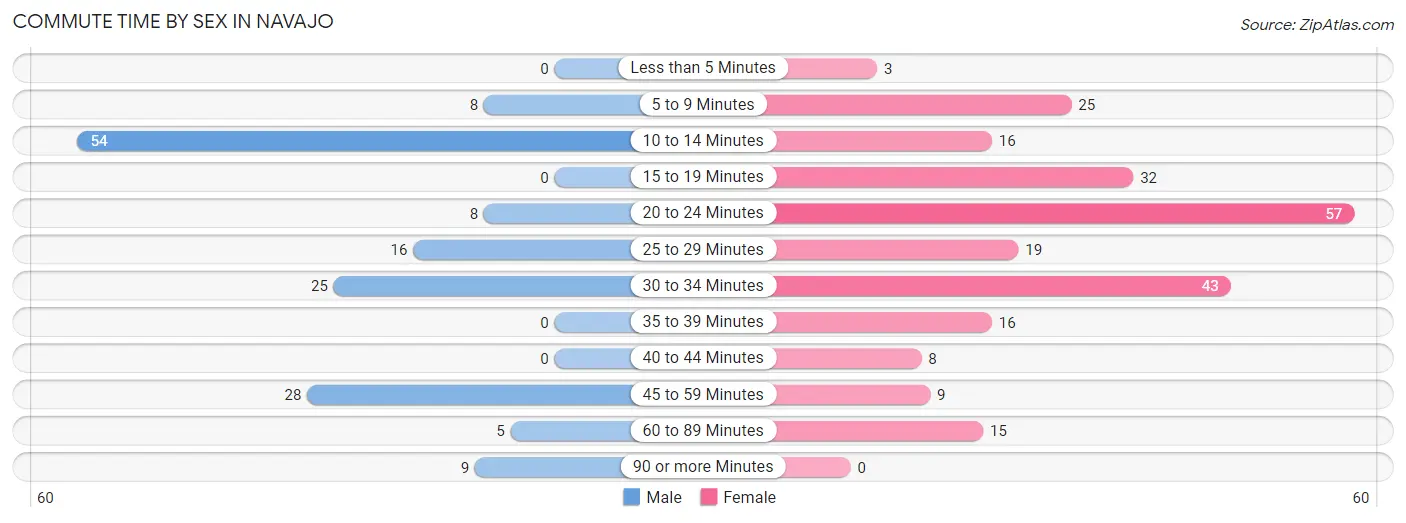
| Commute Time | Male | Female |
| Less than 5 Minutes | 0 (0.0%) | 3 (1.2%) |
| 5 to 9 Minutes | 8 (5.2%) | 25 (10.3%) |
| 10 to 14 Minutes | 54 (35.3%) | 16 (6.6%) |
| 15 to 19 Minutes | 0 (0.0%) | 32 (13.2%) |
| 20 to 24 Minutes | 8 (5.2%) | 57 (23.5%) |
| 25 to 29 Minutes | 16 (10.5%) | 19 (7.8%) |
| 30 to 34 Minutes | 25 (16.3%) | 43 (17.7%) |
| 35 to 39 Minutes | 0 (0.0%) | 16 (6.6%) |
| 40 to 44 Minutes | 0 (0.0%) | 8 (3.3%) |
| 45 to 59 Minutes | 28 (18.3%) | 9 (3.7%) |
| 60 to 89 Minutes | 5 (3.3%) | 15 (6.2%) |
| 90 or more Minutes | 9 (5.9%) | 0 (0.0%) |
Time of Departure to Work by Sex in Navajo
The most frequent times of departure to work in Navajo are 6:00 AM to 6:29 AM (35, 22.9%) for males and 7:00 AM to 7:29 AM (70, 28.8%) for females.
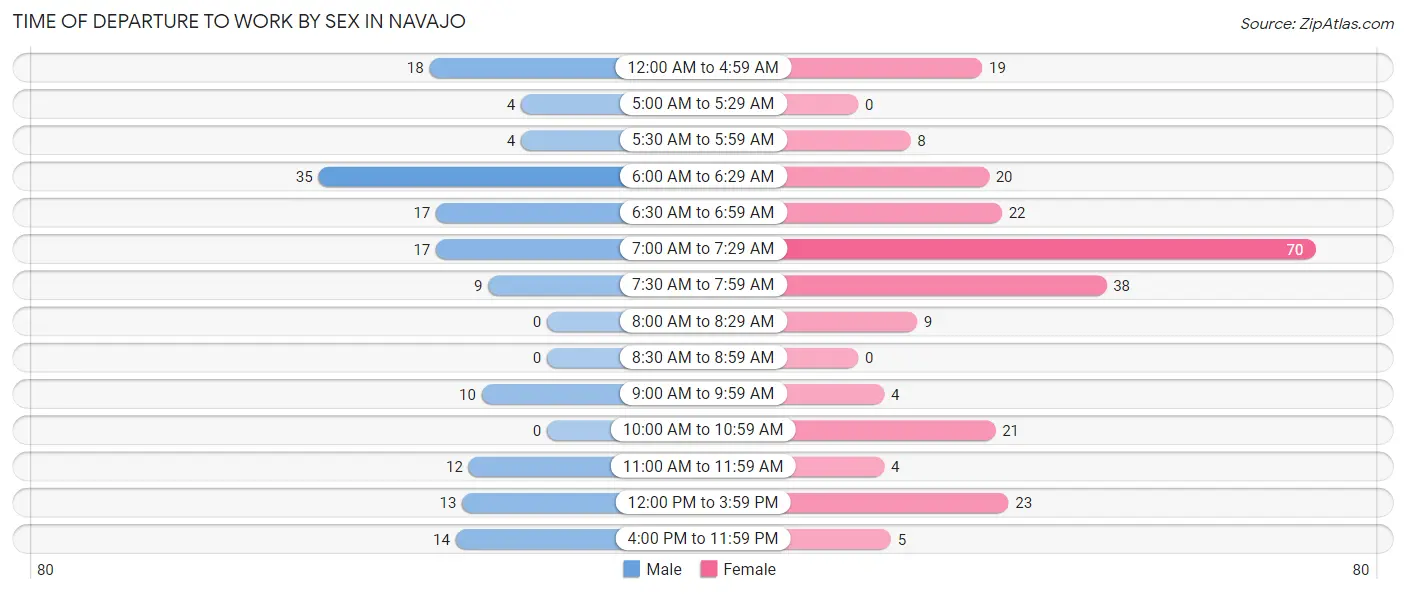
| Time of Departure | Male | Female |
| 12:00 AM to 4:59 AM | 18 (11.8%) | 19 (7.8%) |
| 5:00 AM to 5:29 AM | 4 (2.6%) | 0 (0.0%) |
| 5:30 AM to 5:59 AM | 4 (2.6%) | 8 (3.3%) |
| 6:00 AM to 6:29 AM | 35 (22.9%) | 20 (8.2%) |
| 6:30 AM to 6:59 AM | 17 (11.1%) | 22 (9.0%) |
| 7:00 AM to 7:29 AM | 17 (11.1%) | 70 (28.8%) |
| 7:30 AM to 7:59 AM | 9 (5.9%) | 38 (15.6%) |
| 8:00 AM to 8:29 AM | 0 (0.0%) | 9 (3.7%) |
| 8:30 AM to 8:59 AM | 0 (0.0%) | 0 (0.0%) |
| 9:00 AM to 9:59 AM | 10 (6.5%) | 4 (1.7%) |
| 10:00 AM to 10:59 AM | 0 (0.0%) | 21 (8.6%) |
| 11:00 AM to 11:59 AM | 12 (7.8%) | 4 (1.7%) |
| 12:00 PM to 3:59 PM | 13 (8.5%) | 23 (9.5%) |
| 4:00 PM to 11:59 PM | 14 (9.1%) | 5 (2.1%) |
| Total | 153 (100.0%) | 243 (100.0%) |
Housing Occupancy in Navajo
Occupancy by Ownership in Navajo
Of the total 558 dwellings in Navajo, owner-occupied units account for 27 (4.8%), while renter-occupied units make up 531 (95.2%).
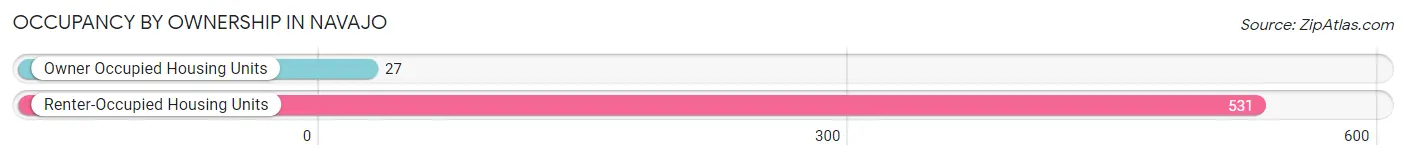
| Occupancy | # Housing Units | % Housing Units |
| Owner Occupied Housing Units | 27 | 4.8% |
| Renter-Occupied Housing Units | 531 | 95.2% |
| Total Occupied Housing Units | 558 | 100.0% |
Occupancy by Household Size in Navajo
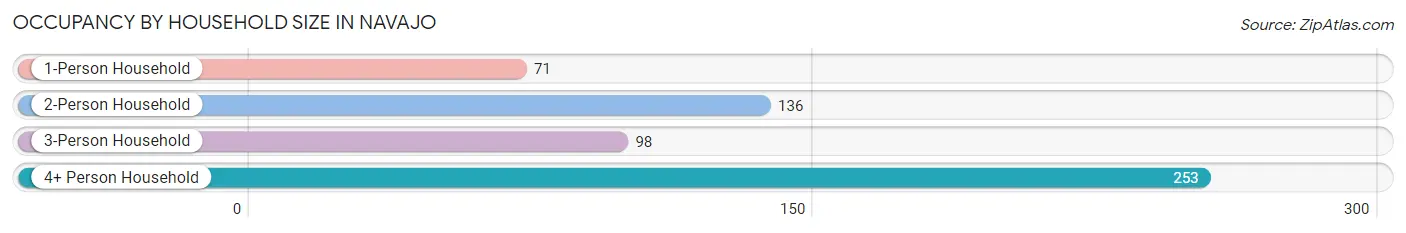
| Household Size | # Housing Units | % Housing Units |
| 1-Person Household | 71 | 12.7% |
| 2-Person Household | 136 | 24.4% |
| 3-Person Household | 98 | 17.6% |
| 4+ Person Household | 253 | 45.3% |
| Total Housing Units | 558 | 100.0% |
Occupancy by Ownership by Household Size in Navajo
| Household Size | Owner-occupied | Renter-occupied |
| 1-Person Household | 0 (0.0%) | 71 (100.0%) |
| 2-Person Household | 9 (6.6%) | 127 (93.4%) |
| 3-Person Household | 4 (4.1%) | 94 (95.9%) |
| 4+ Person Household | 14 (5.5%) | 239 (94.5%) |
| Total Housing Units | 27 (4.8%) | 531 (95.2%) |
Occupancy by Educational Attainment in Navajo
| Household Size | Owner-occupied | Renter-occupied |
| Less than High School | 3 (3.2%) | 91 (96.8%) |
| High School Diploma | 17 (7.7%) | 203 (92.3%) |
| College/Associate Degree | 4 (1.9%) | 211 (98.1%) |
| Bachelor's Degree or higher | 3 (10.3%) | 26 (89.7%) |
Occupancy by Age of Householder in Navajo
| Age Bracket | # Households | % Households |
| Under 35 Years | 161 | 28.8% |
| 35 to 44 Years | 104 | 18.6% |
| 45 to 54 Years | 89 | 16.0% |
| 55 to 64 Years | 105 | 18.8% |
| 65 to 74 Years | 79 | 14.2% |
| 75 to 84 Years | 16 | 2.9% |
| 85 Years and Over | 4 | 0.7% |
| Total | 558 | 100.0% |
Housing Finances in Navajo
Median Income by Occupancy in Navajo
| Occupancy Type | # Households | Median Income |
| Owner-Occupied | 27 (4.8%) | $87,917 |
| Renter-Occupied | 531 (95.2%) | $27,725 |
| Average | 558 (100.0%) | $28,160 |
Occupancy by Householder Income Bracket in Navajo
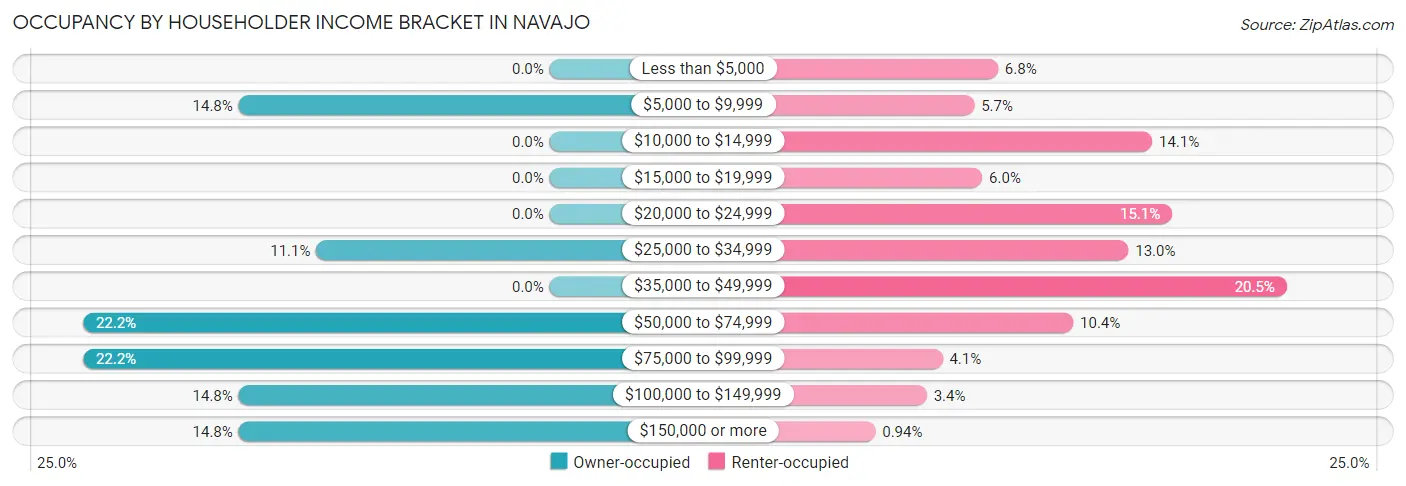
| Income Bracket | Owner-occupied | Renter-occupied |
| Less than $5,000 | 0 (0.0%) | 36 (6.8%) |
| $5,000 to $9,999 | 4 (14.8%) | 30 (5.7%) |
| $10,000 to $14,999 | 0 (0.0%) | 75 (14.1%) |
| $15,000 to $19,999 | 0 (0.0%) | 32 (6.0%) |
| $20,000 to $24,999 | 0 (0.0%) | 80 (15.1%) |
| $25,000 to $34,999 | 3 (11.1%) | 69 (13.0%) |
| $35,000 to $49,999 | 0 (0.0%) | 109 (20.5%) |
| $50,000 to $74,999 | 6 (22.2%) | 55 (10.4%) |
| $75,000 to $99,999 | 6 (22.2%) | 22 (4.1%) |
| $100,000 to $149,999 | 4 (14.8%) | 18 (3.4%) |
| $150,000 or more | 4 (14.8%) | 5 (0.9%) |
| Total | 27 (100.0%) | 531 (100.0%) |
Monthly Housing Cost Tiers in Navajo
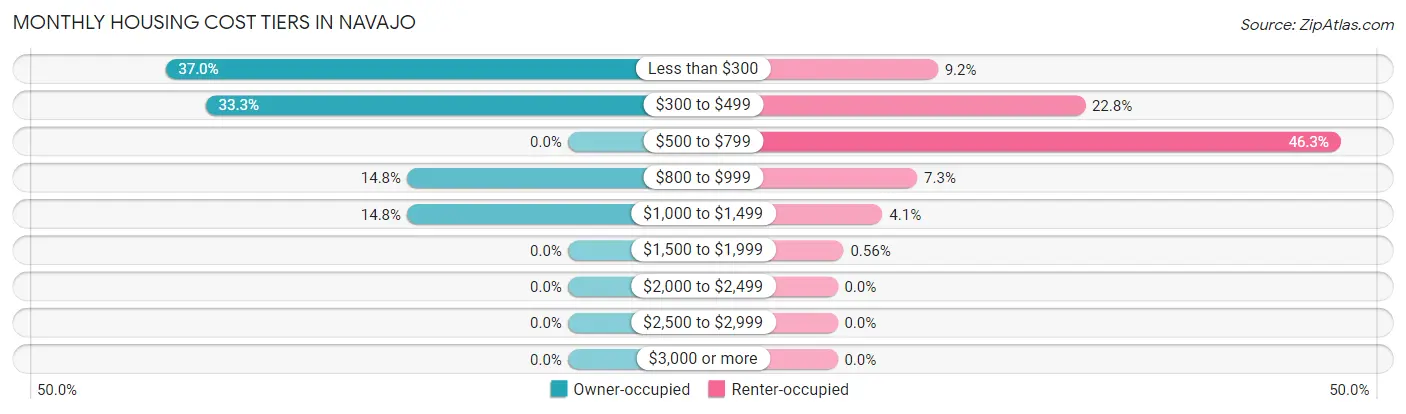
| Monthly Cost | Owner-occupied | Renter-occupied |
| Less than $300 | 10 (37.0%) | 49 (9.2%) |
| $300 to $499 | 9 (33.3%) | 121 (22.8%) |
| $500 to $799 | 0 (0.0%) | 246 (46.3%) |
| $800 to $999 | 4 (14.8%) | 39 (7.3%) |
| $1,000 to $1,499 | 4 (14.8%) | 22 (4.1%) |
| $1,500 to $1,999 | 0 (0.0%) | 3 (0.6%) |
| $2,000 to $2,499 | 0 (0.0%) | 0 (0.0%) |
| $2,500 to $2,999 | 0 (0.0%) | 0 (0.0%) |
| $3,000 or more | 0 (0.0%) | 0 (0.0%) |
| Total | 27 (100.0%) | 531 (100.0%) |
Physical Housing Characteristics in Navajo
Housing Structures in Navajo
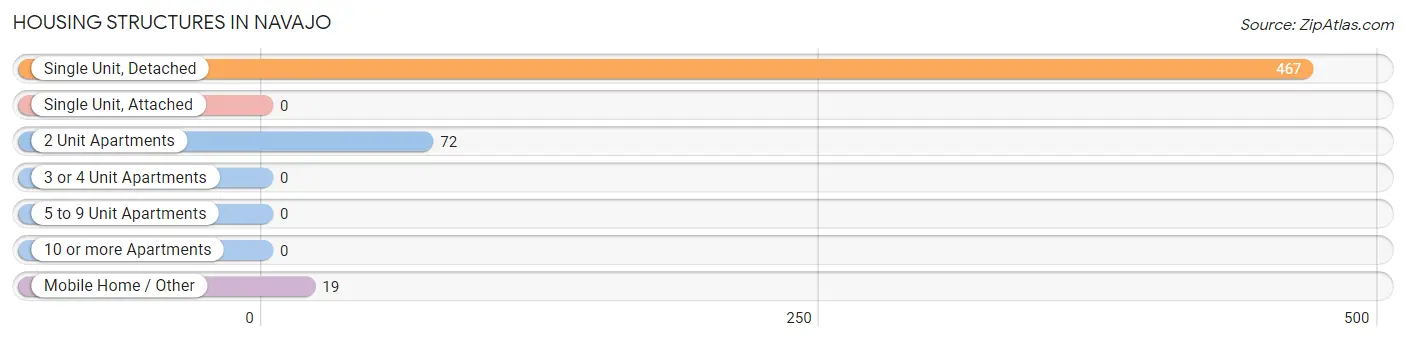
| Structure Type | # Housing Units | % Housing Units |
| Single Unit, Detached | 467 | 83.7% |
| Single Unit, Attached | 0 | 0.0% |
| 2 Unit Apartments | 72 | 12.9% |
| 3 or 4 Unit Apartments | 0 | 0.0% |
| 5 to 9 Unit Apartments | 0 | 0.0% |
| 10 or more Apartments | 0 | 0.0% |
| Mobile Home / Other | 19 | 3.4% |
| Total | 558 | 100.0% |
Housing Structures by Occupancy in Navajo
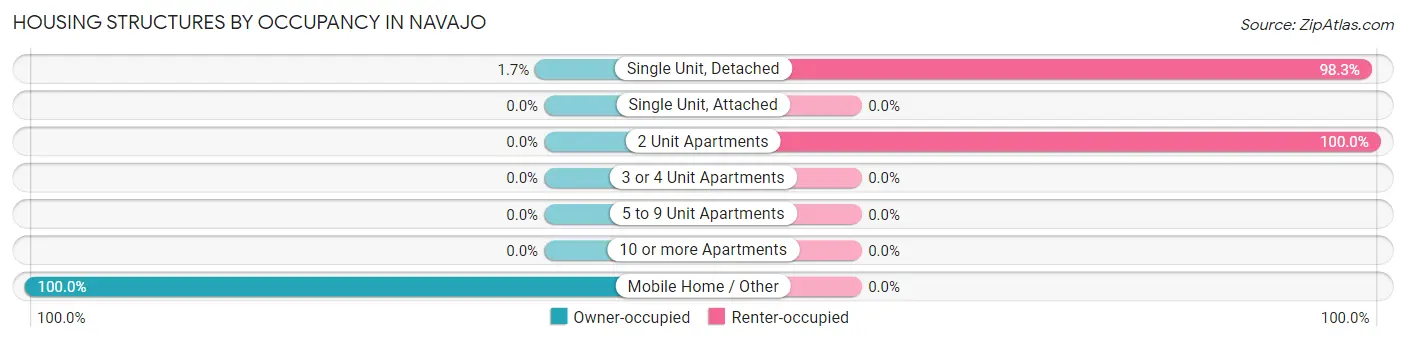
| Structure Type | Owner-occupied | Renter-occupied |
| Single Unit, Detached | 8 (1.7%) | 459 (98.3%) |
| Single Unit, Attached | 0 (0.0%) | 0 (0.0%) |
| 2 Unit Apartments | 0 (0.0%) | 72 (100.0%) |
| 3 or 4 Unit Apartments | 0 (0.0%) | 0 (0.0%) |
| 5 to 9 Unit Apartments | 0 (0.0%) | 0 (0.0%) |
| 10 or more Apartments | 0 (0.0%) | 0 (0.0%) |
| Mobile Home / Other | 19 (100.0%) | 0 (0.0%) |
| Total | 27 (4.8%) | 531 (95.2%) |
Housing Structures by Number of Rooms in Navajo
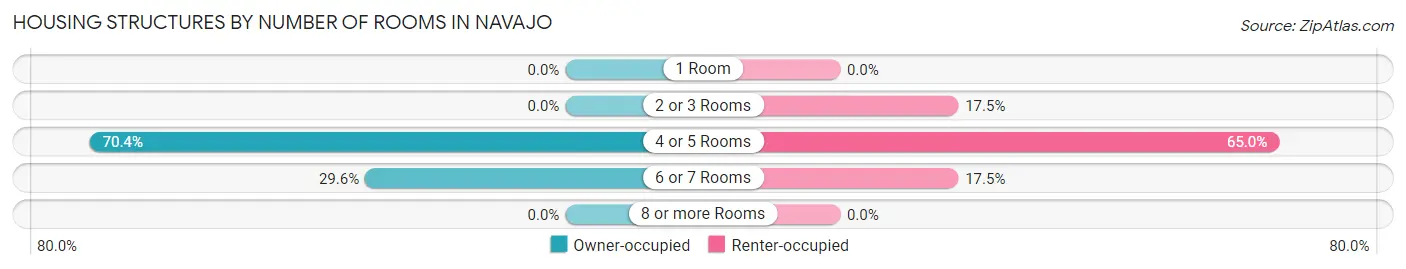
| Number of Rooms | Owner-occupied | Renter-occupied |
| 1 Room | 0 (0.0%) | 0 (0.0%) |
| 2 or 3 Rooms | 0 (0.0%) | 93 (17.5%) |
| 4 or 5 Rooms | 19 (70.4%) | 345 (65.0%) |
| 6 or 7 Rooms | 8 (29.6%) | 93 (17.5%) |
| 8 or more Rooms | 0 (0.0%) | 0 (0.0%) |
| Total | 27 (100.0%) | 531 (100.0%) |
Housing Structure by Heating Type in Navajo
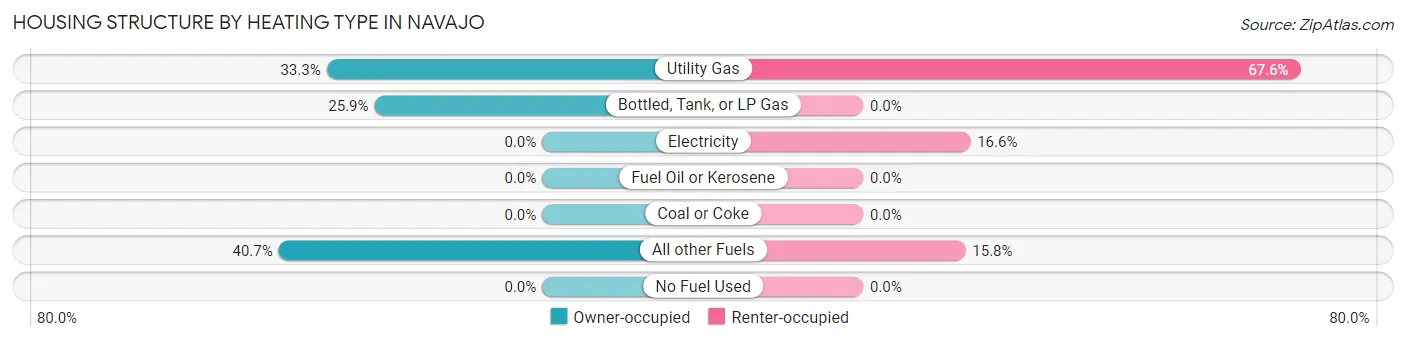
| Heating Type | Owner-occupied | Renter-occupied |
| Utility Gas | 9 (33.3%) | 359 (67.6%) |
| Bottled, Tank, or LP Gas | 7 (25.9%) | 0 (0.0%) |
| Electricity | 0 (0.0%) | 88 (16.6%) |
| Fuel Oil or Kerosene | 0 (0.0%) | 0 (0.0%) |
| Coal or Coke | 0 (0.0%) | 0 (0.0%) |
| All other Fuels | 11 (40.7%) | 84 (15.8%) |
| No Fuel Used | 0 (0.0%) | 0 (0.0%) |
| Total | 27 (100.0%) | 531 (100.0%) |
Household Vehicle Usage in Navajo
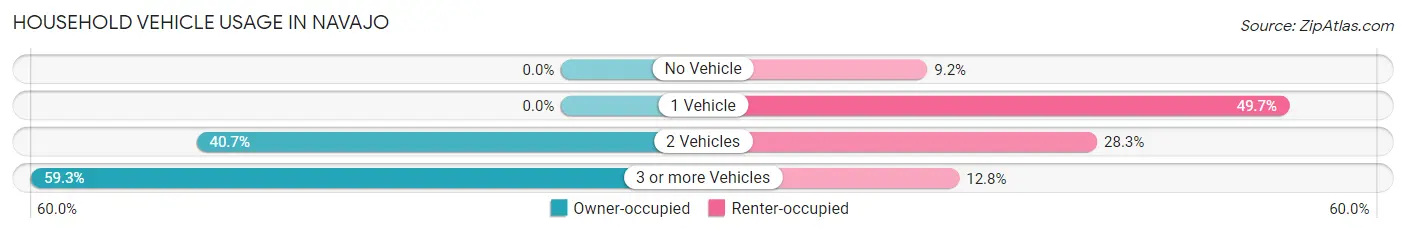
| Vehicles per Household | Owner-occupied | Renter-occupied |
| No Vehicle | 0 (0.0%) | 49 (9.2%) |
| 1 Vehicle | 0 (0.0%) | 264 (49.7%) |
| 2 Vehicles | 11 (40.7%) | 150 (28.2%) |
| 3 or more Vehicles | 16 (59.3%) | 68 (12.8%) |
| Total | 27 (100.0%) | 531 (100.0%) |
Real Estate & Mortgages in Navajo
Real Estate and Mortgage Overview in Navajo
| Characteristic | Without Mortgage | With Mortgage |
| Housing Units | 19 | 8 |
| Median Property Value | $29,600 | $0 |
| Median Household Income | $87,917 | $4 |
| Monthly Housing Costs | $354 | $0 |
| Real Estate Taxes | - | - |
Property Value by Mortgage Status in Navajo
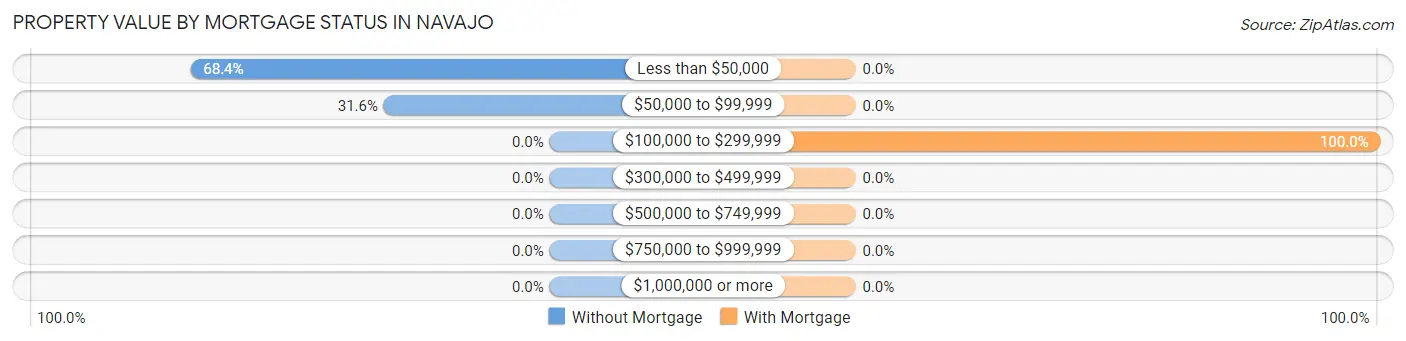
| Property Value | Without Mortgage | With Mortgage |
| Less than $50,000 | 13 (68.4%) | 0 (0.0%) |
| $50,000 to $99,999 | 6 (31.6%) | 0 (0.0%) |
| $100,000 to $299,999 | 0 (0.0%) | 8 (100.0%) |
| $300,000 to $499,999 | 0 (0.0%) | 0 (0.0%) |
| $500,000 to $749,999 | 0 (0.0%) | 0 (0.0%) |
| $750,000 to $999,999 | 0 (0.0%) | 0 (0.0%) |
| $1,000,000 or more | 0 (0.0%) | 0 (0.0%) |
| Total | 19 (100.0%) | 8 (100.0%) |
Household Income by Mortgage Status in Navajo
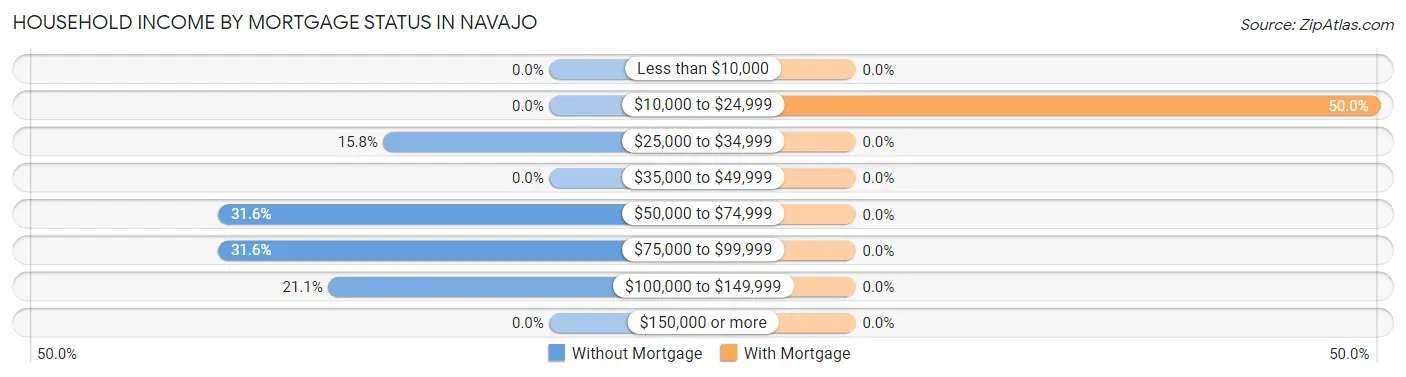
| Household Income | Without Mortgage | With Mortgage |
| Less than $10,000 | 0 (0.0%) | 0 (0.0%) |
| $10,000 to $24,999 | 0 (0.0%) | 4 (50.0%) |
| $25,000 to $34,999 | 3 (15.8%) | 0 (0.0%) |
| $35,000 to $49,999 | 0 (0.0%) | 0 (0.0%) |
| $50,000 to $74,999 | 6 (31.6%) | 0 (0.0%) |
| $75,000 to $99,999 | 6 (31.6%) | 0 (0.0%) |
| $100,000 to $149,999 | 4 (21.0%) | 0 (0.0%) |
| $150,000 or more | 0 (0.0%) | 0 (0.0%) |
| Total | 19 (100.0%) | 8 (100.0%) |
Property Value to Household Income Ratio in Navajo
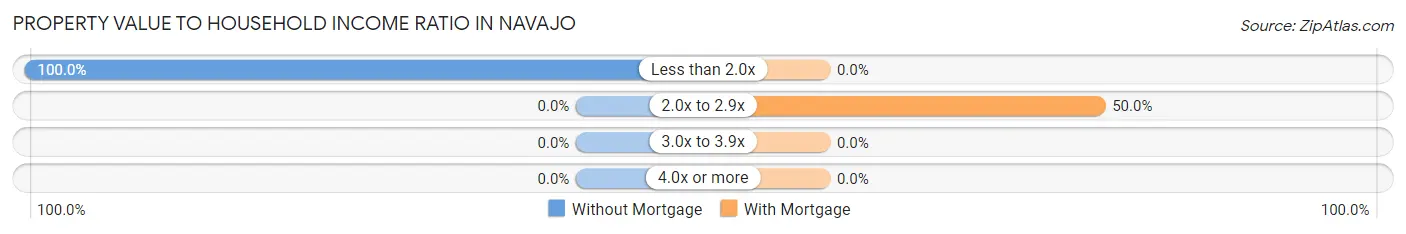
| Value-to-Income Ratio | Without Mortgage | With Mortgage |
| Less than 2.0x | 19 (100.0%) | 0 (0.0%) |
| 2.0x to 2.9x | 0 (0.0%) | 4 (50.0%) |
| 3.0x to 3.9x | 0 (0.0%) | 0 (0.0%) |
| 4.0x or more | 0 (0.0%) | 0 (0.0%) |
| Total | 19 (100.0%) | 8 (100.0%) |
Real Estate Taxes by Mortgage Status in Navajo
| Property Taxes | Without Mortgage | With Mortgage |
| Less than $800 | 0 (0.0%) | 0 (0.0%) |
| $800 to $1,499 | 0 (0.0%) | 0 (0.0%) |
| $800 to $1,499 | 0 (0.0%) | 0 (0.0%) |
| Total | 19 (100.0%) | 8 (100.0%) |
Health & Disability in Navajo
Health Insurance Coverage by Age in Navajo
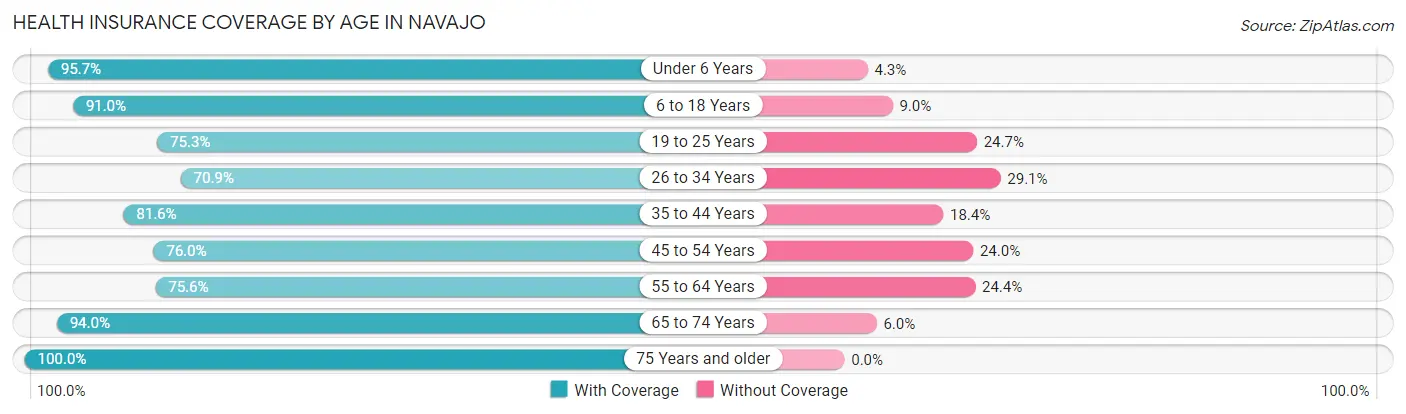
| Age Bracket | With Coverage | Without Coverage |
| Under 6 Years | 221 (95.7%) | 10 (4.3%) |
| 6 to 18 Years | 649 (91.0%) | 64 (9.0%) |
| 19 to 25 Years | 125 (75.3%) | 41 (24.7%) |
| 26 to 34 Years | 212 (70.9%) | 87 (29.1%) |
| 35 to 44 Years | 155 (81.6%) | 35 (18.4%) |
| 45 to 54 Years | 133 (76.0%) | 42 (24.0%) |
| 55 to 64 Years | 121 (75.6%) | 39 (24.4%) |
| 65 to 74 Years | 94 (94.0%) | 6 (6.0%) |
| 75 Years and older | 37 (100.0%) | 0 (0.0%) |
| Total | 1,747 (84.4%) | 324 (15.6%) |
Health Insurance Coverage by Citizenship Status in Navajo
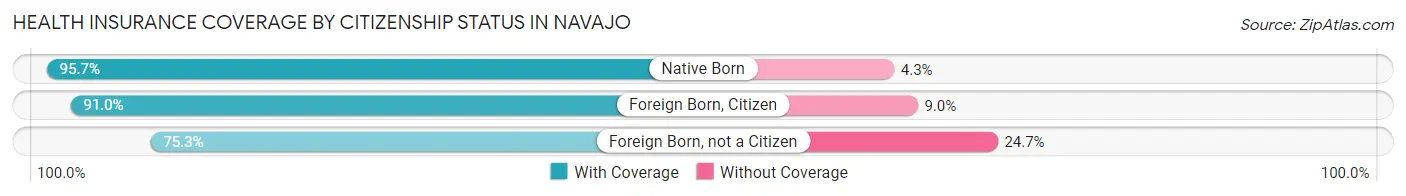
| Citizenship Status | With Coverage | Without Coverage |
| Native Born | 221 (95.7%) | 10 (4.3%) |
| Foreign Born, Citizen | 649 (91.0%) | 64 (9.0%) |
| Foreign Born, not a Citizen | 125 (75.3%) | 41 (24.7%) |
Health Insurance Coverage by Household Income in Navajo
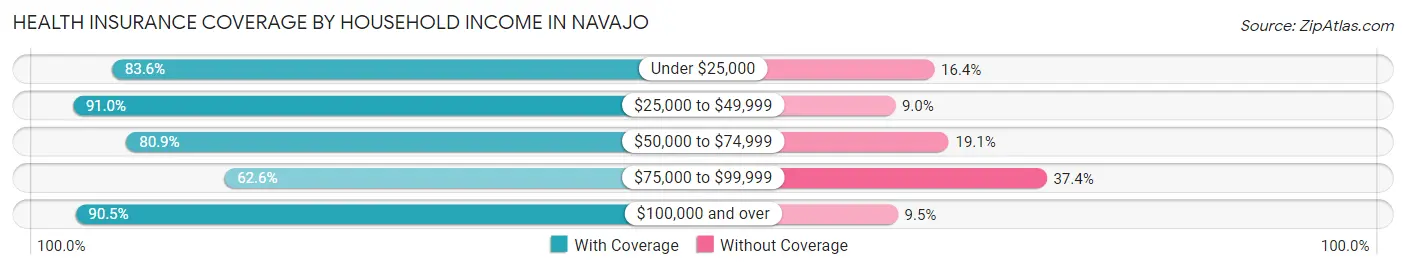
| Household Income | With Coverage | Without Coverage |
| Under $25,000 | 859 (83.6%) | 168 (16.4%) |
| $25,000 to $49,999 | 494 (91.0%) | 49 (9.0%) |
| $50,000 to $74,999 | 174 (80.9%) | 41 (19.1%) |
| $75,000 to $99,999 | 87 (62.6%) | 52 (37.4%) |
| $100,000 and over | 133 (90.5%) | 14 (9.5%) |
Public vs Private Health Insurance Coverage by Age in Navajo
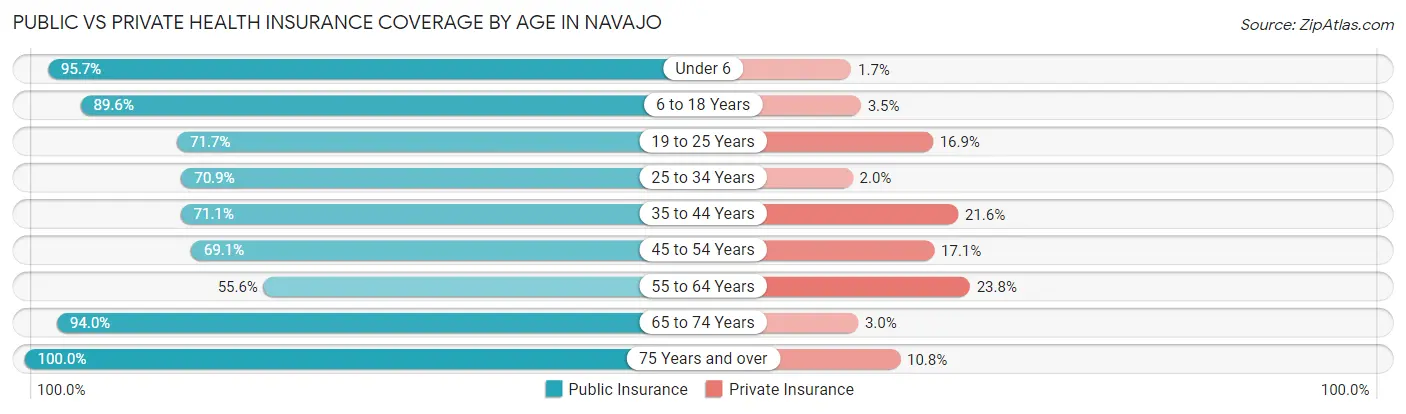
| Age Bracket | Public Insurance | Private Insurance |
| Under 6 | 221 (95.7%) | 4 (1.7%) |
| 6 to 18 Years | 639 (89.6%) | 25 (3.5%) |
| 19 to 25 Years | 119 (71.7%) | 28 (16.9%) |
| 25 to 34 Years | 212 (70.9%) | 6 (2.0%) |
| 35 to 44 Years | 135 (71.1%) | 41 (21.6%) |
| 45 to 54 Years | 121 (69.1%) | 30 (17.1%) |
| 55 to 64 Years | 89 (55.6%) | 38 (23.7%) |
| 65 to 74 Years | 94 (94.0%) | 3 (3.0%) |
| 75 Years and over | 37 (100.0%) | 4 (10.8%) |
| Total | 1,667 (80.5%) | 179 (8.6%) |
Disability Status by Sex by Age in Navajo
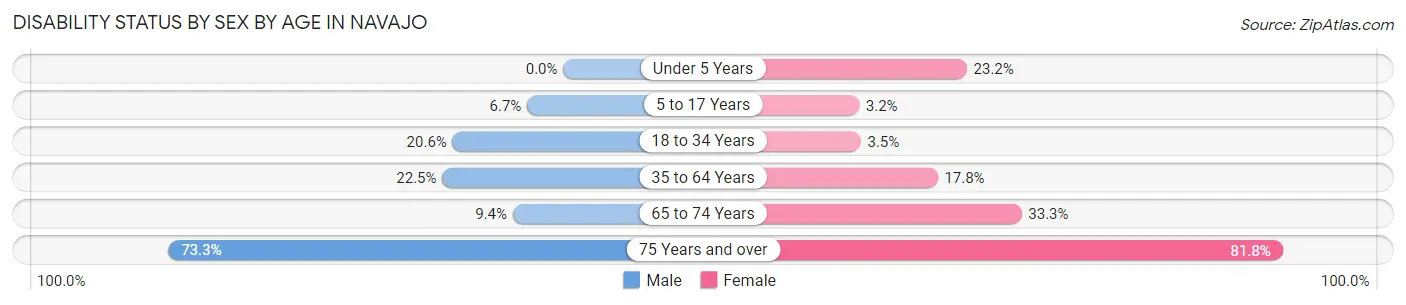
| Age Bracket | Male | Female |
| Under 5 Years | 0 (0.0%) | 19 (23.2%) |
| 5 to 17 Years | 19 (6.7%) | 13 (3.2%) |
| 18 to 34 Years | 45 (20.5%) | 10 (3.5%) |
| 35 to 64 Years | 42 (22.5%) | 60 (17.7%) |
| 65 to 74 Years | 6 (9.4%) | 12 (33.3%) |
| 75 Years and over | 11 (73.3%) | 18 (81.8%) |
Disability Class by Sex by Age in Navajo
Disability Class: Hearing Difficulty
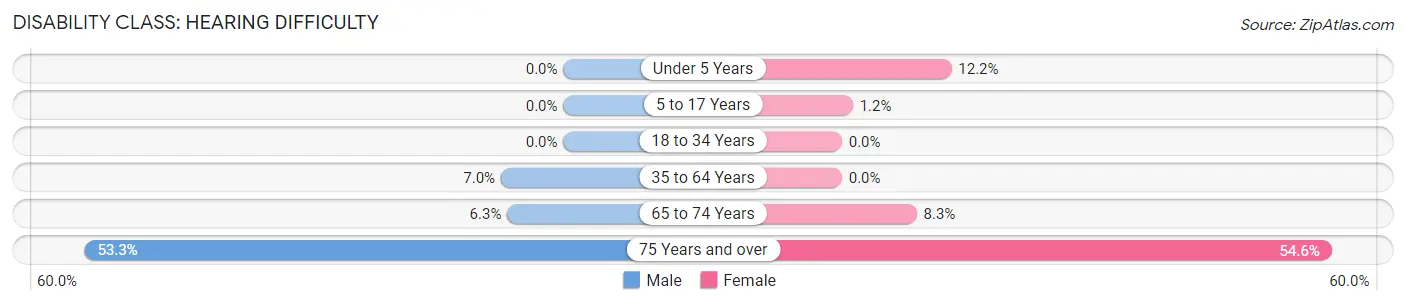
| Age Bracket | Male | Female |
| Under 5 Years | 0 (0.0%) | 10 (12.2%) |
| 5 to 17 Years | 0 (0.0%) | 5 (1.2%) |
| 18 to 34 Years | 0 (0.0%) | 0 (0.0%) |
| 35 to 64 Years | 13 (7.0%) | 0 (0.0%) |
| 65 to 74 Years | 4 (6.2%) | 3 (8.3%) |
| 75 Years and over | 8 (53.3%) | 12 (54.5%) |
Disability Class: Vision Difficulty
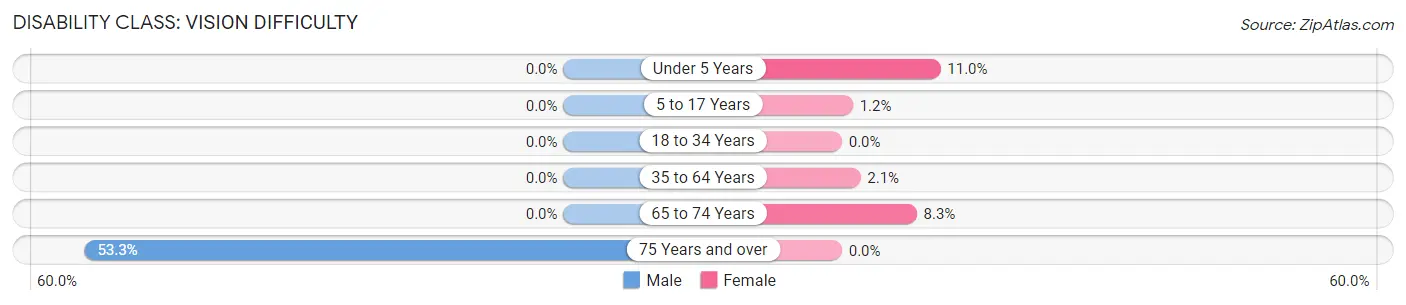
| Age Bracket | Male | Female |
| Under 5 Years | 0 (0.0%) | 9 (11.0%) |
| 5 to 17 Years | 0 (0.0%) | 5 (1.2%) |
| 18 to 34 Years | 0 (0.0%) | 0 (0.0%) |
| 35 to 64 Years | 0 (0.0%) | 7 (2.1%) |
| 65 to 74 Years | 0 (0.0%) | 3 (8.3%) |
| 75 Years and over | 8 (53.3%) | 0 (0.0%) |
Disability Class: Cognitive Difficulty
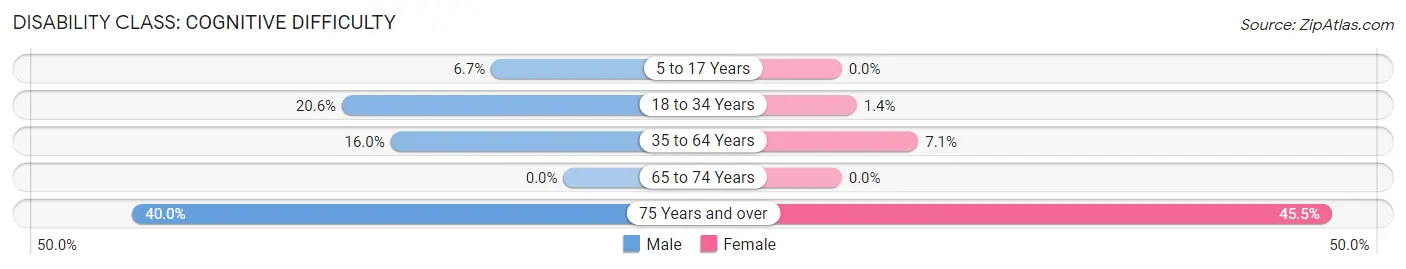
| Age Bracket | Male | Female |
| 5 to 17 Years | 19 (6.7%) | 0 (0.0%) |
| 18 to 34 Years | 45 (20.5%) | 4 (1.4%) |
| 35 to 64 Years | 30 (16.0%) | 24 (7.1%) |
| 65 to 74 Years | 0 (0.0%) | 0 (0.0%) |
| 75 Years and over | 6 (40.0%) | 10 (45.5%) |
Disability Class: Ambulatory Difficulty
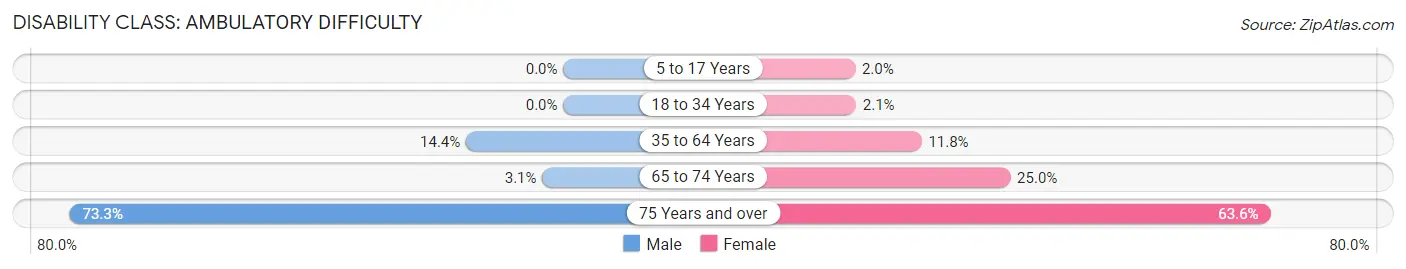
| Age Bracket | Male | Female |
| 5 to 17 Years | 0 (0.0%) | 8 (1.9%) |
| 18 to 34 Years | 0 (0.0%) | 6 (2.1%) |
| 35 to 64 Years | 27 (14.4%) | 40 (11.8%) |
| 65 to 74 Years | 2 (3.1%) | 9 (25.0%) |
| 75 Years and over | 11 (73.3%) | 14 (63.6%) |
Disability Class: Self-Care Difficulty
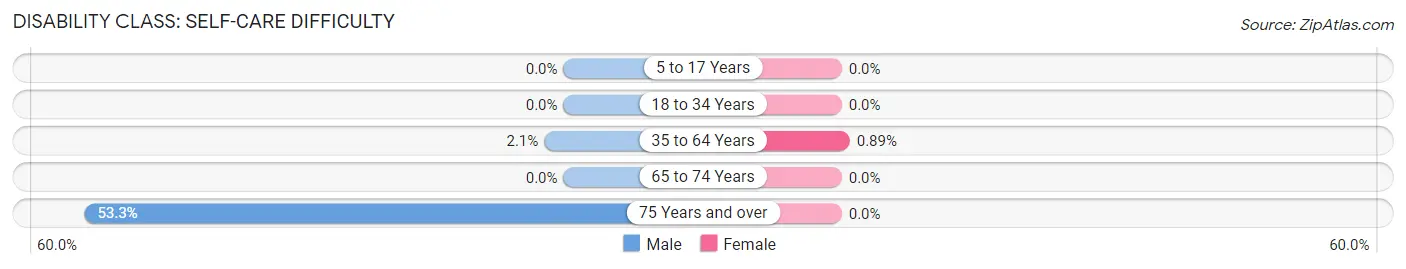
| Age Bracket | Male | Female |
| 5 to 17 Years | 0 (0.0%) | 0 (0.0%) |
| 18 to 34 Years | 0 (0.0%) | 0 (0.0%) |
| 35 to 64 Years | 4 (2.1%) | 3 (0.9%) |
| 65 to 74 Years | 0 (0.0%) | 0 (0.0%) |
| 75 Years and over | 8 (53.3%) | 0 (0.0%) |
Technology Access in Navajo
Computing Device Access in Navajo
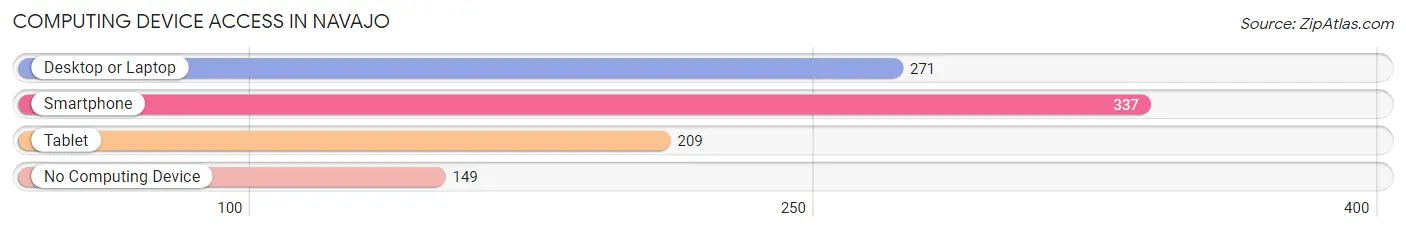
| Device Type | # Households | % Households |
| Desktop or Laptop | 271 | 48.6% |
| Smartphone | 337 | 60.4% |
| Tablet | 209 | 37.5% |
| No Computing Device | 149 | 26.7% |
| Total | 558 | 100.0% |
Internet Access in Navajo
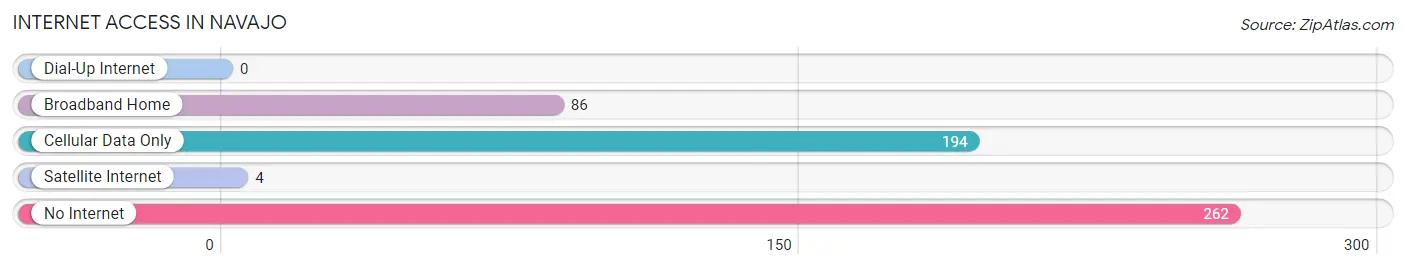
| Internet Type | # Households | % Households |
| Dial-Up Internet | 0 | 0.0% |
| Broadband Home | 86 | 15.4% |
| Cellular Data Only | 194 | 34.8% |
| Satellite Internet | 4 | 0.7% |
| No Internet | 262 | 46.9% |
| Total | 558 | 100.0% |
Navajo Summary
Navajo, New Mexico is a small town located in McKinley County in the northwestern part of the state. It is situated on the Navajo Nation, the largest Native American reservation in the United States. The town is home to a population of approximately 1,500 people, most of whom are Native American. The town is located in a rural area and is surrounded by the Navajo Nation, which covers a total area of 27,425 square miles.
Navajo, New Mexico was established in the late 1800s as a trading post for the Navajo people. The town was named after the Navajo Nation, which is the largest federally recognized tribe in the United States. The town has a rich history and culture, and is home to many traditional Navajo ceremonies and festivals.
Geographically, Navajo, New Mexico is located in the high desert of the Four Corners region. The town is situated at an elevation of 5,000 feet and is surrounded by the Chuska Mountains to the east and the San Juan Mountains to the west. The town is located in a semi-arid climate, with hot summers and cold winters. The average annual temperature is around 60 degrees Fahrenheit.
The economy of Navajo, New Mexico is largely based on tourism and agriculture. The town is home to several tourist attractions, including the Navajo Nation Museum, the Navajo Nation Zoo, and the Navajo Nation Cultural Center. The town also has several agricultural operations, including cattle ranches, sheep farms, and orchards. The town is also home to several businesses, including restaurants, stores, and hotels.
The demographics of Navajo, New Mexico are largely Native American. According to the 2010 census, the population of the town was 1,500, with 97.3% of the population being Native American. The median age of the population was 33.7 years, and the median household income was $25,000. The town is also home to a large number of Navajo people, with over 90% of the population identifying as Navajo.
Navajo, New Mexico is a small town with a rich history and culture. The town is home to many traditional Navajo ceremonies and festivals, and is surrounded by the Navajo Nation. The town has a largely Native American population, and the economy is largely based on tourism and agriculture. The town is a great place to visit and explore, and is a great example of the unique culture and history of the Navajo Nation.
Common Questions
What is Per Capita Income in Navajo?
Per Capita income in Navajo is $10,911.
What is the Median Family Income in Navajo?
Median Family Income in Navajo is $25,938.
What is the Median Household income in Navajo?
Median Household Income in Navajo is $28,160.
What is Income or Wage Gap in Navajo?
Income or Wage Gap in Navajo is 13.3%.
Women in Navajo earn 86.7 cents for every dollar earned by a man.
What is Family Income Deficit in Navajo?
Family Income Deficit in Navajo is $16,655.
Families that are below poverty line in Navajo earn $16,655 less on average than the poverty threshold level.
What is Inequality or Gini Index in Navajo?
Inequality or Gini Index in Navajo is 0.44.
What is the Total Population of Navajo?
Total Population of Navajo is 2,071.
What is the Total Male Population of Navajo?
Total Male Population of Navajo is 895.
What is the Total Female Population of Navajo?
Total Female Population of Navajo is 1,176.
What is the Ratio of Males per 100 Females in Navajo?
There are 76.11 Males per 100 Females in Navajo.
What is the Ratio of Females per 100 Males in Navajo?
There are 131.40 Females per 100 Males in Navajo.
What is the Median Population Age in Navajo?
Median Population Age in Navajo is 22.0 Years.
What is the Average Family Size in Navajo
Average Family Size in Navajo is 3.9 People.
What is the Average Household Size in Navajo
Average Household Size in Navajo is 3.7 People.
How Large is the Labor Force in Navajo?
There are 575 People in the Labor Forcein in Navajo.
What is the Percentage of People in the Labor Force in Navajo?
43.4% of People are in the Labor Force in Navajo.
What is the Unemployment Rate in Navajo?
Unemployment Rate in Navajo is 19.3%.