Hickam Housing, HI Map & Demographics
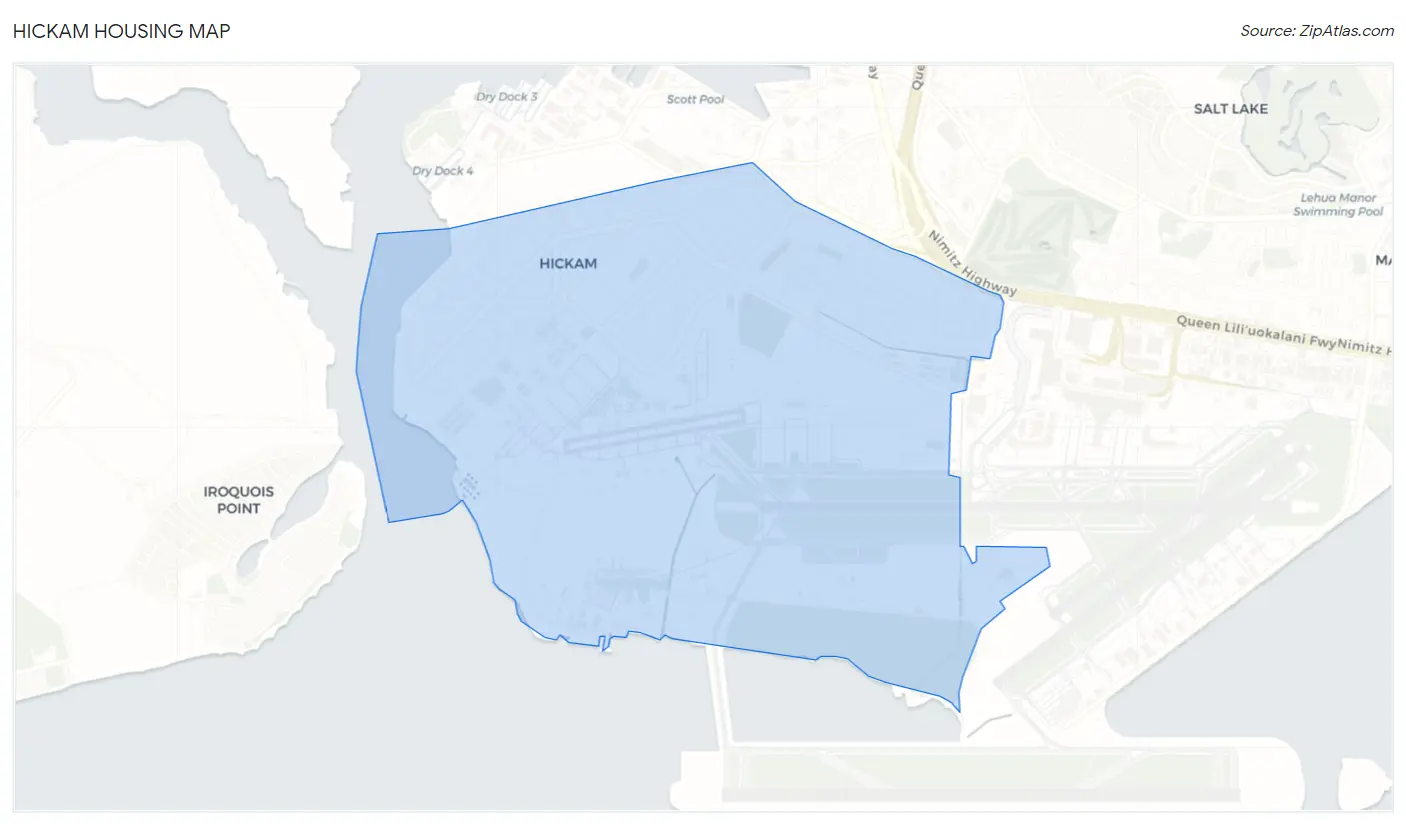
Hickam Housing Map
Hickam Housing Overview
$35,409
PER CAPITA INCOME
$121,513
AVG FAMILY INCOME
$111,139
AVG HOUSEHOLD INCOME
53.7%
WAGE / INCOME GAP [ % ]
46.3¢/ $1
WAGE / INCOME GAP [ $ ]
0.29
INEQUALITY / GINI INDEX
9,502
TOTAL POPULATION
5,137
MALE POPULATION
4,365
FEMALE POPULATION
117.69
MALES / 100 FEMALES
84.97
FEMALES / 100 MALES
26.1
MEDIAN AGE
3.5
AVG FAMILY SIZE
3.2
AVG HOUSEHOLD SIZE
5,094
LABOR FORCE [ PEOPLE ]
80.3%
PERCENT IN LABOR FORCE
9.9%
UNEMPLOYMENT RATE
Income in Hickam Housing
Income Overview in Hickam Housing
Per Capita Income in Hickam Housing is $35,409, while median incomes of families and households are $121,513 and $111,139 respectively.
| Characteristic | Number | Measure |
| Per Capita Income | 9,502 | $35,409 |
| Median Family Income | 2,423 | $121,513 |
| Mean Family Income | 2,423 | $120,445 |
| Median Household Income | 2,839 | $111,139 |
| Mean Household Income | 2,839 | $112,968 |
| Income Deficit | 2,423 | $0 |
| Wage / Income Gap (%) | 9,502 | 53.72% |
| Wage / Income Gap ($) | 9,502 | 46.28¢ per $1 |
| Gini / Inequality Index | 9,502 | 0.29 |
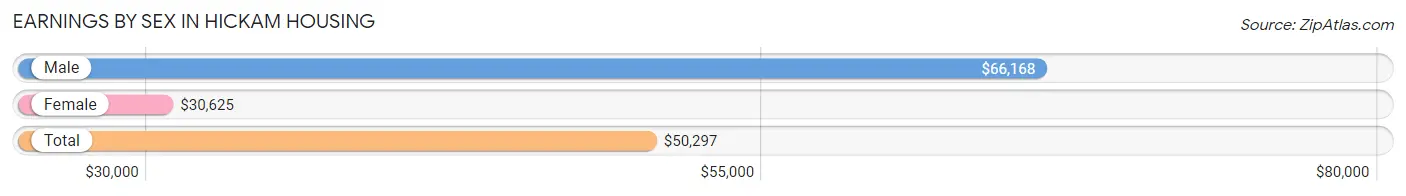
Earnings by Sex in Hickam Housing
Average Earnings in Hickam Housing are $50,297, $66,168 for men and $30,625 for women, a difference of 53.7%.
| Sex | Number | Average Earnings |
| Male | 3,117 (59.5%) | $66,168 |
| Female | 2,123 (40.5%) | $30,625 |
| Total | 5,240 (100.0%) | $50,297 |
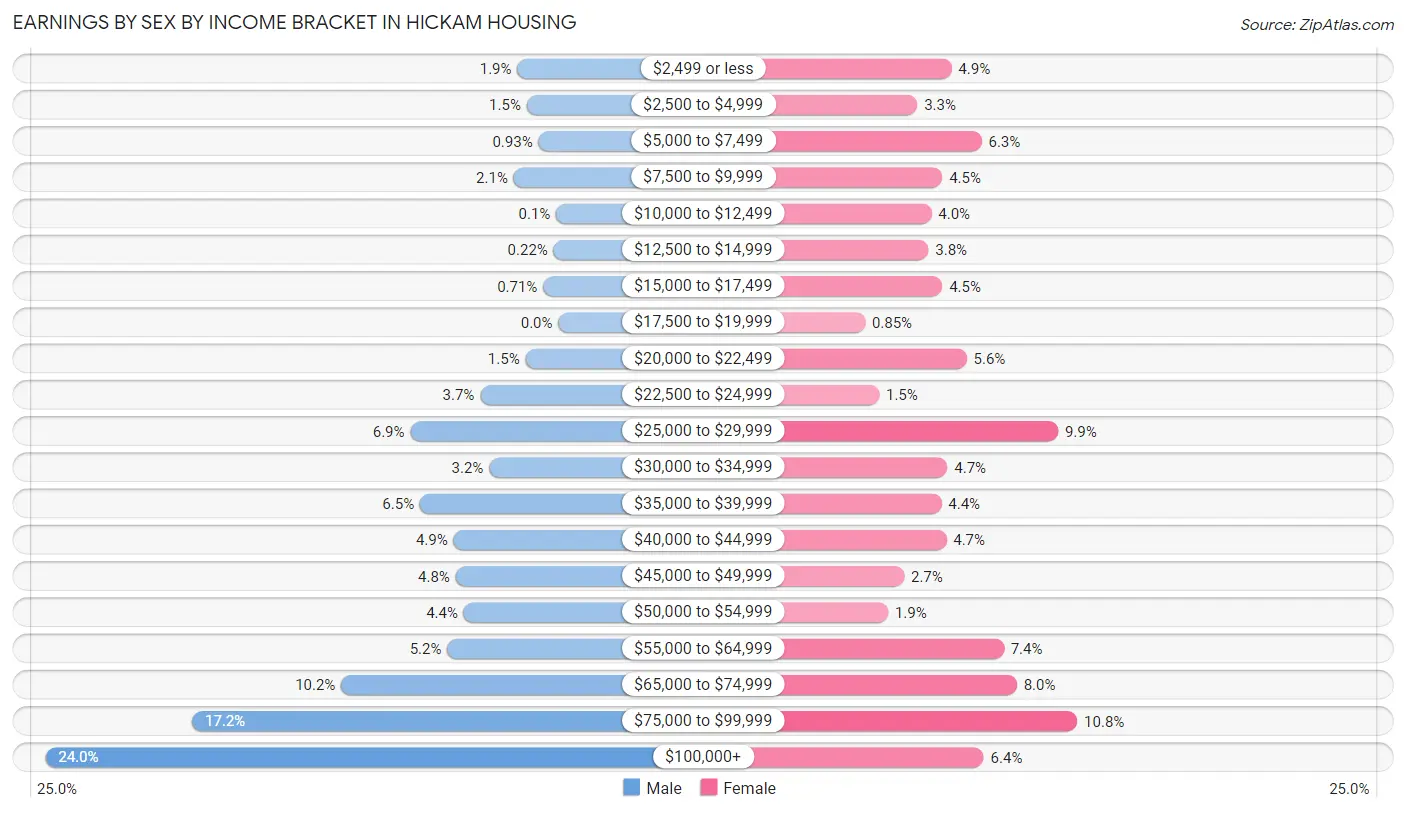
Earnings by Sex by Income Bracket in Hickam Housing
The most common earnings brackets in Hickam Housing are $100,000+ for men (749 | 24.0%) and $75,000 to $99,999 for women (229 | 10.8%).
| Income | Male | Female |
| $2,499 or less | 60 (1.9%) | 104 (4.9%) |
| $2,500 to $4,999 | 46 (1.5%) | 70 (3.3%) |
| $5,000 to $7,499 | 29 (0.9%) | 134 (6.3%) |
| $7,500 to $9,999 | 65 (2.1%) | 95 (4.5%) |
| $10,000 to $12,499 | 3 (0.1%) | 84 (4.0%) |
| $12,500 to $14,999 | 7 (0.2%) | 81 (3.8%) |
| $15,000 to $17,499 | 22 (0.7%) | 95 (4.5%) |
| $17,500 to $19,999 | 0 (0.0%) | 18 (0.9%) |
| $20,000 to $22,499 | 48 (1.5%) | 119 (5.6%) |
| $22,500 to $24,999 | 114 (3.7%) | 32 (1.5%) |
| $25,000 to $29,999 | 216 (6.9%) | 210 (9.9%) |
| $30,000 to $34,999 | 101 (3.2%) | 100 (4.7%) |
| $35,000 to $39,999 | 202 (6.5%) | 94 (4.4%) |
| $40,000 to $44,999 | 153 (4.9%) | 99 (4.7%) |
| $45,000 to $49,999 | 150 (4.8%) | 57 (2.7%) |
| $50,000 to $54,999 | 138 (4.4%) | 41 (1.9%) |
| $55,000 to $64,999 | 162 (5.2%) | 156 (7.3%) |
| $65,000 to $74,999 | 317 (10.2%) | 169 (8.0%) |
| $75,000 to $99,999 | 535 (17.2%) | 229 (10.8%) |
| $100,000+ | 749 (24.0%) | 136 (6.4%) |
| Total | 3,117 (100.0%) | 2,123 (100.0%) |
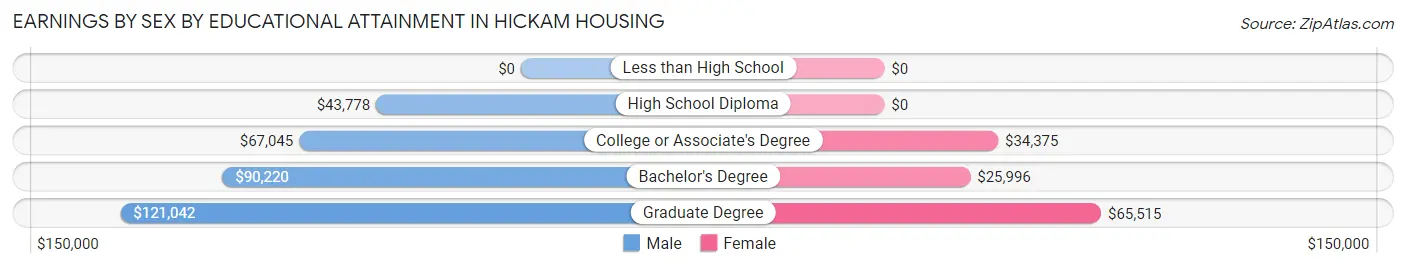
Earnings by Sex by Educational Attainment in Hickam Housing
Average earnings in Hickam Housing are $80,993 for men and $38,297 for women, a difference of 52.7%. Men with an educational attainment of graduate degree enjoy the highest average annual earnings of $121,042, while those with high school diploma education earn the least with $43,778. Women with an educational attainment of graduate degree earn the most with the average annual earnings of $65,515, while those with bachelor's degree education have the smallest earnings of $25,996.
| Educational Attainment | Male Income | Female Income |
| Less than High School | - | - |
| High School Diploma | $43,778 | $0 |
| College or Associate's Degree | $67,045 | $34,375 |
| Bachelor's Degree | $90,220 | $25,996 |
| Graduate Degree | $121,042 | $65,515 |
| Total | $80,993 | $38,297 |
Family Income in Hickam Housing
Family Income Brackets in Hickam Housing
According to the Hickam Housing family income data, there are 860 families falling into the $100,000 to $149,999 income range, which is the most common income bracket and makes up 35.5% of all families.
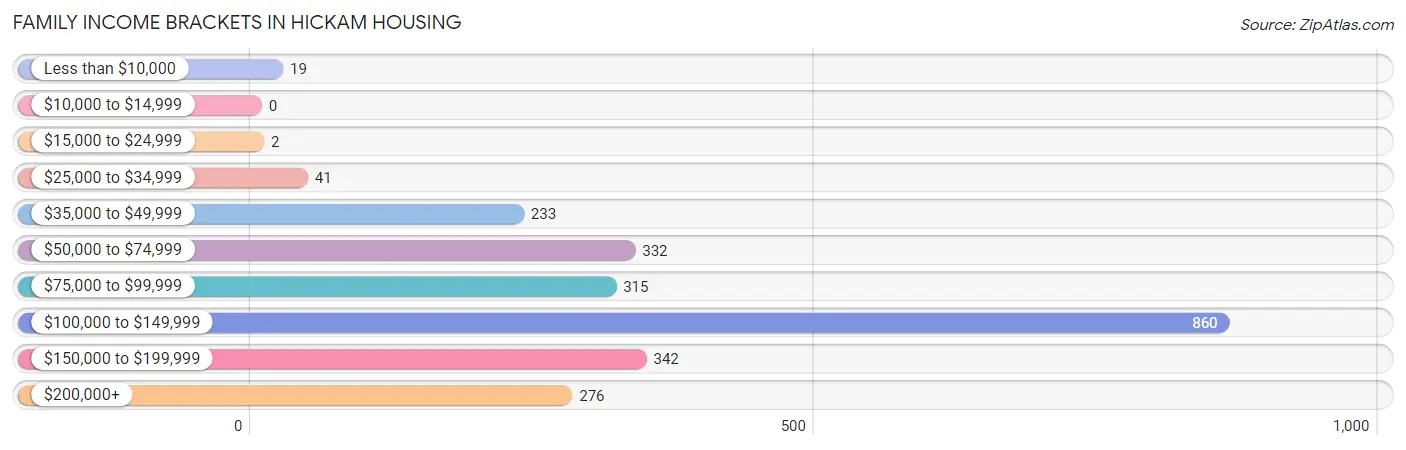
| Income Bracket | # Families | % Families |
| Less than $10,000 | 19 | 0.8% |
| $10,000 to $14,999 | 0 | 0.0% |
| $15,000 to $24,999 | 2 | 0.1% |
| $25,000 to $34,999 | 41 | 1.7% |
| $35,000 to $49,999 | 233 | 9.6% |
| $50,000 to $74,999 | 332 | 13.7% |
| $75,000 to $99,999 | 315 | 13.0% |
| $100,000 to $149,999 | 860 | 35.5% |
| $150,000 to $199,999 | 342 | 14.1% |
| $200,000+ | 276 | 11.4% |
Family Income by Famaliy Size in Hickam Housing
6-person families (77 | 3.2%) account for the highest median family income in Hickam Housing with $152,344 per family, while 2-person families (755 | 31.2%) have the highest median income of $51,696 per family member.
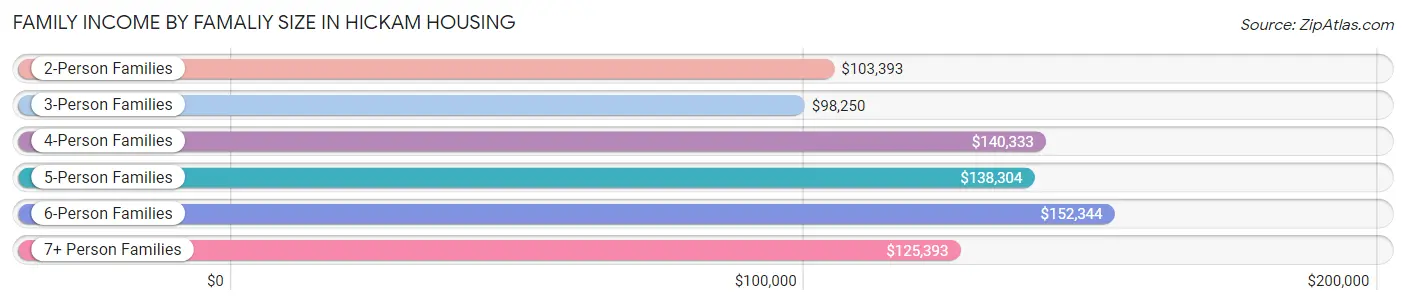
| Income Bracket | # Families | Median Income |
| 2-Person Families | 755 (31.2%) | $103,393 |
| 3-Person Families | 526 (21.7%) | $98,250 |
| 4-Person Families | 784 (32.4%) | $140,333 |
| 5-Person Families | 222 (9.2%) | $138,304 |
| 6-Person Families | 77 (3.2%) | $152,344 |
| 7+ Person Families | 59 (2.4%) | $125,393 |
| Total | 2,423 (100.0%) | $121,513 |
Family Income by Number of Earners in Hickam Housing
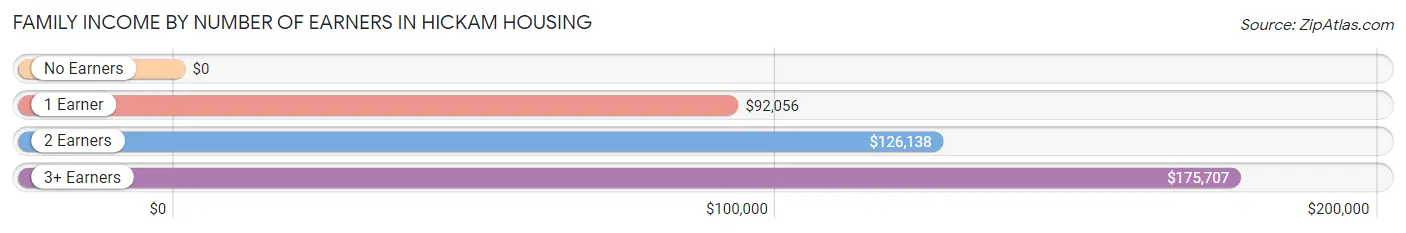
| Number of Earners | # Families | Median Income |
| No Earners | 66 (2.7%) | $0 |
| 1 Earner | 745 (30.7%) | $92,056 |
| 2 Earners | 1,363 (56.2%) | $126,138 |
| 3+ Earners | 249 (10.3%) | $175,707 |
| Total | 2,423 (100.0%) | $121,513 |
Household Income in Hickam Housing
Household Income Brackets in Hickam Housing
With 923 households falling in the category, the $100,000 to $149,999 income range is the most frequent in Hickam Housing, accounting for 32.5% of all households.
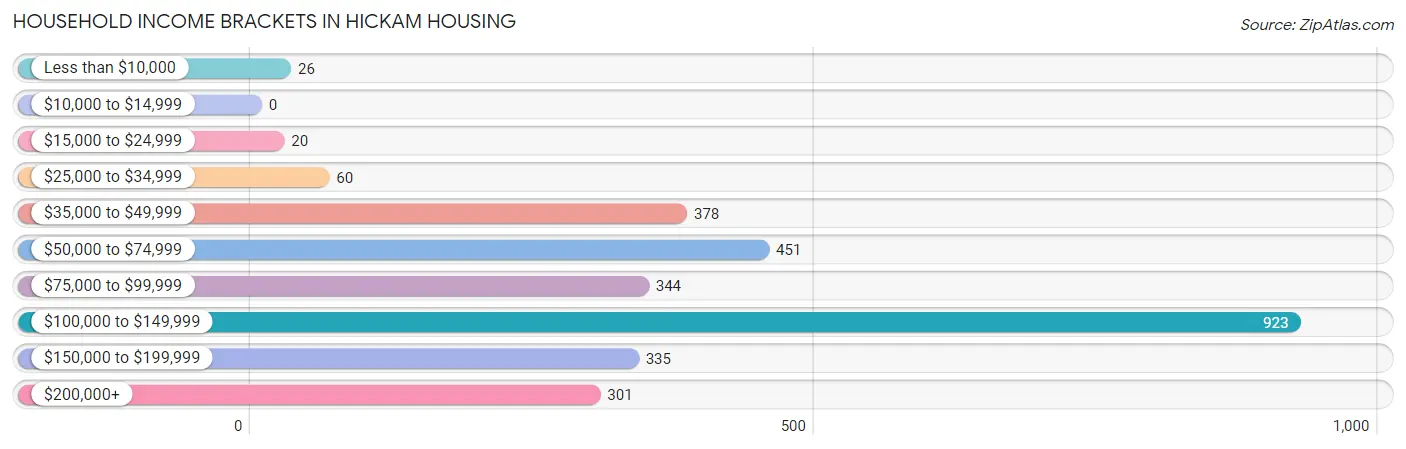
| Income Bracket | # Households | % Households |
| Less than $10,000 | 26 | 0.9% |
| $10,000 to $14,999 | 0 | 0.0% |
| $15,000 to $24,999 | 20 | 0.7% |
| $25,000 to $34,999 | 60 | 2.1% |
| $35,000 to $49,999 | 378 | 13.3% |
| $50,000 to $74,999 | 451 | 15.9% |
| $75,000 to $99,999 | 344 | 12.1% |
| $100,000 to $149,999 | 923 | 32.5% |
| $150,000 to $199,999 | 335 | 11.8% |
| $200,000+ | 301 | 10.6% |
Household Income by Householder Age in Hickam Housing
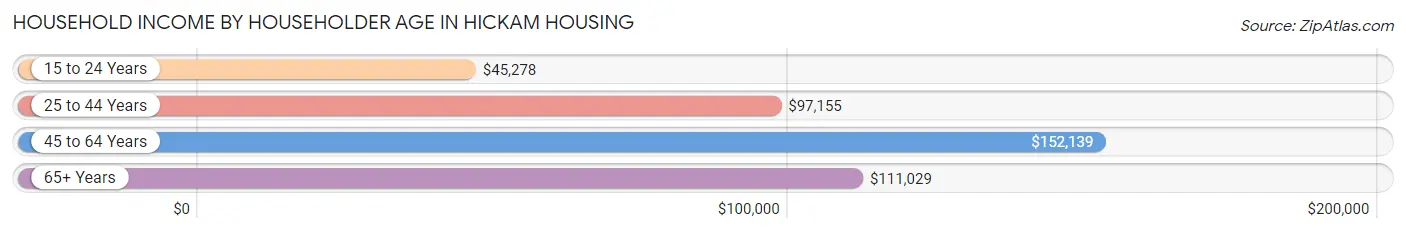
The median household income in Hickam Housing is $111,139, with the highest median household income of $152,139 found in the 45 to 64 years age bracket for the primary householder. A total of 591 households (20.8%) fall into this category. Meanwhile, the 15 to 24 years age bracket for the primary householder has the lowest median household income of $45,278, with 276 households (9.7%) in this group.
| Income Bracket | # Households | Median Income |
| 15 to 24 Years | 276 (9.7%) | $45,278 |
| 25 to 44 Years | 1,920 (67.6%) | $97,155 |
| 45 to 64 Years | 591 (20.8%) | $152,139 |
| 65+ Years | 52 (1.8%) | $111,029 |
| Total | 2,839 (100.0%) | $111,139 |
Poverty in Hickam Housing
Income Below Poverty by Sex and Age in Hickam Housing
With 1.7% poverty level for males and 3.1% for females among the residents of Hickam Housing, 16 and 17 year old males and 16 and 17 year old females are the most vulnerable to poverty, with 8 males (7.5%) and 10 females (15.6%) in their respective age groups living below the poverty level.
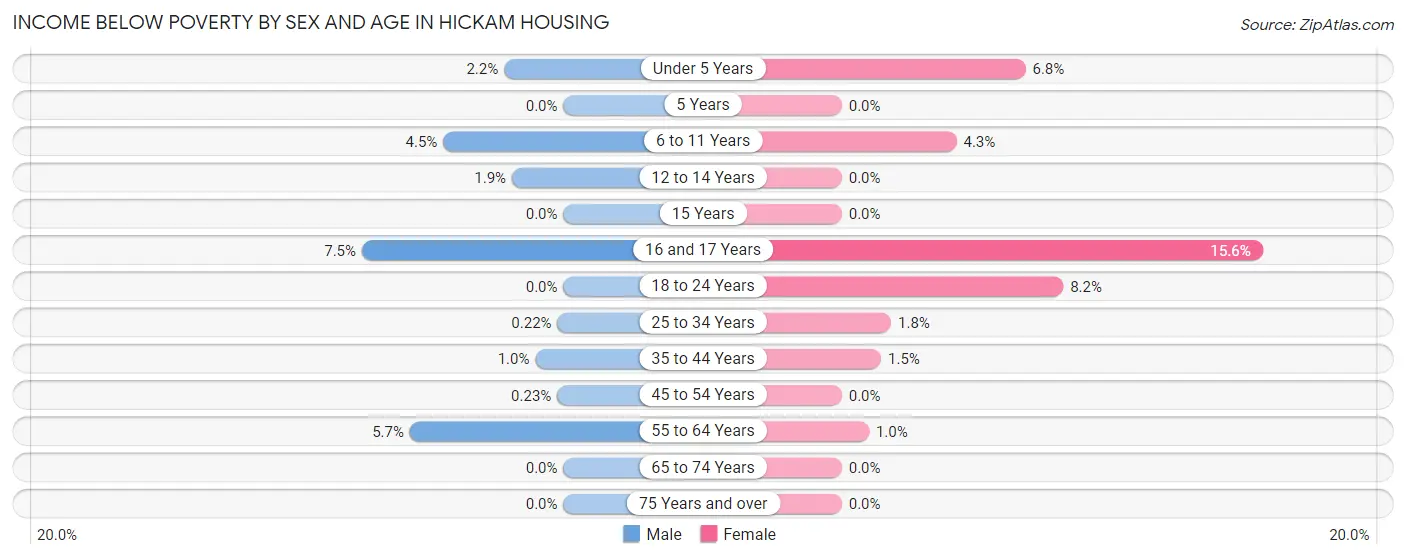
| Age Bracket | Male | Female |
| Under 5 Years | 13 (2.2%) | 32 (6.8%) |
| 5 Years | 0 (0.0%) | 0 (0.0%) |
| 6 to 11 Years | 31 (4.5%) | 29 (4.3%) |
| 12 to 14 Years | 5 (1.9%) | 0 (0.0%) |
| 15 Years | 0 (0.0%) | 0 (0.0%) |
| 16 and 17 Years | 8 (7.5%) | 10 (15.6%) |
| 18 to 24 Years | 0 (0.0%) | 30 (8.2%) |
| 25 to 34 Years | 2 (0.2%) | 14 (1.8%) |
| 35 to 44 Years | 10 (1.0%) | 15 (1.5%) |
| 45 to 54 Years | 1 (0.2%) | 0 (0.0%) |
| 55 to 64 Years | 9 (5.7%) | 2 (1.0%) |
| 65 to 74 Years | 0 (0.0%) | 0 (0.0%) |
| 75 Years and over | 0 (0.0%) | 0 (0.0%) |
| Total | 79 (1.7%) | 132 (3.1%) |
Income Above Poverty by Sex and Age in Hickam Housing
According to the poverty statistics in Hickam Housing, males aged 5 years and females aged 5 years are the age groups that are most secure financially, with 100.0% of males and 100.0% of females in these age groups living above the poverty line.
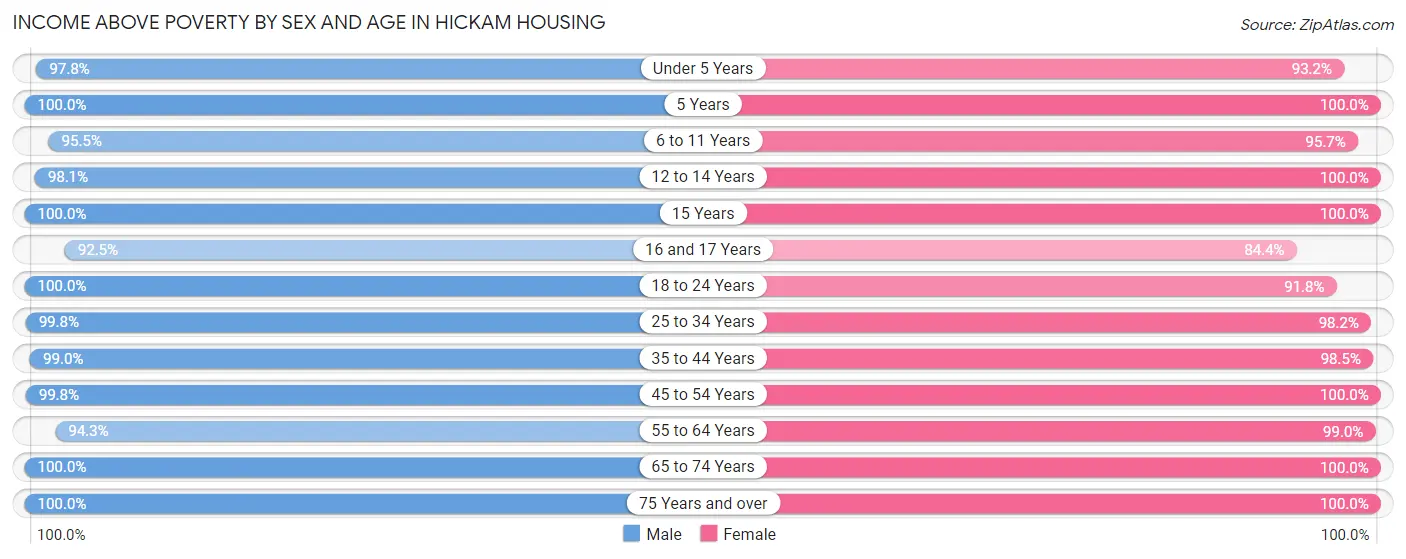
| Age Bracket | Male | Female |
| Under 5 Years | 577 (97.8%) | 437 (93.2%) |
| 5 Years | 81 (100.0%) | 57 (100.0%) |
| 6 to 11 Years | 664 (95.5%) | 651 (95.7%) |
| 12 to 14 Years | 257 (98.1%) | 221 (100.0%) |
| 15 Years | 40 (100.0%) | 63 (100.0%) |
| 16 and 17 Years | 99 (92.5%) | 54 (84.4%) |
| 18 to 24 Years | 481 (100.0%) | 335 (91.8%) |
| 25 to 34 Years | 890 (99.8%) | 750 (98.2%) |
| 35 to 44 Years | 956 (99.0%) | 1,013 (98.5%) |
| 45 to 54 Years | 436 (99.8%) | 255 (100.0%) |
| 55 to 64 Years | 149 (94.3%) | 196 (99.0%) |
| 65 to 74 Years | 39 (100.0%) | 42 (100.0%) |
| 75 Years and over | 13 (100.0%) | 13 (100.0%) |
| Total | 4,682 (98.3%) | 4,087 (96.9%) |
Income Below Poverty Among Married-Couple Families in Hickam Housing
The poverty statistics for married-couple families in Hickam Housing show that 0.5% or 12 of the total 2,304 families live below the poverty line. Families with 5 or more children have the highest poverty rate of 17.0%, comprising of 10 families. On the other hand, families with 1 or 2 children have the lowest poverty rate of 0.0%, which includes 0 families.
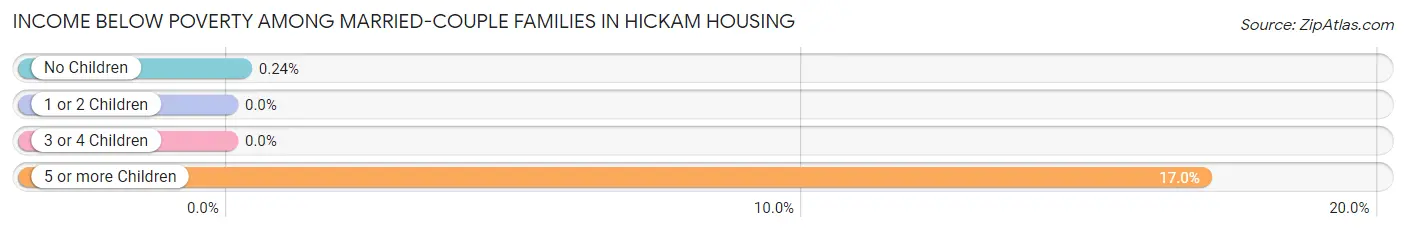
| Children | Above Poverty | Below Poverty |
| No Children | 827 (99.8%) | 2 (0.2%) |
| 1 or 2 Children | 1,219 (100.0%) | 0 (0.0%) |
| 3 or 4 Children | 197 (100.0%) | 0 (0.0%) |
| 5 or more Children | 49 (83.1%) | 10 (17.0%) |
| Total | 2,292 (99.5%) | 12 (0.5%) |
Income Below Poverty Among Single-Parent Households in Hickam Housing
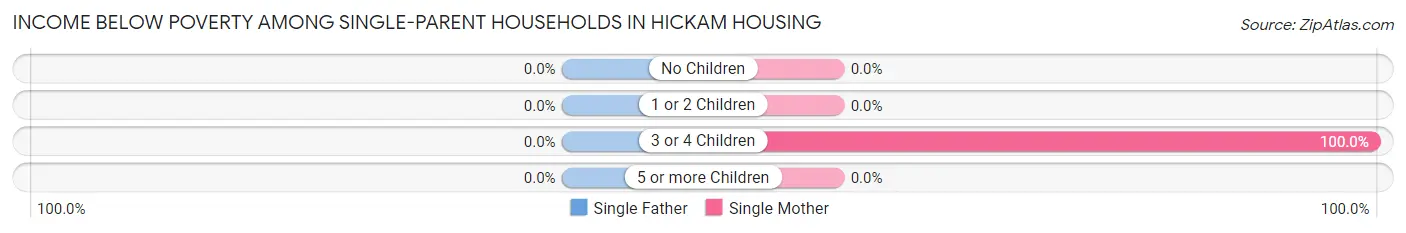
| Children | Single Father | Single Mother |
| No Children | 0 (0.0%) | 0 (0.0%) |
| 1 or 2 Children | 0 (0.0%) | 0 (0.0%) |
| 3 or 4 Children | 0 (0.0%) | 19 (100.0%) |
| 5 or more Children | 0 (0.0%) | 0 (0.0%) |
| Total | 0 (0.0%) | 19 (21.8%) |
Income Below Poverty Among Married-Couple vs Single-Parent Households in Hickam Housing
The poverty data for Hickam Housing shows that 12 of the married-couple family households (0.5%) and 19 of the single-parent households (16.0%) are living below the poverty level. Within the married-couple family households, those with 5 or more children have the highest poverty rate, with 10 households (17.0%) falling below the poverty line. Among the single-parent households, those with 3 or 4 children have the highest poverty rate, with 19 household (51.3%) living below poverty.
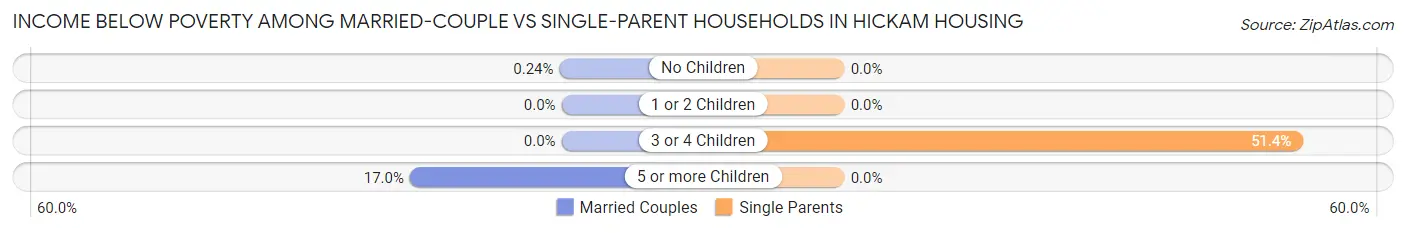
| Children | Married-Couple Families | Single-Parent Households |
| No Children | 2 (0.2%) | 0 (0.0%) |
| 1 or 2 Children | 0 (0.0%) | 0 (0.0%) |
| 3 or 4 Children | 0 (0.0%) | 19 (51.3%) |
| 5 or more Children | 10 (17.0%) | 0 (0.0%) |
| Total | 12 (0.5%) | 19 (16.0%) |
Race in Hickam Housing
The most populous races in Hickam Housing are White / Caucasian (5,932 | 62.4%), Hispanic or Latino (1,399 | 14.7%), and Two or more Races (1,387 | 14.6%).
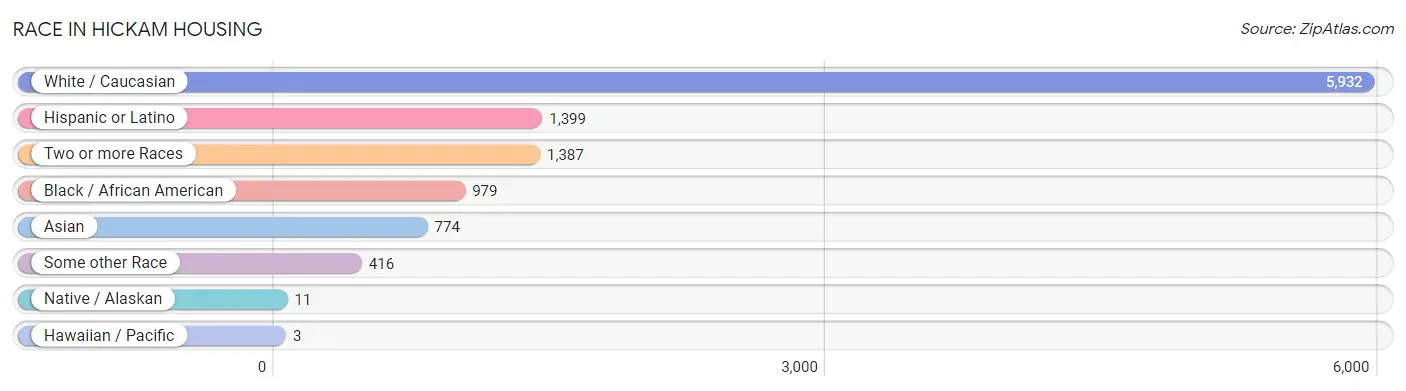
| Race | # Population | % Population |
| Asian | 774 | 8.2% |
| Black / African American | 979 | 10.3% |
| Hawaiian / Pacific | 3 | 0.0% |
| Hispanic or Latino | 1,399 | 14.7% |
| Native / Alaskan | 11 | 0.1% |
| White / Caucasian | 5,932 | 62.4% |
| Two or more Races | 1,387 | 14.6% |
| Some other Race | 416 | 4.4% |
| Total | 9,502 | 100.0% |
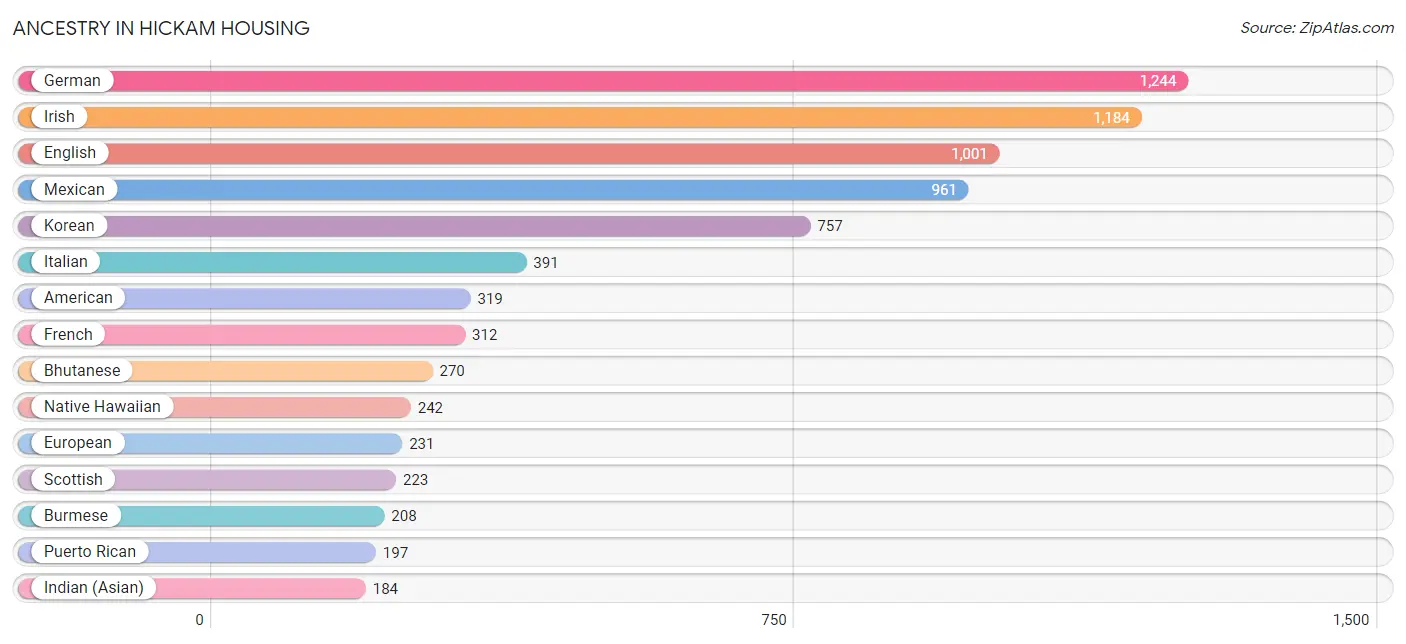
Ancestry in Hickam Housing
The most populous ancestries reported in Hickam Housing are German (1,244 | 13.1%), Irish (1,184 | 12.5%), English (1,001 | 10.5%), Mexican (961 | 10.1%), and Korean (757 | 8.0%), together accounting for 54.2% of all Hickam Housing residents.
| Ancestry | # Population | % Population |
| African | 25 | 0.3% |
| American | 319 | 3.4% |
| Apache | 11 | 0.1% |
| Arab | 19 | 0.2% |
| Belgian | 16 | 0.2% |
| Bhutanese | 270 | 2.8% |
| Blackfeet | 10 | 0.1% |
| Brazilian | 30 | 0.3% |
| British | 93 | 1.0% |
| Burmese | 208 | 2.2% |
| Central American | 39 | 0.4% |
| Cherokee | 17 | 0.2% |
| Chinese | 15 | 0.2% |
| Choctaw | 32 | 0.3% |
| Colombian | 9 | 0.1% |
| Croatian | 12 | 0.1% |
| Cuban | 8 | 0.1% |
| Czech | 68 | 0.7% |
| Czechoslovakian | 18 | 0.2% |
| Danish | 27 | 0.3% |
| Dutch | 33 | 0.4% |
| Ecuadorian | 14 | 0.2% |
| Egyptian | 9 | 0.1% |
| English | 1,001 | 10.5% |
| European | 231 | 2.4% |
| Finnish | 11 | 0.1% |
| French | 312 | 3.3% |
| French Canadian | 34 | 0.4% |
| German | 1,244 | 13.1% |
| Guamanian / Chamorro | 10 | 0.1% |
| Indian (Asian) | 184 | 1.9% |
| Irish | 1,184 | 12.5% |
| Italian | 391 | 4.1% |
| Jamaican | 102 | 1.1% |
| Japanese | 25 | 0.3% |
| Kenyan | 12 | 0.1% |
| Korean | 757 | 8.0% |
| Lithuanian | 2 | 0.0% |
| Malaysian | 4 | 0.0% |
| Marshallese | 33 | 0.4% |
| Mexican | 961 | 10.1% |
| Native Hawaiian | 242 | 2.5% |
| Nigerian | 23 | 0.2% |
| Northern European | 4 | 0.0% |
| Norwegian | 57 | 0.6% |
| Pakistani | 152 | 1.6% |
| Panamanian | 39 | 0.4% |
| Polish | 75 | 0.8% |
| Portuguese | 21 | 0.2% |
| Puerto Rican | 197 | 2.1% |
| Russian | 22 | 0.2% |
| Samoan | 112 | 1.2% |
| Scandinavian | 9 | 0.1% |
| Scotch-Irish | 15 | 0.2% |
| Scottish | 223 | 2.4% |
| Slavic | 14 | 0.2% |
| Slovak | 36 | 0.4% |
| South American | 40 | 0.4% |
| Spaniard | 41 | 0.4% |
| Spanish | 12 | 0.1% |
| Sri Lankan | 132 | 1.4% |
| Subsaharan African | 60 | 0.6% |
| Swedish | 96 | 1.0% |
| Swiss | 4 | 0.0% |
| Thai | 41 | 0.4% |
| Trinidadian and Tobagonian | 48 | 0.5% |
| Turkish | 59 | 0.6% |
| Ukrainian | 32 | 0.3% |
| Venezuelan | 17 | 0.2% |
| Welsh | 10 | 0.1% |
| Yaqui | 43 | 0.4% |
| Yugoslavian | 9 | 0.1% | View All 72 Rows |
Immigrants in Hickam Housing
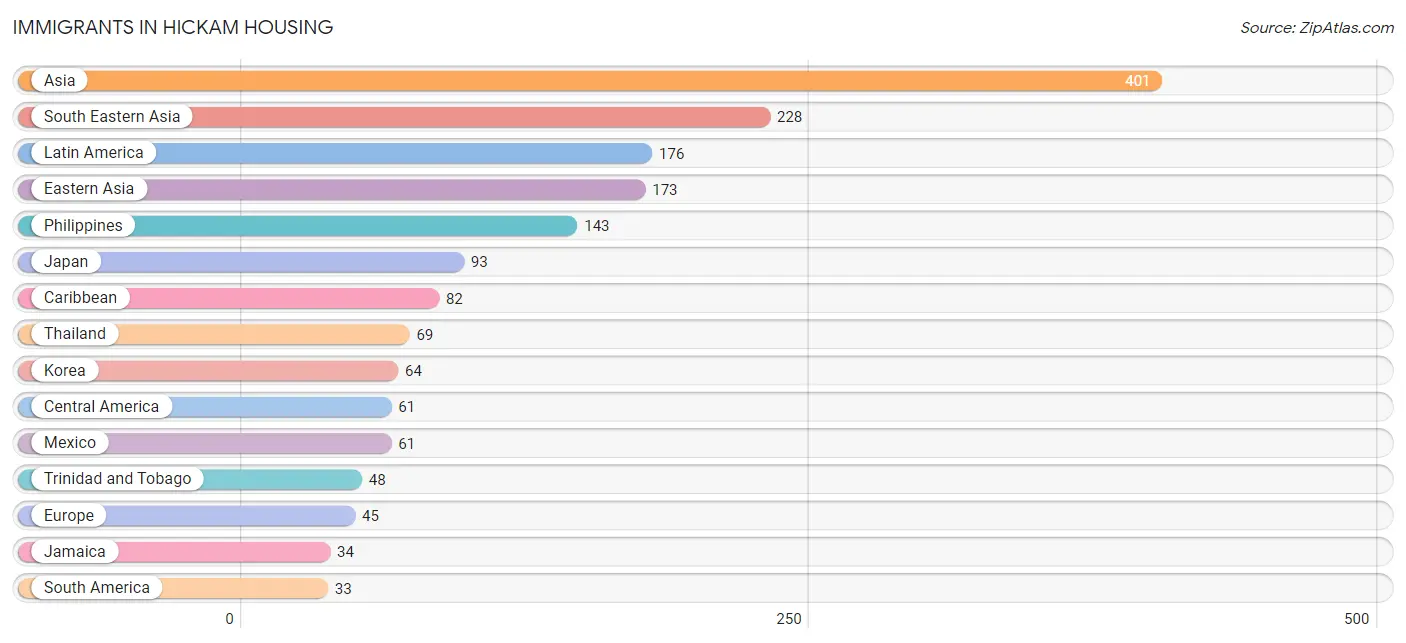
The most numerous immigrant groups reported in Hickam Housing came from Asia (401 | 4.2%), South Eastern Asia (228 | 2.4%), Latin America (176 | 1.8%), Eastern Asia (173 | 1.8%), and Philippines (143 | 1.5%), together accounting for 11.8% of all Hickam Housing residents.
| Immigration Origin | # Population | % Population |
| Africa | 10 | 0.1% |
| Asia | 401 | 4.2% |
| Brazil | 13 | 0.1% |
| Canada | 13 | 0.1% |
| Caribbean | 82 | 0.9% |
| Central America | 61 | 0.6% |
| China | 16 | 0.2% |
| Colombia | 9 | 0.1% |
| Eastern Africa | 10 | 0.1% |
| Eastern Asia | 173 | 1.8% |
| Eastern Europe | 16 | 0.2% |
| Europe | 45 | 0.5% |
| France | 10 | 0.1% |
| Germany | 7 | 0.1% |
| Jamaica | 34 | 0.4% |
| Japan | 93 | 1.0% |
| Kenya | 10 | 0.1% |
| Korea | 64 | 0.7% |
| Latin America | 176 | 1.8% |
| Mexico | 61 | 0.6% |
| Northern Europe | 8 | 0.1% |
| Oceania | 6 | 0.1% |
| Philippines | 143 | 1.5% |
| South America | 33 | 0.4% |
| South Eastern Asia | 228 | 2.4% |
| Switzerland | 4 | 0.0% |
| Thailand | 69 | 0.7% |
| Trinidad and Tobago | 48 | 0.5% |
| Ukraine | 16 | 0.2% |
| Venezuela | 11 | 0.1% |
| Vietnam | 16 | 0.2% |
| Western Europe | 21 | 0.2% | View All 32 Rows |
Sex and Age in Hickam Housing
Sex and Age in Hickam Housing
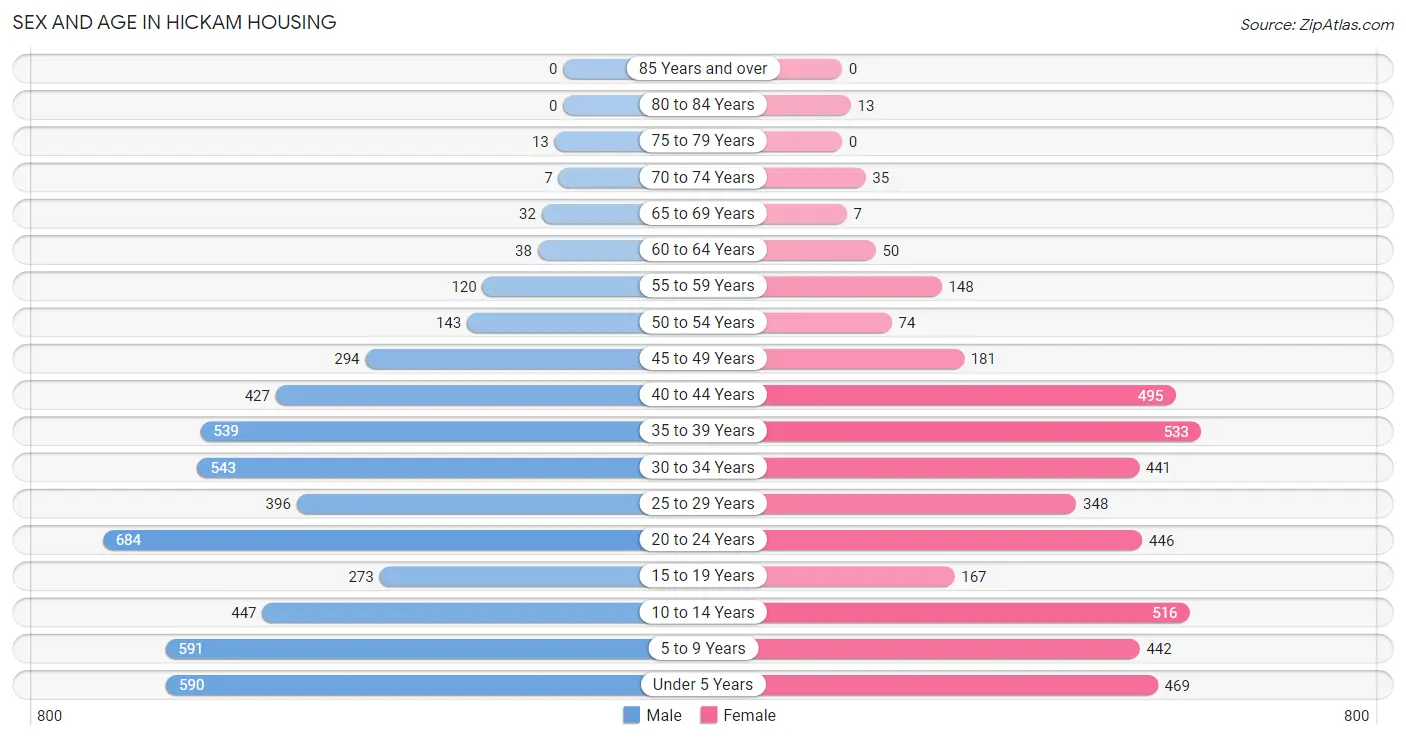
The most populous age groups in Hickam Housing are 20 to 24 Years (684 | 13.3%) for men and 35 to 39 Years (533 | 12.2%) for women.
| Age Bracket | Male | Female |
| Under 5 Years | 590 (11.5%) | 469 (10.7%) |
| 5 to 9 Years | 591 (11.5%) | 442 (10.1%) |
| 10 to 14 Years | 447 (8.7%) | 516 (11.8%) |
| 15 to 19 Years | 273 (5.3%) | 167 (3.8%) |
| 20 to 24 Years | 684 (13.3%) | 446 (10.2%) |
| 25 to 29 Years | 396 (7.7%) | 348 (8.0%) |
| 30 to 34 Years | 543 (10.6%) | 441 (10.1%) |
| 35 to 39 Years | 539 (10.5%) | 533 (12.2%) |
| 40 to 44 Years | 427 (8.3%) | 495 (11.3%) |
| 45 to 49 Years | 294 (5.7%) | 181 (4.2%) |
| 50 to 54 Years | 143 (2.8%) | 74 (1.7%) |
| 55 to 59 Years | 120 (2.3%) | 148 (3.4%) |
| 60 to 64 Years | 38 (0.7%) | 50 (1.1%) |
| 65 to 69 Years | 32 (0.6%) | 7 (0.2%) |
| 70 to 74 Years | 7 (0.1%) | 35 (0.8%) |
| 75 to 79 Years | 13 (0.3%) | 0 (0.0%) |
| 80 to 84 Years | 0 (0.0%) | 13 (0.3%) |
| 85 Years and over | 0 (0.0%) | 0 (0.0%) |
| Total | 5,137 (100.0%) | 4,365 (100.0%) |
Families and Households in Hickam Housing
Median Family Size in Hickam Housing
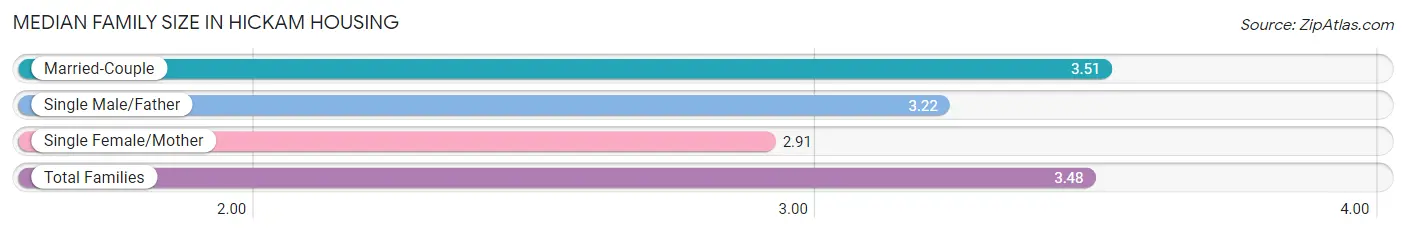
The median family size in Hickam Housing is 3.48 persons per family, with married-couple families (2,304 | 95.1%) accounting for the largest median family size of 3.51 persons per family. On the other hand, single female/mother families (87 | 3.6%) represent the smallest median family size with 2.91 persons per family.
| Family Type | # Families | Family Size |
| Married-Couple | 2,304 (95.1%) | 3.51 |
| Single Male/Father | 32 (1.3%) | 3.22 |
| Single Female/Mother | 87 (3.6%) | 2.91 |
| Total Families | 2,423 (100.0%) | 3.48 |
Median Household Size in Hickam Housing
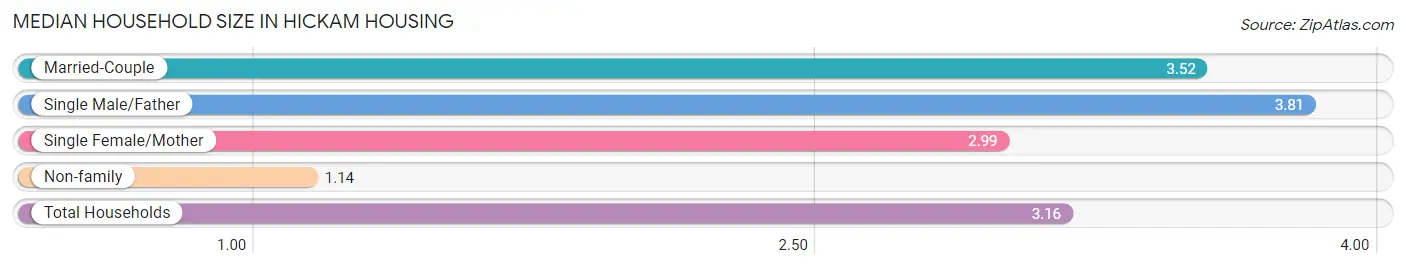
The median household size in Hickam Housing is 3.16 persons per household, with single male/father households (32 | 1.1%) accounting for the largest median household size of 3.81 persons per household. non-family households (416 | 14.6%) represent the smallest median household size with 1.14 persons per household.
| Household Type | # Households | Household Size |
| Married-Couple | 2,304 (81.2%) | 3.52 |
| Single Male/Father | 32 (1.1%) | 3.81 |
| Single Female/Mother | 87 (3.1%) | 2.99 |
| Non-family | 416 (14.6%) | 1.14 |
| Total Households | 2,839 (100.0%) | 3.16 |
Household Size by Marriage Status in Hickam Housing
Out of a total of 2,839 households in Hickam Housing, 2,423 (85.4%) are family households, while 416 (14.6%) are nonfamily households. The most numerous type of family households are 4-person households, comprising 766, and the most common type of nonfamily households are 1-person households, comprising 353.
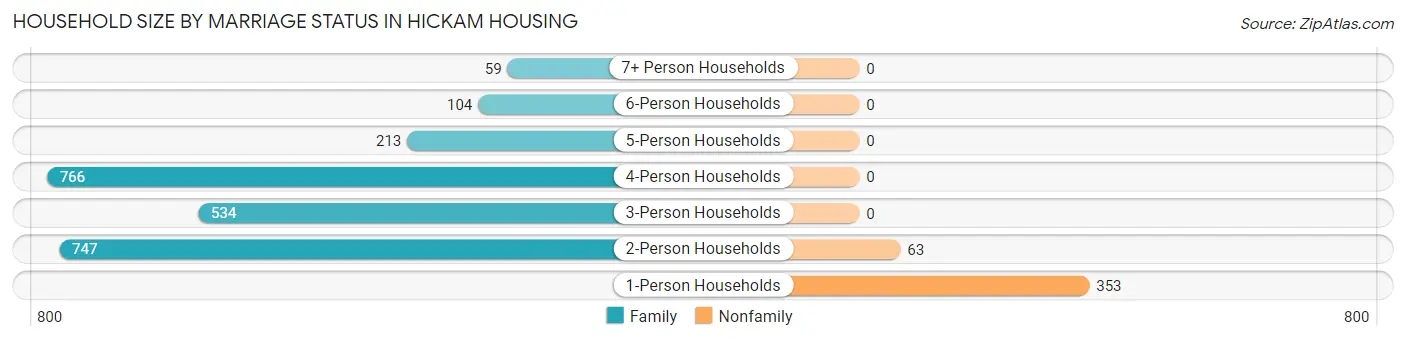
| Household Size | Family Households | Nonfamily Households |
| 1-Person Households | - | 353 (12.4%) |
| 2-Person Households | 747 (26.3%) | 63 (2.2%) |
| 3-Person Households | 534 (18.8%) | 0 (0.0%) |
| 4-Person Households | 766 (27.0%) | 0 (0.0%) |
| 5-Person Households | 213 (7.5%) | 0 (0.0%) |
| 6-Person Households | 104 (3.7%) | 0 (0.0%) |
| 7+ Person Households | 59 (2.1%) | 0 (0.0%) |
| Total | 2,423 (85.4%) | 416 (14.6%) |
Female Fertility in Hickam Housing
Fertility by Age in Hickam Housing
Average fertility rate in Hickam Housing is 50.0 births per 1,000 women. Women in the age bracket of 20 to 34 years have the highest fertility rate with 62.0 births per 1,000 women. Women in the age bracket of 20 to 34 years acount for 59.2% of all women with births.
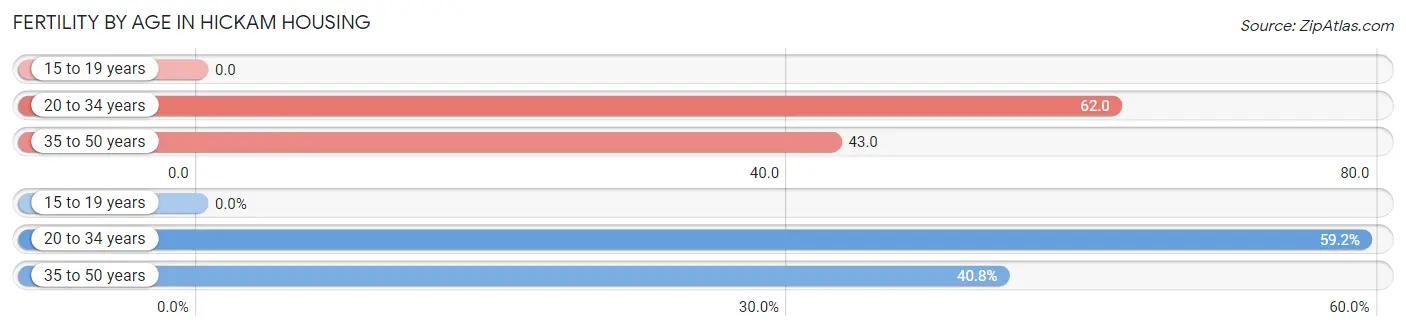
| Age Bracket | Women with Births | Births / 1,000 Women |
| 15 to 19 years | 0 (0.0%) | 0.0 |
| 20 to 34 years | 77 (59.2%) | 62.0 |
| 35 to 50 years | 53 (40.8%) | 43.0 |
| Total | 130 (100.0%) | 50.0 |
Fertility by Age by Marriage Status in Hickam Housing
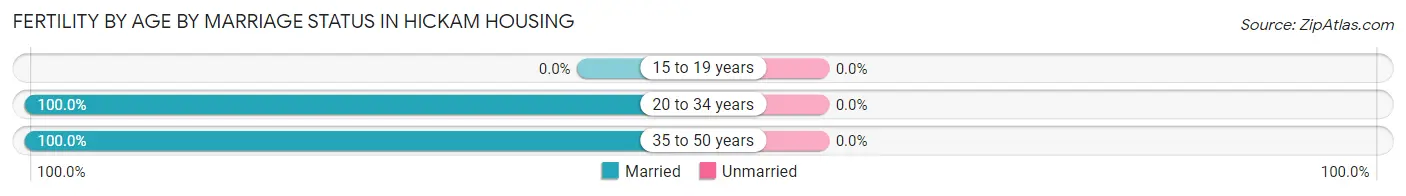
| Age Bracket | Married | Unmarried |
| 15 to 19 years | 0 (0.0%) | 0 (0.0%) |
| 20 to 34 years | 77 (100.0%) | 0 (0.0%) |
| 35 to 50 years | 53 (100.0%) | 0 (0.0%) |
| Total | 130 (100.0%) | 0 (0.0%) |
Fertility by Education in Hickam Housing
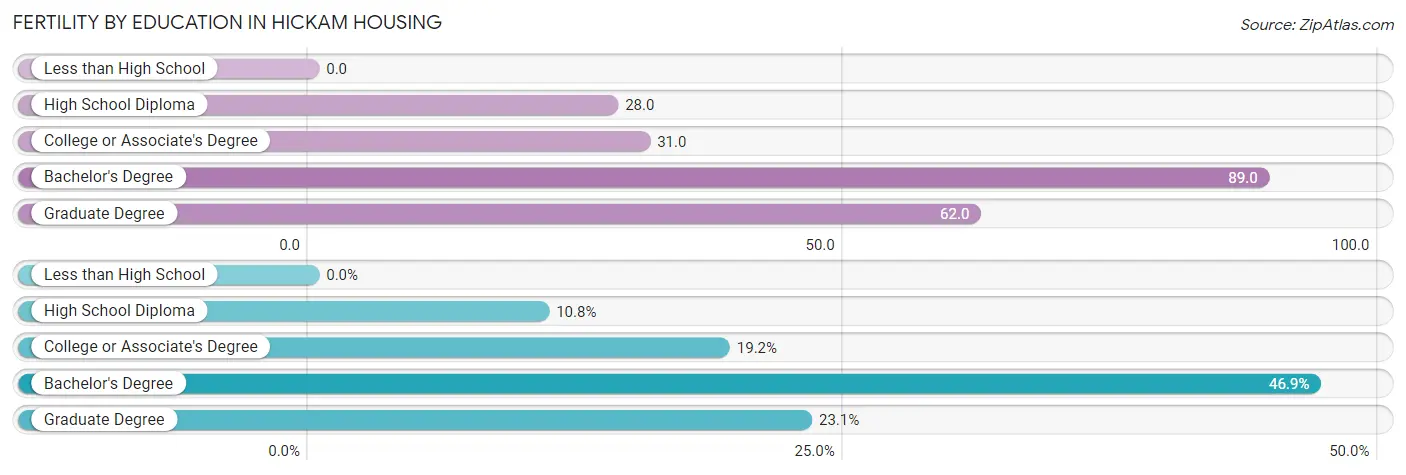
| Educational Attainment | Women with Births | Births / 1,000 Women |
| Less than High School | 0 (0.0%) | 0.0 |
| High School Diploma | 14 (10.8%) | 28.0 |
| College or Associate's Degree | 25 (19.2%) | 31.0 |
| Bachelor's Degree | 61 (46.9%) | 89.0 |
| Graduate Degree | 30 (23.1%) | 62.0 |
| Total | 130 (100.0%) | 50.0 |
Fertility by Education by Marriage Status in Hickam Housing
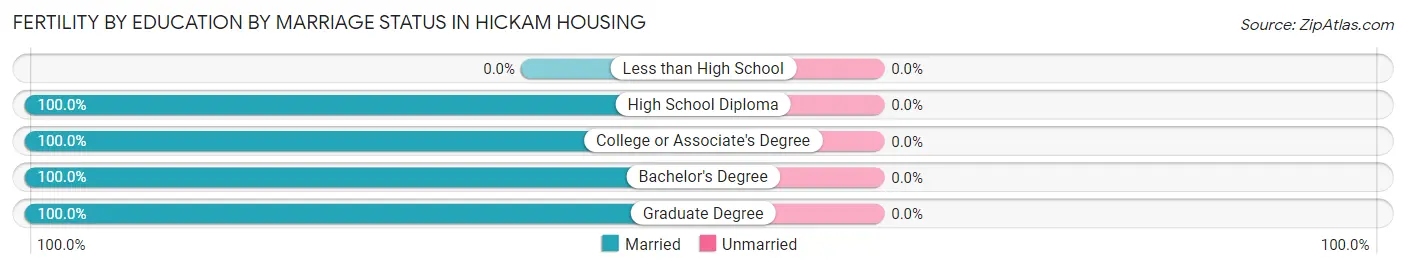
| Educational Attainment | Married | Unmarried |
| Less than High School | 0 (0.0%) | 0 (0.0%) |
| High School Diploma | 14 (100.0%) | 0 (0.0%) |
| College or Associate's Degree | 25 (100.0%) | 0 (0.0%) |
| Bachelor's Degree | 61 (100.0%) | 0 (0.0%) |
| Graduate Degree | 30 (100.0%) | 0 (0.0%) |
| Total | 130 (100.0%) | 0 (0.0%) |
Employment Characteristics in Hickam Housing
Employment by Class of Employer in Hickam Housing
Among the 4,822 employed individuals in Hickam Housing, federal government employees (3,376 | 70.0%), private company employees (1,102 | 22.9%), and not-for-profit organizations (96 | 2.0%) make up the most common classes of employment.
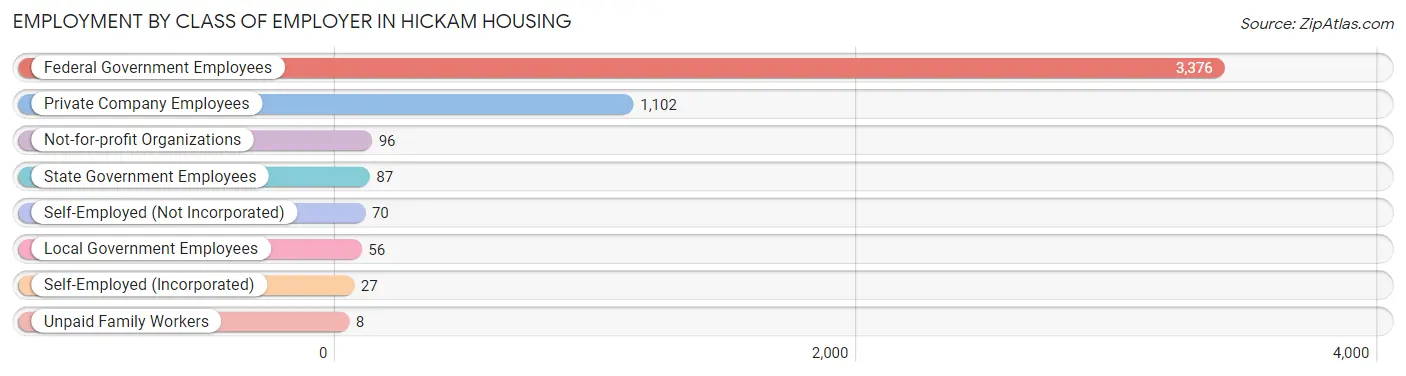
| Employer Class | # Employees | % Employees |
| Private Company Employees | 1,102 | 22.9% |
| Self-Employed (Incorporated) | 27 | 0.6% |
| Self-Employed (Not Incorporated) | 70 | 1.5% |
| Not-for-profit Organizations | 96 | 2.0% |
| Local Government Employees | 56 | 1.2% |
| State Government Employees | 87 | 1.8% |
| Federal Government Employees | 3,376 | 70.0% |
| Unpaid Family Workers | 8 | 0.2% |
| Total | 4,822 | 100.0% |
Employment Status by Age in Hickam Housing
According to the labor force statistics for Hickam Housing, out of the total population over 16 years of age (6,344), 80.3% or 5,094 individuals are in the labor force, with 9.9% or 504 of them unemployed. The age group with the highest labor force participation rate is 20 to 24 years, with 94.7% or 1,070 individuals in the labor force. Within the labor force, the 20 to 24 years age range has the highest percentage of unemployed individuals, with 29.3% or 314 of them being unemployed.
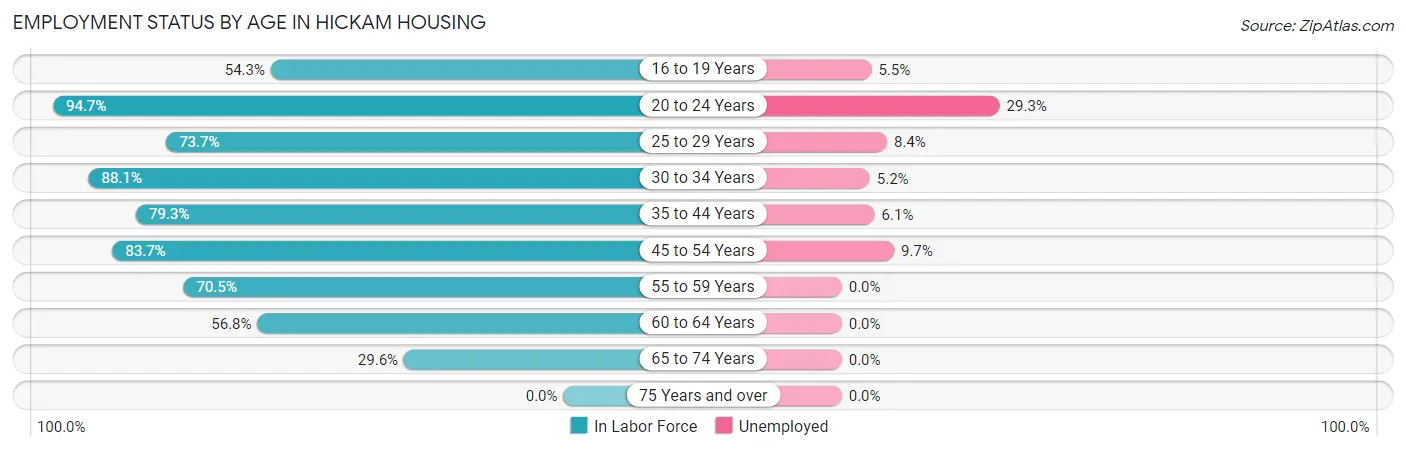
| Age Bracket | In Labor Force | Unemployed |
| 16 to 19 Years | 183 (54.3%) | 10 (5.5%) |
| 20 to 24 Years | 1,070 (94.7%) | 314 (29.3%) |
| 25 to 29 Years | 548 (73.7%) | 46 (8.4%) |
| 30 to 34 Years | 867 (88.1%) | 45 (5.2%) |
| 35 to 44 Years | 1,581 (79.3%) | 96 (6.1%) |
| 45 to 54 Years | 579 (83.7%) | 56 (9.7%) |
| 55 to 59 Years | 189 (70.5%) | 0 (0.0%) |
| 60 to 64 Years | 50 (56.8%) | 0 (0.0%) |
| 65 to 74 Years | 24 (29.6%) | 0 (0.0%) |
| 75 Years and over | 0 (0.0%) | 0 (0.0%) |
| Total | 5,094 (80.3%) | 504 (9.9%) |
Employment Status by Educational Attainment in Hickam Housing
According to labor force statistics for Hickam Housing, 80.0% of individuals (3,816) out of the total population between 25 and 64 years of age (4,770) are in the labor force, with 6.1% or 233 of them being unemployed. The group with the highest labor force participation rate are those with the educational attainment of bachelor's degree or higher, with 82.3% or 1,986 individuals in the labor force. Within the labor force, individuals with high school diploma education have the highest percentage of unemployment, with 8.9% or 34 of them being unemployed.
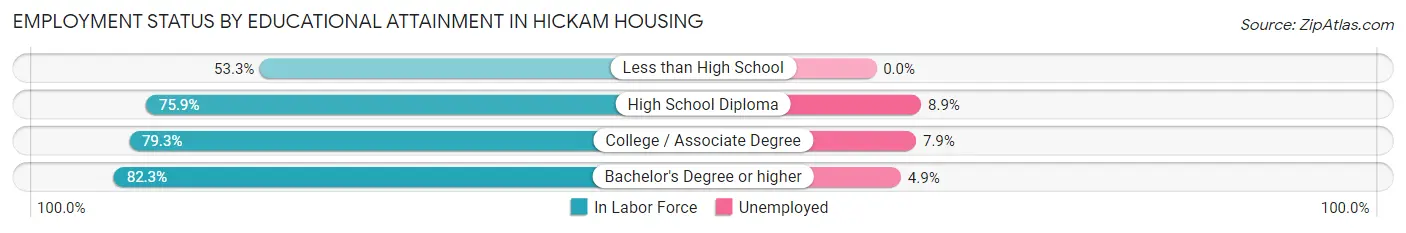
| Educational Attainment | In Labor Force | Unemployed |
| Less than High School | 49 (53.3%) | 0 (0.0%) |
| High School Diploma | 385 (75.9%) | 45 (8.9%) |
| College / Associate Degree | 1,394 (79.3%) | 139 (7.9%) |
| Bachelor's Degree or higher | 1,986 (82.3%) | 118 (4.9%) |
| Total | 3,816 (80.0%) | 291 (6.1%) |
Employment Occupations by Sex in Hickam Housing
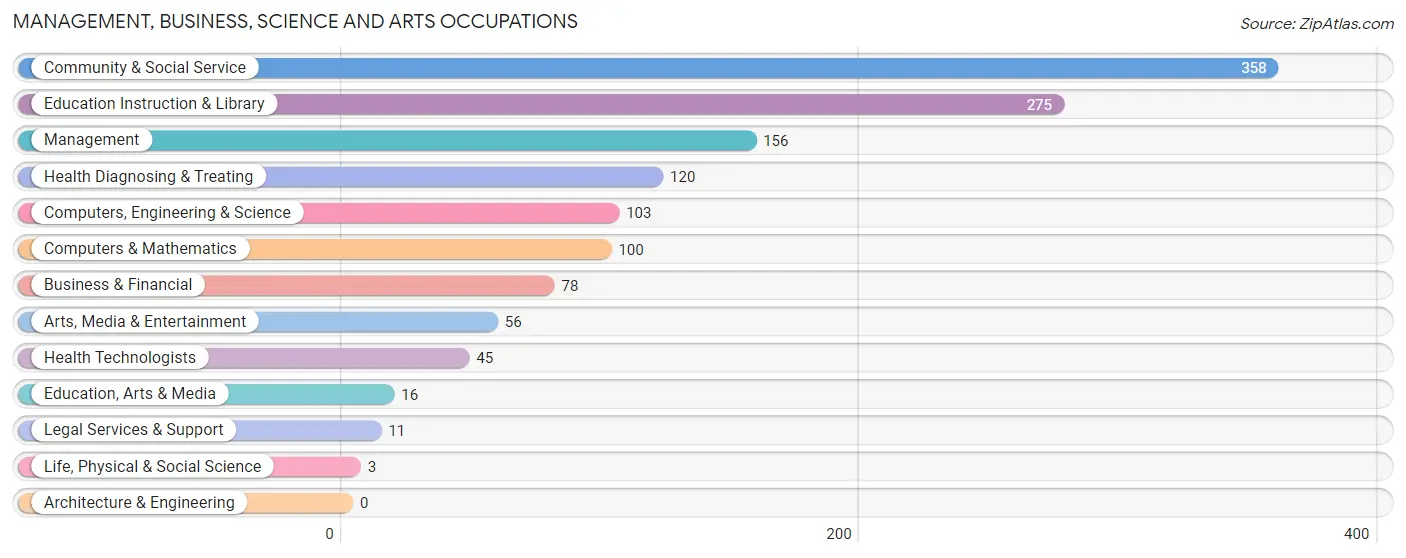
Management, Business, Science and Arts Occupations
The most common Management, Business, Science and Arts occupations in Hickam Housing are Community & Social Service (358 | 17.4%), Education Instruction & Library (275 | 13.3%), Management (156 | 7.6%), Health Diagnosing & Treating (120 | 5.8%), and Computers, Engineering & Science (103 | 5.0%).
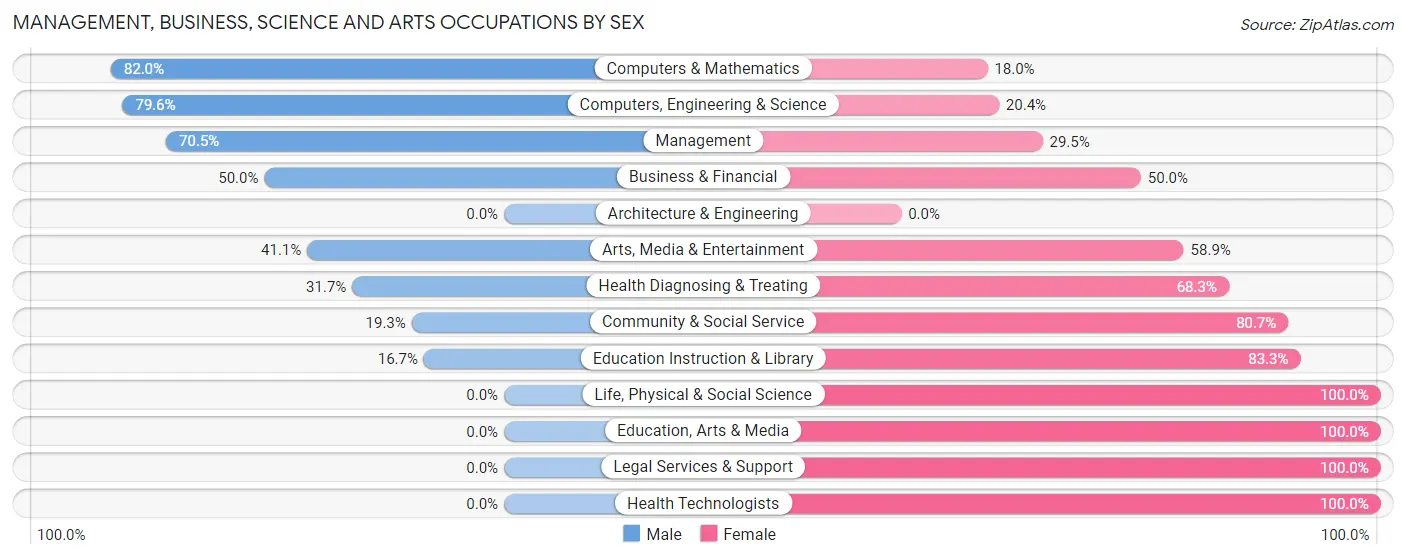
Management, Business, Science and Arts Occupations by Sex
Within the Management, Business, Science and Arts occupations in Hickam Housing, the most male-oriented occupations are Computers & Mathematics (82.0%), Computers, Engineering & Science (79.6%), and Management (70.5%), while the most female-oriented occupations are Life, Physical & Social Science (100.0%), Education, Arts & Media (100.0%), and Legal Services & Support (100.0%).
| Occupation | Male | Female |
| Management | 110 (70.5%) | 46 (29.5%) |
| Business & Financial | 39 (50.0%) | 39 (50.0%) |
| Computers, Engineering & Science | 82 (79.6%) | 21 (20.4%) |
| Computers & Mathematics | 82 (82.0%) | 18 (18.0%) |
| Architecture & Engineering | 0 (0.0%) | 0 (0.0%) |
| Life, Physical & Social Science | 0 (0.0%) | 3 (100.0%) |
| Community & Social Service | 69 (19.3%) | 289 (80.7%) |
| Education, Arts & Media | 0 (0.0%) | 16 (100.0%) |
| Legal Services & Support | 0 (0.0%) | 11 (100.0%) |
| Education Instruction & Library | 46 (16.7%) | 229 (83.3%) |
| Arts, Media & Entertainment | 23 (41.1%) | 33 (58.9%) |
| Health Diagnosing & Treating | 38 (31.7%) | 82 (68.3%) |
| Health Technologists | 0 (0.0%) | 45 (100.0%) |
| Total (Category) | 338 (41.5%) | 477 (58.5%) |
| Total (Overall) | 819 (39.7%) | 1,243 (60.3%) |
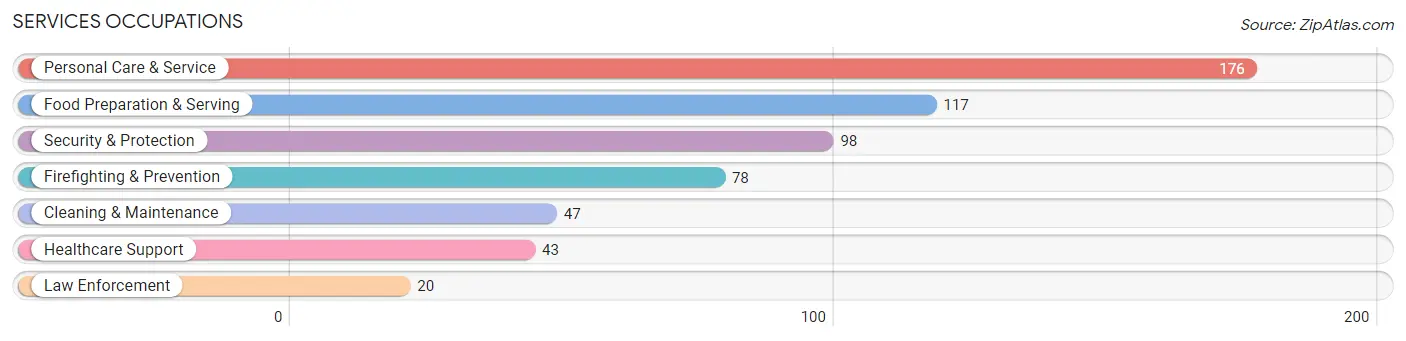
Services Occupations
The most common Services occupations in Hickam Housing are Personal Care & Service (176 | 8.5%), Food Preparation & Serving (117 | 5.7%), Security & Protection (98 | 4.8%), Firefighting & Prevention (78 | 3.8%), and Cleaning & Maintenance (47 | 2.3%).
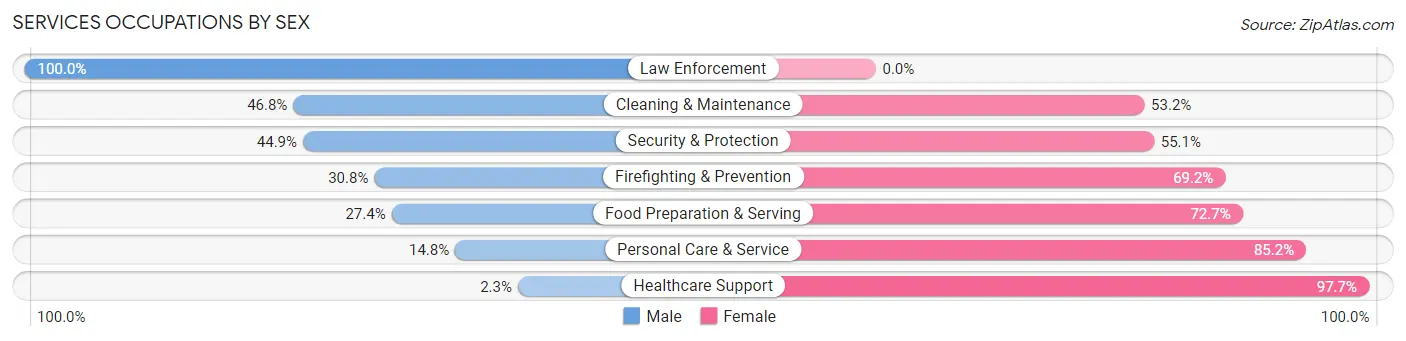
Services Occupations by Sex
Within the Services occupations in Hickam Housing, the most male-oriented occupations are Law Enforcement (100.0%), Cleaning & Maintenance (46.8%), and Security & Protection (44.9%), while the most female-oriented occupations are Healthcare Support (97.7%), Personal Care & Service (85.2%), and Food Preparation & Serving (72.7%).
| Occupation | Male | Female |
| Healthcare Support | 1 (2.3%) | 42 (97.7%) |
| Security & Protection | 44 (44.9%) | 54 (55.1%) |
| Firefighting & Prevention | 24 (30.8%) | 54 (69.2%) |
| Law Enforcement | 20 (100.0%) | 0 (0.0%) |
| Food Preparation & Serving | 32 (27.4%) | 85 (72.7%) |
| Cleaning & Maintenance | 22 (46.8%) | 25 (53.2%) |
| Personal Care & Service | 26 (14.8%) | 150 (85.2%) |
| Total (Category) | 125 (26.0%) | 356 (74.0%) |
| Total (Overall) | 819 (39.7%) | 1,243 (60.3%) |
Sales and Office Occupations
The most common Sales and Office occupations in Hickam Housing are Office & Administration (238 | 11.5%), and Sales & Related (191 | 9.3%).
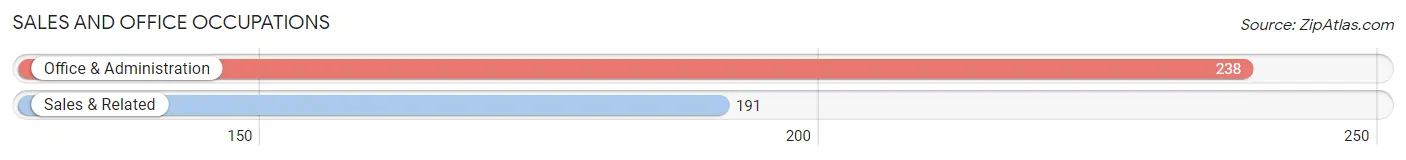
Sales and Office Occupations by Sex
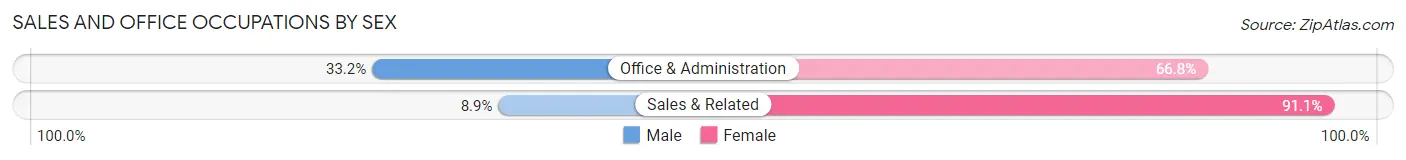
| Occupation | Male | Female |
| Sales & Related | 17 (8.9%) | 174 (91.1%) |
| Office & Administration | 79 (33.2%) | 159 (66.8%) |
| Total (Category) | 96 (22.4%) | 333 (77.6%) |
| Total (Overall) | 819 (39.7%) | 1,243 (60.3%) |
Natural Resources, Construction and Maintenance Occupations
The most common Natural Resources, Construction and Maintenance occupations in Hickam Housing are Installation, Maintenance & Repair (45 | 2.2%), and Construction & Extraction (4 | 0.2%).
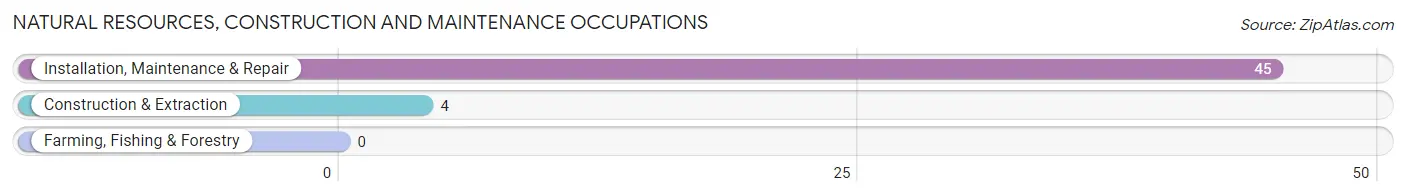
Natural Resources, Construction and Maintenance Occupations by Sex
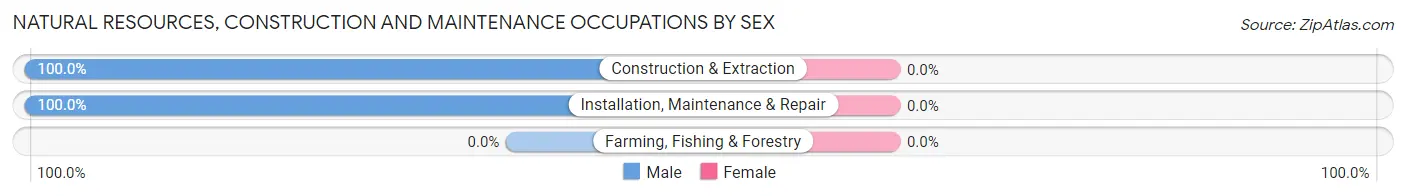
| Occupation | Male | Female |
| Farming, Fishing & Forestry | 0 (0.0%) | 0 (0.0%) |
| Construction & Extraction | 4 (100.0%) | 0 (0.0%) |
| Installation, Maintenance & Repair | 45 (100.0%) | 0 (0.0%) |
| Total (Category) | 49 (100.0%) | 0 (0.0%) |
| Total (Overall) | 819 (39.7%) | 1,243 (60.3%) |
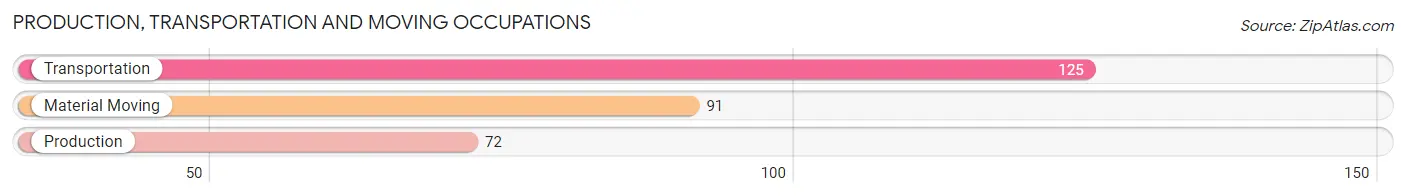
Production, Transportation and Moving Occupations
The most common Production, Transportation and Moving occupations in Hickam Housing are Transportation (125 | 6.1%), Material Moving (91 | 4.4%), and Production (72 | 3.5%).
Production, Transportation and Moving Occupations by Sex
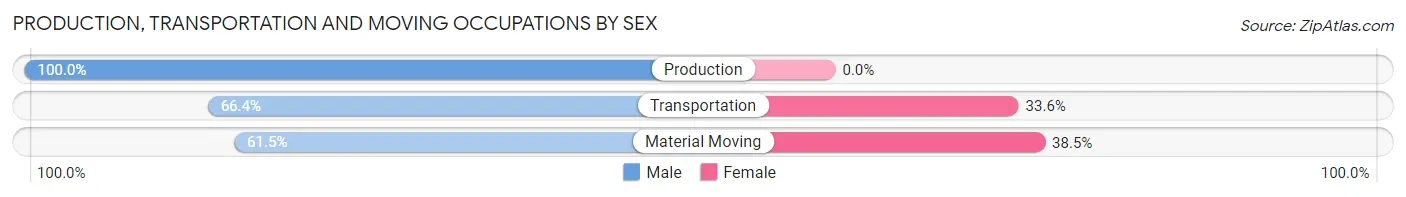
| Occupation | Male | Female |
| Production | 72 (100.0%) | 0 (0.0%) |
| Transportation | 83 (66.4%) | 42 (33.6%) |
| Material Moving | 56 (61.5%) | 35 (38.5%) |
| Total (Category) | 211 (73.3%) | 77 (26.7%) |
| Total (Overall) | 819 (39.7%) | 1,243 (60.3%) |
Employment Industries by Sex in Hickam Housing
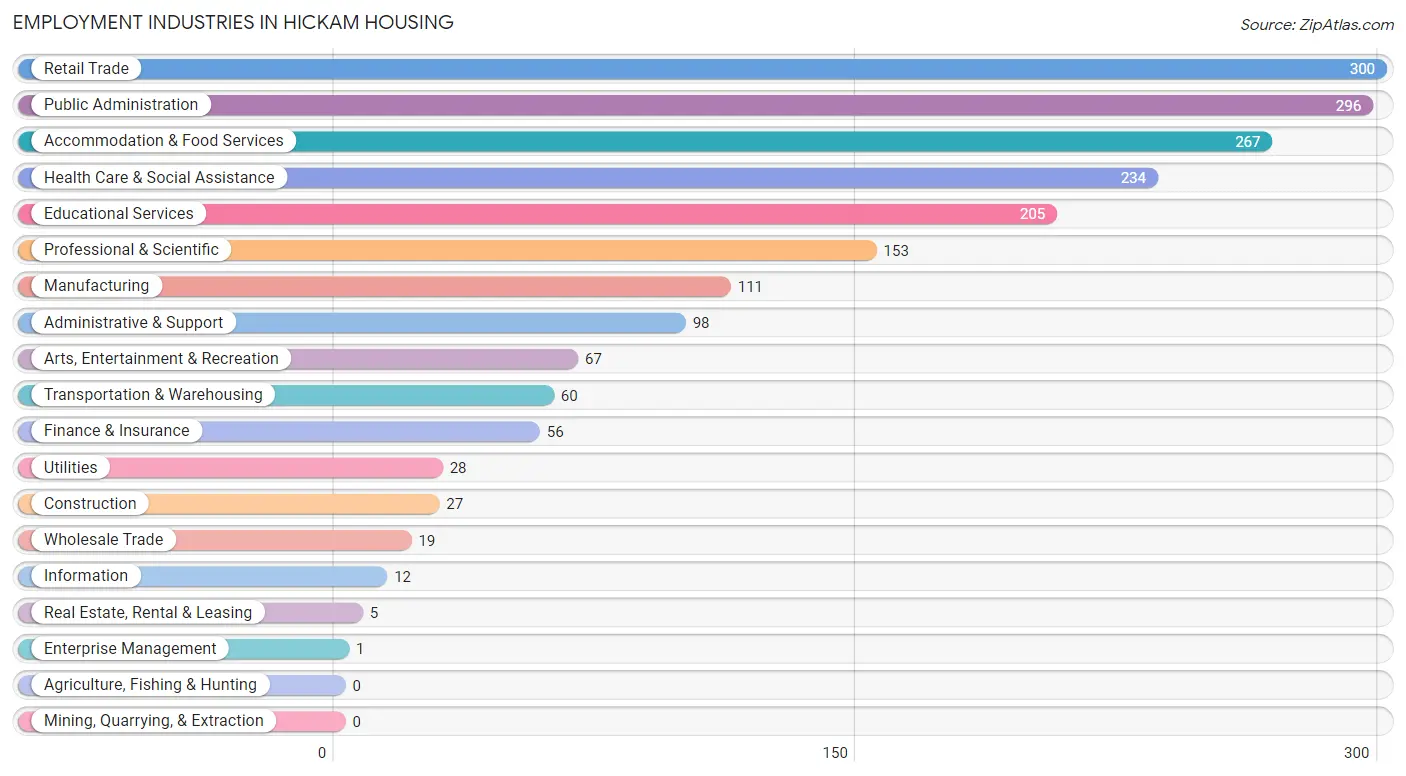
Employment Industries in Hickam Housing
The major employment industries in Hickam Housing include Retail Trade (300 | 14.5%), Public Administration (296 | 14.3%), Accommodation & Food Services (267 | 13.0%), Health Care & Social Assistance (234 | 11.4%), and Educational Services (205 | 9.9%).
Employment Industries by Sex in Hickam Housing
The Hickam Housing industries that see more men than women are Real Estate, Rental & Leasing (100.0%), Enterprise Management (100.0%), and Construction (96.3%), whereas the industries that tend to have a higher number of women are Wholesale Trade (100.0%), Utilities (100.0%), and Educational Services (84.9%).
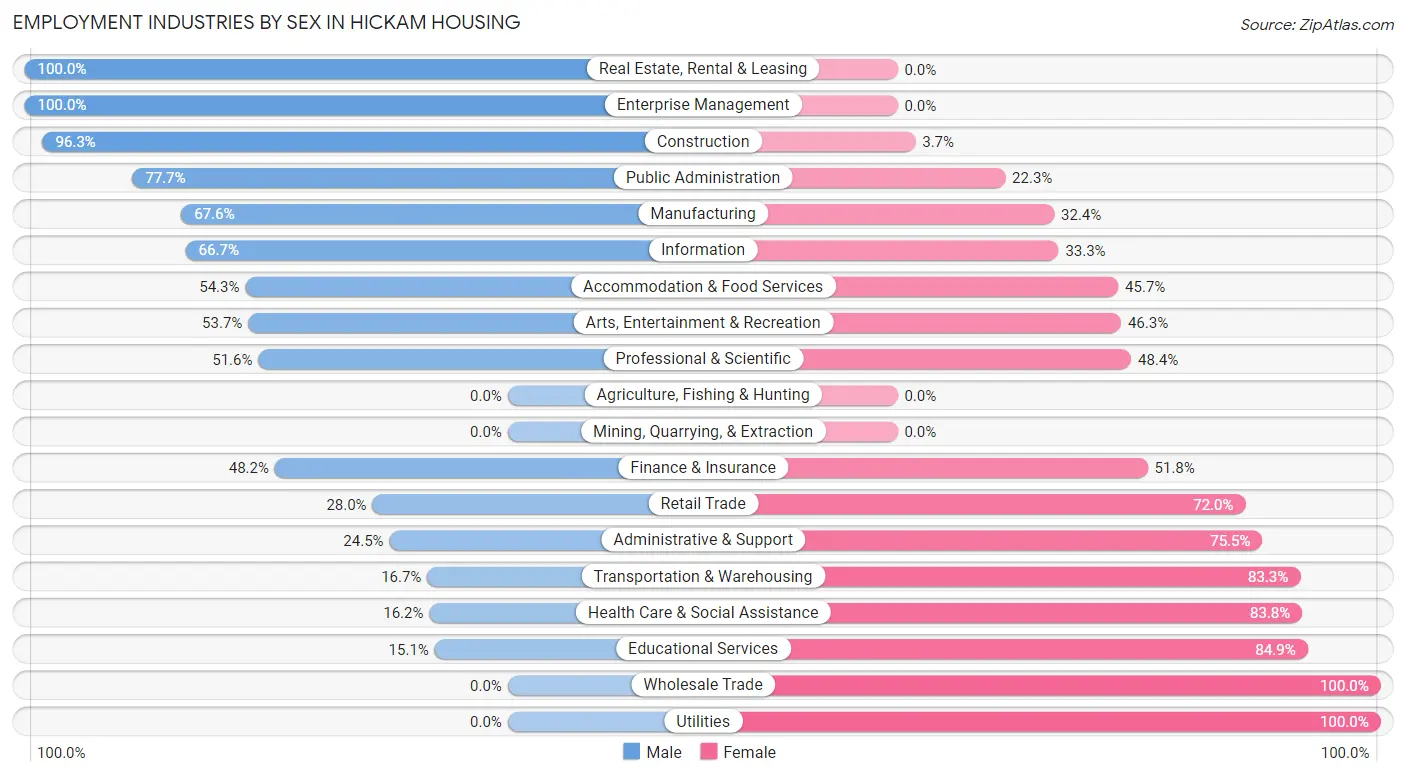
| Industry | Male | Female |
| Agriculture, Fishing & Hunting | 0 (0.0%) | 0 (0.0%) |
| Mining, Quarrying, & Extraction | 0 (0.0%) | 0 (0.0%) |
| Construction | 26 (96.3%) | 1 (3.7%) |
| Manufacturing | 75 (67.6%) | 36 (32.4%) |
| Wholesale Trade | 0 (0.0%) | 19 (100.0%) |
| Retail Trade | 84 (28.0%) | 216 (72.0%) |
| Transportation & Warehousing | 10 (16.7%) | 50 (83.3%) |
| Utilities | 0 (0.0%) | 28 (100.0%) |
| Information | 8 (66.7%) | 4 (33.3%) |
| Finance & Insurance | 27 (48.2%) | 29 (51.8%) |
| Real Estate, Rental & Leasing | 5 (100.0%) | 0 (0.0%) |
| Professional & Scientific | 79 (51.6%) | 74 (48.4%) |
| Enterprise Management | 1 (100.0%) | 0 (0.0%) |
| Administrative & Support | 24 (24.5%) | 74 (75.5%) |
| Educational Services | 31 (15.1%) | 174 (84.9%) |
| Health Care & Social Assistance | 38 (16.2%) | 196 (83.8%) |
| Arts, Entertainment & Recreation | 36 (53.7%) | 31 (46.3%) |
| Accommodation & Food Services | 145 (54.3%) | 122 (45.7%) |
| Public Administration | 230 (77.7%) | 66 (22.3%) |
| Total | 819 (39.7%) | 1,243 (60.3%) |
Education in Hickam Housing
School Enrollment in Hickam Housing
The most common levels of schooling among the 3,608 students in Hickam Housing are elementary school (861 | 23.9%), middle school (819 | 22.7%), and college / undergraduate (809 | 22.4%).
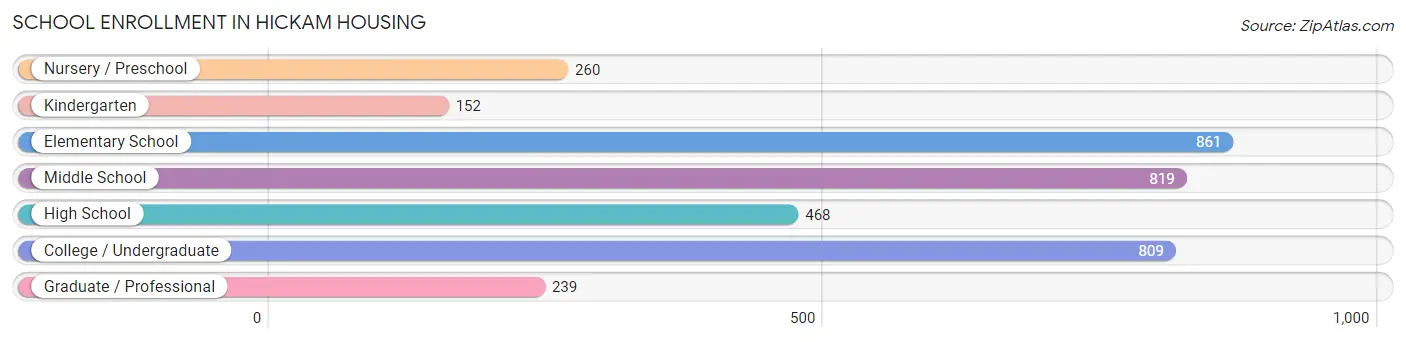
| School Level | # Students | % Students |
| Nursery / Preschool | 260 | 7.2% |
| Kindergarten | 152 | 4.2% |
| Elementary School | 861 | 23.9% |
| Middle School | 819 | 22.7% |
| High School | 468 | 13.0% |
| College / Undergraduate | 809 | 22.4% |
| Graduate / Professional | 239 | 6.6% |
| Total | 3,608 | 100.0% |
School Enrollment by Age by Funding Source in Hickam Housing
Out of a total of 3,608 students who are enrolled in schools in Hickam Housing, 1,212 (33.6%) attend a private institution, while the remaining 2,396 (66.4%) are enrolled in public schools. The age group of 3 to 4 year olds has the highest likelihood of being enrolled in private schools, with 191 (77.0% in the age bracket) enrolled. Conversely, the age group of 15 to 17 year olds has the lowest likelihood of being enrolled in a private school, with 263 (96.0% in the age bracket) attending a public institution.
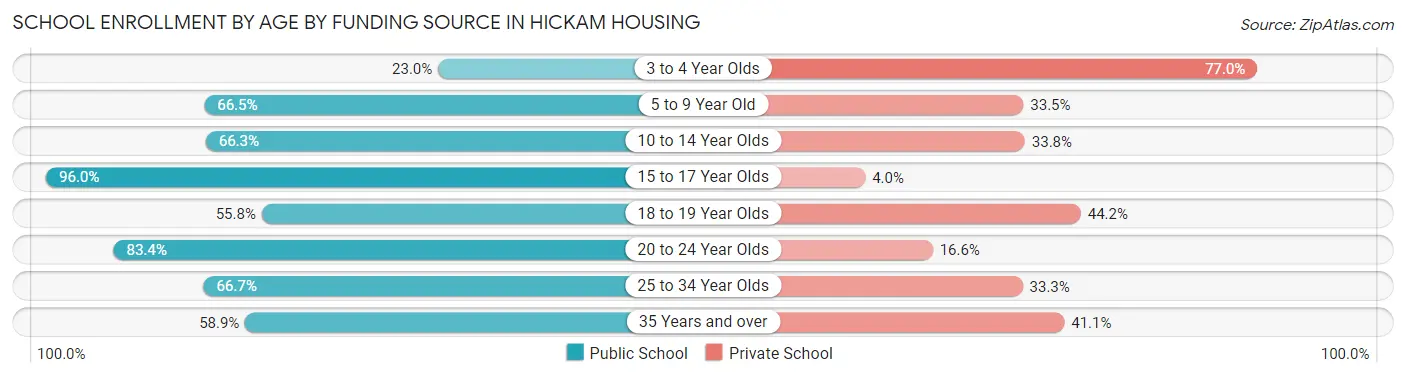
| Age Bracket | Public School | Private School |
| 3 to 4 Year Olds | 57 (23.0%) | 191 (77.0%) |
| 5 to 9 Year Old | 642 (66.5%) | 323 (33.5%) |
| 10 to 14 Year Olds | 638 (66.2%) | 325 (33.8%) |
| 15 to 17 Year Olds | 263 (96.0%) | 11 (4.0%) |
| 18 to 19 Year Olds | 67 (55.8%) | 53 (44.2%) |
| 20 to 24 Year Olds | 312 (83.4%) | 62 (16.6%) |
| 25 to 34 Year Olds | 222 (66.7%) | 111 (33.3%) |
| 35 Years and over | 195 (58.9%) | 136 (41.1%) |
| Total | 2,396 (66.4%) | 1,212 (33.6%) |
Educational Attainment by Field of Study in Hickam Housing
Business (407 | 15.4%), social sciences (314 | 11.9%), science & technology (300 | 11.4%), arts & humanities (292 | 11.1%), and liberal arts & history (290 | 11.0%) are the most common fields of study among 2,641 individuals in Hickam Housing who have obtained a bachelor's degree or higher.
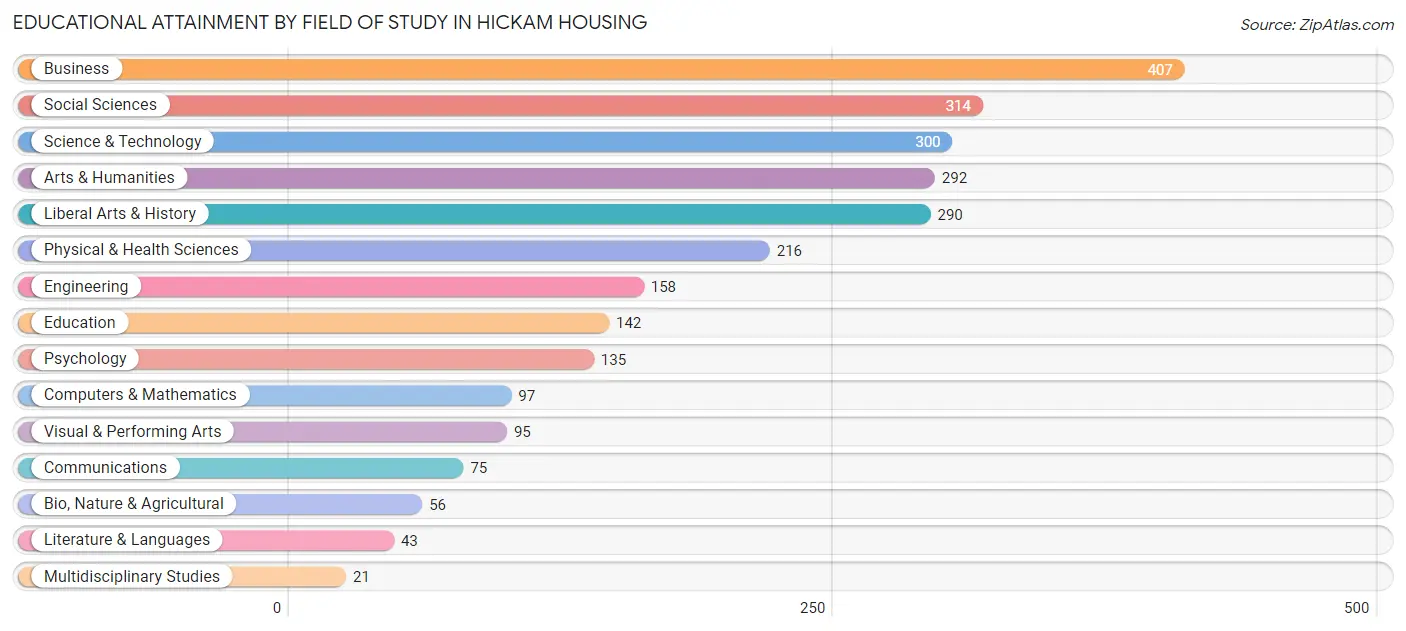
| Field of Study | # Graduates | % Graduates |
| Computers & Mathematics | 97 | 3.7% |
| Bio, Nature & Agricultural | 56 | 2.1% |
| Physical & Health Sciences | 216 | 8.2% |
| Psychology | 135 | 5.1% |
| Social Sciences | 314 | 11.9% |
| Engineering | 158 | 6.0% |
| Multidisciplinary Studies | 21 | 0.8% |
| Science & Technology | 300 | 11.4% |
| Business | 407 | 15.4% |
| Education | 142 | 5.4% |
| Literature & Languages | 43 | 1.6% |
| Liberal Arts & History | 290 | 11.0% |
| Visual & Performing Arts | 95 | 3.6% |
| Communications | 75 | 2.8% |
| Arts & Humanities | 292 | 11.1% |
| Total | 2,641 | 100.0% |
Transportation & Commute in Hickam Housing
Vehicle Availability by Sex in Hickam Housing
The most prevalent vehicle ownership categories in Hickam Housing are males with 2 vehicles (1,775, accounting for 67.0%) and females with 2 vehicles (1,013, making up 107.5%).
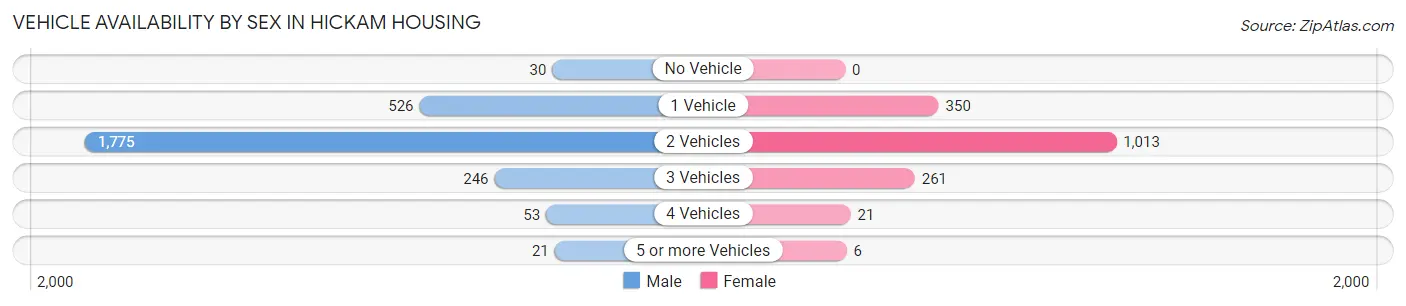
| Vehicles Available | Male | Female |
| No Vehicle | 30 (1.1%) | 0 (0.0%) |
| 1 Vehicle | 526 (19.8%) | 350 (21.2%) |
| 2 Vehicles | 1,775 (67.0%) | 1,013 (61.4%) |
| 3 Vehicles | 246 (9.3%) | 261 (15.8%) |
| 4 Vehicles | 53 (2.0%) | 21 (1.3%) |
| 5 or more Vehicles | 21 (0.8%) | 6 (0.4%) |
| Total | 2,651 (100.0%) | 1,651 (100.0%) |
Commute Time in Hickam Housing
The most frequently occuring commute durations in Hickam Housing are 5 to 9 minutes (1,246 commuters, 26.9%), 15 to 19 minutes (933 commuters, 20.2%), and 10 to 14 minutes (859 commuters, 18.6%).
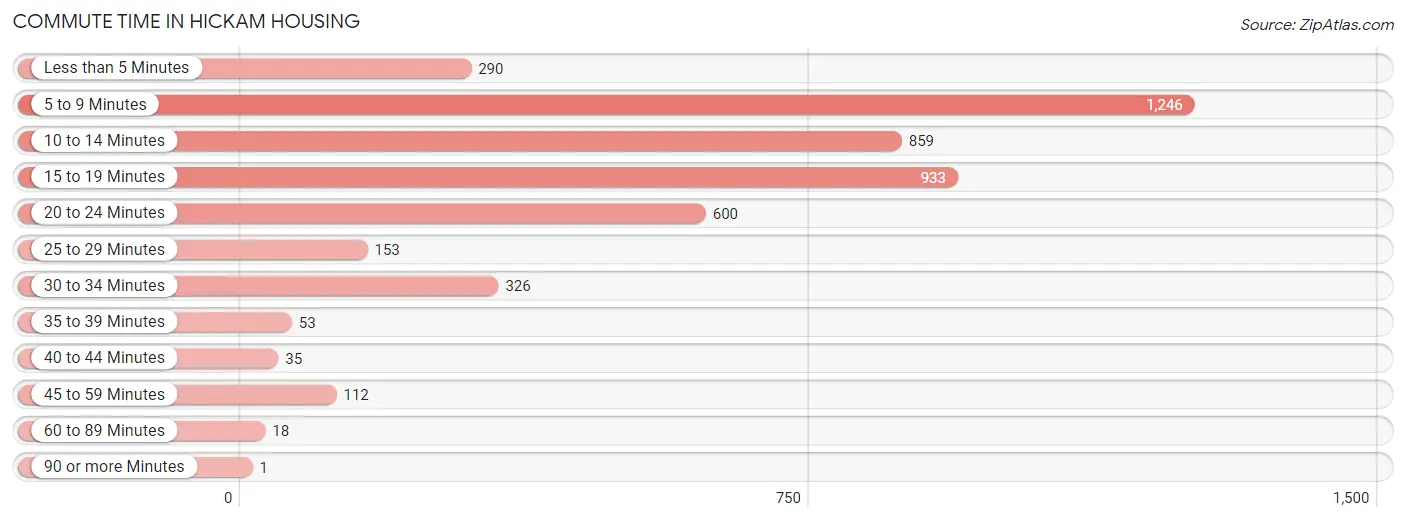
| Commute Time | # Commuters | % Commuters |
| Less than 5 Minutes | 290 | 6.3% |
| 5 to 9 Minutes | 1,246 | 26.9% |
| 10 to 14 Minutes | 859 | 18.6% |
| 15 to 19 Minutes | 933 | 20.2% |
| 20 to 24 Minutes | 600 | 13.0% |
| 25 to 29 Minutes | 153 | 3.3% |
| 30 to 34 Minutes | 326 | 7.0% |
| 35 to 39 Minutes | 53 | 1.1% |
| 40 to 44 Minutes | 35 | 0.8% |
| 45 to 59 Minutes | 112 | 2.4% |
| 60 to 89 Minutes | 18 | 0.4% |
| 90 or more Minutes | 1 | 0.0% |
Commute Time by Sex in Hickam Housing
The most common commute times in Hickam Housing are 5 to 9 minutes (879 commuters, 29.7%) for males and 15 to 19 minutes (388 commuters, 23.3%) for females.
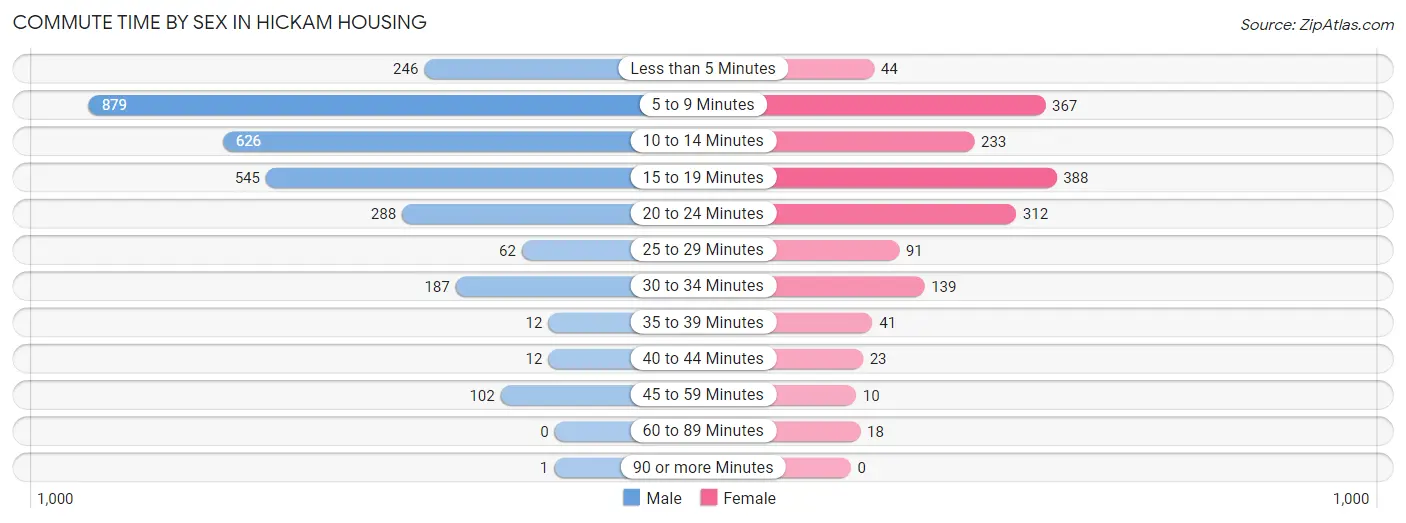
| Commute Time | Male | Female |
| Less than 5 Minutes | 246 (8.3%) | 44 (2.6%) |
| 5 to 9 Minutes | 879 (29.7%) | 367 (22.0%) |
| 10 to 14 Minutes | 626 (21.1%) | 233 (14.0%) |
| 15 to 19 Minutes | 545 (18.4%) | 388 (23.3%) |
| 20 to 24 Minutes | 288 (9.7%) | 312 (18.7%) |
| 25 to 29 Minutes | 62 (2.1%) | 91 (5.5%) |
| 30 to 34 Minutes | 187 (6.3%) | 139 (8.3%) |
| 35 to 39 Minutes | 12 (0.4%) | 41 (2.5%) |
| 40 to 44 Minutes | 12 (0.4%) | 23 (1.4%) |
| 45 to 59 Minutes | 102 (3.5%) | 10 (0.6%) |
| 60 to 89 Minutes | 0 (0.0%) | 18 (1.1%) |
| 90 or more Minutes | 1 (0.0%) | 0 (0.0%) |
Time of Departure to Work by Sex in Hickam Housing
The most frequent times of departure to work in Hickam Housing are 7:00 AM to 7:29 AM (586, 19.8%) for males and 7:00 AM to 7:29 AM (400, 24.0%) for females.
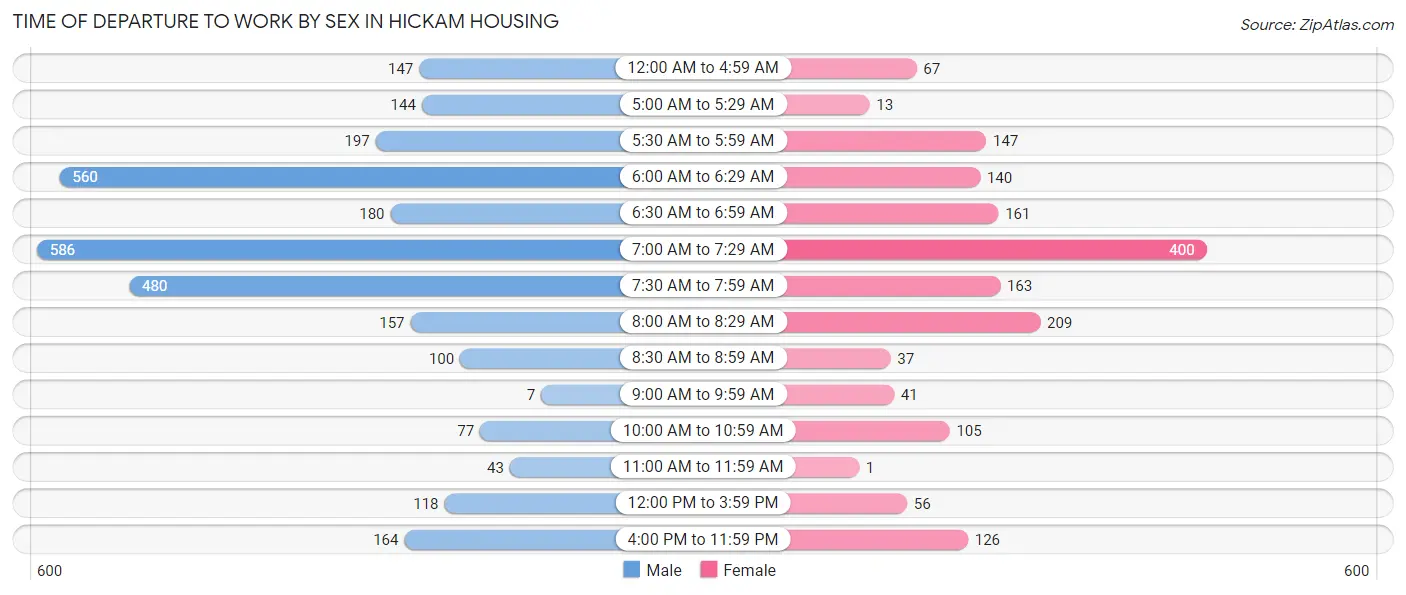
| Time of Departure | Male | Female |
| 12:00 AM to 4:59 AM | 147 (5.0%) | 67 (4.0%) |
| 5:00 AM to 5:29 AM | 144 (4.9%) | 13 (0.8%) |
| 5:30 AM to 5:59 AM | 197 (6.7%) | 147 (8.8%) |
| 6:00 AM to 6:29 AM | 560 (18.9%) | 140 (8.4%) |
| 6:30 AM to 6:59 AM | 180 (6.1%) | 161 (9.7%) |
| 7:00 AM to 7:29 AM | 586 (19.8%) | 400 (24.0%) |
| 7:30 AM to 7:59 AM | 480 (16.2%) | 163 (9.8%) |
| 8:00 AM to 8:29 AM | 157 (5.3%) | 209 (12.6%) |
| 8:30 AM to 8:59 AM | 100 (3.4%) | 37 (2.2%) |
| 9:00 AM to 9:59 AM | 7 (0.2%) | 41 (2.5%) |
| 10:00 AM to 10:59 AM | 77 (2.6%) | 105 (6.3%) |
| 11:00 AM to 11:59 AM | 43 (1.5%) | 1 (0.1%) |
| 12:00 PM to 3:59 PM | 118 (4.0%) | 56 (3.4%) |
| 4:00 PM to 11:59 PM | 164 (5.5%) | 126 (7.6%) |
| Total | 2,960 (100.0%) | 1,666 (100.0%) |
Housing Occupancy in Hickam Housing
Occupancy by Ownership in Hickam Housing
Of the total 2,839 dwellings in Hickam Housing, owner-occupied units account for 8 (0.3%), while renter-occupied units make up 2,831 (99.7%).
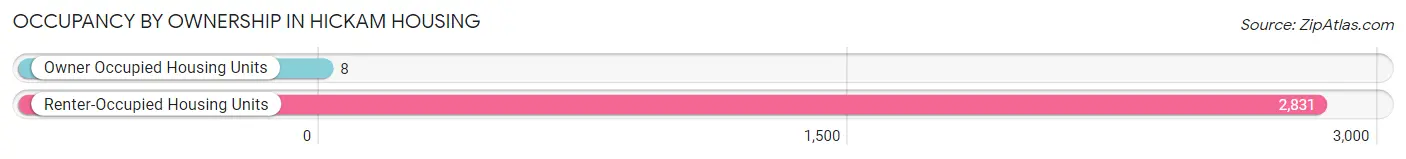
| Occupancy | # Housing Units | % Housing Units |
| Owner Occupied Housing Units | 8 | 0.3% |
| Renter-Occupied Housing Units | 2,831 | 99.7% |
| Total Occupied Housing Units | 2,839 | 100.0% |
Occupancy by Household Size in Hickam Housing
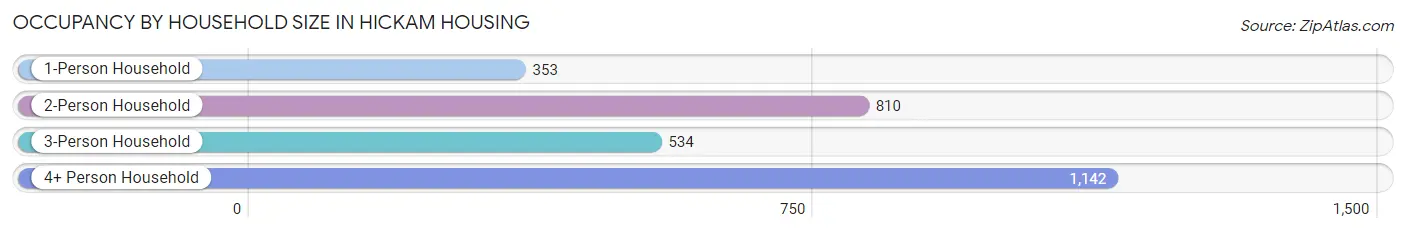
| Household Size | # Housing Units | % Housing Units |
| 1-Person Household | 353 | 12.4% |
| 2-Person Household | 810 | 28.5% |
| 3-Person Household | 534 | 18.8% |
| 4+ Person Household | 1,142 | 40.2% |
| Total Housing Units | 2,839 | 100.0% |
Occupancy by Ownership by Household Size in Hickam Housing
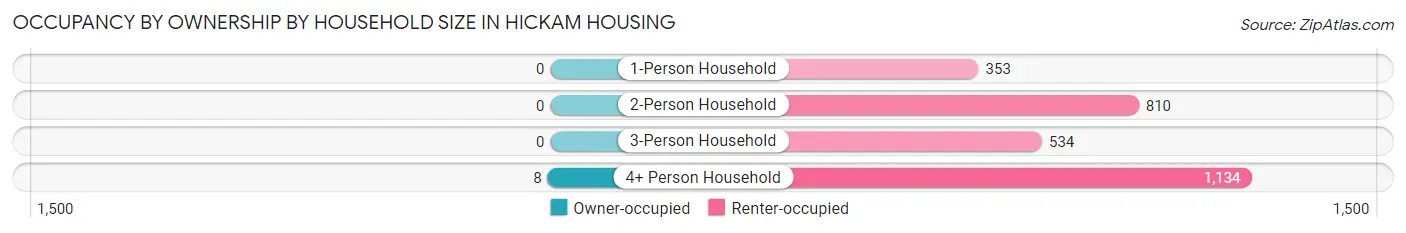
| Household Size | Owner-occupied | Renter-occupied |
| 1-Person Household | 0 (0.0%) | 353 (100.0%) |
| 2-Person Household | 0 (0.0%) | 810 (100.0%) |
| 3-Person Household | 0 (0.0%) | 534 (100.0%) |
| 4+ Person Household | 8 (0.7%) | 1,134 (99.3%) |
| Total Housing Units | 8 (0.3%) | 2,831 (99.7%) |
Occupancy by Educational Attainment in Hickam Housing
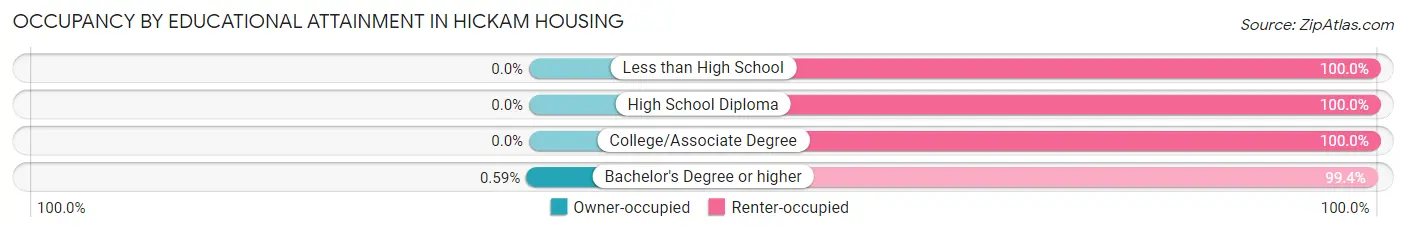
| Household Size | Owner-occupied | Renter-occupied |
| Less than High School | 0 (0.0%) | 37 (100.0%) |
| High School Diploma | 0 (0.0%) | 296 (100.0%) |
| College/Associate Degree | 0 (0.0%) | 1,150 (100.0%) |
| Bachelor's Degree or higher | 8 (0.6%) | 1,348 (99.4%) |
Occupancy by Age of Householder in Hickam Housing
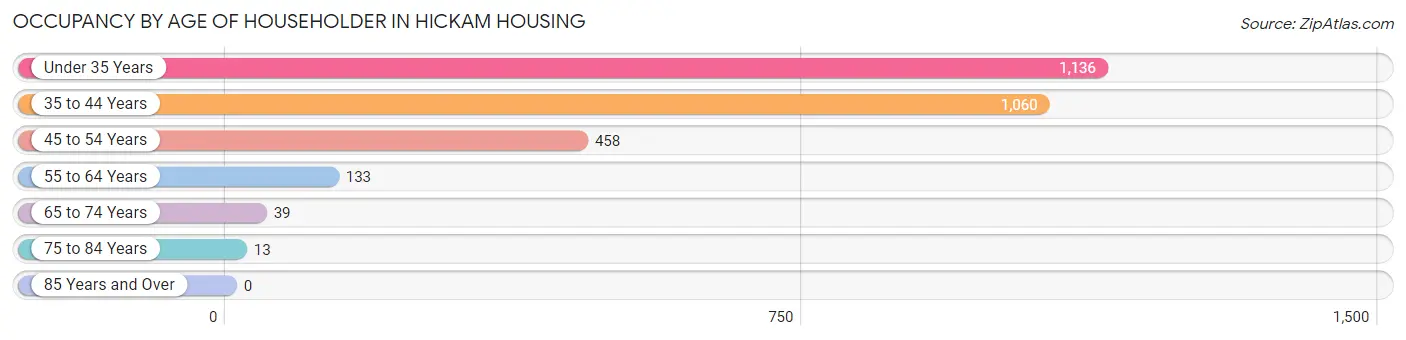
| Age Bracket | # Households | % Households |
| Under 35 Years | 1,136 | 40.0% |
| 35 to 44 Years | 1,060 | 37.3% |
| 45 to 54 Years | 458 | 16.1% |
| 55 to 64 Years | 133 | 4.7% |
| 65 to 74 Years | 39 | 1.4% |
| 75 to 84 Years | 13 | 0.5% |
| 85 Years and Over | 0 | 0.0% |
| Total | 2,839 | 100.0% |
Housing Finances in Hickam Housing
Median Income by Occupancy in Hickam Housing
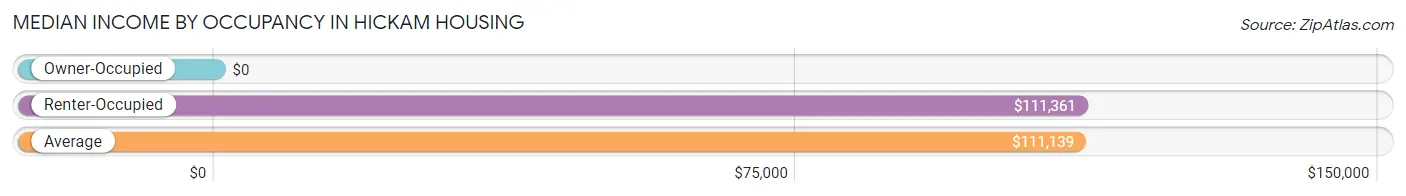
| Occupancy Type | # Households | Median Income |
| Owner-Occupied | 8 (0.3%) | $0 |
| Renter-Occupied | 2,831 (99.7%) | $111,361 |
| Average | 2,839 (100.0%) | $111,139 |
Occupancy by Householder Income Bracket in Hickam Housing
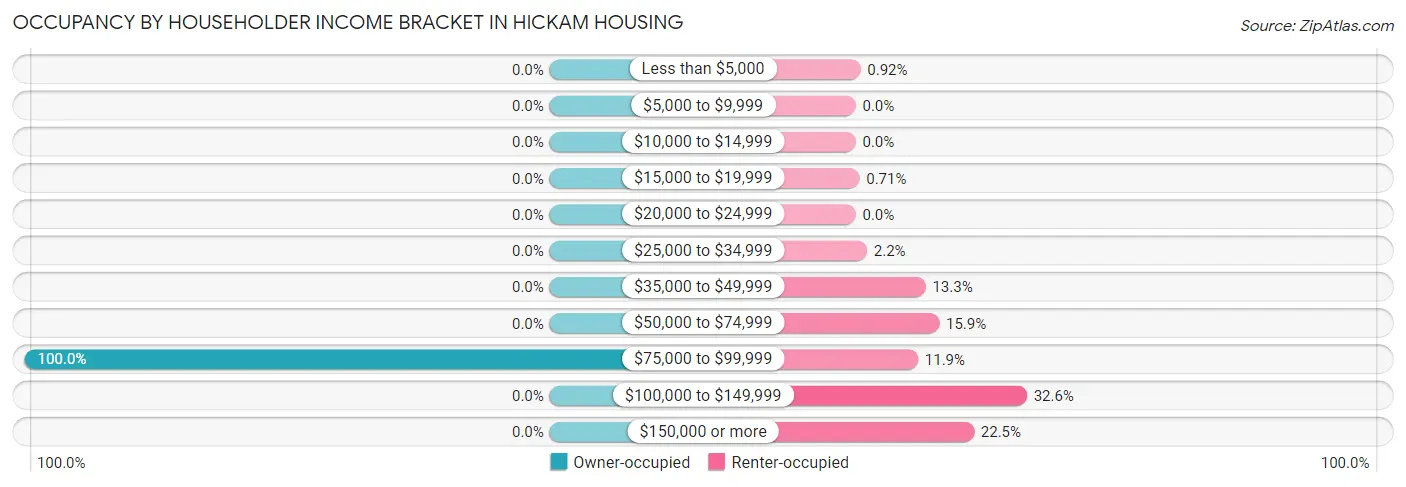
| Income Bracket | Owner-occupied | Renter-occupied |
| Less than $5,000 | 0 (0.0%) | 26 (0.9%) |
| $5,000 to $9,999 | 0 (0.0%) | 0 (0.0%) |
| $10,000 to $14,999 | 0 (0.0%) | 0 (0.0%) |
| $15,000 to $19,999 | 0 (0.0%) | 20 (0.7%) |
| $20,000 to $24,999 | 0 (0.0%) | 0 (0.0%) |
| $25,000 to $34,999 | 0 (0.0%) | 61 (2.1%) |
| $35,000 to $49,999 | 0 (0.0%) | 377 (13.3%) |
| $50,000 to $74,999 | 0 (0.0%) | 450 (15.9%) |
| $75,000 to $99,999 | 8 (100.0%) | 336 (11.9%) |
| $100,000 to $149,999 | 0 (0.0%) | 923 (32.6%) |
| $150,000 or more | 0 (0.0%) | 638 (22.5%) |
| Total | 8 (100.0%) | 2,831 (100.0%) |
Monthly Housing Cost Tiers in Hickam Housing
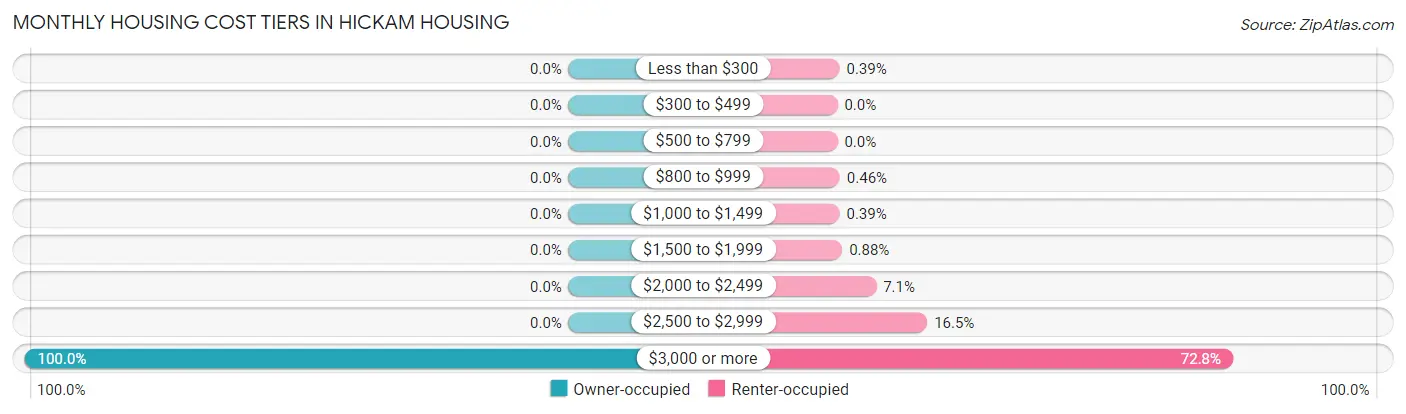
| Monthly Cost | Owner-occupied | Renter-occupied |
| Less than $300 | 0 (0.0%) | 11 (0.4%) |
| $300 to $499 | 0 (0.0%) | 0 (0.0%) |
| $500 to $799 | 0 (0.0%) | 0 (0.0%) |
| $800 to $999 | 0 (0.0%) | 13 (0.5%) |
| $1,000 to $1,499 | 0 (0.0%) | 11 (0.4%) |
| $1,500 to $1,999 | 0 (0.0%) | 25 (0.9%) |
| $2,000 to $2,499 | 0 (0.0%) | 202 (7.1%) |
| $2,500 to $2,999 | 0 (0.0%) | 468 (16.5%) |
| $3,000 or more | 8 (100.0%) | 2,061 (72.8%) |
| Total | 8 (100.0%) | 2,831 (100.0%) |
Physical Housing Characteristics in Hickam Housing
Housing Structures in Hickam Housing
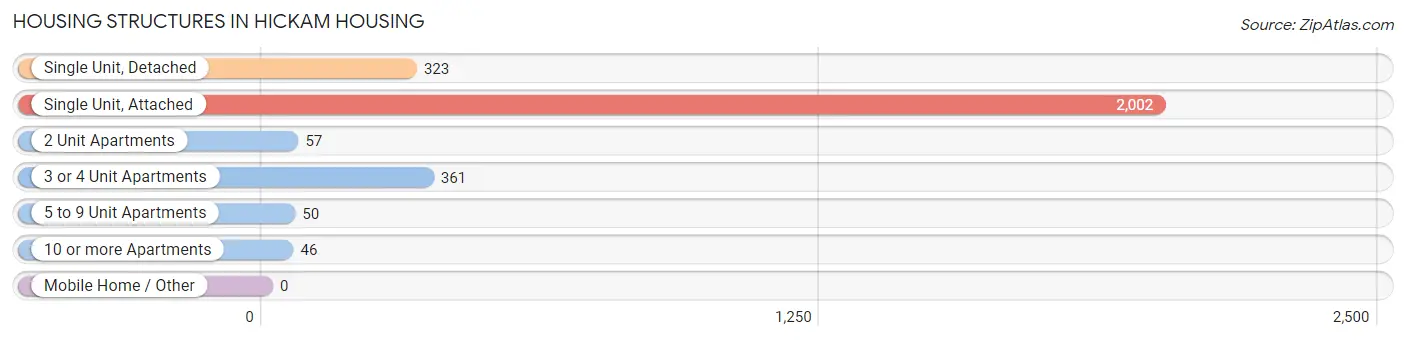
| Structure Type | # Housing Units | % Housing Units |
| Single Unit, Detached | 323 | 11.4% |
| Single Unit, Attached | 2,002 | 70.5% |
| 2 Unit Apartments | 57 | 2.0% |
| 3 or 4 Unit Apartments | 361 | 12.7% |
| 5 to 9 Unit Apartments | 50 | 1.8% |
| 10 or more Apartments | 46 | 1.6% |
| Mobile Home / Other | 0 | 0.0% |
| Total | 2,839 | 100.0% |
Housing Structures by Occupancy in Hickam Housing
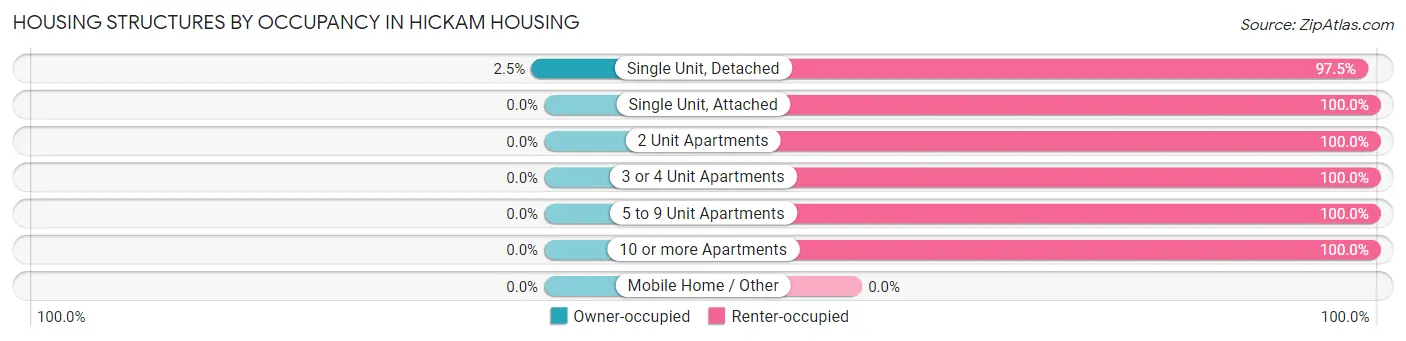
| Structure Type | Owner-occupied | Renter-occupied |
| Single Unit, Detached | 8 (2.5%) | 315 (97.5%) |
| Single Unit, Attached | 0 (0.0%) | 2,002 (100.0%) |
| 2 Unit Apartments | 0 (0.0%) | 57 (100.0%) |
| 3 or 4 Unit Apartments | 0 (0.0%) | 361 (100.0%) |
| 5 to 9 Unit Apartments | 0 (0.0%) | 50 (100.0%) |
| 10 or more Apartments | 0 (0.0%) | 46 (100.0%) |
| Mobile Home / Other | 0 (0.0%) | 0 (0.0%) |
| Total | 8 (0.3%) | 2,831 (99.7%) |
Housing Structures by Number of Rooms in Hickam Housing
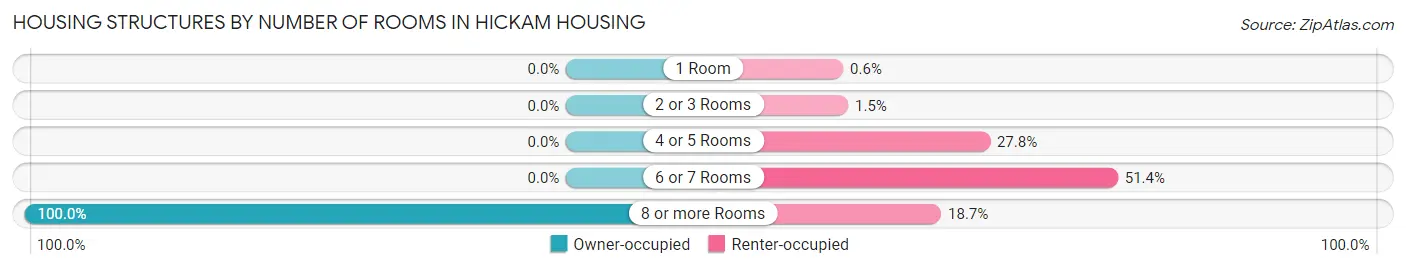
| Number of Rooms | Owner-occupied | Renter-occupied |
| 1 Room | 0 (0.0%) | 17 (0.6%) |
| 2 or 3 Rooms | 0 (0.0%) | 43 (1.5%) |
| 4 or 5 Rooms | 0 (0.0%) | 786 (27.8%) |
| 6 or 7 Rooms | 0 (0.0%) | 1,455 (51.4%) |
| 8 or more Rooms | 8 (100.0%) | 530 (18.7%) |
| Total | 8 (100.0%) | 2,831 (100.0%) |
Housing Structure by Heating Type in Hickam Housing
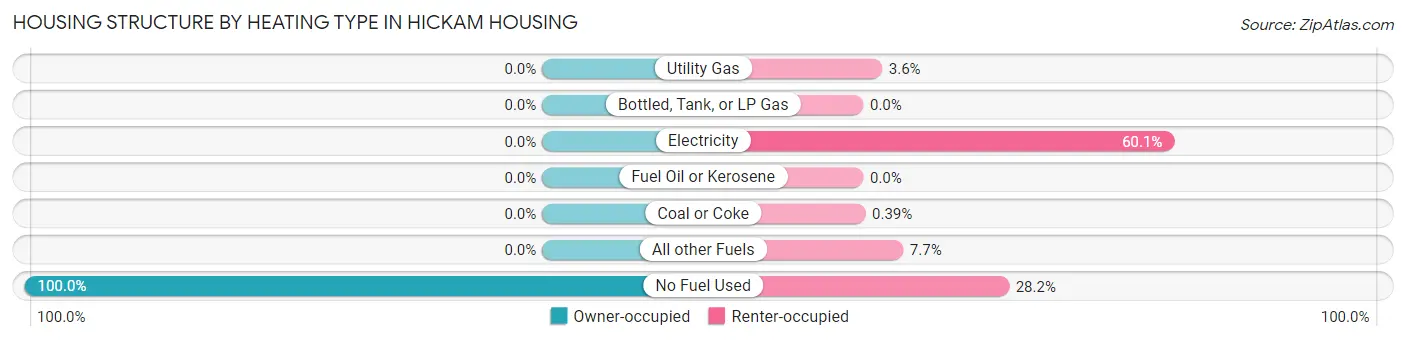
| Heating Type | Owner-occupied | Renter-occupied |
| Utility Gas | 0 (0.0%) | 103 (3.6%) |
| Bottled, Tank, or LP Gas | 0 (0.0%) | 0 (0.0%) |
| Electricity | 0 (0.0%) | 1,702 (60.1%) |
| Fuel Oil or Kerosene | 0 (0.0%) | 0 (0.0%) |
| Coal or Coke | 0 (0.0%) | 11 (0.4%) |
| All other Fuels | 0 (0.0%) | 218 (7.7%) |
| No Fuel Used | 8 (100.0%) | 797 (28.1%) |
| Total | 8 (100.0%) | 2,831 (100.0%) |
Household Vehicle Usage in Hickam Housing
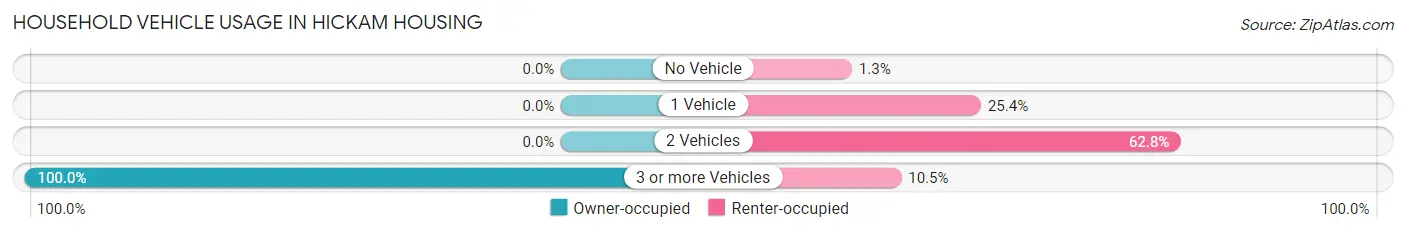
| Vehicles per Household | Owner-occupied | Renter-occupied |
| No Vehicle | 0 (0.0%) | 37 (1.3%) |
| 1 Vehicle | 0 (0.0%) | 719 (25.4%) |
| 2 Vehicles | 0 (0.0%) | 1,777 (62.8%) |
| 3 or more Vehicles | 8 (100.0%) | 298 (10.5%) |
| Total | 8 (100.0%) | 2,831 (100.0%) |
Real Estate & Mortgages in Hickam Housing
Real Estate and Mortgage Overview in Hickam Housing
| Characteristic | Without Mortgage | With Mortgage |
| Housing Units | 0 | 8 |
| Median Property Value | - | - |
| Median Household Income | - | - |
| Monthly Housing Costs | - | - |
| Real Estate Taxes | - | - |
Property Value by Mortgage Status in Hickam Housing
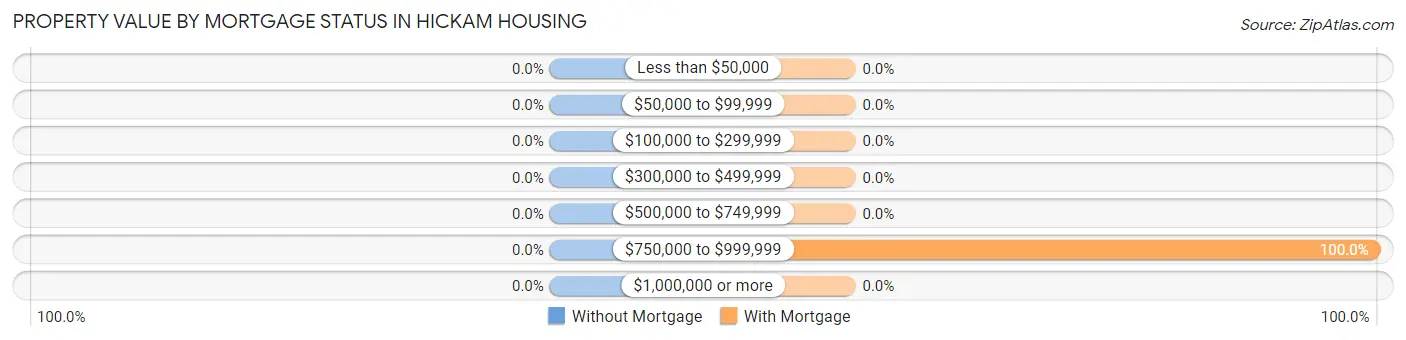
| Property Value | Without Mortgage | With Mortgage |
| Less than $50,000 | 0 (0.0%) | 0 (0.0%) |
| $50,000 to $99,999 | 0 (0.0%) | 0 (0.0%) |
| $100,000 to $299,999 | 0 (0.0%) | 0 (0.0%) |
| $300,000 to $499,999 | 0 (0.0%) | 0 (0.0%) |
| $500,000 to $749,999 | 0 (0.0%) | 0 (0.0%) |
| $750,000 to $999,999 | 0 (0.0%) | 8 (100.0%) |
| $1,000,000 or more | 0 (0.0%) | 0 (0.0%) |
| Total | 0 (0.0%) | 8 (100.0%) |
Household Income by Mortgage Status in Hickam Housing
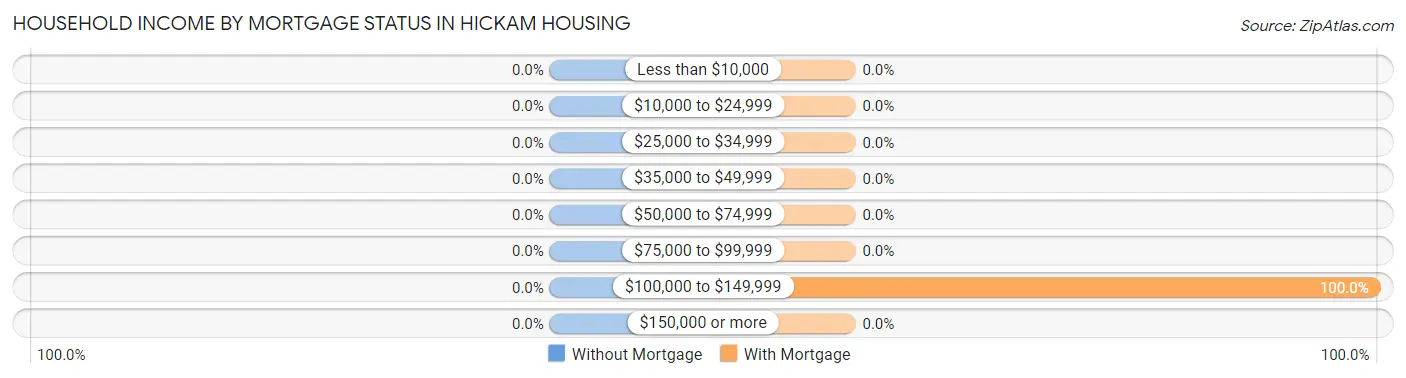
| Household Income | Without Mortgage | With Mortgage |
| Less than $10,000 | 0 (0.0%) | 0 (0.0%) |
| $10,000 to $24,999 | 0 (0.0%) | 0 (0.0%) |
| $25,000 to $34,999 | 0 (0.0%) | 0 (0.0%) |
| $35,000 to $49,999 | 0 (0.0%) | 0 (0.0%) |
| $50,000 to $74,999 | 0 (0.0%) | 0 (0.0%) |
| $75,000 to $99,999 | 0 (0.0%) | 0 (0.0%) |
| $100,000 to $149,999 | 0 (0.0%) | 8 (100.0%) |
| $150,000 or more | 0 (0.0%) | 0 (0.0%) |
| Total | 0 (0.0%) | 8 (100.0%) |
Property Value to Household Income Ratio in Hickam Housing
| Value-to-Income Ratio | Without Mortgage | With Mortgage |
| Less than 2.0x | 0 (0.0%) | 0 (0.0%) |
| 2.0x to 2.9x | 0 (0.0%) | 0 (0.0%) |
| 3.0x to 3.9x | 0 (0.0%) | 0 (0.0%) |
| 4.0x or more | 0 (0.0%) | 0 (0.0%) |
| Total | 0 (0.0%) | 8 (100.0%) |
Real Estate Taxes by Mortgage Status in Hickam Housing
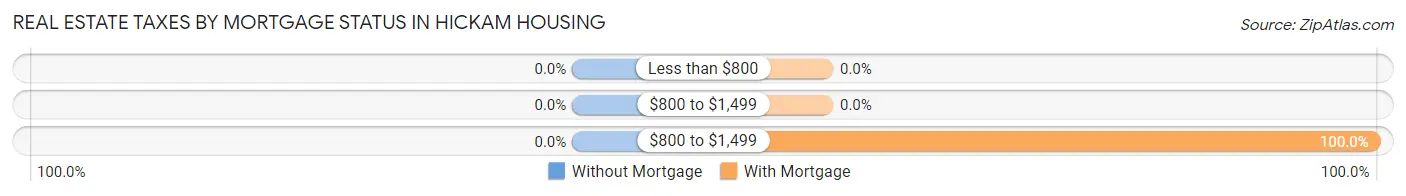
| Property Taxes | Without Mortgage | With Mortgage |
| Less than $800 | 0 (0.0%) | 0 (0.0%) |
| $800 to $1,499 | 0 (0.0%) | 0 (0.0%) |
| $800 to $1,499 | 0 (0.0%) | 8 (100.0%) |
| Total | 0 (0.0%) | 8 (100.0%) |
Health & Disability in Hickam Housing
Health Insurance Coverage by Age in Hickam Housing
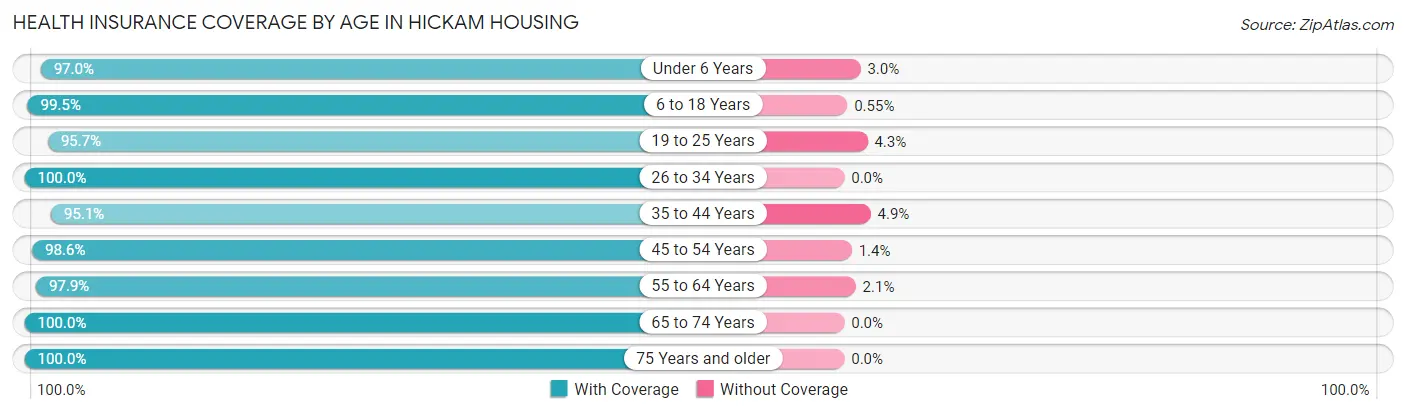
| Age Bracket | With Coverage | Without Coverage |
| Under 6 Years | 1,161 (97.0%) | 36 (3.0%) |
| 6 to 18 Years | 2,187 (99.5%) | 12 (0.5%) |
| 19 to 25 Years | 532 (95.7%) | 24 (4.3%) |
| 26 to 34 Years | 922 (100.0%) | 0 (0.0%) |
| 35 to 44 Years | 910 (95.1%) | 47 (4.9%) |
| 45 to 54 Years | 425 (98.6%) | 6 (1.4%) |
| 55 to 64 Years | 323 (97.9%) | 7 (2.1%) |
| 65 to 74 Years | 81 (100.0%) | 0 (0.0%) |
| 75 Years and older | 26 (100.0%) | 0 (0.0%) |
| Total | 6,567 (98.0%) | 132 (2.0%) |
Health Insurance Coverage by Citizenship Status in Hickam Housing
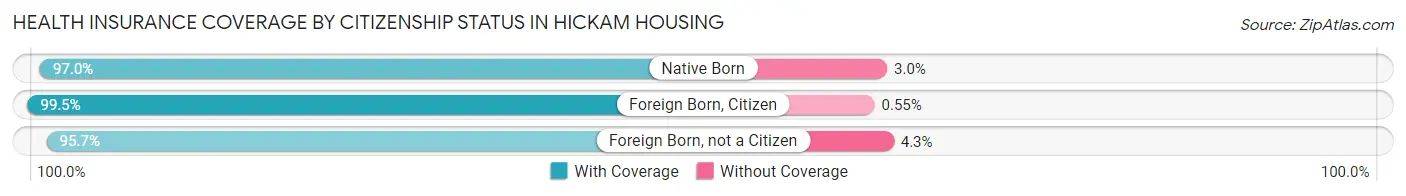
| Citizenship Status | With Coverage | Without Coverage |
| Native Born | 1,161 (97.0%) | 36 (3.0%) |
| Foreign Born, Citizen | 2,187 (99.5%) | 12 (0.5%) |
| Foreign Born, not a Citizen | 532 (95.7%) | 24 (4.3%) |
Health Insurance Coverage by Household Income in Hickam Housing
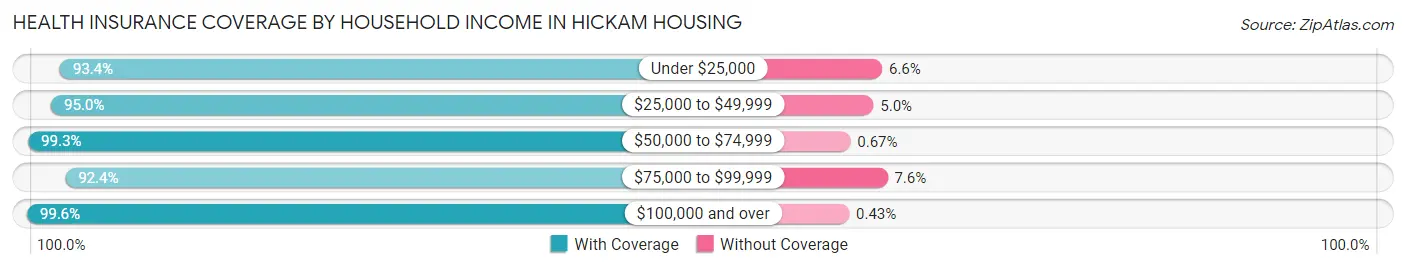
| Household Income | With Coverage | Without Coverage |
| Under $25,000 | 99 (93.4%) | 7 (6.6%) |
| $25,000 to $49,999 | 535 (95.0%) | 28 (5.0%) |
| $50,000 to $74,999 | 888 (99.3%) | 6 (0.7%) |
| $75,000 to $99,999 | 885 (92.4%) | 73 (7.6%) |
| $100,000 and over | 4,156 (99.6%) | 18 (0.4%) |
Public vs Private Health Insurance Coverage by Age in Hickam Housing
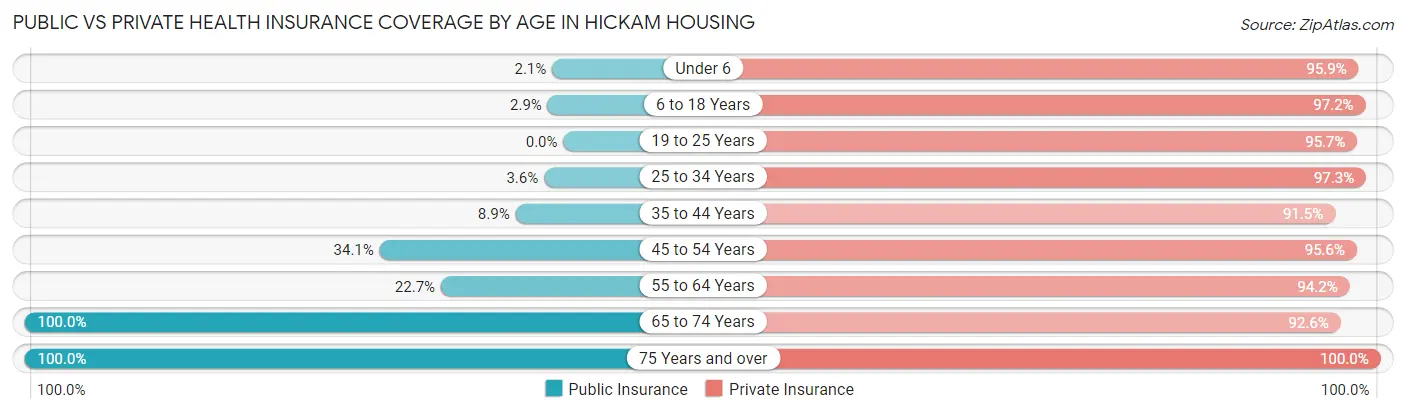
| Age Bracket | Public Insurance | Private Insurance |
| Under 6 | 25 (2.1%) | 1,148 (95.9%) |
| 6 to 18 Years | 64 (2.9%) | 2,137 (97.2%) |
| 19 to 25 Years | 0 (0.0%) | 532 (95.7%) |
| 25 to 34 Years | 33 (3.6%) | 897 (97.3%) |
| 35 to 44 Years | 85 (8.9%) | 876 (91.5%) |
| 45 to 54 Years | 147 (34.1%) | 412 (95.6%) |
| 55 to 64 Years | 75 (22.7%) | 311 (94.2%) |
| 65 to 74 Years | 81 (100.0%) | 75 (92.6%) |
| 75 Years and over | 26 (100.0%) | 26 (100.0%) |
| Total | 536 (8.0%) | 6,414 (95.8%) |
Disability Status by Sex by Age in Hickam Housing
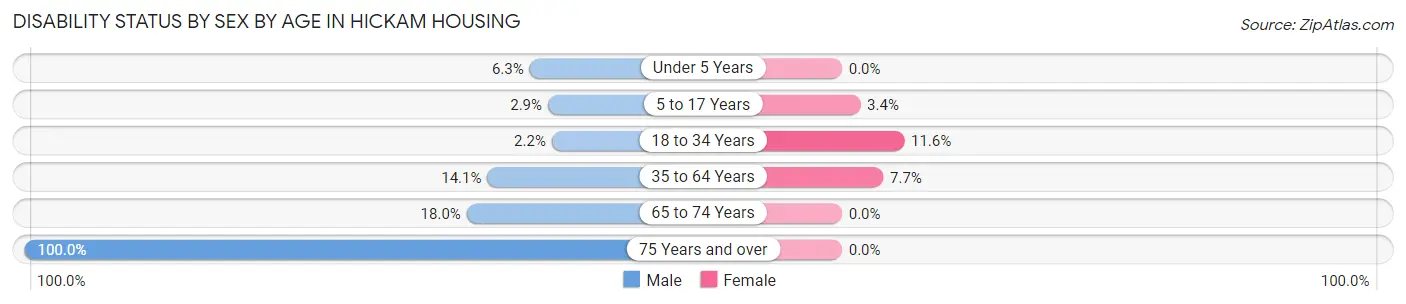
| Age Bracket | Male | Female |
| Under 5 Years | 37 (6.3%) | 0 (0.0%) |
| 5 to 17 Years | 34 (2.9%) | 37 (3.4%) |
| 18 to 34 Years | 12 (2.1%) | 114 (11.6%) |
| 35 to 64 Years | 75 (14.1%) | 91 (7.7%) |
| 65 to 74 Years | 7 (17.9%) | 0 (0.0%) |
| 75 Years and over | 13 (100.0%) | 0 (0.0%) |
Disability Class by Sex by Age in Hickam Housing
Disability Class: Hearing Difficulty
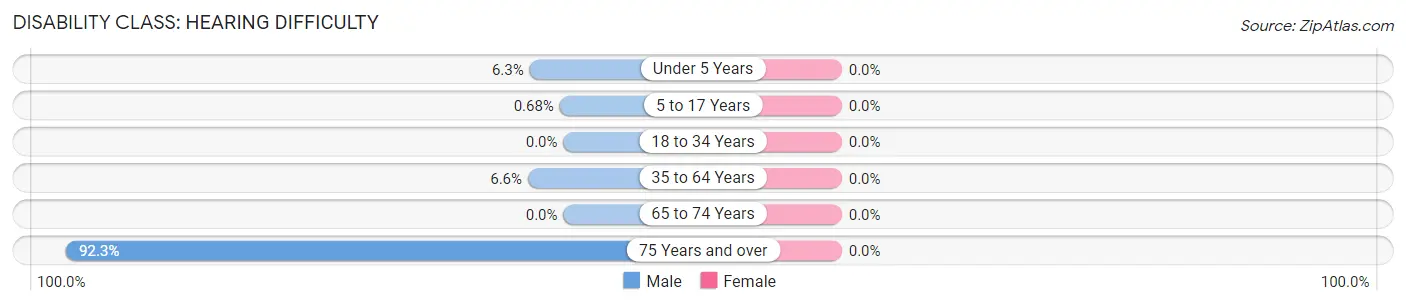
| Age Bracket | Male | Female |
| Under 5 Years | 37 (6.3%) | 0 (0.0%) |
| 5 to 17 Years | 8 (0.7%) | 0 (0.0%) |
| 18 to 34 Years | 0 (0.0%) | 0 (0.0%) |
| 35 to 64 Years | 35 (6.6%) | 0 (0.0%) |
| 65 to 74 Years | 0 (0.0%) | 0 (0.0%) |
| 75 Years and over | 12 (92.3%) | 0 (0.0%) |
Disability Class: Vision Difficulty
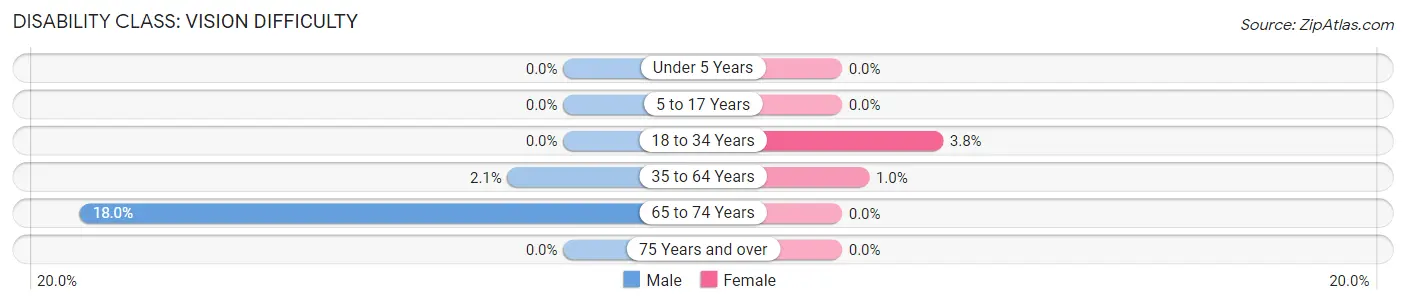
| Age Bracket | Male | Female |
| Under 5 Years | 0 (0.0%) | 0 (0.0%) |
| 5 to 17 Years | 0 (0.0%) | 0 (0.0%) |
| 18 to 34 Years | 0 (0.0%) | 37 (3.7%) |
| 35 to 64 Years | 11 (2.1%) | 12 (1.0%) |
| 65 to 74 Years | 7 (17.9%) | 0 (0.0%) |
| 75 Years and over | 0 (0.0%) | 0 (0.0%) |
Disability Class: Cognitive Difficulty
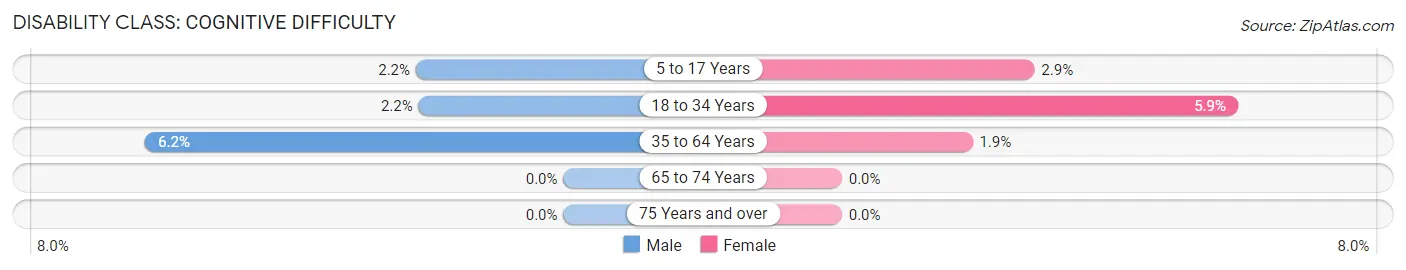
| Age Bracket | Male | Female |
| 5 to 17 Years | 26 (2.2%) | 31 (2.9%) |
| 18 to 34 Years | 12 (2.1%) | 58 (5.9%) |
| 35 to 64 Years | 33 (6.2%) | 23 (1.9%) |
| 65 to 74 Years | 0 (0.0%) | 0 (0.0%) |
| 75 Years and over | 0 (0.0%) | 0 (0.0%) |
Disability Class: Ambulatory Difficulty
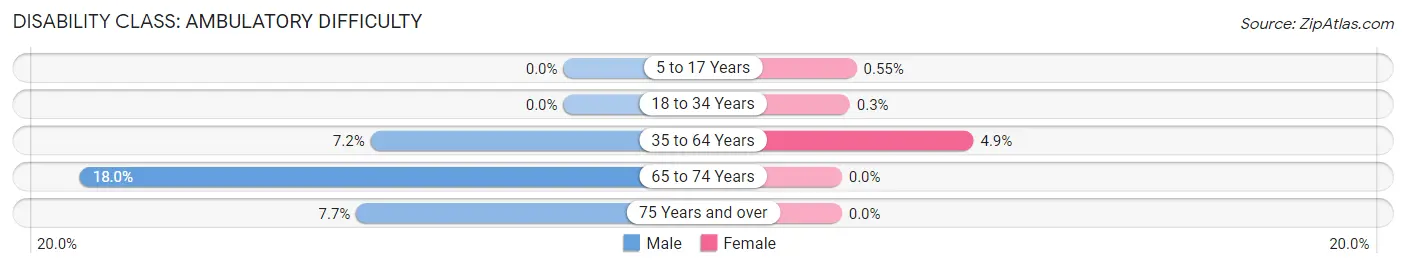
| Age Bracket | Male | Female |
| 5 to 17 Years | 0 (0.0%) | 6 (0.5%) |
| 18 to 34 Years | 0 (0.0%) | 3 (0.3%) |
| 35 to 64 Years | 38 (7.2%) | 58 (4.9%) |
| 65 to 74 Years | 7 (17.9%) | 0 (0.0%) |
| 75 Years and over | 1 (7.7%) | 0 (0.0%) |
Disability Class: Self-Care Difficulty
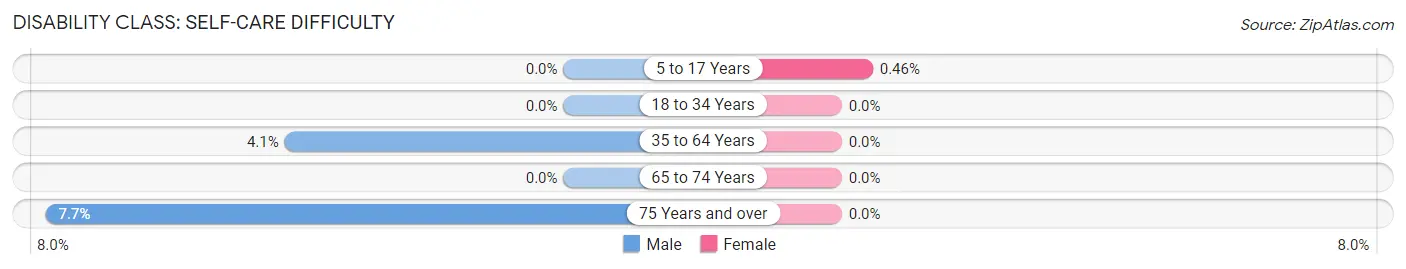
| Age Bracket | Male | Female |
| 5 to 17 Years | 0 (0.0%) | 5 (0.5%) |
| 18 to 34 Years | 0 (0.0%) | 0 (0.0%) |
| 35 to 64 Years | 22 (4.1%) | 0 (0.0%) |
| 65 to 74 Years | 0 (0.0%) | 0 (0.0%) |
| 75 Years and over | 1 (7.7%) | 0 (0.0%) |
Technology Access in Hickam Housing
Computing Device Access in Hickam Housing
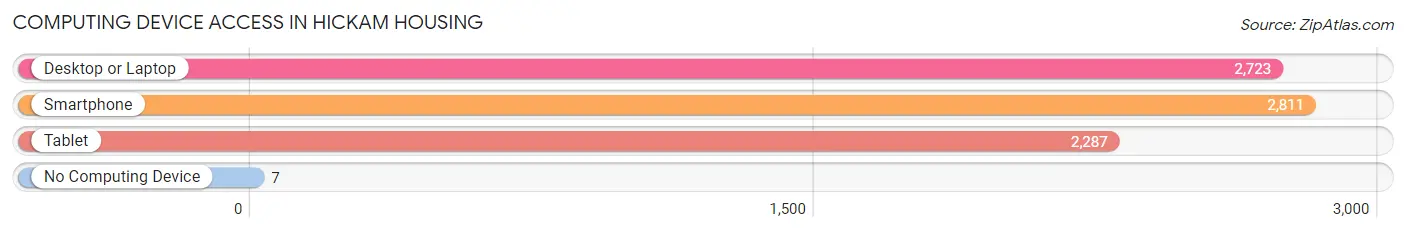
| Device Type | # Households | % Households |
| Desktop or Laptop | 2,723 | 95.9% |
| Smartphone | 2,811 | 99.0% |
| Tablet | 2,287 | 80.6% |
| No Computing Device | 7 | 0.3% |
| Total | 2,839 | 100.0% |
Internet Access in Hickam Housing
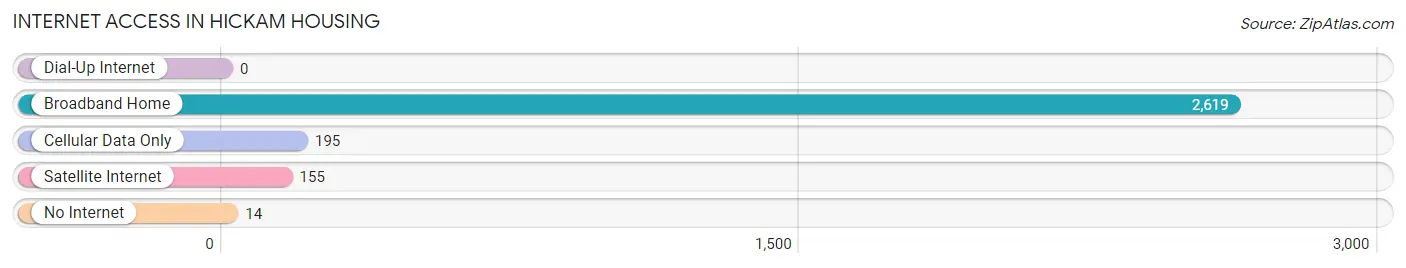
| Internet Type | # Households | % Households |
| Dial-Up Internet | 0 | 0.0% |
| Broadband Home | 2,619 | 92.2% |
| Cellular Data Only | 195 | 6.9% |
| Satellite Internet | 155 | 5.5% |
| No Internet | 14 | 0.5% |
| Total | 2,839 | 100.0% |
Hickam Housing Summary
Hickam Housing, HI is a residential area located on the island of Oahu in the state of Hawaii. It is part of the Honolulu metropolitan area and is located near the Honolulu International Airport. The area is home to a large military population, as it is located near the Joint Base Pearl Harbor-Hickam. The area is also home to a variety of businesses, restaurants, and other amenities.
History
Hickam Housing, HI was originally part of the Hawaiian Kingdom, and was annexed by the United States in 1898. The area was used as a military base during World War II, and was the site of the attack on Pearl Harbor. After the war, the area was developed into a residential area for military personnel and their families. The area was officially designated as Hickam Housing in 1954.
Geography
Hickam Housing, HI is located on the island of Oahu, which is the third largest island in the Hawaiian archipelago. The area is located near the Honolulu International Airport and is bordered by the Pacific Ocean to the east and Pearl Harbor to the west. The area is mostly flat, with some hills in the northern part of the area. The climate is tropical, with temperatures ranging from the mid-70s to the mid-80s year-round.
Economy
Hickam Housing, HI is primarily a residential area, but it is also home to a variety of businesses and services. The area is home to a number of restaurants, retail stores, and other amenities. The area is also home to a number of military-related businesses, such as the Joint Base Pearl Harbor-Hickam. The area is also home to a number of government offices, such as the U.S. Department of Defense and the U.S. Navy.
Demographics
As of the 2010 census, the population of Hickam Housing, HI was 8,919. The population is primarily made up of military personnel and their families. The median age of the population is 33.7 years, and the median household income is $50,945. The area is predominantly white, with a small percentage of African Americans, Asians, and Native Americans. The area is also home to a large number of military personnel, with over 4,000 active duty personnel living in the area.
Common Questions
What is Per Capita Income in Hickam Housing?
Per Capita income in Hickam Housing is $35,409.
What is the Median Family Income in Hickam Housing?
Median Family Income in Hickam Housing is $121,513.
What is the Median Household income in Hickam Housing?
Median Household Income in Hickam Housing is $111,139.
What is Income or Wage Gap in Hickam Housing?
Income or Wage Gap in Hickam Housing is 53.7%.
Women in Hickam Housing earn 46.3 cents for every dollar earned by a man.
What is Inequality or Gini Index in Hickam Housing?
Inequality or Gini Index in Hickam Housing is 0.29.
What is the Total Population of Hickam Housing?
Total Population of Hickam Housing is 9,502.
What is the Total Male Population of Hickam Housing?
Total Male Population of Hickam Housing is 5,137.
What is the Total Female Population of Hickam Housing?
Total Female Population of Hickam Housing is 4,365.
What is the Ratio of Males per 100 Females in Hickam Housing?
There are 117.69 Males per 100 Females in Hickam Housing.
What is the Ratio of Females per 100 Males in Hickam Housing?
There are 84.97 Females per 100 Males in Hickam Housing.
What is the Median Population Age in Hickam Housing?
Median Population Age in Hickam Housing is 26.1 Years.
What is the Average Family Size in Hickam Housing
Average Family Size in Hickam Housing is 3.5 People.
What is the Average Household Size in Hickam Housing
Average Household Size in Hickam Housing is 3.2 People.
How Large is the Labor Force in Hickam Housing?
There are 5,094 People in the Labor Forcein in Hickam Housing.
What is the Percentage of People in the Labor Force in Hickam Housing?
80.3% of People are in the Labor Force in Hickam Housing.
What is the Unemployment Rate in Hickam Housing?
Unemployment Rate in Hickam Housing is 9.9%.