Mountain Home AFB, ID Map & Demographics
Mountain Home AFB Map
Mountain Home AFB Overview
$25,485
PER CAPITA INCOME
$62,361
AVG FAMILY INCOME
$60,764
AVG HOUSEHOLD INCOME
26.4%
WAGE / INCOME GAP [ % ]
73.6¢/ $1
WAGE / INCOME GAP [ $ ]
0.36
INEQUALITY / GINI INDEX
3,184
TOTAL POPULATION
2,040
MALE POPULATION
1,144
FEMALE POPULATION
178.32
MALES / 100 FEMALES
56.08
FEMALES / 100 MALES
23.0
MEDIAN AGE
3.0
AVG FAMILY SIZE
2.9
AVG HOUSEHOLD SIZE
1,910
LABOR FORCE [ PEOPLE ]
82.1%
PERCENT IN LABOR FORCE
9.5%
UNEMPLOYMENT RATE
Mountain Home AFB Zip Codes
Mountain Home AFB Area Codes
Income in Mountain Home AFB
Income Overview in Mountain Home AFB
Per Capita Income in Mountain Home AFB is $25,485, while median incomes of families and households are $62,361 and $60,764 respectively.
| Characteristic | Number | Measure |
| Per Capita Income | 3,184 | $25,485 |
| Median Family Income | 802 | $62,361 |
| Mean Family Income | 802 | $78,036 |
| Median Household Income | 853 | $60,764 |
| Mean Household Income | 853 | $76,411 |
| Income Deficit | 802 | $0 |
| Wage / Income Gap (%) | 3,184 | 26.42% |
| Wage / Income Gap ($) | 3,184 | 73.58¢ per $1 |
| Gini / Inequality Index | 3,184 | 0.36 |
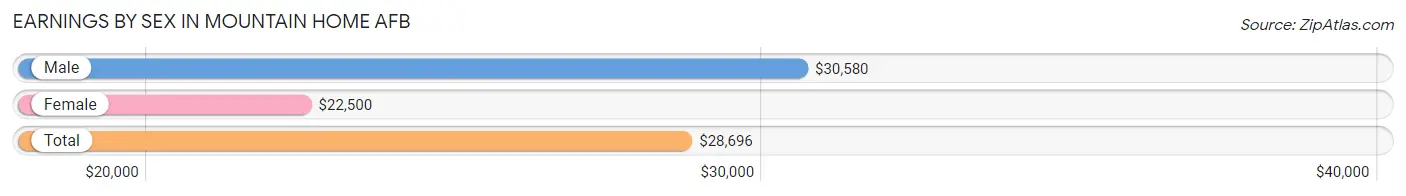
Earnings by Sex in Mountain Home AFB
Average Earnings in Mountain Home AFB are $28,696, $30,580 for men and $22,500 for women, a difference of 26.4%.
| Sex | Number | Average Earnings |
| Male | 1,498 (75.6%) | $30,580 |
| Female | 484 (24.4%) | $22,500 |
| Total | 1,982 (100.0%) | $28,696 |
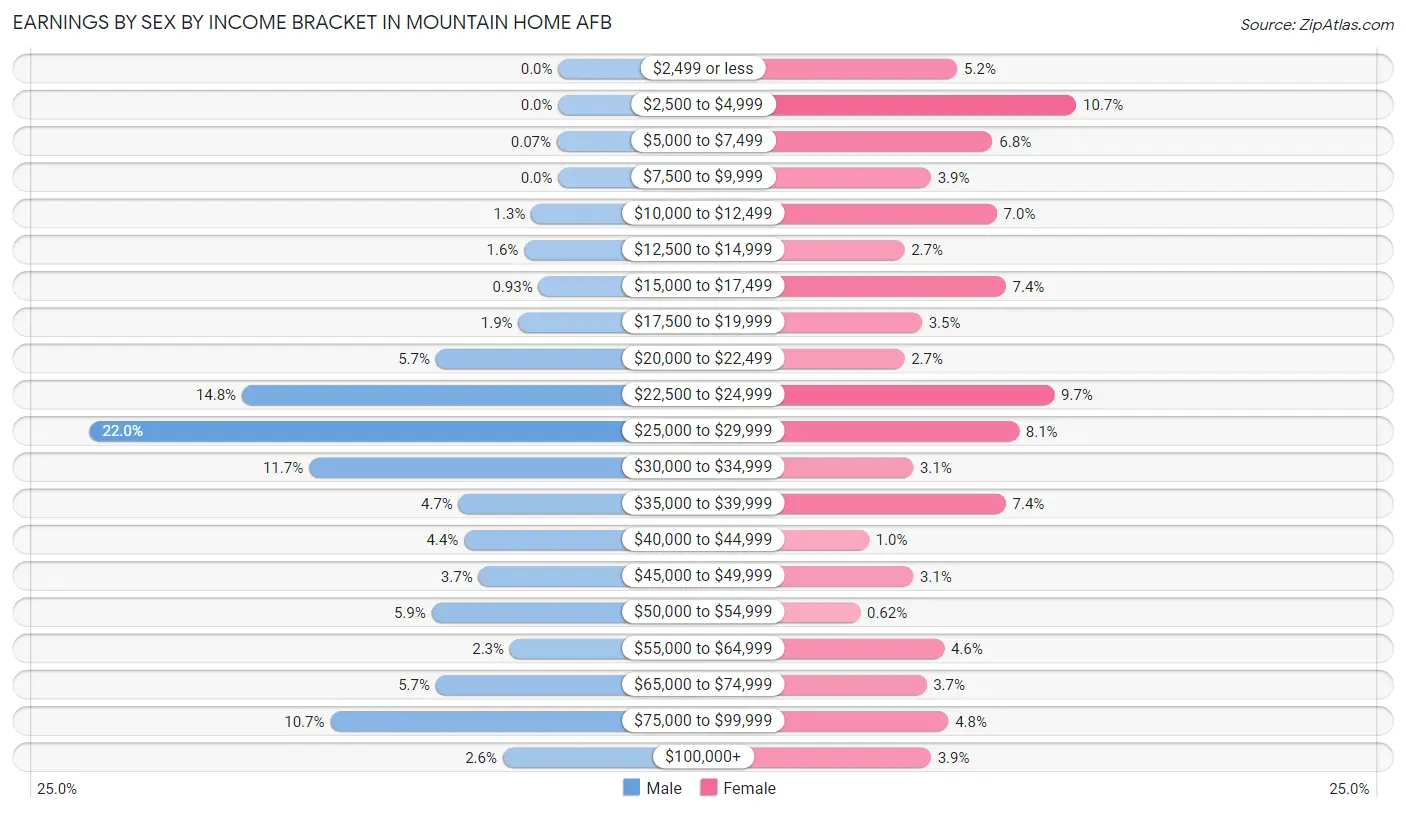
Earnings by Sex by Income Bracket in Mountain Home AFB
The most common earnings brackets in Mountain Home AFB are $25,000 to $29,999 for men (329 | 22.0%) and $2,500 to $4,999 for women (52 | 10.7%).
| Income | Male | Female |
| $2,499 or less | 0 (0.0%) | 25 (5.2%) |
| $2,500 to $4,999 | 0 (0.0%) | 52 (10.7%) |
| $5,000 to $7,499 | 1 (0.1%) | 33 (6.8%) |
| $7,500 to $9,999 | 0 (0.0%) | 19 (3.9%) |
| $10,000 to $12,499 | 19 (1.3%) | 34 (7.0%) |
| $12,500 to $14,999 | 24 (1.6%) | 13 (2.7%) |
| $15,000 to $17,499 | 14 (0.9%) | 36 (7.4%) |
| $17,500 to $19,999 | 28 (1.9%) | 17 (3.5%) |
| $20,000 to $22,499 | 86 (5.7%) | 13 (2.7%) |
| $22,500 to $24,999 | 222 (14.8%) | 47 (9.7%) |
| $25,000 to $29,999 | 329 (22.0%) | 39 (8.1%) |
| $30,000 to $34,999 | 175 (11.7%) | 15 (3.1%) |
| $35,000 to $39,999 | 70 (4.7%) | 36 (7.4%) |
| $40,000 to $44,999 | 66 (4.4%) | 5 (1.0%) |
| $45,000 to $49,999 | 56 (3.7%) | 15 (3.1%) |
| $50,000 to $54,999 | 89 (5.9%) | 3 (0.6%) |
| $55,000 to $64,999 | 34 (2.3%) | 22 (4.5%) |
| $65,000 to $74,999 | 86 (5.7%) | 18 (3.7%) |
| $75,000 to $99,999 | 160 (10.7%) | 23 (4.8%) |
| $100,000+ | 39 (2.6%) | 19 (3.9%) |
| Total | 1,498 (100.0%) | 484 (100.0%) |
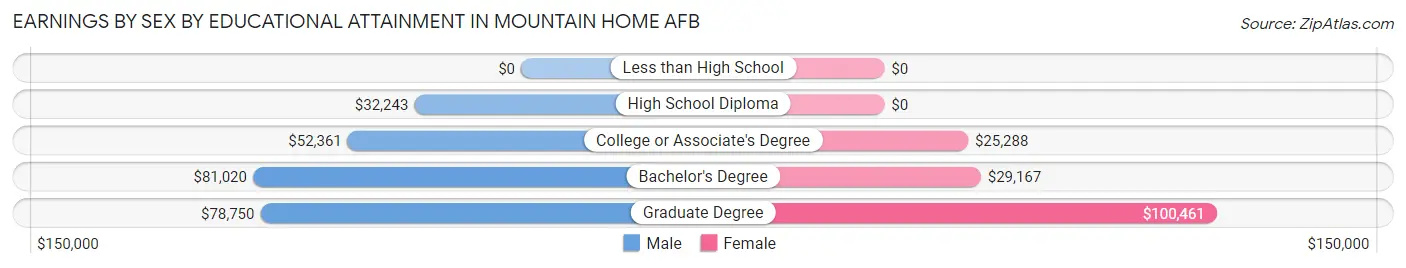
Earnings by Sex by Educational Attainment in Mountain Home AFB
Average earnings in Mountain Home AFB are $53,333 for men and $26,827 for women, a difference of 49.7%. Men with an educational attainment of bachelor's degree enjoy the highest average annual earnings of $81,020, while those with high school diploma education earn the least with $32,243. Women with an educational attainment of graduate degree earn the most with the average annual earnings of $100,461, while those with college or associate's degree education have the smallest earnings of $25,288.
| Educational Attainment | Male Income | Female Income |
| Less than High School | - | - |
| High School Diploma | $32,243 | $0 |
| College or Associate's Degree | $52,361 | $25,288 |
| Bachelor's Degree | $81,020 | $29,167 |
| Graduate Degree | $78,750 | $100,461 |
| Total | $53,333 | $26,827 |
Family Income in Mountain Home AFB
Family Income Brackets in Mountain Home AFB
According to the Mountain Home AFB family income data, there are 190 families falling into the $75,000 to $99,999 income range, which is the most common income bracket and makes up 23.7% of all families. Conversely, the $15,000 to $24,999 income bracket is the least frequent group with only 9 families (1.1%) belonging to this category.
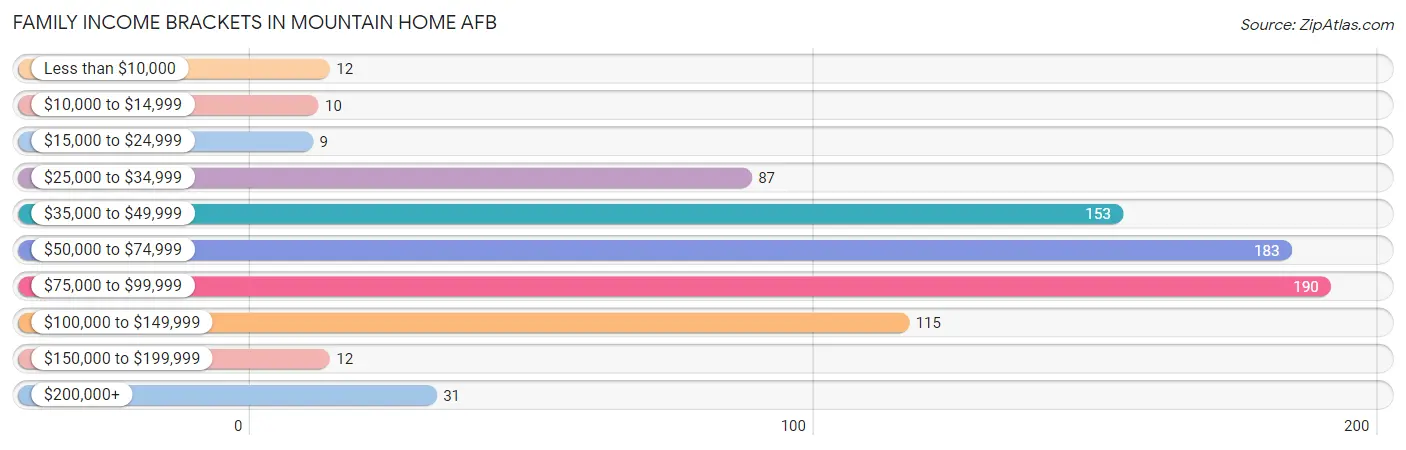
| Income Bracket | # Families | % Families |
| Less than $10,000 | 12 | 1.5% |
| $10,000 to $14,999 | 10 | 1.2% |
| $15,000 to $24,999 | 9 | 1.1% |
| $25,000 to $34,999 | 87 | 10.8% |
| $35,000 to $49,999 | 153 | 19.1% |
| $50,000 to $74,999 | 183 | 22.8% |
| $75,000 to $99,999 | 190 | 23.7% |
| $100,000 to $149,999 | 115 | 14.3% |
| $150,000 to $199,999 | 12 | 1.5% |
| $200,000+ | 31 | 3.9% |
Family Income by Famaliy Size in Mountain Home AFB
4-person families (303 | 37.8%) account for the highest median family income in Mountain Home AFB with $85,625 per family, while 4-person families (303 | 37.8%) have the highest median income of $21,406 per family member.
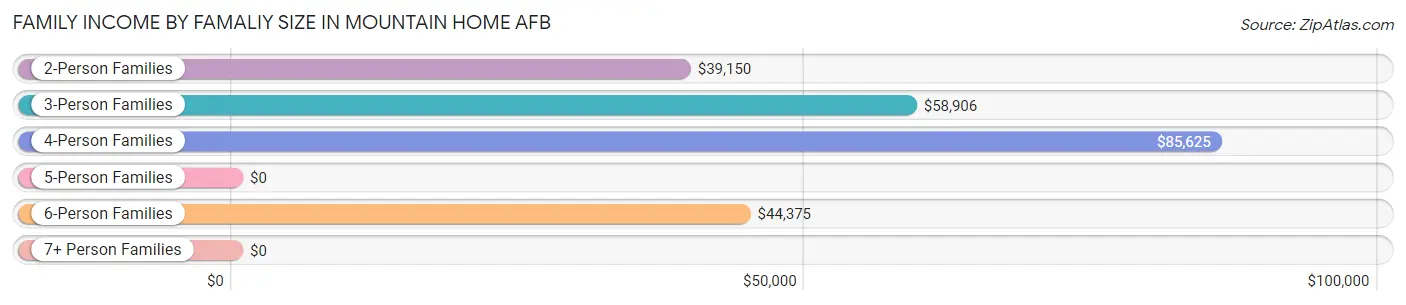
| Income Bracket | # Families | Median Income |
| 2-Person Families | 221 (27.6%) | $39,150 |
| 3-Person Families | 171 (21.3%) | $58,906 |
| 4-Person Families | 303 (37.8%) | $85,625 |
| 5-Person Families | 53 (6.6%) | $0 |
| 6-Person Families | 50 (6.2%) | $44,375 |
| 7+ Person Families | 4 (0.5%) | $0 |
| Total | 802 (100.0%) | $62,361 |
Family Income by Number of Earners in Mountain Home AFB
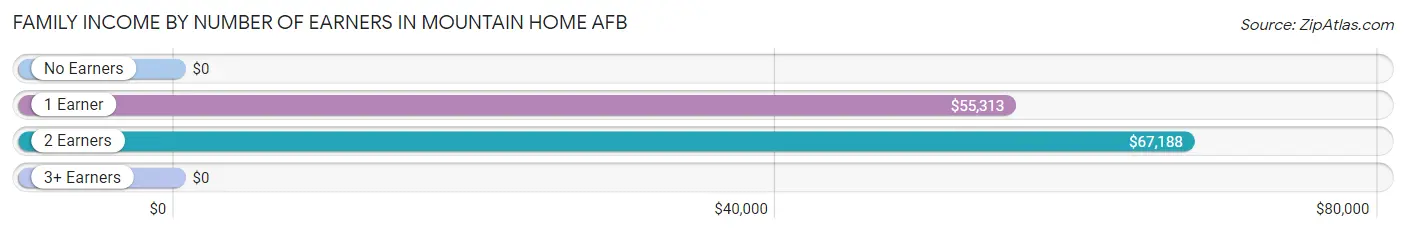
| Number of Earners | # Families | Median Income |
| No Earners | 8 (1.0%) | $0 |
| 1 Earner | 351 (43.8%) | $55,313 |
| 2 Earners | 432 (53.9%) | $67,188 |
| 3+ Earners | 11 (1.4%) | $0 |
| Total | 802 (100.0%) | $62,361 |
Household Income in Mountain Home AFB
Household Income Brackets in Mountain Home AFB
With 204 households falling in the category, the $75,000 to $99,999 income range is the most frequent in Mountain Home AFB, accounting for 23.9% of all households. In contrast, only 9 households (1.1%) fall into the $15,000 to $24,999 income bracket, making it the least populous group.
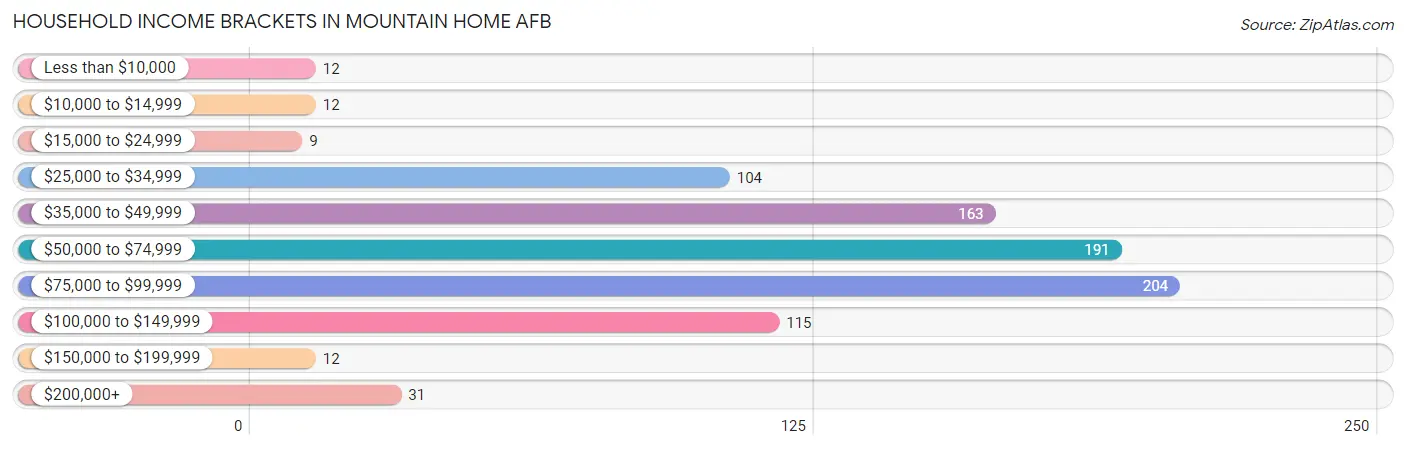
| Income Bracket | # Households | % Households |
| Less than $10,000 | 12 | 1.4% |
| $10,000 to $14,999 | 12 | 1.4% |
| $15,000 to $24,999 | 9 | 1.1% |
| $25,000 to $34,999 | 104 | 12.2% |
| $35,000 to $49,999 | 163 | 19.1% |
| $50,000 to $74,999 | 191 | 22.4% |
| $75,000 to $99,999 | 204 | 23.9% |
| $100,000 to $149,999 | 115 | 13.5% |
| $150,000 to $199,999 | 12 | 1.4% |
| $200,000+ | 31 | 3.6% |
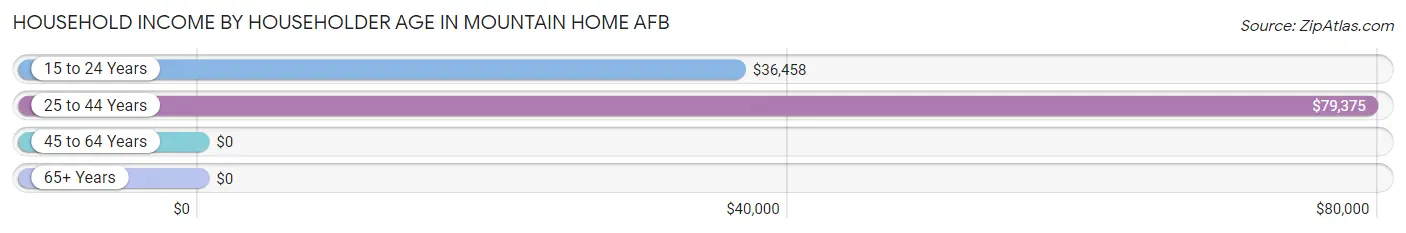
Household Income by Householder Age in Mountain Home AFB
The median household income in Mountain Home AFB is $60,764, with the highest median household income of $79,375 found in the 25 to 44 years age bracket for the primary householder. A total of 667 households (78.2%) fall into this category. Meanwhile, the 45 to 64 years age bracket for the primary householder has the lowest median household income of $0, with 6 households (0.7%) in this group.
| Income Bracket | # Households | Median Income |
| 15 to 24 Years | 180 (21.1%) | $36,458 |
| 25 to 44 Years | 667 (78.2%) | $79,375 |
| 45 to 64 Years | 6 (0.7%) | $0 |
| 65+ Years | 0 (0.0%) | $0 |
| Total | 853 (100.0%) | $60,764 |
Poverty in Mountain Home AFB
Income Below Poverty by Sex and Age in Mountain Home AFB
With 4.6% poverty level for males and 5.4% for females among the residents of Mountain Home AFB, 16 and 17 year old males and 6 to 11 year old females are the most vulnerable to poverty, with 4 males (100.0%) and 16 females (12.9%) in their respective age groups living below the poverty level.
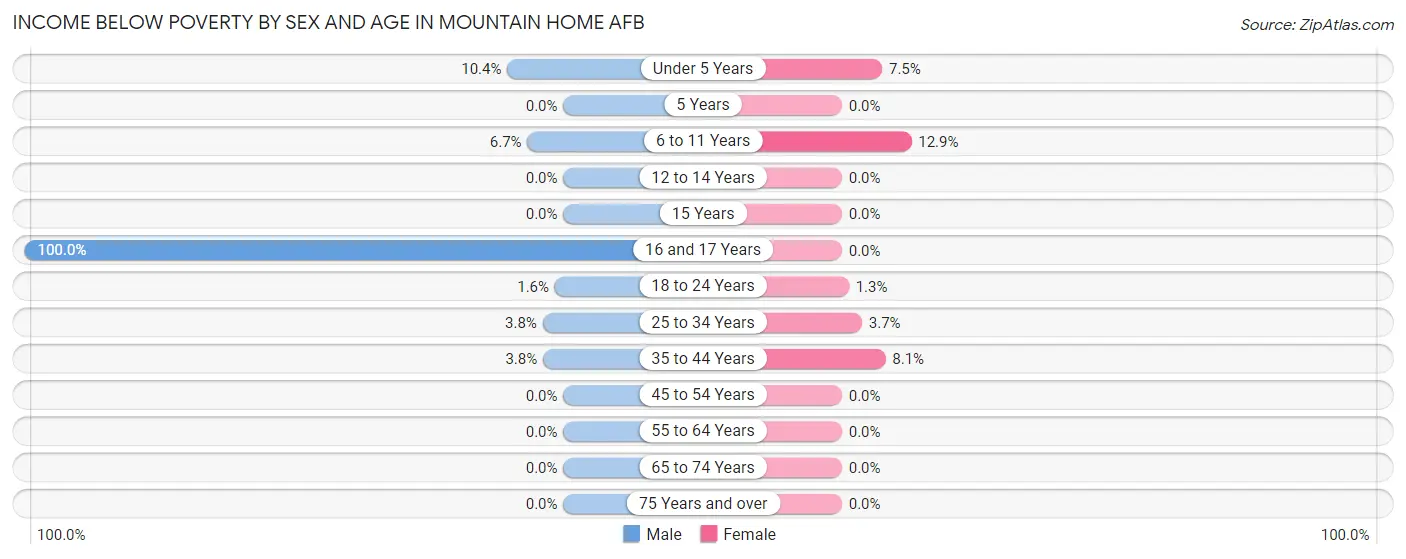
| Age Bracket | Male | Female |
| Under 5 Years | 21 (10.4%) | 13 (7.5%) |
| 5 Years | 0 (0.0%) | 0 (0.0%) |
| 6 to 11 Years | 12 (6.7%) | 16 (12.9%) |
| 12 to 14 Years | 0 (0.0%) | 0 (0.0%) |
| 15 Years | 0 (0.0%) | 0 (0.0%) |
| 16 and 17 Years | 4 (100.0%) | 0 (0.0%) |
| 18 to 24 Years | 4 (1.6%) | 2 (1.3%) |
| 25 to 34 Years | 18 (3.8%) | 15 (3.7%) |
| 35 to 44 Years | 5 (3.8%) | 11 (8.1%) |
| 45 to 54 Years | 0 (0.0%) | 0 (0.0%) |
| 55 to 64 Years | 0 (0.0%) | 0 (0.0%) |
| 65 to 74 Years | 0 (0.0%) | 0 (0.0%) |
| 75 Years and over | 0 (0.0%) | 0 (0.0%) |
| Total | 64 (4.6%) | 57 (5.4%) |
Income Above Poverty by Sex and Age in Mountain Home AFB
According to the poverty statistics in Mountain Home AFB, males aged 5 years and females aged 5 years are the age groups that are most secure financially, with 100.0% of males and 100.0% of females in these age groups living above the poverty line.
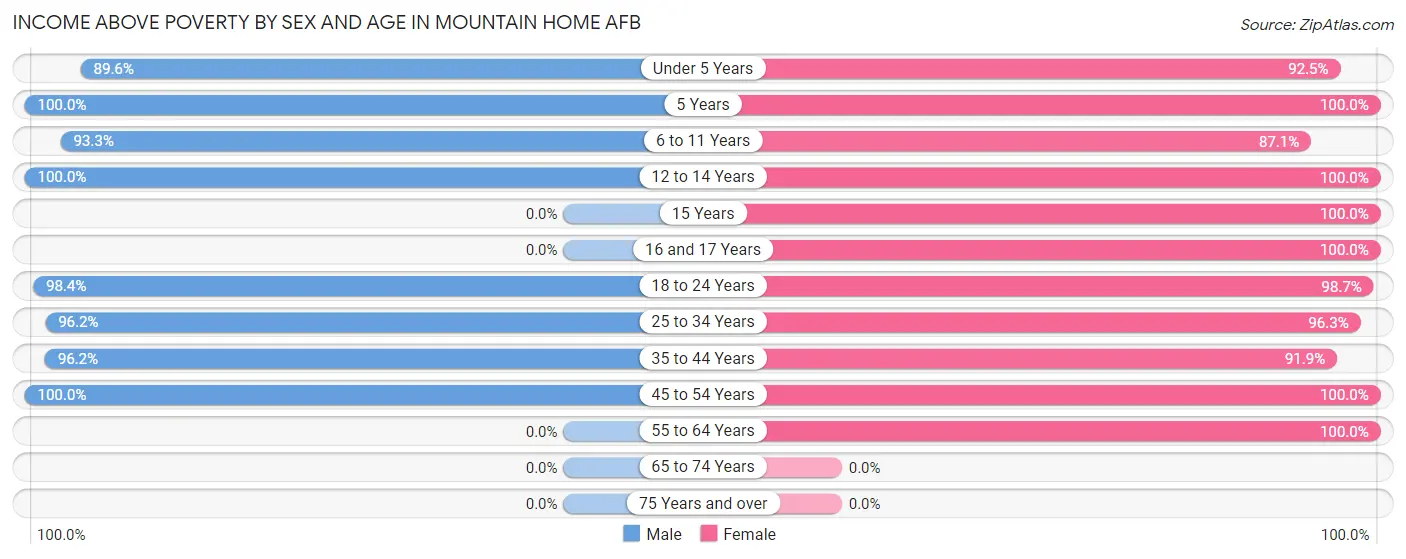
| Age Bracket | Male | Female |
| Under 5 Years | 181 (89.6%) | 161 (92.5%) |
| 5 Years | 68 (100.0%) | 15 (100.0%) |
| 6 to 11 Years | 168 (93.3%) | 108 (87.1%) |
| 12 to 14 Years | 61 (100.0%) | 31 (100.0%) |
| 15 Years | 0 (0.0%) | 3 (100.0%) |
| 16 and 17 Years | 0 (0.0%) | 4 (100.0%) |
| 18 to 24 Years | 249 (98.4%) | 154 (98.7%) |
| 25 to 34 Years | 452 (96.2%) | 387 (96.3%) |
| 35 to 44 Years | 128 (96.2%) | 125 (91.9%) |
| 45 to 54 Years | 6 (100.0%) | 10 (100.0%) |
| 55 to 64 Years | 0 (0.0%) | 7 (100.0%) |
| 65 to 74 Years | 0 (0.0%) | 0 (0.0%) |
| 75 Years and over | 0 (0.0%) | 0 (0.0%) |
| Total | 1,313 (95.4%) | 1,005 (94.6%) |
Income Below Poverty Among Married-Couple Families in Mountain Home AFB
The poverty statistics for married-couple families in Mountain Home AFB show that 2.4% or 18 of the total 745 families live below the poverty line. Families with 3 or 4 children have the highest poverty rate of 6.8%, comprising of 7 families. On the other hand, families with no children have the lowest poverty rate of 0.0%, which includes 0 families.
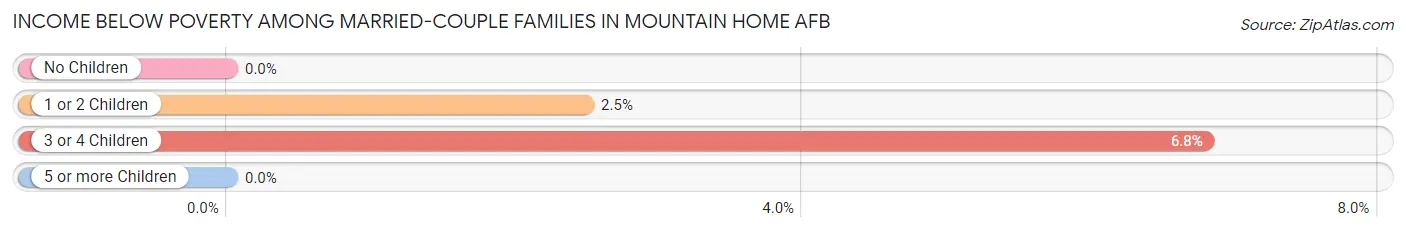
| Children | Above Poverty | Below Poverty |
| No Children | 194 (100.0%) | 0 (0.0%) |
| 1 or 2 Children | 433 (97.5%) | 11 (2.5%) |
| 3 or 4 Children | 96 (93.2%) | 7 (6.8%) |
| 5 or more Children | 4 (100.0%) | 0 (0.0%) |
| Total | 727 (97.6%) | 18 (2.4%) |
Income Below Poverty Among Single-Parent Households in Mountain Home AFB
According to the poverty data in Mountain Home AFB, 20.0% or 5 single-father households and 37.5% or 12 single-mother households are living below the poverty line. Among single-father households, those with 1 or 2 children have the highest poverty rate, with 5 households (100.0%) experiencing poverty. Likewise, among single-mother households, those with 3 or 4 children have the highest poverty rate, with 8 households (100.0%) falling below the poverty line.
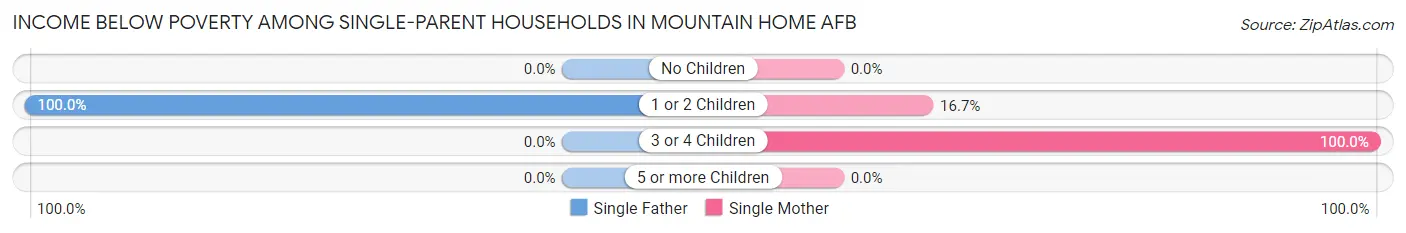
| Children | Single Father | Single Mother |
| No Children | 0 (0.0%) | 0 (0.0%) |
| 1 or 2 Children | 5 (100.0%) | 4 (16.7%) |
| 3 or 4 Children | 0 (0.0%) | 8 (100.0%) |
| 5 or more Children | 0 (0.0%) | 0 (0.0%) |
| Total | 5 (20.0%) | 12 (37.5%) |
Income Below Poverty Among Married-Couple vs Single-Parent Households in Mountain Home AFB
The poverty data for Mountain Home AFB shows that 18 of the married-couple family households (2.4%) and 17 of the single-parent households (29.8%) are living below the poverty level. Within the married-couple family households, those with 3 or 4 children have the highest poverty rate, with 7 households (6.8%) falling below the poverty line. Among the single-parent households, those with 3 or 4 children have the highest poverty rate, with 8 household (100.0%) living below poverty.
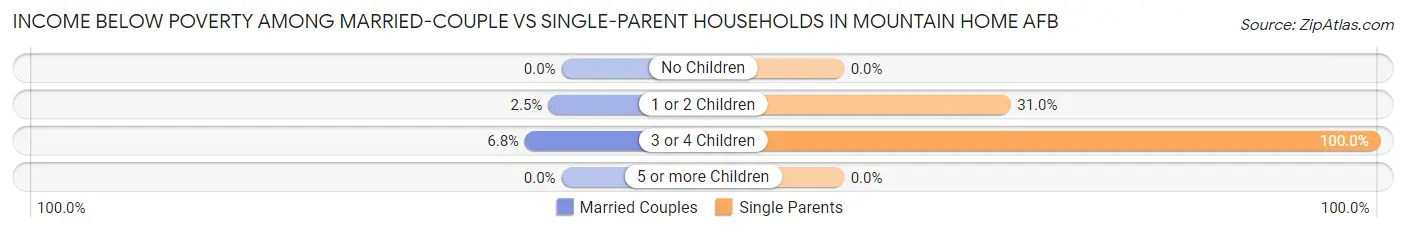
| Children | Married-Couple Families | Single-Parent Households |
| No Children | 0 (0.0%) | 0 (0.0%) |
| 1 or 2 Children | 11 (2.5%) | 9 (31.0%) |
| 3 or 4 Children | 7 (6.8%) | 8 (100.0%) |
| 5 or more Children | 0 (0.0%) | 0 (0.0%) |
| Total | 18 (2.4%) | 17 (29.8%) |
Race in Mountain Home AFB
The most populous races in Mountain Home AFB are White / Caucasian (2,143 | 67.3%), Hispanic or Latino (611 | 19.2%), and Two or more Races (402 | 12.6%).
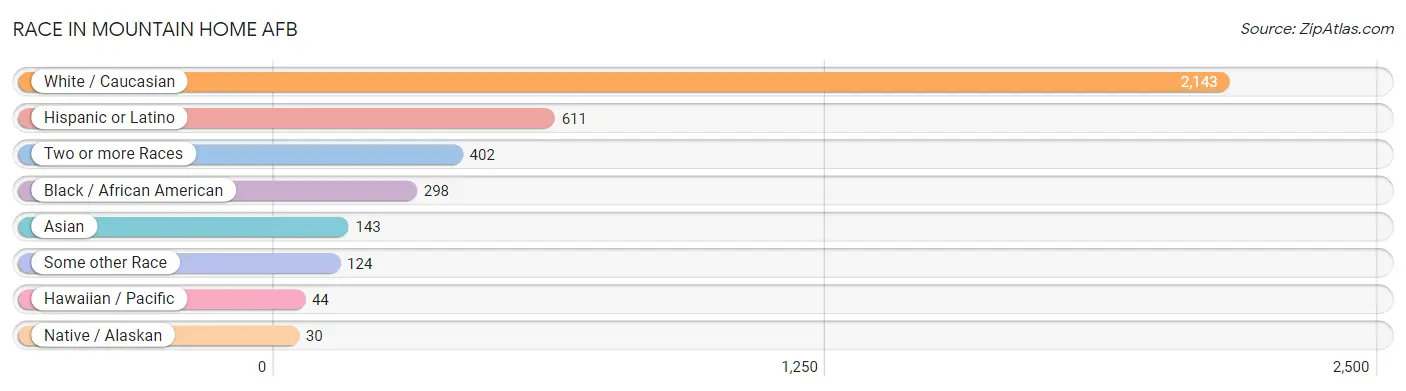
| Race | # Population | % Population |
| Asian | 143 | 4.5% |
| Black / African American | 298 | 9.4% |
| Hawaiian / Pacific | 44 | 1.4% |
| Hispanic or Latino | 611 | 19.2% |
| Native / Alaskan | 30 | 0.9% |
| White / Caucasian | 2,143 | 67.3% |
| Two or more Races | 402 | 12.6% |
| Some other Race | 124 | 3.9% |
| Total | 3,184 | 100.0% |
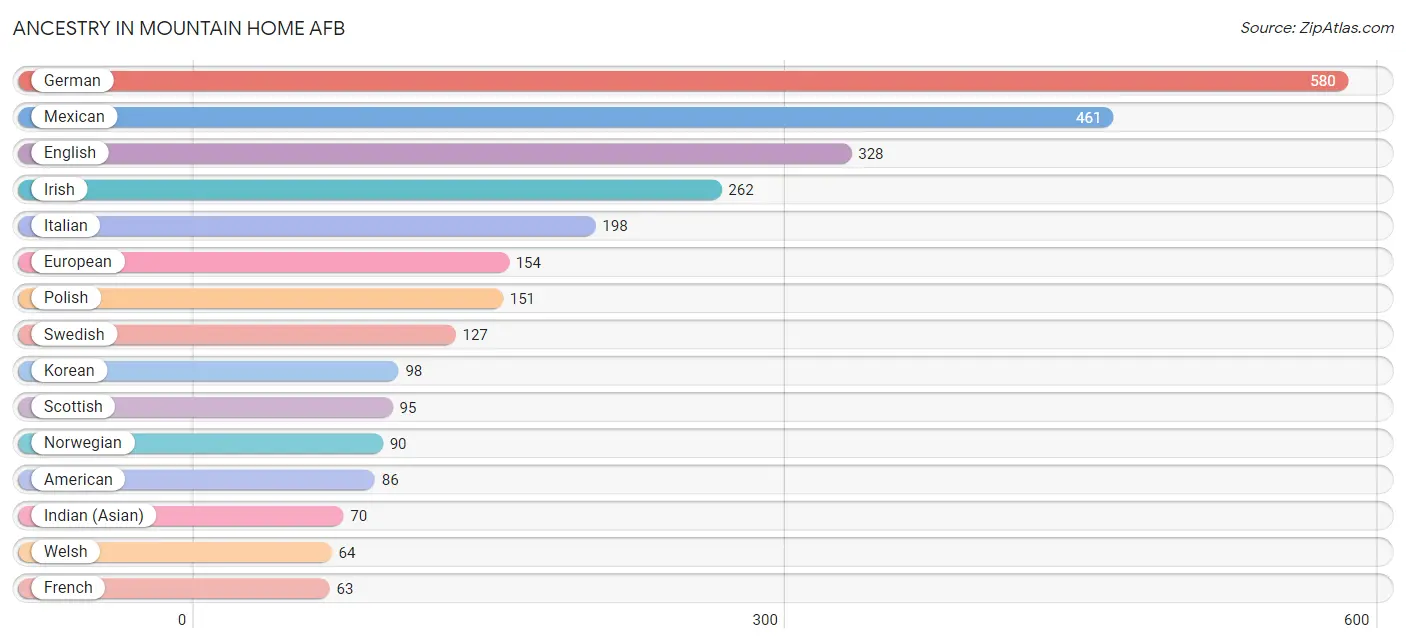
Ancestry in Mountain Home AFB
The most populous ancestries reported in Mountain Home AFB are German (580 | 18.2%), Mexican (461 | 14.5%), English (328 | 10.3%), Irish (262 | 8.2%), and Italian (198 | 6.2%), together accounting for 57.5% of all Mountain Home AFB residents.
| Ancestry | # Population | % Population |
| African | 9 | 0.3% |
| Aleut | 9 | 0.3% |
| American | 86 | 2.7% |
| Apache | 16 | 0.5% |
| Bhutanese | 23 | 0.7% |
| British | 34 | 1.1% |
| Burmese | 10 | 0.3% |
| Central American | 46 | 1.4% |
| Cherokee | 62 | 1.9% |
| Colombian | 10 | 0.3% |
| Croatian | 10 | 0.3% |
| Czech | 5 | 0.2% |
| Danish | 6 | 0.2% |
| Dominican | 9 | 0.3% |
| Dutch | 35 | 1.1% |
| Eastern European | 5 | 0.2% |
| English | 328 | 10.3% |
| European | 154 | 4.8% |
| French | 63 | 2.0% |
| French Canadian | 9 | 0.3% |
| German | 580 | 18.2% |
| Guamanian / Chamorro | 19 | 0.6% |
| Guatemalan | 32 | 1.0% |
| Hungarian | 4 | 0.1% |
| Indian (Asian) | 70 | 2.2% |
| Irish | 262 | 8.2% |
| Italian | 198 | 6.2% |
| Jamaican | 29 | 0.9% |
| Korean | 98 | 3.1% |
| Malaysian | 10 | 0.3% |
| Mexican | 461 | 14.5% |
| Native Hawaiian | 30 | 0.9% |
| Navajo | 2 | 0.1% |
| Nigerian | 14 | 0.4% |
| Norwegian | 90 | 2.8% |
| Okinawan | 15 | 0.5% |
| Pakistani | 23 | 0.7% |
| Panamanian | 14 | 0.4% |
| Polish | 151 | 4.7% |
| Puerto Rican | 63 | 2.0% |
| Romanian | 12 | 0.4% |
| Russian | 11 | 0.4% |
| Samoan | 20 | 0.6% |
| Scandinavian | 8 | 0.3% |
| Scotch-Irish | 9 | 0.3% |
| Scottish | 95 | 3.0% |
| Sioux | 15 | 0.5% |
| South American | 10 | 0.3% |
| Sri Lankan | 4 | 0.1% |
| Subsaharan African | 23 | 0.7% |
| Swedish | 127 | 4.0% |
| Swiss | 6 | 0.2% |
| Thai | 6 | 0.2% |
| Tsimshian | 4 | 0.1% |
| Welsh | 64 | 2.0% |
| Yugoslavian | 8 | 0.3% | View All 56 Rows |
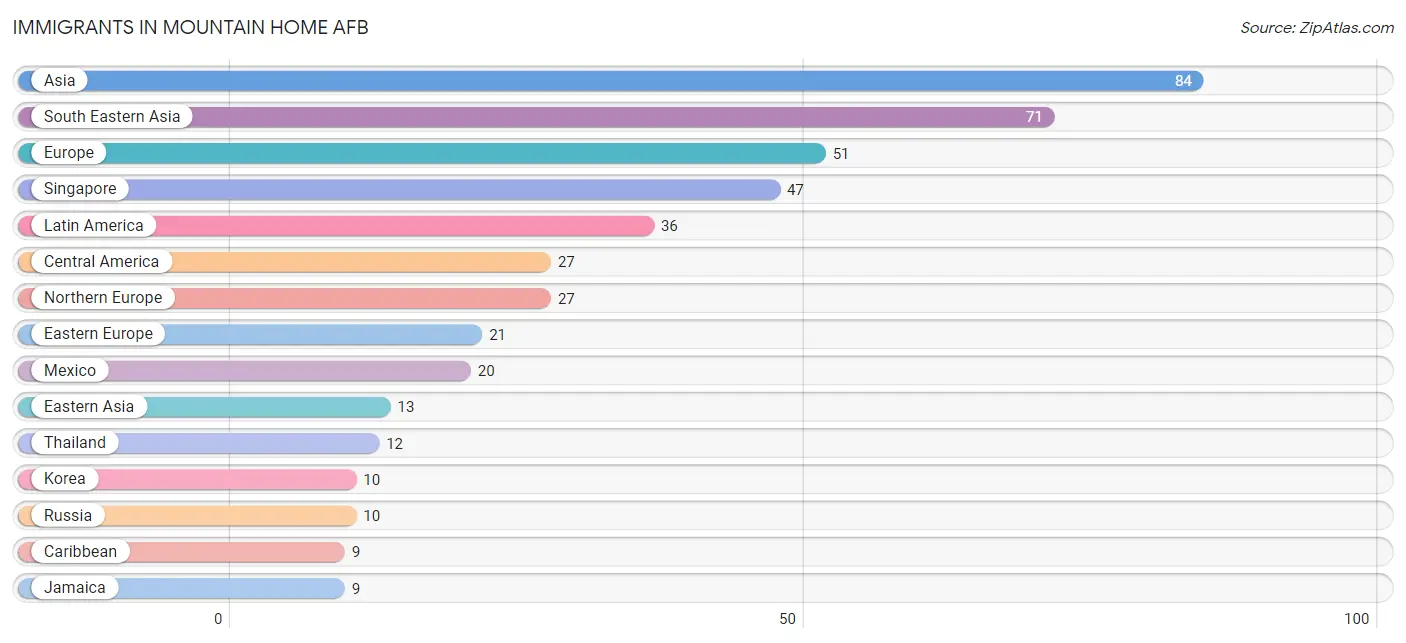
Immigrants in Mountain Home AFB
The most numerous immigrant groups reported in Mountain Home AFB came from Asia (84 | 2.6%), South Eastern Asia (71 | 2.2%), Europe (51 | 1.6%), Singapore (47 | 1.5%), and Latin America (36 | 1.1%), together accounting for 9.1% of all Mountain Home AFB residents.
| Immigration Origin | # Population | % Population |
| Asia | 84 | 2.6% |
| Caribbean | 9 | 0.3% |
| Central America | 27 | 0.9% |
| Eastern Asia | 13 | 0.4% |
| Eastern Europe | 21 | 0.7% |
| England | 5 | 0.2% |
| Europe | 51 | 1.6% |
| Guatemala | 4 | 0.1% |
| Indonesia | 3 | 0.1% |
| Italy | 3 | 0.1% |
| Jamaica | 9 | 0.3% |
| Japan | 3 | 0.1% |
| Korea | 10 | 0.3% |
| Latin America | 36 | 1.1% |
| Mexico | 20 | 0.6% |
| Northern Europe | 27 | 0.9% |
| Panama | 3 | 0.1% |
| Philippines | 9 | 0.3% |
| Russia | 10 | 0.3% |
| Singapore | 47 | 1.5% |
| South Eastern Asia | 71 | 2.2% |
| Southern Europe | 3 | 0.1% |
| Thailand | 12 | 0.4% | View All 23 Rows |
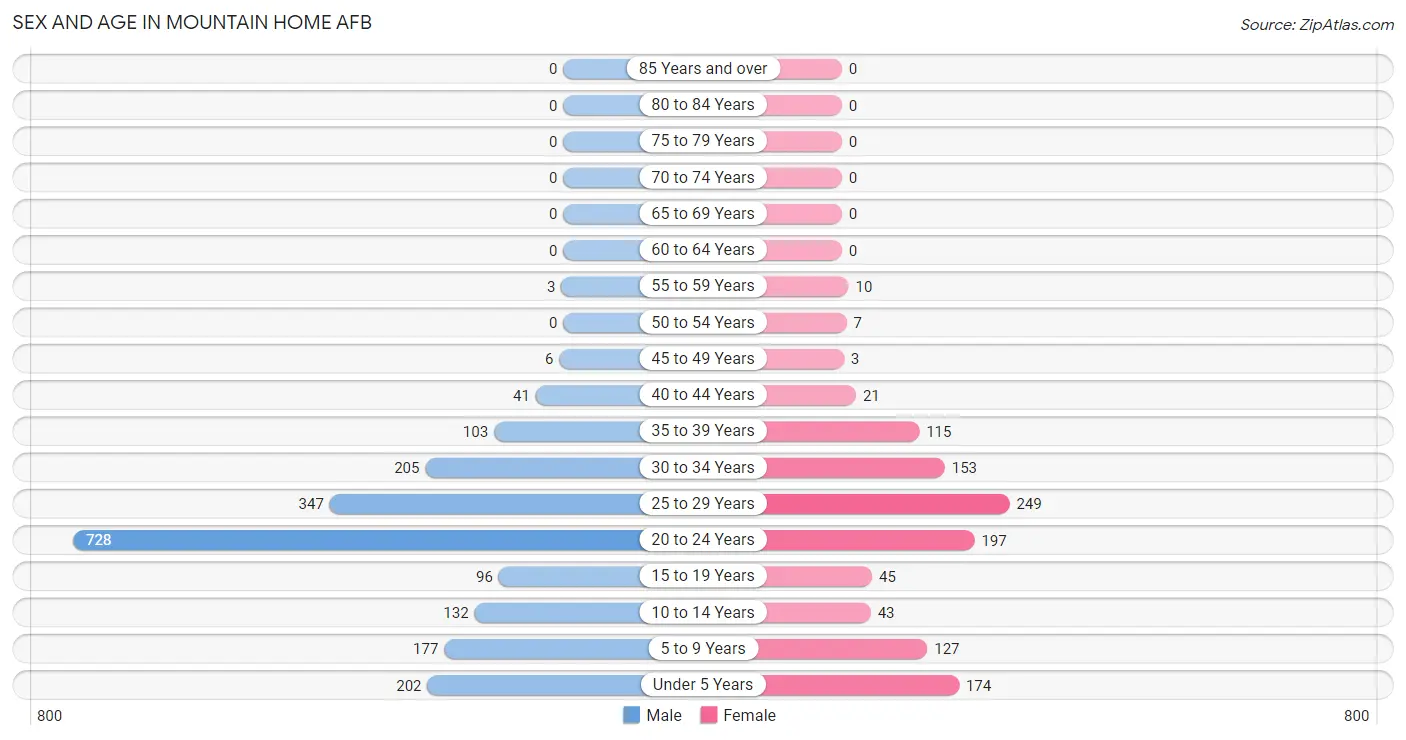
Sex and Age in Mountain Home AFB
Sex and Age in Mountain Home AFB
The most populous age groups in Mountain Home AFB are 20 to 24 Years (728 | 35.7%) for men and 25 to 29 Years (249 | 21.8%) for women.
| Age Bracket | Male | Female |
| Under 5 Years | 202 (9.9%) | 174 (15.2%) |
| 5 to 9 Years | 177 (8.7%) | 127 (11.1%) |
| 10 to 14 Years | 132 (6.5%) | 43 (3.8%) |
| 15 to 19 Years | 96 (4.7%) | 45 (3.9%) |
| 20 to 24 Years | 728 (35.7%) | 197 (17.2%) |
| 25 to 29 Years | 347 (17.0%) | 249 (21.8%) |
| 30 to 34 Years | 205 (10.1%) | 153 (13.4%) |
| 35 to 39 Years | 103 (5.1%) | 115 (10.1%) |
| 40 to 44 Years | 41 (2.0%) | 21 (1.8%) |
| 45 to 49 Years | 6 (0.3%) | 3 (0.3%) |
| 50 to 54 Years | 0 (0.0%) | 7 (0.6%) |
| 55 to 59 Years | 3 (0.2%) | 10 (0.9%) |
| 60 to 64 Years | 0 (0.0%) | 0 (0.0%) |
| 65 to 69 Years | 0 (0.0%) | 0 (0.0%) |
| 70 to 74 Years | 0 (0.0%) | 0 (0.0%) |
| 75 to 79 Years | 0 (0.0%) | 0 (0.0%) |
| 80 to 84 Years | 0 (0.0%) | 0 (0.0%) |
| 85 Years and over | 0 (0.0%) | 0 (0.0%) |
| Total | 2,040 (100.0%) | 1,144 (100.0%) |
Families and Households in Mountain Home AFB
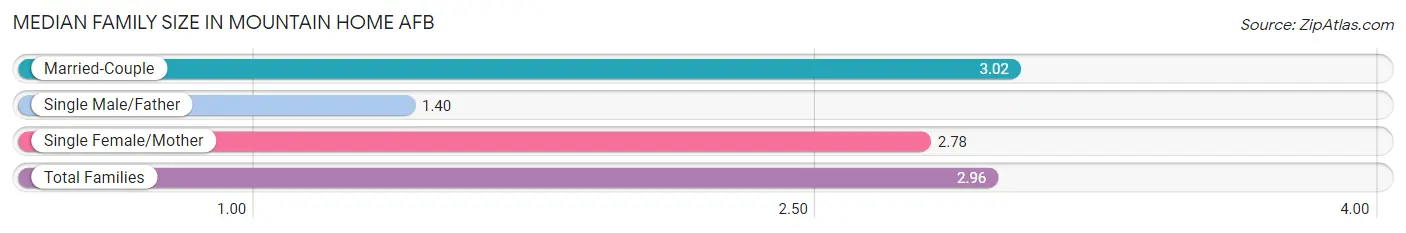
Median Family Size in Mountain Home AFB
The median family size in Mountain Home AFB is 2.96 persons per family, with married-couple families (745 | 92.9%) accounting for the largest median family size of 3.02 persons per family. On the other hand, single male/father families (25 | 3.1%) represent the smallest median family size with 1.40 persons per family.
| Family Type | # Families | Family Size |
| Married-Couple | 745 (92.9%) | 3.02 |
| Single Male/Father | 25 (3.1%) | 1.40 |
| Single Female/Mother | 32 (4.0%) | 2.78 |
| Total Families | 802 (100.0%) | 2.96 |
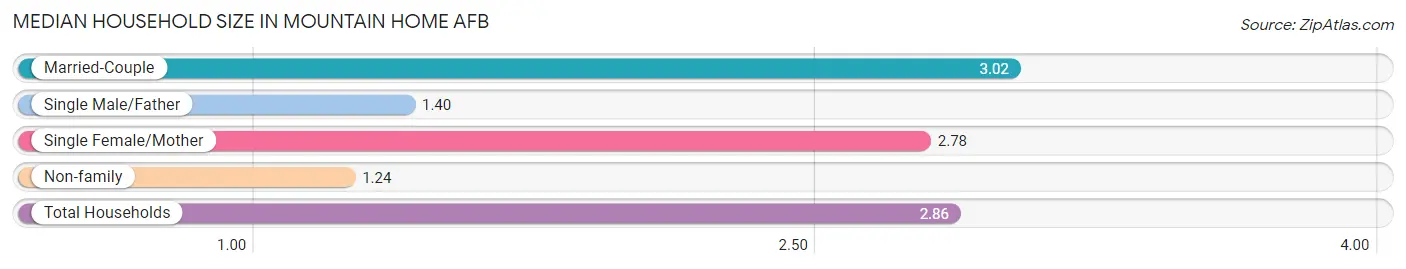
Median Household Size in Mountain Home AFB
The median household size in Mountain Home AFB is 2.86 persons per household, with married-couple households (745 | 87.3%) accounting for the largest median household size of 3.02 persons per household. non-family households (51 | 6.0%) represent the smallest median household size with 1.24 persons per household.
| Household Type | # Households | Household Size |
| Married-Couple | 745 (87.3%) | 3.02 |
| Single Male/Father | 25 (2.9%) | 1.40 |
| Single Female/Mother | 32 (3.7%) | 2.78 |
| Non-family | 51 (6.0%) | 1.24 |
| Total Households | 853 (100.0%) | 2.86 |
Household Size by Marriage Status in Mountain Home AFB
Out of a total of 853 households in Mountain Home AFB, 802 (94.0%) are family households, while 51 (6.0%) are nonfamily households. The most numerous type of family households are 4-person households, comprising 303, and the most common type of nonfamily households are 1-person households, comprising 42.
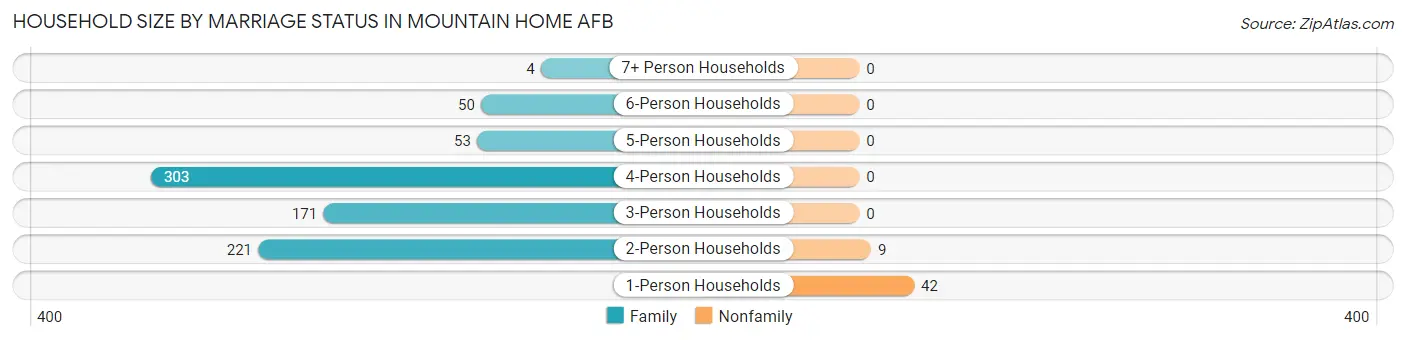
| Household Size | Family Households | Nonfamily Households |
| 1-Person Households | - | 42 (4.9%) |
| 2-Person Households | 221 (25.9%) | 9 (1.1%) |
| 3-Person Households | 171 (20.1%) | 0 (0.0%) |
| 4-Person Households | 303 (35.5%) | 0 (0.0%) |
| 5-Person Households | 53 (6.2%) | 0 (0.0%) |
| 6-Person Households | 50 (5.9%) | 0 (0.0%) |
| 7+ Person Households | 4 (0.5%) | 0 (0.0%) |
| Total | 802 (94.0%) | 51 (6.0%) |
Female Fertility in Mountain Home AFB
Fertility by Age in Mountain Home AFB
Average fertility rate in Mountain Home AFB is 213.0 births per 1,000 women. Women in the age bracket of 20 to 34 years have the highest fertility rate with 267.0 births per 1,000 women. Women in the age bracket of 20 to 34 years acount for 95.8% of all women with births.
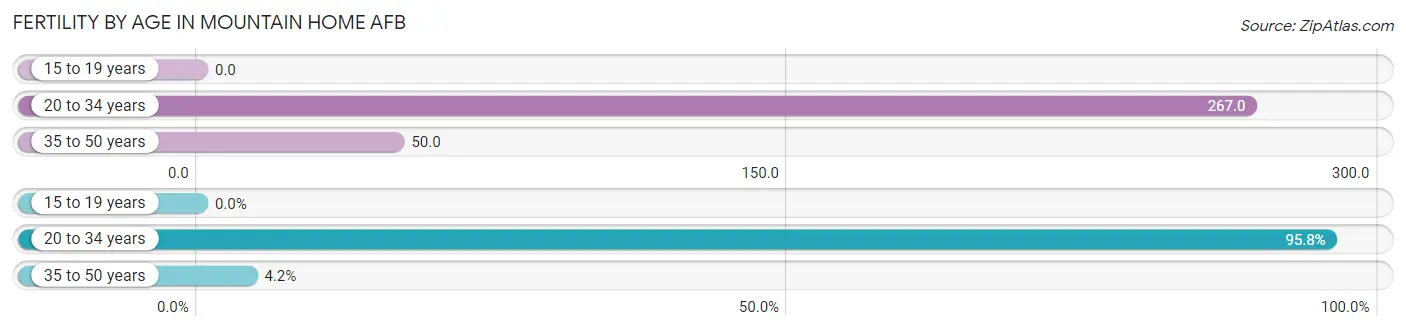
| Age Bracket | Women with Births | Births / 1,000 Women |
| 15 to 19 years | 0 (0.0%) | 0.0 |
| 20 to 34 years | 160 (95.8%) | 267.0 |
| 35 to 50 years | 7 (4.2%) | 50.0 |
| Total | 167 (100.0%) | 213.0 |
Fertility by Age by Marriage Status in Mountain Home AFB
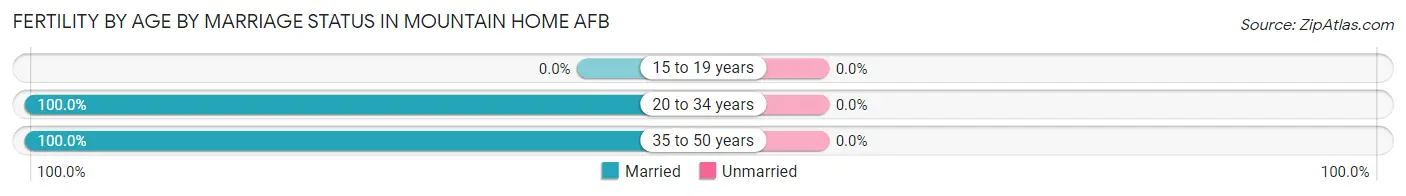
| Age Bracket | Married | Unmarried |
| 15 to 19 years | 0 (0.0%) | 0 (0.0%) |
| 20 to 34 years | 160 (100.0%) | 0 (0.0%) |
| 35 to 50 years | 7 (100.0%) | 0 (0.0%) |
| Total | 167 (100.0%) | 0 (0.0%) |
Fertility by Education in Mountain Home AFB
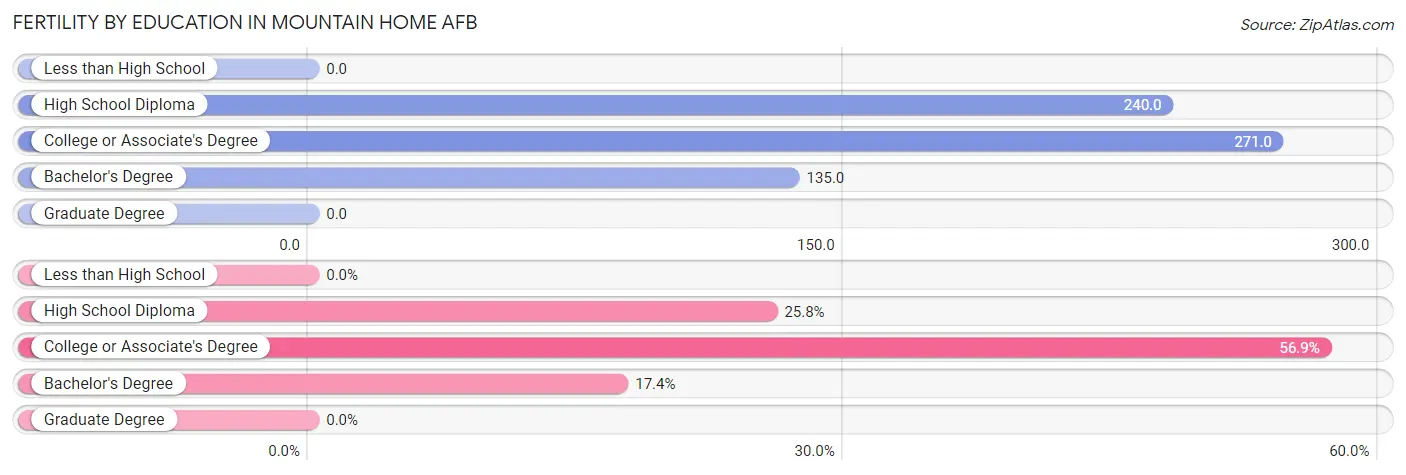
| Educational Attainment | Women with Births | Births / 1,000 Women |
| Less than High School | 0 (0.0%) | 0.0 |
| High School Diploma | 43 (25.8%) | 240.0 |
| College or Associate's Degree | 95 (56.9%) | 271.0 |
| Bachelor's Degree | 29 (17.4%) | 135.0 |
| Graduate Degree | 0 (0.0%) | 0.0 |
| Total | 167 (100.0%) | 213.0 |
Fertility by Education by Marriage Status in Mountain Home AFB
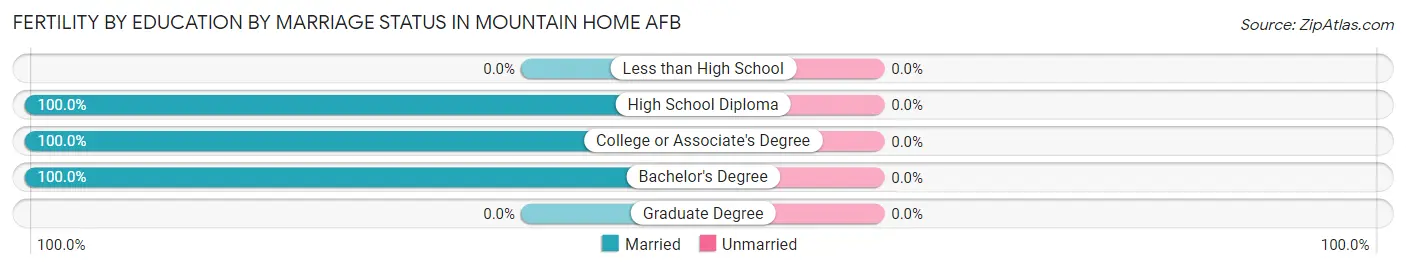
| Educational Attainment | Married | Unmarried |
| Less than High School | 0 (0.0%) | 0 (0.0%) |
| High School Diploma | 43 (100.0%) | 0 (0.0%) |
| College or Associate's Degree | 95 (100.0%) | 0 (0.0%) |
| Bachelor's Degree | 29 (100.0%) | 0 (0.0%) |
| Graduate Degree | 0 (0.0%) | 0 (0.0%) |
| Total | 167 (100.0%) | 0 (0.0%) |
Employment Characteristics in Mountain Home AFB
Employment by Class of Employer in Mountain Home AFB
Among the 1,806 employed individuals in Mountain Home AFB, federal government employees (1,533 | 84.9%), private company employees (164 | 9.1%), and local government employees (49 | 2.7%) make up the most common classes of employment.
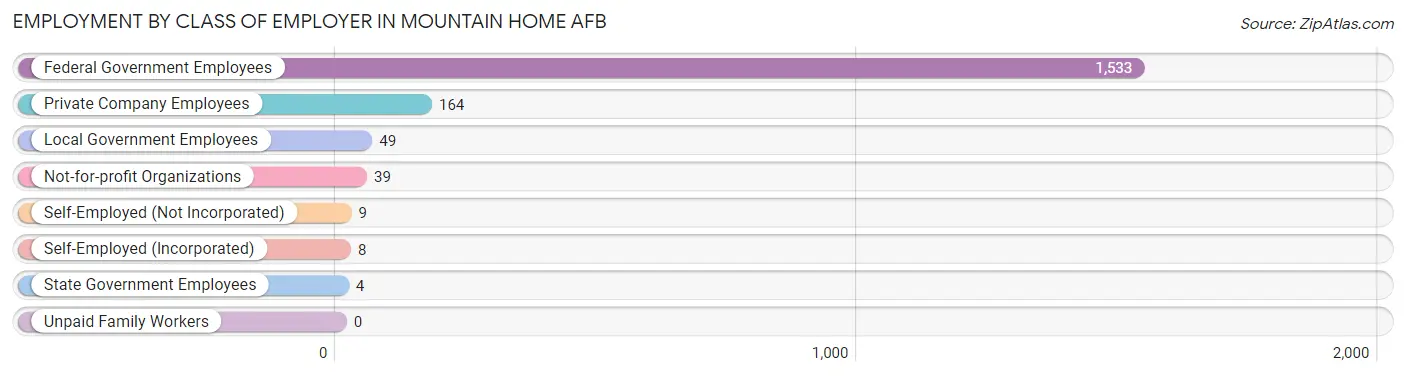
| Employer Class | # Employees | % Employees |
| Private Company Employees | 164 | 9.1% |
| Self-Employed (Incorporated) | 8 | 0.4% |
| Self-Employed (Not Incorporated) | 9 | 0.5% |
| Not-for-profit Organizations | 39 | 2.2% |
| Local Government Employees | 49 | 2.7% |
| State Government Employees | 4 | 0.2% |
| Federal Government Employees | 1,533 | 84.9% |
| Unpaid Family Workers | 0 | 0.0% |
| Total | 1,806 | 100.0% |
Employment Status by Age in Mountain Home AFB
According to the labor force statistics for Mountain Home AFB, out of the total population over 16 years of age (2,326), 82.1% or 1,910 individuals are in the labor force, with 9.5% or 181 of them unemployed. The age group with the highest labor force participation rate is 20 to 24 years, with 90.9% or 841 individuals in the labor force. Within the labor force, the 16 to 19 years age range has the highest percentage of unemployed individuals, with 100.0% or 122 of them being unemployed.
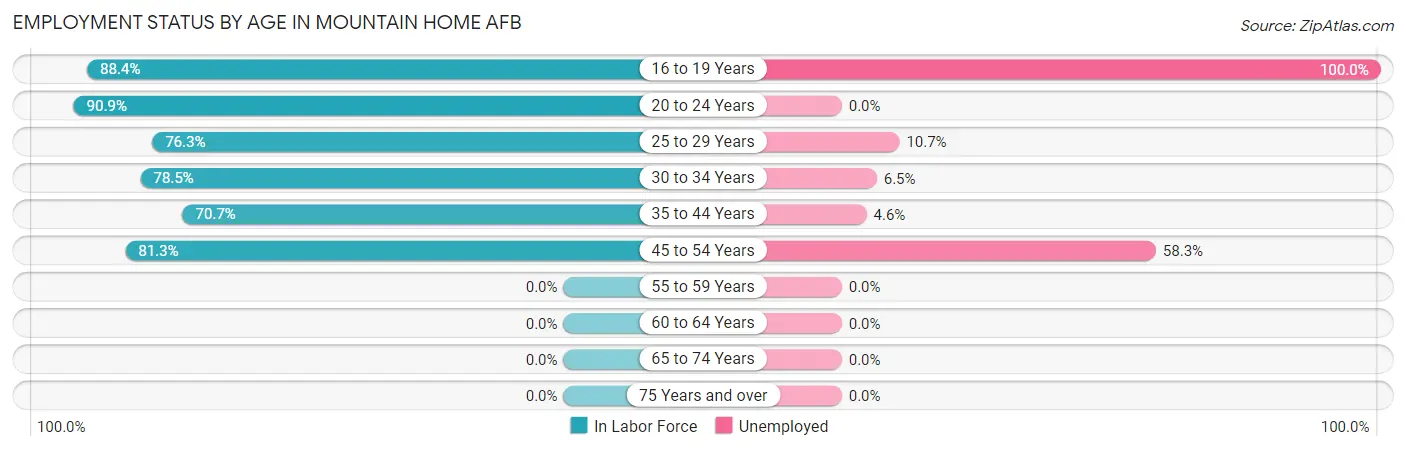
| Age Bracket | In Labor Force | Unemployed |
| 16 to 19 Years | 122 (88.4%) | 122 (100.0%) |
| 20 to 24 Years | 841 (90.9%) | 0 (0.0%) |
| 25 to 29 Years | 455 (76.3%) | 49 (10.7%) |
| 30 to 34 Years | 281 (78.5%) | 18 (6.5%) |
| 35 to 44 Years | 198 (70.7%) | 9 (4.6%) |
| 45 to 54 Years | 13 (81.3%) | 8 (58.3%) |
| 55 to 59 Years | 0 (0.0%) | 0 (0.0%) |
| 60 to 64 Years | 0 (0.0%) | 0 (0.0%) |
| 65 to 74 Years | 0 (0.0%) | 0 (0.0%) |
| 75 Years and over | 0 (0.0%) | 0 (0.0%) |
| Total | 1,910 (82.1%) | 181 (9.5%) |
Employment Status by Educational Attainment in Mountain Home AFB
According to labor force statistics for Mountain Home AFB, 75.0% of individuals (947) out of the total population between 25 and 64 years of age (1,263) are in the labor force, with 9.7% or 92 of them being unemployed. The group with the highest labor force participation rate are those with the educational attainment of college / associate degree, with 85.2% or 546 individuals in the labor force. Within the labor force, individuals with college / associate degree education have the highest percentage of unemployment, with 14.2% or 78 of them being unemployed.
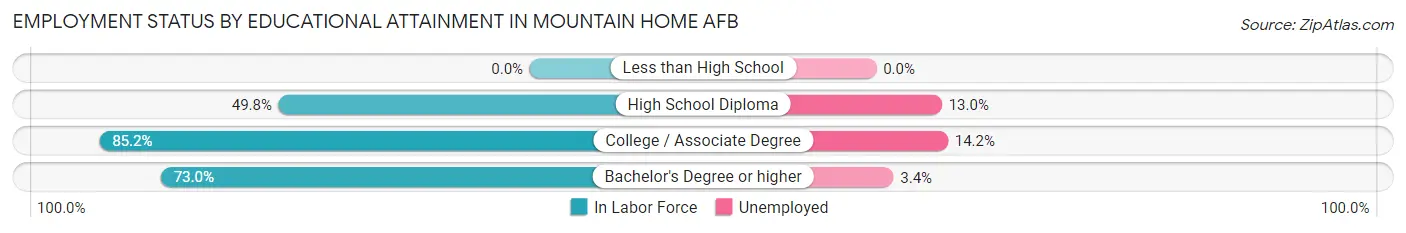
| Educational Attainment | In Labor Force | Unemployed |
| Less than High School | 0 (0.0%) | 0 (0.0%) |
| High School Diploma | 109 (49.8%) | 28 (13.0%) |
| College / Associate Degree | 546 (85.2%) | 91 (14.2%) |
| Bachelor's Degree or higher | 292 (73.0%) | 14 (3.4%) |
| Total | 947 (75.0%) | 123 (9.7%) |
Employment Occupations by Sex in Mountain Home AFB
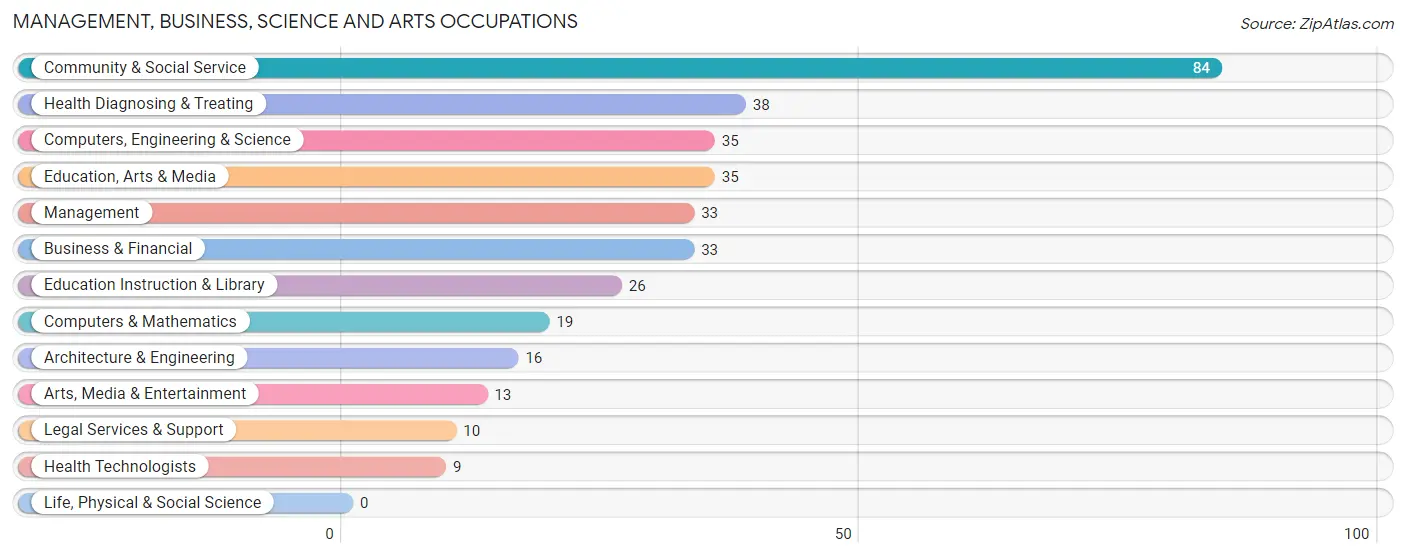
Management, Business, Science and Arts Occupations
The most common Management, Business, Science and Arts occupations in Mountain Home AFB are Community & Social Service (84 | 20.1%), Health Diagnosing & Treating (38 | 9.1%), Computers, Engineering & Science (35 | 8.4%), Education, Arts & Media (35 | 8.4%), and Management (33 | 7.9%).
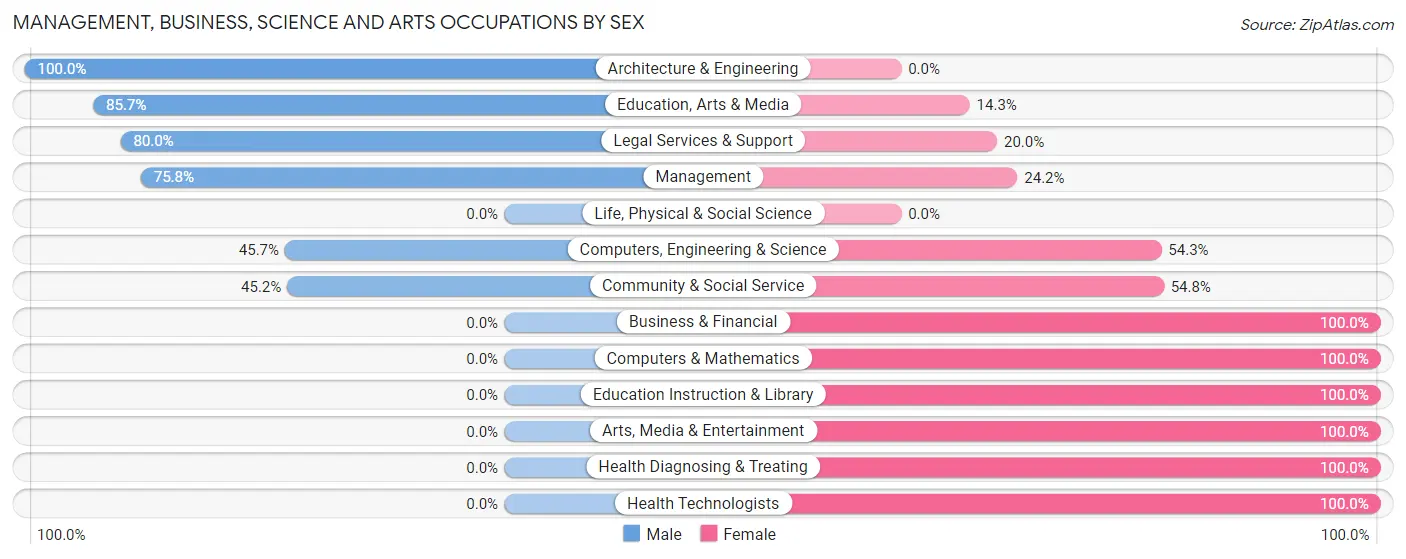
Management, Business, Science and Arts Occupations by Sex
Within the Management, Business, Science and Arts occupations in Mountain Home AFB, the most male-oriented occupations are Architecture & Engineering (100.0%), Education, Arts & Media (85.7%), and Legal Services & Support (80.0%), while the most female-oriented occupations are Business & Financial (100.0%), Computers & Mathematics (100.0%), and Education Instruction & Library (100.0%).
| Occupation | Male | Female |
| Management | 25 (75.8%) | 8 (24.2%) |
| Business & Financial | 0 (0.0%) | 33 (100.0%) |
| Computers, Engineering & Science | 16 (45.7%) | 19 (54.3%) |
| Computers & Mathematics | 0 (0.0%) | 19 (100.0%) |
| Architecture & Engineering | 16 (100.0%) | 0 (0.0%) |
| Life, Physical & Social Science | 0 (0.0%) | 0 (0.0%) |
| Community & Social Service | 38 (45.2%) | 46 (54.8%) |
| Education, Arts & Media | 30 (85.7%) | 5 (14.3%) |
| Legal Services & Support | 8 (80.0%) | 2 (20.0%) |
| Education Instruction & Library | 0 (0.0%) | 26 (100.0%) |
| Arts, Media & Entertainment | 0 (0.0%) | 13 (100.0%) |
| Health Diagnosing & Treating | 0 (0.0%) | 38 (100.0%) |
| Health Technologists | 0 (0.0%) | 9 (100.0%) |
| Total (Category) | 79 (35.4%) | 144 (64.6%) |
| Total (Overall) | 136 (32.6%) | 281 (67.4%) |
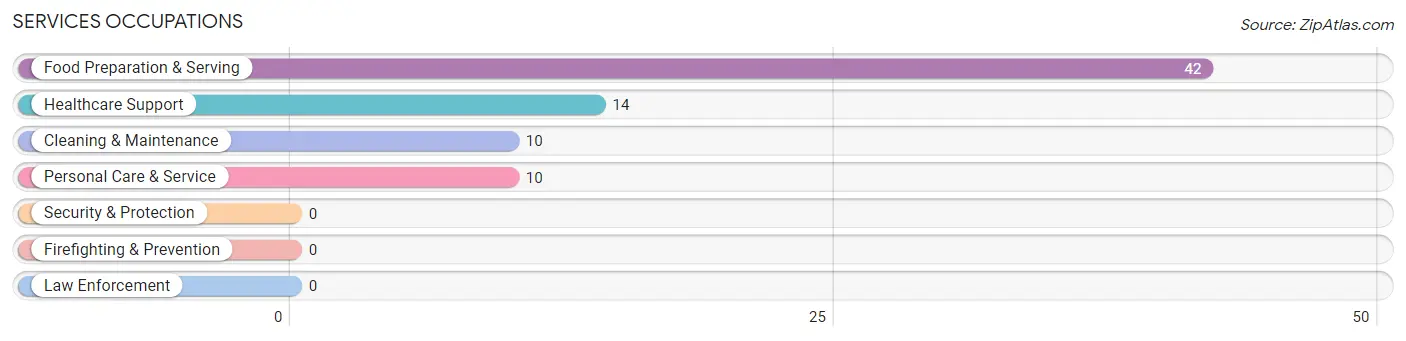
Services Occupations
The most common Services occupations in Mountain Home AFB are Food Preparation & Serving (42 | 10.1%), Healthcare Support (14 | 3.4%), Cleaning & Maintenance (10 | 2.4%), and Personal Care & Service (10 | 2.4%).
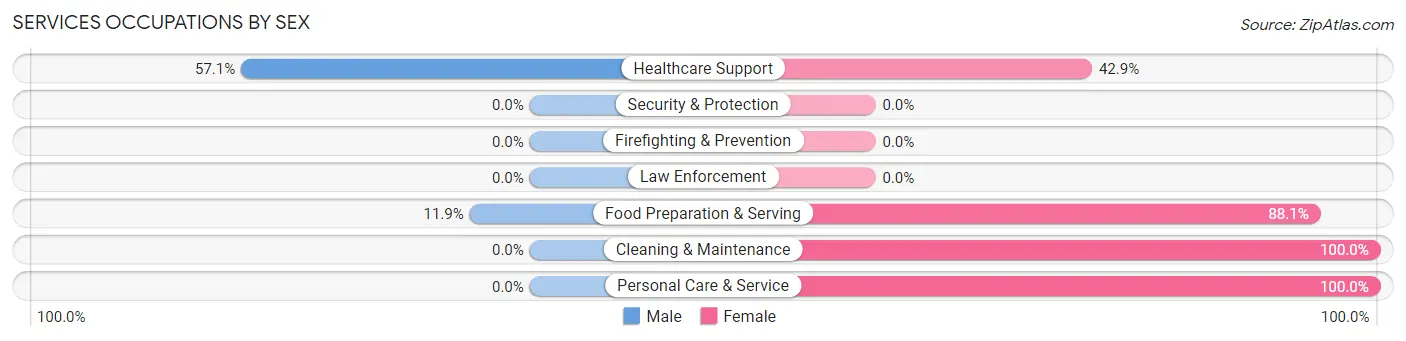
Services Occupations by Sex
Within the Services occupations in Mountain Home AFB, the most male-oriented occupations are Healthcare Support (57.1%), and Food Preparation & Serving (11.9%), while the most female-oriented occupations are Cleaning & Maintenance (100.0%), Personal Care & Service (100.0%), and Food Preparation & Serving (88.1%).
| Occupation | Male | Female |
| Healthcare Support | 8 (57.1%) | 6 (42.9%) |
| Security & Protection | 0 (0.0%) | 0 (0.0%) |
| Firefighting & Prevention | 0 (0.0%) | 0 (0.0%) |
| Law Enforcement | 0 (0.0%) | 0 (0.0%) |
| Food Preparation & Serving | 5 (11.9%) | 37 (88.1%) |
| Cleaning & Maintenance | 0 (0.0%) | 10 (100.0%) |
| Personal Care & Service | 0 (0.0%) | 10 (100.0%) |
| Total (Category) | 13 (17.1%) | 63 (82.9%) |
| Total (Overall) | 136 (32.6%) | 281 (67.4%) |
Sales and Office Occupations
The most common Sales and Office occupations in Mountain Home AFB are Office & Administration (39 | 9.3%), and Sales & Related (32 | 7.7%).
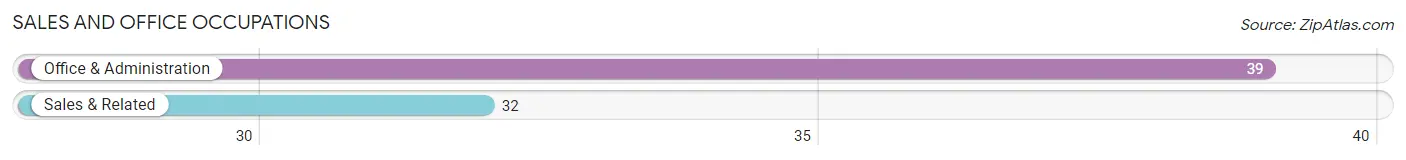
Sales and Office Occupations by Sex
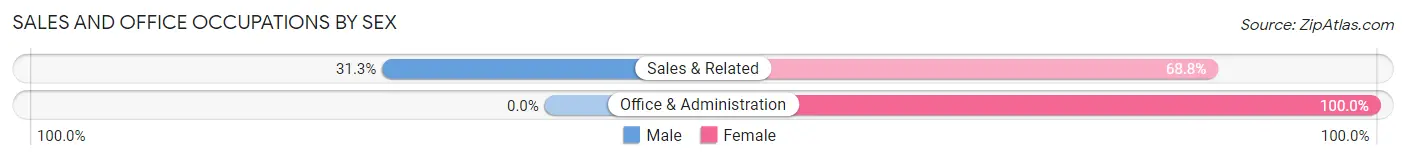
| Occupation | Male | Female |
| Sales & Related | 10 (31.2%) | 22 (68.8%) |
| Office & Administration | 0 (0.0%) | 39 (100.0%) |
| Total (Category) | 10 (14.1%) | 61 (85.9%) |
| Total (Overall) | 136 (32.6%) | 281 (67.4%) |
Natural Resources, Construction and Maintenance Occupations
The most common Natural Resources, Construction and Maintenance occupations in Mountain Home AFB are Construction & Extraction (25 | 6.0%), and Installation, Maintenance & Repair (4 | 1.0%).
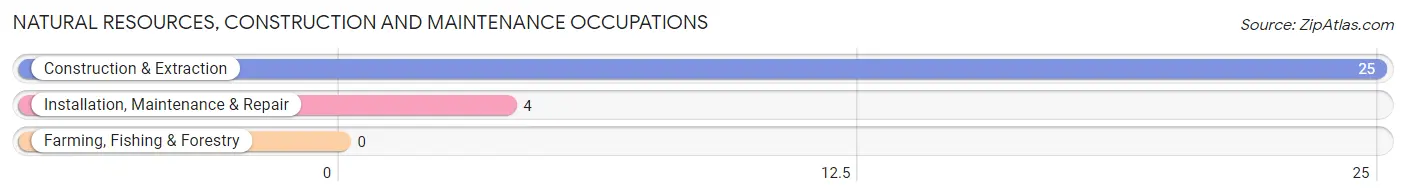
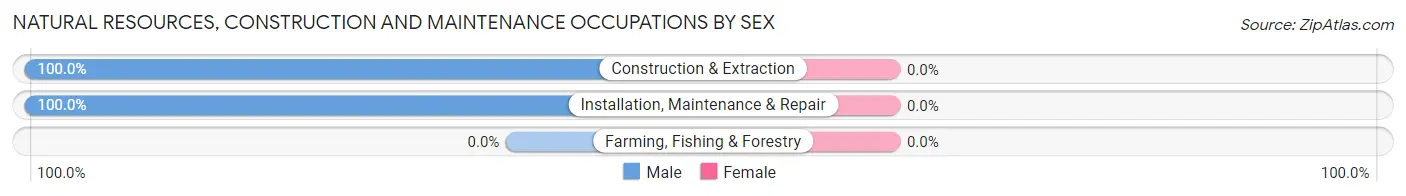
Natural Resources, Construction and Maintenance Occupations by Sex
| Occupation | Male | Female |
| Farming, Fishing & Forestry | 0 (0.0%) | 0 (0.0%) |
| Construction & Extraction | 25 (100.0%) | 0 (0.0%) |
| Installation, Maintenance & Repair | 4 (100.0%) | 0 (0.0%) |
| Total (Category) | 29 (100.0%) | 0 (0.0%) |
| Total (Overall) | 136 (32.6%) | 281 (67.4%) |
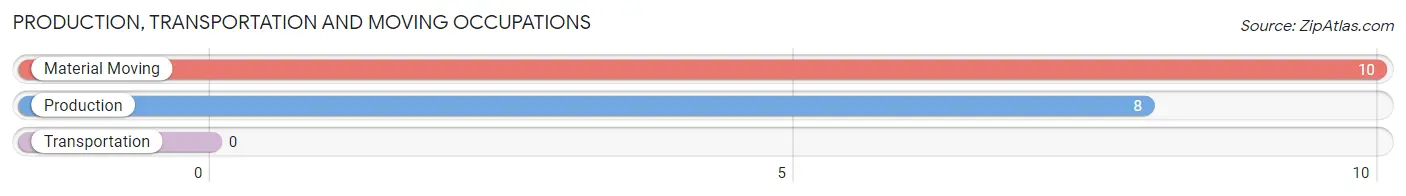
Production, Transportation and Moving Occupations
The most common Production, Transportation and Moving occupations in Mountain Home AFB are Material Moving (10 | 2.4%), and Production (8 | 1.9%).
Production, Transportation and Moving Occupations by Sex
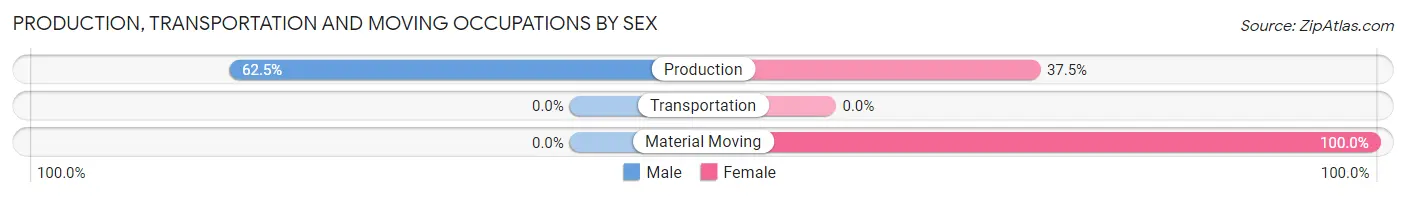
| Occupation | Male | Female |
| Production | 5 (62.5%) | 3 (37.5%) |
| Transportation | 0 (0.0%) | 0 (0.0%) |
| Material Moving | 0 (0.0%) | 10 (100.0%) |
| Total (Category) | 5 (27.8%) | 13 (72.2%) |
| Total (Overall) | 136 (32.6%) | 281 (67.4%) |
Employment Industries by Sex in Mountain Home AFB
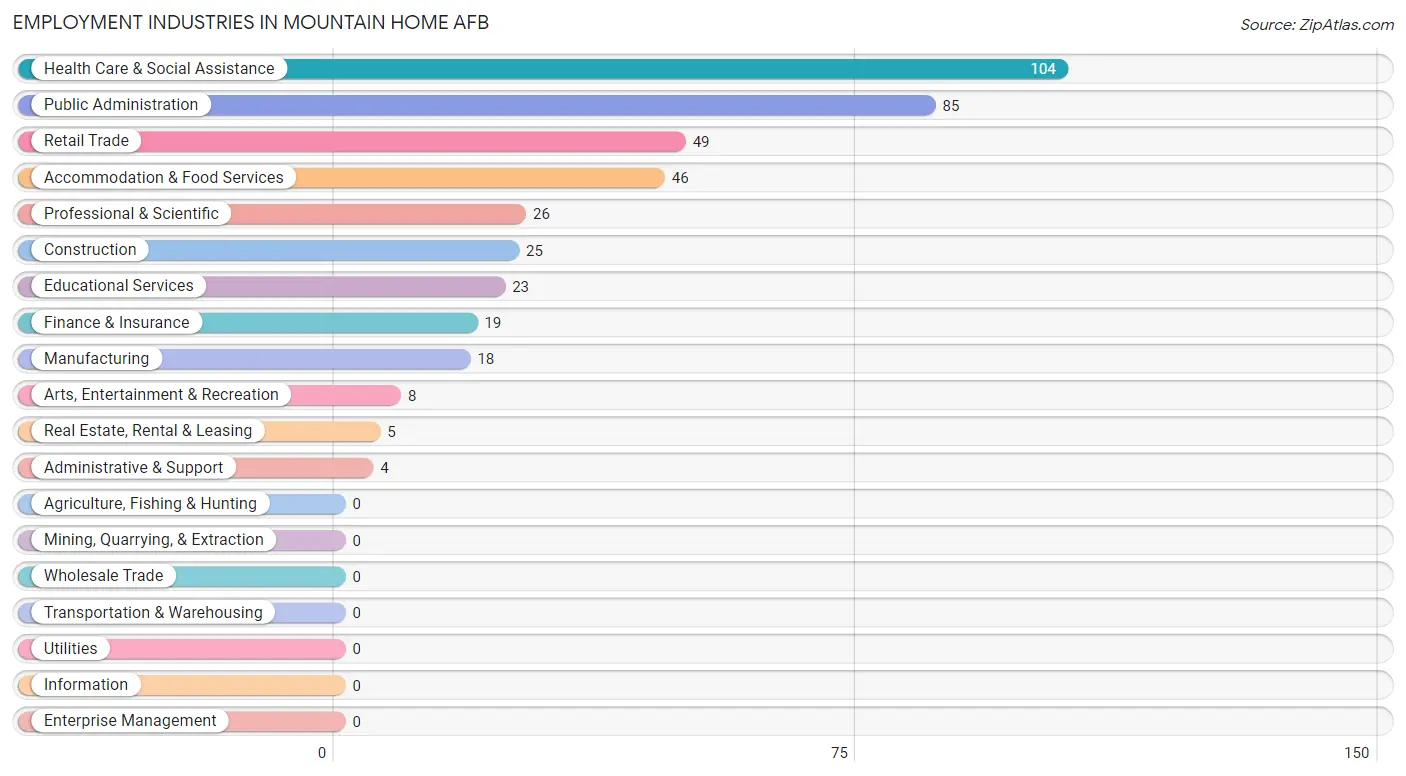
Employment Industries in Mountain Home AFB
The major employment industries in Mountain Home AFB include Health Care & Social Assistance (104 | 24.9%), Public Administration (85 | 20.4%), Retail Trade (49 | 11.7%), Accommodation & Food Services (46 | 11.0%), and Professional & Scientific (26 | 6.2%).
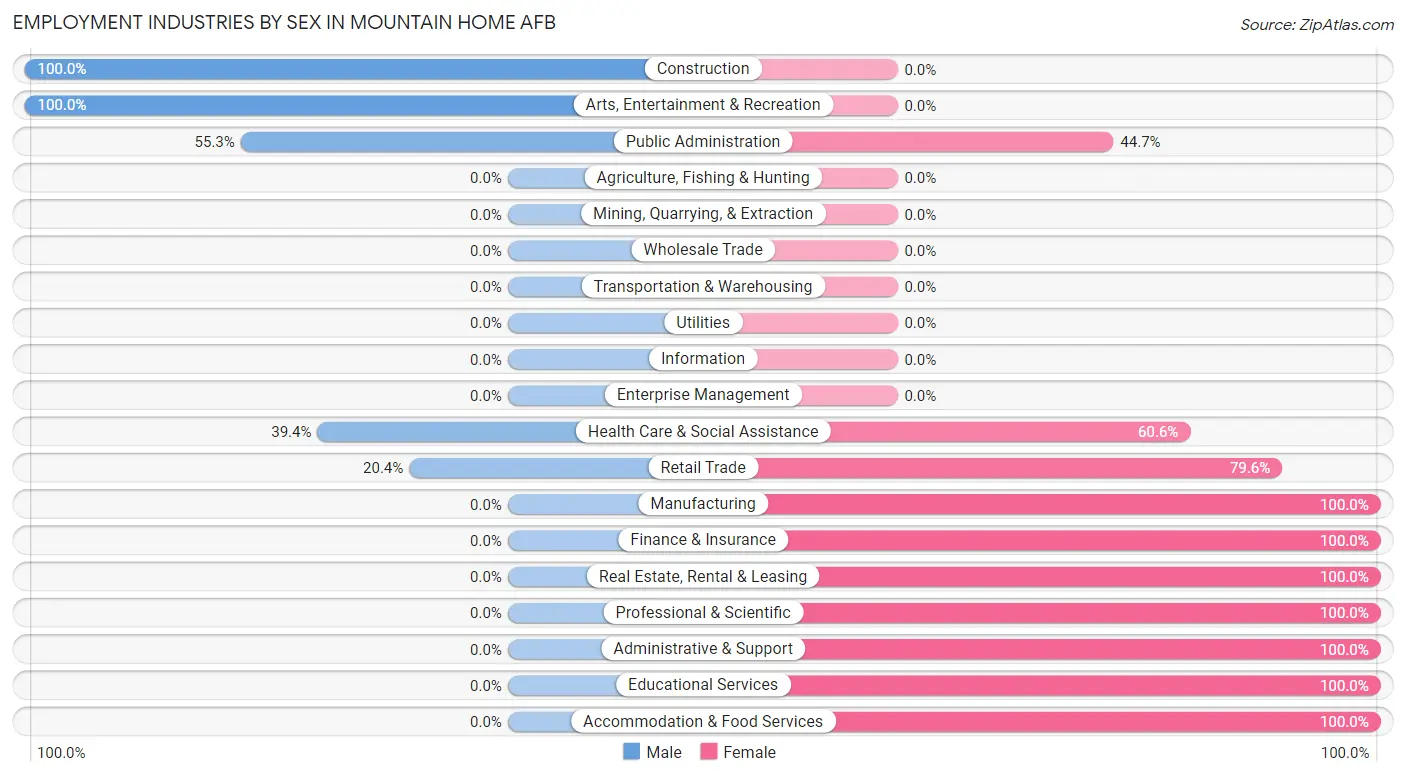
Employment Industries by Sex in Mountain Home AFB
The Mountain Home AFB industries that see more men than women are Construction (100.0%), Arts, Entertainment & Recreation (100.0%), and Public Administration (55.3%), whereas the industries that tend to have a higher number of women are Manufacturing (100.0%), Finance & Insurance (100.0%), and Real Estate, Rental & Leasing (100.0%).
| Industry | Male | Female |
| Agriculture, Fishing & Hunting | 0 (0.0%) | 0 (0.0%) |
| Mining, Quarrying, & Extraction | 0 (0.0%) | 0 (0.0%) |
| Construction | 25 (100.0%) | 0 (0.0%) |
| Manufacturing | 0 (0.0%) | 18 (100.0%) |
| Wholesale Trade | 0 (0.0%) | 0 (0.0%) |
| Retail Trade | 10 (20.4%) | 39 (79.6%) |
| Transportation & Warehousing | 0 (0.0%) | 0 (0.0%) |
| Utilities | 0 (0.0%) | 0 (0.0%) |
| Information | 0 (0.0%) | 0 (0.0%) |
| Finance & Insurance | 0 (0.0%) | 19 (100.0%) |
| Real Estate, Rental & Leasing | 0 (0.0%) | 5 (100.0%) |
| Professional & Scientific | 0 (0.0%) | 26 (100.0%) |
| Enterprise Management | 0 (0.0%) | 0 (0.0%) |
| Administrative & Support | 0 (0.0%) | 4 (100.0%) |
| Educational Services | 0 (0.0%) | 23 (100.0%) |
| Health Care & Social Assistance | 41 (39.4%) | 63 (60.6%) |
| Arts, Entertainment & Recreation | 8 (100.0%) | 0 (0.0%) |
| Accommodation & Food Services | 0 (0.0%) | 46 (100.0%) |
| Public Administration | 47 (55.3%) | 38 (44.7%) |
| Total | 136 (32.6%) | 281 (67.4%) |
Education in Mountain Home AFB
School Enrollment in Mountain Home AFB
The most common levels of schooling among the 1,042 students in Mountain Home AFB are college / undergraduate (403 | 38.7%), elementary school (229 | 22.0%), and graduate / professional (134 | 12.9%).
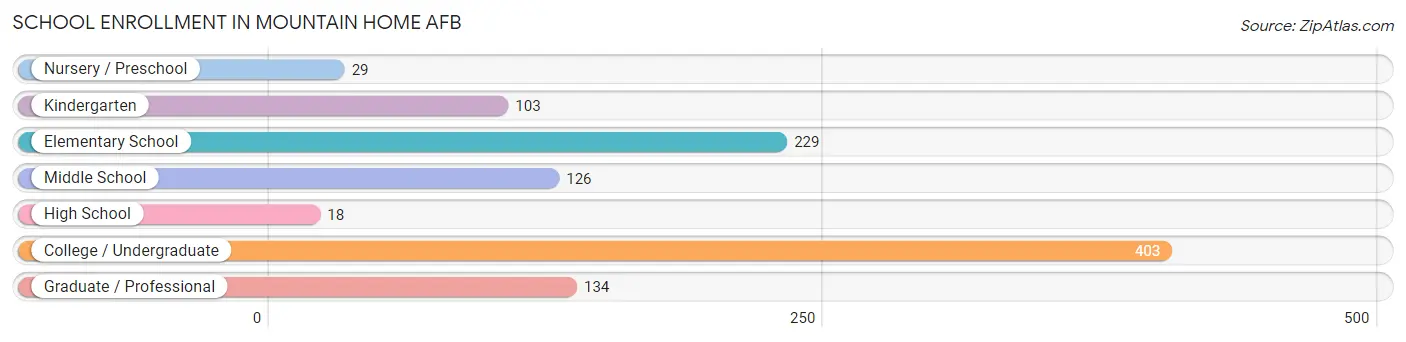
| School Level | # Students | % Students |
| Nursery / Preschool | 29 | 2.8% |
| Kindergarten | 103 | 9.9% |
| Elementary School | 229 | 22.0% |
| Middle School | 126 | 12.1% |
| High School | 18 | 1.7% |
| College / Undergraduate | 403 | 38.7% |
| Graduate / Professional | 134 | 12.9% |
| Total | 1,042 | 100.0% |
School Enrollment by Age by Funding Source in Mountain Home AFB
Out of a total of 1,042 students who are enrolled in schools in Mountain Home AFB, 174 (16.7%) attend a private institution, while the remaining 868 (83.3%) are enrolled in public schools. The age group of 3 to 4 year olds has the highest likelihood of being enrolled in private schools, with 10 (41.7% in the age bracket) enrolled. Conversely, the age group of 20 to 24 year olds has the lowest likelihood of being enrolled in a private school, with 221 (95.3% in the age bracket) attending a public institution.
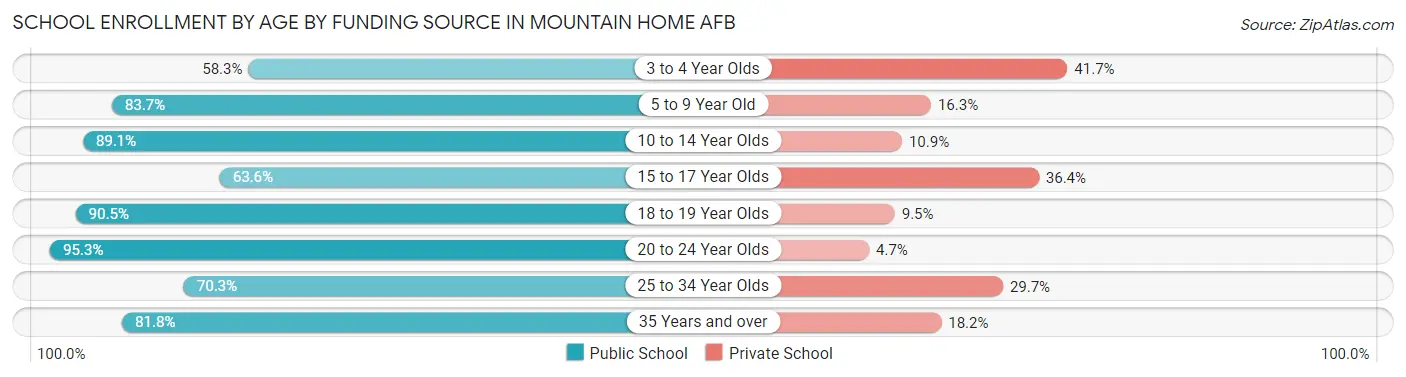
| Age Bracket | Public School | Private School |
| 3 to 4 Year Olds | 14 (58.3%) | 10 (41.7%) |
| 5 to 9 Year Old | 242 (83.7%) | 47 (16.3%) |
| 10 to 14 Year Olds | 156 (89.1%) | 19 (10.9%) |
| 15 to 17 Year Olds | 7 (63.6%) | 4 (36.4%) |
| 18 to 19 Year Olds | 19 (90.5%) | 2 (9.5%) |
| 20 to 24 Year Olds | 221 (95.3%) | 11 (4.7%) |
| 25 to 34 Year Olds | 173 (70.3%) | 73 (29.7%) |
| 35 Years and over | 36 (81.8%) | 8 (18.2%) |
| Total | 868 (83.3%) | 174 (16.7%) |
Educational Attainment by Field of Study in Mountain Home AFB
Arts & humanities (83 | 20.2%), education (62 | 15.1%), business (59 | 14.4%), science & technology (56 | 13.6%), and social sciences (33 | 8.0%) are the most common fields of study among 411 individuals in Mountain Home AFB who have obtained a bachelor's degree or higher.
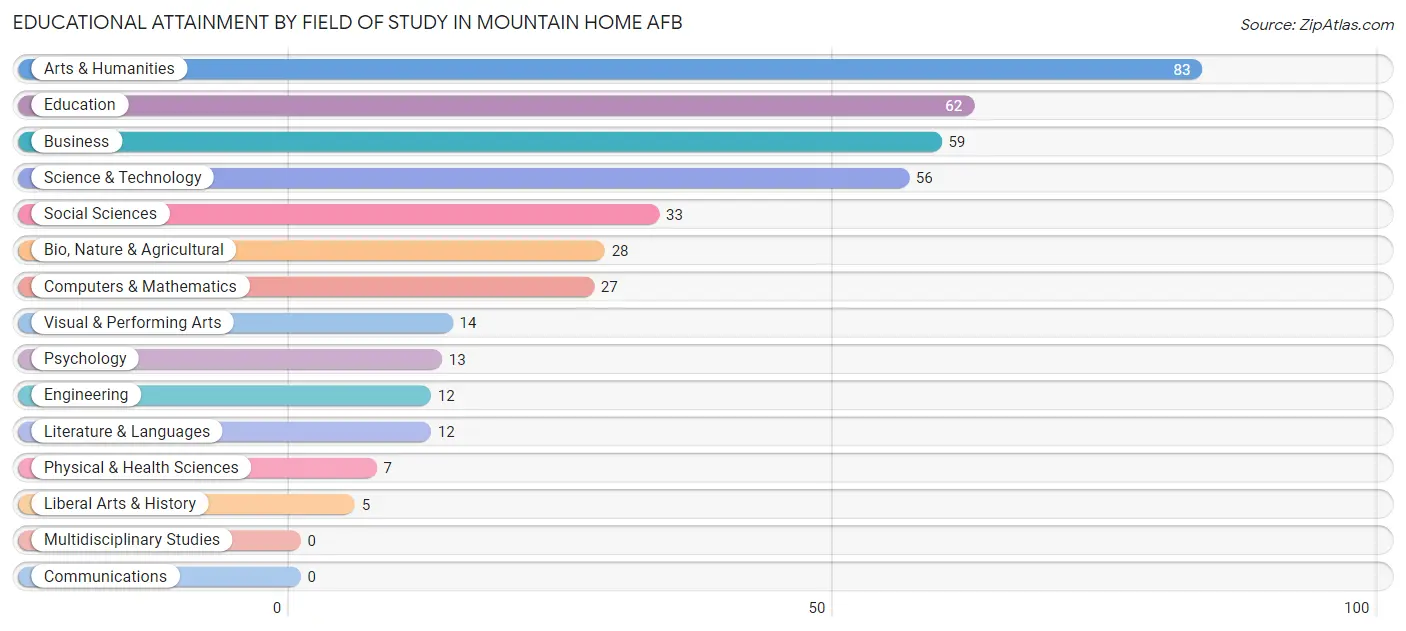
| Field of Study | # Graduates | % Graduates |
| Computers & Mathematics | 27 | 6.6% |
| Bio, Nature & Agricultural | 28 | 6.8% |
| Physical & Health Sciences | 7 | 1.7% |
| Psychology | 13 | 3.2% |
| Social Sciences | 33 | 8.0% |
| Engineering | 12 | 2.9% |
| Multidisciplinary Studies | 0 | 0.0% |
| Science & Technology | 56 | 13.6% |
| Business | 59 | 14.4% |
| Education | 62 | 15.1% |
| Literature & Languages | 12 | 2.9% |
| Liberal Arts & History | 5 | 1.2% |
| Visual & Performing Arts | 14 | 3.4% |
| Communications | 0 | 0.0% |
| Arts & Humanities | 83 | 20.2% |
| Total | 411 | 100.0% |
Transportation & Commute in Mountain Home AFB
Vehicle Availability by Sex in Mountain Home AFB
The most prevalent vehicle ownership categories in Mountain Home AFB are males with 2 vehicles (569, accounting for 69.3%) and females with 2 vehicles (191, making up 184.7%).
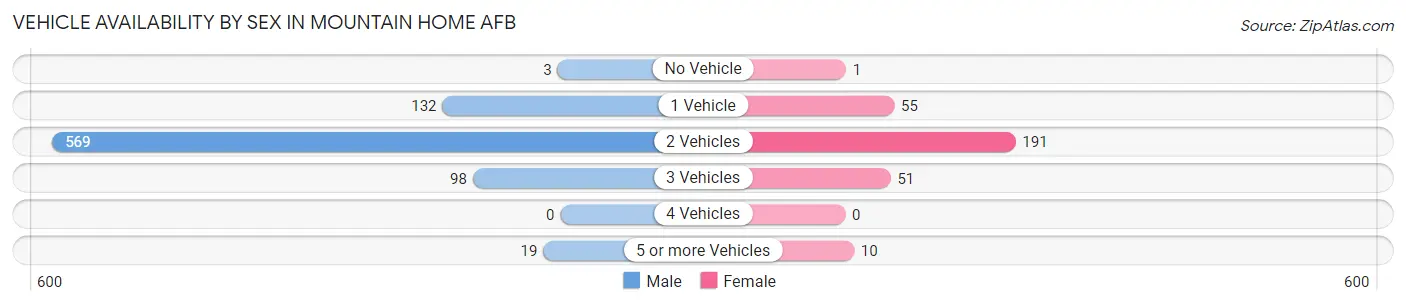
| Vehicles Available | Male | Female |
| No Vehicle | 3 (0.4%) | 1 (0.3%) |
| 1 Vehicle | 132 (16.1%) | 55 (17.9%) |
| 2 Vehicles | 569 (69.3%) | 191 (62.0%) |
| 3 Vehicles | 98 (11.9%) | 51 (16.6%) |
| 4 Vehicles | 0 (0.0%) | 0 (0.0%) |
| 5 or more Vehicles | 19 (2.3%) | 10 (3.3%) |
| Total | 821 (100.0%) | 308 (100.0%) |
Commute Time in Mountain Home AFB
The most frequently occuring commute durations in Mountain Home AFB are 5 to 9 minutes (1,020 commuters, 58.5%), less than 5 minutes (299 commuters, 17.1%), and 10 to 14 minutes (190 commuters, 10.9%).
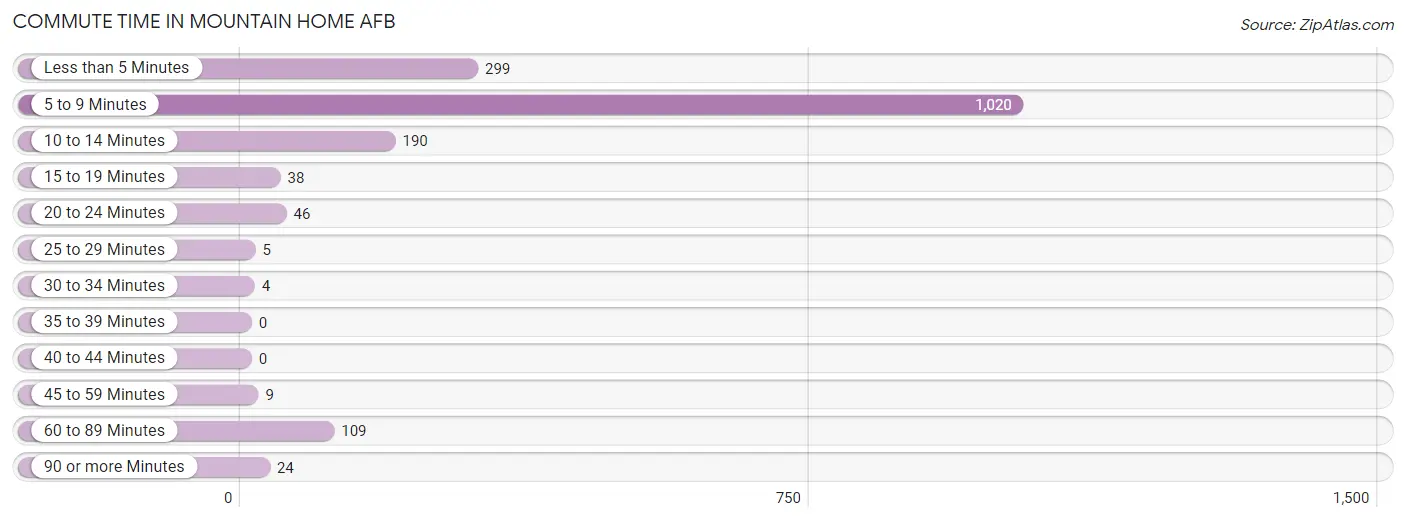
| Commute Time | # Commuters | % Commuters |
| Less than 5 Minutes | 299 | 17.1% |
| 5 to 9 Minutes | 1,020 | 58.5% |
| 10 to 14 Minutes | 190 | 10.9% |
| 15 to 19 Minutes | 38 | 2.2% |
| 20 to 24 Minutes | 46 | 2.6% |
| 25 to 29 Minutes | 5 | 0.3% |
| 30 to 34 Minutes | 4 | 0.2% |
| 35 to 39 Minutes | 0 | 0.0% |
| 40 to 44 Minutes | 0 | 0.0% |
| 45 to 59 Minutes | 9 | 0.5% |
| 60 to 89 Minutes | 109 | 6.2% |
| 90 or more Minutes | 24 | 1.4% |
Commute Time by Sex in Mountain Home AFB
The most common commute times in Mountain Home AFB are 5 to 9 minutes (826 commuters, 57.8%) for males and 5 to 9 minutes (194 commuters, 61.6%) for females.
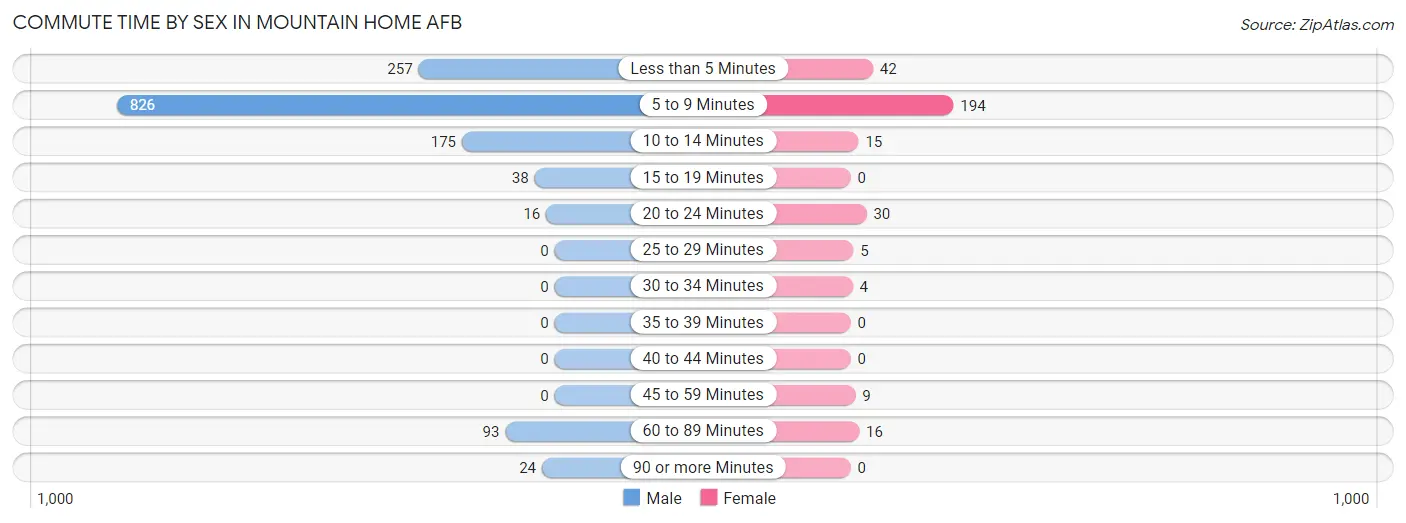
| Commute Time | Male | Female |
| Less than 5 Minutes | 257 (18.0%) | 42 (13.3%) |
| 5 to 9 Minutes | 826 (57.8%) | 194 (61.6%) |
| 10 to 14 Minutes | 175 (12.2%) | 15 (4.8%) |
| 15 to 19 Minutes | 38 (2.7%) | 0 (0.0%) |
| 20 to 24 Minutes | 16 (1.1%) | 30 (9.5%) |
| 25 to 29 Minutes | 0 (0.0%) | 5 (1.6%) |
| 30 to 34 Minutes | 0 (0.0%) | 4 (1.3%) |
| 35 to 39 Minutes | 0 (0.0%) | 0 (0.0%) |
| 40 to 44 Minutes | 0 (0.0%) | 0 (0.0%) |
| 45 to 59 Minutes | 0 (0.0%) | 9 (2.9%) |
| 60 to 89 Minutes | 93 (6.5%) | 16 (5.1%) |
| 90 or more Minutes | 24 (1.7%) | 0 (0.0%) |
Time of Departure to Work by Sex in Mountain Home AFB
The most frequent times of departure to work in Mountain Home AFB are 7:00 AM to 7:29 AM (399, 27.9%) for males and 7:00 AM to 7:29 AM (50, 15.9%) for females.
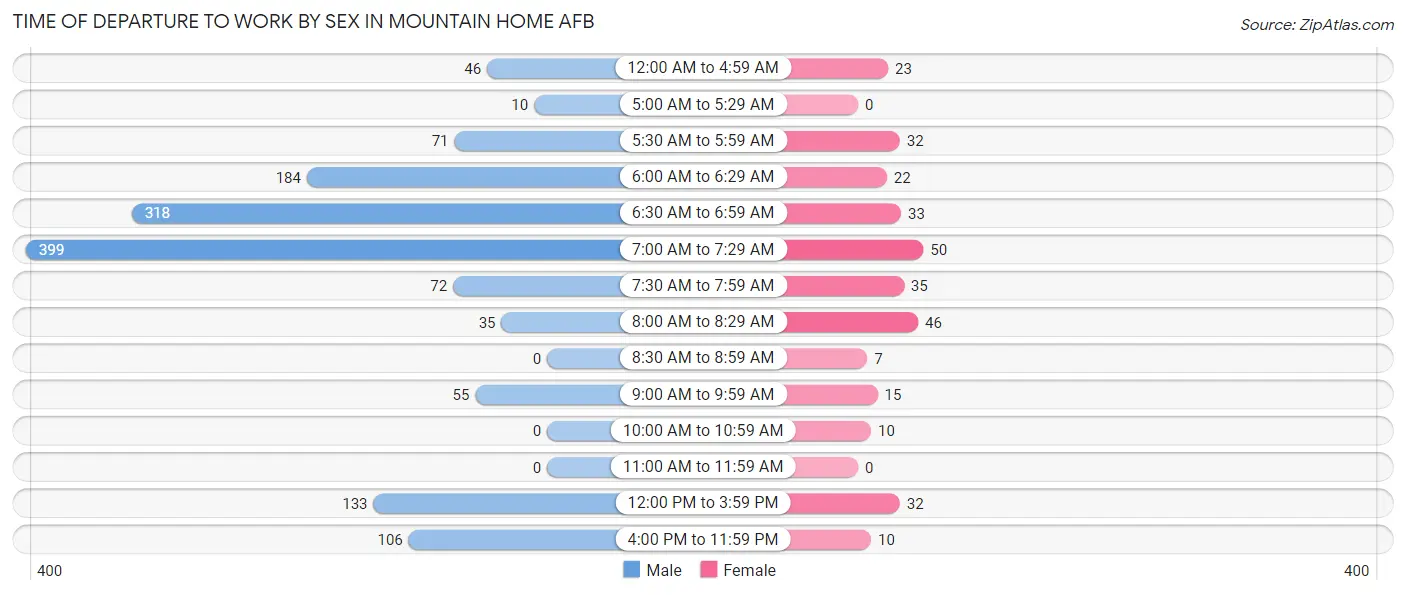
| Time of Departure | Male | Female |
| 12:00 AM to 4:59 AM | 46 (3.2%) | 23 (7.3%) |
| 5:00 AM to 5:29 AM | 10 (0.7%) | 0 (0.0%) |
| 5:30 AM to 5:59 AM | 71 (5.0%) | 32 (10.2%) |
| 6:00 AM to 6:29 AM | 184 (12.9%) | 22 (7.0%) |
| 6:30 AM to 6:59 AM | 318 (22.3%) | 33 (10.5%) |
| 7:00 AM to 7:29 AM | 399 (27.9%) | 50 (15.9%) |
| 7:30 AM to 7:59 AM | 72 (5.0%) | 35 (11.1%) |
| 8:00 AM to 8:29 AM | 35 (2.5%) | 46 (14.6%) |
| 8:30 AM to 8:59 AM | 0 (0.0%) | 7 (2.2%) |
| 9:00 AM to 9:59 AM | 55 (3.8%) | 15 (4.8%) |
| 10:00 AM to 10:59 AM | 0 (0.0%) | 10 (3.2%) |
| 11:00 AM to 11:59 AM | 0 (0.0%) | 0 (0.0%) |
| 12:00 PM to 3:59 PM | 133 (9.3%) | 32 (10.2%) |
| 4:00 PM to 11:59 PM | 106 (7.4%) | 10 (3.2%) |
| Total | 1,429 (100.0%) | 315 (100.0%) |
Housing Occupancy in Mountain Home AFB
Occupancy by Ownership in Mountain Home AFB
Of the total 853 dwellings in Mountain Home AFB, owner-occupied units account for 6 (0.7%), while renter-occupied units make up 847 (99.3%).
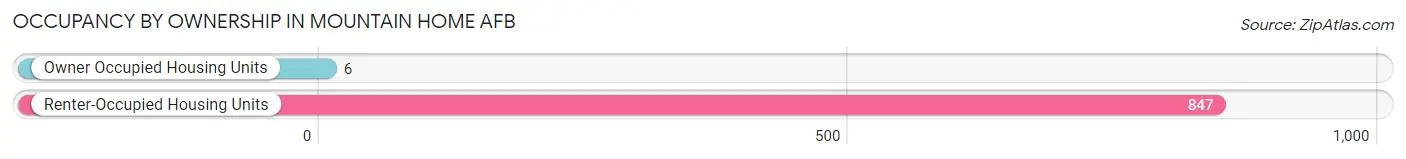
| Occupancy | # Housing Units | % Housing Units |
| Owner Occupied Housing Units | 6 | 0.7% |
| Renter-Occupied Housing Units | 847 | 99.3% |
| Total Occupied Housing Units | 853 | 100.0% |
Occupancy by Household Size in Mountain Home AFB
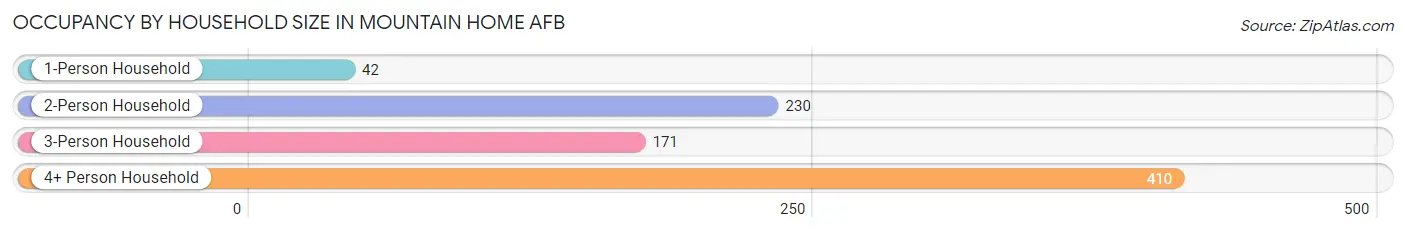
| Household Size | # Housing Units | % Housing Units |
| 1-Person Household | 42 | 4.9% |
| 2-Person Household | 230 | 27.0% |
| 3-Person Household | 171 | 20.1% |
| 4+ Person Household | 410 | 48.1% |
| Total Housing Units | 853 | 100.0% |
Occupancy by Ownership by Household Size in Mountain Home AFB
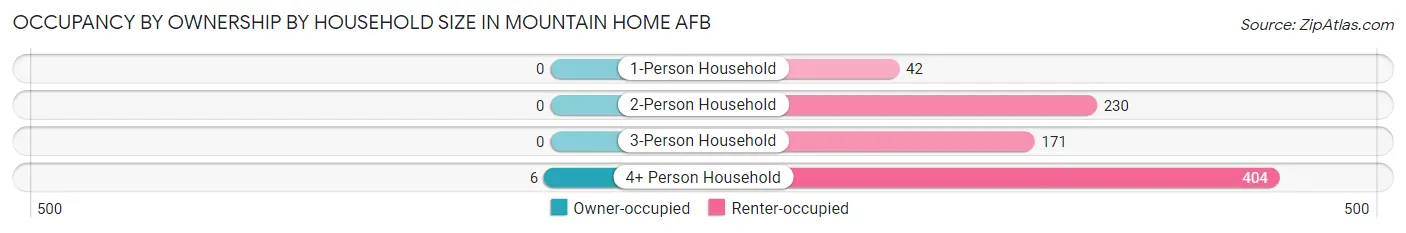
| Household Size | Owner-occupied | Renter-occupied |
| 1-Person Household | 0 (0.0%) | 42 (100.0%) |
| 2-Person Household | 0 (0.0%) | 230 (100.0%) |
| 3-Person Household | 0 (0.0%) | 171 (100.0%) |
| 4+ Person Household | 6 (1.5%) | 404 (98.5%) |
| Total Housing Units | 6 (0.7%) | 847 (99.3%) |
Occupancy by Educational Attainment in Mountain Home AFB
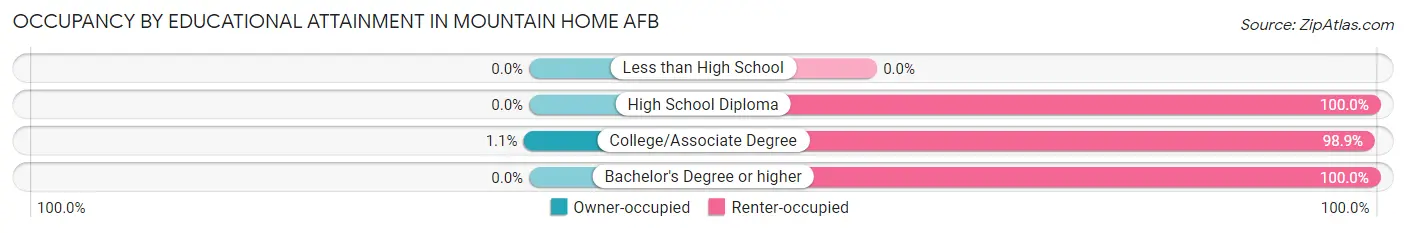
| Household Size | Owner-occupied | Renter-occupied |
| Less than High School | 0 (0.0%) | 0 (0.0%) |
| High School Diploma | 0 (0.0%) | 120 (100.0%) |
| College/Associate Degree | 6 (1.1%) | 523 (98.9%) |
| Bachelor's Degree or higher | 0 (0.0%) | 204 (100.0%) |
Occupancy by Age of Householder in Mountain Home AFB
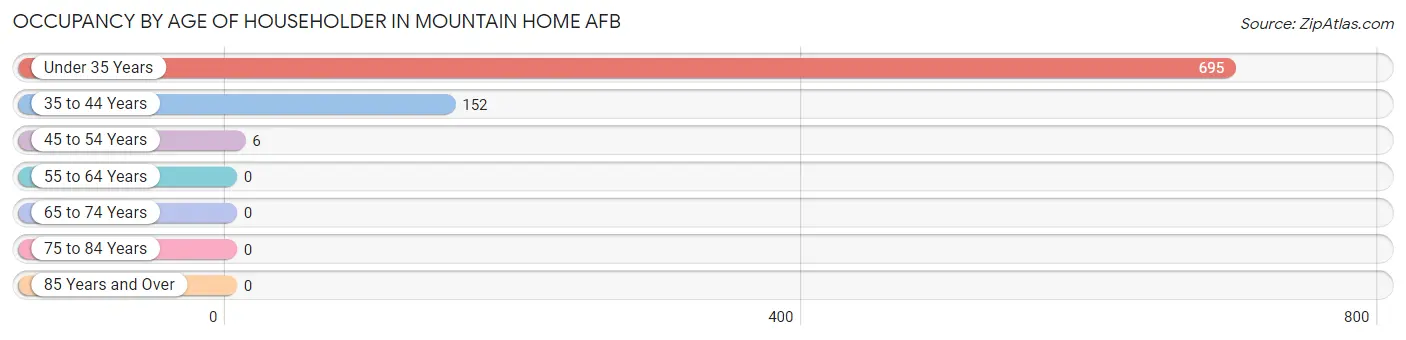
| Age Bracket | # Households | % Households |
| Under 35 Years | 695 | 81.5% |
| 35 to 44 Years | 152 | 17.8% |
| 45 to 54 Years | 6 | 0.7% |
| 55 to 64 Years | 0 | 0.0% |
| 65 to 74 Years | 0 | 0.0% |
| 75 to 84 Years | 0 | 0.0% |
| 85 Years and Over | 0 | 0.0% |
| Total | 853 | 100.0% |
Housing Finances in Mountain Home AFB
Median Income by Occupancy in Mountain Home AFB
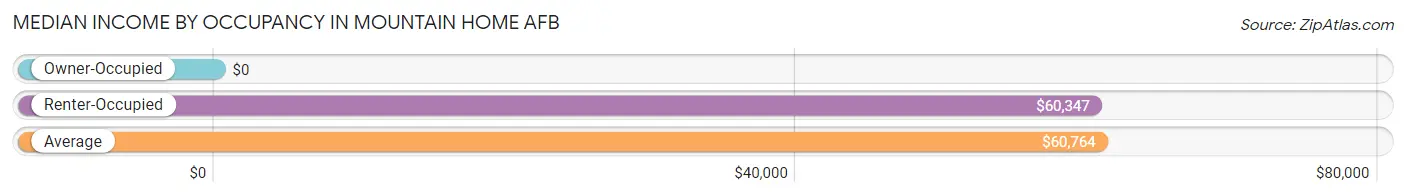
| Occupancy Type | # Households | Median Income |
| Owner-Occupied | 6 (0.7%) | $0 |
| Renter-Occupied | 847 (99.3%) | $60,347 |
| Average | 853 (100.0%) | $60,764 |
Occupancy by Householder Income Bracket in Mountain Home AFB
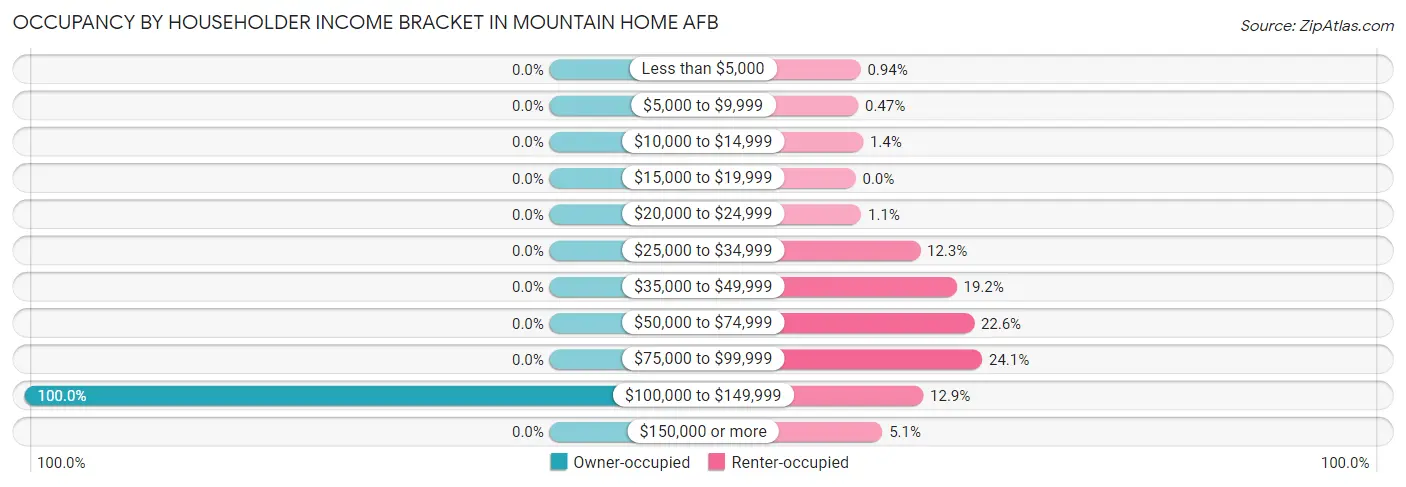
| Income Bracket | Owner-occupied | Renter-occupied |
| Less than $5,000 | 0 (0.0%) | 8 (0.9%) |
| $5,000 to $9,999 | 0 (0.0%) | 4 (0.5%) |
| $10,000 to $14,999 | 0 (0.0%) | 12 (1.4%) |
| $15,000 to $19,999 | 0 (0.0%) | 0 (0.0%) |
| $20,000 to $24,999 | 0 (0.0%) | 9 (1.1%) |
| $25,000 to $34,999 | 0 (0.0%) | 104 (12.3%) |
| $35,000 to $49,999 | 0 (0.0%) | 163 (19.2%) |
| $50,000 to $74,999 | 0 (0.0%) | 191 (22.6%) |
| $75,000 to $99,999 | 0 (0.0%) | 204 (24.1%) |
| $100,000 to $149,999 | 6 (100.0%) | 109 (12.9%) |
| $150,000 or more | 0 (0.0%) | 43 (5.1%) |
| Total | 6 (100.0%) | 847 (100.0%) |
Monthly Housing Cost Tiers in Mountain Home AFB
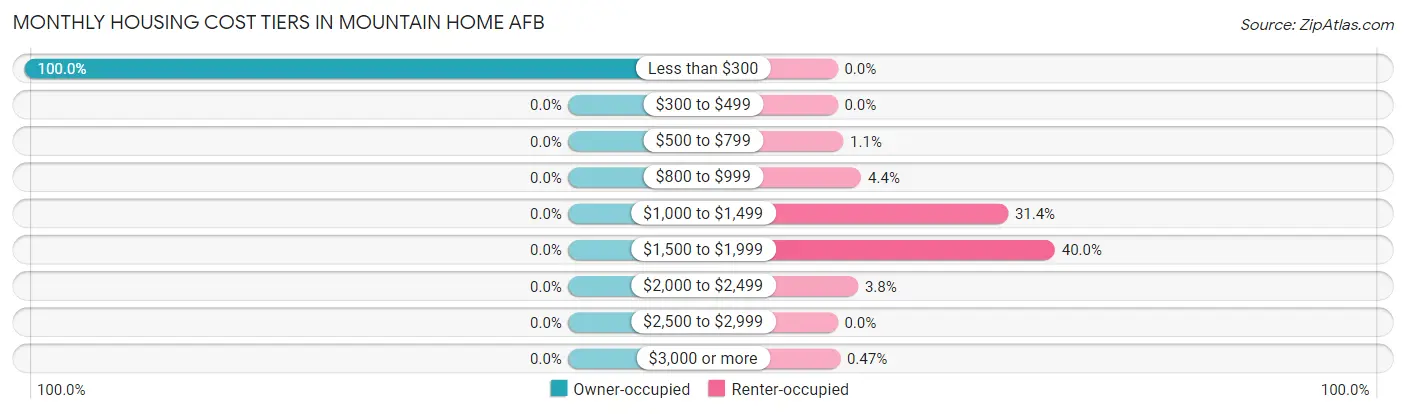
| Monthly Cost | Owner-occupied | Renter-occupied |
| Less than $300 | 6 (100.0%) | 0 (0.0%) |
| $300 to $499 | 0 (0.0%) | 0 (0.0%) |
| $500 to $799 | 0 (0.0%) | 9 (1.1%) |
| $800 to $999 | 0 (0.0%) | 37 (4.4%) |
| $1,000 to $1,499 | 0 (0.0%) | 266 (31.4%) |
| $1,500 to $1,999 | 0 (0.0%) | 339 (40.0%) |
| $2,000 to $2,499 | 0 (0.0%) | 32 (3.8%) |
| $2,500 to $2,999 | 0 (0.0%) | 0 (0.0%) |
| $3,000 or more | 0 (0.0%) | 4 (0.5%) |
| Total | 6 (100.0%) | 847 (100.0%) |
Physical Housing Characteristics in Mountain Home AFB
Housing Structures in Mountain Home AFB
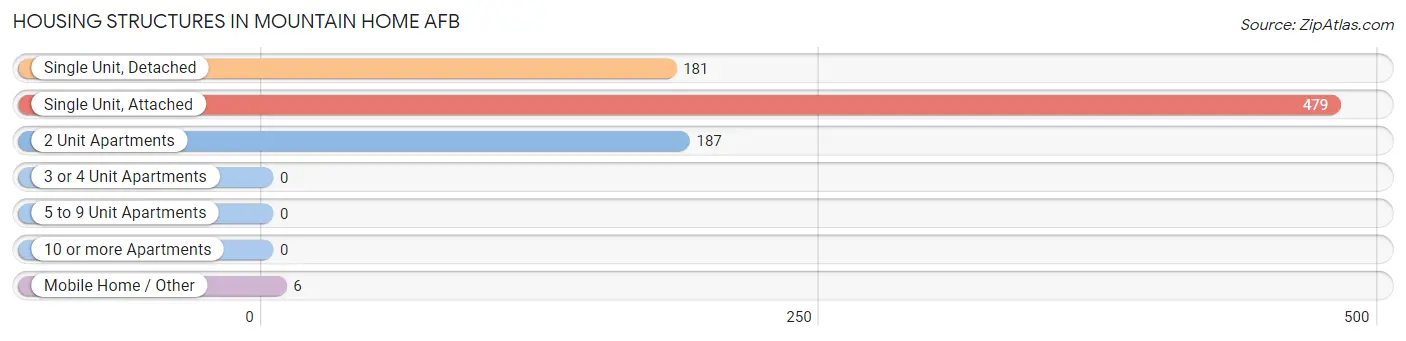
| Structure Type | # Housing Units | % Housing Units |
| Single Unit, Detached | 181 | 21.2% |
| Single Unit, Attached | 479 | 56.1% |
| 2 Unit Apartments | 187 | 21.9% |
| 3 or 4 Unit Apartments | 0 | 0.0% |
| 5 to 9 Unit Apartments | 0 | 0.0% |
| 10 or more Apartments | 0 | 0.0% |
| Mobile Home / Other | 6 | 0.7% |
| Total | 853 | 100.0% |
Housing Structures by Occupancy in Mountain Home AFB
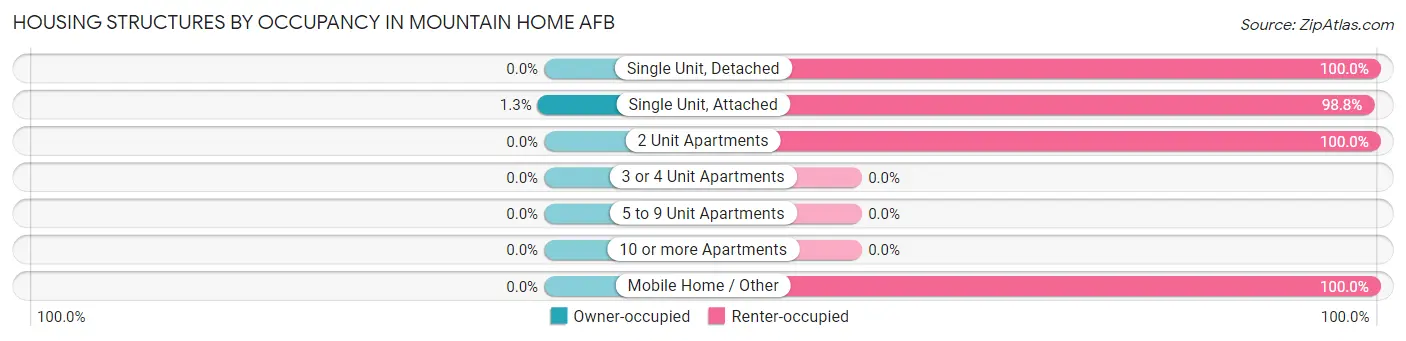
| Structure Type | Owner-occupied | Renter-occupied |
| Single Unit, Detached | 0 (0.0%) | 181 (100.0%) |
| Single Unit, Attached | 6 (1.3%) | 473 (98.8%) |
| 2 Unit Apartments | 0 (0.0%) | 187 (100.0%) |
| 3 or 4 Unit Apartments | 0 (0.0%) | 0 (0.0%) |
| 5 to 9 Unit Apartments | 0 (0.0%) | 0 (0.0%) |
| 10 or more Apartments | 0 (0.0%) | 0 (0.0%) |
| Mobile Home / Other | 0 (0.0%) | 6 (100.0%) |
| Total | 6 (0.7%) | 847 (99.3%) |
Housing Structures by Number of Rooms in Mountain Home AFB
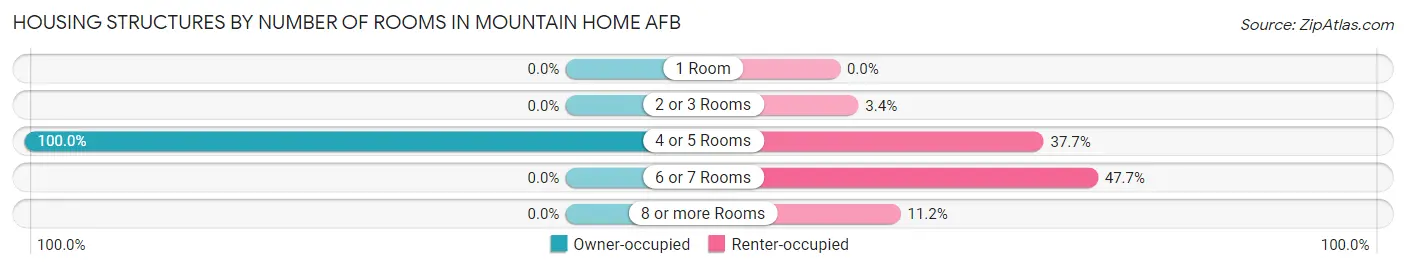
| Number of Rooms | Owner-occupied | Renter-occupied |
| 1 Room | 0 (0.0%) | 0 (0.0%) |
| 2 or 3 Rooms | 0 (0.0%) | 29 (3.4%) |
| 4 or 5 Rooms | 6 (100.0%) | 319 (37.7%) |
| 6 or 7 Rooms | 0 (0.0%) | 404 (47.7%) |
| 8 or more Rooms | 0 (0.0%) | 95 (11.2%) |
| Total | 6 (100.0%) | 847 (100.0%) |
Housing Structure by Heating Type in Mountain Home AFB
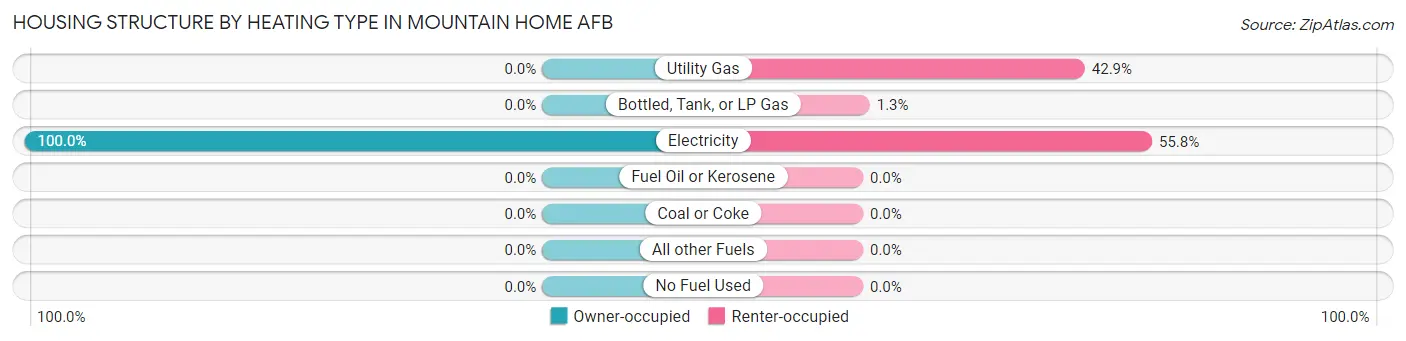
| Heating Type | Owner-occupied | Renter-occupied |
| Utility Gas | 0 (0.0%) | 363 (42.9%) |
| Bottled, Tank, or LP Gas | 0 (0.0%) | 11 (1.3%) |
| Electricity | 6 (100.0%) | 473 (55.8%) |
| Fuel Oil or Kerosene | 0 (0.0%) | 0 (0.0%) |
| Coal or Coke | 0 (0.0%) | 0 (0.0%) |
| All other Fuels | 0 (0.0%) | 0 (0.0%) |
| No Fuel Used | 0 (0.0%) | 0 (0.0%) |
| Total | 6 (100.0%) | 847 (100.0%) |
Household Vehicle Usage in Mountain Home AFB
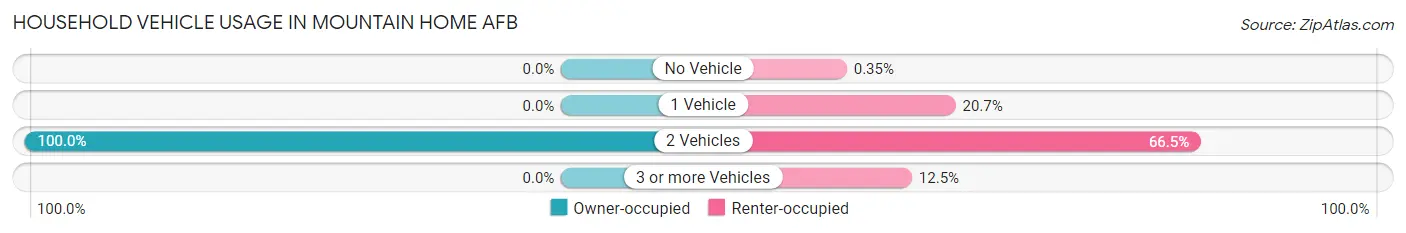
| Vehicles per Household | Owner-occupied | Renter-occupied |
| No Vehicle | 0 (0.0%) | 3 (0.4%) |
| 1 Vehicle | 0 (0.0%) | 175 (20.7%) |
| 2 Vehicles | 6 (100.0%) | 563 (66.5%) |
| 3 or more Vehicles | 0 (0.0%) | 106 (12.5%) |
| Total | 6 (100.0%) | 847 (100.0%) |
Real Estate & Mortgages in Mountain Home AFB
Real Estate and Mortgage Overview in Mountain Home AFB
| Characteristic | Without Mortgage | With Mortgage |
| Housing Units | 6 | 0 |
| Median Property Value | - | - |
| Median Household Income | - | - |
| Monthly Housing Costs | - | - |
| Real Estate Taxes | - | - |
Property Value by Mortgage Status in Mountain Home AFB
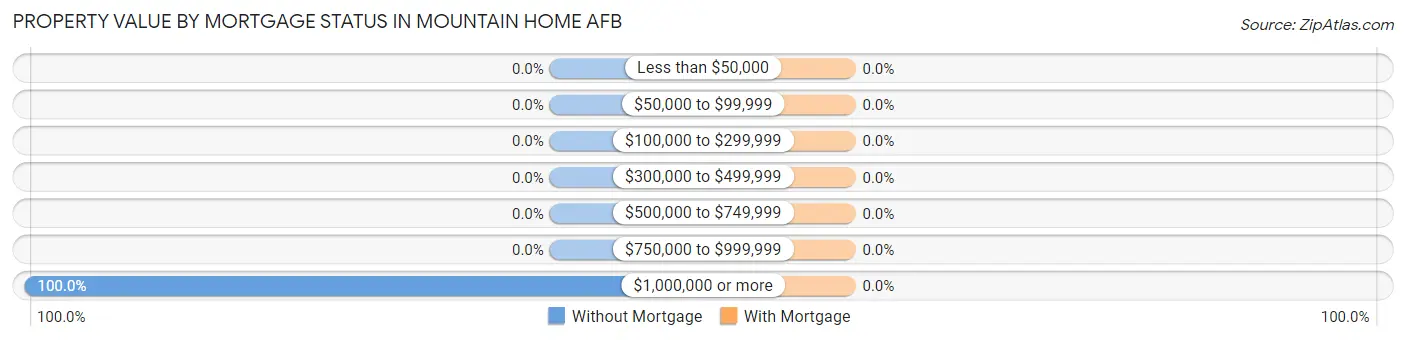
| Property Value | Without Mortgage | With Mortgage |
| Less than $50,000 | 0 (0.0%) | 0 (0.0%) |
| $50,000 to $99,999 | 0 (0.0%) | 0 (0.0%) |
| $100,000 to $299,999 | 0 (0.0%) | 0 (0.0%) |
| $300,000 to $499,999 | 0 (0.0%) | 0 (0.0%) |
| $500,000 to $749,999 | 0 (0.0%) | 0 (0.0%) |
| $750,000 to $999,999 | 0 (0.0%) | 0 (0.0%) |
| $1,000,000 or more | 6 (100.0%) | 0 (0.0%) |
| Total | 6 (100.0%) | 0 (0.0%) |
Household Income by Mortgage Status in Mountain Home AFB
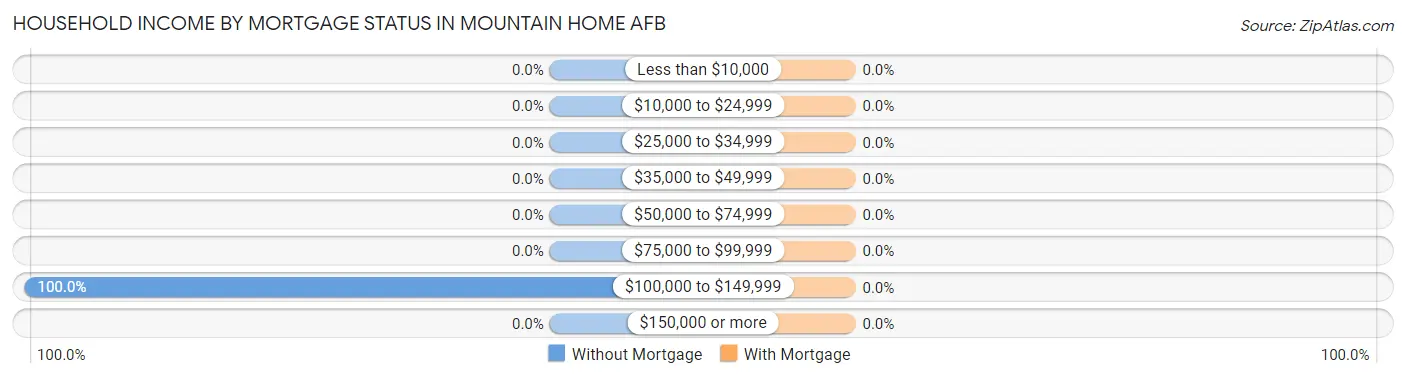
| Household Income | Without Mortgage | With Mortgage |
| Less than $10,000 | 0 (0.0%) | 0 (0.0%) |
| $10,000 to $24,999 | 0 (0.0%) | 0 (0.0%) |
| $25,000 to $34,999 | 0 (0.0%) | 0 (0.0%) |
| $35,000 to $49,999 | 0 (0.0%) | 0 (0.0%) |
| $50,000 to $74,999 | 0 (0.0%) | 0 (0.0%) |
| $75,000 to $99,999 | 0 (0.0%) | 0 (0.0%) |
| $100,000 to $149,999 | 6 (100.0%) | 0 (0.0%) |
| $150,000 or more | 0 (0.0%) | 0 (0.0%) |
| Total | 6 (100.0%) | 0 (0.0%) |
Property Value to Household Income Ratio in Mountain Home AFB
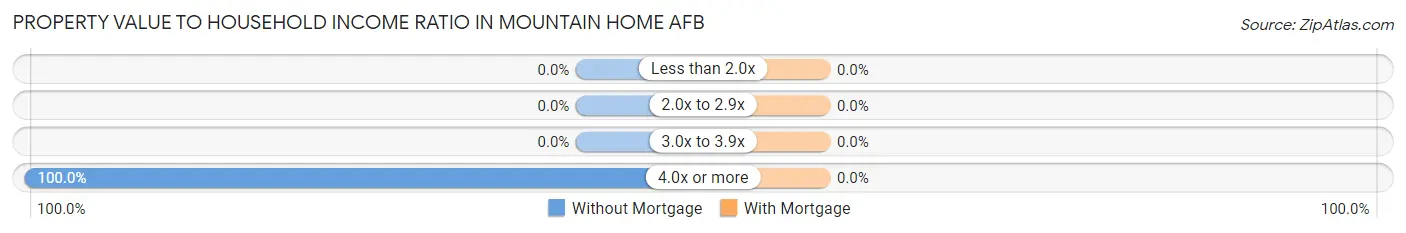
| Value-to-Income Ratio | Without Mortgage | With Mortgage |
| Less than 2.0x | 0 (0.0%) | 0 (0.0%) |
| 2.0x to 2.9x | 0 (0.0%) | 0 (0.0%) |
| 3.0x to 3.9x | 0 (0.0%) | 0 (0.0%) |
| 4.0x or more | 6 (100.0%) | 0 (0.0%) |
| Total | 6 (100.0%) | 0 (0.0%) |
Real Estate Taxes by Mortgage Status in Mountain Home AFB
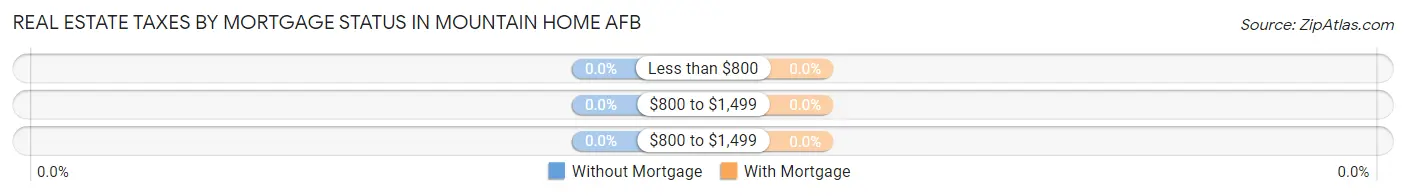
| Property Taxes | Without Mortgage | With Mortgage |
| Less than $800 | 0 (0.0%) | 0 (0.0%) |
| $800 to $1,499 | 0 (0.0%) | 0 (0.0%) |
| $800 to $1,499 | 0 (0.0%) | 0 (0.0%) |
| Total | 6 (100.0%) | 0 (0.0%) |
Health & Disability in Mountain Home AFB
Health Insurance Coverage by Age in Mountain Home AFB
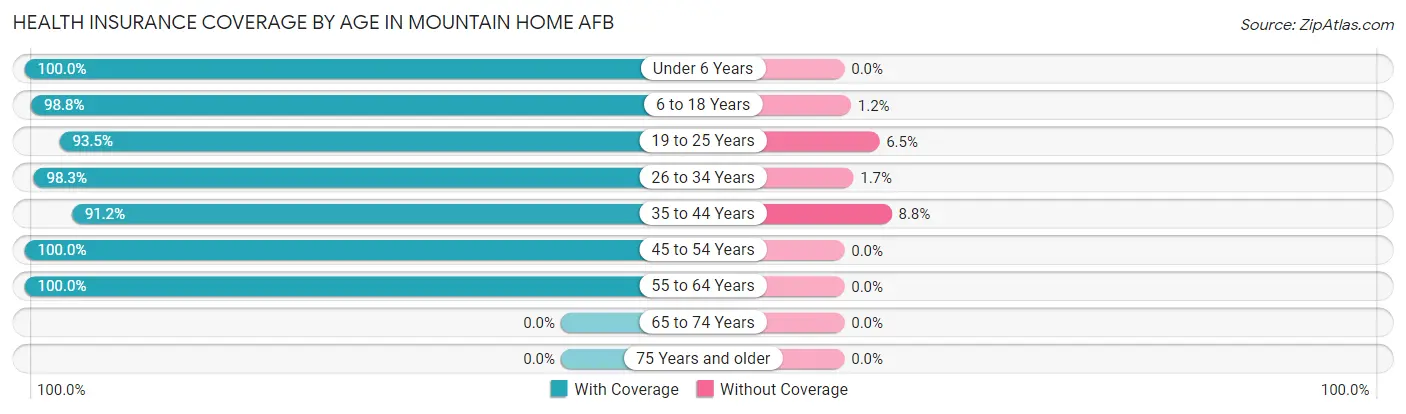
| Age Bracket | With Coverage | Without Coverage |
| Under 6 Years | 459 (100.0%) | 0 (0.0%) |
| 6 to 18 Years | 404 (98.8%) | 5 (1.2%) |
| 19 to 25 Years | 273 (93.5%) | 19 (6.5%) |
| 26 to 34 Years | 351 (98.3%) | 6 (1.7%) |
| 35 to 44 Years | 145 (91.2%) | 14 (8.8%) |
| 45 to 54 Years | 15 (100.0%) | 0 (0.0%) |
| 55 to 64 Years | 7 (100.0%) | 0 (0.0%) |
| 65 to 74 Years | 0 (0.0%) | 0 (0.0%) |
| 75 Years and older | 0 (0.0%) | 0 (0.0%) |
| Total | 1,654 (97.4%) | 44 (2.6%) |
Health Insurance Coverage by Citizenship Status in Mountain Home AFB
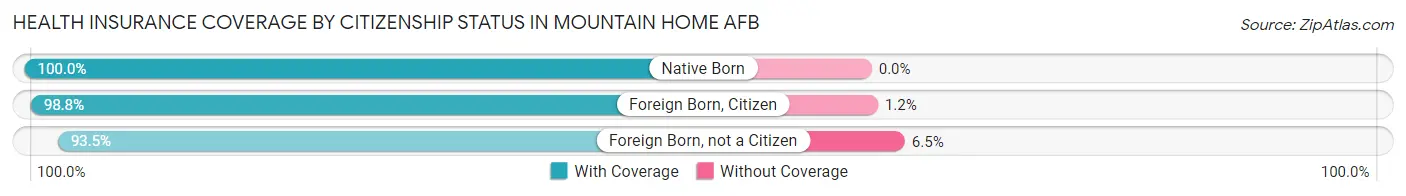
| Citizenship Status | With Coverage | Without Coverage |
| Native Born | 459 (100.0%) | 0 (0.0%) |
| Foreign Born, Citizen | 404 (98.8%) | 5 (1.2%) |
| Foreign Born, not a Citizen | 273 (93.5%) | 19 (6.5%) |
Health Insurance Coverage by Household Income in Mountain Home AFB
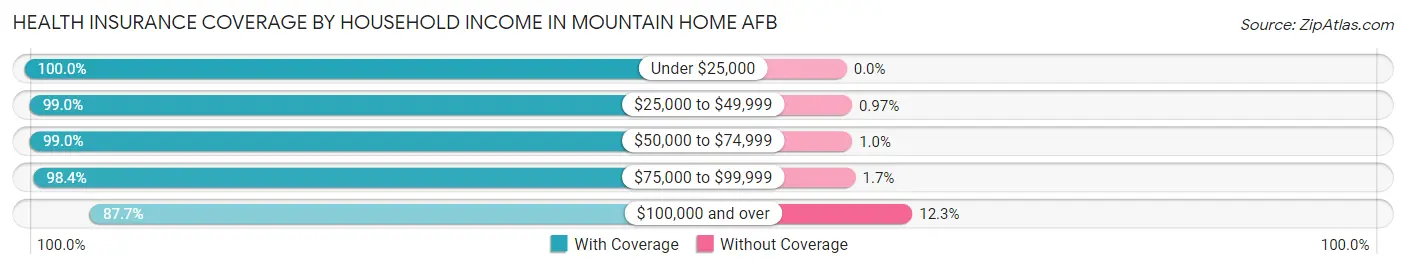
| Household Income | With Coverage | Without Coverage |
| Under $25,000 | 93 (100.0%) | 0 (0.0%) |
| $25,000 to $49,999 | 407 (99.0%) | 4 (1.0%) |
| $50,000 to $74,999 | 484 (99.0%) | 5 (1.0%) |
| $75,000 to $99,999 | 477 (98.4%) | 8 (1.7%) |
| $100,000 and over | 193 (87.7%) | 27 (12.3%) |
Public vs Private Health Insurance Coverage by Age in Mountain Home AFB
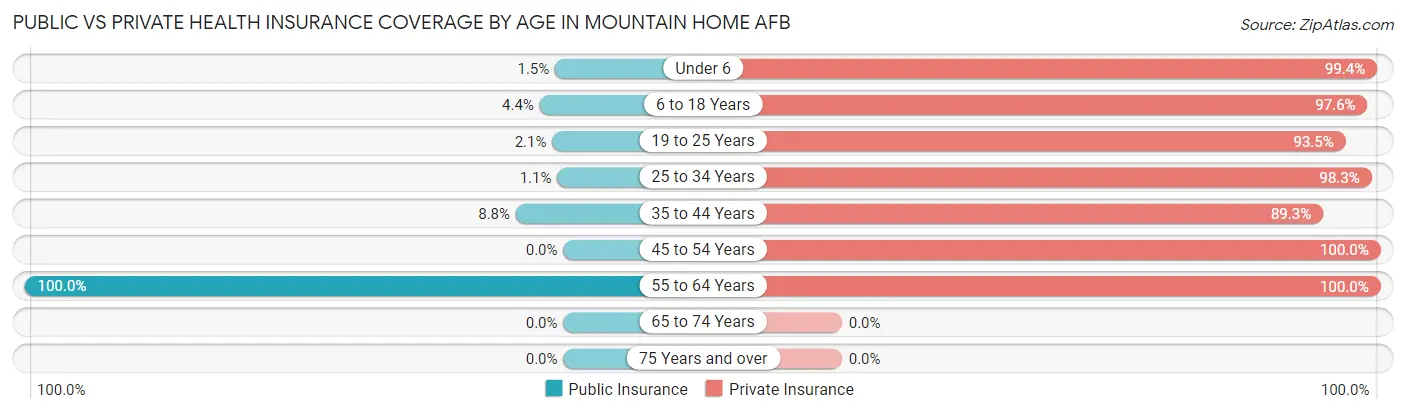
| Age Bracket | Public Insurance | Private Insurance |
| Under 6 | 7 (1.5%) | 456 (99.4%) |
| 6 to 18 Years | 18 (4.4%) | 399 (97.6%) |
| 19 to 25 Years | 6 (2.1%) | 273 (93.5%) |
| 25 to 34 Years | 4 (1.1%) | 351 (98.3%) |
| 35 to 44 Years | 14 (8.8%) | 142 (89.3%) |
| 45 to 54 Years | 0 (0.0%) | 15 (100.0%) |
| 55 to 64 Years | 7 (100.0%) | 7 (100.0%) |
| 65 to 74 Years | 0 (0.0%) | 0 (0.0%) |
| 75 Years and over | 0 (0.0%) | 0 (0.0%) |
| Total | 56 (3.3%) | 1,643 (96.8%) |
Disability Status by Sex by Age in Mountain Home AFB
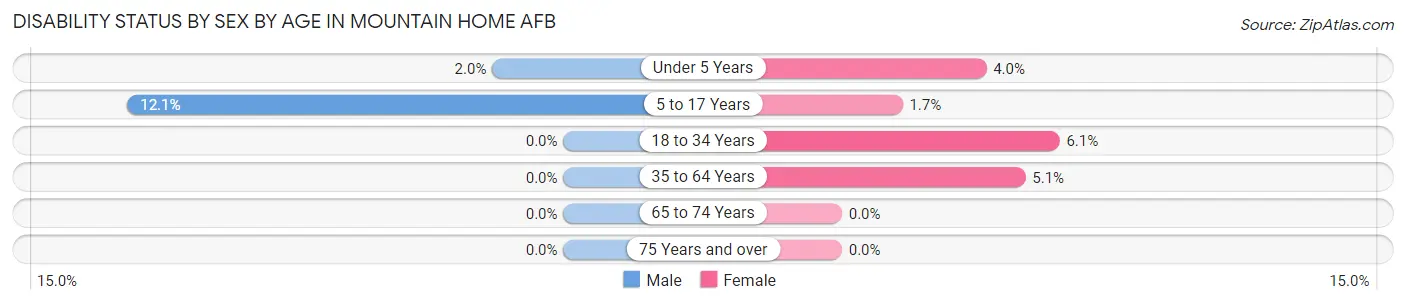
| Age Bracket | Male | Female |
| Under 5 Years | 4 (2.0%) | 7 (4.0%) |
| 5 to 17 Years | 38 (12.1%) | 3 (1.7%) |
| 18 to 34 Years | 0 (0.0%) | 32 (6.1%) |
| 35 to 64 Years | 0 (0.0%) | 7 (5.1%) |
| 65 to 74 Years | 0 (0.0%) | 0 (0.0%) |
| 75 Years and over | 0 (0.0%) | 0 (0.0%) |
Disability Class by Sex by Age in Mountain Home AFB
Disability Class: Hearing Difficulty
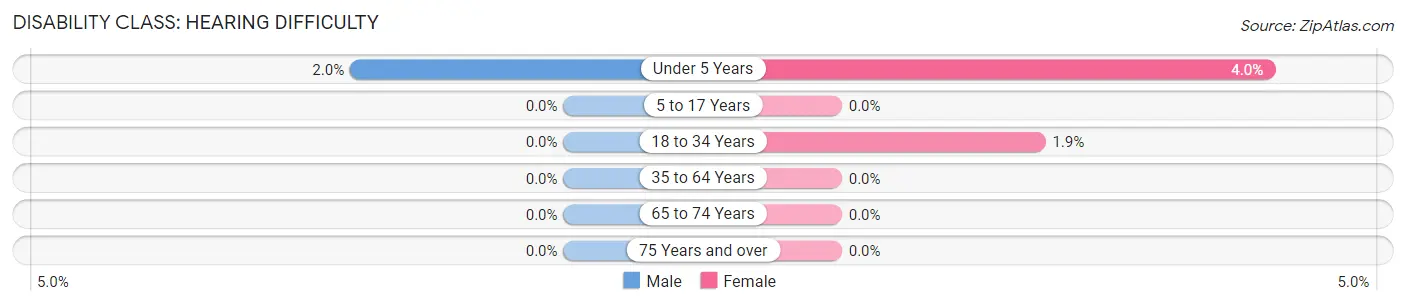
| Age Bracket | Male | Female |
| Under 5 Years | 4 (2.0%) | 7 (4.0%) |
| 5 to 17 Years | 0 (0.0%) | 0 (0.0%) |
| 18 to 34 Years | 0 (0.0%) | 10 (1.9%) |
| 35 to 64 Years | 0 (0.0%) | 0 (0.0%) |
| 65 to 74 Years | 0 (0.0%) | 0 (0.0%) |
| 75 Years and over | 0 (0.0%) | 0 (0.0%) |
Disability Class: Vision Difficulty
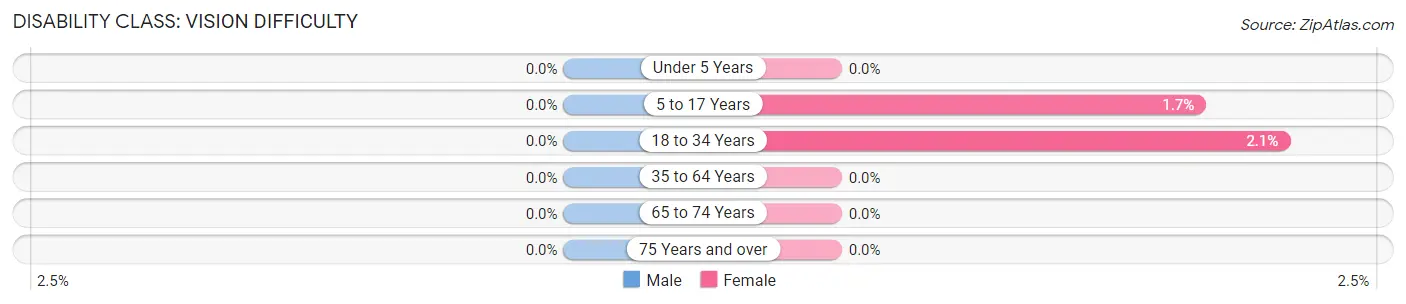
| Age Bracket | Male | Female |
| Under 5 Years | 0 (0.0%) | 0 (0.0%) |
| 5 to 17 Years | 0 (0.0%) | 3 (1.7%) |
| 18 to 34 Years | 0 (0.0%) | 11 (2.1%) |
| 35 to 64 Years | 0 (0.0%) | 0 (0.0%) |
| 65 to 74 Years | 0 (0.0%) | 0 (0.0%) |
| 75 Years and over | 0 (0.0%) | 0 (0.0%) |
Disability Class: Cognitive Difficulty
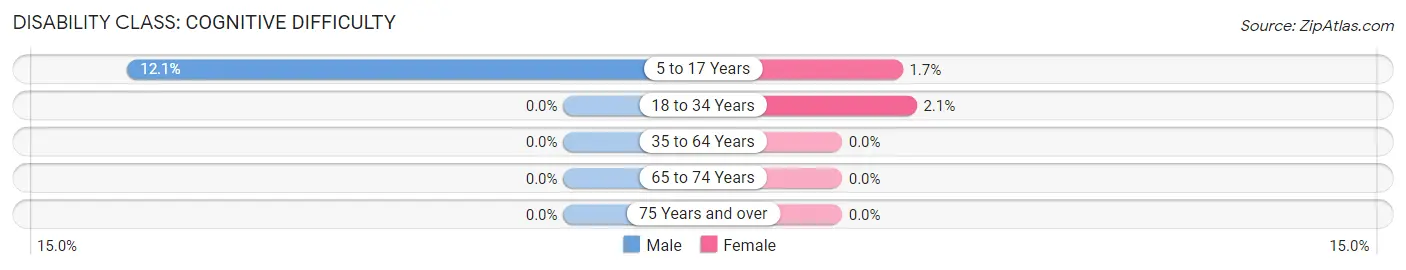
| Age Bracket | Male | Female |
| 5 to 17 Years | 38 (12.1%) | 3 (1.7%) |
| 18 to 34 Years | 0 (0.0%) | 11 (2.1%) |
| 35 to 64 Years | 0 (0.0%) | 0 (0.0%) |
| 65 to 74 Years | 0 (0.0%) | 0 (0.0%) |
| 75 Years and over | 0 (0.0%) | 0 (0.0%) |
Disability Class: Ambulatory Difficulty
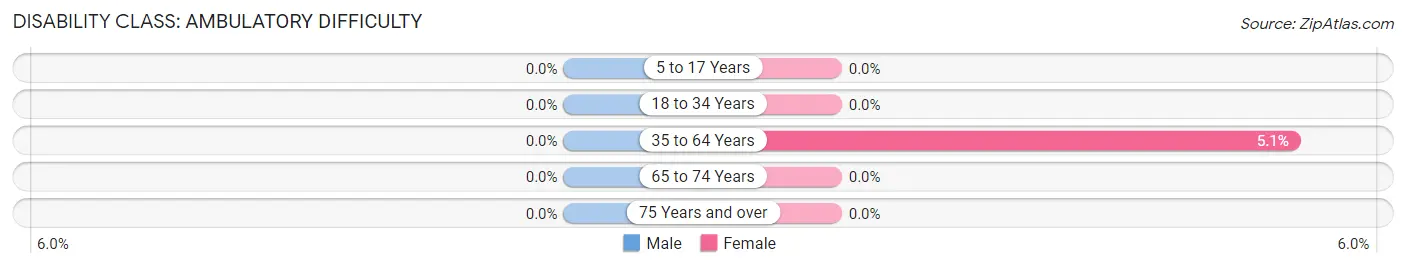
| Age Bracket | Male | Female |
| 5 to 17 Years | 0 (0.0%) | 0 (0.0%) |
| 18 to 34 Years | 0 (0.0%) | 0 (0.0%) |
| 35 to 64 Years | 0 (0.0%) | 7 (5.1%) |
| 65 to 74 Years | 0 (0.0%) | 0 (0.0%) |
| 75 Years and over | 0 (0.0%) | 0 (0.0%) |
Disability Class: Self-Care Difficulty
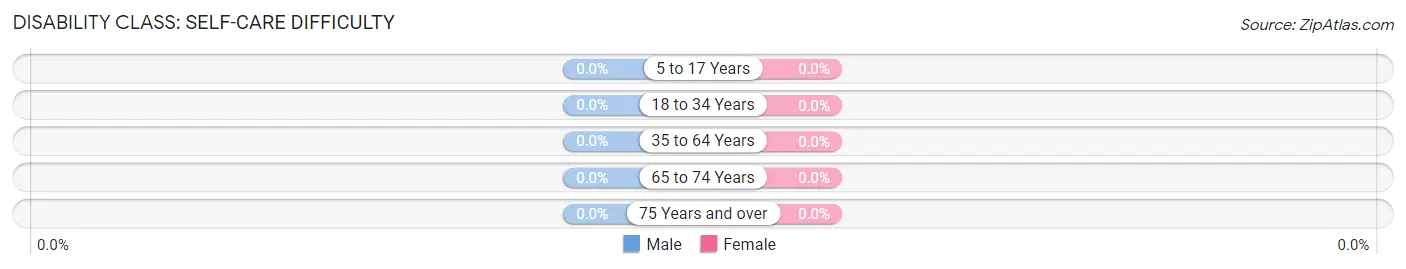
| Age Bracket | Male | Female |
| 5 to 17 Years | 0 (0.0%) | 0 (0.0%) |
| 18 to 34 Years | 0 (0.0%) | 0 (0.0%) |
| 35 to 64 Years | 0 (0.0%) | 0 (0.0%) |
| 65 to 74 Years | 0 (0.0%) | 0 (0.0%) |
| 75 Years and over | 0 (0.0%) | 0 (0.0%) |
Technology Access in Mountain Home AFB
Computing Device Access in Mountain Home AFB
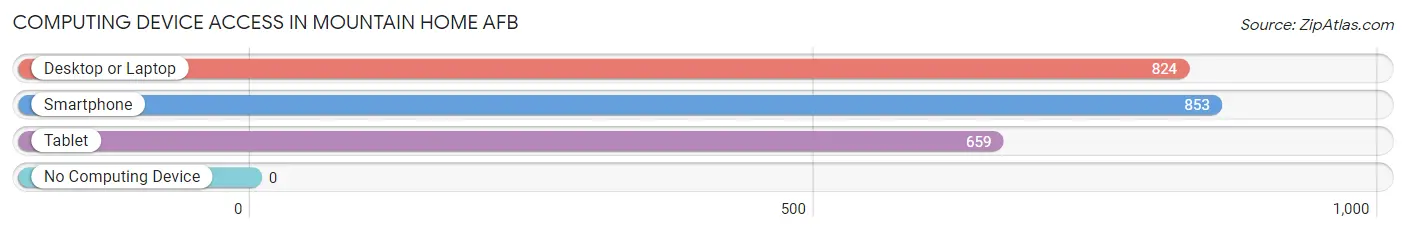
| Device Type | # Households | % Households |
| Desktop or Laptop | 824 | 96.6% |
| Smartphone | 853 | 100.0% |
| Tablet | 659 | 77.3% |
| No Computing Device | 0 | 0.0% |
| Total | 853 | 100.0% |
Internet Access in Mountain Home AFB
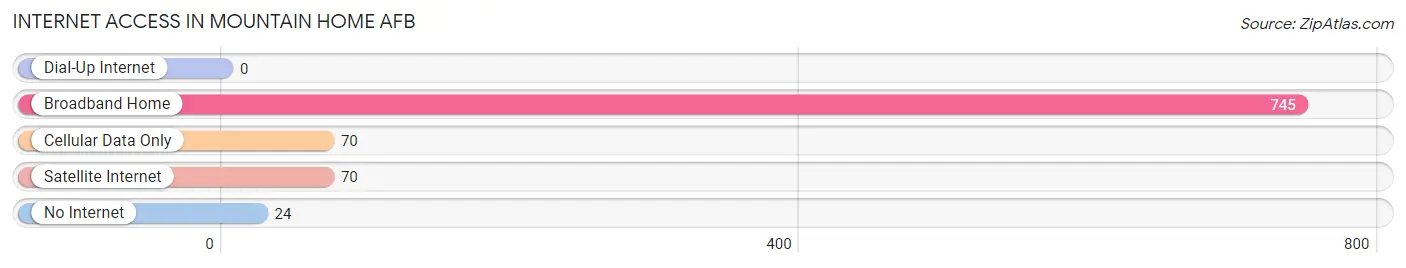
| Internet Type | # Households | % Households |
| Dial-Up Internet | 0 | 0.0% |
| Broadband Home | 745 | 87.3% |
| Cellular Data Only | 70 | 8.2% |
| Satellite Internet | 70 | 8.2% |
| No Internet | 24 | 2.8% |
| Total | 853 | 100.0% |
Mountain Home AFB Summary
Mountain Home Air Force Base (AFB) is located in Elmore County, Idaho, approximately 40 miles southeast of Boise. It is the home of the 366th Fighter Wing, which is part of the Air Combat Command. The base is also home to the Idaho Air National Guard's 124th Fighter Wing. The base was established in 1942 and has been an important part of the local economy ever since.
Geography
Mountain Home AFB is located in the southwestern part of Idaho, in Elmore County. The base is situated in the Snake River Plain, a large area of flat land that stretches from the Rocky Mountains to the Oregon border. The base is surrounded by the Owyhee Mountains to the west, the Boise Mountains to the north, and the Snake River to the east. The base is located at an elevation of 2,890 feet above sea level.
The climate in the area is semi-arid, with hot summers and cold winters. The average annual temperature is around 50 degrees Fahrenheit, with temperatures ranging from the low 30s in the winter to the high 90s in the summer. The area receives an average of 8.5 inches of precipitation per year, with most of it falling in the winter months.
Economy
Mountain Home AFB is a major economic driver for the region. The base has an estimated economic impact of over $1 billion annually, making it one of the largest employers in the state. The base is home to over 5,000 military personnel and civilian employees, and provides jobs for many local businesses.
The base is also home to a number of defense contractors, including Boeing, Lockheed Martin, and Northrop Grumman. These companies provide a variety of services to the base, including aircraft maintenance, logistics, and engineering.
Demographics
As of the 2010 census, the population of Mountain Home AFB was 8,845. The racial makeup of the base was 79.3% White, 8.2% African American, 0.7% Native American, 4.2% Asian, 0.2% Pacific Islander, and 6.6% from other races. The median household income was $50,945, and the median family income was $60,945.
The base is home to a diverse population, with a variety of religious and cultural backgrounds. The base is home to a number of churches, including Catholic, Protestant, and Jewish congregations. The base also has a variety of recreational activities, including a golf course, a bowling alley, and a movie theater.
Conclusion
Mountain Home AFB is an important part of the local economy and community. The base provides jobs for thousands of people, and is home to a diverse population. The base is also home to a number of defense contractors, providing a variety of services to the base. The base is an important part of the local economy, and its presence is felt throughout the region.
Common Questions
What is Per Capita Income in Mountain Home AFB?
Per Capita income in Mountain Home AFB is $25,485.
What is the Median Family Income in Mountain Home AFB?
Median Family Income in Mountain Home AFB is $62,361.
What is the Median Household income in Mountain Home AFB?
Median Household Income in Mountain Home AFB is $60,764.
What is Income or Wage Gap in Mountain Home AFB?
Income or Wage Gap in Mountain Home AFB is 26.4%.
Women in Mountain Home AFB earn 73.6 cents for every dollar earned by a man.
What is Inequality or Gini Index in Mountain Home AFB?
Inequality or Gini Index in Mountain Home AFB is 0.36.
What is the Total Population of Mountain Home AFB?
Total Population of Mountain Home AFB is 3,184.
What is the Total Male Population of Mountain Home AFB?
Total Male Population of Mountain Home AFB is 2,040.
What is the Total Female Population of Mountain Home AFB?
Total Female Population of Mountain Home AFB is 1,144.
What is the Ratio of Males per 100 Females in Mountain Home AFB?
There are 178.32 Males per 100 Females in Mountain Home AFB.
What is the Ratio of Females per 100 Males in Mountain Home AFB?
There are 56.08 Females per 100 Males in Mountain Home AFB.
What is the Median Population Age in Mountain Home AFB?
Median Population Age in Mountain Home AFB is 23.0 Years.
What is the Average Family Size in Mountain Home AFB
Average Family Size in Mountain Home AFB is 3.0 People.
What is the Average Household Size in Mountain Home AFB
Average Household Size in Mountain Home AFB is 2.9 People.
How Large is the Labor Force in Mountain Home AFB?
There are 1,910 People in the Labor Forcein in Mountain Home AFB.
What is the Percentage of People in the Labor Force in Mountain Home AFB?
82.1% of People are in the Labor Force in Mountain Home AFB.
What is the Unemployment Rate in Mountain Home AFB?
Unemployment Rate in Mountain Home AFB is 9.5%.