Earnings by Sex by Educational Attainment in Franklin
Educational Attainment
Male Income
Female Income
Less than High School
-
-
High School Diploma
-
-
College or Associate's Degree
-
-
Bachelor's Degree
-
-
Graduate Degree
-
-
Total
-
-
Family Income in Franklin
Family Income Brackets in Franklin
Income Bracket
# Families
% Families
Less than $10,000
0
0.0%
$10,000 to $14,999
0
0.0%
$15,000 to $24,999
0
0.0%
$25,000 to $34,999
0
0.0%
$35,000 to $49,999
0
0.0%
$50,000 to $74,999
0
0.0%
$75,000 to $99,999
0
0.0%
$100,000 to $149,999
0
0.0%
$150,000 to $199,999
0
0.0%
$200,000+
0
0.0%
Family Income by Famaliy Size in Franklin
Income Bracket
# Families
Median Income
2-Person Families
0 (0.0%)
$0
3-Person Families
0 (0.0%)
$0
4-Person Families
0 (0.0%)
$0
5-Person Families
0 (0.0%)
$0
6-Person Families
0 (0.0%)
$0
7+ Person Families
0 (0.0%)
$0
Total
0 (0.0%)
$0
Family Income by Number of Earners in Franklin
Number of Earners
# Families
Median Income
No Earners
0 (0.0%)
$0
1 Earner
0 (0.0%)
$0
2 Earners
0 (0.0%)
$0
3+ Earners
0 (0.0%)
$0
Total
0 (0.0%)
$0
Household Income in Franklin
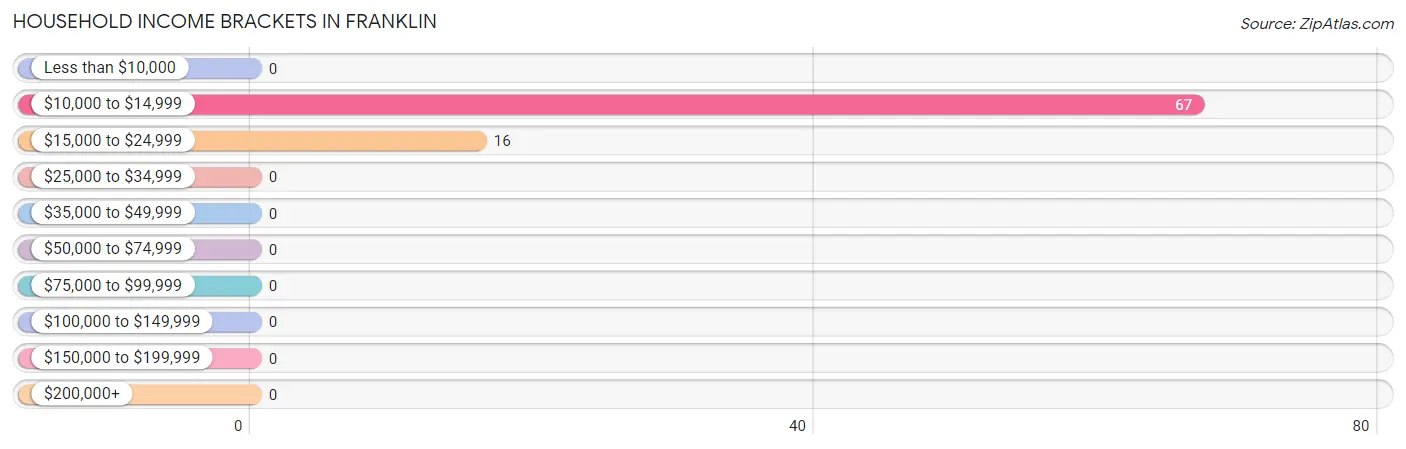
Household Income Brackets in Franklin
With 67 households falling in the category, the $10,000 to $14,999 income range is the most frequent in Franklin, accounting for 80.7% of all households.
Income Bracket
# Households
% Households
Less than $10,000
0
0.0%
$10,000 to $14,999
67
80.7%
$15,000 to $24,999
16
19.3%
$25,000 to $34,999
0
0.0%
$35,000 to $49,999
0
0.0%
$50,000 to $74,999
0
0.0%
$75,000 to $99,999
0
0.0%
$100,000 to $149,999
0
0.0%
$150,000 to $199,999
0
0.0%
$200,000+
0
0.0%
Household Income by Householder Age in Franklin
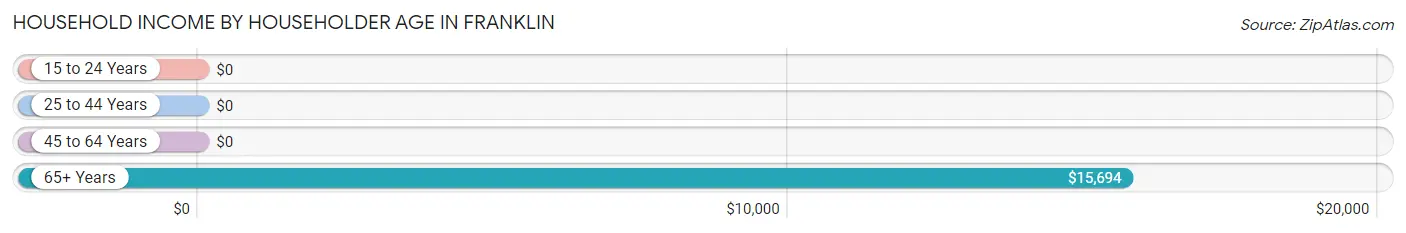
The median household income in Franklin is $13,482, with the highest median household income of $15,694 found in the 65+ years age bracket for the primary householder. A total of 27 households (32.5%) fall into this category.
Income Bracket
# Households
Median Income
15 to 24 Years
0 (0.0%)
$0
25 to 44 Years
25 (30.1%)
$0
45 to 64 Years
31 (37.3%)
$0
65+ Years
27 (32.5%)
$15,694
Total
83 (100.0%)
$13,482
Poverty in Franklin
Income Below Poverty by Sex and Age in Franklin
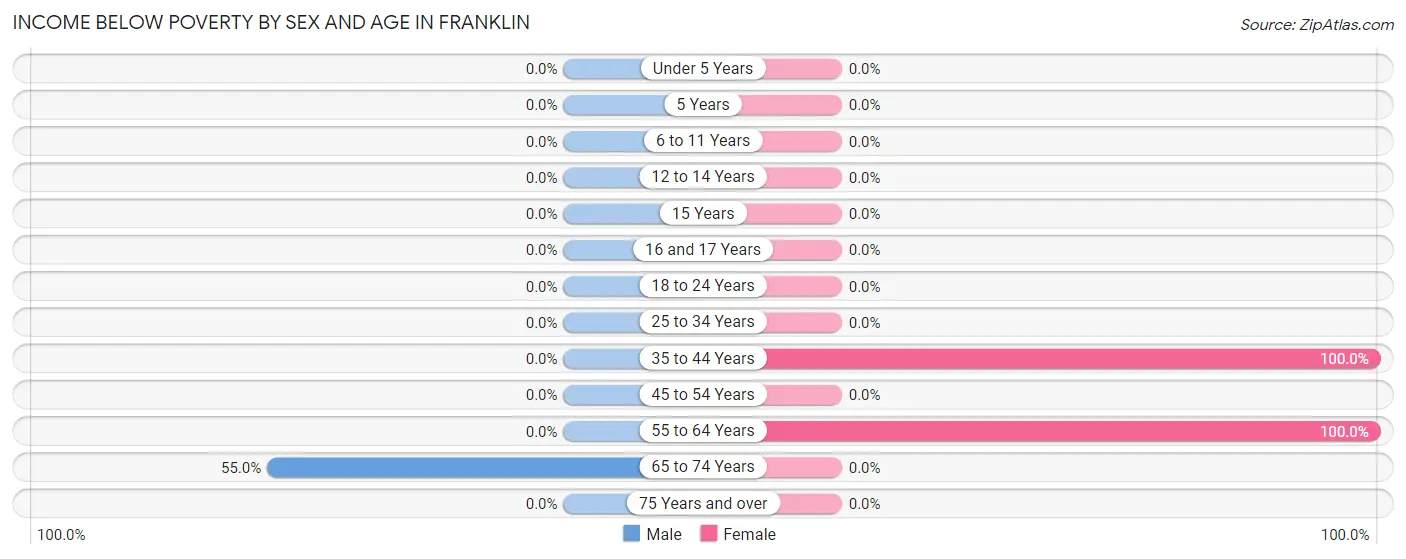
With 40.7% poverty level for males and 100.0% for females among the residents of Franklin, 65 to 74 year old males and 35 to 44 year old females are the most vulnerable to poverty, with 11 males (55.0%) and 25 females (100.0%) in their respective age groups living below the poverty level.
Age Bracket
Male
Female
Under 5 Years
0 (0.0%)
0 (0.0%)
5 Years
0 (0.0%)
0 (0.0%)
6 to 11 Years
0 (0.0%)
0 (0.0%)
12 to 14 Years
0 (0.0%)
0 (0.0%)
15 Years
0 (0.0%)
0 (0.0%)
16 and 17 Years
0 (0.0%)
0 (0.0%)
18 to 24 Years
0 (0.0%)
0 (0.0%)
25 to 34 Years
0 (0.0%)
0 (0.0%)
35 to 44 Years
0 (0.0%)
25 (100.0%)
45 to 54 Years
0 (0.0%)
0 (0.0%)
55 to 64 Years
0 (0.0%)
31 (100.0%)
65 to 74 Years
11 (55.0%)
0 (0.0%)
75 Years and over
0 (0.0%)
0 (0.0%)
Total
11 (40.7%)
56 (100.0%)
Income Above Poverty by Sex and Age in Franklin
Age Bracket
Male
Female
Under 5 Years
0 (0.0%)
0 (0.0%)
5 Years
0 (0.0%)
0 (0.0%)
6 to 11 Years
0 (0.0%)
0 (0.0%)
12 to 14 Years
0 (0.0%)
0 (0.0%)
15 Years
0 (0.0%)
0 (0.0%)
16 and 17 Years
0 (0.0%)
0 (0.0%)
18 to 24 Years
0 (0.0%)
0 (0.0%)
25 to 34 Years
0 (0.0%)
0 (0.0%)
35 to 44 Years
0 (0.0%)
0 (0.0%)
45 to 54 Years
0 (0.0%)
0 (0.0%)
55 to 64 Years
0 (0.0%)
0 (0.0%)
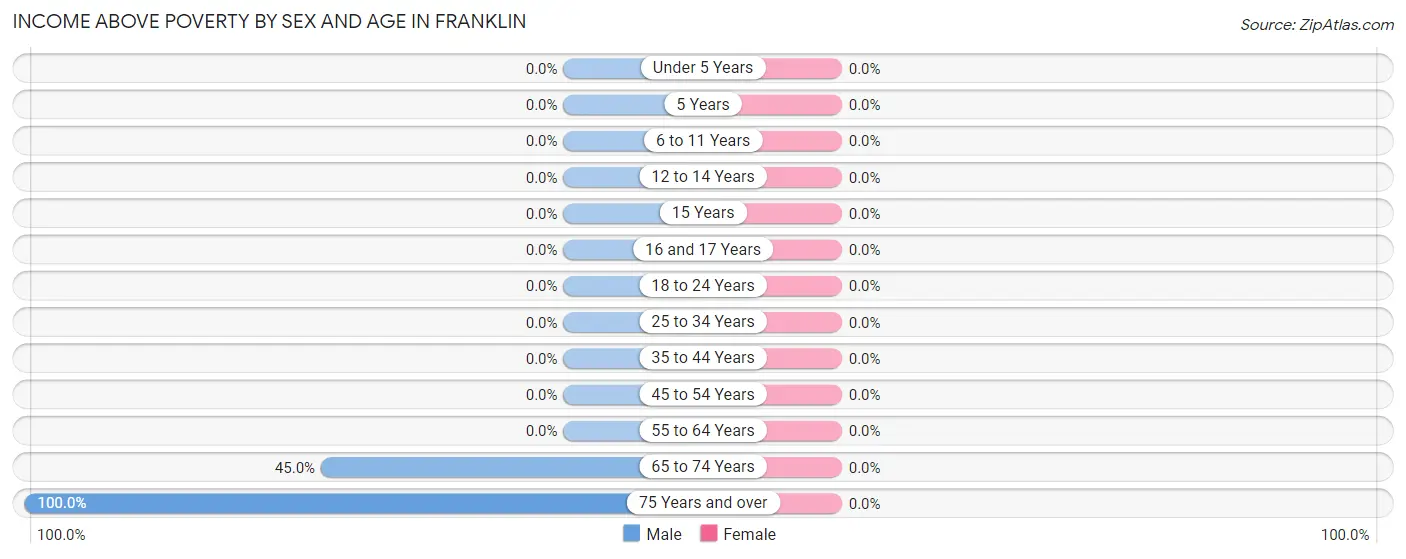
65 to 74 Years
9 (45.0%)
0 (0.0%)
75 Years and over
7 (100.0%)
0 (0.0%)
Total
16 (59.3%)
0 (0.0%)
Income Below Poverty Among Married-Couple Families in Franklin
Children
Above Poverty
Below Poverty
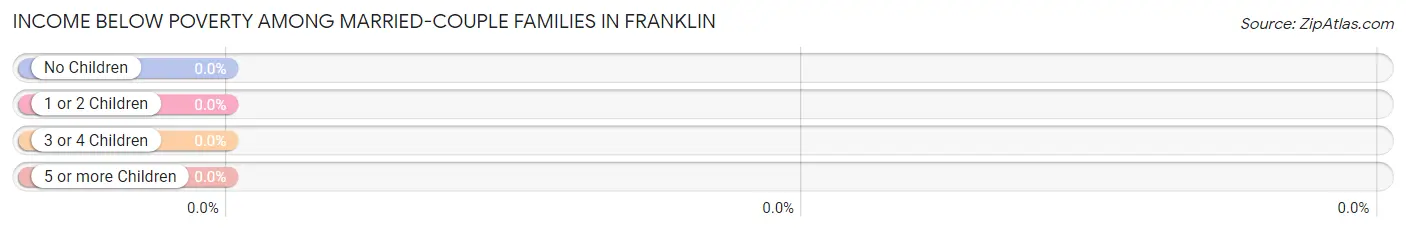
No Children
0 (0.0%)
0 (0.0%)
1 or 2 Children
0 (0.0%)
0 (0.0%)
3 or 4 Children
0 (0.0%)
0 (0.0%)
5 or more Children
0 (0.0%)
0 (0.0%)
Total
0 (0.0%)
0 (0.0%)
Income Below Poverty Among Single-Parent Households in Franklin
Children
Single Father
Single Mother
No Children
0 (0.0%)
0 (0.0%)
1 or 2 Children
0 (0.0%)
0 (0.0%)
3 or 4 Children
0 (0.0%)
0 (0.0%)
5 or more Children
0 (0.0%)
0 (0.0%)
Total
0 (0.0%)
0 (0.0%)
Income Below Poverty Among Married-Couple vs Single-Parent Households in Franklin
Children
Married-Couple Families
Single-Parent Households
No Children
0 (0.0%)
0 (0.0%)
1 or 2 Children
0 (0.0%)
0 (0.0%)
3 or 4 Children
0 (0.0%)
0 (0.0%)
5 or more Children
0 (0.0%)
0 (0.0%)
Total
0 (0.0%)
0 (0.0%)
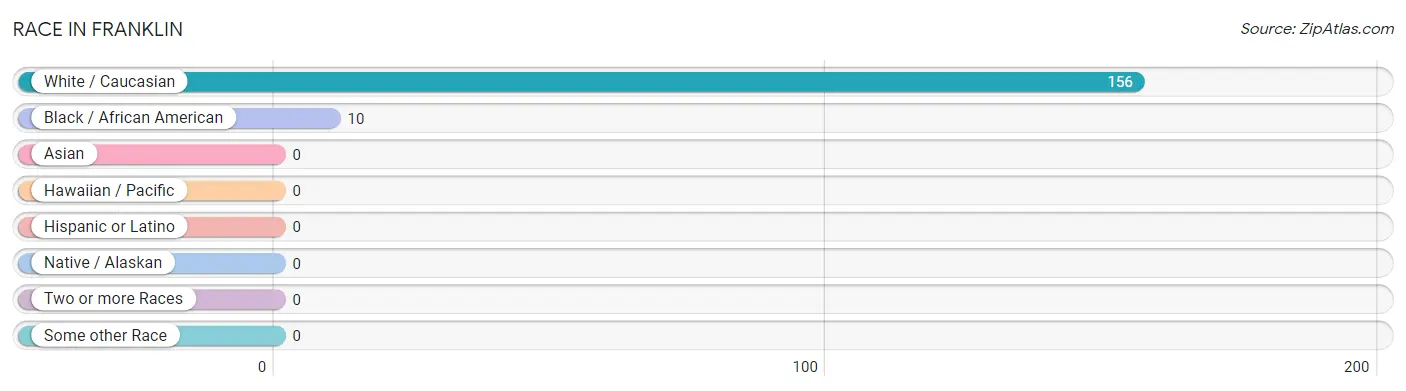
Race in Franklin
The most populous races in Franklin are White / Caucasian (156 | 94.0%), and Black / African American (10 | 6.0%).
Race
# Population
% Population
Asian
0
0.0%
Black / African American
10
6.0%
Hawaiian / Pacific
0
0.0%
Hispanic or Latino
0
0.0%
Native / Alaskan
0
0.0%
White / Caucasian
156
94.0%
Two or more Races
0
0.0%
Some other Race
0
0.0%
Total
166
100.0%
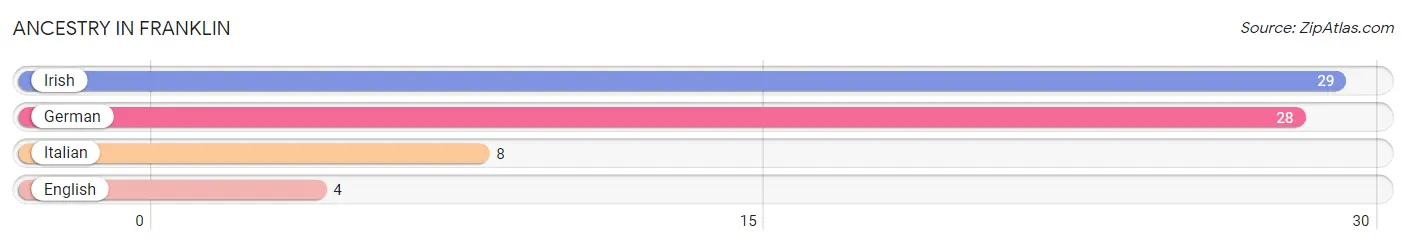
Ancestry in Franklin
The most populous ancestries reported in Franklin are Irish (29 | 17.5%), German (28 | 16.9%), Italian (8 | 4.8%), and English (4 | 2.4%), together accounting for 41.6% of all Franklin residents.
Ancestry
# Population
% Population
English
4
2.4%
German
28
16.9%
Irish
29
17.5%
Italian
8
4.8%
View All 4 Rows
Immigrants in Franklin
Immigration Origin
# Population
% Population
View All 0 Rows
Sex and Age in Franklin
Sex and Age in Franklin
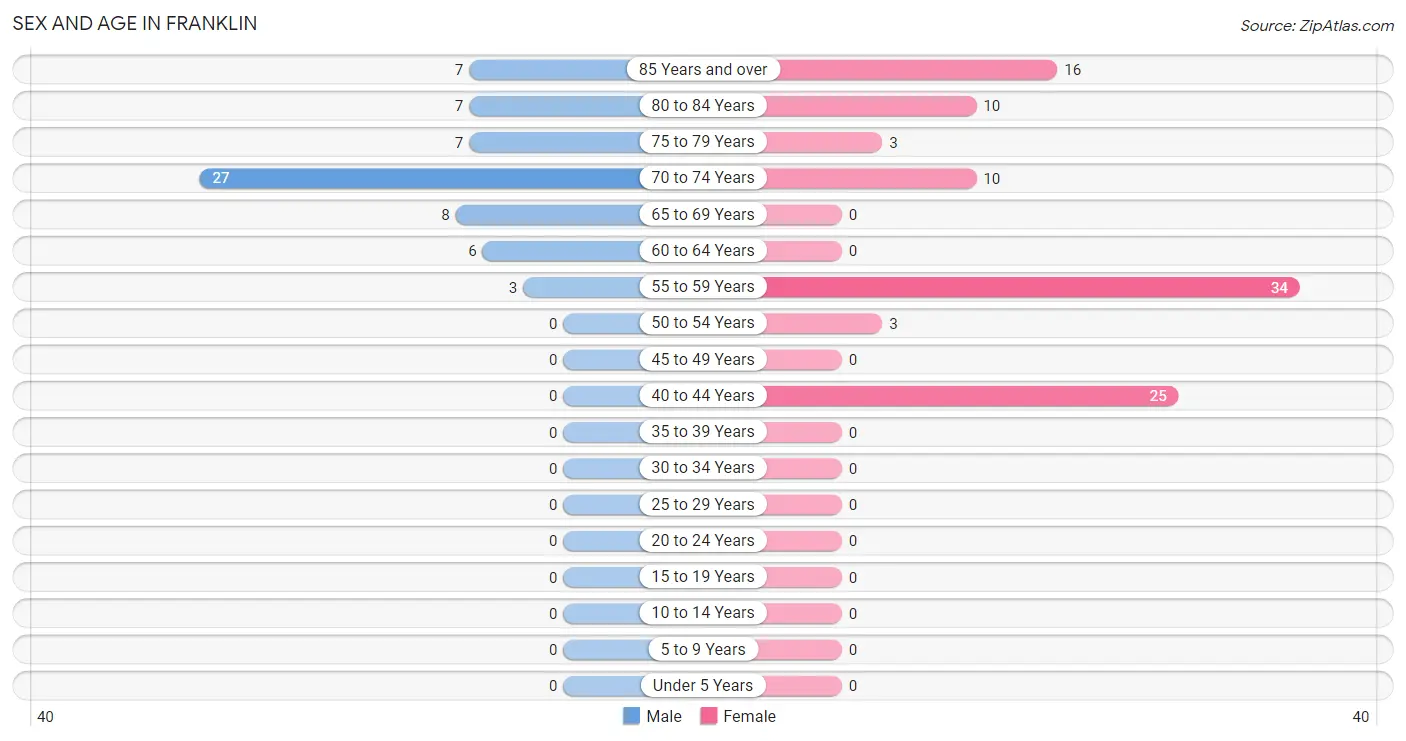
The most populous age groups in Franklin are 70 to 74 Years (27 | 41.5%) for men and 55 to 59 Years (34 | 33.7%) for women.
Age Bracket
Male
Female
Under 5 Years
0 (0.0%)
0 (0.0%)
5 to 9 Years
0 (0.0%)
0 (0.0%)
10 to 14 Years
0 (0.0%)
0 (0.0%)
15 to 19 Years
0 (0.0%)
0 (0.0%)
20 to 24 Years
0 (0.0%)
0 (0.0%)
25 to 29 Years
0 (0.0%)
0 (0.0%)
30 to 34 Years
0 (0.0%)
0 (0.0%)
35 to 39 Years
0 (0.0%)
0 (0.0%)
40 to 44 Years
0 (0.0%)
25 (24.7%)
45 to 49 Years
0 (0.0%)
0 (0.0%)
50 to 54 Years
0 (0.0%)
3 (3.0%)
55 to 59 Years
3 (4.6%)
34 (33.7%)
60 to 64 Years
6 (9.2%)
0 (0.0%)
65 to 69 Years
8 (12.3%)
0 (0.0%)
70 to 74 Years
27 (41.5%)
10 (9.9%)
75 to 79 Years
7 (10.8%)
3 (3.0%)
80 to 84 Years
7 (10.8%)
10 (9.9%)
85 Years and over
7 (10.8%)
16 (15.8%)
Total
65 (100.0%)
101 (100.0%)
Families and Households in Franklin
Median Family Size in Franklin
Family Type
# Families
Family Size
Married-Couple
0 (0.0%)
-
Single Male/Father
0 (0.0%)
-
Single Female/Mother
0 (0.0%)
-
Total Families
0 (0.0%)
-
Median Household Size in Franklin
Household Type
# Households
Household Size
Married-Couple
0 (0.0%)
-
Single Male/Father
0 (0.0%)
-
Single Female/Mother
0 (0.0%)
-
Non-family
83 (100.0%)
-
Total Households
83 (100.0%)
-
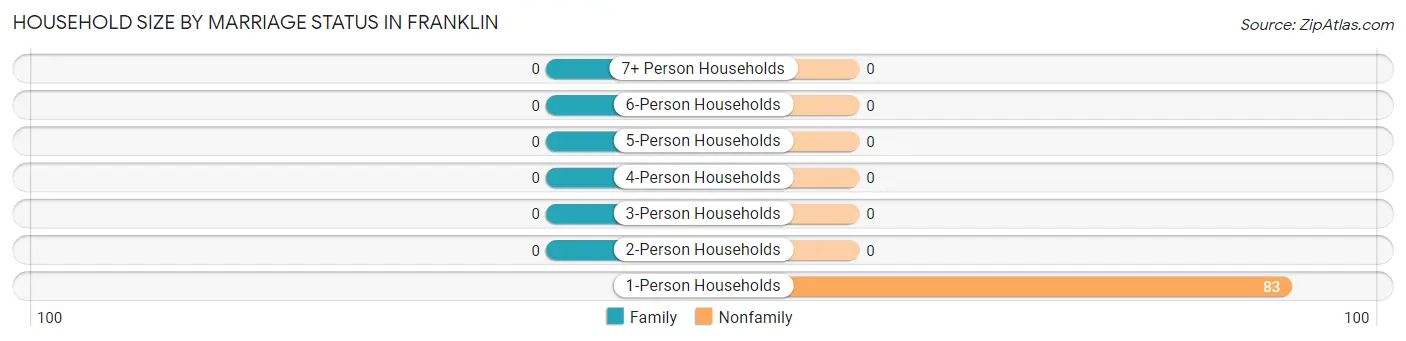
Household Size by Marriage Status in Franklin
Household Size
Family Households
Nonfamily Households
1-Person Households
-
83 (100.0%)
2-Person Households
0 (0.0%)
0 (0.0%)
3-Person Households
0 (0.0%)
0 (0.0%)
4-Person Households
0 (0.0%)
0 (0.0%)
5-Person Households
0 (0.0%)
0 (0.0%)
6-Person Households
0 (0.0%)
0 (0.0%)
7+ Person Households
0 (0.0%)
0 (0.0%)
Total
0 (0.0%)
83 (100.0%)
Female Fertility in Franklin
Fertility by Age in Franklin
Age Bracket
Women with Births
Births / 1,000 Women
15 to 19 years
0 (0.0%)
0.0
20 to 34 years
0 (0.0%)
0.0
35 to 50 years
0 (0.0%)
0.0
Total
0 (0.0%)
0.0
Fertility by Age by Marriage Status in Franklin
Age Bracket
Married
Unmarried
15 to 19 years
0 (0.0%)
0 (0.0%)
20 to 34 years
0 (0.0%)
0 (0.0%)
35 to 50 years
0 (0.0%)
0 (0.0%)
Total
0 (0.0%)
0 (0.0%)
Fertility by Education in Franklin
Educational Attainment
Women with Births
Births / 1,000 Women
Less than High School
0 (0.0%)
0.0
High School Diploma
0 (0.0%)
0.0
College or Associate's Degree
0 (0.0%)
0.0
Bachelor's Degree
0 (0.0%)
0.0
Graduate Degree
0 (0.0%)
0.0
Total
0 (0.0%)
0.0
Fertility by Education by Marriage Status in Franklin
Educational Attainment
Married
Unmarried
Less than High School
0 (0.0%)
0 (0.0%)
High School Diploma
0 (0.0%)
0 (0.0%)
College or Associate's Degree
0 (0.0%)
0 (0.0%)
Bachelor's Degree
0 (0.0%)
0 (0.0%)
Graduate Degree
0 (0.0%)
0 (0.0%)
Total
0 (0.0%)
0 (0.0%)
Employment Characteristics in Franklin
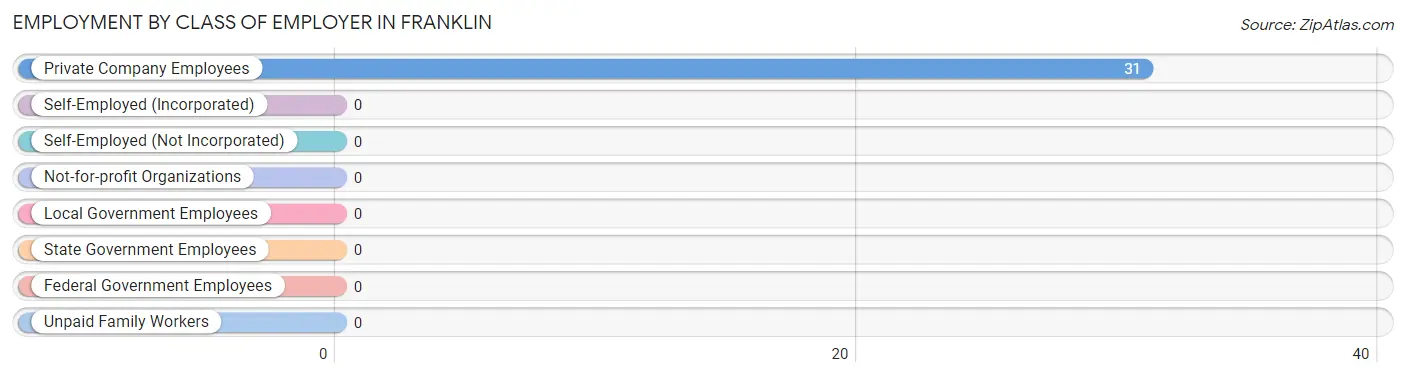
Employment by Class of Employer in Franklin
Among the 31 employed individuals in Franklin, , and private company employees (31 | 100.0%) make up the most common classes of employment.
Employer Class
# Employees
% Employees
Private Company Employees
31
100.0%
Self-Employed (Incorporated)
0
0.0%
Self-Employed (Not Incorporated)
0
0.0%
Not-for-profit Organizations
0
0.0%
Local Government Employees
0
0.0%
State Government Employees
0
0.0%
Federal Government Employees
0
0.0%
Unpaid Family Workers
0
0.0%
Total
31
100.0%
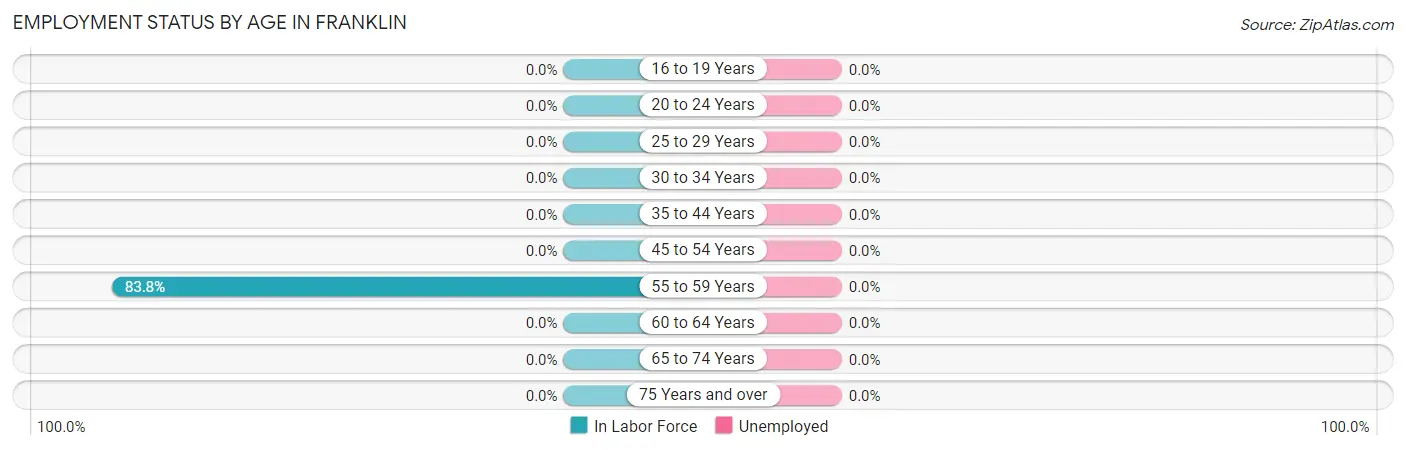
Employment Status by Age in Franklin
Age Bracket
In Labor Force
Unemployed
16 to 19 Years
0 (0.0%)
0 (0.0%)
20 to 24 Years
0 (0.0%)
0 (0.0%)
25 to 29 Years
0 (0.0%)
0 (0.0%)
30 to 34 Years
0 (0.0%)
0 (0.0%)
35 to 44 Years
0 (0.0%)
0 (0.0%)
45 to 54 Years
0 (0.0%)
0 (0.0%)
55 to 59 Years
31 (83.8%)
0 (0.0%)
60 to 64 Years
0 (0.0%)
0 (0.0%)
65 to 74 Years
0 (0.0%)
0 (0.0%)
75 Years and over
0 (0.0%)
0 (0.0%)
Total
31 (18.7%)
0 (0.0%)
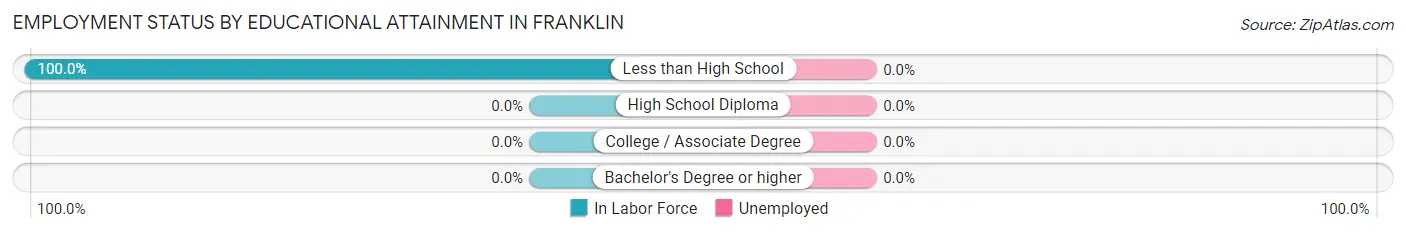
Employment Status by Educational Attainment in Franklin
Educational Attainment
In Labor Force
Unemployed
Less than High School
31 (100.0%)
0 (0.0%)
High School Diploma
0 (0.0%)
0 (0.0%)
College / Associate Degree
0 (0.0%)
0 (0.0%)
Bachelor's Degree or higher
0 (0.0%)
0 (0.0%)
Total
31 (43.7%)
0 (0.0%)
Employment Occupations by Sex in Franklin
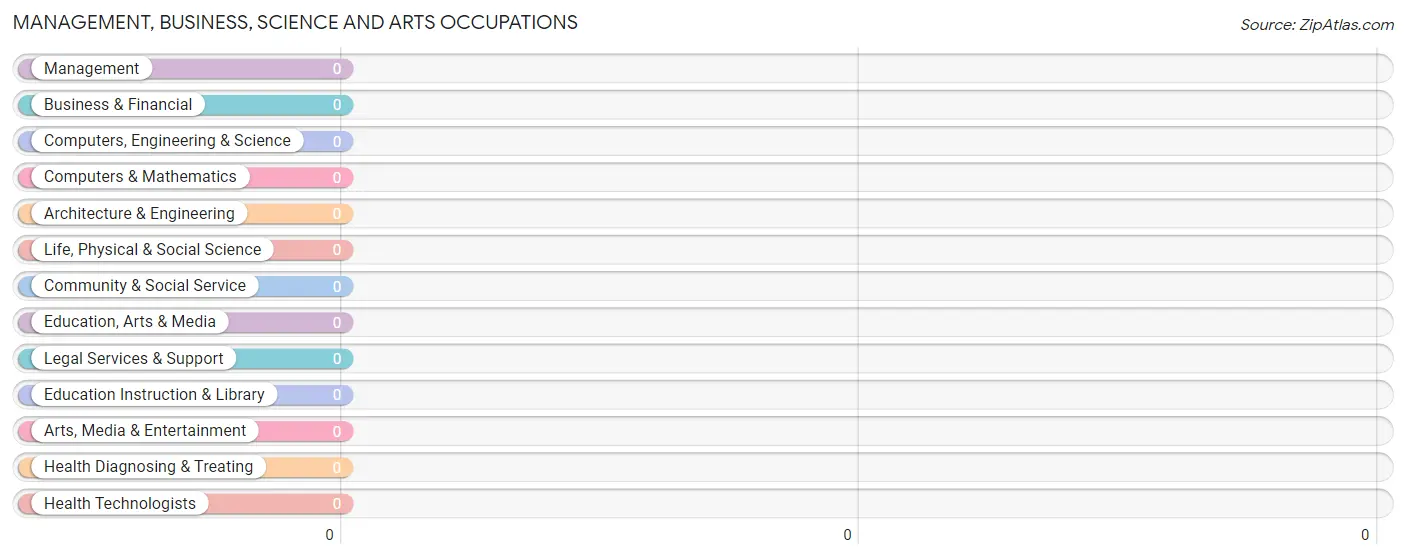
Management, Business, Science and Arts Occupations
Management, Business, Science and Arts Occupations by Sex
Occupation
Male
Female
Management
0 (0.0%)
0 (0.0%)
Business & Financial
0 (0.0%)
0 (0.0%)
Computers, Engineering & Science
0 (0.0%)
0 (0.0%)
Computers & Mathematics
0 (0.0%)
0 (0.0%)
Architecture & Engineering
0 (0.0%)
0 (0.0%)
Life, Physical & Social Science
0 (0.0%)
0 (0.0%)
Community & Social Service
0 (0.0%)
0 (0.0%)
Education, Arts & Media
0 (0.0%)
0 (0.0%)
Legal Services & Support
0 (0.0%)
0 (0.0%)
Education Instruction & Library
0 (0.0%)
0 (0.0%)
Arts, Media & Entertainment
0 (0.0%)
0 (0.0%)
Health Diagnosing & Treating
0 (0.0%)
0 (0.0%)
Health Technologists
0 (0.0%)
0 (0.0%)
Total (Category)
0 (0.0%)
0 (0.0%)
Total (Overall)
0 (0.0%)
31 (100.0%)
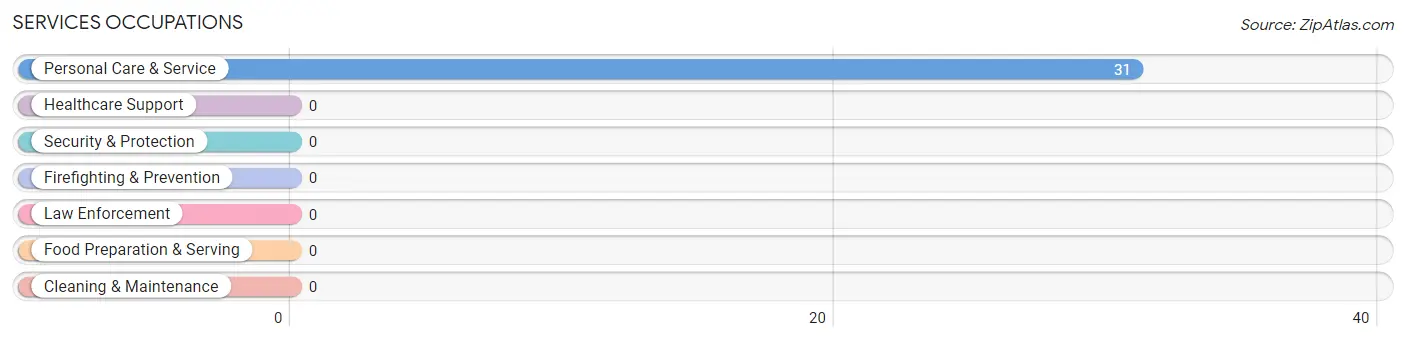
Services Occupations
The most common Services occupations in Franklin are , and Personal Care & Service (31 | 100.0%).
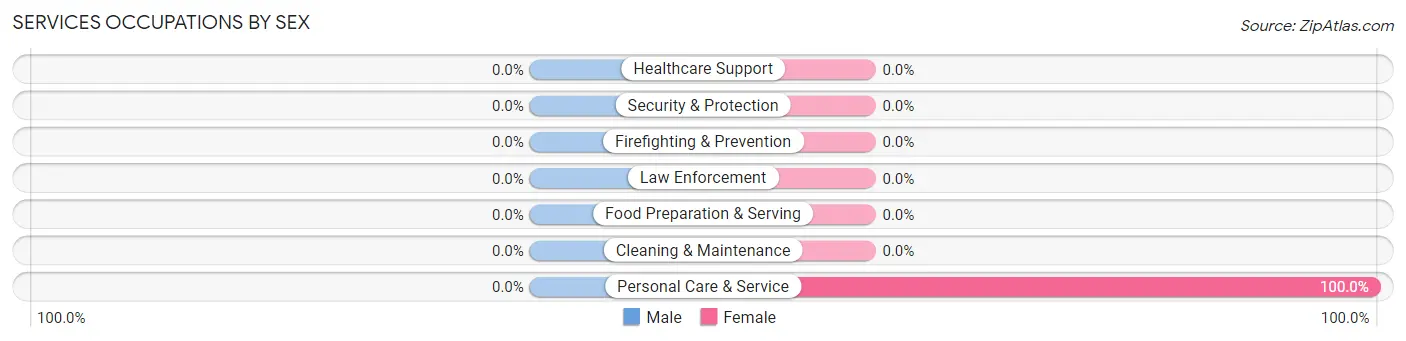
Services Occupations by Sex
Occupation
Male
Female
Healthcare Support
0 (0.0%)
0 (0.0%)
Security & Protection
0 (0.0%)
0 (0.0%)
Firefighting & Prevention
0 (0.0%)
0 (0.0%)
Law Enforcement
0 (0.0%)
0 (0.0%)
Food Preparation & Serving
0 (0.0%)
0 (0.0%)
Cleaning & Maintenance
0 (0.0%)
0 (0.0%)
Personal Care & Service
0 (0.0%)
31 (100.0%)
Total (Category)
0 (0.0%)
31 (100.0%)
Total (Overall)
0 (0.0%)
31 (100.0%)
Sales and Office Occupations
Sales and Office Occupations by Sex
Occupation
Male
Female
Sales & Related
0 (0.0%)
0 (0.0%)
Office & Administration
0 (0.0%)
0 (0.0%)
Total (Category)
0 (0.0%)
0 (0.0%)
Total (Overall)
0 (0.0%)
31 (100.0%)
Natural Resources, Construction and Maintenance Occupations
Natural Resources, Construction and Maintenance Occupations by Sex
Occupation
Male
Female
Farming, Fishing & Forestry
0 (0.0%)
0 (0.0%)
Construction & Extraction
0 (0.0%)
0 (0.0%)
Installation, Maintenance & Repair
0 (0.0%)
0 (0.0%)
Total (Category)
0 (0.0%)
0 (0.0%)
Total (Overall)
0 (0.0%)
31 (100.0%)
Production, Transportation and Moving Occupations
Production, Transportation and Moving Occupations by Sex
Occupation
Male
Female
Production
0 (0.0%)
0 (0.0%)
Transportation
0 (0.0%)
0 (0.0%)
Material Moving
0 (0.0%)
0 (0.0%)
Total (Category)
0 (0.0%)
0 (0.0%)
Total (Overall)
0 (0.0%)
31 (100.0%)
Employment Industries by Sex in Franklin
Employment Industries in Franklin
Employment Industries by Sex in Franklin
Industry
Male
Female
Agriculture, Fishing & Hunting
0 (0.0%)
0 (0.0%)
Mining, Quarrying, & Extraction
0 (0.0%)
0 (0.0%)
Construction
0 (0.0%)
0 (0.0%)
Manufacturing
0 (0.0%)
0 (0.0%)
Wholesale Trade
0 (0.0%)
0 (0.0%)
Retail Trade
0 (0.0%)
0 (0.0%)
Transportation & Warehousing
0 (0.0%)
0 (0.0%)
Utilities
0 (0.0%)
0 (0.0%)
Information
0 (0.0%)
0 (0.0%)
Finance & Insurance
0 (0.0%)
0 (0.0%)
Real Estate, Rental & Leasing
0 (0.0%)
0 (0.0%)
Professional & Scientific
0 (0.0%)
0 (0.0%)
Enterprise Management
0 (0.0%)
0 (0.0%)
Administrative & Support
0 (0.0%)
0 (0.0%)
Educational Services
0 (0.0%)
0 (0.0%)
Health Care & Social Assistance
0 (0.0%)
0 (0.0%)
Arts, Entertainment & Recreation
0 (0.0%)
0 (0.0%)
Accommodation & Food Services
0 (0.0%)
0 (0.0%)
Public Administration
0 (0.0%)
0 (0.0%)
Total
0 (0.0%)
31 (100.0%)
Education in Franklin
School Enrollment in Franklin
School Level
# Students
% Students
Nursery / Preschool
0
0.0%
Kindergarten
0
0.0%
Elementary School
0
0.0%
Middle School
0
0.0%
High School
0
0.0%
College / Undergraduate
0
0.0%
Graduate / Professional
0
0.0%
Total
0
0.0%
School Enrollment by Age by Funding Source in Franklin
Age Bracket
Public School
Private School
3 to 4 Year Olds
0 (0.0%)
0 (0.0%)
5 to 9 Year Old
0 (0.0%)
0 (0.0%)
10 to 14 Year Olds
0 (0.0%)
0 (0.0%)
15 to 17 Year Olds
0 (0.0%)
0 (0.0%)
18 to 19 Year Olds
0 (0.0%)
0 (0.0%)
20 to 24 Year Olds
0 (0.0%)
0 (0.0%)
25 to 34 Year Olds
0 (0.0%)
0 (0.0%)
35 Years and over
0 (0.0%)
0 (0.0%)
Total
0 (0.0%)
0 (0.0%)
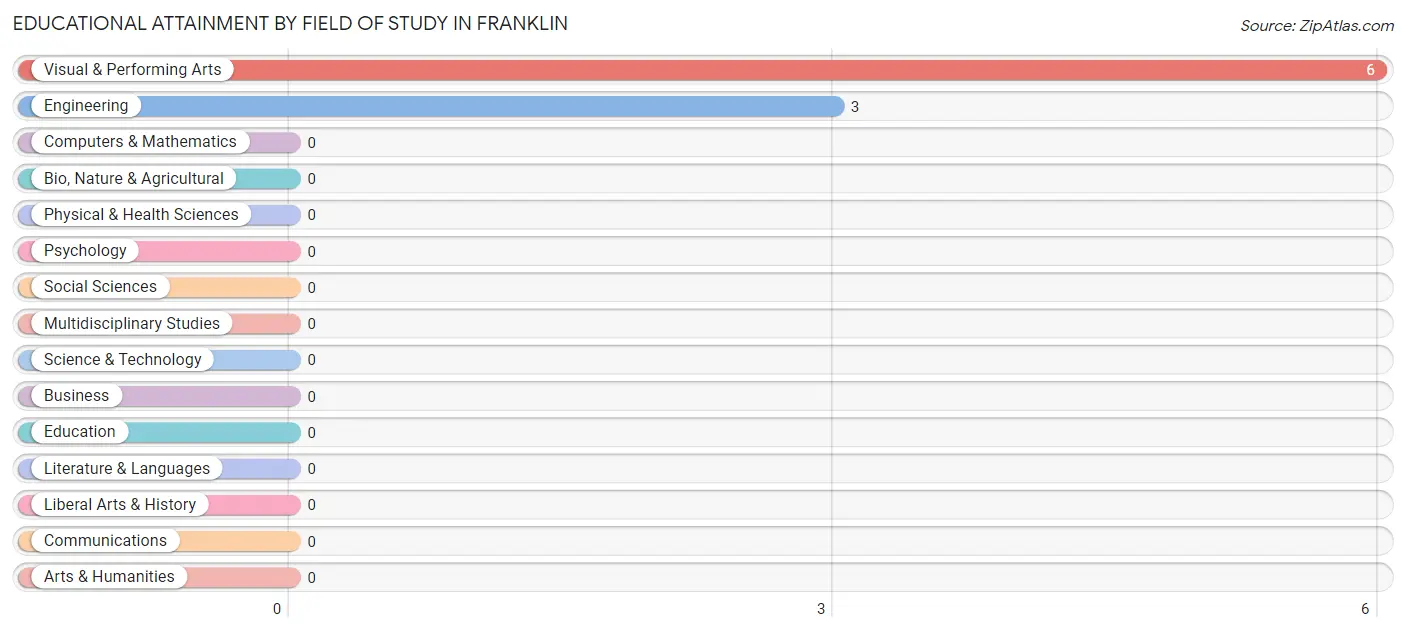
Educational Attainment by Field of Study in Franklin
Visual & performing arts (6 | 66.7%), and engineering (3 | 33.3%) are the most common fields of study among 9 individuals in Franklin who have obtained a bachelor's degree or higher.
Field of Study
# Graduates
% Graduates
Computers & Mathematics
0
0.0%
Bio, Nature & Agricultural
0
0.0%
Physical & Health Sciences
0
0.0%
Psychology
0
0.0%
Social Sciences
0
0.0%
Engineering
3
33.3%
Multidisciplinary Studies
0
0.0%
Science & Technology
0
0.0%
Business
0
0.0%
Education
0
0.0%
Literature & Languages
0
0.0%
Liberal Arts & History
0
0.0%
Visual & Performing Arts
6
66.7%
Communications
0
0.0%
Arts & Humanities
0
0.0%
Total
9
100.0%
Transportation & Commute in Franklin
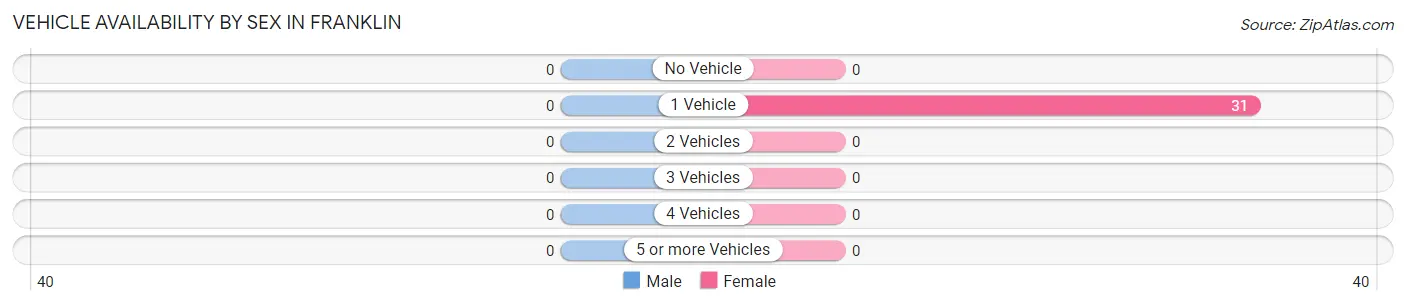
Vehicle Availability by Sex in Franklin
Vehicles Available
Male
Female
No Vehicle
0 (0.0%)
0 (0.0%)
1 Vehicle
0 (0.0%)
31 (100.0%)
2 Vehicles
0 (0.0%)
0 (0.0%)
3 Vehicles
0 (0.0%)
0 (0.0%)
4 Vehicles
0 (0.0%)
0 (0.0%)
5 or more Vehicles
0 (0.0%)
0 (0.0%)
Total
0 (0.0%)
31 (100.0%)
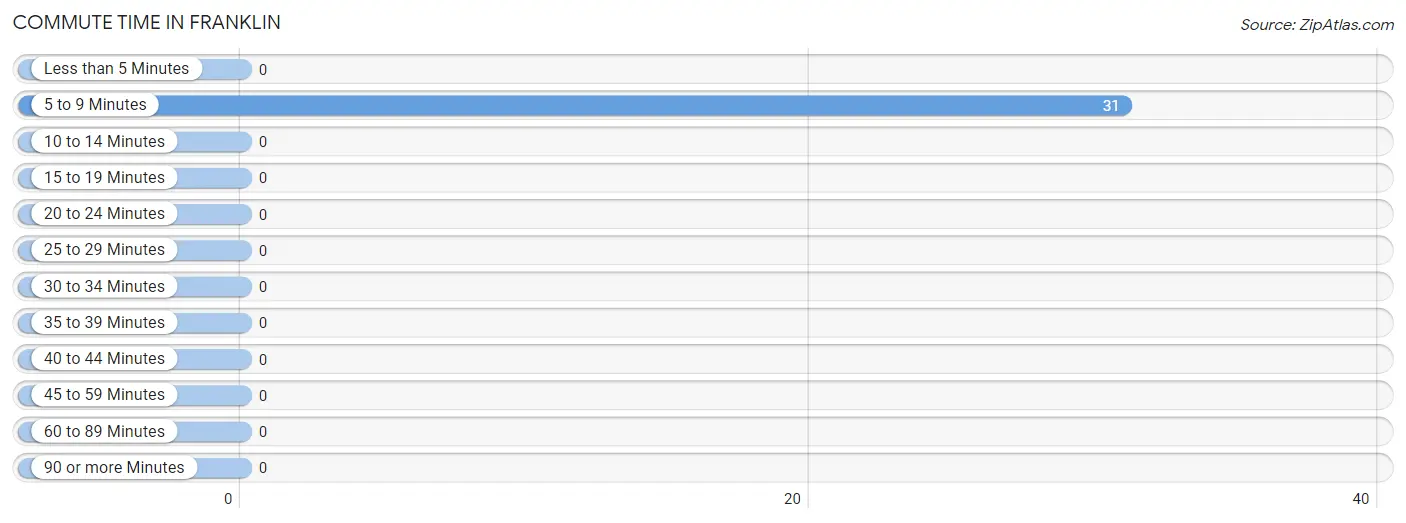
Commute Time in Franklin
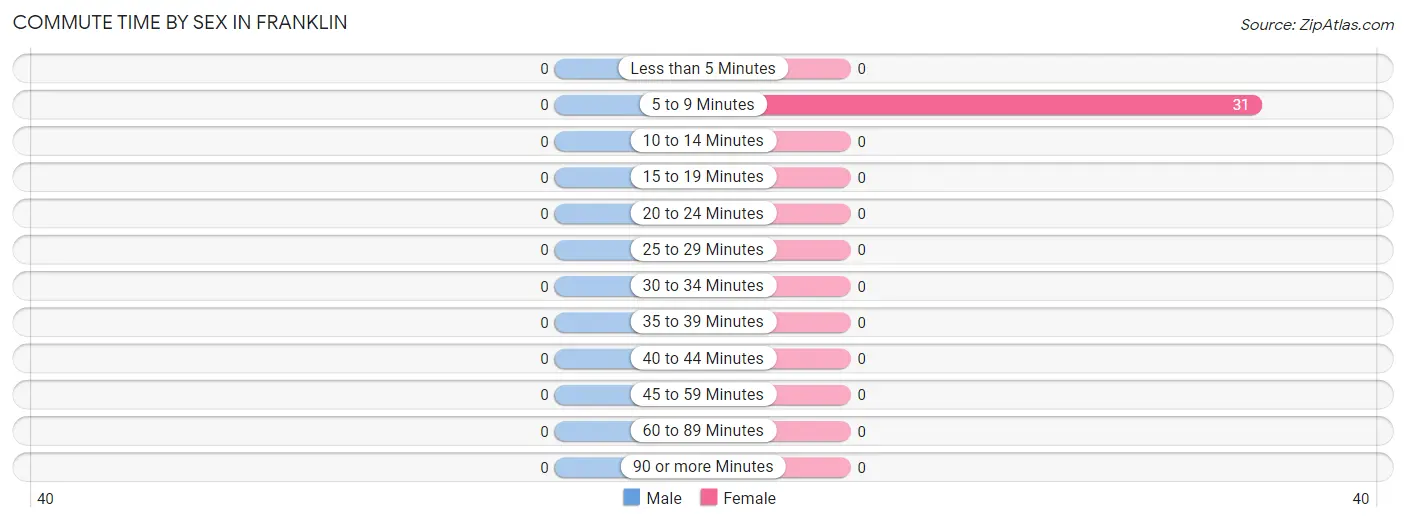
The most frequently occuring commute durations in Franklin are 5 to 9 minutes (31 commuters, 100.0%), less than 5 minutes (0 commuters, 0.0%), and 10 to 14 minutes (0 commuters, 0.0%).
Commute Time
# Commuters
% Commuters
Less than 5 Minutes
0
0.0%
5 to 9 Minutes
31
100.0%
10 to 14 Minutes
0
0.0%
15 to 19 Minutes
0
0.0%
20 to 24 Minutes
0
0.0%
25 to 29 Minutes
0
0.0%
30 to 34 Minutes
0
0.0%
35 to 39 Minutes
0
0.0%
40 to 44 Minutes
0
0.0%
45 to 59 Minutes
0
0.0%
60 to 89 Minutes
0
0.0%
90 or more Minutes
0
0.0%
Commute Time by Sex in Franklin
Commute Time
Male
Female
Less than 5 Minutes
0 (0.0%)
0 (0.0%)
5 to 9 Minutes
0 (0.0%)
31 (100.0%)
10 to 14 Minutes
0 (0.0%)
0 (0.0%)
15 to 19 Minutes
0 (0.0%)
0 (0.0%)
20 to 24 Minutes
0 (0.0%)
0 (0.0%)
25 to 29 Minutes
0 (0.0%)
0 (0.0%)
30 to 34 Minutes
0 (0.0%)
0 (0.0%)
35 to 39 Minutes
0 (0.0%)
0 (0.0%)
40 to 44 Minutes
0 (0.0%)
0 (0.0%)
45 to 59 Minutes
0 (0.0%)
0 (0.0%)
60 to 89 Minutes
0 (0.0%)
0 (0.0%)
90 or more Minutes
0 (0.0%)
0 (0.0%)
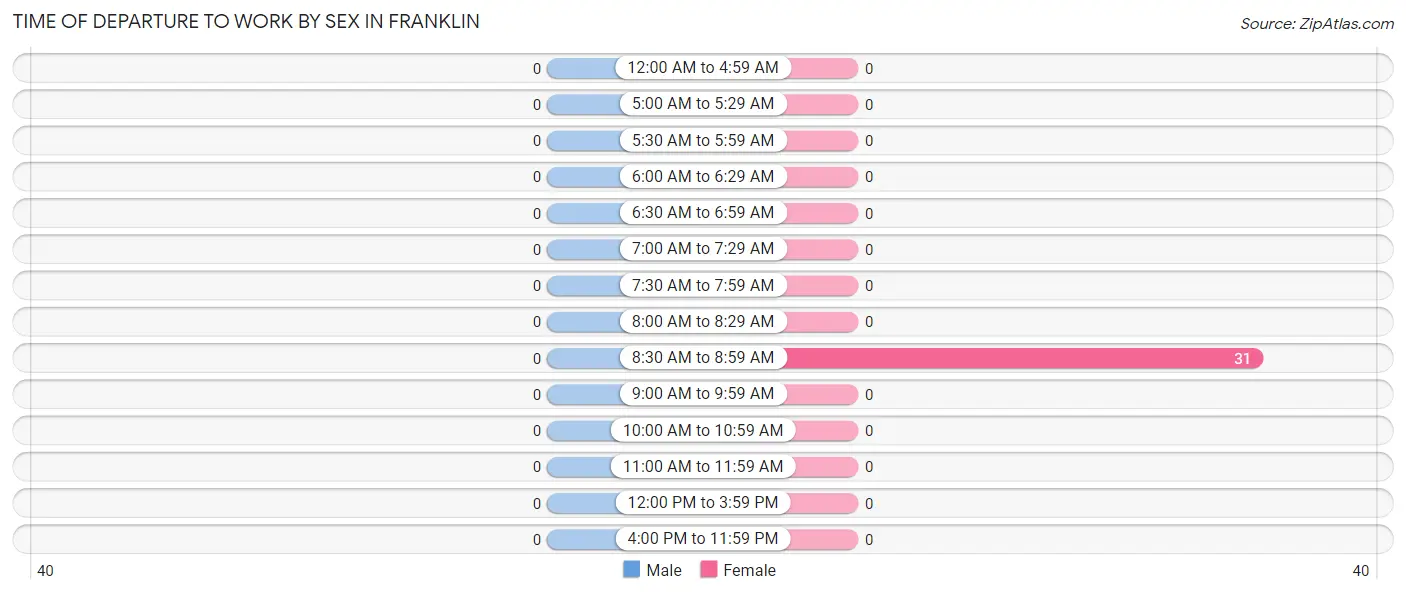
Time of Departure to Work by Sex in Franklin
Time of Departure
Male
Female
12:00 AM to 4:59 AM
0 (0.0%)
0 (0.0%)
5:00 AM to 5:29 AM
0 (0.0%)
0 (0.0%)
5:30 AM to 5:59 AM
0 (0.0%)
0 (0.0%)
6:00 AM to 6:29 AM
0 (0.0%)
0 (0.0%)
6:30 AM to 6:59 AM
0 (0.0%)
0 (0.0%)
7:00 AM to 7:29 AM
0 (0.0%)
0 (0.0%)
7:30 AM to 7:59 AM
0 (0.0%)
0 (0.0%)
8:00 AM to 8:29 AM
0 (0.0%)
0 (0.0%)
8:30 AM to 8:59 AM
0 (0.0%)
31 (100.0%)
9:00 AM to 9:59 AM
0 (0.0%)
0 (0.0%)
10:00 AM to 10:59 AM
0 (0.0%)
0 (0.0%)
11:00 AM to 11:59 AM
0 (0.0%)
0 (0.0%)
12:00 PM to 3:59 PM
0 (0.0%)
0 (0.0%)
4:00 PM to 11:59 PM
0 (0.0%)
0 (0.0%)
Total
0 (0.0%)
31 (100.0%)
Housing Occupancy in Franklin
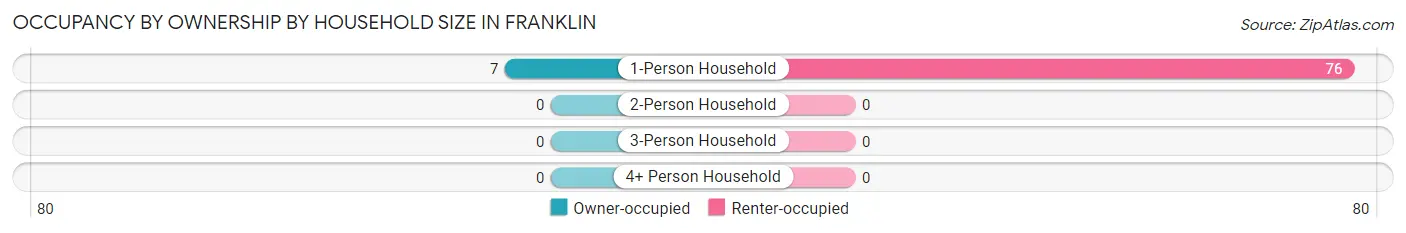
Occupancy by Ownership in Franklin
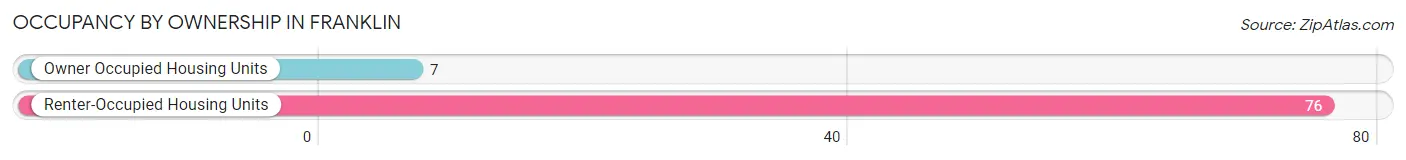
Of the total 83 dwellings in Franklin, owner-occupied units account for 7 (8.4%), while renter-occupied units make up 76 (91.6%).
Occupancy
# Housing Units
% Housing Units
Owner Occupied Housing Units
7
8.4%
Renter-Occupied Housing Units
76
91.6%
Total Occupied Housing Units
83
100.0%
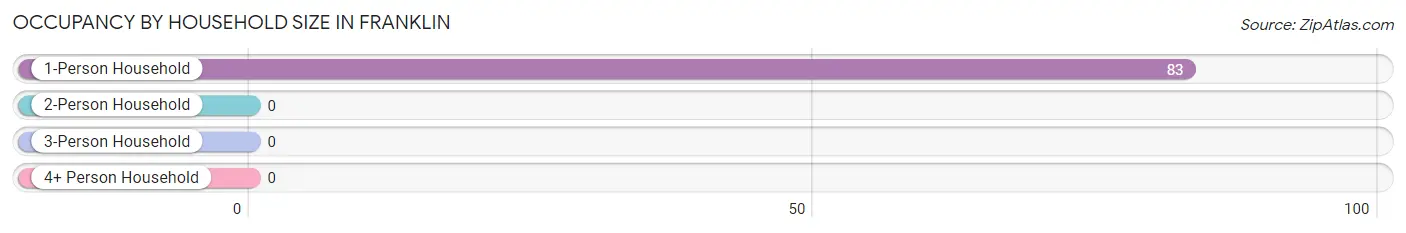
Occupancy by Household Size in Franklin
Household Size
# Housing Units
% Housing Units
1-Person Household
83
100.0%
2-Person Household
0
0.0%
3-Person Household
0
0.0%
4+ Person Household
0
0.0%
Total Housing Units
83
100.0%
Occupancy by Ownership by Household Size in Franklin
Household Size
Owner-occupied
Renter-occupied
1-Person Household
7 (8.4%)
76 (91.6%)
2-Person Household
0 (0.0%)
0 (0.0%)
3-Person Household
0 (0.0%)
0 (0.0%)
4+ Person Household
0 (0.0%)
0 (0.0%)
Total Housing Units
7 (8.4%)
76 (91.6%)
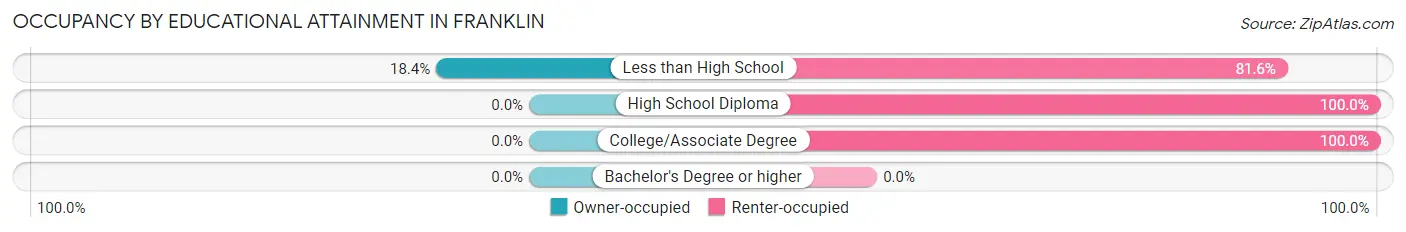
Occupancy by Educational Attainment in Franklin
Household Size
Owner-occupied
Renter-occupied
Less than High School
7 (18.4%)
31 (81.6%)
High School Diploma
0 (0.0%)
20 (100.0%)
College/Associate Degree
0 (0.0%)
25 (100.0%)
Bachelor's Degree or higher
0 (0.0%)
0 (0.0%)
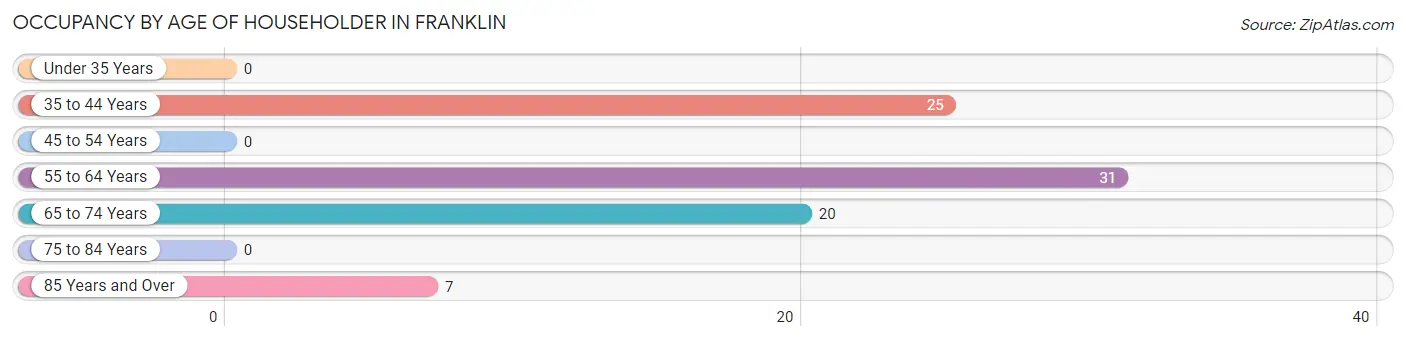
Occupancy by Age of Householder in Franklin
Age Bracket
# Households
% Households
Under 35 Years
0
0.0%
35 to 44 Years
25
30.1%
45 to 54 Years
0
0.0%
55 to 64 Years
31
37.3%
65 to 74 Years
20
24.1%
75 to 84 Years
0
0.0%
85 Years and Over
7
8.4%
Total
83
100.0%
Housing Finances in Franklin
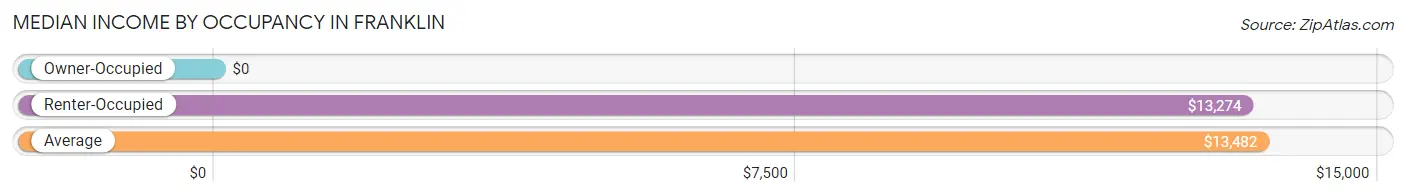
Median Income by Occupancy in Franklin
Occupancy Type
# Households
Median Income
Owner-Occupied
7 (8.4%)
$0
Renter-Occupied
76 (91.6%)
$13,274
Average
83 (100.0%)
$13,482
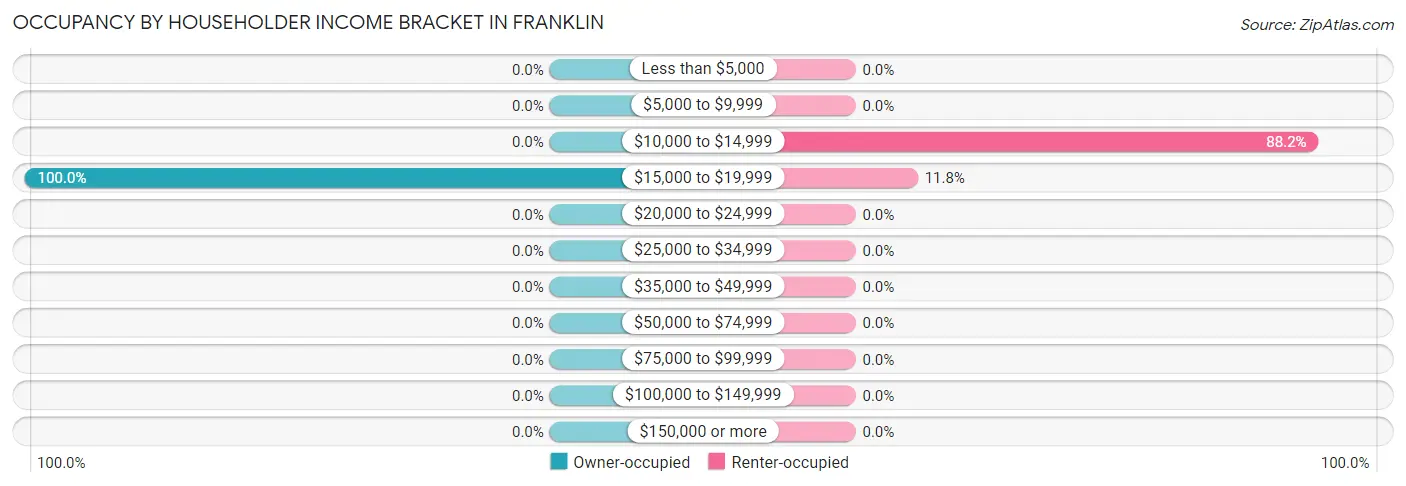
Occupancy by Householder Income Bracket in Franklin
Income Bracket
Owner-occupied
Renter-occupied
Less than $5,000
0 (0.0%)
0 (0.0%)
$5,000 to $9,999
0 (0.0%)
0 (0.0%)
$10,000 to $14,999
0 (0.0%)
67 (88.2%)
$15,000 to $19,999
7 (100.0%)
9 (11.8%)
$20,000 to $24,999
0 (0.0%)
0 (0.0%)
$25,000 to $34,999
0 (0.0%)
0 (0.0%)
$35,000 to $49,999
0 (0.0%)
0 (0.0%)
$50,000 to $74,999
0 (0.0%)
0 (0.0%)
$75,000 to $99,999
0 (0.0%)
0 (0.0%)
$100,000 to $149,999
0 (0.0%)
0 (0.0%)
$150,000 or more
0 (0.0%)
0 (0.0%)
Total
7 (100.0%)
76 (100.0%)
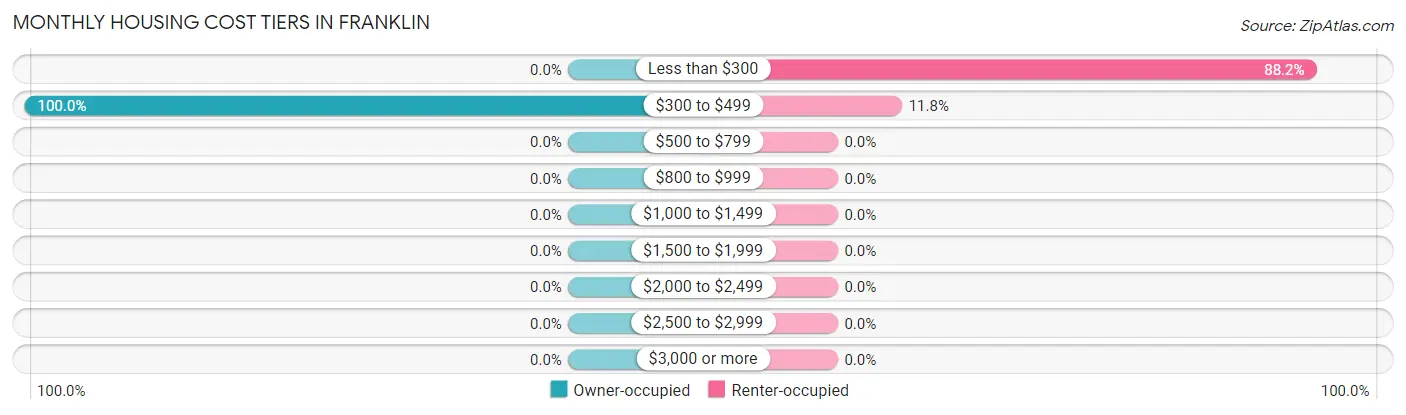
Monthly Housing Cost Tiers in Franklin
Monthly Cost
Owner-occupied
Renter-occupied
Less than $300
0 (0.0%)
67 (88.2%)
$300 to $499
7 (100.0%)
9 (11.8%)
$500 to $799
0 (0.0%)
0 (0.0%)
$800 to $999
0 (0.0%)
0 (0.0%)
$1,000 to $1,499
0 (0.0%)
0 (0.0%)
$1,500 to $1,999
0 (0.0%)
0 (0.0%)
$2,000 to $2,499
0 (0.0%)
0 (0.0%)
$2,500 to $2,999
0 (0.0%)
0 (0.0%)
$3,000 or more
0 (0.0%)
0 (0.0%)
Total
7 (100.0%)
76 (100.0%)
Physical Housing Characteristics in Franklin
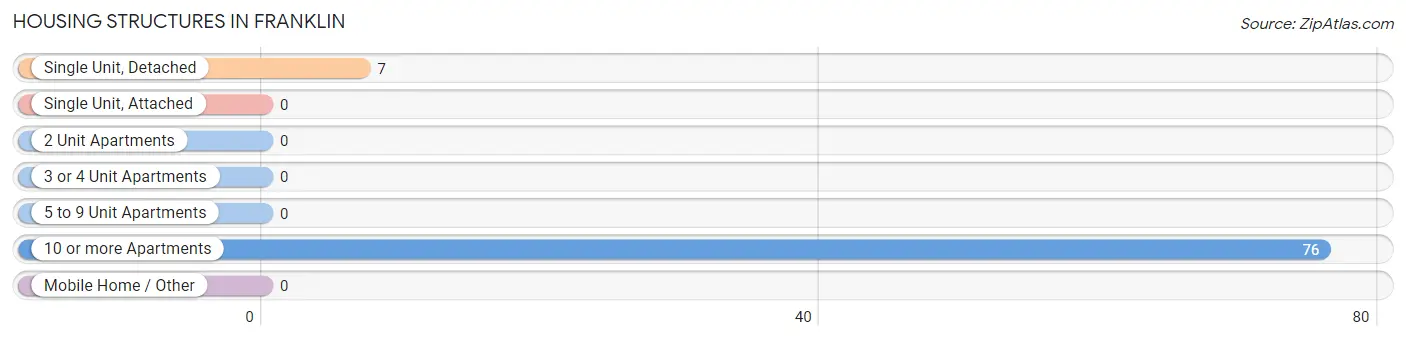
Housing Structures in Franklin
Structure Type
# Housing Units
% Housing Units
Single Unit, Detached
7
8.4%
Single Unit, Attached
0
0.0%
2 Unit Apartments
0
0.0%
3 or 4 Unit Apartments
0
0.0%
5 to 9 Unit Apartments
0
0.0%
10 or more Apartments
76
91.6%
Mobile Home / Other
0
0.0%
Total
83
100.0%
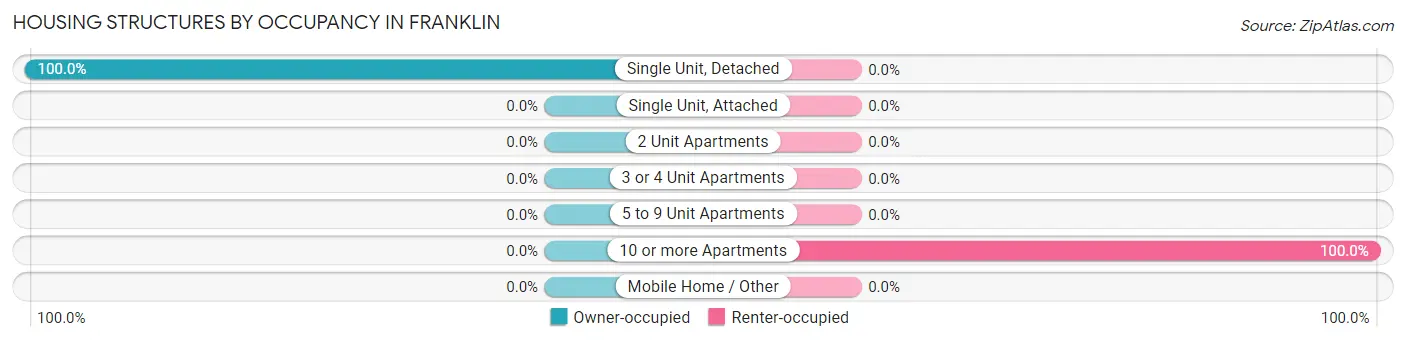
Housing Structures by Occupancy in Franklin
Structure Type
Owner-occupied
Renter-occupied
Single Unit, Detached
7 (100.0%)
0 (0.0%)
Single Unit, Attached
0 (0.0%)
0 (0.0%)
2 Unit Apartments
0 (0.0%)
0 (0.0%)
3 or 4 Unit Apartments
0 (0.0%)
0 (0.0%)
5 to 9 Unit Apartments
0 (0.0%)
0 (0.0%)
10 or more Apartments
0 (0.0%)
76 (100.0%)
Mobile Home / Other
0 (0.0%)
0 (0.0%)
Total
7 (8.4%)
76 (91.6%)
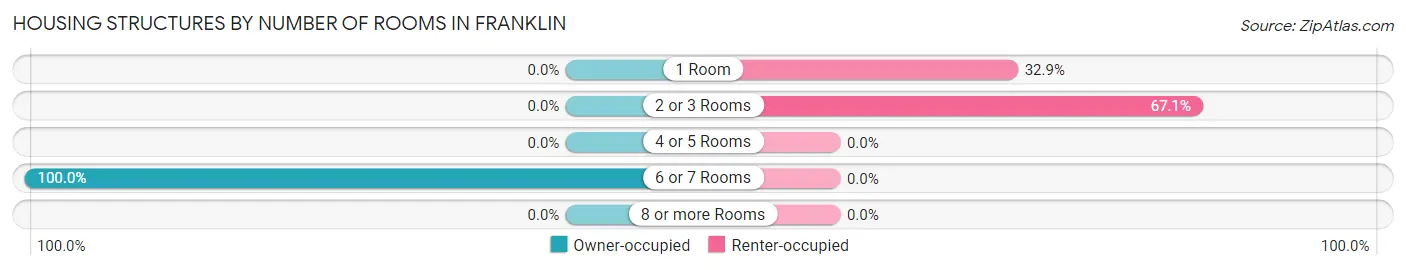
Housing Structures by Number of Rooms in Franklin
Number of Rooms
Owner-occupied
Renter-occupied
1 Room
0 (0.0%)
25 (32.9%)
2 or 3 Rooms
0 (0.0%)
51 (67.1%)
4 or 5 Rooms
0 (0.0%)
0 (0.0%)
6 or 7 Rooms
7 (100.0%)
0 (0.0%)
8 or more Rooms
0 (0.0%)
0 (0.0%)
Total
7 (100.0%)
76 (100.0%)
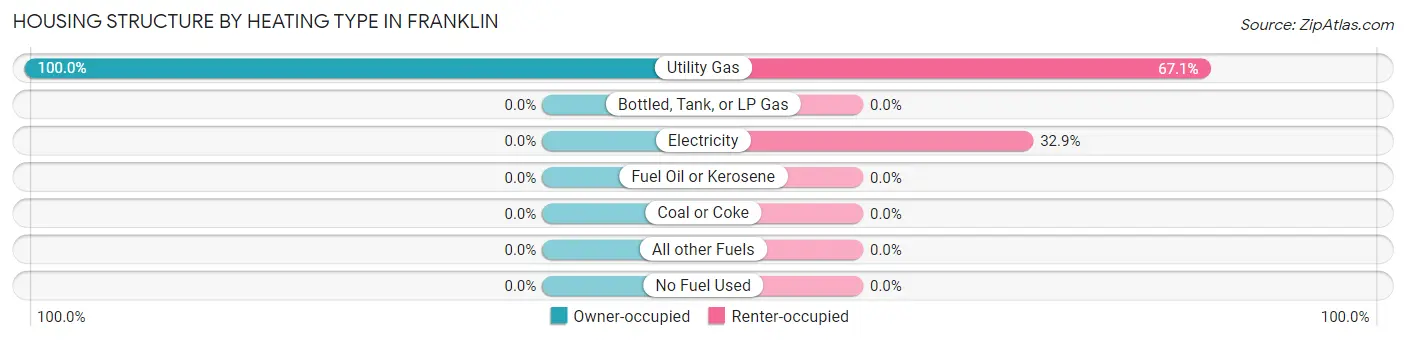
Housing Structure by Heating Type in Franklin
Heating Type
Owner-occupied
Renter-occupied
Utility Gas
7 (100.0%)
51 (67.1%)
Bottled, Tank, or LP Gas
0 (0.0%)
0 (0.0%)
Electricity
0 (0.0%)
25 (32.9%)
Fuel Oil or Kerosene
0 (0.0%)
0 (0.0%)
Coal or Coke
0 (0.0%)
0 (0.0%)
All other Fuels
0 (0.0%)
0 (0.0%)
No Fuel Used
0 (0.0%)
0 (0.0%)
Total
7 (100.0%)
76 (100.0%)
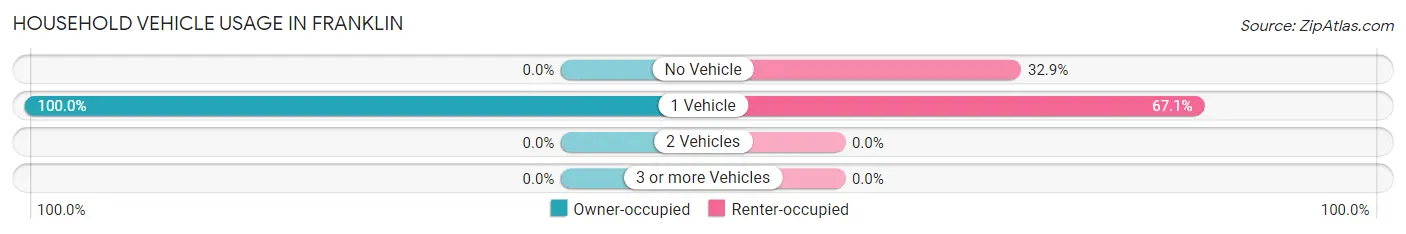
Household Vehicle Usage in Franklin
Vehicles per Household
Owner-occupied
Renter-occupied
No Vehicle
0 (0.0%)
25 (32.9%)
1 Vehicle
7 (100.0%)
51 (67.1%)
2 Vehicles
0 (0.0%)
0 (0.0%)
3 or more Vehicles
0 (0.0%)
0 (0.0%)
Total
7 (100.0%)
76 (100.0%)
Real Estate & Mortgages in Franklin
Real Estate and Mortgage Overview in Franklin
Characteristic
Without Mortgage
With Mortgage
Housing Units
7
0
Median Property Value
-
-
Median Household Income
-
-
Monthly Housing Costs
-
-
Real Estate Taxes
-
-
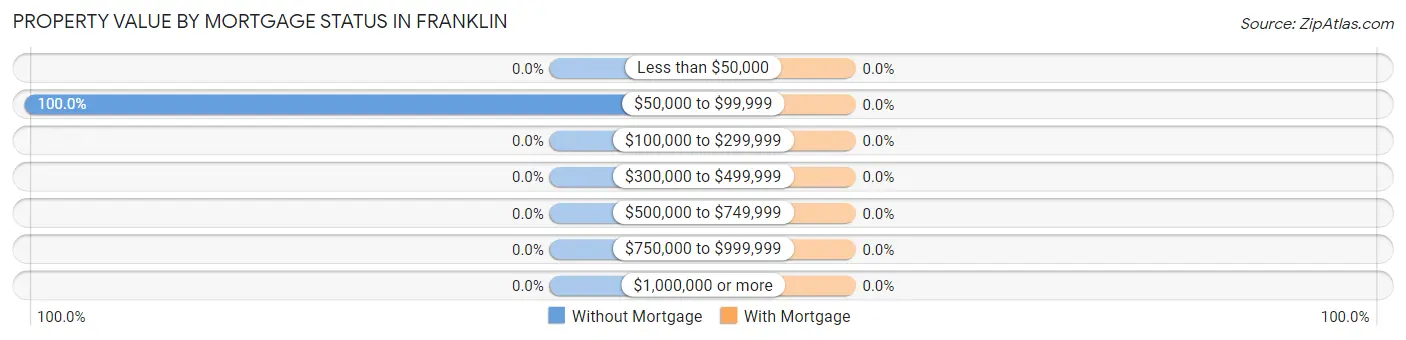
Property Value by Mortgage Status in Franklin
Property Value
Without Mortgage
With Mortgage
Less than $50,000
0 (0.0%)
0 (0.0%)
$50,000 to $99,999
7 (100.0%)
0 (0.0%)
$100,000 to $299,999
0 (0.0%)
0 (0.0%)
$300,000 to $499,999
0 (0.0%)
0 (0.0%)
$500,000 to $749,999
0 (0.0%)
0 (0.0%)
$750,000 to $999,999
0 (0.0%)
0 (0.0%)
$1,000,000 or more
0 (0.0%)
0 (0.0%)
Total
7 (100.0%)
0 (0.0%)
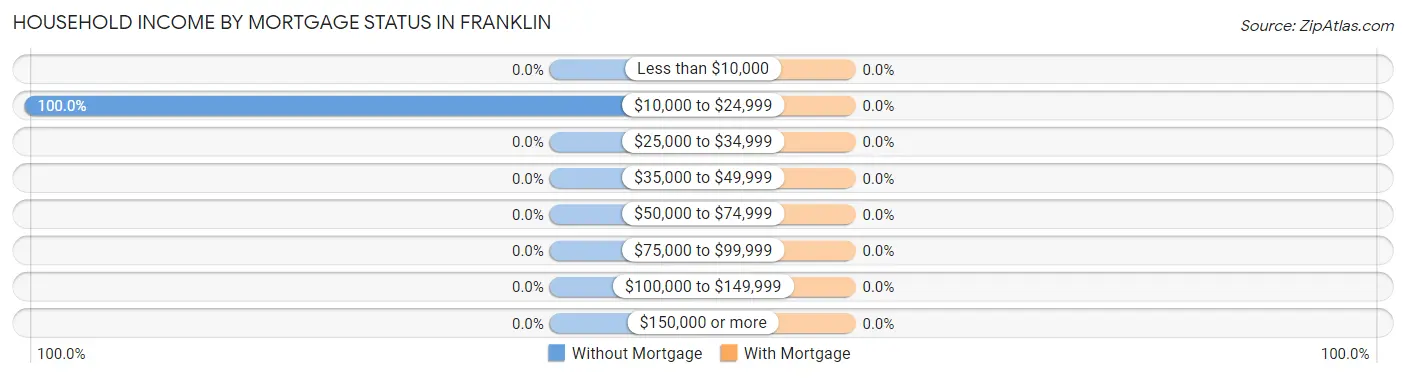
Household Income by Mortgage Status in Franklin
Household Income
Without Mortgage
With Mortgage
Less than $10,000
0 (0.0%)
0 (0.0%)
$10,000 to $24,999
7 (100.0%)
0 (0.0%)
$25,000 to $34,999
0 (0.0%)
0 (0.0%)
$35,000 to $49,999
0 (0.0%)
0 (0.0%)
$50,000 to $74,999
0 (0.0%)
0 (0.0%)
$75,000 to $99,999
0 (0.0%)
0 (0.0%)
$100,000 to $149,999
0 (0.0%)
0 (0.0%)
$150,000 or more
0 (0.0%)
0 (0.0%)
Total
7 (100.0%)
0 (0.0%)
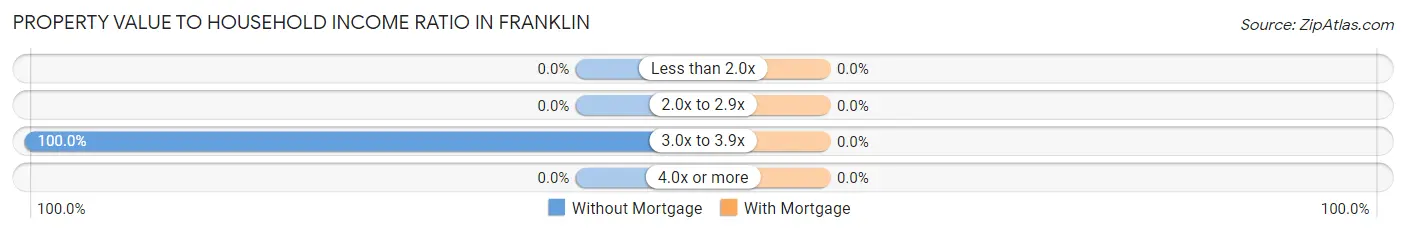
Property Value to Household Income Ratio in Franklin
Value-to-Income Ratio
Without Mortgage
With Mortgage
Less than 2.0x
0 (0.0%)
0 (0.0%)
2.0x to 2.9x
0 (0.0%)
0 (0.0%)
3.0x to 3.9x
7 (100.0%)
0 (0.0%)
4.0x or more
0 (0.0%)
0 (0.0%)
Total
7 (100.0%)
0 (0.0%)
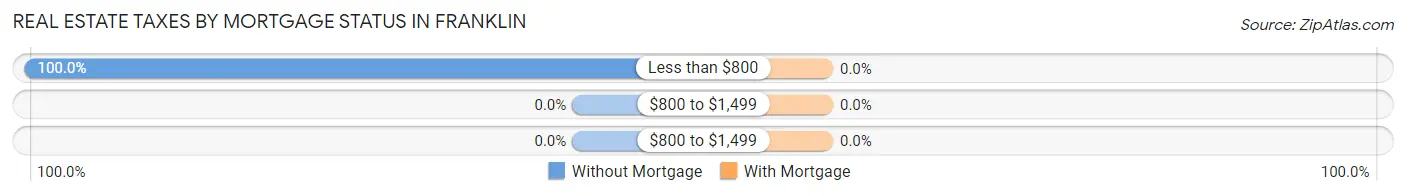
Real Estate Taxes by Mortgage Status in Franklin
Property Taxes
Without Mortgage
With Mortgage
Less than $800
7 (100.0%)
0 (0.0%)
$800 to $1,499
0 (0.0%)
0 (0.0%)
$800 to $1,499
0 (0.0%)
0 (0.0%)
Total
7 (100.0%)
0 (0.0%)
Health & Disability in Franklin
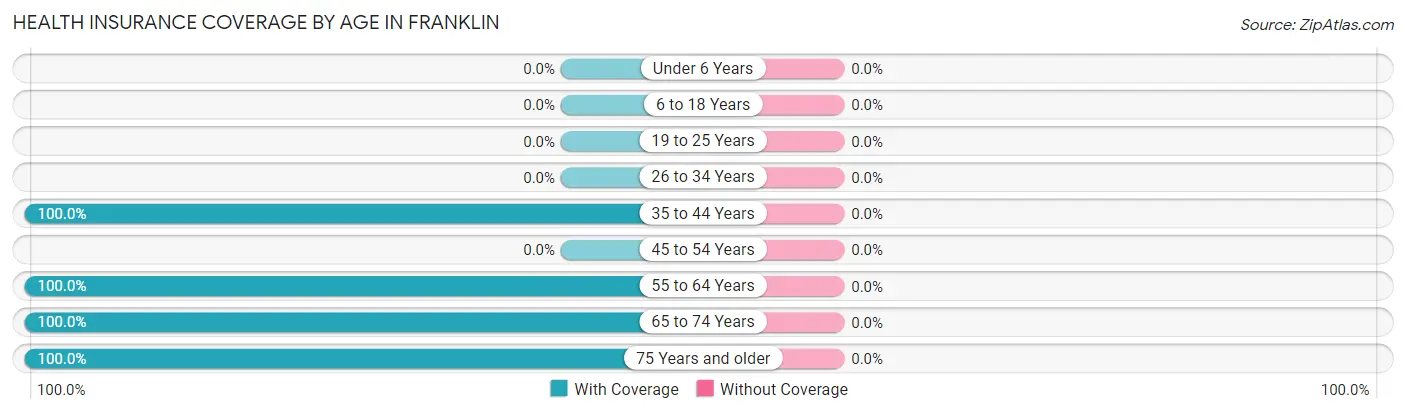
Health Insurance Coverage by Age in Franklin
Age Bracket
With Coverage
Without Coverage
Under 6 Years
0 (0.0%)
0 (0.0%)
6 to 18 Years
0 (0.0%)
0 (0.0%)
19 to 25 Years
0 (0.0%)
0 (0.0%)
26 to 34 Years
0 (0.0%)
0 (0.0%)
35 to 44 Years
25 (100.0%)
0 (0.0%)
45 to 54 Years
0 (0.0%)
0 (0.0%)
55 to 64 Years
31 (100.0%)
0 (0.0%)
65 to 74 Years
20 (100.0%)
0 (0.0%)
75 Years and older
7 (100.0%)
0 (0.0%)
Total
83 (100.0%)
0 (0.0%)
Health Insurance Coverage by Citizenship Status in Franklin
Citizenship Status
With Coverage
Without Coverage
Native Born
0 (0.0%)
0 (0.0%)
Foreign Born, Citizen
0 (0.0%)
0 (0.0%)
Foreign Born, not a Citizen
0 (0.0%)
0 (0.0%)
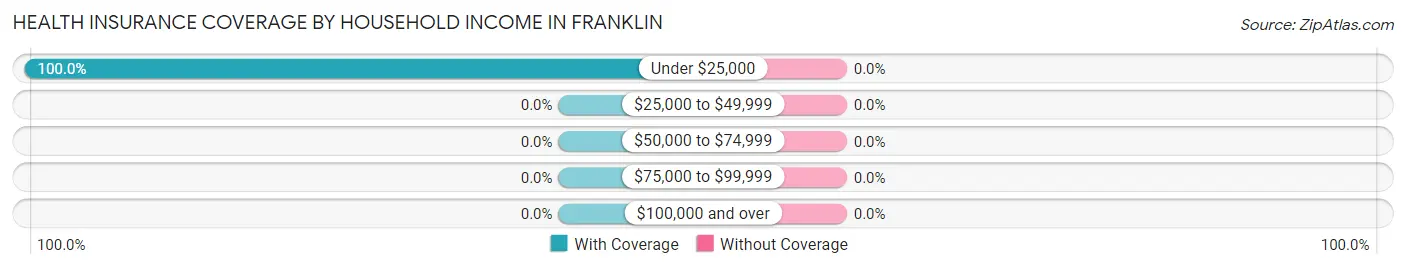
Health Insurance Coverage by Household Income in Franklin
Household Income
With Coverage
Without Coverage
Under $25,000
83 (100.0%)
0 (0.0%)
$25,000 to $49,999
0 (0.0%)
0 (0.0%)
$50,000 to $74,999
0 (0.0%)
0 (0.0%)
$75,000 to $99,999
0 (0.0%)
0 (0.0%)
$100,000 and over
0 (0.0%)
0 (0.0%)
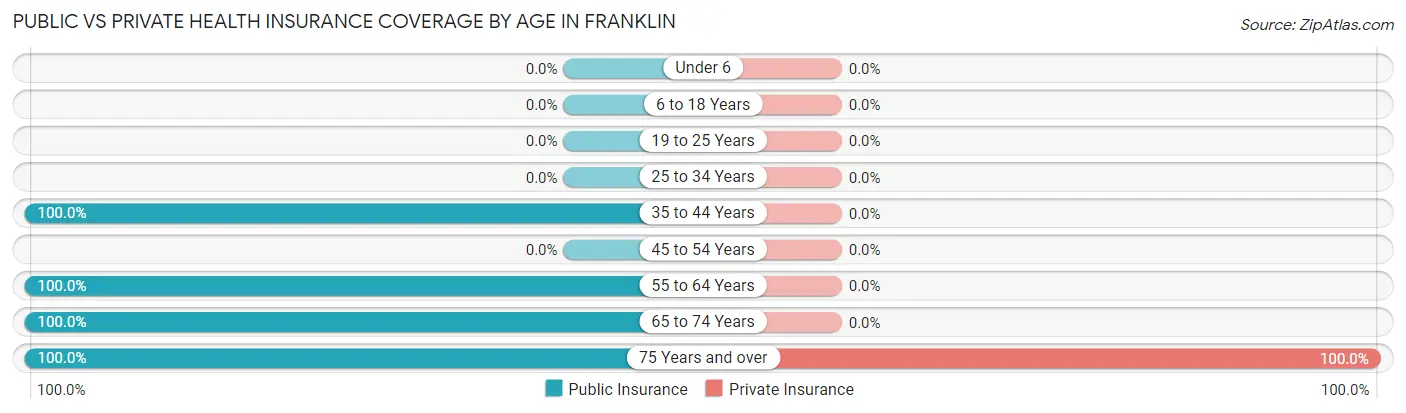
Public vs Private Health Insurance Coverage by Age in Franklin
Age Bracket
Public Insurance
Private Insurance
Under 6
0 (0.0%)
0 (0.0%)
6 to 18 Years
0 (0.0%)
0 (0.0%)
19 to 25 Years
0 (0.0%)
0 (0.0%)
25 to 34 Years
0 (0.0%)
0 (0.0%)
35 to 44 Years
25 (100.0%)
0 (0.0%)
45 to 54 Years
0 (0.0%)
0 (0.0%)
55 to 64 Years
31 (100.0%)
0 (0.0%)
65 to 74 Years
20 (100.0%)
0 (0.0%)
75 Years and over
7 (100.0%)
7 (100.0%)
Total
83 (100.0%)
7 (8.4%)
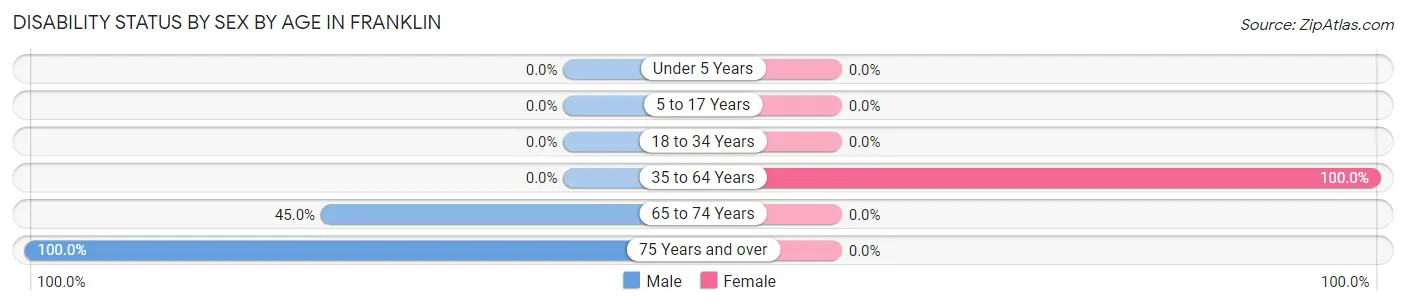
Disability Status by Sex by Age in Franklin
Age Bracket
Male
Female
Under 5 Years
0 (0.0%)
0 (0.0%)
5 to 17 Years
0 (0.0%)
0 (0.0%)
18 to 34 Years
0 (0.0%)
0 (0.0%)
35 to 64 Years
0 (0.0%)
56 (100.0%)
65 to 74 Years
9 (45.0%)
0 (0.0%)
75 Years and over
7 (100.0%)
0 (0.0%)
Disability Class by Sex by Age in Franklin
Disability Class: Hearing Difficulty
Age Bracket
Male
Female
Under 5 Years
0 (0.0%)
0 (0.0%)
5 to 17 Years
0 (0.0%)
0 (0.0%)
18 to 34 Years
0 (0.0%)
0 (0.0%)
35 to 64 Years
0 (0.0%)
0 (0.0%)
65 to 74 Years
0 (0.0%)
0 (0.0%)
75 Years and over
0 (0.0%)
0 (0.0%)
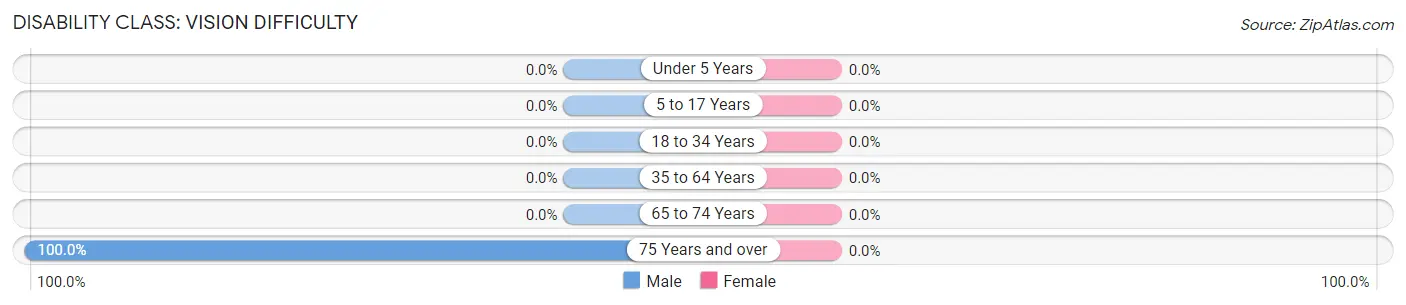
Disability Class: Vision Difficulty
Age Bracket
Male
Female
Under 5 Years
0 (0.0%)
0 (0.0%)
5 to 17 Years
0 (0.0%)
0 (0.0%)
18 to 34 Years
0 (0.0%)
0 (0.0%)
35 to 64 Years
0 (0.0%)
0 (0.0%)
65 to 74 Years
0 (0.0%)
0 (0.0%)
75 Years and over
7 (100.0%)
0 (0.0%)
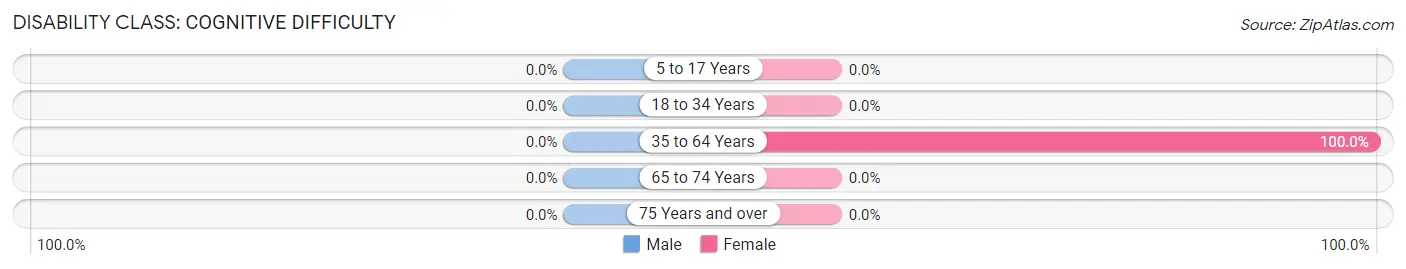
Disability Class: Cognitive Difficulty
Age Bracket
Male
Female
5 to 17 Years
0 (0.0%)
0 (0.0%)
18 to 34 Years
0 (0.0%)
0 (0.0%)
35 to 64 Years
0 (0.0%)
56 (100.0%)
65 to 74 Years
0 (0.0%)
0 (0.0%)
75 Years and over
0 (0.0%)
0 (0.0%)
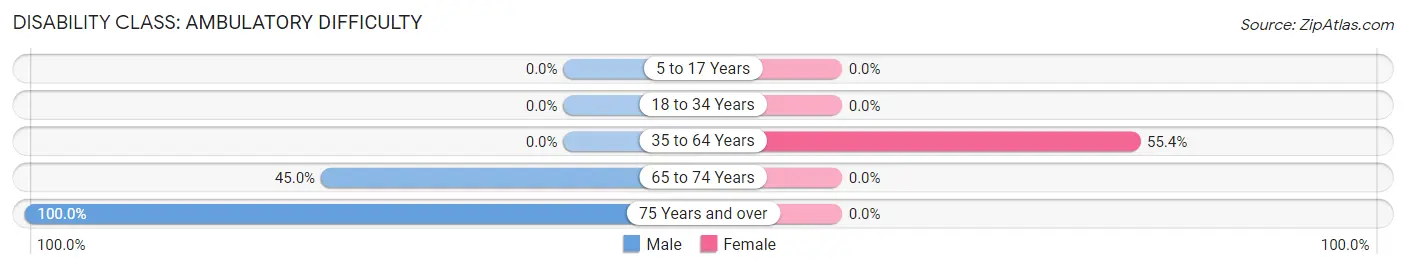
Disability Class: Ambulatory Difficulty
Age Bracket
Male
Female
5 to 17 Years
0 (0.0%)
0 (0.0%)
18 to 34 Years
0 (0.0%)
0 (0.0%)
35 to 64 Years
0 (0.0%)
31 (55.4%)
65 to 74 Years
9 (45.0%)
0 (0.0%)
75 Years and over
7 (100.0%)
0 (0.0%)
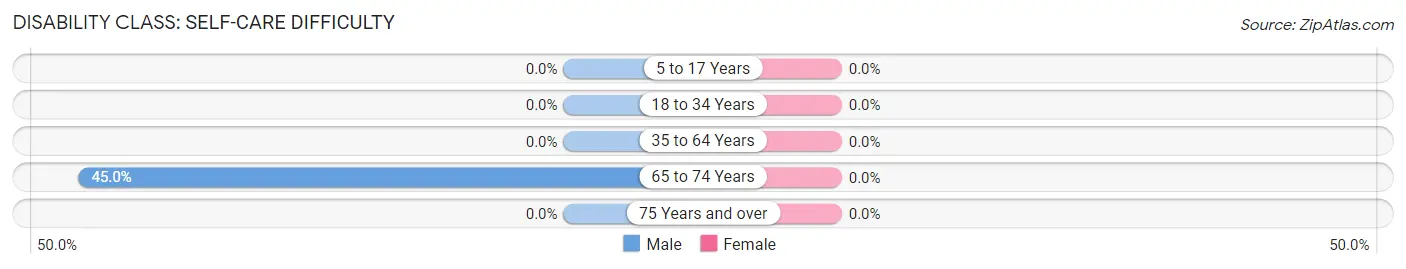
Disability Class: Self-Care Difficulty
Age Bracket
Male
Female
5 to 17 Years
0 (0.0%)
0 (0.0%)
18 to 34 Years
0 (0.0%)
0 (0.0%)
35 to 64 Years
0 (0.0%)
0 (0.0%)
65 to 74 Years
9 (45.0%)
0 (0.0%)
75 Years and over
0 (0.0%)
0 (0.0%)
Technology Access in Franklin
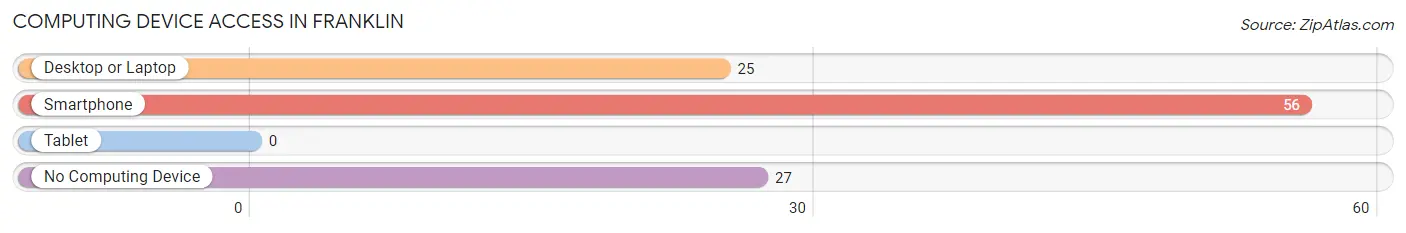
Computing Device Access in Franklin
Device Type
# Households
% Households
Desktop or Laptop
25
30.1%
Smartphone
56
67.5%
Tablet
0
0.0%
No Computing Device
27
32.5%
Total
83
100.0%
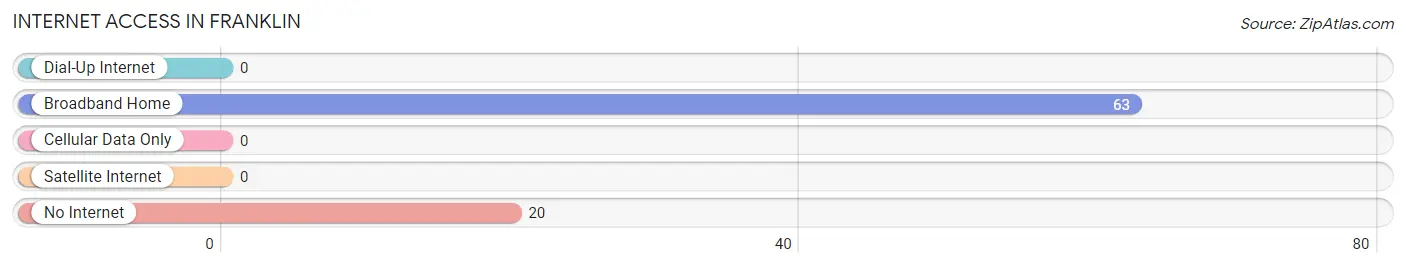
Internet Access in Franklin
Internet Type
# Households
% Households
Dial-Up Internet
0
0.0%
Broadband Home
63
75.9%
Cellular Data Only
0
0.0%
Satellite Internet
0
0.0%
No Internet
20
24.1%
Total
83
100.0%
Franklin Summary
Franklin, Maryland is a small town located in the heart of the Eastern Shore of Maryland. It is situated in the northern part of the county of Kent, and is bordered by the towns of Chestertown, Galena, and Millington. The town has a population of approximately 2,000 people, and is a part of the larger metropolitan area of Baltimore-Washington.
History
The town of Franklin was founded in 1795 by a group of settlers from Pennsylvania. The town was named after Benjamin Franklin, and was originally a farming community. The town was incorporated in 1820, and the first post office was established in 1821.
In the early 19th century, the town was a major center for the production of tobacco, and the town was home to several tobacco warehouses. The town was also home to a number of mills, including a grist mill, a saw mill, and a paper mill.
In the late 19th century, the town began to experience a decline in its economy, as the tobacco industry began to decline. The town was also affected by the Great Depression, and many of the mills and warehouses closed.
Geography
Franklin is located in the northern part of Kent County, and is bordered by the towns of Chestertown, Galena, and Millington. The town is situated on the Eastern Shore of Maryland, and is located approximately 40 miles east of Baltimore. The town is situated on the Chester River, and is surrounded by rolling hills and farmland.
Economy
The economy of Franklin is largely based on agriculture and tourism. The town is home to several farms, and the surrounding area is known for its production of corn, soybeans, and other crops. The town is also home to several wineries, and is a popular destination for wine tours.
The town is also home to several small businesses, including restaurants, shops, and other services. The town is also home to a number of historic sites, including the Franklin House, which is listed on the National Register of Historic Places.
Demographics
As of the 2010 census, the population of Franklin was 2,000 people. The racial makeup of the town was 94.2% White, 2.2% African American, 0.7% Native American, 0.7% Asian, 0.2% Pacific Islander, and 1.9% from other races. The median household income in the town was $45,000, and the median family income was $50,000.
Conclusion
Franklin, Maryland is a small town located in the heart of the Eastern Shore of Maryland. It is a historic town with a rich history, and is home to a number of farms, wineries, and other businesses. The town is also home to a number of historic sites, and is a popular destination for tourists. The town has a population of approximately 2,000 people, and is a part of the larger metropolitan area of Baltimore-Washington.
Common Questions
What is Per Capita Income in Franklin?
Per Capita income in Franklin is $11,737.
What is the Median Household income in Franklin?
Median Household Income in Franklin is $13,482.
What is Inequality or Gini Index in Franklin?
Inequality or Gini Index in Franklin is 0.08.
What is the Total Population of Franklin?
Total Population of Franklin is 166.
What is the Total Male Population of Franklin?
Total Male Population of Franklin is 65.
What is the Total Female Population of Franklin?
Total Female Population of Franklin is 101.
What is the Ratio of Males per 100 Females in Franklin?
There are 64.36 Males per 100 Females in Franklin.
What is the Ratio of Females per 100 Males in Franklin?
There are 155.38 Females per 100 Males in Franklin.
What is the Median Population Age in Franklin?
Median Population Age in Franklin is 71.0 Years.
How Large is the Labor Force in Franklin?
There are 31 People in the Labor Forcein in Franklin.
What is the Percentage of People in the Labor Force in Franklin?
18.7% of People are in the Labor Force in Franklin.
Report Title
Report Link
HTML Copy & Paste Link
Social Media
Copy and paste the folowing code into any webpage where you would like this interactive chart to display