Fort Hood, TX Map & Demographics
Fort Hood Map
Fort Hood Overview
$22,323
PER CAPITA INCOME
$54,013
AVG FAMILY INCOME
$54,404
AVG HOUSEHOLD INCOME
18.4%
WAGE / INCOME GAP [ % ]
81.6¢/ $1
WAGE / INCOME GAP [ $ ]
$13,708
FAMILY INCOME DEFICIT
0.39
INEQUALITY / GINI INDEX
25,476
TOTAL POPULATION
17,323
MALE POPULATION
8,153
FEMALE POPULATION
212.47
MALES / 100 FEMALES
47.06
FEMALES / 100 MALES
21.7
MEDIAN AGE
3.5
AVG FAMILY SIZE
3.4
AVG HOUSEHOLD SIZE
16,303
LABOR FORCE [ PEOPLE ]
82.1%
PERCENT IN LABOR FORCE
15.2%
UNEMPLOYMENT RATE
Fort Hood Zip Codes
Fort Hood Area Codes
Income in Fort Hood
Income Overview in Fort Hood
Per Capita Income in Fort Hood is $22,323, while median incomes of families and households are $54,013 and $54,404 respectively.
| Characteristic | Number | Measure |
| Per Capita Income | 25,476 | $22,323 |
| Median Family Income | 3,911 | $54,013 |
| Mean Family Income | 3,911 | $68,179 |
| Median Household Income | 4,188 | $54,404 |
| Mean Household Income | 4,188 | $67,748 |
| Income Deficit | 3,911 | $13,708 |
| Wage / Income Gap (%) | 25,476 | 18.36% |
| Wage / Income Gap ($) | 25,476 | 81.64¢ per $1 |
| Gini / Inequality Index | 25,476 | 0.39 |
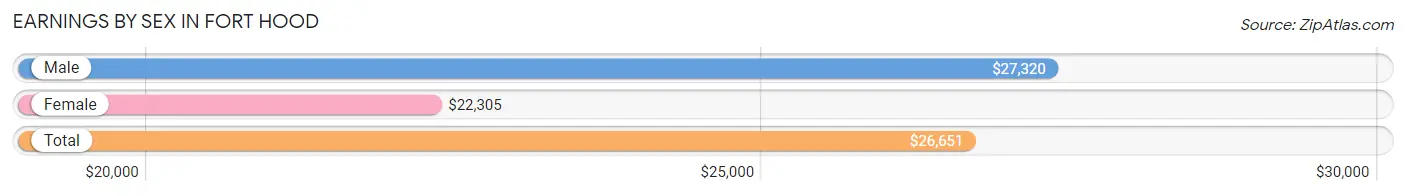
Earnings by Sex in Fort Hood
Average Earnings in Fort Hood are $26,651, $27,320 for men and $22,305 for women, a difference of 18.4%.
| Sex | Number | Average Earnings |
| Male | 13,590 (79.7%) | $27,320 |
| Female | 3,457 (20.3%) | $22,305 |
| Total | 17,047 (100.0%) | $26,651 |
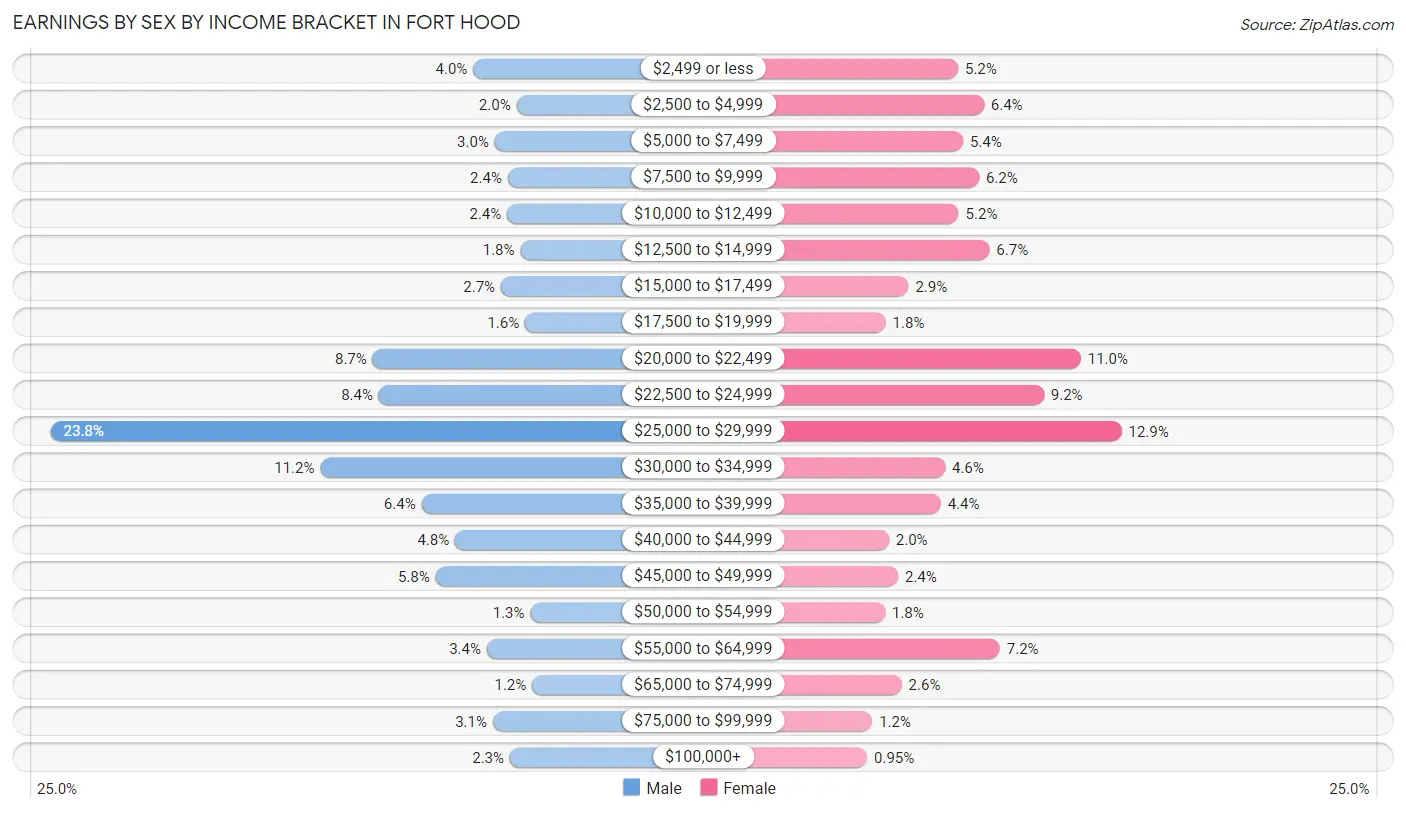
Earnings by Sex by Income Bracket in Fort Hood
The most common earnings brackets in Fort Hood are $25,000 to $29,999 for men (3,232 | 23.8%) and $25,000 to $29,999 for women (445 | 12.9%).
| Income | Male | Female |
| $2,499 or less | 542 (4.0%) | 180 (5.2%) |
| $2,500 to $4,999 | 267 (2.0%) | 222 (6.4%) |
| $5,000 to $7,499 | 405 (3.0%) | 188 (5.4%) |
| $7,500 to $9,999 | 322 (2.4%) | 214 (6.2%) |
| $10,000 to $12,499 | 326 (2.4%) | 181 (5.2%) |
| $12,500 to $14,999 | 242 (1.8%) | 231 (6.7%) |
| $15,000 to $17,499 | 365 (2.7%) | 100 (2.9%) |
| $17,500 to $19,999 | 212 (1.6%) | 63 (1.8%) |
| $20,000 to $22,499 | 1,182 (8.7%) | 379 (11.0%) |
| $22,500 to $24,999 | 1,143 (8.4%) | 319 (9.2%) |
| $25,000 to $29,999 | 3,232 (23.8%) | 445 (12.9%) |
| $30,000 to $34,999 | 1,515 (11.2%) | 159 (4.6%) |
| $35,000 to $39,999 | 871 (6.4%) | 152 (4.4%) |
| $40,000 to $44,999 | 658 (4.8%) | 68 (2.0%) |
| $45,000 to $49,999 | 782 (5.8%) | 83 (2.4%) |
| $50,000 to $54,999 | 178 (1.3%) | 62 (1.8%) |
| $55,000 to $64,999 | 455 (3.4%) | 248 (7.2%) |
| $65,000 to $74,999 | 167 (1.2%) | 89 (2.6%) |
| $75,000 to $99,999 | 417 (3.1%) | 41 (1.2%) |
| $100,000+ | 309 (2.3%) | 33 (0.9%) |
| Total | 13,590 (100.0%) | 3,457 (100.0%) |
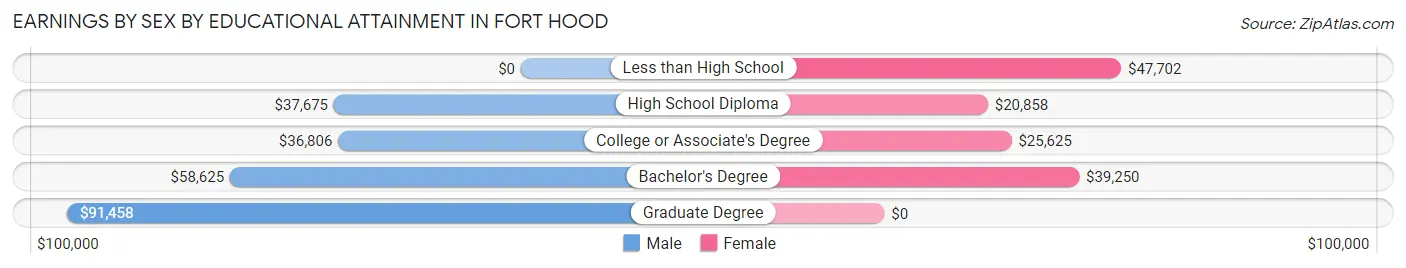
Earnings by Sex by Educational Attainment in Fort Hood
Average earnings in Fort Hood are $40,046 for men and $26,778 for women, a difference of 33.1%. Men with an educational attainment of graduate degree enjoy the highest average annual earnings of $91,458, while those with college or associate's degree education earn the least with $36,806. Women with an educational attainment of less than high school earn the most with the average annual earnings of $47,702, while those with high school diploma education have the smallest earnings of $20,858.
| Educational Attainment | Male Income | Female Income |
| Less than High School | - | - |
| High School Diploma | $37,675 | $20,858 |
| College or Associate's Degree | $36,806 | $25,625 |
| Bachelor's Degree | $58,625 | $39,250 |
| Graduate Degree | $91,458 | $0 |
| Total | $40,046 | $26,778 |
Family Income in Fort Hood
Family Income Brackets in Fort Hood
According to the Fort Hood family income data, there are 1,001 families falling into the $50,000 to $74,999 income range, which is the most common income bracket and makes up 25.6% of all families. Conversely, the $10,000 to $14,999 income bracket is the least frequent group with only 31 families (0.8%) belonging to this category.
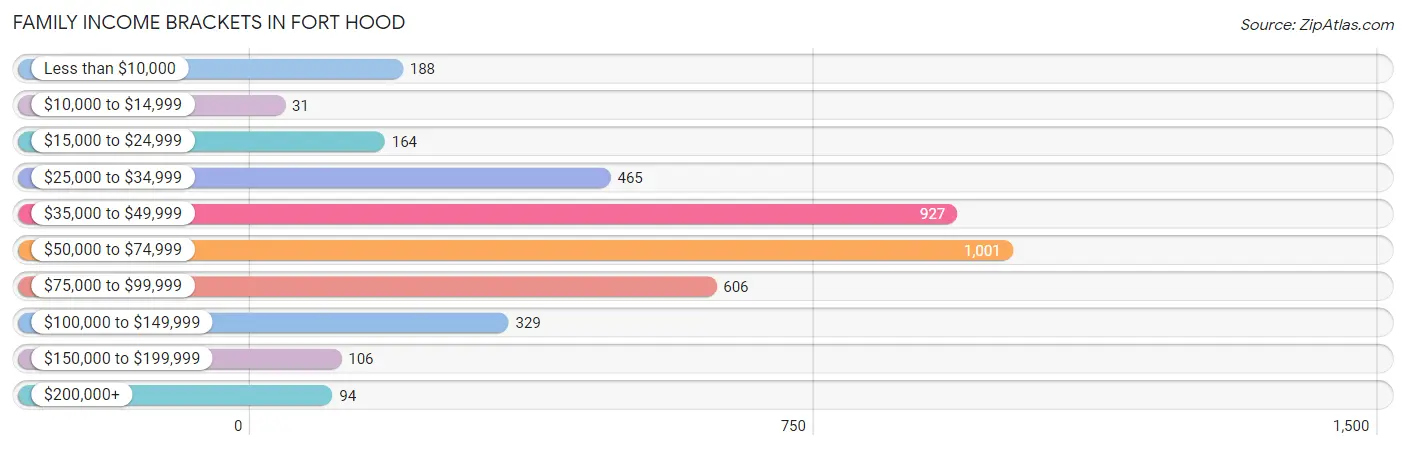
| Income Bracket | # Families | % Families |
| Less than $10,000 | 188 | 4.8% |
| $10,000 to $14,999 | 31 | 0.8% |
| $15,000 to $24,999 | 164 | 4.2% |
| $25,000 to $34,999 | 465 | 11.9% |
| $35,000 to $49,999 | 927 | 23.7% |
| $50,000 to $74,999 | 1,001 | 25.6% |
| $75,000 to $99,999 | 606 | 15.5% |
| $100,000 to $149,999 | 329 | 8.4% |
| $150,000 to $199,999 | 106 | 2.7% |
| $200,000+ | 94 | 2.4% |
Family Income by Famaliy Size in Fort Hood
7+ person families (35 | 0.9%) account for the highest median family income in Fort Hood with $83,438 per family, while 2-person families (1,163 | 29.7%) have the highest median income of $25,199 per family member.
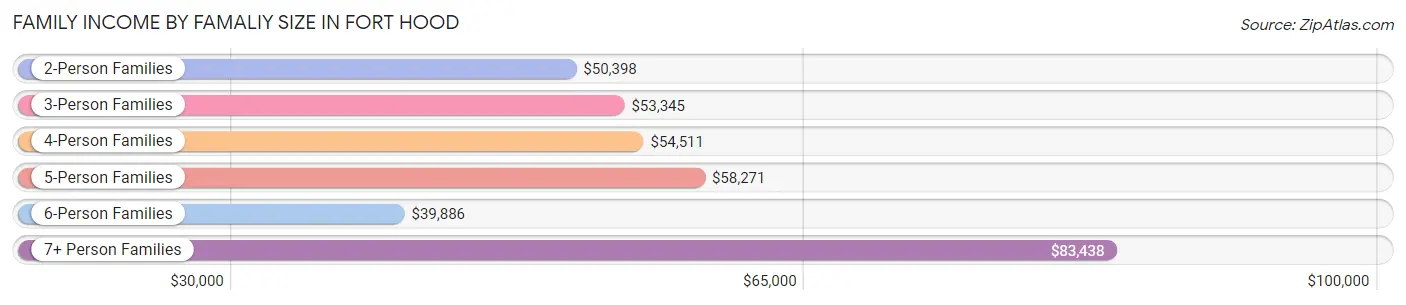
| Income Bracket | # Families | Median Income |
| 2-Person Families | 1,163 (29.7%) | $50,398 |
| 3-Person Families | 921 (23.5%) | $53,345 |
| 4-Person Families | 938 (24.0%) | $54,511 |
| 5-Person Families | 719 (18.4%) | $58,271 |
| 6-Person Families | 135 (3.5%) | $39,886 |
| 7+ Person Families | 35 (0.9%) | $83,438 |
| Total | 3,911 (100.0%) | $54,013 |
Family Income by Number of Earners in Fort Hood
The median family income in Fort Hood is $54,013, with families comprising 3+ earners (114) having the highest median family income of $76,429, while families with no earners (169) have the lowest median family income of $2,499, accounting for 2.9% and 4.3% of families, respectively.
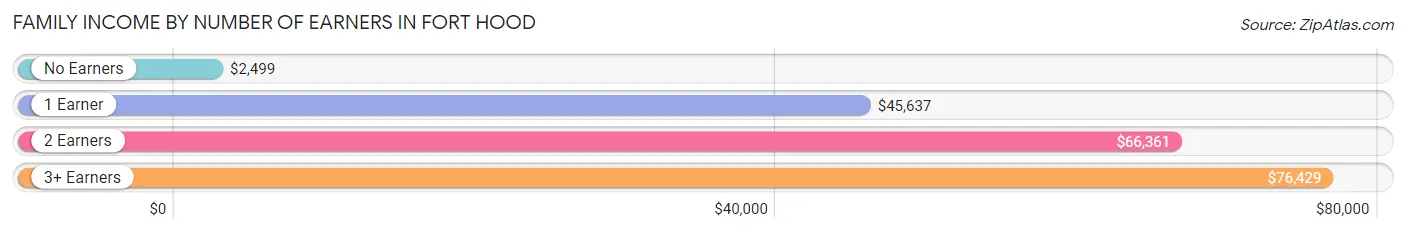
| Number of Earners | # Families | Median Income |
| No Earners | 169 (4.3%) | $2,499 |
| 1 Earner | 2,022 (51.7%) | $45,637 |
| 2 Earners | 1,606 (41.1%) | $66,361 |
| 3+ Earners | 114 (2.9%) | $76,429 |
| Total | 3,911 (100.0%) | $54,013 |
Household Income in Fort Hood
Household Income Brackets in Fort Hood
With 1,127 households falling in the category, the $50,000 to $74,999 income range is the most frequent in Fort Hood, accounting for 26.9% of all households. In contrast, only 38 households (0.9%) fall into the $10,000 to $14,999 income bracket, making it the least populous group.
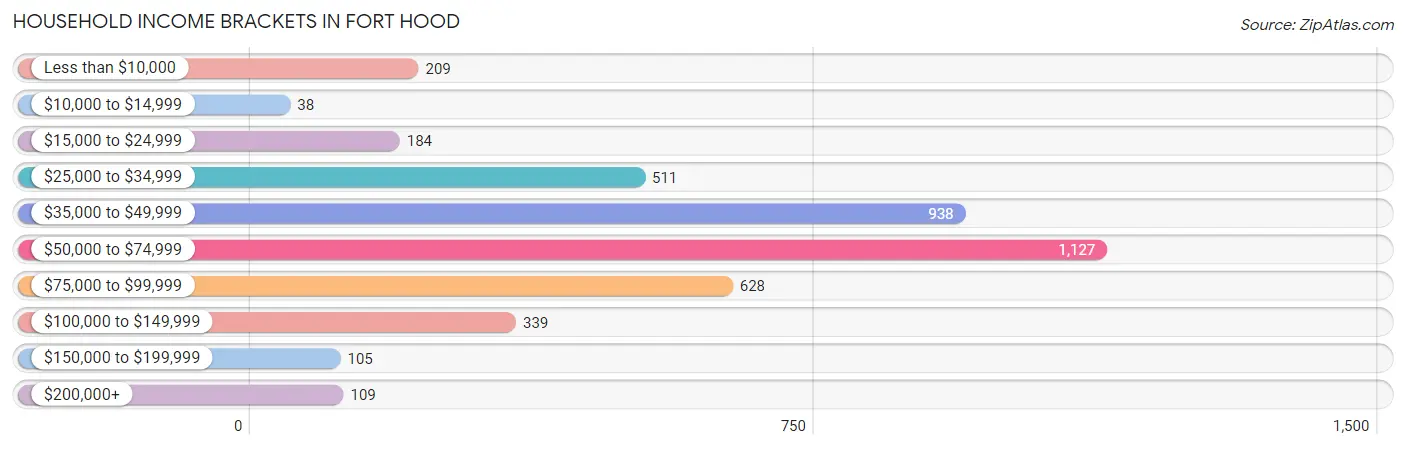
| Income Bracket | # Households | % Households |
| Less than $10,000 | 209 | 5.0% |
| $10,000 to $14,999 | 38 | 0.9% |
| $15,000 to $24,999 | 184 | 4.4% |
| $25,000 to $34,999 | 511 | 12.2% |
| $35,000 to $49,999 | 938 | 22.4% |
| $50,000 to $74,999 | 1,127 | 26.9% |
| $75,000 to $99,999 | 628 | 15.0% |
| $100,000 to $149,999 | 339 | 8.1% |
| $150,000 to $199,999 | 105 | 2.5% |
| $200,000+ | 109 | 2.6% |
Household Income by Householder Age in Fort Hood
The median household income in Fort Hood is $54,404, with the highest median household income of $92,500 found in the 45 to 64 years age bracket for the primary householder. A total of 454 households (10.8%) fall into this category. Meanwhile, the 15 to 24 years age bracket for the primary householder has the lowest median household income of $43,555, with 934 households (22.3%) in this group.
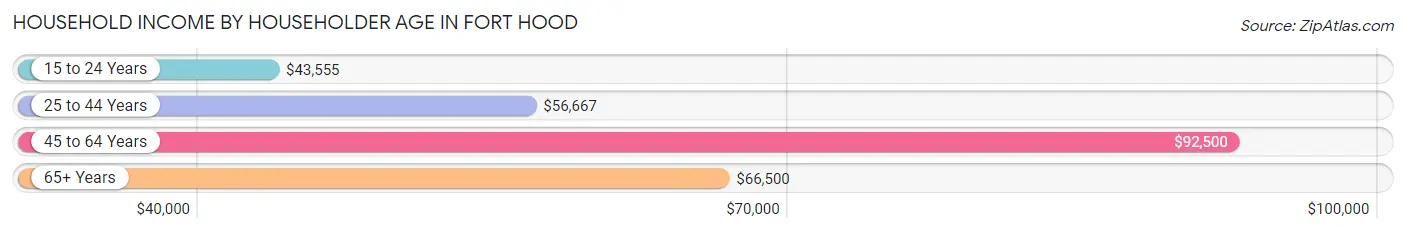
| Income Bracket | # Households | Median Income |
| 15 to 24 Years | 934 (22.3%) | $43,555 |
| 25 to 44 Years | 2,776 (66.3%) | $56,667 |
| 45 to 64 Years | 454 (10.8%) | $92,500 |
| 65+ Years | 24 (0.6%) | $66,500 |
| Total | 4,188 (100.0%) | $54,404 |
Poverty in Fort Hood
Income Below Poverty by Sex and Age in Fort Hood
With 13.5% poverty level for males and 16.5% for females among the residents of Fort Hood, 12 to 14 year old males and 16 and 17 year old females are the most vulnerable to poverty, with 77 males (33.5%) and 55 females (59.1%) in their respective age groups living below the poverty level.
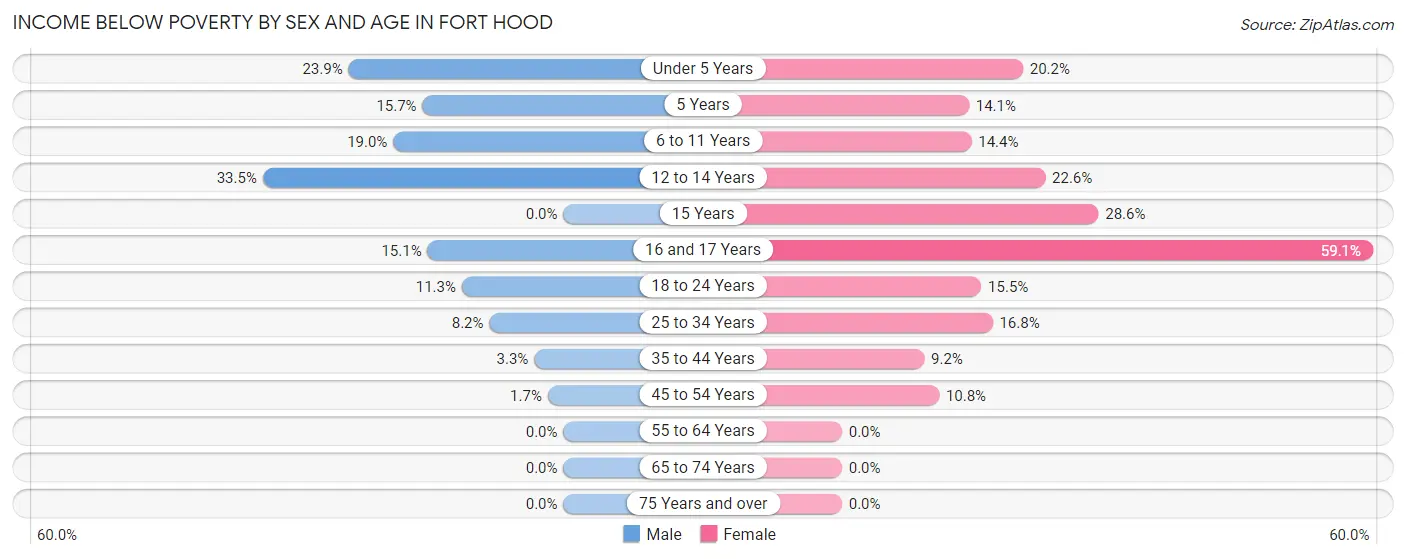
| Age Bracket | Male | Female |
| Under 5 Years | 323 (23.9%) | 311 (20.2%) |
| 5 Years | 32 (15.7%) | 27 (14.1%) |
| 6 to 11 Years | 232 (19.0%) | 89 (14.4%) |
| 12 to 14 Years | 77 (33.5%) | 36 (22.6%) |
| 15 Years | 0 (0.0%) | 16 (28.6%) |
| 16 and 17 Years | 23 (15.1%) | 55 (59.1%) |
| 18 to 24 Years | 113 (11.3%) | 174 (15.5%) |
| 25 to 34 Years | 147 (8.2%) | 338 (16.8%) |
| 35 to 44 Years | 26 (3.3%) | 61 (9.2%) |
| 45 to 54 Years | 7 (1.7%) | 25 (10.8%) |
| 55 to 64 Years | 0 (0.0%) | 0 (0.0%) |
| 65 to 74 Years | 0 (0.0%) | 0 (0.0%) |
| 75 Years and over | 0 (0.0%) | 0 (0.0%) |
| Total | 980 (13.5%) | 1,132 (16.5%) |
Income Above Poverty by Sex and Age in Fort Hood
According to the poverty statistics in Fort Hood, males aged 15 years and females aged 55 to 64 years are the age groups that are most secure financially, with 100.0% of males and 100.0% of females in these age groups living above the poverty line.
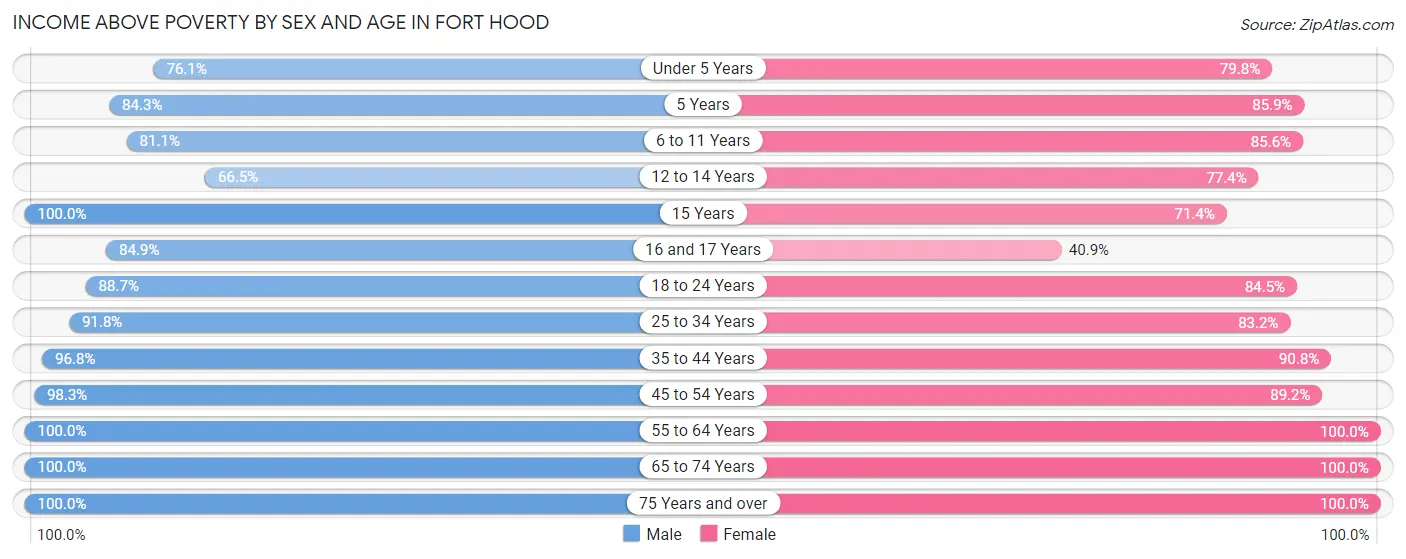
| Age Bracket | Male | Female |
| Under 5 Years | 1,027 (76.1%) | 1,232 (79.8%) |
| 5 Years | 172 (84.3%) | 164 (85.9%) |
| 6 to 11 Years | 992 (81.0%) | 528 (85.6%) |
| 12 to 14 Years | 153 (66.5%) | 123 (77.4%) |
| 15 Years | 44 (100.0%) | 40 (71.4%) |
| 16 and 17 Years | 129 (84.9%) | 38 (40.9%) |
| 18 to 24 Years | 886 (88.7%) | 947 (84.5%) |
| 25 to 34 Years | 1,636 (91.8%) | 1,676 (83.2%) |
| 35 to 44 Years | 775 (96.8%) | 604 (90.8%) |
| 45 to 54 Years | 396 (98.3%) | 206 (89.2%) |
| 55 to 64 Years | 49 (100.0%) | 145 (100.0%) |
| 65 to 74 Years | 34 (100.0%) | 9 (100.0%) |
| 75 Years and over | 8 (100.0%) | 23 (100.0%) |
| Total | 6,301 (86.5%) | 5,735 (83.5%) |
Income Below Poverty Among Married-Couple Families in Fort Hood
The poverty statistics for married-couple families in Fort Hood show that 7.3% or 251 of the total 3,452 families live below the poverty line. Families with 3 or 4 children have the highest poverty rate of 22.3%, comprising of 153 families. On the other hand, families with 5 or more children have the lowest poverty rate of 0.0%, which includes 0 families.
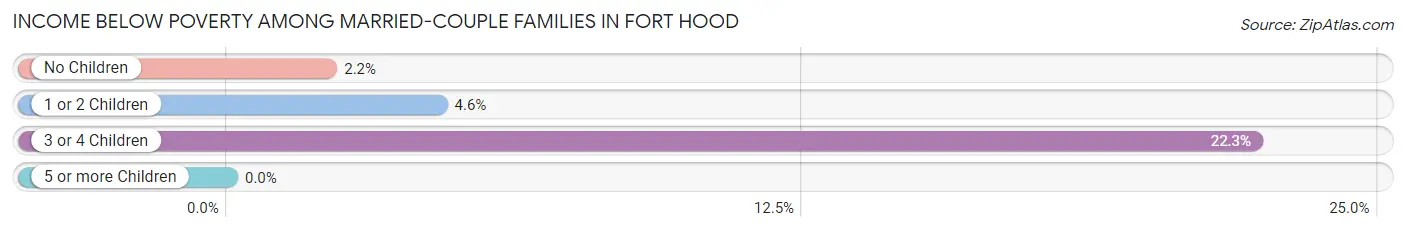
| Children | Above Poverty | Below Poverty |
| No Children | 1,131 (97.8%) | 25 (2.2%) |
| 1 or 2 Children | 1,528 (95.4%) | 73 (4.6%) |
| 3 or 4 Children | 533 (77.7%) | 153 (22.3%) |
| 5 or more Children | 9 (100.0%) | 0 (0.0%) |
| Total | 3,201 (92.7%) | 251 (7.3%) |
Income Below Poverty Among Single-Parent Households in Fort Hood
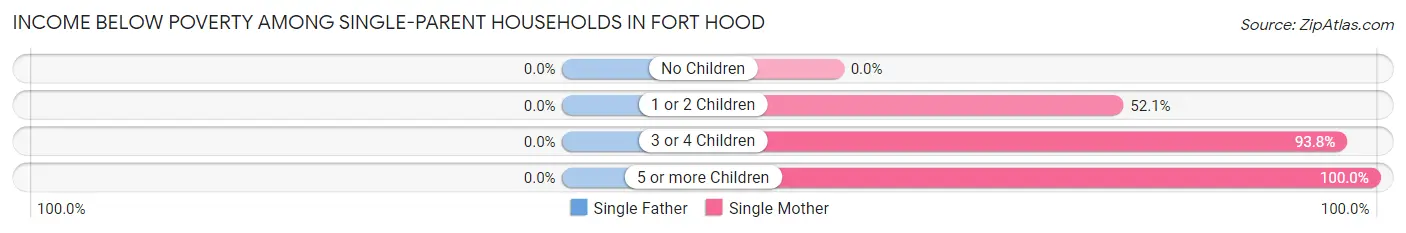
| Children | Single Father | Single Mother |
| No Children | 0 (0.0%) | 0 (0.0%) |
| 1 or 2 Children | 0 (0.0%) | 111 (52.1%) |
| 3 or 4 Children | 0 (0.0%) | 75 (93.8%) |
| 5 or more Children | 0 (0.0%) | 18 (100.0%) |
| Total | 0 (0.0%) | 204 (63.7%) |
Income Below Poverty Among Married-Couple vs Single-Parent Households in Fort Hood
The poverty data for Fort Hood shows that 251 of the married-couple family households (7.3%) and 204 of the single-parent households (44.4%) are living below the poverty level. Within the married-couple family households, those with 3 or 4 children have the highest poverty rate, with 153 households (22.3%) falling below the poverty line. Among the single-parent households, those with 5 or more children have the highest poverty rate, with 18 household (100.0%) living below poverty.
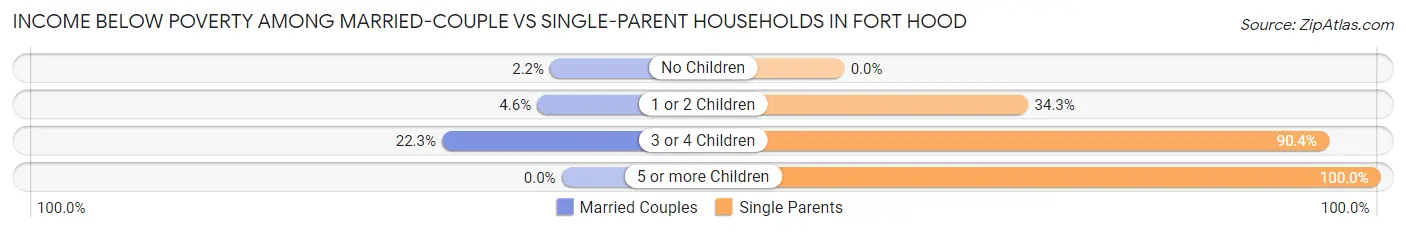
| Children | Married-Couple Families | Single-Parent Households |
| No Children | 25 (2.2%) | 0 (0.0%) |
| 1 or 2 Children | 73 (4.6%) | 111 (34.3%) |
| 3 or 4 Children | 153 (22.3%) | 75 (90.4%) |
| 5 or more Children | 0 (0.0%) | 18 (100.0%) |
| Total | 251 (7.3%) | 204 (44.4%) |
Race in Fort Hood
The most populous races in Fort Hood are White / Caucasian (15,234 | 59.8%), Hispanic or Latino (5,732 | 22.5%), and Black / African American (5,156 | 20.2%).
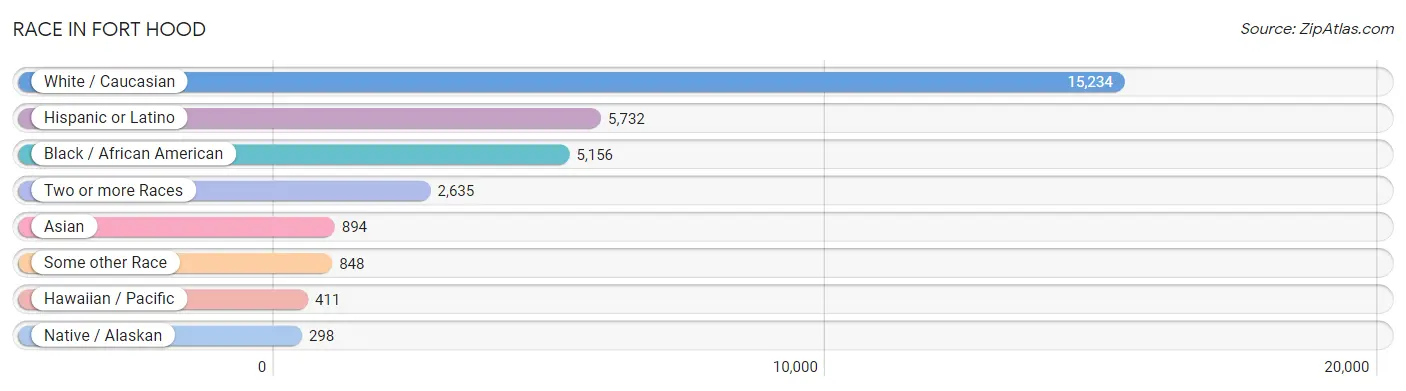
| Race | # Population | % Population |
| Asian | 894 | 3.5% |
| Black / African American | 5,156 | 20.2% |
| Hawaiian / Pacific | 411 | 1.6% |
| Hispanic or Latino | 5,732 | 22.5% |
| Native / Alaskan | 298 | 1.2% |
| White / Caucasian | 15,234 | 59.8% |
| Two or more Races | 2,635 | 10.3% |
| Some other Race | 848 | 3.3% |
| Total | 25,476 | 100.0% |
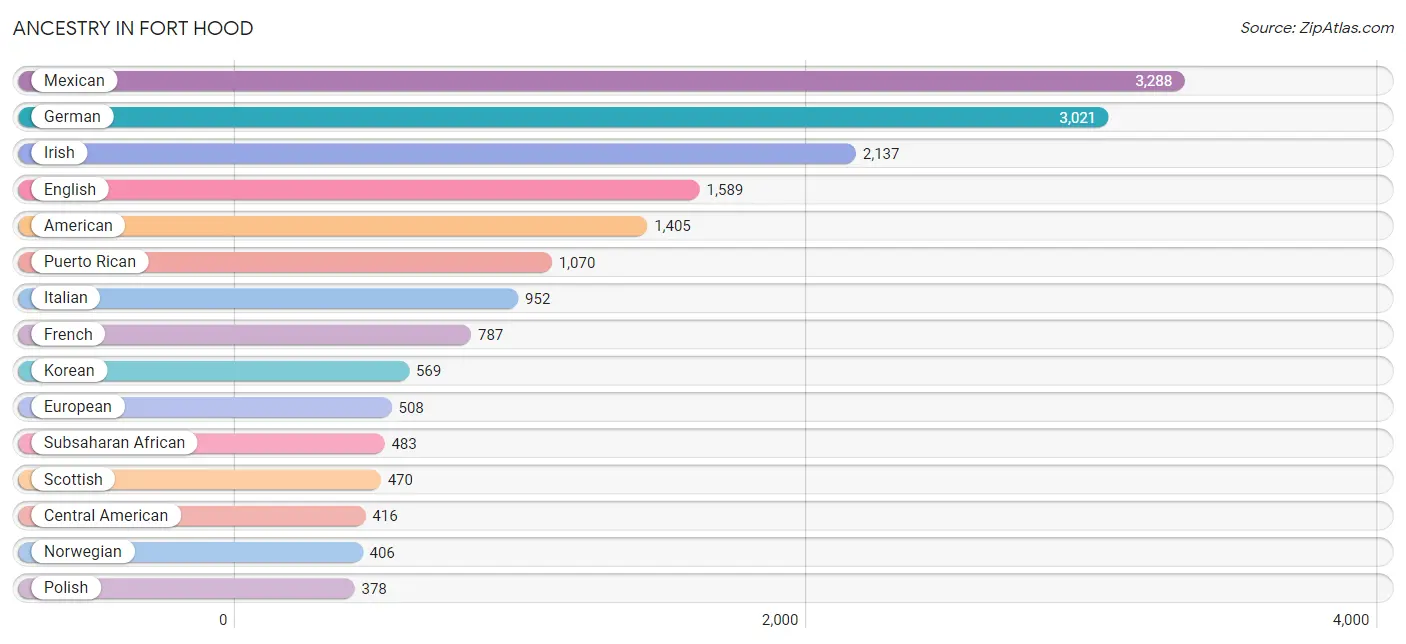
Ancestry in Fort Hood
The most populous ancestries reported in Fort Hood are Mexican (3,288 | 12.9%), German (3,021 | 11.9%), Irish (2,137 | 8.4%), English (1,589 | 6.2%), and American (1,405 | 5.5%), together accounting for 44.9% of all Fort Hood residents.
| Ancestry | # Population | % Population |
| African | 240 | 0.9% |
| Aleut | 11 | 0.0% |
| American | 1,405 | 5.5% |
| Apache | 12 | 0.1% |
| Arab | 109 | 0.4% |
| Bhutanese | 142 | 0.6% |
| Blackfeet | 38 | 0.2% |
| Brazilian | 87 | 0.3% |
| British | 132 | 0.5% |
| Burmese | 309 | 1.2% |
| Canadian | 33 | 0.1% |
| Central American | 416 | 1.6% |
| Central American Indian | 132 | 0.5% |
| Cherokee | 69 | 0.3% |
| Chickasaw | 9 | 0.0% |
| Chilean | 24 | 0.1% |
| Choctaw | 9 | 0.0% |
| Colombian | 163 | 0.6% |
| Costa Rican | 63 | 0.3% |
| Creek | 19 | 0.1% |
| Cuban | 166 | 0.6% |
| Czech | 90 | 0.4% |
| Czechoslovakian | 22 | 0.1% |
| Danish | 86 | 0.3% |
| Dominican | 160 | 0.6% |
| Dutch | 206 | 0.8% |
| Ecuadorian | 41 | 0.2% |
| Egyptian | 52 | 0.2% |
| English | 1,589 | 6.2% |
| European | 508 | 2.0% |
| Fijian | 79 | 0.3% |
| Finnish | 31 | 0.1% |
| French | 787 | 3.1% |
| French Canadian | 73 | 0.3% |
| German | 3,021 | 11.9% |
| Ghanaian | 47 | 0.2% |
| Greek | 48 | 0.2% |
| Guamanian / Chamorro | 189 | 0.7% |
| Guatemalan | 155 | 0.6% |
| Guyanese | 20 | 0.1% |
| Haitian | 114 | 0.4% |
| Honduran | 18 | 0.1% |
| Hopi | 5 | 0.0% |
| Hungarian | 48 | 0.2% |
| Indian (Asian) | 88 | 0.4% |
| Irish | 2,137 | 8.4% |
| Italian | 952 | 3.7% |
| Jamaican | 176 | 0.7% |
| Japanese | 19 | 0.1% |
| Kenyan | 85 | 0.3% |
| Korean | 569 | 2.2% |
| Latvian | 5 | 0.0% |
| Lebanese | 20 | 0.1% |
| Lithuanian | 97 | 0.4% |
| Lumbee | 39 | 0.2% |
| Malaysian | 51 | 0.2% |
| Mexican | 3,288 | 12.9% |
| Mexican American Indian | 53 | 0.2% |
| Native Hawaiian | 153 | 0.6% |
| Navajo | 31 | 0.1% |
| Nigerian | 39 | 0.2% |
| Northern European | 10 | 0.0% |
| Norwegian | 406 | 1.6% |
| Pakistani | 46 | 0.2% |
| Panamanian | 24 | 0.1% |
| Peruvian | 96 | 0.4% |
| Polish | 378 | 1.5% |
| Portuguese | 49 | 0.2% |
| Pueblo | 10 | 0.0% |
| Puerto Rican | 1,070 | 4.2% |
| Romanian | 32 | 0.1% |
| Russian | 117 | 0.5% |
| Salvadoran | 156 | 0.6% |
| Samoan | 242 | 0.9% |
| Scandinavian | 92 | 0.4% |
| Scotch-Irish | 189 | 0.7% |
| Scottish | 470 | 1.8% |
| Senegalese | 43 | 0.2% |
| Serbian | 6 | 0.0% |
| Slovak | 38 | 0.2% |
| South American | 356 | 1.4% |
| Soviet Union | 12 | 0.1% |
| Spaniard | 148 | 0.6% |
| Sri Lankan | 117 | 0.5% |
| Subsaharan African | 483 | 1.9% |
| Swedish | 203 | 0.8% |
| Thai | 56 | 0.2% |
| Trinidadian and Tobagonian | 14 | 0.1% |
| Ukrainian | 46 | 0.2% |
| Ute | 9 | 0.0% |
| Venezuelan | 32 | 0.1% |
| Vietnamese | 13 | 0.1% |
| Welsh | 61 | 0.2% |
| West Indian | 6 | 0.0% | View All 94 Rows |
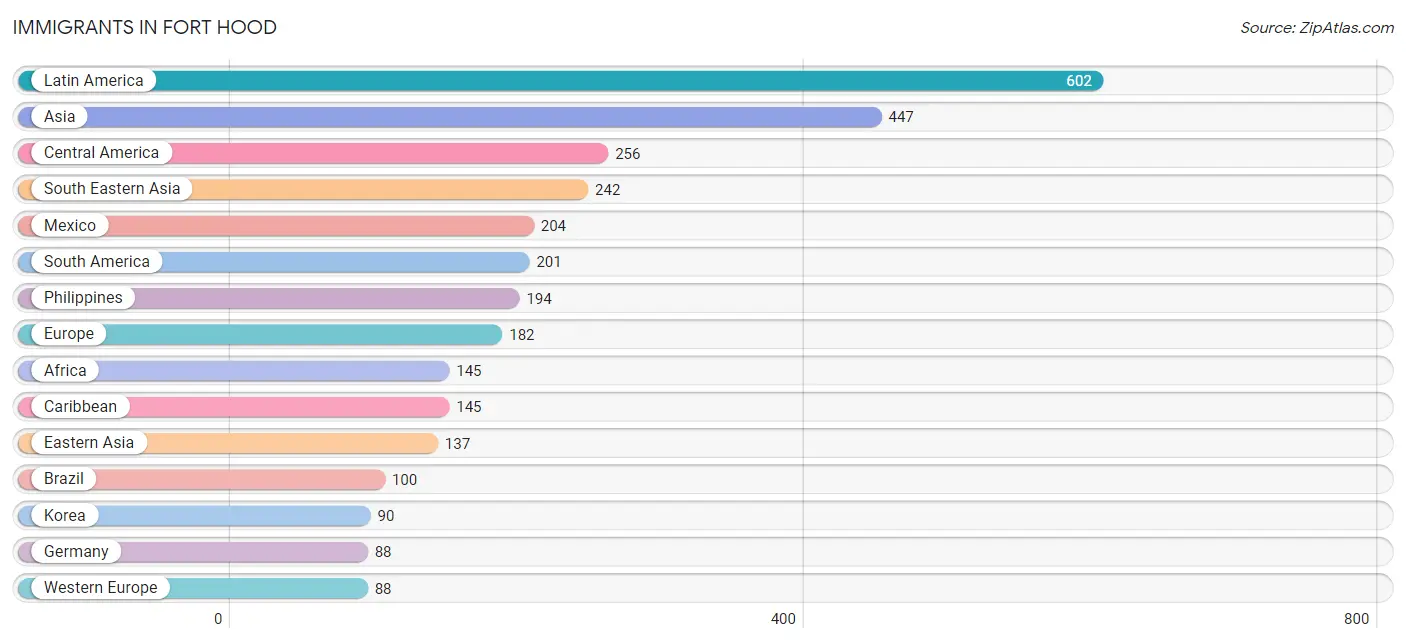
Immigrants in Fort Hood
The most numerous immigrant groups reported in Fort Hood came from Latin America (602 | 2.4%), Asia (447 | 1.8%), Central America (256 | 1.0%), South Eastern Asia (242 | 0.9%), and Mexico (204 | 0.8%), together accounting for 6.9% of all Fort Hood residents.
| Immigration Origin | # Population | % Population |
| Africa | 145 | 0.6% |
| Asia | 447 | 1.8% |
| Bangladesh | 13 | 0.1% |
| Belarus | 11 | 0.0% |
| Brazil | 100 | 0.4% |
| Cameroon | 20 | 0.1% |
| Canada | 10 | 0.0% |
| Caribbean | 145 | 0.6% |
| Central America | 256 | 1.0% |
| China | 44 | 0.2% |
| Colombia | 29 | 0.1% |
| Costa Rica | 32 | 0.1% |
| Cuba | 9 | 0.0% |
| Dominican Republic | 10 | 0.0% |
| Eastern Africa | 16 | 0.1% |
| Eastern Asia | 137 | 0.5% |
| Eastern Europe | 47 | 0.2% |
| Ecuador | 41 | 0.2% |
| El Salvador | 20 | 0.1% |
| England | 9 | 0.0% |
| Europe | 182 | 0.7% |
| Germany | 88 | 0.4% |
| Ghana | 28 | 0.1% |
| Haiti | 58 | 0.2% |
| India | 17 | 0.1% |
| Jamaica | 68 | 0.3% |
| Japan | 3 | 0.0% |
| Kenya | 16 | 0.1% |
| Korea | 90 | 0.4% |
| Latin America | 602 | 2.4% |
| Mexico | 204 | 0.8% |
| Middle Africa | 20 | 0.1% |
| Nepal | 25 | 0.1% |
| Northern Europe | 47 | 0.2% |
| Oceania | 53 | 0.2% |
| Peru | 10 | 0.0% |
| Philippines | 194 | 0.8% |
| Romania | 9 | 0.0% |
| Serbia | 6 | 0.0% |
| South Africa | 26 | 0.1% |
| South America | 201 | 0.8% |
| South Central Asia | 55 | 0.2% |
| South Eastern Asia | 242 | 0.9% |
| Thailand | 39 | 0.2% |
| Ukraine | 9 | 0.0% |
| Venezuela | 18 | 0.1% |
| Vietnam | 9 | 0.0% |
| Western Africa | 68 | 0.3% |
| Western Asia | 13 | 0.1% |
| Western Europe | 88 | 0.4% | View All 50 Rows |
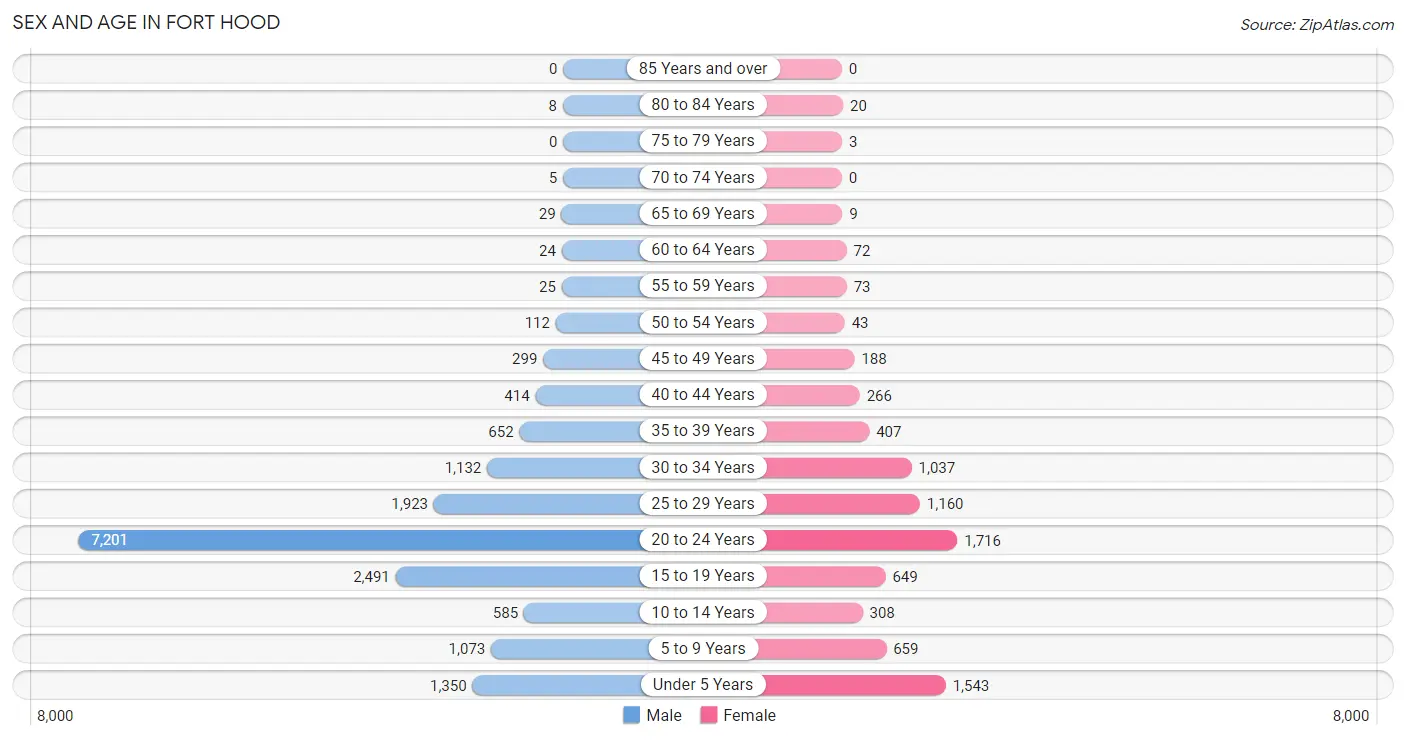
Sex and Age in Fort Hood
Sex and Age in Fort Hood
The most populous age groups in Fort Hood are 20 to 24 Years (7,201 | 41.6%) for men and 20 to 24 Years (1,716 | 21.0%) for women.
| Age Bracket | Male | Female |
| Under 5 Years | 1,350 (7.8%) | 1,543 (18.9%) |
| 5 to 9 Years | 1,073 (6.2%) | 659 (8.1%) |
| 10 to 14 Years | 585 (3.4%) | 308 (3.8%) |
| 15 to 19 Years | 2,491 (14.4%) | 649 (8.0%) |
| 20 to 24 Years | 7,201 (41.6%) | 1,716 (21.0%) |
| 25 to 29 Years | 1,923 (11.1%) | 1,160 (14.2%) |
| 30 to 34 Years | 1,132 (6.5%) | 1,037 (12.7%) |
| 35 to 39 Years | 652 (3.8%) | 407 (5.0%) |
| 40 to 44 Years | 414 (2.4%) | 266 (3.3%) |
| 45 to 49 Years | 299 (1.7%) | 188 (2.3%) |
| 50 to 54 Years | 112 (0.6%) | 43 (0.5%) |
| 55 to 59 Years | 25 (0.1%) | 73 (0.9%) |
| 60 to 64 Years | 24 (0.1%) | 72 (0.9%) |
| 65 to 69 Years | 29 (0.2%) | 9 (0.1%) |
| 70 to 74 Years | 5 (0.0%) | 0 (0.0%) |
| 75 to 79 Years | 0 (0.0%) | 3 (0.0%) |
| 80 to 84 Years | 8 (0.1%) | 20 (0.3%) |
| 85 Years and over | 0 (0.0%) | 0 (0.0%) |
| Total | 17,323 (100.0%) | 8,153 (100.0%) |
Families and Households in Fort Hood
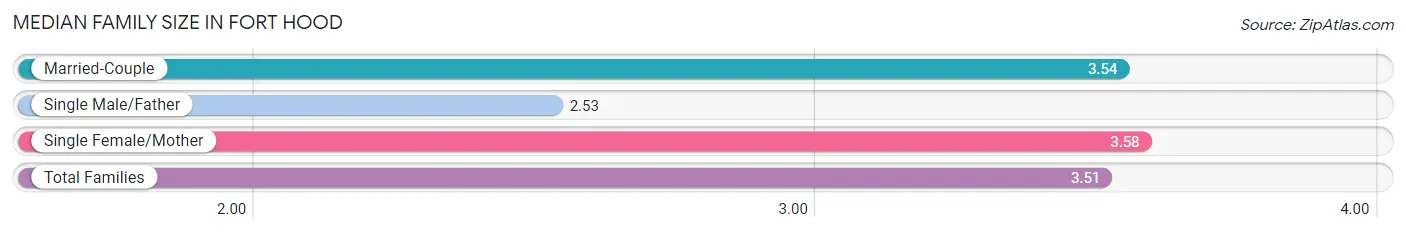
Median Family Size in Fort Hood
The median family size in Fort Hood is 3.51 persons per family, with single female/mother families (320 | 8.2%) accounting for the largest median family size of 3.58 persons per family. On the other hand, single male/father families (139 | 3.5%) represent the smallest median family size with 2.53 persons per family.
| Family Type | # Families | Family Size |
| Married-Couple | 3,452 (88.3%) | 3.54 |
| Single Male/Father | 139 (3.5%) | 2.53 |
| Single Female/Mother | 320 (8.2%) | 3.58 |
| Total Families | 3,911 (100.0%) | 3.51 |
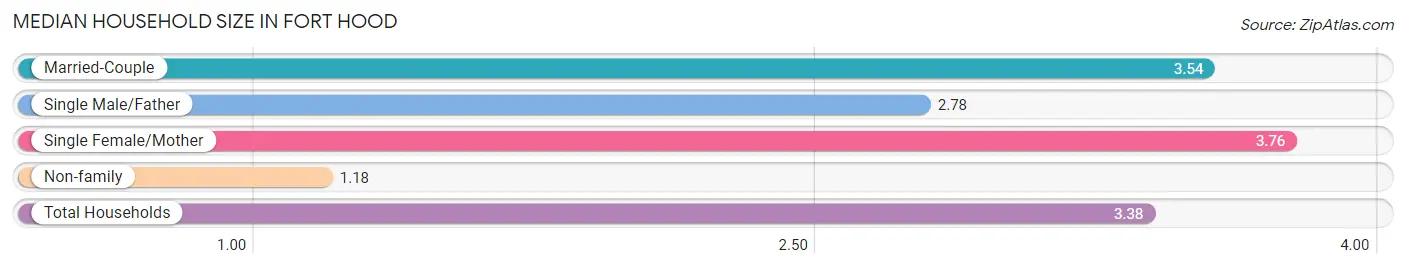
Median Household Size in Fort Hood
The median household size in Fort Hood is 3.38 persons per household, with single female/mother households (320 | 7.6%) accounting for the largest median household size of 3.76 persons per household. non-family households (277 | 6.6%) represent the smallest median household size with 1.18 persons per household.
| Household Type | # Households | Household Size |
| Married-Couple | 3,452 (82.4%) | 3.54 |
| Single Male/Father | 139 (3.3%) | 2.78 |
| Single Female/Mother | 320 (7.6%) | 3.76 |
| Non-family | 277 (6.6%) | 1.18 |
| Total Households | 4,188 (100.0%) | 3.38 |
Household Size by Marriage Status in Fort Hood
Out of a total of 4,188 households in Fort Hood, 3,911 (93.4%) are family households, while 277 (6.6%) are nonfamily households. The most numerous type of family households are 2-person households, comprising 1,097, and the most common type of nonfamily households are 1-person households, comprising 229.
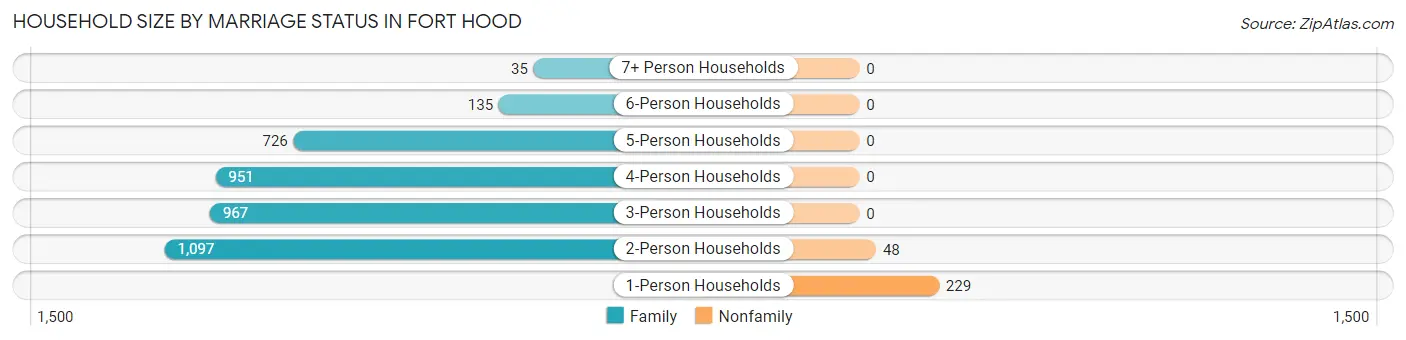
| Household Size | Family Households | Nonfamily Households |
| 1-Person Households | - | 229 (5.5%) |
| 2-Person Households | 1,097 (26.2%) | 48 (1.1%) |
| 3-Person Households | 967 (23.1%) | 0 (0.0%) |
| 4-Person Households | 951 (22.7%) | 0 (0.0%) |
| 5-Person Households | 726 (17.3%) | 0 (0.0%) |
| 6-Person Households | 135 (3.2%) | 0 (0.0%) |
| 7+ Person Households | 35 (0.8%) | 0 (0.0%) |
| Total | 3,911 (93.4%) | 277 (6.6%) |
Female Fertility in Fort Hood
Fertility by Age in Fort Hood
Average fertility rate in Fort Hood is 133.0 births per 1,000 women. Women in the age bracket of 20 to 34 years have the highest fertility rate with 180.0 births per 1,000 women. Women in the age bracket of 20 to 34 years acount for 97.1% of all women with births.
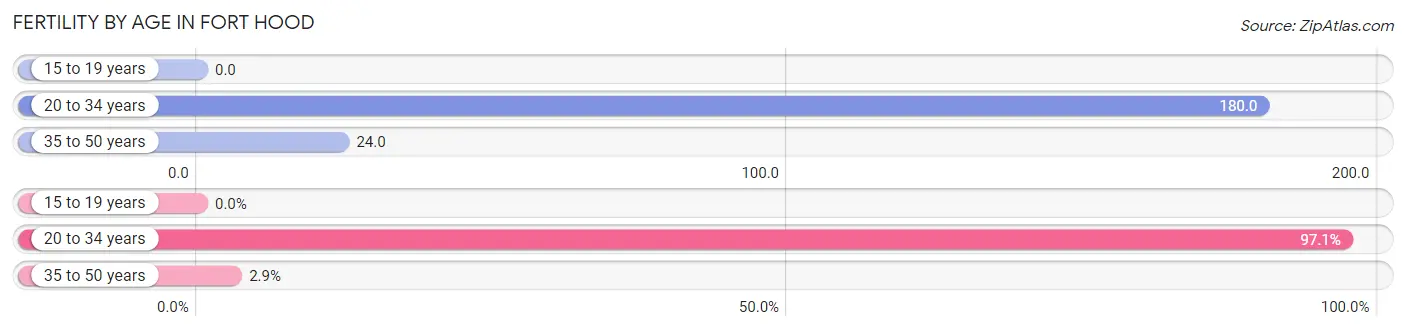
| Age Bracket | Women with Births | Births / 1,000 Women |
| 15 to 19 years | 0 (0.0%) | 0.0 |
| 20 to 34 years | 704 (97.1%) | 180.0 |
| 35 to 50 years | 21 (2.9%) | 24.0 |
| Total | 725 (100.0%) | 133.0 |
Fertility by Age by Marriage Status in Fort Hood
97.2% of women with births (725) in Fort Hood are married. The highest percentage of unmarried women with births falls into 20 to 34 years age bracket with 2.8% of them unmarried at the time of birth, while the lowest percentage of unmarried women with births belong to 35 to 50 years age bracket with 0.0% of them unmarried.
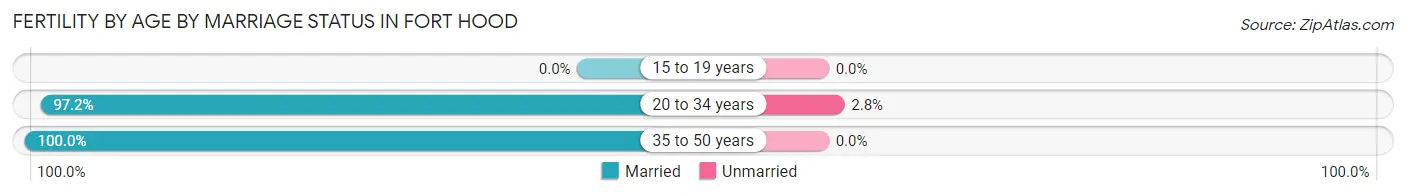
| Age Bracket | Married | Unmarried |
| 15 to 19 years | 0 (0.0%) | 0 (0.0%) |
| 20 to 34 years | 684 (97.2%) | 20 (2.8%) |
| 35 to 50 years | 21 (100.0%) | 0 (0.0%) |
| Total | 705 (97.2%) | 20 (2.8%) |
Fertility by Education in Fort Hood
Average fertility rate in Fort Hood is 133.0 births per 1,000 women. Women with the education attainment of college or associate's degree have the highest fertility rate of 180.0 births per 1,000 women, while women with the education attainment of graduate degree have the lowest fertility at 57.0 births per 1,000 women. Women with the education attainment of college or associate's degree represent 61.9% of all women with births.
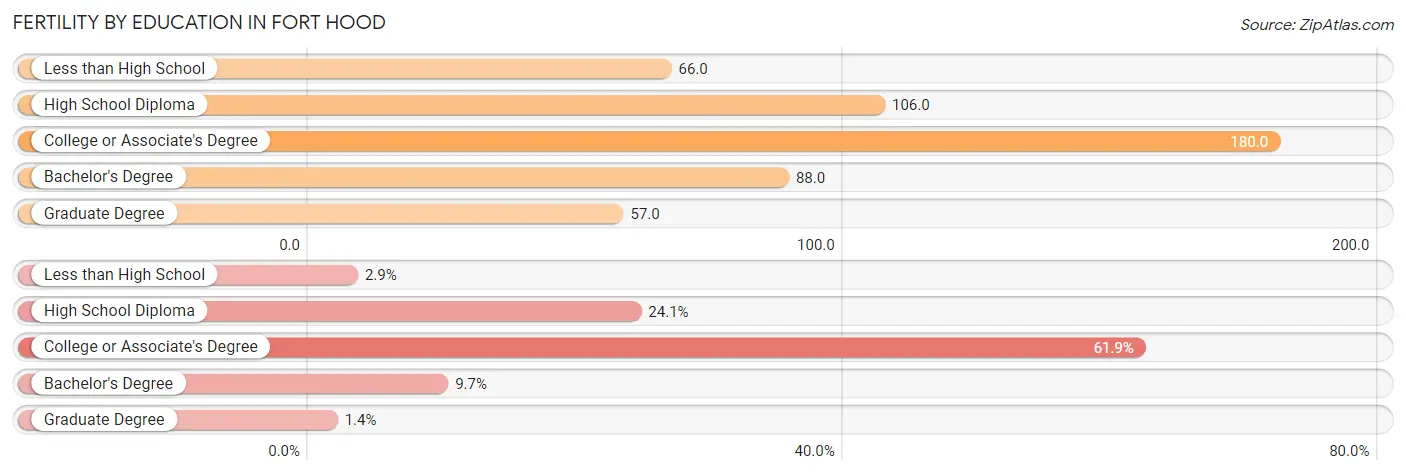
| Educational Attainment | Women with Births | Births / 1,000 Women |
| Less than High School | 21 (2.9%) | 66.0 |
| High School Diploma | 175 (24.1%) | 106.0 |
| College or Associate's Degree | 449 (61.9%) | 180.0 |
| Bachelor's Degree | 70 (9.7%) | 88.0 |
| Graduate Degree | 10 (1.4%) | 57.0 |
| Total | 725 (100.0%) | 133.0 |
Fertility by Education by Marriage Status in Fort Hood
2.8% of women with births in Fort Hood are unmarried. Women with the educational attainment of less than high school are most likely to be married with 100.0% of them married at childbirth, while women with the educational attainment of college or associate's degree are least likely to be married with 4.4% of them unmarried at childbirth.
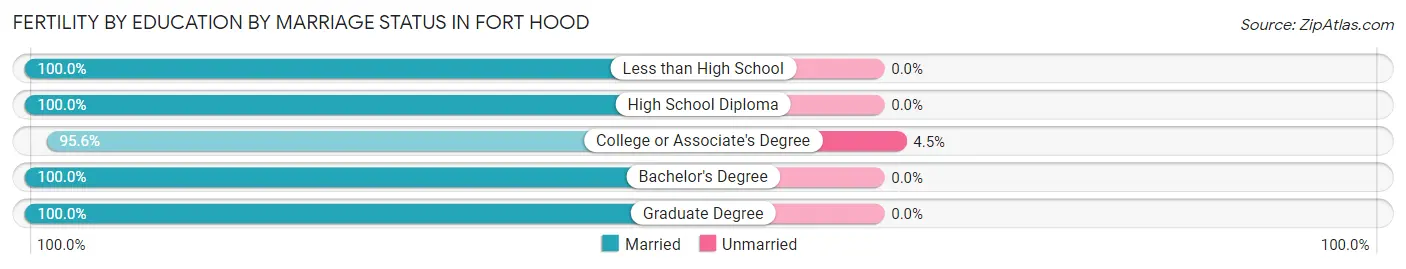
| Educational Attainment | Married | Unmarried |
| Less than High School | 21 (100.0%) | 0 (0.0%) |
| High School Diploma | 175 (100.0%) | 0 (0.0%) |
| College or Associate's Degree | 429 (95.6%) | 20 (4.4%) |
| Bachelor's Degree | 70 (100.0%) | 0 (0.0%) |
| Graduate Degree | 10 (100.0%) | 0 (0.0%) |
| Total | 705 (97.2%) | 20 (2.8%) |
Employment Characteristics in Fort Hood
Employment by Class of Employer in Fort Hood
Among the 14,840 employed individuals in Fort Hood, federal government employees (12,468 | 84.0%), private company employees (1,900 | 12.8%), and local government employees (138 | 0.9%) make up the most common classes of employment.
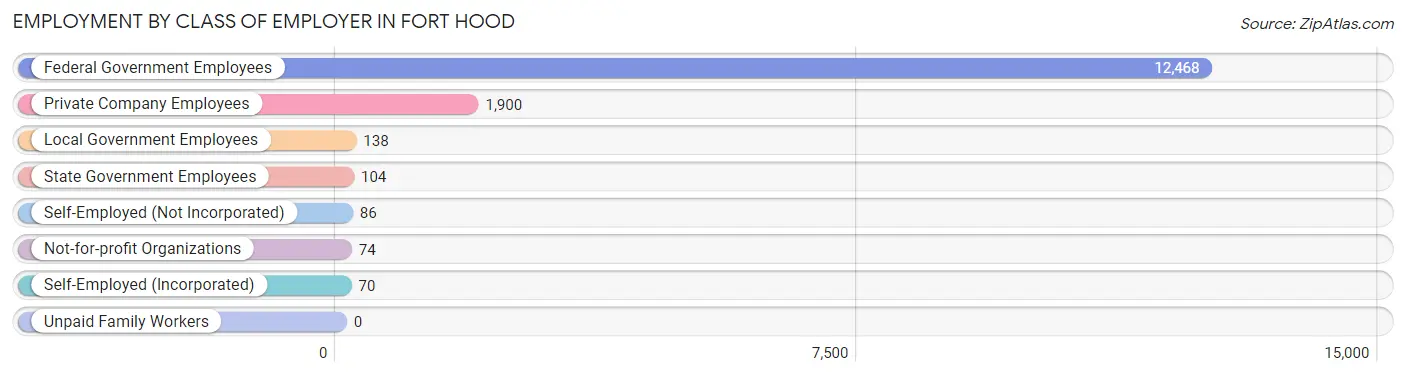
| Employer Class | # Employees | % Employees |
| Private Company Employees | 1,900 | 12.8% |
| Self-Employed (Incorporated) | 70 | 0.5% |
| Self-Employed (Not Incorporated) | 86 | 0.6% |
| Not-for-profit Organizations | 74 | 0.5% |
| Local Government Employees | 138 | 0.9% |
| State Government Employees | 104 | 0.7% |
| Federal Government Employees | 12,468 | 84.0% |
| Unpaid Family Workers | 0 | 0.0% |
| Total | 14,840 | 100.0% |
Employment Status by Age in Fort Hood
According to the labor force statistics for Fort Hood, out of the total population over 16 years of age (19,858), 82.1% or 16,303 individuals are in the labor force, with 15.2% or 2,478 of them unemployed. The age group with the highest labor force participation rate is 20 to 24 years, with 88.7% or 7,909 individuals in the labor force. Within the labor force, the 45 to 54 years age range has the highest percentage of unemployed individuals, with 38.8% or 180 of them being unemployed.
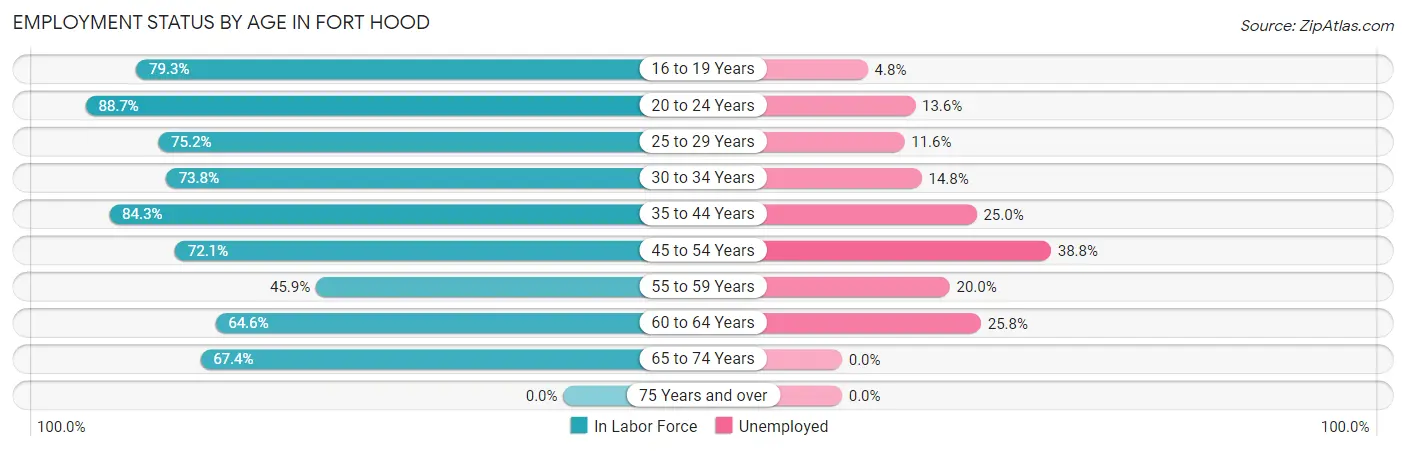
| Age Bracket | In Labor Force | Unemployed |
| 16 to 19 Years | 2,411 (79.3%) | 116 (4.8%) |
| 20 to 24 Years | 7,909 (88.7%) | 1,076 (13.6%) |
| 25 to 29 Years | 2,318 (75.2%) | 269 (11.6%) |
| 30 to 34 Years | 1,601 (73.8%) | 237 (14.8%) |
| 35 to 44 Years | 1,466 (84.3%) | 366 (25.0%) |
| 45 to 54 Years | 463 (72.1%) | 180 (38.8%) |
| 55 to 59 Years | 45 (45.9%) | 9 (20.0%) |
| 60 to 64 Years | 62 (64.6%) | 16 (25.8%) |
| 65 to 74 Years | 29 (67.4%) | 0 (0.0%) |
| 75 Years and over | 0 (0.0%) | 0 (0.0%) |
| Total | 16,303 (82.1%) | 2,478 (15.2%) |
Employment Status by Educational Attainment in Fort Hood
According to labor force statistics for Fort Hood, 76.1% of individuals (5,956) out of the total population between 25 and 64 years of age (7,827) are in the labor force, with 19.3% or 1,150 of them being unemployed. The group with the highest labor force participation rate are those with the educational attainment of bachelor's degree or higher, with 84.5% or 1,579 individuals in the labor force. Within the labor force, individuals with less than high school education have the highest percentage of unemployment, with 23.9% or 21 of them being unemployed.
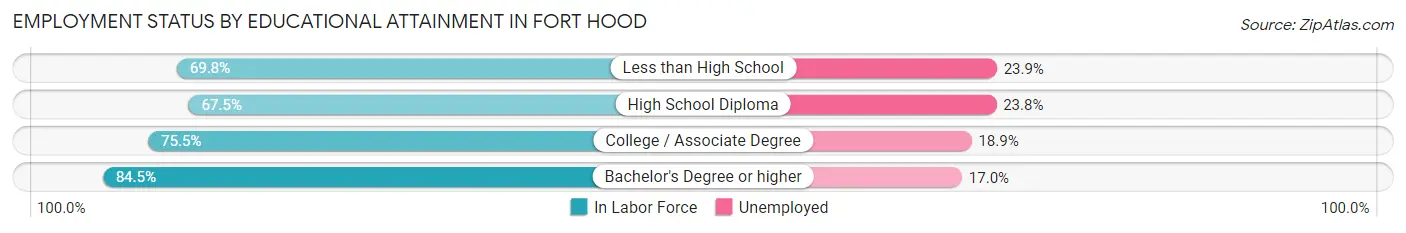
| Educational Attainment | In Labor Force | Unemployed |
| Less than High School | 88 (69.8%) | 30 (23.9%) |
| High School Diploma | 963 (67.5%) | 340 (23.8%) |
| College / Associate Degree | 3,326 (75.5%) | 833 (18.9%) |
| Bachelor's Degree or higher | 1,579 (84.5%) | 318 (17.0%) |
| Total | 5,956 (76.1%) | 1,511 (19.3%) |
Employment Occupations by Sex in Fort Hood
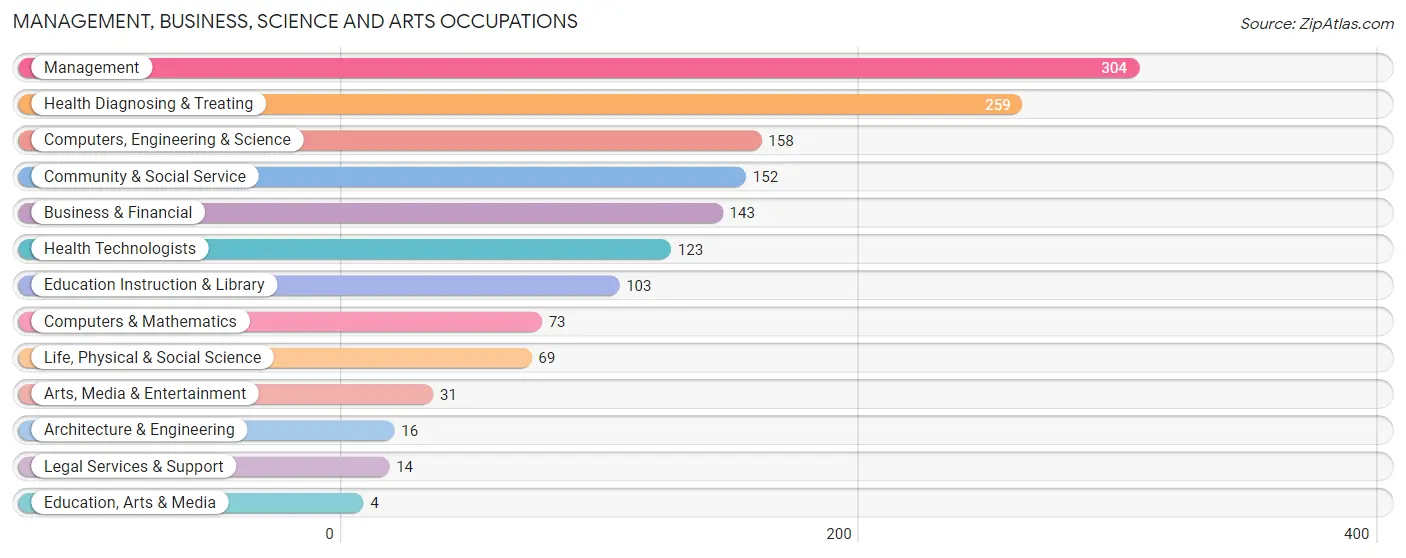
Management, Business, Science and Arts Occupations
The most common Management, Business, Science and Arts occupations in Fort Hood are Management (304 | 9.9%), Health Diagnosing & Treating (259 | 8.4%), Computers, Engineering & Science (158 | 5.1%), Community & Social Service (152 | 5.0%), and Business & Financial (143 | 4.6%).
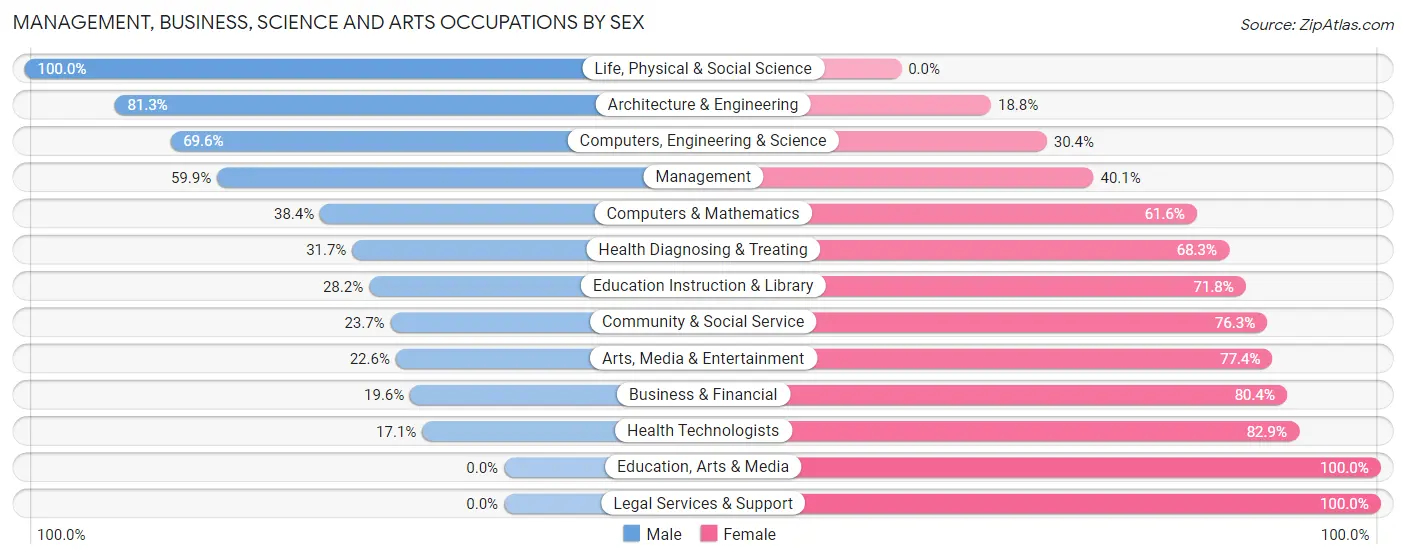
Management, Business, Science and Arts Occupations by Sex
Within the Management, Business, Science and Arts occupations in Fort Hood, the most male-oriented occupations are Life, Physical & Social Science (100.0%), Architecture & Engineering (81.2%), and Computers, Engineering & Science (69.6%), while the most female-oriented occupations are Education, Arts & Media (100.0%), Legal Services & Support (100.0%), and Health Technologists (82.9%).
| Occupation | Male | Female |
| Management | 182 (59.9%) | 122 (40.1%) |
| Business & Financial | 28 (19.6%) | 115 (80.4%) |
| Computers, Engineering & Science | 110 (69.6%) | 48 (30.4%) |
| Computers & Mathematics | 28 (38.4%) | 45 (61.6%) |
| Architecture & Engineering | 13 (81.2%) | 3 (18.8%) |
| Life, Physical & Social Science | 69 (100.0%) | 0 (0.0%) |
| Community & Social Service | 36 (23.7%) | 116 (76.3%) |
| Education, Arts & Media | 0 (0.0%) | 4 (100.0%) |
| Legal Services & Support | 0 (0.0%) | 14 (100.0%) |
| Education Instruction & Library | 29 (28.2%) | 74 (71.8%) |
| Arts, Media & Entertainment | 7 (22.6%) | 24 (77.4%) |
| Health Diagnosing & Treating | 82 (31.7%) | 177 (68.3%) |
| Health Technologists | 21 (17.1%) | 102 (82.9%) |
| Total (Category) | 438 (43.1%) | 578 (56.9%) |
| Total (Overall) | 1,686 (54.9%) | 1,386 (45.1%) |
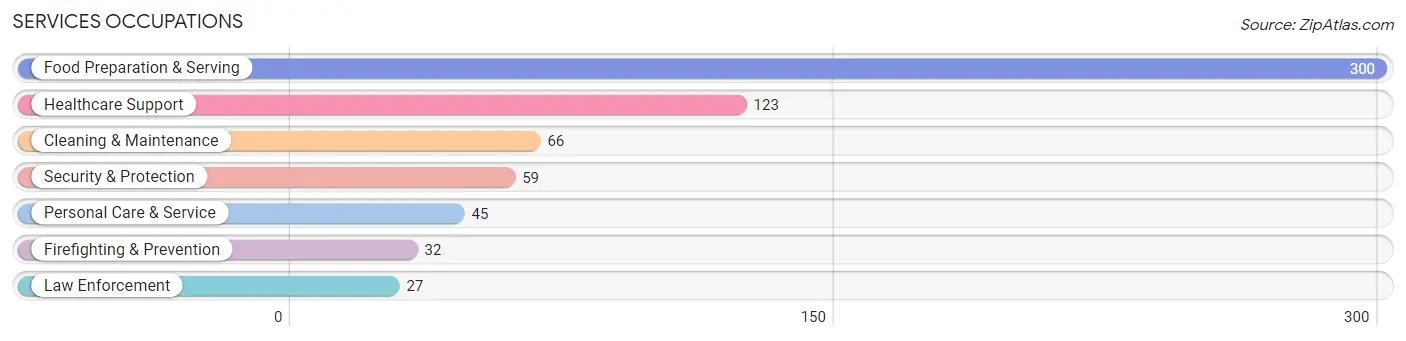
Services Occupations
The most common Services occupations in Fort Hood are Food Preparation & Serving (300 | 9.8%), Healthcare Support (123 | 4.0%), Cleaning & Maintenance (66 | 2.1%), Security & Protection (59 | 1.9%), and Personal Care & Service (45 | 1.5%).
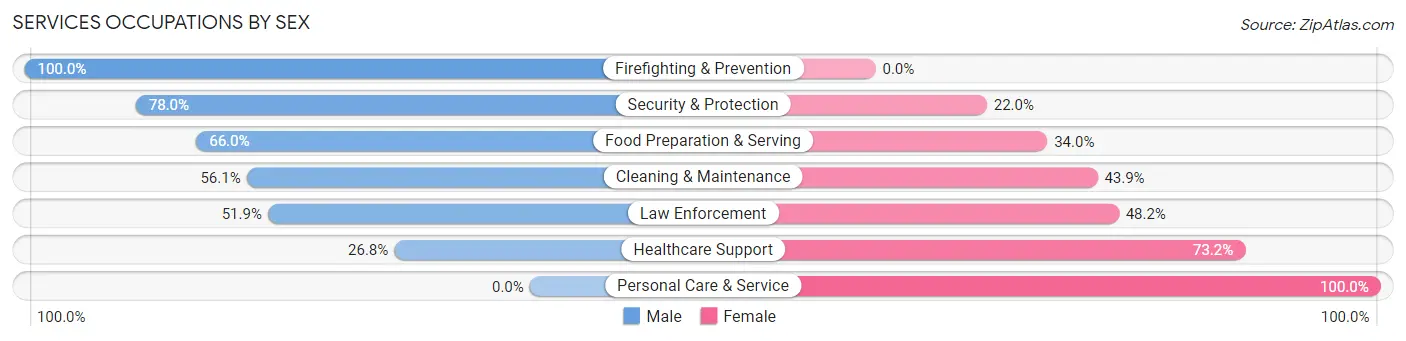
Services Occupations by Sex
Within the Services occupations in Fort Hood, the most male-oriented occupations are Firefighting & Prevention (100.0%), Security & Protection (78.0%), and Food Preparation & Serving (66.0%), while the most female-oriented occupations are Personal Care & Service (100.0%), Healthcare Support (73.2%), and Law Enforcement (48.1%).
| Occupation | Male | Female |
| Healthcare Support | 33 (26.8%) | 90 (73.2%) |
| Security & Protection | 46 (78.0%) | 13 (22.0%) |
| Firefighting & Prevention | 32 (100.0%) | 0 (0.0%) |
| Law Enforcement | 14 (51.8%) | 13 (48.1%) |
| Food Preparation & Serving | 198 (66.0%) | 102 (34.0%) |
| Cleaning & Maintenance | 37 (56.1%) | 29 (43.9%) |
| Personal Care & Service | 0 (0.0%) | 45 (100.0%) |
| Total (Category) | 314 (52.9%) | 279 (47.0%) |
| Total (Overall) | 1,686 (54.9%) | 1,386 (45.1%) |
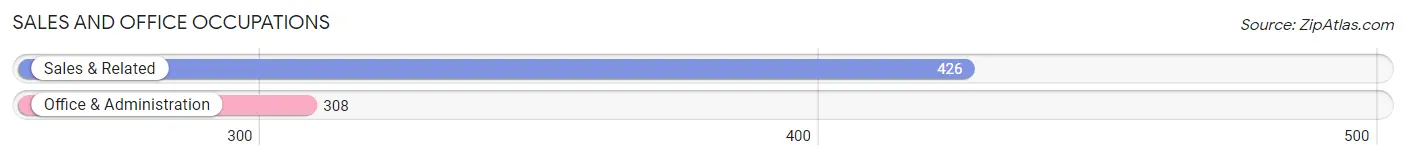
Sales and Office Occupations
The most common Sales and Office occupations in Fort Hood are Sales & Related (426 | 13.9%), and Office & Administration (308 | 10.0%).
Sales and Office Occupations by Sex
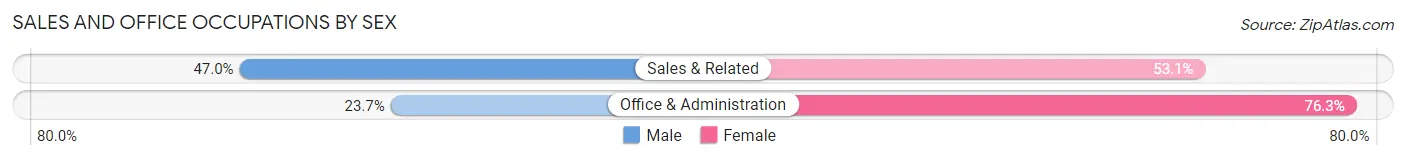
| Occupation | Male | Female |
| Sales & Related | 200 (46.9%) | 226 (53.0%) |
| Office & Administration | 73 (23.7%) | 235 (76.3%) |
| Total (Category) | 273 (37.2%) | 461 (62.8%) |
| Total (Overall) | 1,686 (54.9%) | 1,386 (45.1%) |
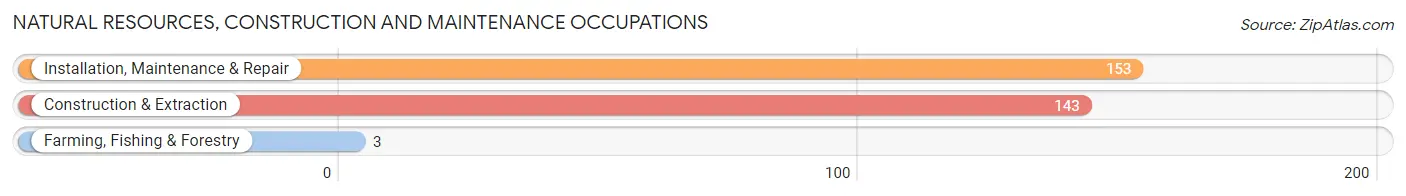
Natural Resources, Construction and Maintenance Occupations
The most common Natural Resources, Construction and Maintenance occupations in Fort Hood are Installation, Maintenance & Repair (153 | 5.0%), Construction & Extraction (143 | 4.6%), and Farming, Fishing & Forestry (3 | 0.1%).
Natural Resources, Construction and Maintenance Occupations by Sex
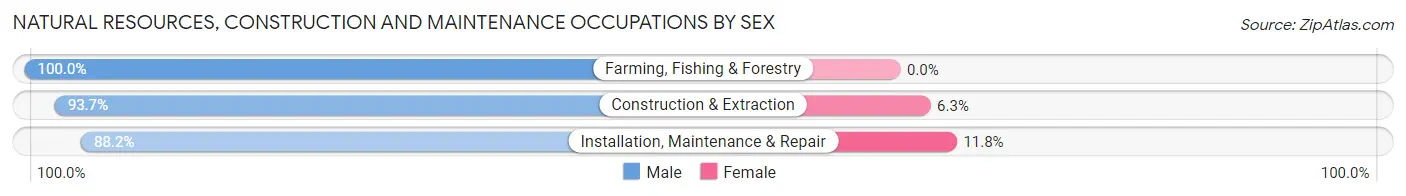
| Occupation | Male | Female |
| Farming, Fishing & Forestry | 3 (100.0%) | 0 (0.0%) |
| Construction & Extraction | 134 (93.7%) | 9 (6.3%) |
| Installation, Maintenance & Repair | 135 (88.2%) | 18 (11.8%) |
| Total (Category) | 272 (91.0%) | 27 (9.0%) |
| Total (Overall) | 1,686 (54.9%) | 1,386 (45.1%) |
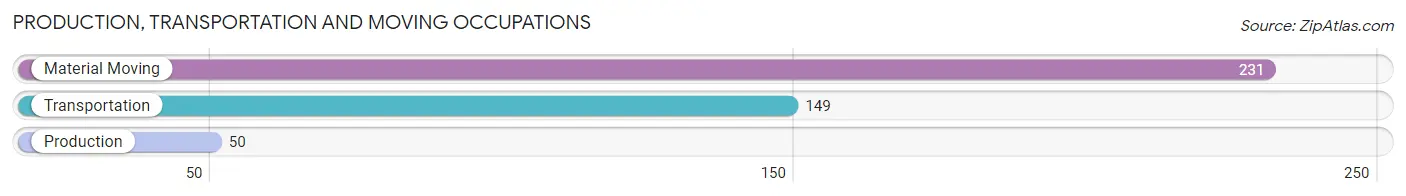
Production, Transportation and Moving Occupations
The most common Production, Transportation and Moving occupations in Fort Hood are Material Moving (231 | 7.5%), Transportation (149 | 4.9%), and Production (50 | 1.6%).
Production, Transportation and Moving Occupations by Sex
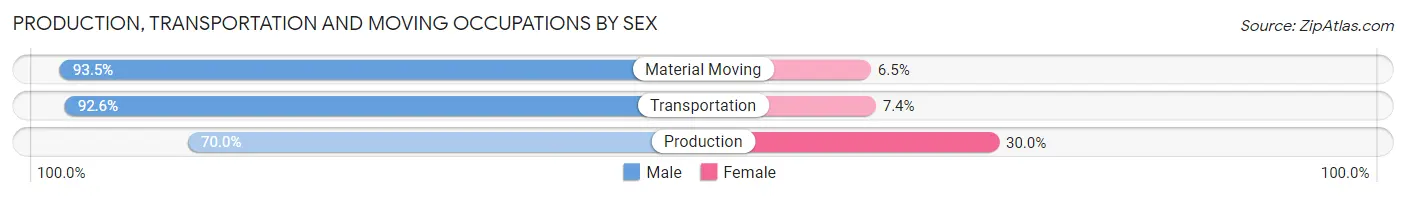
| Occupation | Male | Female |
| Production | 35 (70.0%) | 15 (30.0%) |
| Transportation | 138 (92.6%) | 11 (7.4%) |
| Material Moving | 216 (93.5%) | 15 (6.5%) |
| Total (Category) | 389 (90.5%) | 41 (9.5%) |
| Total (Overall) | 1,686 (54.9%) | 1,386 (45.1%) |
Employment Industries by Sex in Fort Hood
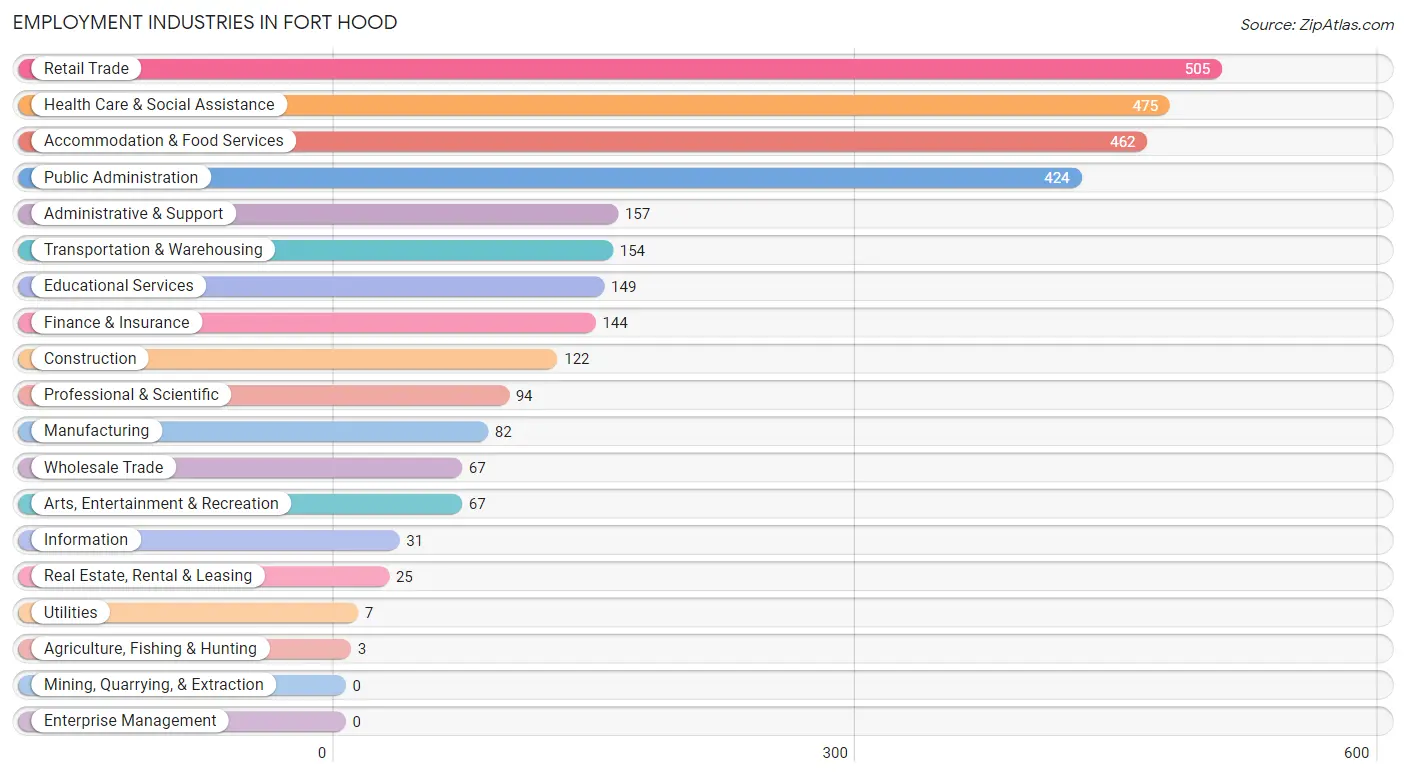
Employment Industries in Fort Hood
The major employment industries in Fort Hood include Retail Trade (505 | 16.4%), Health Care & Social Assistance (475 | 15.5%), Accommodation & Food Services (462 | 15.0%), Public Administration (424 | 13.8%), and Administrative & Support (157 | 5.1%).
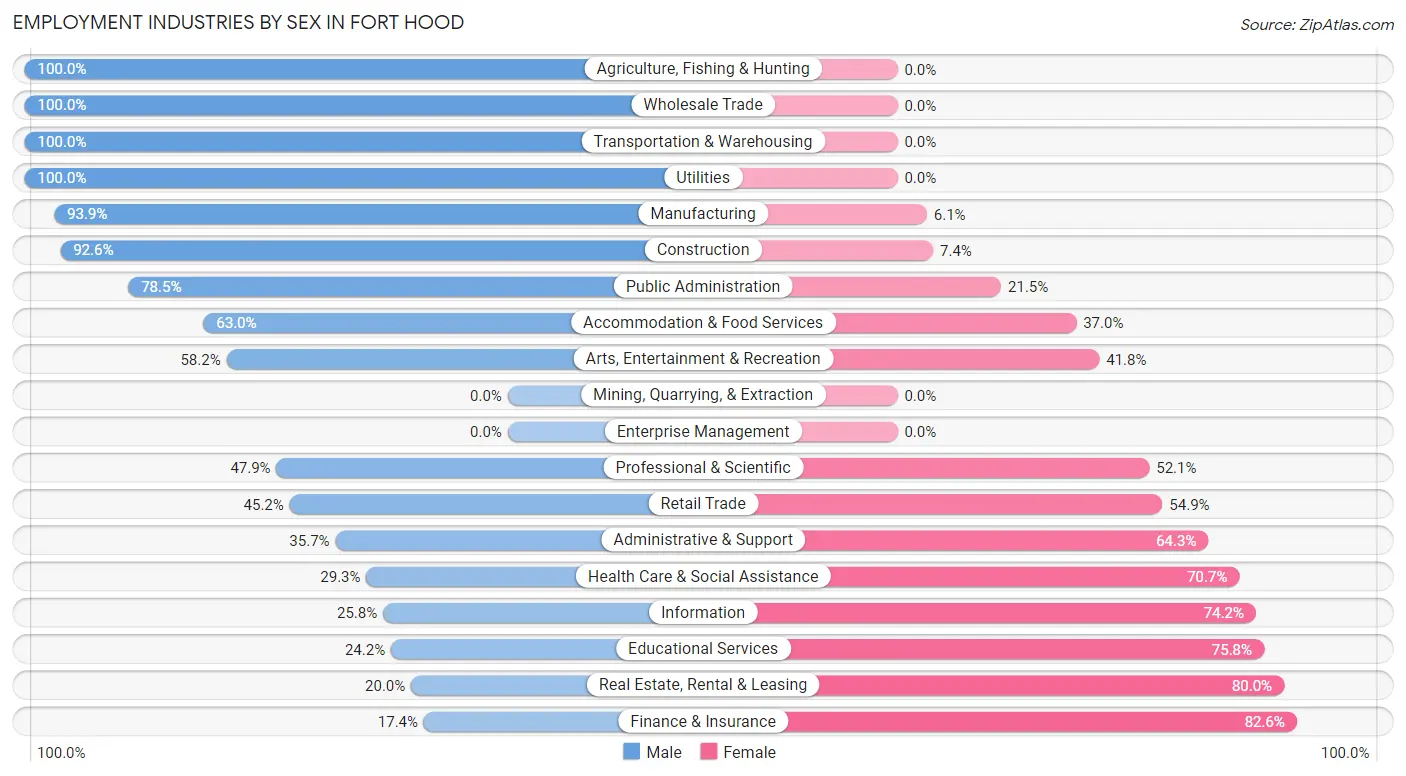
Employment Industries by Sex in Fort Hood
The Fort Hood industries that see more men than women are Agriculture, Fishing & Hunting (100.0%), Wholesale Trade (100.0%), and Transportation & Warehousing (100.0%), whereas the industries that tend to have a higher number of women are Finance & Insurance (82.6%), Real Estate, Rental & Leasing (80.0%), and Educational Services (75.8%).
| Industry | Male | Female |
| Agriculture, Fishing & Hunting | 3 (100.0%) | 0 (0.0%) |
| Mining, Quarrying, & Extraction | 0 (0.0%) | 0 (0.0%) |
| Construction | 113 (92.6%) | 9 (7.4%) |
| Manufacturing | 77 (93.9%) | 5 (6.1%) |
| Wholesale Trade | 67 (100.0%) | 0 (0.0%) |
| Retail Trade | 228 (45.2%) | 277 (54.8%) |
| Transportation & Warehousing | 154 (100.0%) | 0 (0.0%) |
| Utilities | 7 (100.0%) | 0 (0.0%) |
| Information | 8 (25.8%) | 23 (74.2%) |
| Finance & Insurance | 25 (17.4%) | 119 (82.6%) |
| Real Estate, Rental & Leasing | 5 (20.0%) | 20 (80.0%) |
| Professional & Scientific | 45 (47.9%) | 49 (52.1%) |
| Enterprise Management | 0 (0.0%) | 0 (0.0%) |
| Administrative & Support | 56 (35.7%) | 101 (64.3%) |
| Educational Services | 36 (24.2%) | 113 (75.8%) |
| Health Care & Social Assistance | 139 (29.3%) | 336 (70.7%) |
| Arts, Entertainment & Recreation | 39 (58.2%) | 28 (41.8%) |
| Accommodation & Food Services | 291 (63.0%) | 171 (37.0%) |
| Public Administration | 333 (78.5%) | 91 (21.5%) |
| Total | 1,686 (54.9%) | 1,386 (45.1%) |
Education in Fort Hood
School Enrollment in Fort Hood
The most common levels of schooling among the 5,738 students in Fort Hood are college / undergraduate (2,171 | 37.8%), elementary school (1,137 | 19.8%), and middle school (670 | 11.7%).
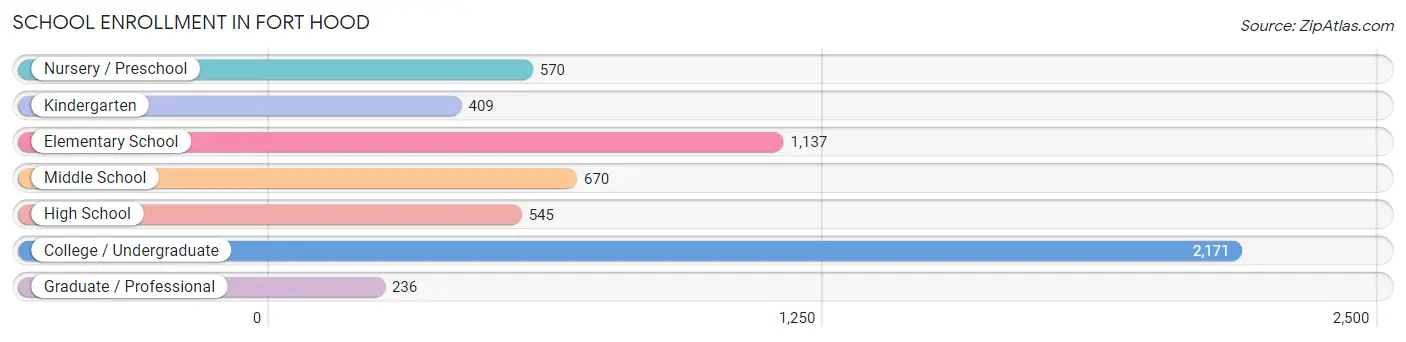
| School Level | # Students | % Students |
| Nursery / Preschool | 570 | 9.9% |
| Kindergarten | 409 | 7.1% |
| Elementary School | 1,137 | 19.8% |
| Middle School | 670 | 11.7% |
| High School | 545 | 9.5% |
| College / Undergraduate | 2,171 | 37.8% |
| Graduate / Professional | 236 | 4.1% |
| Total | 5,738 | 100.0% |
School Enrollment by Age by Funding Source in Fort Hood
Out of a total of 5,738 students who are enrolled in schools in Fort Hood, 717 (12.5%) attend a private institution, while the remaining 5,021 (87.5%) are enrolled in public schools. The age group of 18 to 19 year olds has the highest likelihood of being enrolled in private schools, with 155 (42.0% in the age bracket) enrolled. Conversely, the age group of 25 to 34 year olds has the lowest likelihood of being enrolled in a private school, with 946 (94.5% in the age bracket) attending a public institution.
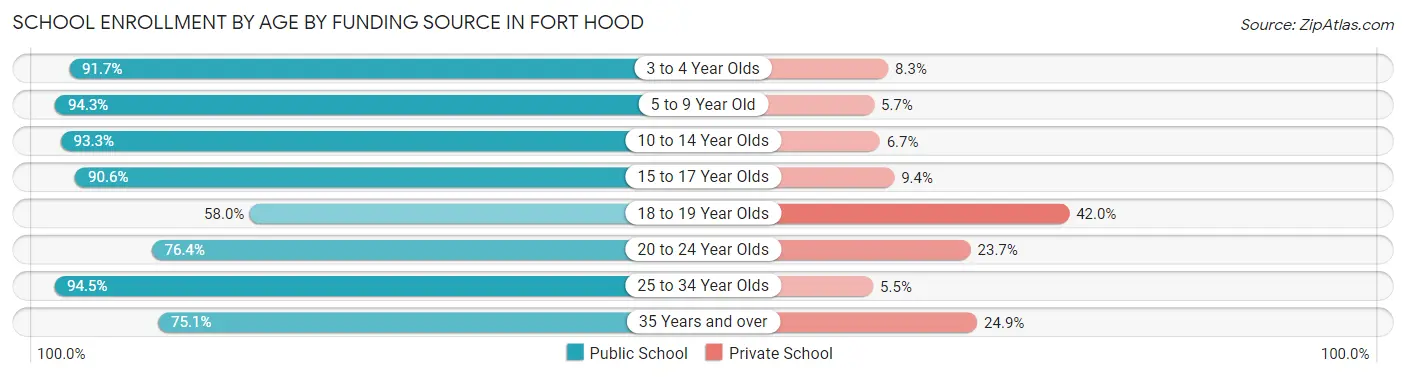
| Age Bracket | Public School | Private School |
| 3 to 4 Year Olds | 398 (91.7%) | 36 (8.3%) |
| 5 to 9 Year Old | 1,417 (94.3%) | 85 (5.7%) |
| 10 to 14 Year Olds | 833 (93.3%) | 60 (6.7%) |
| 15 to 17 Year Olds | 250 (90.6%) | 26 (9.4%) |
| 18 to 19 Year Olds | 214 (58.0%) | 155 (42.0%) |
| 20 to 24 Year Olds | 694 (76.3%) | 215 (23.6%) |
| 25 to 34 Year Olds | 946 (94.5%) | 55 (5.5%) |
| 35 Years and over | 266 (75.1%) | 88 (24.9%) |
| Total | 5,021 (87.5%) | 717 (12.5%) |
Educational Attainment by Field of Study in Fort Hood
Arts & humanities (444 | 21.6%), business (406 | 19.7%), social sciences (211 | 10.2%), psychology (151 | 7.3%), and science & technology (146 | 7.1%) are the most common fields of study among 2,059 individuals in Fort Hood who have obtained a bachelor's degree or higher.
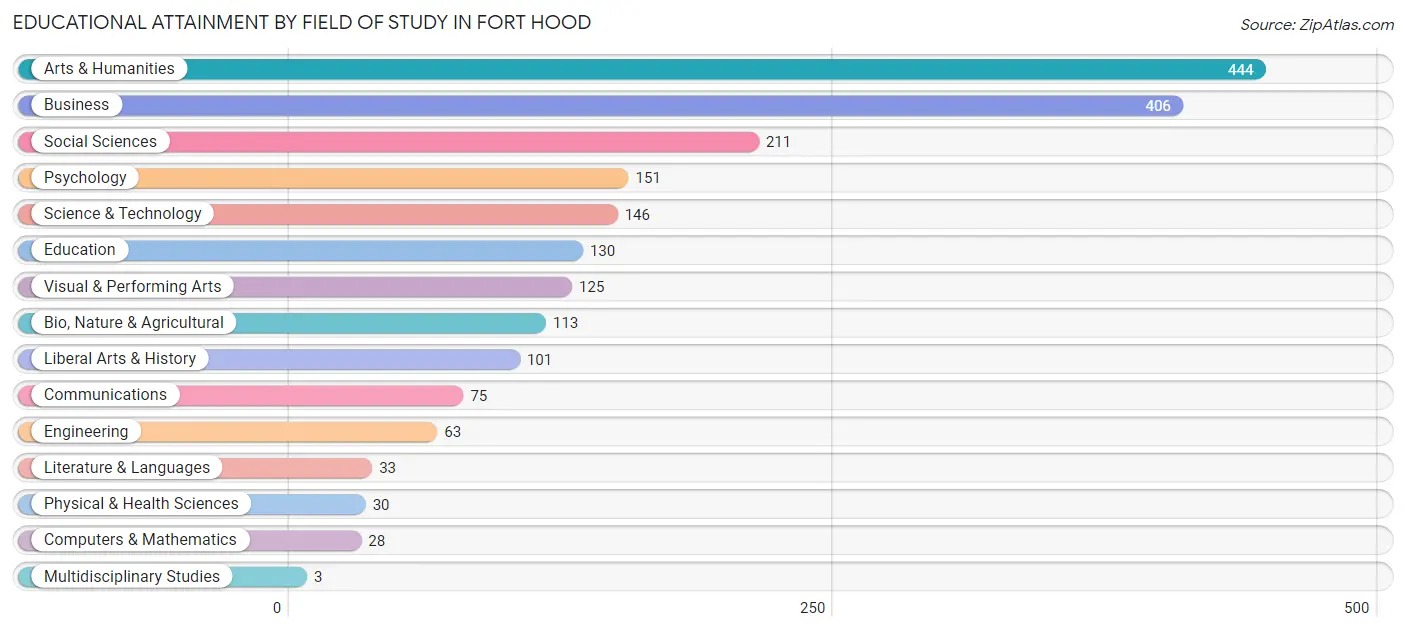
| Field of Study | # Graduates | % Graduates |
| Computers & Mathematics | 28 | 1.4% |
| Bio, Nature & Agricultural | 113 | 5.5% |
| Physical & Health Sciences | 30 | 1.5% |
| Psychology | 151 | 7.3% |
| Social Sciences | 211 | 10.2% |
| Engineering | 63 | 3.1% |
| Multidisciplinary Studies | 3 | 0.2% |
| Science & Technology | 146 | 7.1% |
| Business | 406 | 19.7% |
| Education | 130 | 6.3% |
| Literature & Languages | 33 | 1.6% |
| Liberal Arts & History | 101 | 4.9% |
| Visual & Performing Arts | 125 | 6.1% |
| Communications | 75 | 3.6% |
| Arts & Humanities | 444 | 21.6% |
| Total | 2,059 | 100.0% |
Transportation & Commute in Fort Hood
Vehicle Availability by Sex in Fort Hood
The most prevalent vehicle ownership categories in Fort Hood are males with 2 vehicles (2,293, accounting for 65.2%) and females with 2 vehicles (954, making up 153.2%).
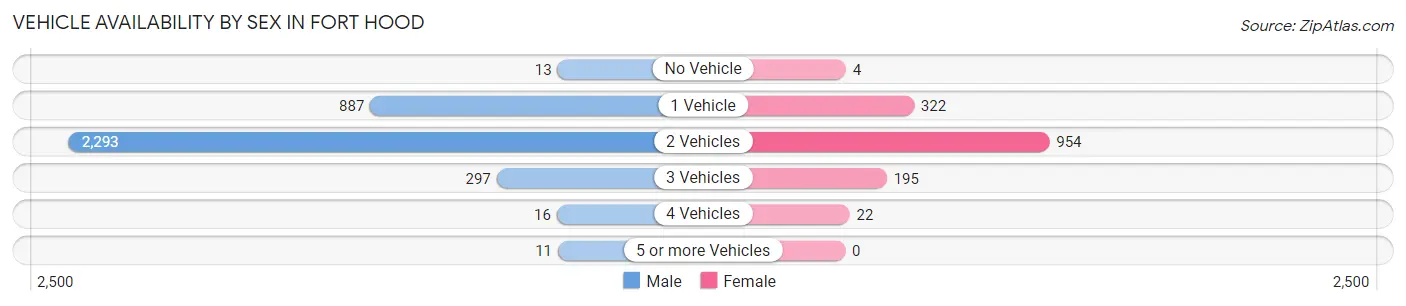
| Vehicles Available | Male | Female |
| No Vehicle | 13 (0.4%) | 4 (0.3%) |
| 1 Vehicle | 887 (25.2%) | 322 (21.5%) |
| 2 Vehicles | 2,293 (65.2%) | 954 (63.7%) |
| 3 Vehicles | 297 (8.4%) | 195 (13.0%) |
| 4 Vehicles | 16 (0.4%) | 22 (1.5%) |
| 5 or more Vehicles | 11 (0.3%) | 0 (0.0%) |
| Total | 3,517 (100.0%) | 1,497 (100.0%) |
Commute Time in Fort Hood
The most frequently occuring commute durations in Fort Hood are 5 to 9 minutes (4,158 commuters, 30.8%), 10 to 14 minutes (3,104 commuters, 23.0%), and 15 to 19 minutes (2,273 commuters, 16.9%).
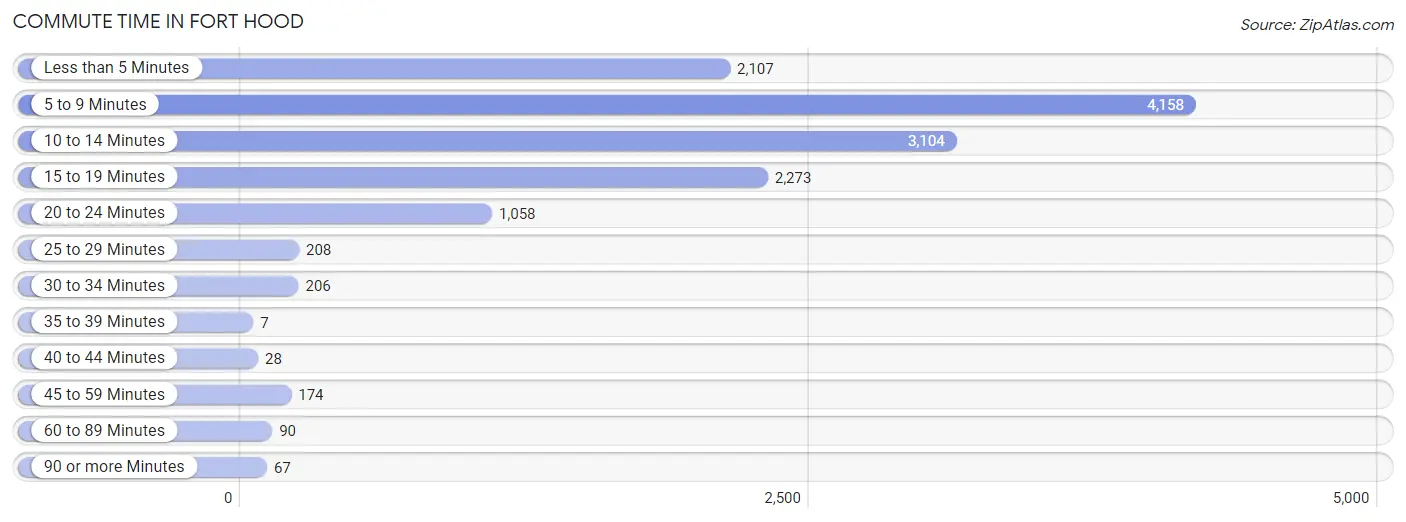
| Commute Time | # Commuters | % Commuters |
| Less than 5 Minutes | 2,107 | 15.6% |
| 5 to 9 Minutes | 4,158 | 30.8% |
| 10 to 14 Minutes | 3,104 | 23.0% |
| 15 to 19 Minutes | 2,273 | 16.9% |
| 20 to 24 Minutes | 1,058 | 7.9% |
| 25 to 29 Minutes | 208 | 1.5% |
| 30 to 34 Minutes | 206 | 1.5% |
| 35 to 39 Minutes | 7 | 0.1% |
| 40 to 44 Minutes | 28 | 0.2% |
| 45 to 59 Minutes | 174 | 1.3% |
| 60 to 89 Minutes | 90 | 0.7% |
| 90 or more Minutes | 67 | 0.5% |
Commute Time by Sex in Fort Hood
The most common commute times in Fort Hood are 5 to 9 minutes (3,728 commuters, 33.2%) for males and 10 to 14 minutes (595 commuters, 26.6%) for females.
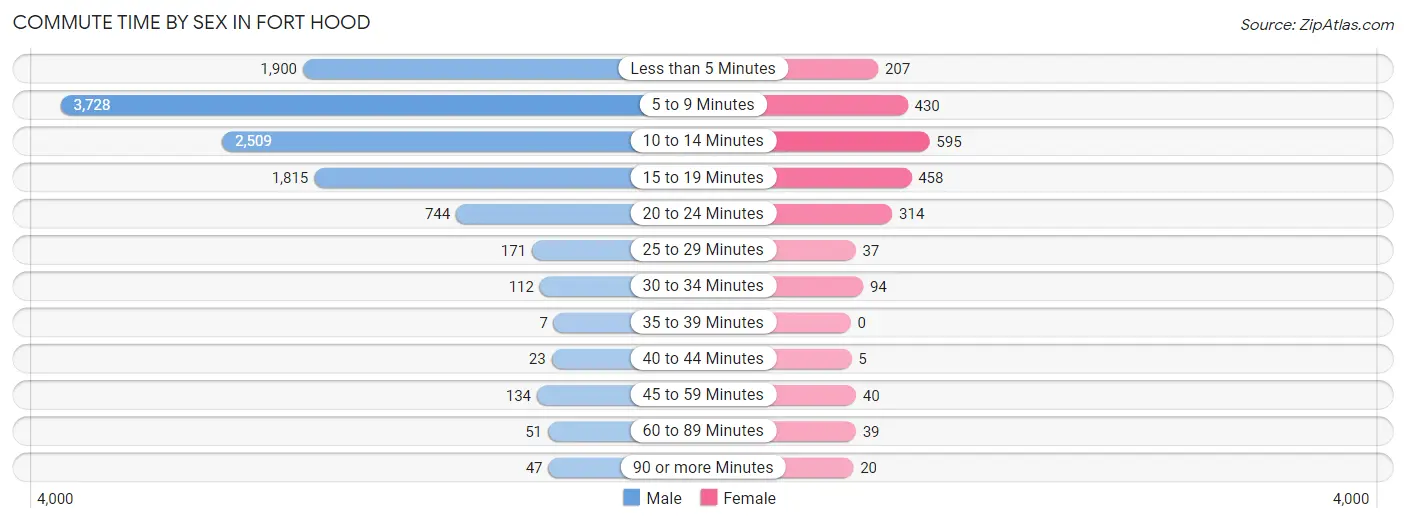
| Commute Time | Male | Female |
| Less than 5 Minutes | 1,900 (16.9%) | 207 (9.2%) |
| 5 to 9 Minutes | 3,728 (33.2%) | 430 (19.2%) |
| 10 to 14 Minutes | 2,509 (22.3%) | 595 (26.6%) |
| 15 to 19 Minutes | 1,815 (16.2%) | 458 (20.5%) |
| 20 to 24 Minutes | 744 (6.6%) | 314 (14.0%) |
| 25 to 29 Minutes | 171 (1.5%) | 37 (1.7%) |
| 30 to 34 Minutes | 112 (1.0%) | 94 (4.2%) |
| 35 to 39 Minutes | 7 (0.1%) | 0 (0.0%) |
| 40 to 44 Minutes | 23 (0.2%) | 5 (0.2%) |
| 45 to 59 Minutes | 134 (1.2%) | 40 (1.8%) |
| 60 to 89 Minutes | 51 (0.4%) | 39 (1.7%) |
| 90 or more Minutes | 47 (0.4%) | 20 (0.9%) |
Time of Departure to Work by Sex in Fort Hood
The most frequent times of departure to work in Fort Hood are 6:00 AM to 6:29 AM (2,751, 24.5%) for males and 6:00 AM to 6:29 AM (403, 18.0%) for females.
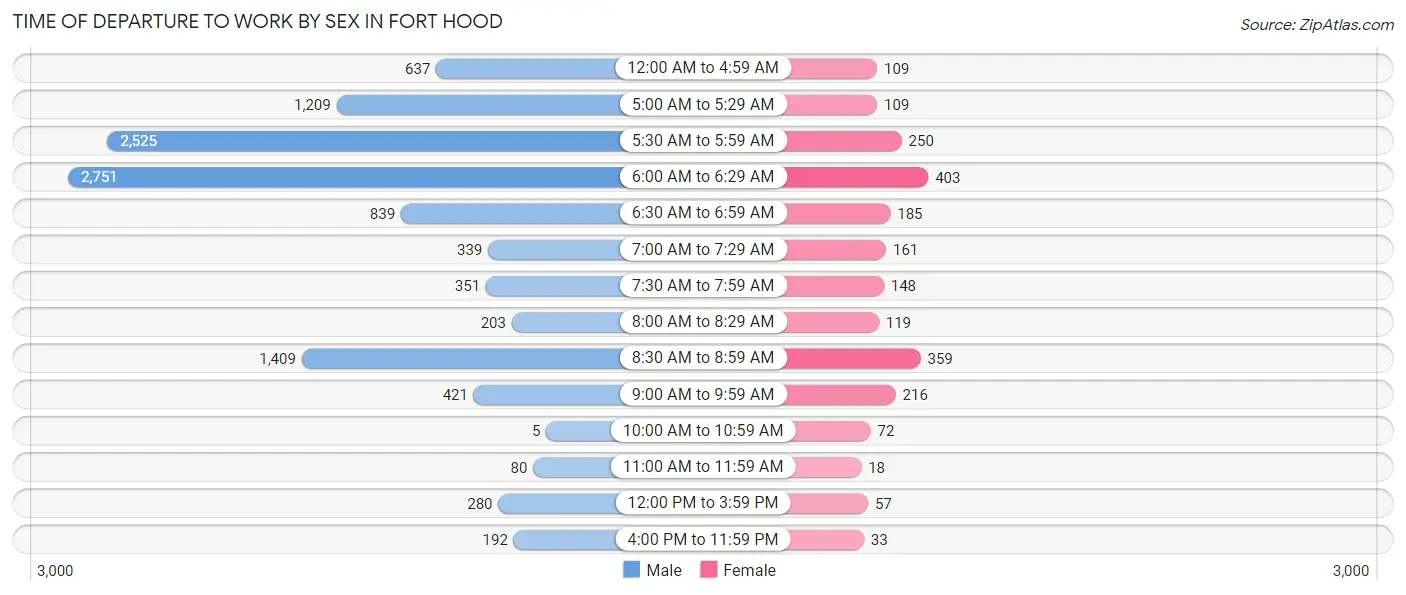
| Time of Departure | Male | Female |
| 12:00 AM to 4:59 AM | 637 (5.7%) | 109 (4.9%) |
| 5:00 AM to 5:29 AM | 1,209 (10.8%) | 109 (4.9%) |
| 5:30 AM to 5:59 AM | 2,525 (22.5%) | 250 (11.2%) |
| 6:00 AM to 6:29 AM | 2,751 (24.5%) | 403 (18.0%) |
| 6:30 AM to 6:59 AM | 839 (7.5%) | 185 (8.3%) |
| 7:00 AM to 7:29 AM | 339 (3.0%) | 161 (7.2%) |
| 7:30 AM to 7:59 AM | 351 (3.1%) | 148 (6.6%) |
| 8:00 AM to 8:29 AM | 203 (1.8%) | 119 (5.3%) |
| 8:30 AM to 8:59 AM | 1,409 (12.5%) | 359 (16.0%) |
| 9:00 AM to 9:59 AM | 421 (3.7%) | 216 (9.7%) |
| 10:00 AM to 10:59 AM | 5 (0.0%) | 72 (3.2%) |
| 11:00 AM to 11:59 AM | 80 (0.7%) | 18 (0.8%) |
| 12:00 PM to 3:59 PM | 280 (2.5%) | 57 (2.5%) |
| 4:00 PM to 11:59 PM | 192 (1.7%) | 33 (1.5%) |
| Total | 11,241 (100.0%) | 2,239 (100.0%) |
Housing Occupancy in Fort Hood
Occupancy by Ownership in Fort Hood
Of the total 4,188 dwellings in Fort Hood, owner-occupied units account for 28 (0.7%), while renter-occupied units make up 4,160 (99.3%).
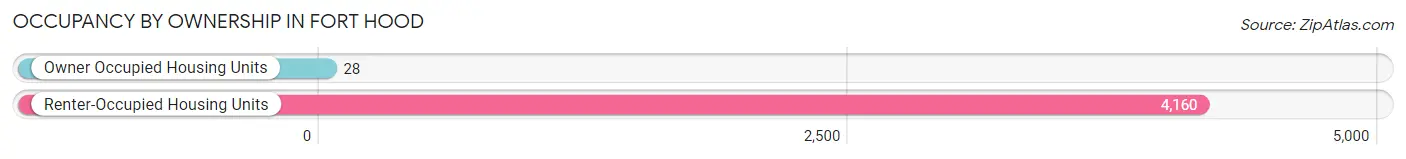
| Occupancy | # Housing Units | % Housing Units |
| Owner Occupied Housing Units | 28 | 0.7% |
| Renter-Occupied Housing Units | 4,160 | 99.3% |
| Total Occupied Housing Units | 4,188 | 100.0% |
Occupancy by Household Size in Fort Hood
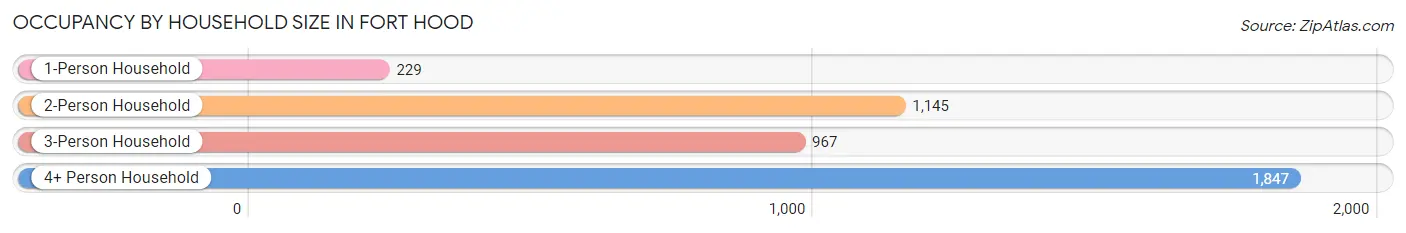
| Household Size | # Housing Units | % Housing Units |
| 1-Person Household | 229 | 5.5% |
| 2-Person Household | 1,145 | 27.3% |
| 3-Person Household | 967 | 23.1% |
| 4+ Person Household | 1,847 | 44.1% |
| Total Housing Units | 4,188 | 100.0% |
Occupancy by Ownership by Household Size in Fort Hood
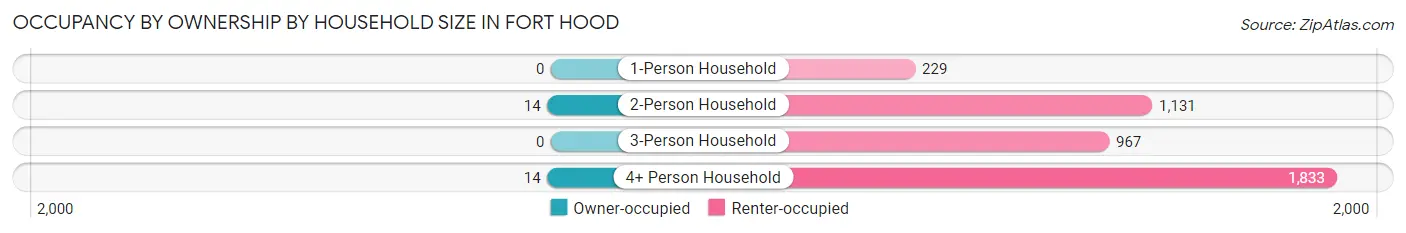
| Household Size | Owner-occupied | Renter-occupied |
| 1-Person Household | 0 (0.0%) | 229 (100.0%) |
| 2-Person Household | 14 (1.2%) | 1,131 (98.8%) |
| 3-Person Household | 0 (0.0%) | 967 (100.0%) |
| 4+ Person Household | 14 (0.8%) | 1,833 (99.2%) |
| Total Housing Units | 28 (0.7%) | 4,160 (99.3%) |
Occupancy by Educational Attainment in Fort Hood
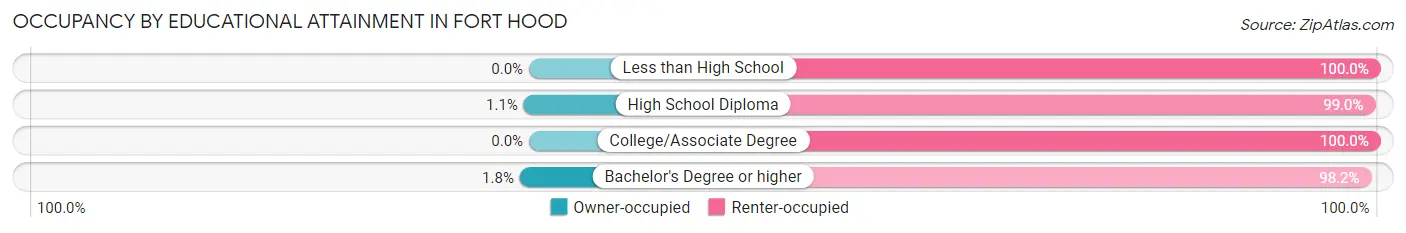
| Household Size | Owner-occupied | Renter-occupied |
| Less than High School | 0 (0.0%) | 28 (100.0%) |
| High School Diploma | 11 (1.1%) | 1,039 (99.0%) |
| College/Associate Degree | 0 (0.0%) | 2,183 (100.0%) |
| Bachelor's Degree or higher | 17 (1.8%) | 910 (98.2%) |
Occupancy by Age of Householder in Fort Hood
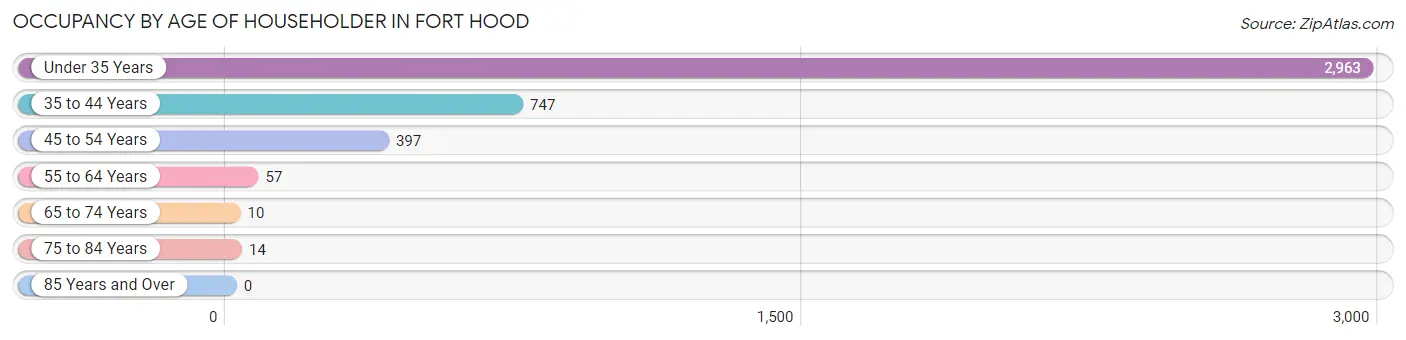
| Age Bracket | # Households | % Households |
| Under 35 Years | 2,963 | 70.8% |
| 35 to 44 Years | 747 | 17.8% |
| 45 to 54 Years | 397 | 9.5% |
| 55 to 64 Years | 57 | 1.4% |
| 65 to 74 Years | 10 | 0.2% |
| 75 to 84 Years | 14 | 0.3% |
| 85 Years and Over | 0 | 0.0% |
| Total | 4,188 | 100.0% |
Housing Finances in Fort Hood
Median Income by Occupancy in Fort Hood
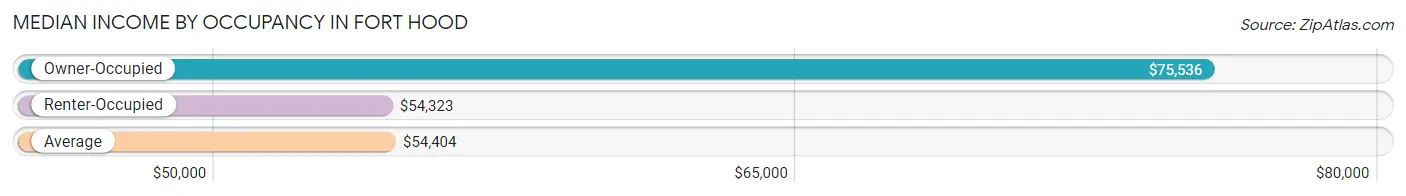
| Occupancy Type | # Households | Median Income |
| Owner-Occupied | 28 (0.7%) | $75,536 |
| Renter-Occupied | 4,160 (99.3%) | $54,323 |
| Average | 4,188 (100.0%) | $54,404 |
Occupancy by Householder Income Bracket in Fort Hood
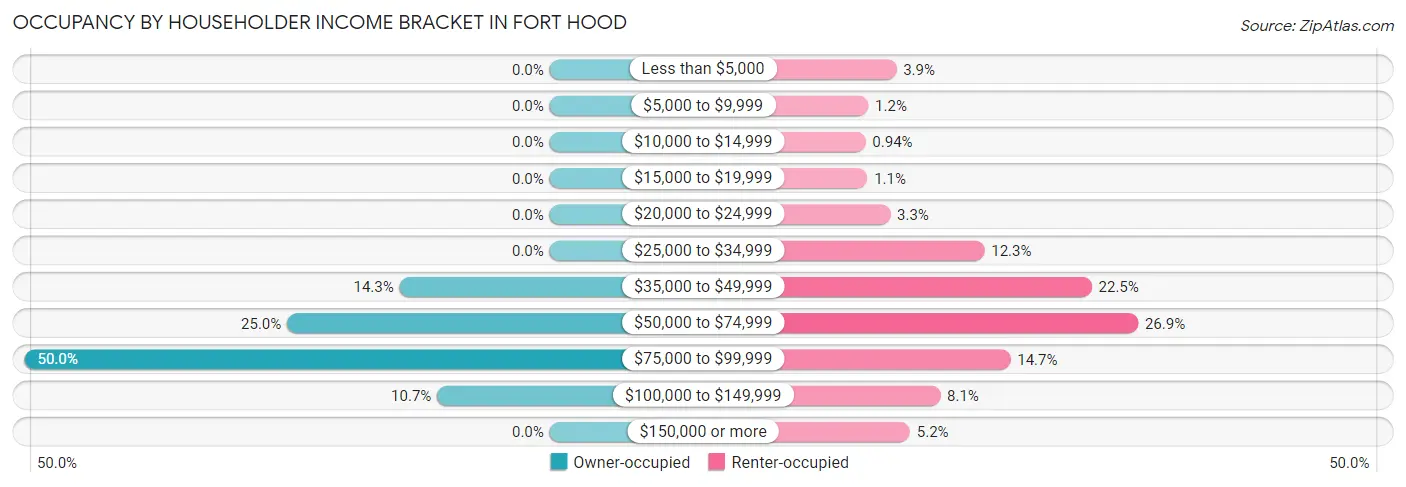
| Income Bracket | Owner-occupied | Renter-occupied |
| Less than $5,000 | 0 (0.0%) | 161 (3.9%) |
| $5,000 to $9,999 | 0 (0.0%) | 50 (1.2%) |
| $10,000 to $14,999 | 0 (0.0%) | 39 (0.9%) |
| $15,000 to $19,999 | 0 (0.0%) | 46 (1.1%) |
| $20,000 to $24,999 | 0 (0.0%) | 137 (3.3%) |
| $25,000 to $34,999 | 0 (0.0%) | 510 (12.3%) |
| $35,000 to $49,999 | 4 (14.3%) | 935 (22.5%) |
| $50,000 to $74,999 | 7 (25.0%) | 1,119 (26.9%) |
| $75,000 to $99,999 | 14 (50.0%) | 613 (14.7%) |
| $100,000 to $149,999 | 3 (10.7%) | 335 (8.1%) |
| $150,000 or more | 0 (0.0%) | 215 (5.2%) |
| Total | 28 (100.0%) | 4,160 (100.0%) |
Monthly Housing Cost Tiers in Fort Hood
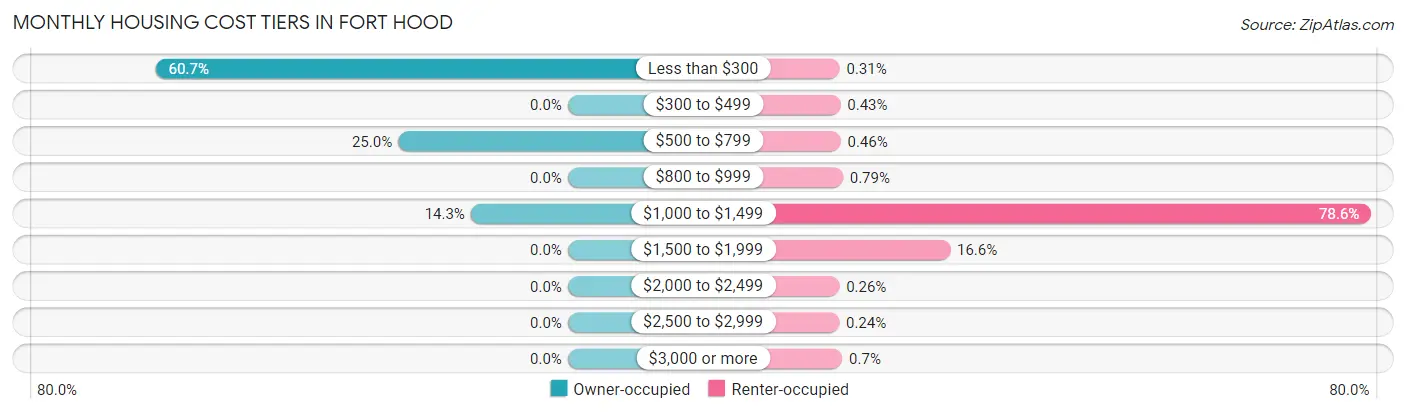
| Monthly Cost | Owner-occupied | Renter-occupied |
| Less than $300 | 17 (60.7%) | 13 (0.3%) |
| $300 to $499 | 0 (0.0%) | 18 (0.4%) |
| $500 to $799 | 7 (25.0%) | 19 (0.5%) |
| $800 to $999 | 0 (0.0%) | 33 (0.8%) |
| $1,000 to $1,499 | 4 (14.3%) | 3,270 (78.6%) |
| $1,500 to $1,999 | 0 (0.0%) | 690 (16.6%) |
| $2,000 to $2,499 | 0 (0.0%) | 11 (0.3%) |
| $2,500 to $2,999 | 0 (0.0%) | 10 (0.2%) |
| $3,000 or more | 0 (0.0%) | 29 (0.7%) |
| Total | 28 (100.0%) | 4,160 (100.0%) |
Physical Housing Characteristics in Fort Hood
Housing Structures in Fort Hood
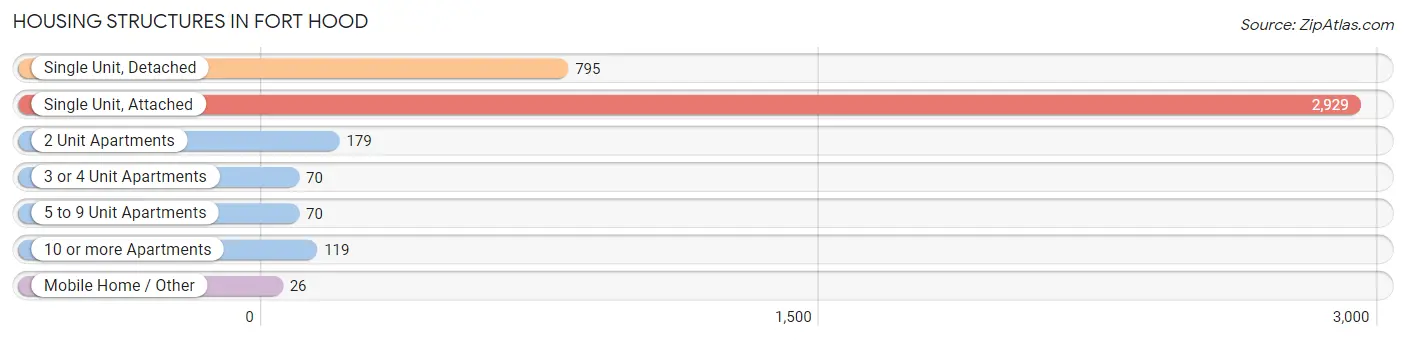
| Structure Type | # Housing Units | % Housing Units |
| Single Unit, Detached | 795 | 19.0% |
| Single Unit, Attached | 2,929 | 69.9% |
| 2 Unit Apartments | 179 | 4.3% |
| 3 or 4 Unit Apartments | 70 | 1.7% |
| 5 to 9 Unit Apartments | 70 | 1.7% |
| 10 or more Apartments | 119 | 2.8% |
| Mobile Home / Other | 26 | 0.6% |
| Total | 4,188 | 100.0% |
Housing Structures by Occupancy in Fort Hood
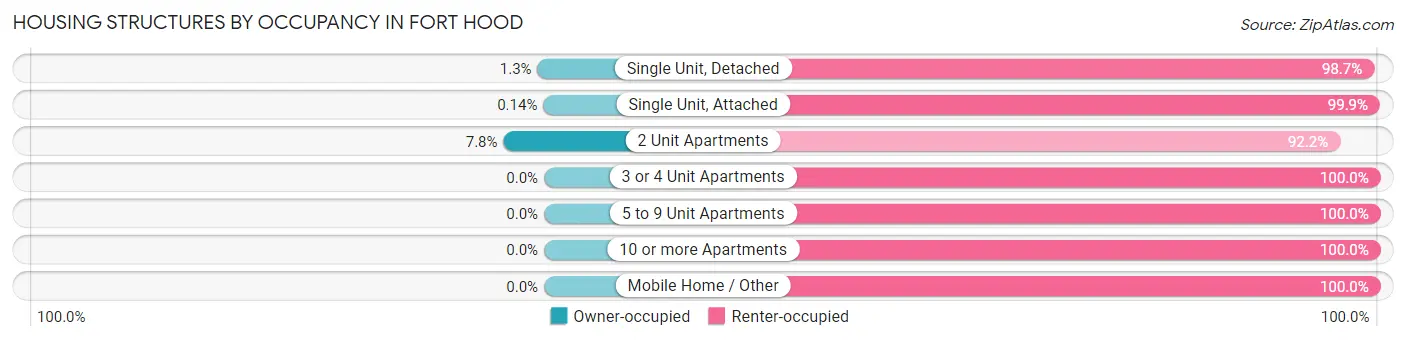
| Structure Type | Owner-occupied | Renter-occupied |
| Single Unit, Detached | 10 (1.3%) | 785 (98.7%) |
| Single Unit, Attached | 4 (0.1%) | 2,925 (99.9%) |
| 2 Unit Apartments | 14 (7.8%) | 165 (92.2%) |
| 3 or 4 Unit Apartments | 0 (0.0%) | 70 (100.0%) |
| 5 to 9 Unit Apartments | 0 (0.0%) | 70 (100.0%) |
| 10 or more Apartments | 0 (0.0%) | 119 (100.0%) |
| Mobile Home / Other | 0 (0.0%) | 26 (100.0%) |
| Total | 28 (0.7%) | 4,160 (99.3%) |
Housing Structures by Number of Rooms in Fort Hood
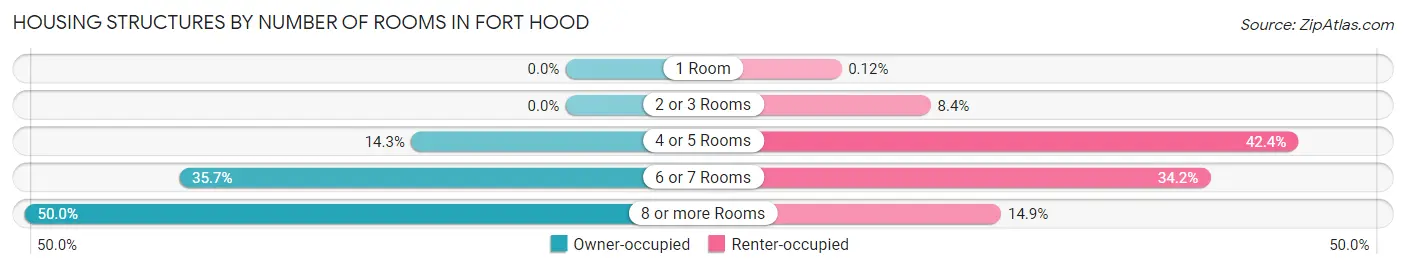
| Number of Rooms | Owner-occupied | Renter-occupied |
| 1 Room | 0 (0.0%) | 5 (0.1%) |
| 2 or 3 Rooms | 0 (0.0%) | 349 (8.4%) |
| 4 or 5 Rooms | 4 (14.3%) | 1,762 (42.4%) |
| 6 or 7 Rooms | 10 (35.7%) | 1,424 (34.2%) |
| 8 or more Rooms | 14 (50.0%) | 620 (14.9%) |
| Total | 28 (100.0%) | 4,160 (100.0%) |
Housing Structure by Heating Type in Fort Hood
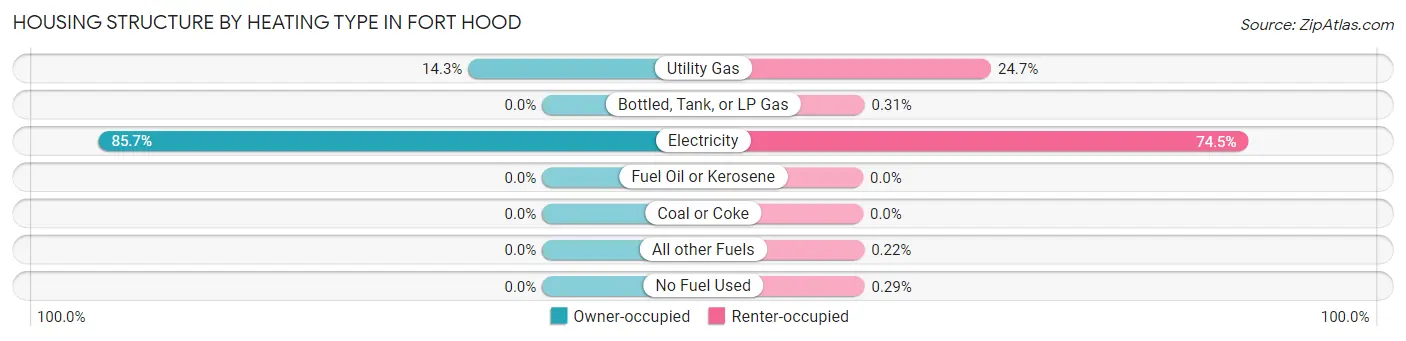
| Heating Type | Owner-occupied | Renter-occupied |
| Utility Gas | 4 (14.3%) | 1,029 (24.7%) |
| Bottled, Tank, or LP Gas | 0 (0.0%) | 13 (0.3%) |
| Electricity | 24 (85.7%) | 3,097 (74.5%) |
| Fuel Oil or Kerosene | 0 (0.0%) | 0 (0.0%) |
| Coal or Coke | 0 (0.0%) | 0 (0.0%) |
| All other Fuels | 0 (0.0%) | 9 (0.2%) |
| No Fuel Used | 0 (0.0%) | 12 (0.3%) |
| Total | 28 (100.0%) | 4,160 (100.0%) |
Household Vehicle Usage in Fort Hood
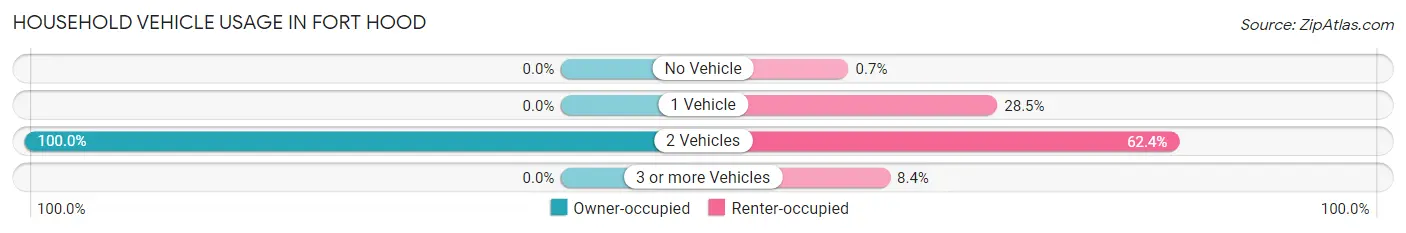
| Vehicles per Household | Owner-occupied | Renter-occupied |
| No Vehicle | 0 (0.0%) | 29 (0.7%) |
| 1 Vehicle | 0 (0.0%) | 1,184 (28.5%) |
| 2 Vehicles | 28 (100.0%) | 2,596 (62.4%) |
| 3 or more Vehicles | 0 (0.0%) | 351 (8.4%) |
| Total | 28 (100.0%) | 4,160 (100.0%) |
Real Estate & Mortgages in Fort Hood
Real Estate and Mortgage Overview in Fort Hood
| Characteristic | Without Mortgage | With Mortgage |
| Housing Units | 28 | 0 |
| Median Property Value | - | - |
| Median Household Income | $75,536 | $0 |
| Monthly Housing Costs | $657 | $0 |
| Real Estate Taxes | - | - |
Property Value by Mortgage Status in Fort Hood
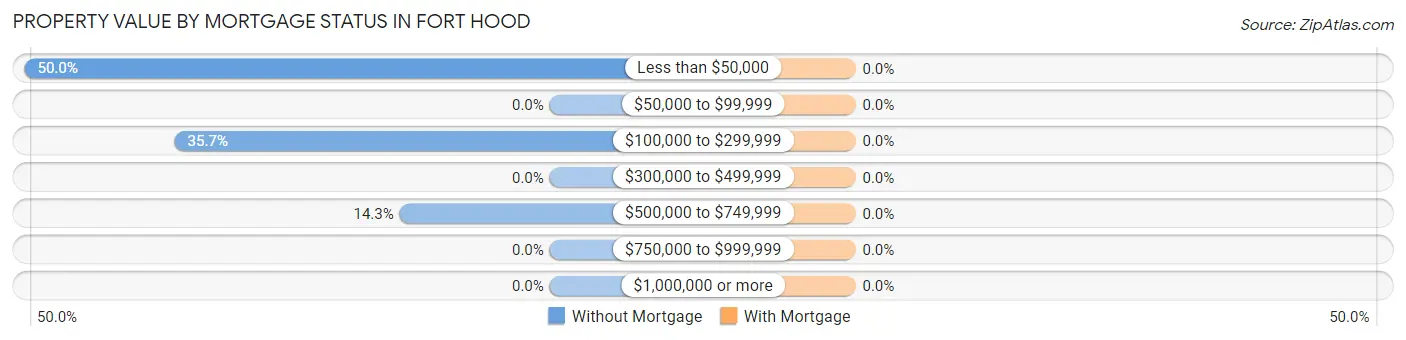
| Property Value | Without Mortgage | With Mortgage |
| Less than $50,000 | 14 (50.0%) | 0 (0.0%) |
| $50,000 to $99,999 | 0 (0.0%) | 0 (0.0%) |
| $100,000 to $299,999 | 10 (35.7%) | 0 (0.0%) |
| $300,000 to $499,999 | 0 (0.0%) | 0 (0.0%) |
| $500,000 to $749,999 | 4 (14.3%) | 0 (0.0%) |
| $750,000 to $999,999 | 0 (0.0%) | 0 (0.0%) |
| $1,000,000 or more | 0 (0.0%) | 0 (0.0%) |
| Total | 28 (100.0%) | 0 (0.0%) |
Household Income by Mortgage Status in Fort Hood
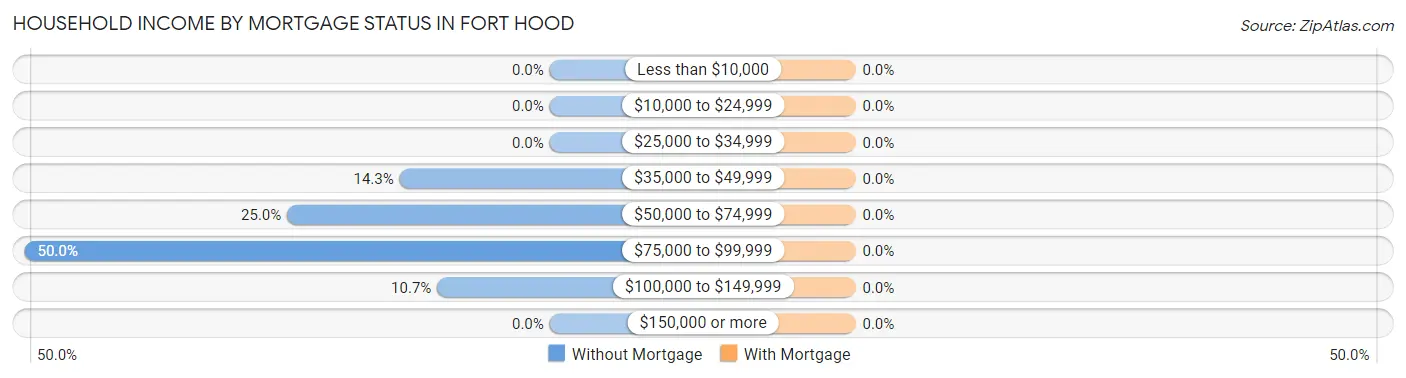
| Household Income | Without Mortgage | With Mortgage |
| Less than $10,000 | 0 (0.0%) | 0 (0.0%) |
| $10,000 to $24,999 | 0 (0.0%) | 0 (0.0%) |
| $25,000 to $34,999 | 0 (0.0%) | 0 (0.0%) |
| $35,000 to $49,999 | 4 (14.3%) | 0 (0.0%) |
| $50,000 to $74,999 | 7 (25.0%) | 0 (0.0%) |
| $75,000 to $99,999 | 14 (50.0%) | 0 (0.0%) |
| $100,000 to $149,999 | 3 (10.7%) | 0 (0.0%) |
| $150,000 or more | 0 (0.0%) | 0 (0.0%) |
| Total | 28 (100.0%) | 0 (0.0%) |
Property Value to Household Income Ratio in Fort Hood
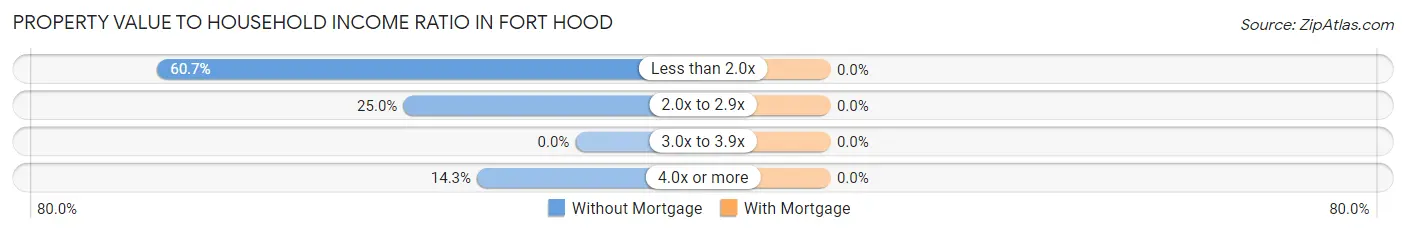
| Value-to-Income Ratio | Without Mortgage | With Mortgage |
| Less than 2.0x | 17 (60.7%) | 0 (0.0%) |
| 2.0x to 2.9x | 7 (25.0%) | 0 (0.0%) |
| 3.0x to 3.9x | 0 (0.0%) | 0 (0.0%) |
| 4.0x or more | 4 (14.3%) | 0 (0.0%) |
| Total | 28 (100.0%) | 0 (0.0%) |
Real Estate Taxes by Mortgage Status in Fort Hood
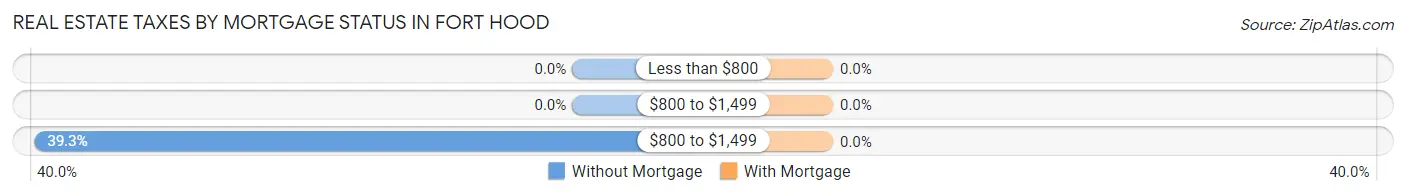
| Property Taxes | Without Mortgage | With Mortgage |
| Less than $800 | 0 (0.0%) | 0 (0.0%) |
| $800 to $1,499 | 0 (0.0%) | 0 (0.0%) |
| $800 to $1,499 | 11 (39.3%) | 0 (0.0%) |
| Total | 28 (100.0%) | 0 (0.0%) |
Health & Disability in Fort Hood
Health Insurance Coverage by Age in Fort Hood
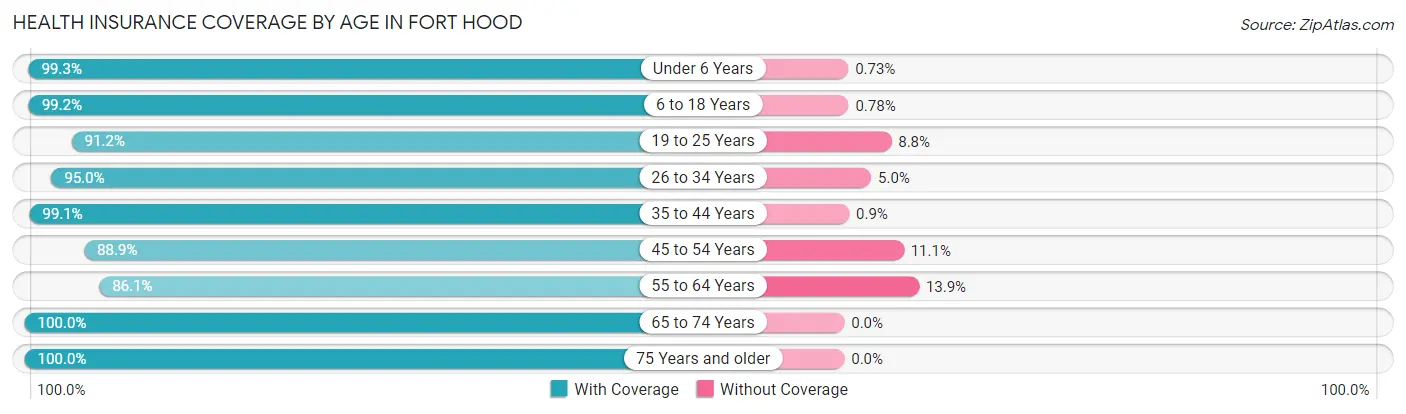
| Age Bracket | With Coverage | Without Coverage |
| Under 6 Years | 3,264 (99.3%) | 24 (0.7%) |
| 6 to 18 Years | 2,655 (99.2%) | 21 (0.8%) |
| 19 to 25 Years | 1,458 (91.2%) | 140 (8.8%) |
| 26 to 34 Years | 1,810 (95.0%) | 95 (5.0%) |
| 35 to 44 Years | 775 (99.1%) | 7 (0.9%) |
| 45 to 54 Years | 345 (88.9%) | 43 (11.1%) |
| 55 to 64 Years | 167 (86.1%) | 27 (13.9%) |
| 65 to 74 Years | 43 (100.0%) | 0 (0.0%) |
| 75 Years and older | 31 (100.0%) | 0 (0.0%) |
| Total | 10,548 (96.7%) | 357 (3.3%) |
Health Insurance Coverage by Citizenship Status in Fort Hood
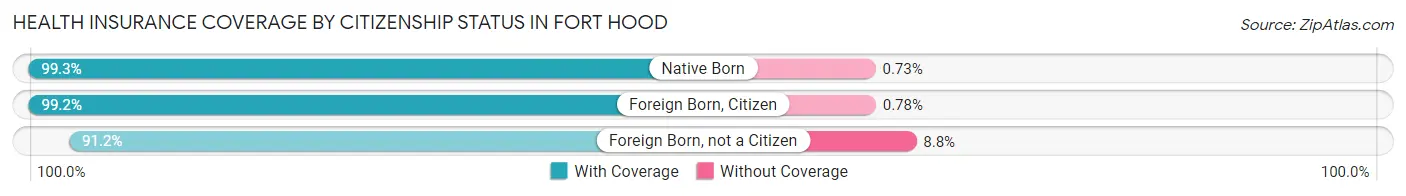
| Citizenship Status | With Coverage | Without Coverage |
| Native Born | 3,264 (99.3%) | 24 (0.7%) |
| Foreign Born, Citizen | 2,655 (99.2%) | 21 (0.8%) |
| Foreign Born, not a Citizen | 1,458 (91.2%) | 140 (8.8%) |
Health Insurance Coverage by Household Income in Fort Hood
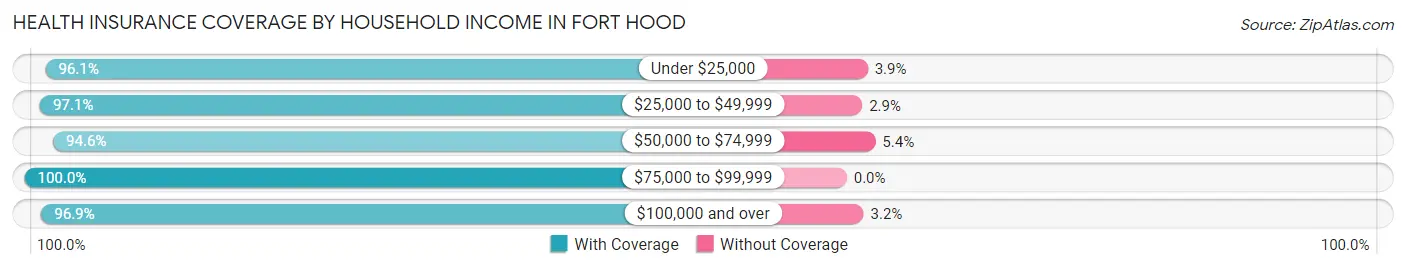
| Household Income | With Coverage | Without Coverage |
| Under $25,000 | 1,224 (96.1%) | 50 (3.9%) |
| $25,000 to $49,999 | 3,432 (97.1%) | 102 (2.9%) |
| $50,000 to $74,999 | 2,752 (94.6%) | 156 (5.4%) |
| $75,000 to $99,999 | 1,635 (100.0%) | 0 (0.0%) |
| $100,000 and over | 1,505 (96.9%) | 49 (3.2%) |
Public vs Private Health Insurance Coverage by Age in Fort Hood
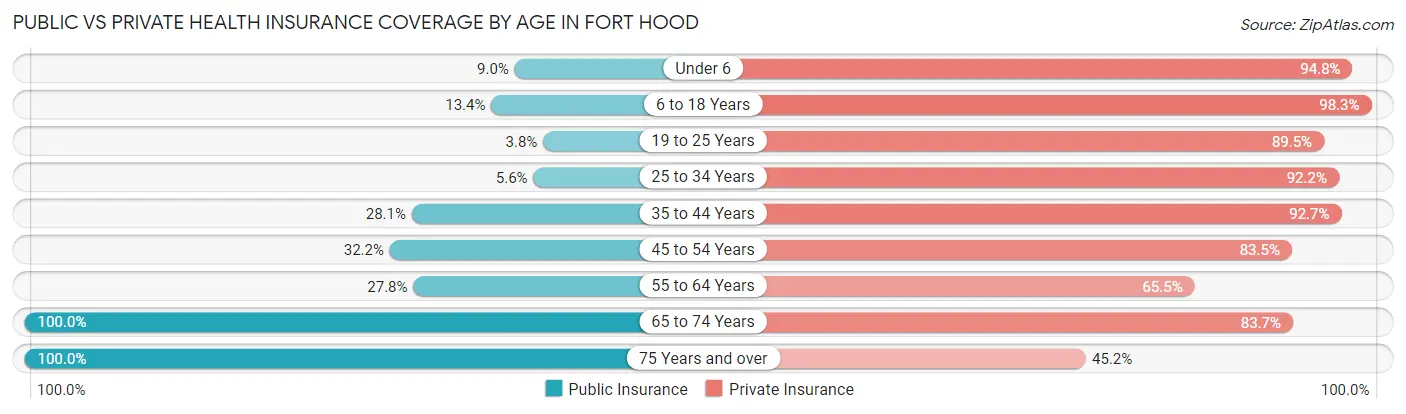
| Age Bracket | Public Insurance | Private Insurance |
| Under 6 | 297 (9.0%) | 3,116 (94.8%) |
| 6 to 18 Years | 358 (13.4%) | 2,630 (98.3%) |
| 19 to 25 Years | 60 (3.7%) | 1,430 (89.5%) |
| 25 to 34 Years | 106 (5.6%) | 1,757 (92.2%) |
| 35 to 44 Years | 220 (28.1%) | 725 (92.7%) |
| 45 to 54 Years | 125 (32.2%) | 324 (83.5%) |
| 55 to 64 Years | 54 (27.8%) | 127 (65.5%) |
| 65 to 74 Years | 43 (100.0%) | 36 (83.7%) |
| 75 Years and over | 31 (100.0%) | 14 (45.2%) |
| Total | 1,294 (11.9%) | 10,159 (93.2%) |
Disability Status by Sex by Age in Fort Hood
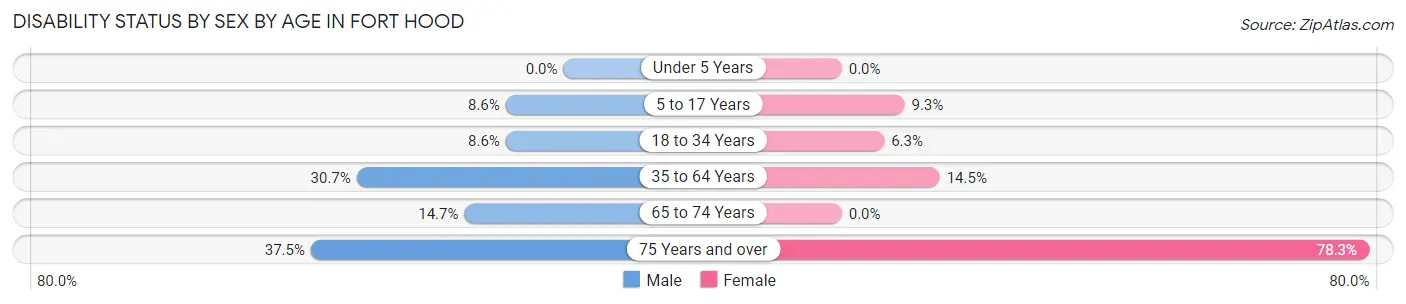
| Age Bracket | Male | Female |
| Under 5 Years | 0 (0.0%) | 0 (0.0%) |
| 5 to 17 Years | 159 (8.6%) | 104 (9.3%) |
| 18 to 34 Years | 53 (8.6%) | 188 (6.3%) |
| 35 to 64 Years | 140 (30.7%) | 132 (14.5%) |
| 65 to 74 Years | 5 (14.7%) | 0 (0.0%) |
| 75 Years and over | 3 (37.5%) | 18 (78.3%) |
Disability Class by Sex by Age in Fort Hood
Disability Class: Hearing Difficulty
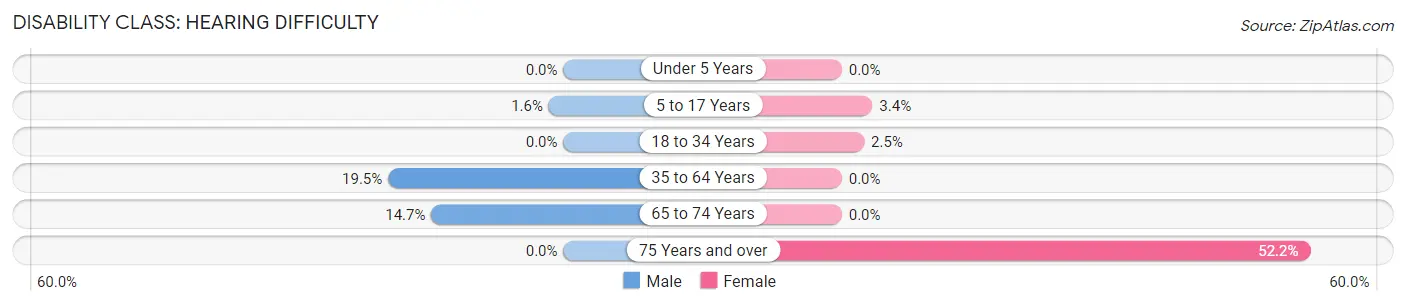
| Age Bracket | Male | Female |
| Under 5 Years | 0 (0.0%) | 0 (0.0%) |
| 5 to 17 Years | 30 (1.6%) | 38 (3.4%) |
| 18 to 34 Years | 0 (0.0%) | 74 (2.5%) |
| 35 to 64 Years | 89 (19.5%) | 0 (0.0%) |
| 65 to 74 Years | 5 (14.7%) | 0 (0.0%) |
| 75 Years and over | 0 (0.0%) | 12 (52.2%) |
Disability Class: Vision Difficulty
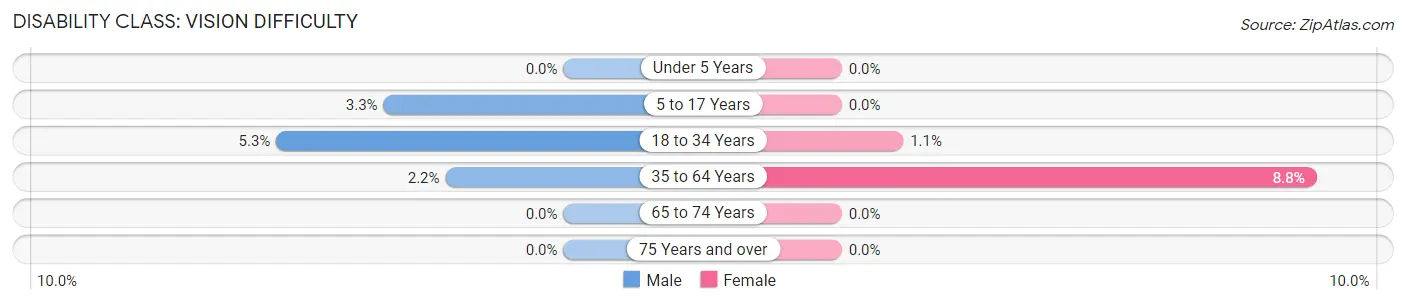
| Age Bracket | Male | Female |
| Under 5 Years | 0 (0.0%) | 0 (0.0%) |
| 5 to 17 Years | 62 (3.3%) | 0 (0.0%) |
| 18 to 34 Years | 33 (5.3%) | 34 (1.1%) |
| 35 to 64 Years | 10 (2.2%) | 80 (8.8%) |
| 65 to 74 Years | 0 (0.0%) | 0 (0.0%) |
| 75 Years and over | 0 (0.0%) | 0 (0.0%) |
Disability Class: Cognitive Difficulty
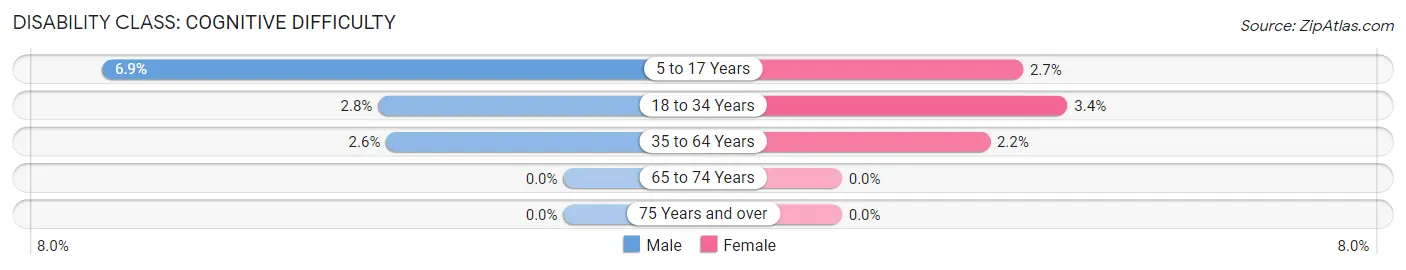
| Age Bracket | Male | Female |
| 5 to 17 Years | 127 (6.9%) | 30 (2.7%) |
| 18 to 34 Years | 17 (2.8%) | 100 (3.4%) |
| 35 to 64 Years | 12 (2.6%) | 20 (2.2%) |
| 65 to 74 Years | 0 (0.0%) | 0 (0.0%) |
| 75 Years and over | 0 (0.0%) | 0 (0.0%) |
Disability Class: Ambulatory Difficulty
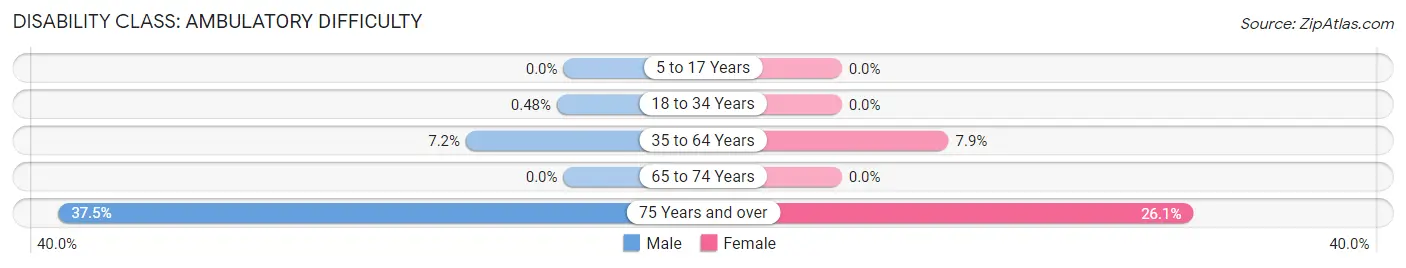
| Age Bracket | Male | Female |
| 5 to 17 Years | 0 (0.0%) | 0 (0.0%) |
| 18 to 34 Years | 3 (0.5%) | 0 (0.0%) |
| 35 to 64 Years | 33 (7.2%) | 72 (7.9%) |
| 65 to 74 Years | 0 (0.0%) | 0 (0.0%) |
| 75 Years and over | 3 (37.5%) | 6 (26.1%) |
Disability Class: Self-Care Difficulty
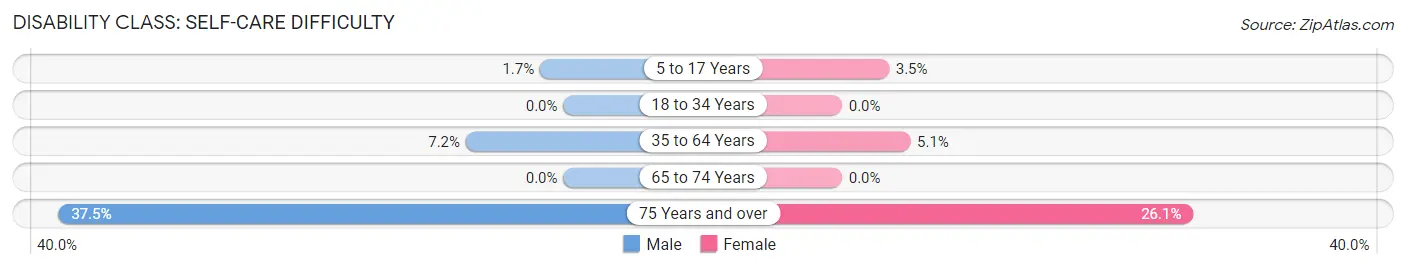
| Age Bracket | Male | Female |
| 5 to 17 Years | 32 (1.7%) | 39 (3.5%) |
| 18 to 34 Years | 0 (0.0%) | 0 (0.0%) |
| 35 to 64 Years | 33 (7.2%) | 46 (5.1%) |
| 65 to 74 Years | 0 (0.0%) | 0 (0.0%) |
| 75 Years and over | 3 (37.5%) | 6 (26.1%) |
Technology Access in Fort Hood
Computing Device Access in Fort Hood
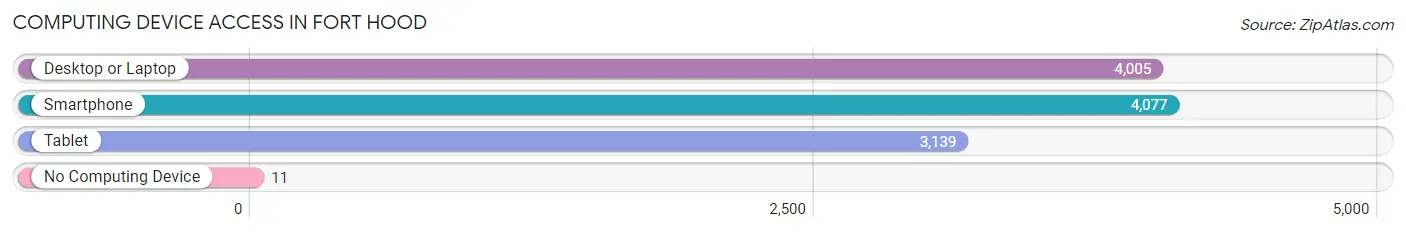
| Device Type | # Households | % Households |
| Desktop or Laptop | 4,005 | 95.6% |
| Smartphone | 4,077 | 97.4% |
| Tablet | 3,139 | 75.0% |
| No Computing Device | 11 | 0.3% |
| Total | 4,188 | 100.0% |
Internet Access in Fort Hood
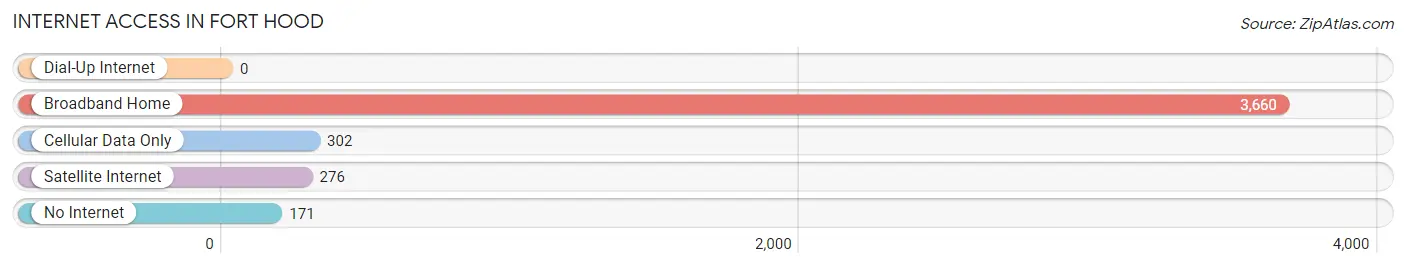
| Internet Type | # Households | % Households |
| Dial-Up Internet | 0 | 0.0% |
| Broadband Home | 3,660 | 87.4% |
| Cellular Data Only | 302 | 7.2% |
| Satellite Internet | 276 | 6.6% |
| No Internet | 171 | 4.1% |
| Total | 4,188 | 100.0% |
Fort Hood Summary
Fort Hood is a United States Army post located in Killeen, Texas. It is the largest active duty armored post in the United States Armed Forces, and is home to the 1st Cavalry Division, the 4th Infantry Division, the 13th Sustainment Command, the 1st Medical Brigade, the III Corps, and the 1st Air Cavalry Brigade. The post is named after Confederate General John Bell Hood, who fought in the Civil War.
History
Fort Hood was established in 1942 as a training center for the United States Army. It was originally named Camp Hood, and was located on the site of the former Camp Stanley, which had been used as a training center for the United States Army during World War I. The post was renamed Fort Hood in 1950, and has since served as a major training center for the United States Army.
During the Vietnam War, Fort Hood was the home of the 11th Air Assault Division, which was the first air assault division in the United States Army. The 11th Air Assault Division was later re-designated as the 1st Cavalry Division.
In 2003, Fort Hood was the site of the largest deployment of troops since World War II, when over 40,000 soldiers were deployed to Iraq.
Geography
Fort Hood is located in Central Texas, approximately 60 miles north of Austin and 70 miles south of Waco. The post is situated on a total of 340 square miles of land, and is bordered by the cities of Killeen, Copperas Cove, and Harker Heights. The post is located in Bell County, and is home to the Fort Hood Military Reservation, which is the largest military reservation in the United States.
The terrain of Fort Hood is mostly flat, with some rolling hills. The post is located in the Central Texas Hill Country, and is home to a variety of wildlife, including deer, wild turkeys, and coyotes.
Economy
Fort Hood is home to a large and diverse economy. The post is home to a variety of businesses, including retail stores, restaurants, hotels, and entertainment venues. The post is also home to a variety of military-related businesses, such as defense contractors, military supply stores, and military-related services.
The post is also home to a variety of educational institutions, including Central Texas College, Texas A&M University-Central Texas, and the University of Mary Hardin-Baylor.
Demographics
As of the 2010 census, the population of Fort Hood was 34,619. The racial makeup of the post was 68.3% White, 19.2% African American, 0.7% Native American, 2.3% Asian, 0.2% Pacific Islander, 5.2% from other races, and 4.3% from two or more races. Hispanic or Latino of any race were 15.2% of the population.
The median household income at Fort Hood was $45,845, and the median family income was $50,845. The per capita income at Fort Hood was $20,845.
Conclusion
Fort Hood is a United States Army post located in Killeen, Texas. It is the largest active duty armored post in the United States Armed Forces, and is home to the 1st Cavalry Division, the 4th Infantry Division, the 13th Sustainment Command, the 1st Medical Brigade, the III Corps, and the 1st Air Cavalry Brigade. The post is named after Confederate General John Bell Hood, who fought in the Civil War. Fort Hood is located in Central Texas, and is home to a large and diverse economy. As of the 2010 census, the population of Fort Hood was 34,619. The racial makeup of the post was 68.3% White, 19.2% African American, 0.7% Native American, 2.3% Asian, 0.2% Pacific Islander, 5.2% from other races, and 4.3% from two or more races. Hispanic or Latino of any race were 15.2% of the population. Fort Hood has served as a major training center for the United States Army since 1942, and has been the site of the largest deployment of troops since World War II.
Common Questions
What is Per Capita Income in Fort Hood?
Per Capita income in Fort Hood is $22,323.
What is the Median Family Income in Fort Hood?
Median Family Income in Fort Hood is $54,013.
What is the Median Household income in Fort Hood?
Median Household Income in Fort Hood is $54,404.
What is Income or Wage Gap in Fort Hood?
Income or Wage Gap in Fort Hood is 18.4%.
Women in Fort Hood earn 81.6 cents for every dollar earned by a man.
What is Family Income Deficit in Fort Hood?
Family Income Deficit in Fort Hood is $13,708.
Families that are below poverty line in Fort Hood earn $13,708 less on average than the poverty threshold level.
What is Inequality or Gini Index in Fort Hood?
Inequality or Gini Index in Fort Hood is 0.39.
What is the Total Population of Fort Hood?
Total Population of Fort Hood is 25,476.
What is the Total Male Population of Fort Hood?
Total Male Population of Fort Hood is 17,323.
What is the Total Female Population of Fort Hood?
Total Female Population of Fort Hood is 8,153.
What is the Ratio of Males per 100 Females in Fort Hood?
There are 212.47 Males per 100 Females in Fort Hood.
What is the Ratio of Females per 100 Males in Fort Hood?
There are 47.06 Females per 100 Males in Fort Hood.
What is the Median Population Age in Fort Hood?
Median Population Age in Fort Hood is 21.7 Years.
What is the Average Family Size in Fort Hood
Average Family Size in Fort Hood is 3.5 People.
What is the Average Household Size in Fort Hood
Average Household Size in Fort Hood is 3.4 People.
How Large is the Labor Force in Fort Hood?
There are 16,303 People in the Labor Forcein in Fort Hood.
What is the Percentage of People in the Labor Force in Fort Hood?
82.1% of People are in the Labor Force in Fort Hood.
What is the Unemployment Rate in Fort Hood?
Unemployment Rate in Fort Hood is 15.2%.