Fort Knox, KY Map & Demographics
Fort Knox Map
Fort Knox Overview
$31,450
PER CAPITA INCOME
$84,063
AVG FAMILY INCOME
$76,864
AVG HOUSEHOLD INCOME
0.5%
WAGE / INCOME GAP [ % ]
99.5¢/ $1
WAGE / INCOME GAP [ $ ]
$17,264
FAMILY INCOME DEFICIT
0.33
INEQUALITY / GINI INDEX
8,655
TOTAL POPULATION
4,794
MALE POPULATION
3,861
FEMALE POPULATION
124.16
MALES / 100 FEMALES
80.54
FEMALES / 100 MALES
24.7
MEDIAN AGE
3.9
AVG FAMILY SIZE
3.1
AVG HOUSEHOLD SIZE
4,881
LABOR FORCE [ PEOPLE ]
79.5%
PERCENT IN LABOR FORCE
8.8%
UNEMPLOYMENT RATE
Fort Knox Zip Codes
Fort Knox Area Codes
Income in Fort Knox
Income Overview in Fort Knox
Per Capita Income in Fort Knox is $31,450, while median incomes of families and households are $84,063 and $76,864 respectively.
| Characteristic | Number | Measure |
| Per Capita Income | 8,655 | $31,450 |
| Median Family Income | 1,637 | $84,063 |
| Mean Family Income | 1,637 | $99,865 |
| Median Household Income | 2,288 | $76,864 |
| Mean Household Income | 2,288 | $92,074 |
| Income Deficit | 1,637 | $17,264 |
| Wage / Income Gap (%) | 8,655 | 0.51% |
| Wage / Income Gap ($) | 8,655 | 99.49¢ per $1 |
| Gini / Inequality Index | 8,655 | 0.33 |
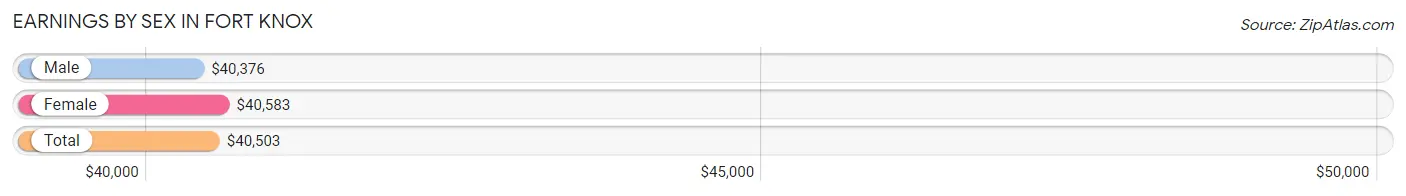
Earnings by Sex in Fort Knox
Average Earnings in Fort Knox are $40,503, $40,376 for men and $40,583 for women, a difference of 0.5%.
| Sex | Number | Average Earnings |
| Male | 3,377 (66.4%) | $40,376 |
| Female | 1,705 (33.6%) | $40,583 |
| Total | 5,082 (100.0%) | $40,503 |
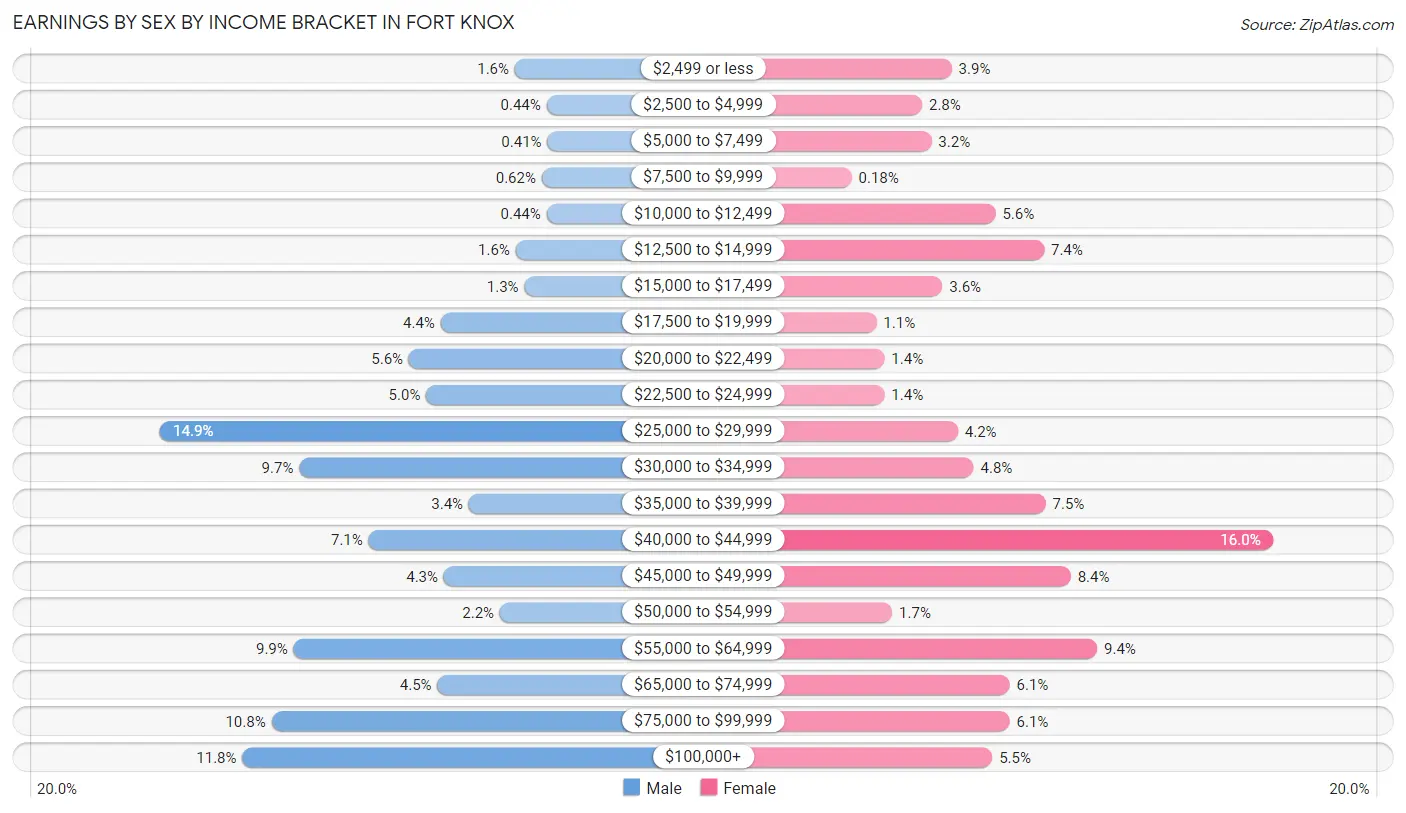
Earnings by Sex by Income Bracket in Fort Knox
The most common earnings brackets in Fort Knox are $25,000 to $29,999 for men (504 | 14.9%) and $40,000 to $44,999 for women (272 | 16.0%).
| Income | Male | Female |
| $2,499 or less | 55 (1.6%) | 67 (3.9%) |
| $2,500 to $4,999 | 15 (0.4%) | 48 (2.8%) |
| $5,000 to $7,499 | 14 (0.4%) | 54 (3.2%) |
| $7,500 to $9,999 | 21 (0.6%) | 3 (0.2%) |
| $10,000 to $12,499 | 15 (0.4%) | 95 (5.6%) |
| $12,500 to $14,999 | 54 (1.6%) | 126 (7.4%) |
| $15,000 to $17,499 | 43 (1.3%) | 61 (3.6%) |
| $17,500 to $19,999 | 149 (4.4%) | 19 (1.1%) |
| $20,000 to $22,499 | 189 (5.6%) | 24 (1.4%) |
| $22,500 to $24,999 | 167 (5.0%) | 24 (1.4%) |
| $25,000 to $29,999 | 504 (14.9%) | 71 (4.2%) |
| $30,000 to $34,999 | 328 (9.7%) | 81 (4.8%) |
| $35,000 to $39,999 | 113 (3.4%) | 127 (7.4%) |
| $40,000 to $44,999 | 240 (7.1%) | 272 (16.0%) |
| $45,000 to $49,999 | 145 (4.3%) | 143 (8.4%) |
| $50,000 to $54,999 | 74 (2.2%) | 29 (1.7%) |
| $55,000 to $64,999 | 335 (9.9%) | 160 (9.4%) |
| $65,000 to $74,999 | 153 (4.5%) | 104 (6.1%) |
| $75,000 to $99,999 | 363 (10.7%) | 104 (6.1%) |
| $100,000+ | 400 (11.8%) | 93 (5.4%) |
| Total | 3,377 (100.0%) | 1,705 (100.0%) |
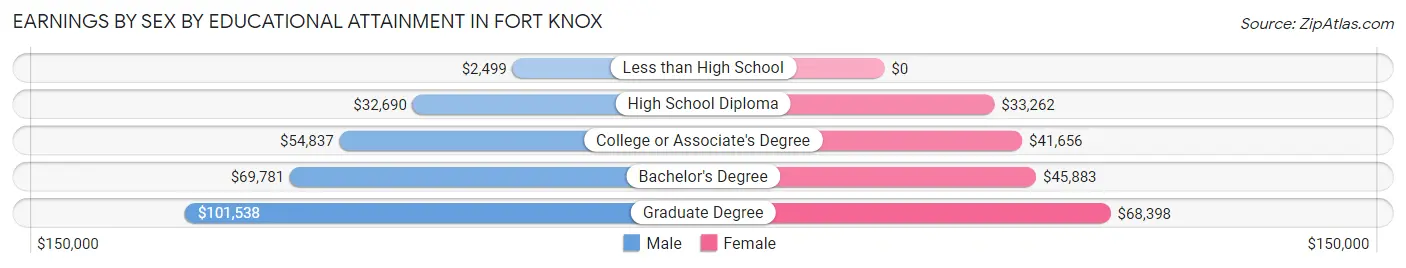
Earnings by Sex by Educational Attainment in Fort Knox
Average earnings in Fort Knox are $60,998 for men and $42,422 for women, a difference of 30.4%. Men with an educational attainment of graduate degree enjoy the highest average annual earnings of $101,538, while those with less than high school education earn the least with $2,499. Women with an educational attainment of graduate degree earn the most with the average annual earnings of $68,398, while those with high school diploma education have the smallest earnings of $33,262.
| Educational Attainment | Male Income | Female Income |
| Less than High School | $2,499 | $0 |
| High School Diploma | $32,690 | $33,262 |
| College or Associate's Degree | $54,837 | $41,656 |
| Bachelor's Degree | $69,781 | $45,883 |
| Graduate Degree | $101,538 | $68,398 |
| Total | $60,998 | $42,422 |
Family Income in Fort Knox
Family Income Brackets in Fort Knox
According to the Fort Knox family income data, there are 460 families falling into the $100,000 to $149,999 income range, which is the most common income bracket and makes up 28.1% of all families. Conversely, the $10,000 to $14,999 income bracket is the least frequent group with only 7 families (0.4%) belonging to this category.
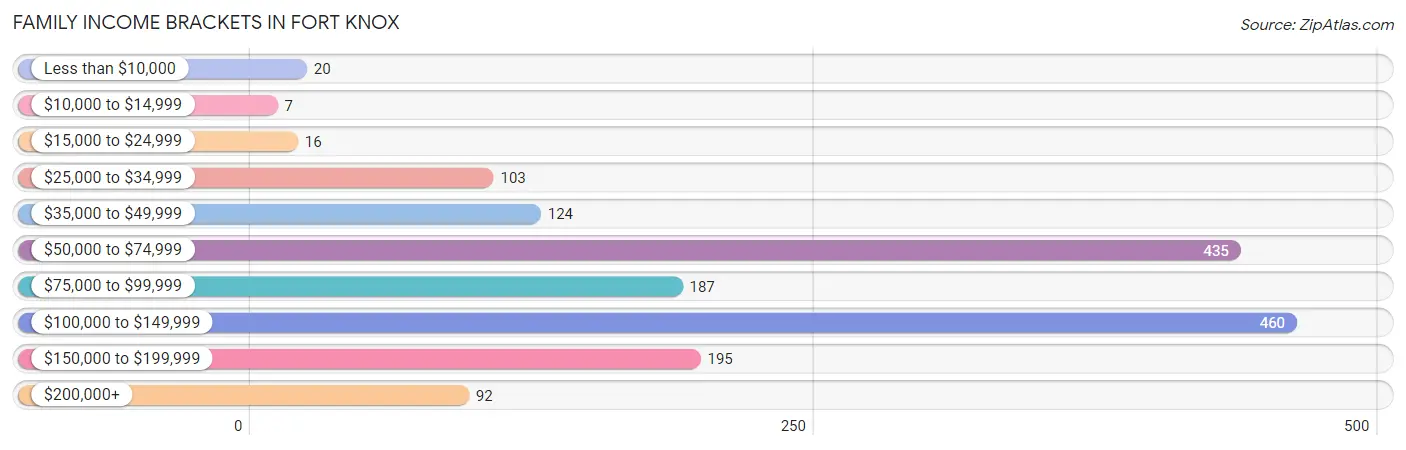
| Income Bracket | # Families | % Families |
| Less than $10,000 | 20 | 1.2% |
| $10,000 to $14,999 | 7 | 0.4% |
| $15,000 to $24,999 | 16 | 1.0% |
| $25,000 to $34,999 | 103 | 6.3% |
| $35,000 to $49,999 | 124 | 7.6% |
| $50,000 to $74,999 | 435 | 26.6% |
| $75,000 to $99,999 | 187 | 11.4% |
| $100,000 to $149,999 | 460 | 28.1% |
| $150,000 to $199,999 | 195 | 11.9% |
| $200,000+ | 92 | 5.6% |
Family Income by Famaliy Size in Fort Knox
5-person families (200 | 12.2%) account for the highest median family income in Fort Knox with $118,319 per family, while 2-person families (442 | 27.0%) have the highest median income of $38,494 per family member.
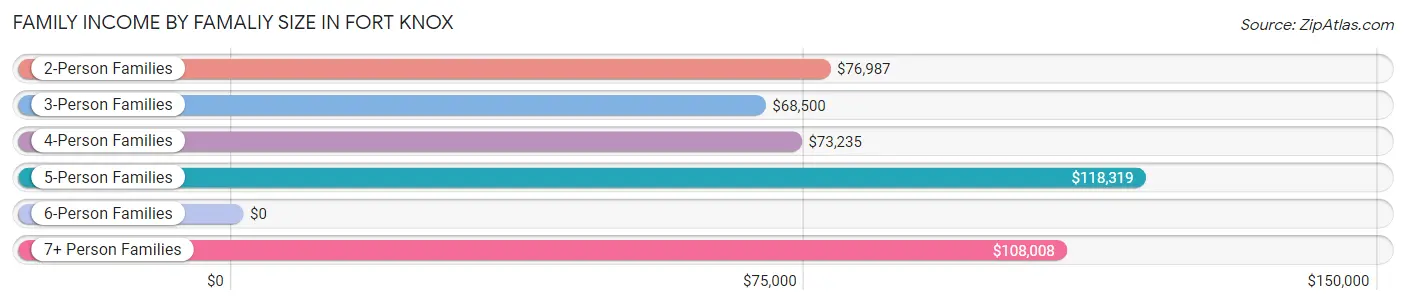
| Income Bracket | # Families | Median Income |
| 2-Person Families | 442 (27.0%) | $76,987 |
| 3-Person Families | 436 (26.6%) | $68,500 |
| 4-Person Families | 432 (26.4%) | $73,235 |
| 5-Person Families | 200 (12.2%) | $118,319 |
| 6-Person Families | 70 (4.3%) | $0 |
| 7+ Person Families | 57 (3.5%) | $108,008 |
| Total | 1,637 (100.0%) | $84,063 |
Family Income by Number of Earners in Fort Knox
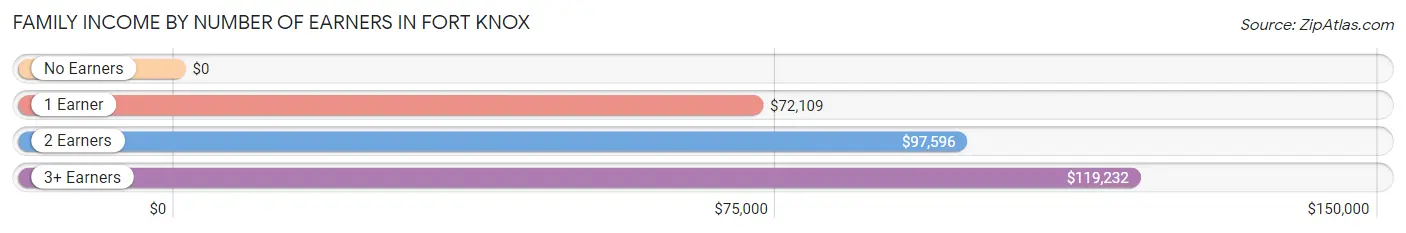
| Number of Earners | # Families | Median Income |
| No Earners | 38 (2.3%) | $0 |
| 1 Earner | 645 (39.4%) | $72,109 |
| 2 Earners | 867 (53.0%) | $97,596 |
| 3+ Earners | 87 (5.3%) | $119,232 |
| Total | 1,637 (100.0%) | $84,063 |
Household Income in Fort Knox
Household Income Brackets in Fort Knox
With 620 households falling in the category, the $100,000 to $149,999 income range is the most frequent in Fort Knox, accounting for 27.1% of all households. In contrast, only 23 households (1.0%) fall into the $10,000 to $14,999 income bracket, making it the least populous group.
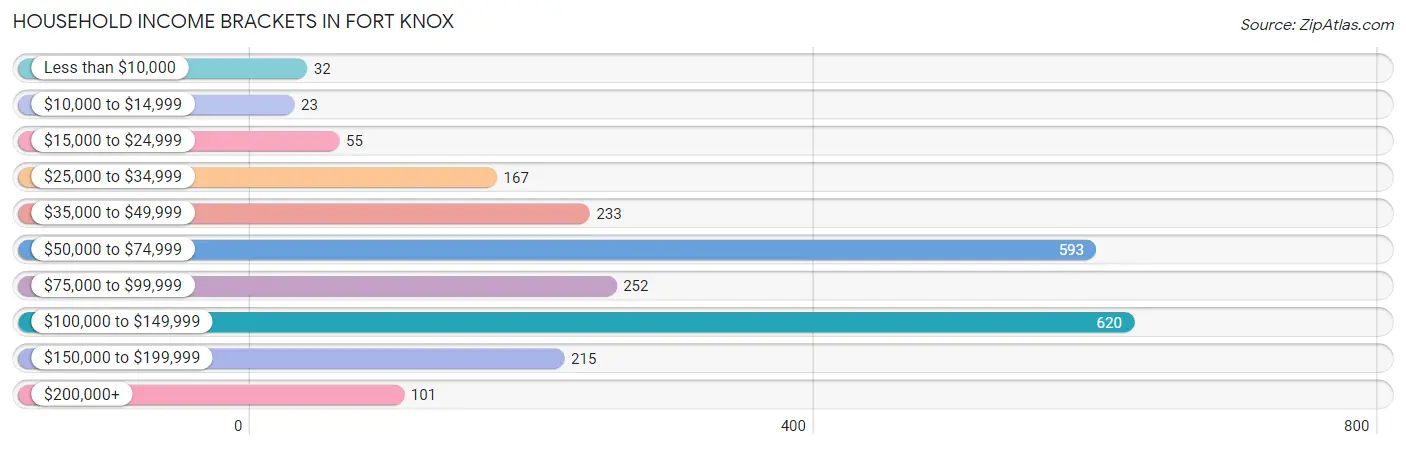
| Income Bracket | # Households | % Households |
| Less than $10,000 | 32 | 1.4% |
| $10,000 to $14,999 | 23 | 1.0% |
| $15,000 to $24,999 | 55 | 2.4% |
| $25,000 to $34,999 | 167 | 7.3% |
| $35,000 to $49,999 | 233 | 10.2% |
| $50,000 to $74,999 | 593 | 25.9% |
| $75,000 to $99,999 | 252 | 11.0% |
| $100,000 to $149,999 | 620 | 27.1% |
| $150,000 to $199,999 | 215 | 9.4% |
| $200,000+ | 101 | 4.4% |
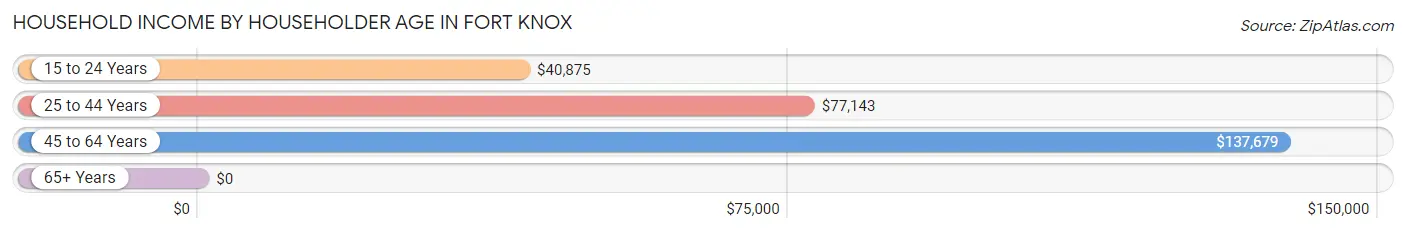
Household Income by Householder Age in Fort Knox
The median household income in Fort Knox is $76,864, with the highest median household income of $137,679 found in the 45 to 64 years age bracket for the primary householder. A total of 407 households (17.8%) fall into this category. Meanwhile, the 65+ years age bracket for the primary householder has the lowest median household income of $0, with 69 households (3.0%) in this group.
| Income Bracket | # Households | Median Income |
| 15 to 24 Years | 196 (8.6%) | $40,875 |
| 25 to 44 Years | 1,616 (70.6%) | $77,143 |
| 45 to 64 Years | 407 (17.8%) | $137,679 |
| 65+ Years | 69 (3.0%) | $0 |
| Total | 2,288 (100.0%) | $76,864 |
Poverty in Fort Knox
Income Below Poverty by Sex and Age in Fort Knox
With 4.5% poverty level for males and 4.1% for females among the residents of Fort Knox, 75 year old and over males and under 5 year old females are the most vulnerable to poverty, with 4 males (12.9%) and 47 females (8.9%) in their respective age groups living below the poverty level.
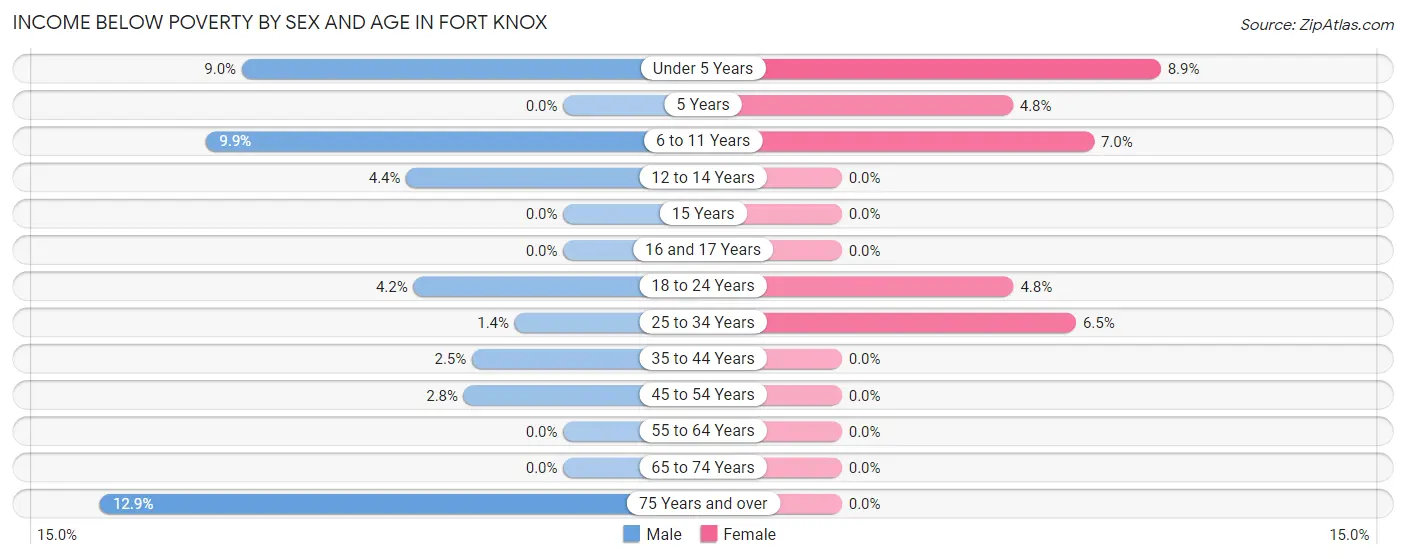
| Age Bracket | Male | Female |
| Under 5 Years | 41 (8.9%) | 47 (8.9%) |
| 5 Years | 0 (0.0%) | 4 (4.8%) |
| 6 to 11 Years | 51 (9.9%) | 37 (7.0%) |
| 12 to 14 Years | 8 (4.4%) | 0 (0.0%) |
| 15 Years | 0 (0.0%) | 0 (0.0%) |
| 16 and 17 Years | 0 (0.0%) | 0 (0.0%) |
| 18 to 24 Years | 10 (4.2%) | 17 (4.8%) |
| 25 to 34 Years | 10 (1.3%) | 49 (6.5%) |
| 35 to 44 Years | 18 (2.5%) | 0 (0.0%) |
| 45 to 54 Years | 8 (2.8%) | 0 (0.0%) |
| 55 to 64 Years | 0 (0.0%) | 0 (0.0%) |
| 65 to 74 Years | 0 (0.0%) | 0 (0.0%) |
| 75 Years and over | 4 (12.9%) | 0 (0.0%) |
| Total | 150 (4.5%) | 154 (4.1%) |
Income Above Poverty by Sex and Age in Fort Knox
According to the poverty statistics in Fort Knox, males aged 5 years and females aged 12 to 14 years are the age groups that are most secure financially, with 100.0% of males and 100.0% of females in these age groups living above the poverty line.
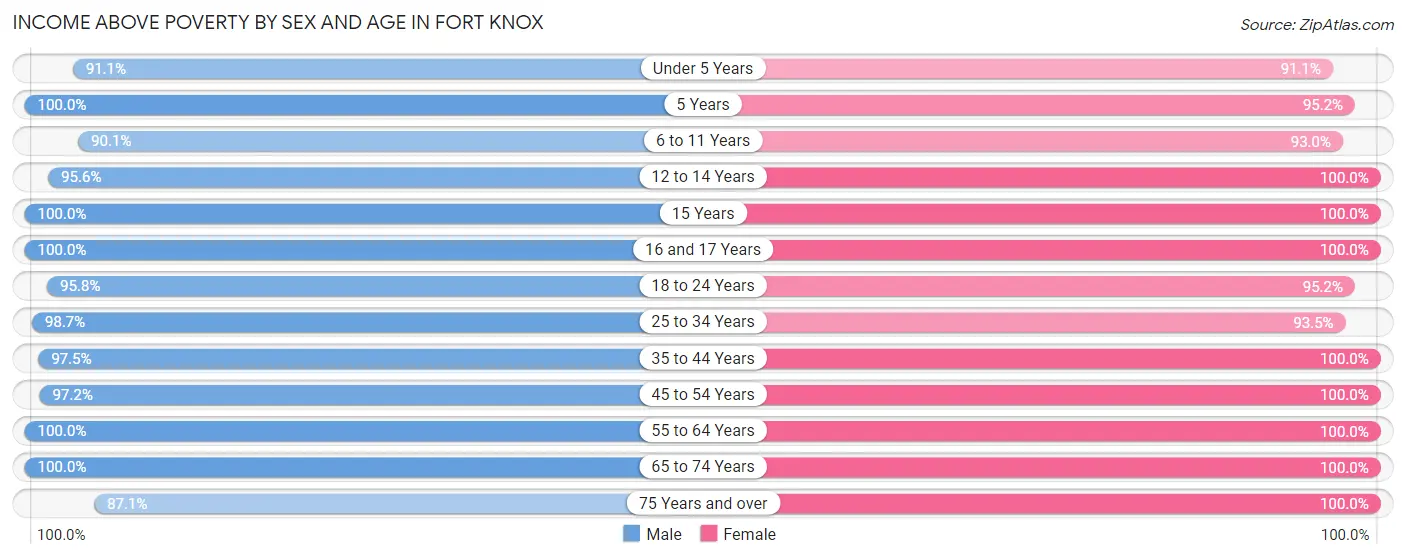
| Age Bracket | Male | Female |
| Under 5 Years | 417 (91.0%) | 482 (91.1%) |
| 5 Years | 3 (100.0%) | 80 (95.2%) |
| 6 to 11 Years | 462 (90.1%) | 490 (93.0%) |
| 12 to 14 Years | 175 (95.6%) | 160 (100.0%) |
| 15 Years | 28 (100.0%) | 30 (100.0%) |
| 16 and 17 Years | 53 (100.0%) | 122 (100.0%) |
| 18 to 24 Years | 230 (95.8%) | 339 (95.2%) |
| 25 to 34 Years | 732 (98.7%) | 702 (93.5%) |
| 35 to 44 Years | 692 (97.5%) | 850 (100.0%) |
| 45 to 54 Years | 281 (97.2%) | 207 (100.0%) |
| 55 to 64 Years | 67 (100.0%) | 76 (100.0%) |
| 65 to 74 Years | 20 (100.0%) | 60 (100.0%) |
| 75 Years and over | 27 (87.1%) | 14 (100.0%) |
| Total | 3,187 (95.5%) | 3,612 (95.9%) |
Income Below Poverty Among Married-Couple Families in Fort Knox
The poverty statistics for married-couple families in Fort Knox show that 2.1% or 30 of the total 1,411 families live below the poverty line. Families with 5 or more children have the highest poverty rate of 9.3%, comprising of 4 families. On the other hand, families with no children have the lowest poverty rate of 0.0%, which includes 0 families.
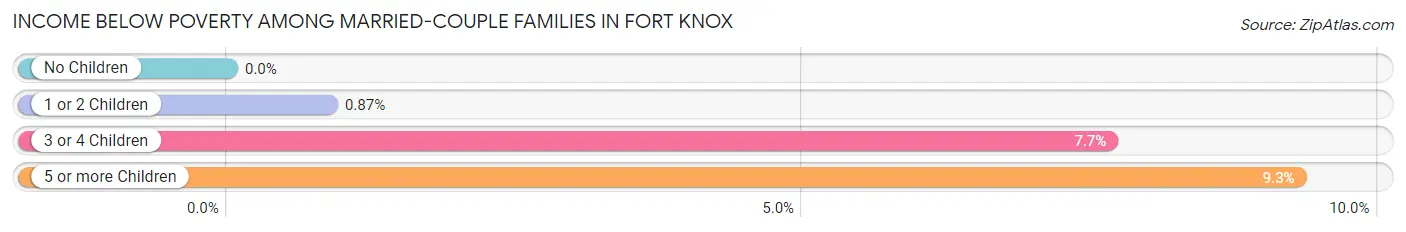
| Children | Above Poverty | Below Poverty |
| No Children | 418 (100.0%) | 0 (0.0%) |
| 1 or 2 Children | 683 (99.1%) | 6 (0.9%) |
| 3 or 4 Children | 241 (92.3%) | 20 (7.7%) |
| 5 or more Children | 39 (90.7%) | 4 (9.3%) |
| Total | 1,381 (97.9%) | 30 (2.1%) |
Income Below Poverty Among Single-Parent Households in Fort Knox
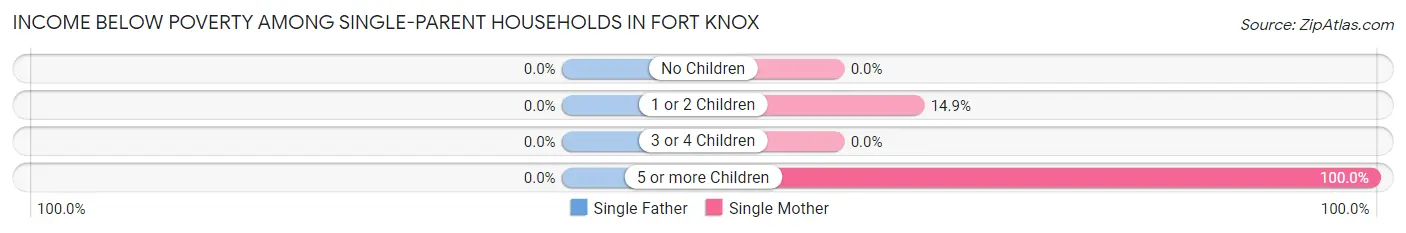
| Children | Single Father | Single Mother |
| No Children | 0 (0.0%) | 0 (0.0%) |
| 1 or 2 Children | 0 (0.0%) | 17 (14.9%) |
| 3 or 4 Children | 0 (0.0%) | 0 (0.0%) |
| 5 or more Children | 0 (0.0%) | 3 (100.0%) |
| Total | 0 (0.0%) | 20 (17.0%) |
Income Below Poverty Among Married-Couple vs Single-Parent Households in Fort Knox
The poverty data for Fort Knox shows that 30 of the married-couple family households (2.1%) and 20 of the single-parent households (8.8%) are living below the poverty level. Within the married-couple family households, those with 5 or more children have the highest poverty rate, with 4 households (9.3%) falling below the poverty line. Among the single-parent households, those with 5 or more children have the highest poverty rate, with 3 household (100.0%) living below poverty.
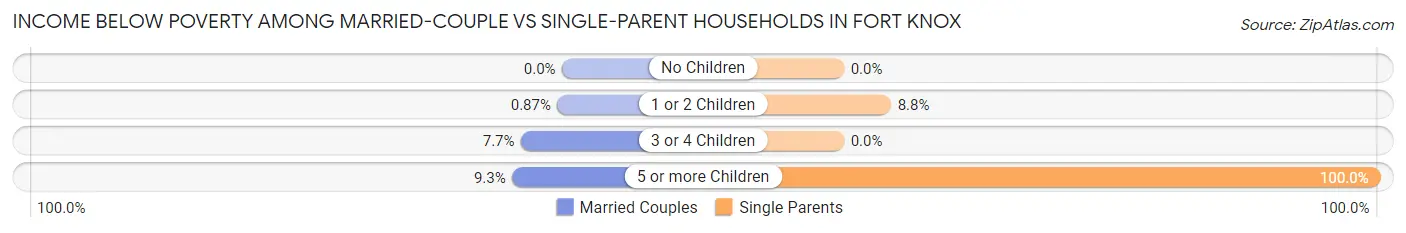
| Children | Married-Couple Families | Single-Parent Households |
| No Children | 0 (0.0%) | 0 (0.0%) |
| 1 or 2 Children | 6 (0.9%) | 17 (8.8%) |
| 3 or 4 Children | 20 (7.7%) | 0 (0.0%) |
| 5 or more Children | 4 (9.3%) | 3 (100.0%) |
| Total | 30 (2.1%) | 20 (8.8%) |
Race in Fort Knox
The most populous races in Fort Knox are White / Caucasian (5,045 | 58.3%), Hispanic or Latino (2,245 | 25.9%), and Black / African American (1,612 | 18.6%).
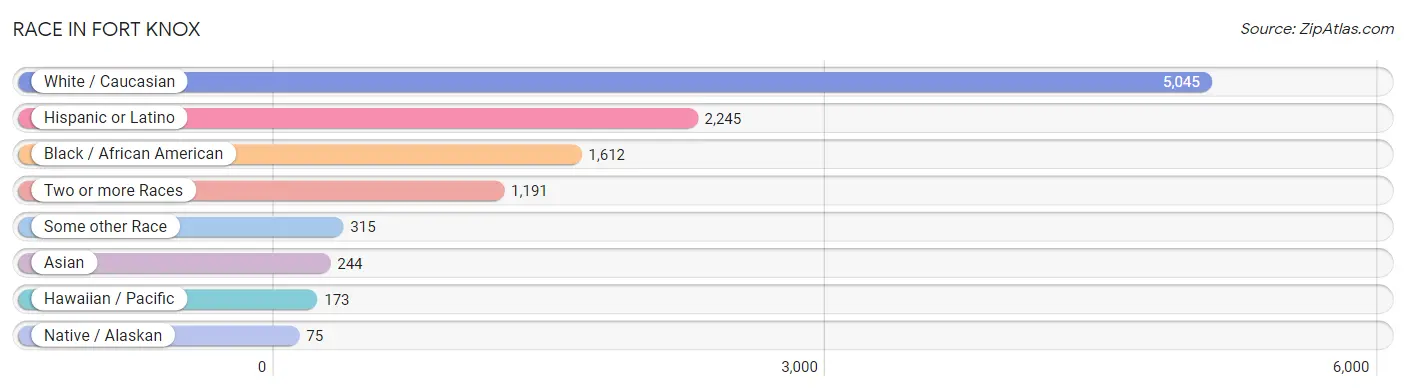
| Race | # Population | % Population |
| Asian | 244 | 2.8% |
| Black / African American | 1,612 | 18.6% |
| Hawaiian / Pacific | 173 | 2.0% |
| Hispanic or Latino | 2,245 | 25.9% |
| Native / Alaskan | 75 | 0.9% |
| White / Caucasian | 5,045 | 58.3% |
| Two or more Races | 1,191 | 13.8% |
| Some other Race | 315 | 3.6% |
| Total | 8,655 | 100.0% |
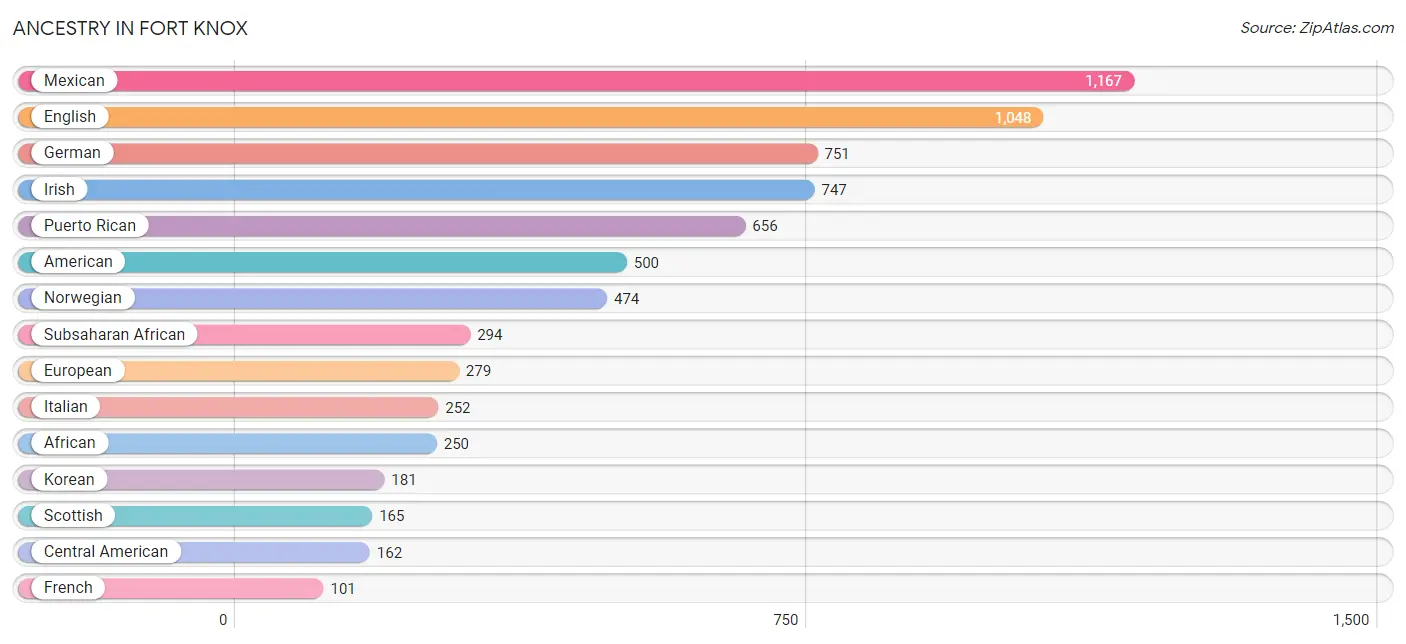
Ancestry in Fort Knox
The most populous ancestries reported in Fort Knox are Mexican (1,167 | 13.5%), English (1,048 | 12.1%), German (751 | 8.7%), Irish (747 | 8.6%), and Puerto Rican (656 | 7.6%), together accounting for 50.5% of all Fort Knox residents.
| Ancestry | # Population | % Population |
| African | 250 | 2.9% |
| American | 500 | 5.8% |
| Australian | 9 | 0.1% |
| Belgian | 7 | 0.1% |
| Bhutanese | 5 | 0.1% |
| British West Indian | 14 | 0.2% |
| Burmese | 79 | 0.9% |
| Central American | 162 | 1.9% |
| Central American Indian | 17 | 0.2% |
| Cherokee | 4 | 0.1% |
| Chickasaw | 14 | 0.2% |
| Colombian | 2 | 0.0% |
| Creek | 6 | 0.1% |
| Czech | 16 | 0.2% |
| Danish | 22 | 0.3% |
| Dominican | 67 | 0.8% |
| Dutch | 60 | 0.7% |
| Eastern European | 14 | 0.2% |
| English | 1,048 | 12.1% |
| European | 279 | 3.2% |
| Finnish | 10 | 0.1% |
| French | 101 | 1.2% |
| French Canadian | 5 | 0.1% |
| German | 751 | 8.7% |
| Greek | 18 | 0.2% |
| Guamanian / Chamorro | 30 | 0.4% |
| Guatemalan | 53 | 0.6% |
| Honduran | 96 | 1.1% |
| Hungarian | 4 | 0.1% |
| Indian (Asian) | 45 | 0.5% |
| Irish | 747 | 8.6% |
| Italian | 252 | 2.9% |
| Jamaican | 97 | 1.1% |
| Korean | 181 | 2.1% |
| Latvian | 16 | 0.2% |
| Mexican | 1,167 | 13.5% |
| Native Hawaiian | 8 | 0.1% |
| Navajo | 5 | 0.1% |
| Nicaraguan | 7 | 0.1% |
| Nigerian | 14 | 0.2% |
| Northern European | 11 | 0.1% |
| Norwegian | 474 | 5.5% |
| Pakistani | 18 | 0.2% |
| Peruvian | 1 | 0.0% |
| Polish | 96 | 1.1% |
| Portuguese | 22 | 0.3% |
| Pueblo | 31 | 0.4% |
| Puerto Rican | 656 | 7.6% |
| Puget Sound Salish | 10 | 0.1% |
| Romanian | 7 | 0.1% |
| Russian | 20 | 0.2% |
| Salvadoran | 6 | 0.1% |
| Scandinavian | 51 | 0.6% |
| Scotch-Irish | 58 | 0.7% |
| Scottish | 165 | 1.9% |
| Senegalese | 6 | 0.1% |
| South American | 3 | 0.0% |
| South American Indian | 1 | 0.0% |
| Spaniard | 7 | 0.1% |
| Spanish | 27 | 0.3% |
| Subsaharan African | 294 | 3.4% |
| Sudanese | 24 | 0.3% |
| Swedish | 26 | 0.3% |
| Swiss | 10 | 0.1% |
| Thai | 42 | 0.5% |
| Tohono O'Odham | 12 | 0.1% |
| Welsh | 10 | 0.1% |
| West Indian | 13 | 0.2% | View All 68 Rows |
Immigrants in Fort Knox
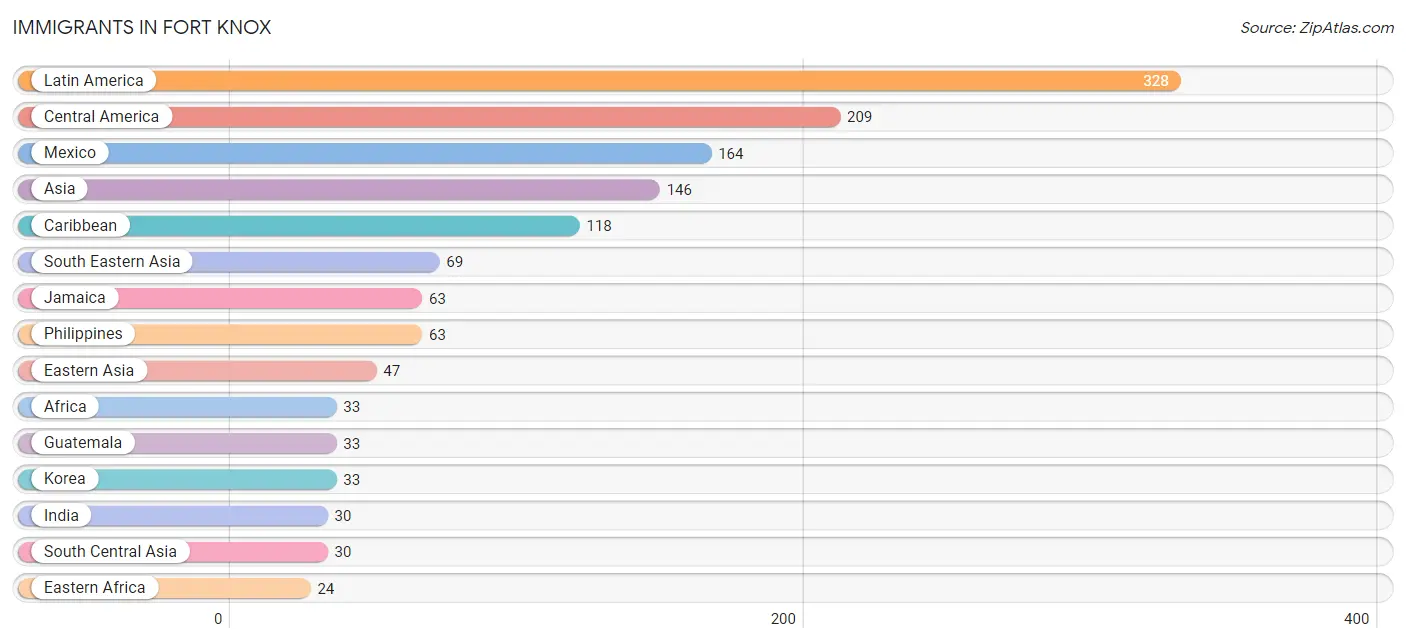
The most numerous immigrant groups reported in Fort Knox came from Latin America (328 | 3.8%), Central America (209 | 2.4%), Mexico (164 | 1.9%), Asia (146 | 1.7%), and Caribbean (118 | 1.4%), together accounting for 11.1% of all Fort Knox residents.
| Immigration Origin | # Population | % Population |
| Africa | 33 | 0.4% |
| Asia | 146 | 1.7% |
| Australia | 8 | 0.1% |
| Canada | 15 | 0.2% |
| Caribbean | 118 | 1.4% |
| Central America | 209 | 2.4% |
| China | 14 | 0.2% |
| Eastern Africa | 24 | 0.3% |
| Eastern Asia | 47 | 0.5% |
| Eastern Europe | 5 | 0.1% |
| Europe | 20 | 0.2% |
| Germany | 10 | 0.1% |
| Grenada | 21 | 0.2% |
| Guatemala | 33 | 0.4% |
| Honduras | 12 | 0.1% |
| India | 30 | 0.4% |
| Jamaica | 63 | 0.7% |
| Korea | 33 | 0.4% |
| Latin America | 328 | 3.8% |
| Mexico | 164 | 1.9% |
| Oceania | 12 | 0.1% |
| Peru | 1 | 0.0% |
| Philippines | 63 | 0.7% |
| Russia | 5 | 0.1% |
| Senegal | 6 | 0.1% |
| South America | 1 | 0.0% |
| South Central Asia | 30 | 0.4% |
| South Eastern Asia | 69 | 0.8% |
| Southern Europe | 5 | 0.1% |
| St. Vincent and the Grenadines | 14 | 0.2% |
| Trinidad and Tobago | 20 | 0.2% |
| Western Africa | 9 | 0.1% |
| Western Europe | 10 | 0.1% | View All 33 Rows |
Sex and Age in Fort Knox
Sex and Age in Fort Knox
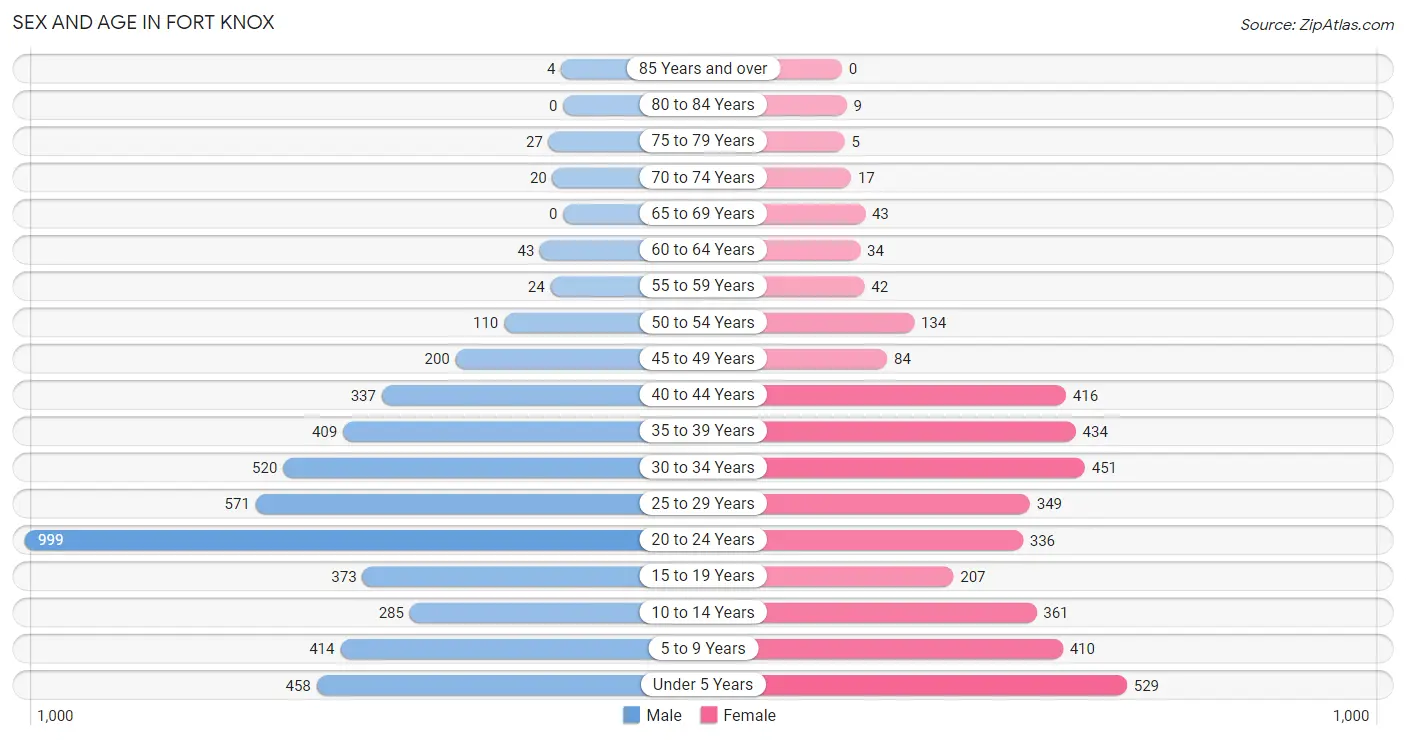
The most populous age groups in Fort Knox are 20 to 24 Years (999 | 20.8%) for men and Under 5 Years (529 | 13.7%) for women.
| Age Bracket | Male | Female |
| Under 5 Years | 458 (9.6%) | 529 (13.7%) |
| 5 to 9 Years | 414 (8.6%) | 410 (10.6%) |
| 10 to 14 Years | 285 (5.9%) | 361 (9.3%) |
| 15 to 19 Years | 373 (7.8%) | 207 (5.4%) |
| 20 to 24 Years | 999 (20.8%) | 336 (8.7%) |
| 25 to 29 Years | 571 (11.9%) | 349 (9.0%) |
| 30 to 34 Years | 520 (10.8%) | 451 (11.7%) |
| 35 to 39 Years | 409 (8.5%) | 434 (11.2%) |
| 40 to 44 Years | 337 (7.0%) | 416 (10.8%) |
| 45 to 49 Years | 200 (4.2%) | 84 (2.2%) |
| 50 to 54 Years | 110 (2.3%) | 134 (3.5%) |
| 55 to 59 Years | 24 (0.5%) | 42 (1.1%) |
| 60 to 64 Years | 43 (0.9%) | 34 (0.9%) |
| 65 to 69 Years | 0 (0.0%) | 43 (1.1%) |
| 70 to 74 Years | 20 (0.4%) | 17 (0.4%) |
| 75 to 79 Years | 27 (0.6%) | 5 (0.1%) |
| 80 to 84 Years | 0 (0.0%) | 9 (0.2%) |
| 85 Years and over | 4 (0.1%) | 0 (0.0%) |
| Total | 4,794 (100.0%) | 3,861 (100.0%) |
Families and Households in Fort Knox
Median Family Size in Fort Knox
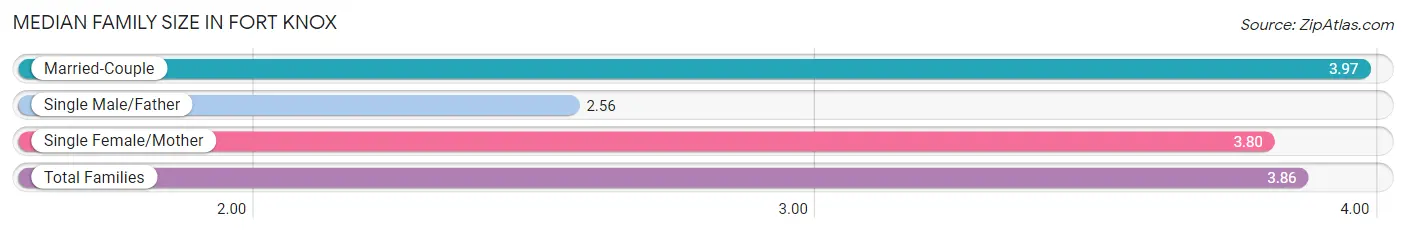
The median family size in Fort Knox is 3.86 persons per family, with married-couple families (1,411 | 86.2%) accounting for the largest median family size of 3.97 persons per family. On the other hand, single male/father families (108 | 6.6%) represent the smallest median family size with 2.56 persons per family.
| Family Type | # Families | Family Size |
| Married-Couple | 1,411 (86.2%) | 3.97 |
| Single Male/Father | 108 (6.6%) | 2.56 |
| Single Female/Mother | 118 (7.2%) | 3.80 |
| Total Families | 1,637 (100.0%) | 3.86 |
Median Household Size in Fort Knox
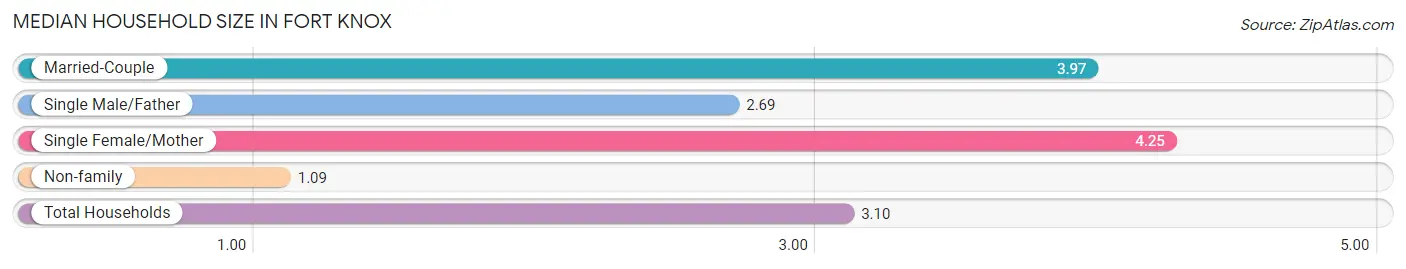
The median household size in Fort Knox is 3.10 persons per household, with single female/mother households (118 | 5.2%) accounting for the largest median household size of 4.25 persons per household. non-family households (651 | 28.4%) represent the smallest median household size with 1.09 persons per household.
| Household Type | # Households | Household Size |
| Married-Couple | 1,411 (61.7%) | 3.97 |
| Single Male/Father | 108 (4.7%) | 2.69 |
| Single Female/Mother | 118 (5.2%) | 4.25 |
| Non-family | 651 (28.4%) | 1.09 |
| Total Households | 2,288 (100.0%) | 3.10 |
Household Size by Marriage Status in Fort Knox
Out of a total of 2,288 households in Fort Knox, 1,637 (71.6%) are family households, while 651 (28.4%) are nonfamily households. The most numerous type of family households are 4-person households, comprising 475, and the most common type of nonfamily households are 1-person households, comprising 612.
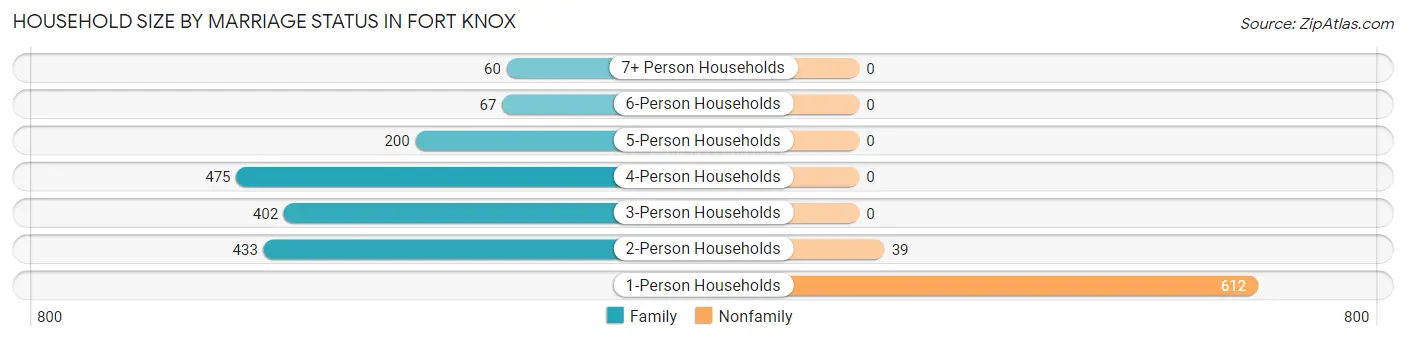
| Household Size | Family Households | Nonfamily Households |
| 1-Person Households | - | 612 (26.8%) |
| 2-Person Households | 433 (18.9%) | 39 (1.7%) |
| 3-Person Households | 402 (17.6%) | 0 (0.0%) |
| 4-Person Households | 475 (20.8%) | 0 (0.0%) |
| 5-Person Households | 200 (8.7%) | 0 (0.0%) |
| 6-Person Households | 67 (2.9%) | 0 (0.0%) |
| 7+ Person Households | 60 (2.6%) | 0 (0.0%) |
| Total | 1,637 (71.6%) | 651 (28.4%) |
Female Fertility in Fort Knox
Fertility by Age in Fort Knox
Average fertility rate in Fort Knox is 106.0 births per 1,000 women. Women in the age bracket of 20 to 34 years have the highest fertility rate with 151.0 births per 1,000 women. Women in the age bracket of 20 to 34 years acount for 69.1% of all women with births.
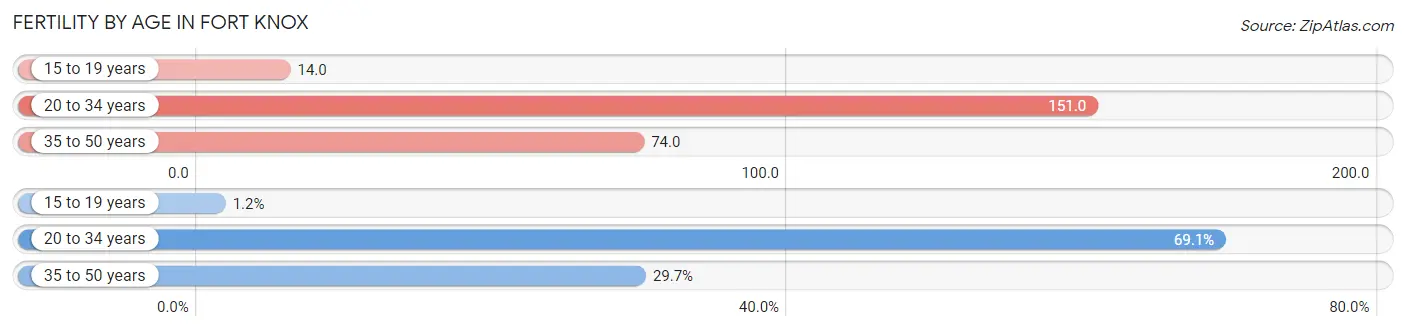
| Age Bracket | Women with Births | Births / 1,000 Women |
| 15 to 19 years | 3 (1.2%) | 14.0 |
| 20 to 34 years | 172 (69.1%) | 151.0 |
| 35 to 50 years | 74 (29.7%) | 74.0 |
| Total | 249 (100.0%) | 106.0 |
Fertility by Age by Marriage Status in Fort Knox
95.6% of women with births (249) in Fort Knox are married. The highest percentage of unmarried women with births falls into 15 to 19 years age bracket with 100.0% of them unmarried at the time of birth, while the lowest percentage of unmarried women with births belong to 35 to 50 years age bracket with 0.0% of them unmarried.
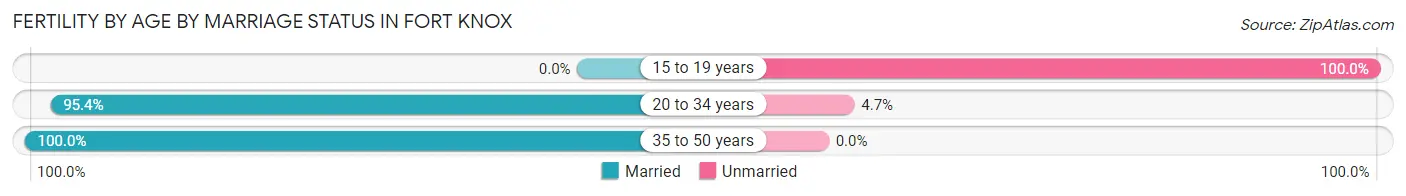
| Age Bracket | Married | Unmarried |
| 15 to 19 years | 0 (0.0%) | 3 (100.0%) |
| 20 to 34 years | 164 (95.4%) | 8 (4.6%) |
| 35 to 50 years | 74 (100.0%) | 0 (0.0%) |
| Total | 238 (95.6%) | 11 (4.4%) |
Fertility by Education in Fort Knox
Average fertility rate in Fort Knox is 106.0 births per 1,000 women. Women with the education attainment of graduate degree have the highest fertility rate of 225.0 births per 1,000 women, while women with the education attainment of less than high school have the lowest fertility at 35.0 births per 1,000 women. Women with the education attainment of college or associate's degree represent 51.0% of all women with births.
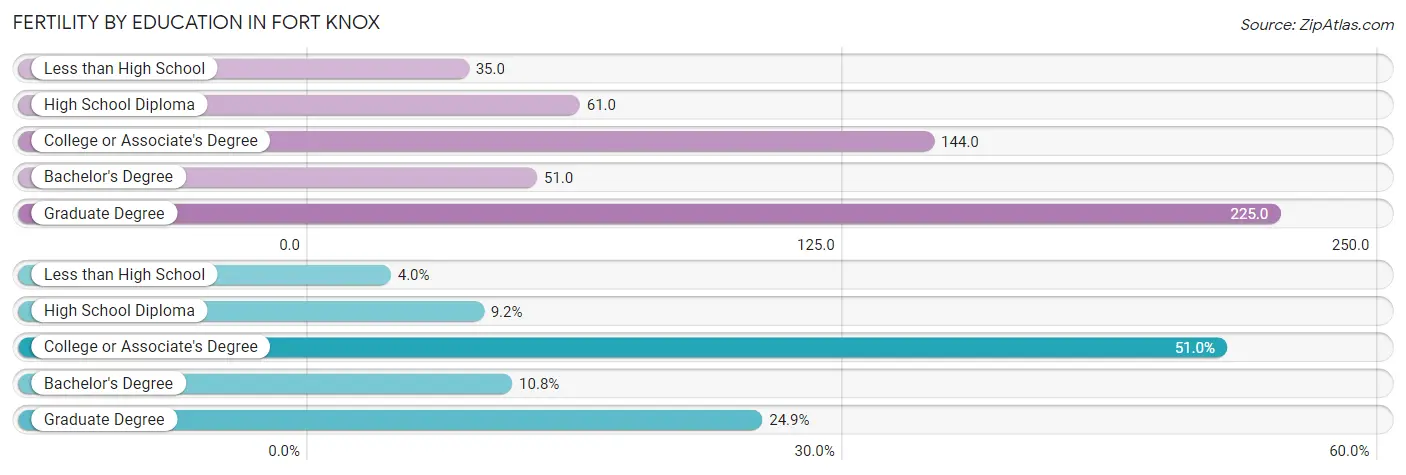
| Educational Attainment | Women with Births | Births / 1,000 Women |
| Less than High School | 10 (4.0%) | 35.0 |
| High School Diploma | 23 (9.2%) | 61.0 |
| College or Associate's Degree | 127 (51.0%) | 144.0 |
| Bachelor's Degree | 27 (10.8%) | 51.0 |
| Graduate Degree | 62 (24.9%) | 225.0 |
| Total | 249 (100.0%) | 106.0 |
Fertility by Education by Marriage Status in Fort Knox
4.4% of women with births in Fort Knox are unmarried. Women with the educational attainment of less than high school are most likely to be married with 100.0% of them married at childbirth, while women with the educational attainment of high school diploma are least likely to be married with 47.8% of them unmarried at childbirth.
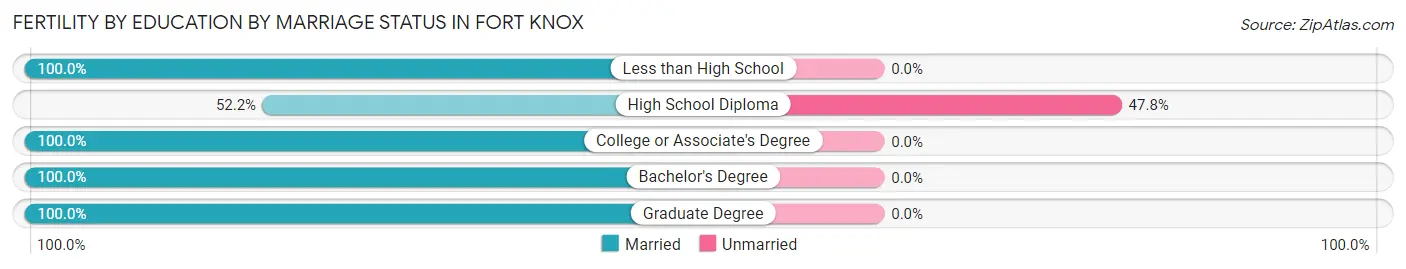
| Educational Attainment | Married | Unmarried |
| Less than High School | 10 (100.0%) | 0 (0.0%) |
| High School Diploma | 12 (52.2%) | 11 (47.8%) |
| College or Associate's Degree | 127 (100.0%) | 0 (0.0%) |
| Bachelor's Degree | 27 (100.0%) | 0 (0.0%) |
| Graduate Degree | 62 (100.0%) | 0 (0.0%) |
| Total | 238 (95.6%) | 11 (4.4%) |
Employment Characteristics in Fort Knox
Employment by Class of Employer in Fort Knox
Among the 4,610 employed individuals in Fort Knox, federal government employees (3,653 | 79.2%), private company employees (764 | 16.6%), and not-for-profit organizations (116 | 2.5%) make up the most common classes of employment.
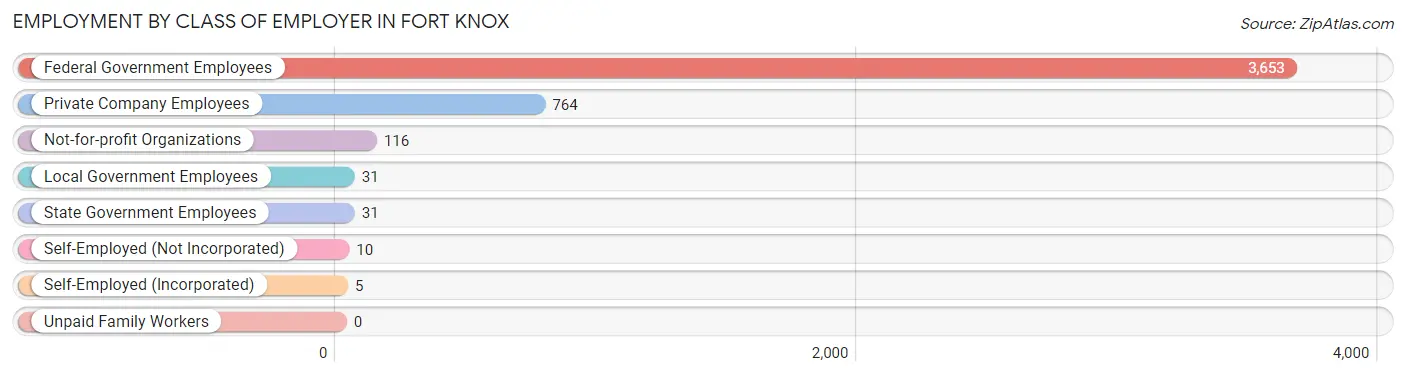
| Employer Class | # Employees | % Employees |
| Private Company Employees | 764 | 16.6% |
| Self-Employed (Incorporated) | 5 | 0.1% |
| Self-Employed (Not Incorporated) | 10 | 0.2% |
| Not-for-profit Organizations | 116 | 2.5% |
| Local Government Employees | 31 | 0.7% |
| State Government Employees | 31 | 0.7% |
| Federal Government Employees | 3,653 | 79.2% |
| Unpaid Family Workers | 0 | 0.0% |
| Total | 4,610 | 100.0% |
Employment Status by Age in Fort Knox
According to the labor force statistics for Fort Knox, out of the total population over 16 years of age (6,140), 79.5% or 4,881 individuals are in the labor force, with 8.8% or 430 of them unemployed. The age group with the highest labor force participation rate is 20 to 24 years, with 96.3% or 1,286 individuals in the labor force. Within the labor force, the 35 to 44 years age range has the highest percentage of unemployed individuals, with 17.2% or 201 of them being unemployed.
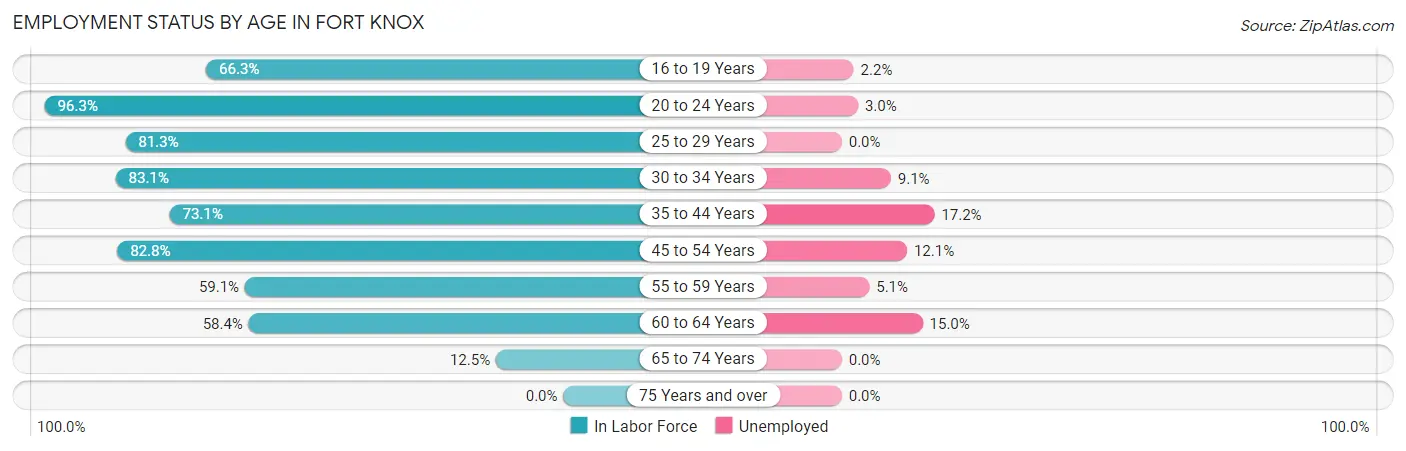
| Age Bracket | In Labor Force | Unemployed |
| 16 to 19 Years | 346 (66.3%) | 8 (2.2%) |
| 20 to 24 Years | 1,286 (96.3%) | 39 (3.0%) |
| 25 to 29 Years | 748 (81.3%) | 0 (0.0%) |
| 30 to 34 Years | 807 (83.1%) | 73 (9.1%) |
| 35 to 44 Years | 1,167 (73.1%) | 201 (17.2%) |
| 45 to 54 Years | 437 (82.8%) | 53 (12.1%) |
| 55 to 59 Years | 39 (59.1%) | 2 (5.1%) |
| 60 to 64 Years | 45 (58.4%) | 7 (15.0%) |
| 65 to 74 Years | 10 (12.5%) | 0 (0.0%) |
| 75 Years and over | 0 (0.0%) | 0 (0.0%) |
| Total | 4,881 (79.5%) | 430 (8.8%) |
Employment Status by Educational Attainment in Fort Knox
According to labor force statistics for Fort Knox, 78.0% of individuals (3,243) out of the total population between 25 and 64 years of age (4,158) are in the labor force, with 10.5% or 341 of them being unemployed. The group with the highest labor force participation rate are those with the educational attainment of bachelor's degree or higher, with 85.2% or 1,454 individuals in the labor force. Within the labor force, individuals with college / associate degree education have the highest percentage of unemployment, with 19.5% or 270 of them being unemployed.
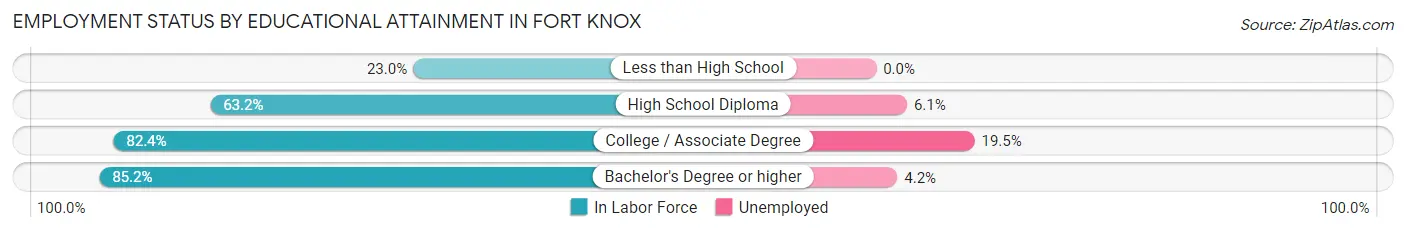
| Educational Attainment | In Labor Force | Unemployed |
| Less than High School | 48 (23.0%) | 0 (0.0%) |
| High School Diploma | 354 (63.2%) | 34 (6.1%) |
| College / Associate Degree | 1,386 (82.4%) | 328 (19.5%) |
| Bachelor's Degree or higher | 1,454 (85.2%) | 72 (4.2%) |
| Total | 3,243 (78.0%) | 437 (10.5%) |
Employment Occupations by Sex in Fort Knox
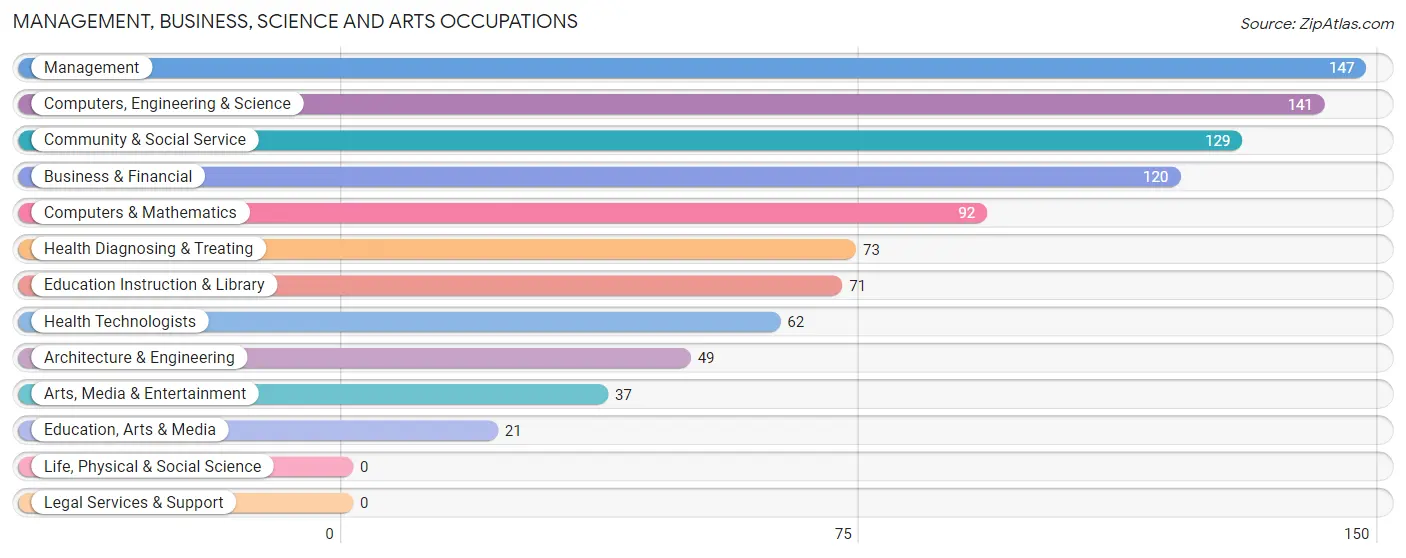
Management, Business, Science and Arts Occupations
The most common Management, Business, Science and Arts occupations in Fort Knox are Management (147 | 9.1%), Computers, Engineering & Science (141 | 8.7%), Community & Social Service (129 | 8.0%), Business & Financial (120 | 7.4%), and Computers & Mathematics (92 | 5.7%).
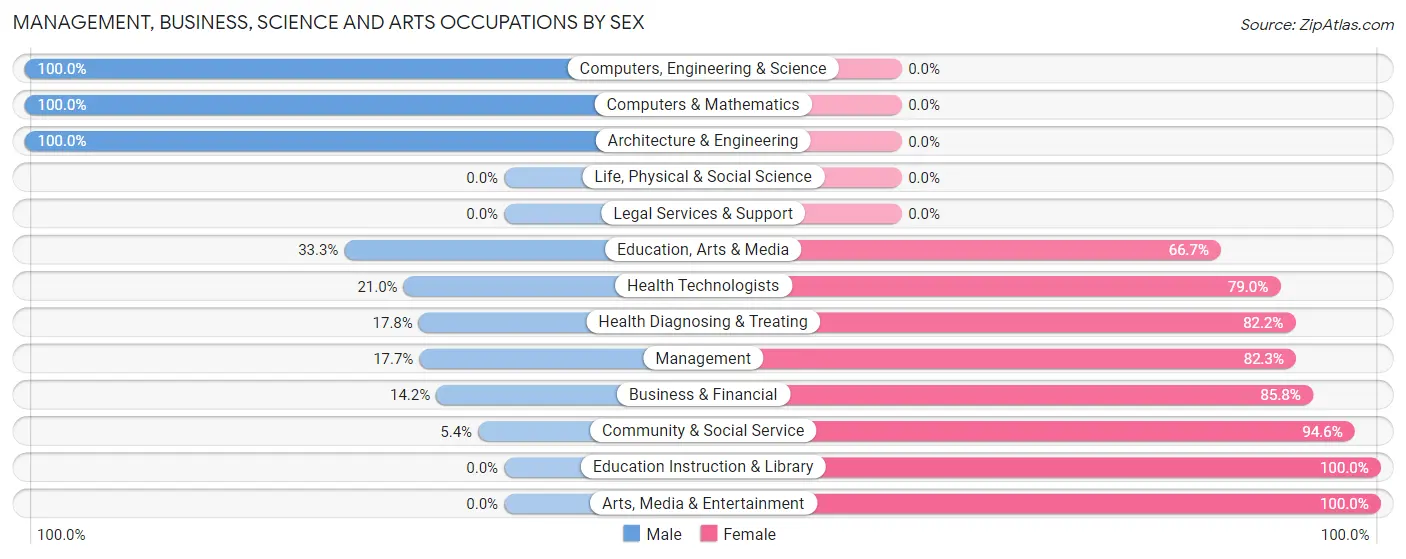
Management, Business, Science and Arts Occupations by Sex
Within the Management, Business, Science and Arts occupations in Fort Knox, the most male-oriented occupations are Computers, Engineering & Science (100.0%), Computers & Mathematics (100.0%), and Architecture & Engineering (100.0%), while the most female-oriented occupations are Education Instruction & Library (100.0%), Arts, Media & Entertainment (100.0%), and Community & Social Service (94.6%).
| Occupation | Male | Female |
| Management | 26 (17.7%) | 121 (82.3%) |
| Business & Financial | 17 (14.2%) | 103 (85.8%) |
| Computers, Engineering & Science | 141 (100.0%) | 0 (0.0%) |
| Computers & Mathematics | 92 (100.0%) | 0 (0.0%) |
| Architecture & Engineering | 49 (100.0%) | 0 (0.0%) |
| Life, Physical & Social Science | 0 (0.0%) | 0 (0.0%) |
| Community & Social Service | 7 (5.4%) | 122 (94.6%) |
| Education, Arts & Media | 7 (33.3%) | 14 (66.7%) |
| Legal Services & Support | 0 (0.0%) | 0 (0.0%) |
| Education Instruction & Library | 0 (0.0%) | 71 (100.0%) |
| Arts, Media & Entertainment | 0 (0.0%) | 37 (100.0%) |
| Health Diagnosing & Treating | 13 (17.8%) | 60 (82.2%) |
| Health Technologists | 13 (21.0%) | 49 (79.0%) |
| Total (Category) | 204 (33.4%) | 406 (66.6%) |
| Total (Overall) | 612 (37.7%) | 1,010 (62.3%) |
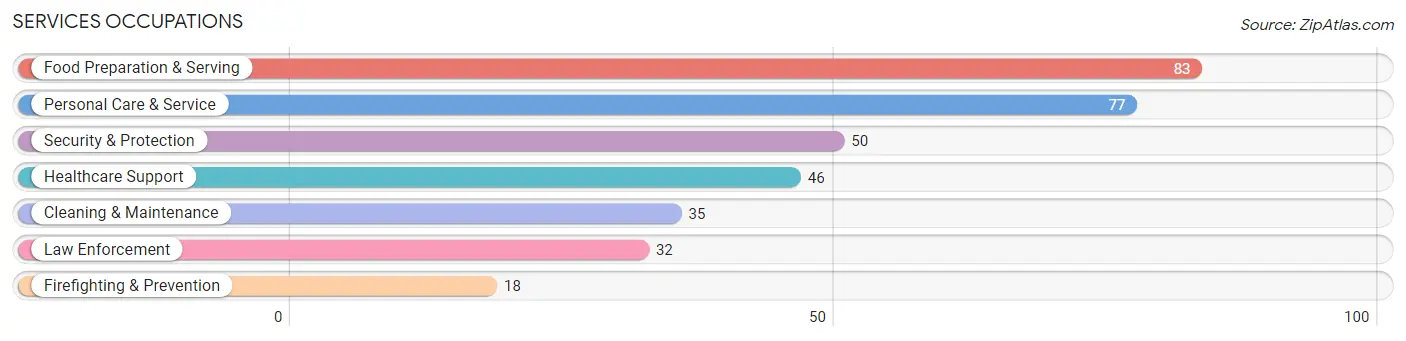
Services Occupations
The most common Services occupations in Fort Knox are Food Preparation & Serving (83 | 5.1%), Personal Care & Service (77 | 4.8%), Security & Protection (50 | 3.1%), Healthcare Support (46 | 2.8%), and Cleaning & Maintenance (35 | 2.2%).
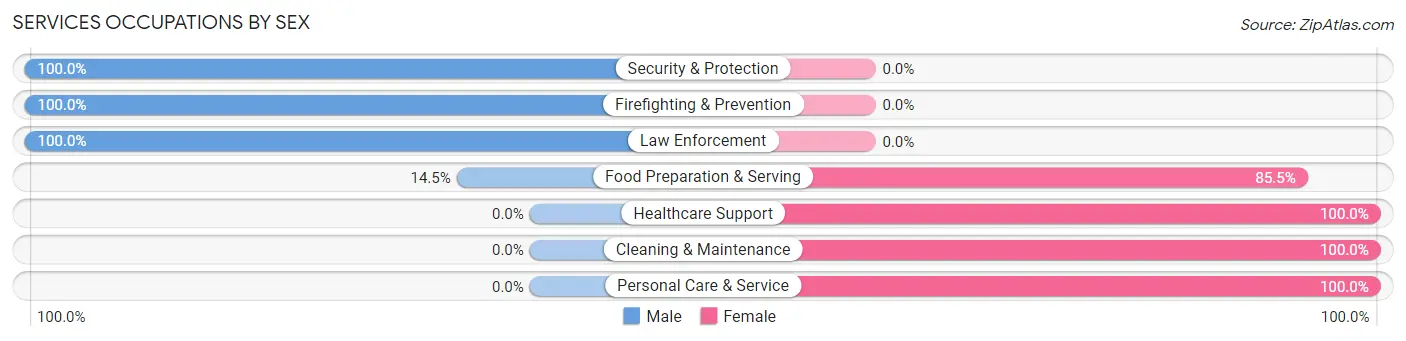
Services Occupations by Sex
Within the Services occupations in Fort Knox, the most male-oriented occupations are Security & Protection (100.0%), Firefighting & Prevention (100.0%), and Law Enforcement (100.0%), while the most female-oriented occupations are Healthcare Support (100.0%), Cleaning & Maintenance (100.0%), and Personal Care & Service (100.0%).
| Occupation | Male | Female |
| Healthcare Support | 0 (0.0%) | 46 (100.0%) |
| Security & Protection | 50 (100.0%) | 0 (0.0%) |
| Firefighting & Prevention | 18 (100.0%) | 0 (0.0%) |
| Law Enforcement | 32 (100.0%) | 0 (0.0%) |
| Food Preparation & Serving | 12 (14.5%) | 71 (85.5%) |
| Cleaning & Maintenance | 0 (0.0%) | 35 (100.0%) |
| Personal Care & Service | 0 (0.0%) | 77 (100.0%) |
| Total (Category) | 62 (21.3%) | 229 (78.7%) |
| Total (Overall) | 612 (37.7%) | 1,010 (62.3%) |
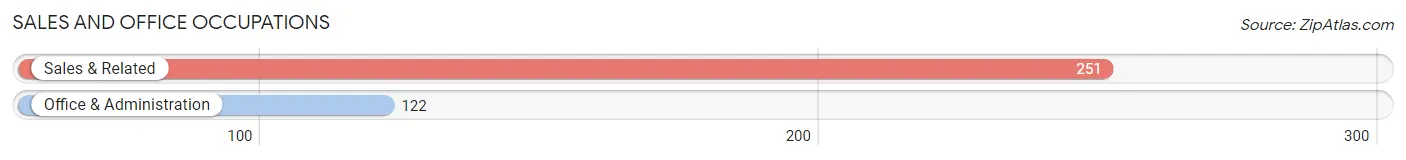
Sales and Office Occupations
The most common Sales and Office occupations in Fort Knox are Sales & Related (251 | 15.5%), and Office & Administration (122 | 7.5%).
Sales and Office Occupations by Sex
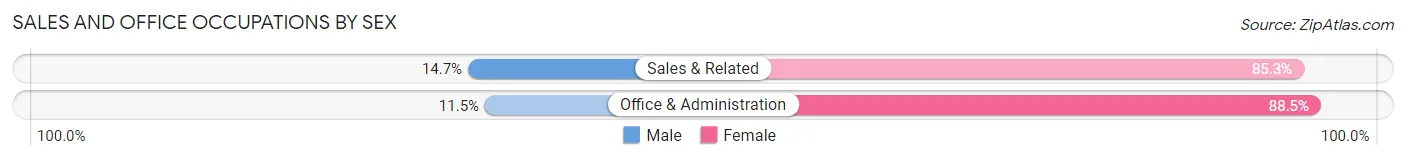
| Occupation | Male | Female |
| Sales & Related | 37 (14.7%) | 214 (85.3%) |
| Office & Administration | 14 (11.5%) | 108 (88.5%) |
| Total (Category) | 51 (13.7%) | 322 (86.3%) |
| Total (Overall) | 612 (37.7%) | 1,010 (62.3%) |
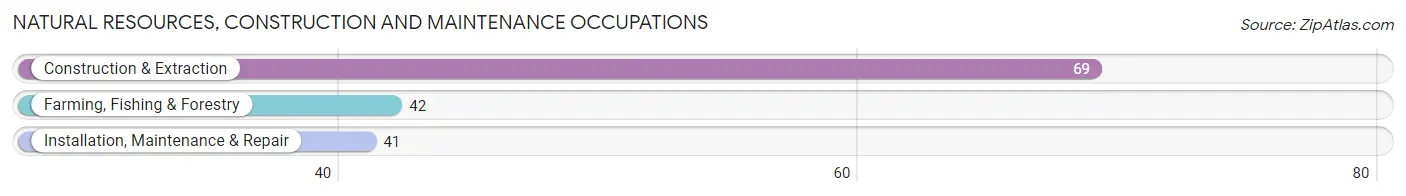
Natural Resources, Construction and Maintenance Occupations
The most common Natural Resources, Construction and Maintenance occupations in Fort Knox are Construction & Extraction (69 | 4.3%), Farming, Fishing & Forestry (42 | 2.6%), and Installation, Maintenance & Repair (41 | 2.5%).
Natural Resources, Construction and Maintenance Occupations by Sex
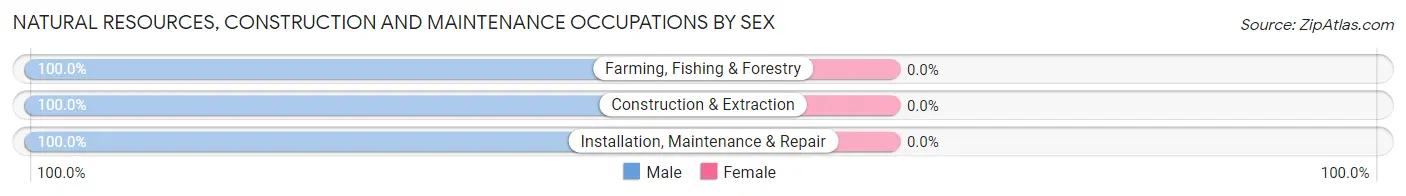
| Occupation | Male | Female |
| Farming, Fishing & Forestry | 42 (100.0%) | 0 (0.0%) |
| Construction & Extraction | 69 (100.0%) | 0 (0.0%) |
| Installation, Maintenance & Repair | 41 (100.0%) | 0 (0.0%) |
| Total (Category) | 152 (100.0%) | 0 (0.0%) |
| Total (Overall) | 612 (37.7%) | 1,010 (62.3%) |
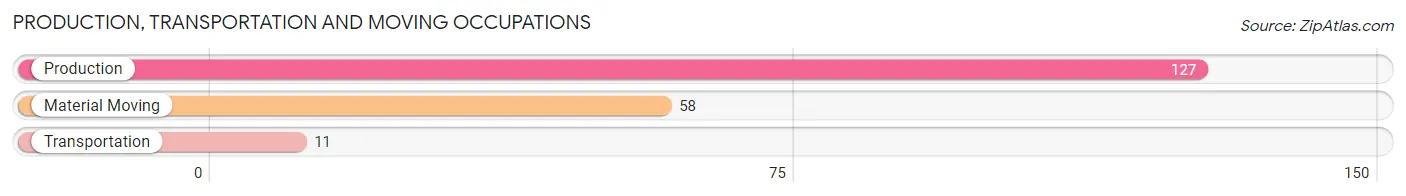
Production, Transportation and Moving Occupations
The most common Production, Transportation and Moving occupations in Fort Knox are Production (127 | 7.8%), Material Moving (58 | 3.6%), and Transportation (11 | 0.7%).
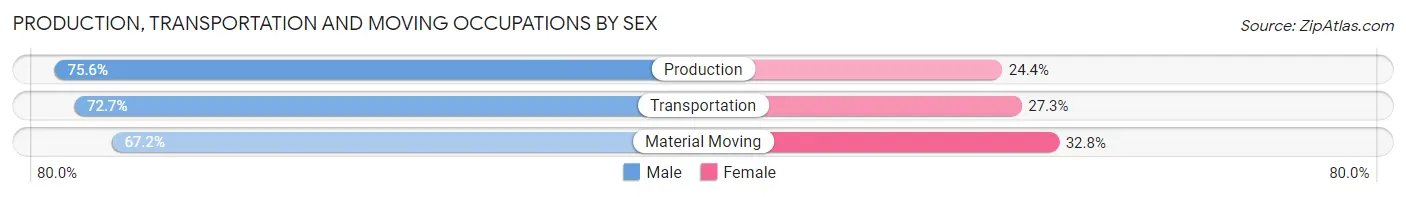
Production, Transportation and Moving Occupations by Sex
| Occupation | Male | Female |
| Production | 96 (75.6%) | 31 (24.4%) |
| Transportation | 8 (72.7%) | 3 (27.3%) |
| Material Moving | 39 (67.2%) | 19 (32.8%) |
| Total (Category) | 143 (73.0%) | 53 (27.0%) |
| Total (Overall) | 612 (37.7%) | 1,010 (62.3%) |
Employment Industries by Sex in Fort Knox
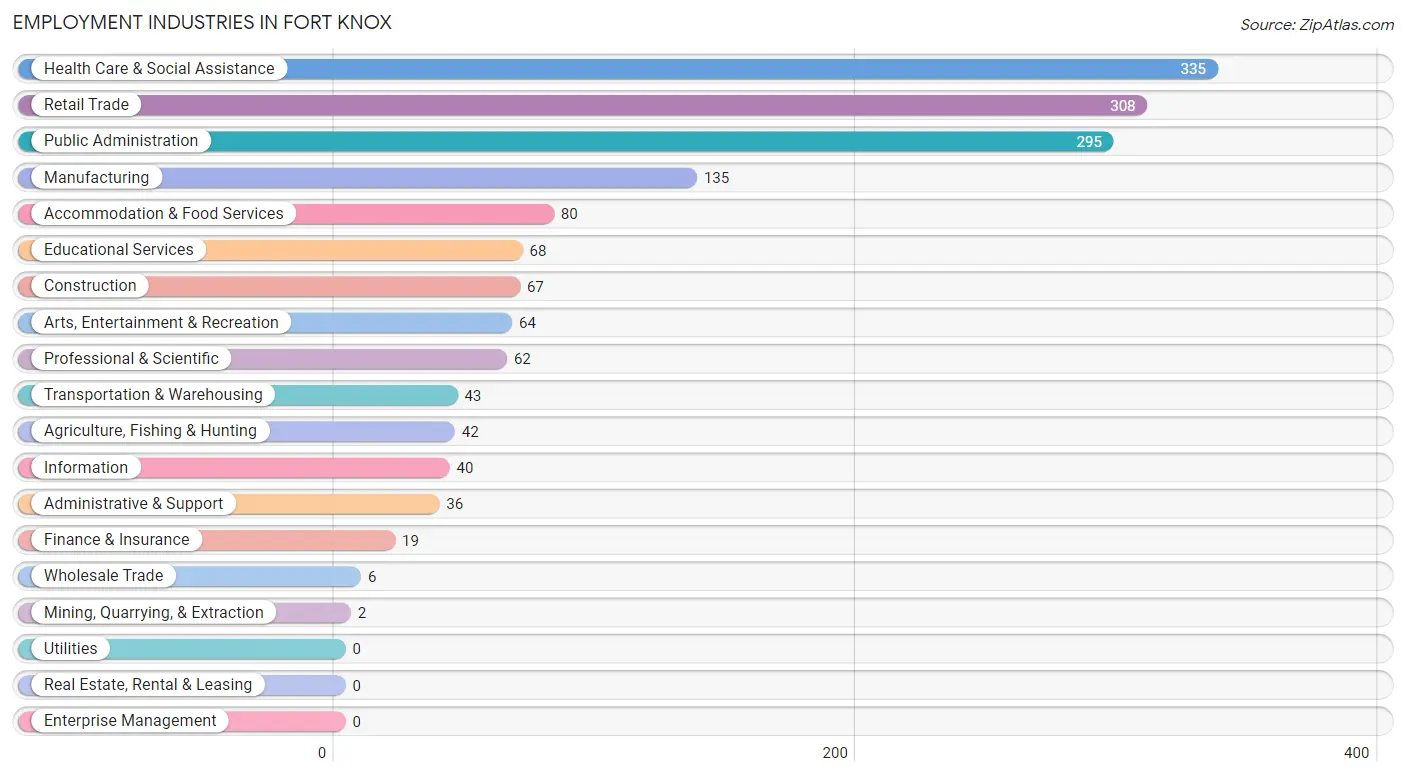
Employment Industries in Fort Knox
The major employment industries in Fort Knox include Health Care & Social Assistance (335 | 20.6%), Retail Trade (308 | 19.0%), Public Administration (295 | 18.2%), Manufacturing (135 | 8.3%), and Accommodation & Food Services (80 | 4.9%).
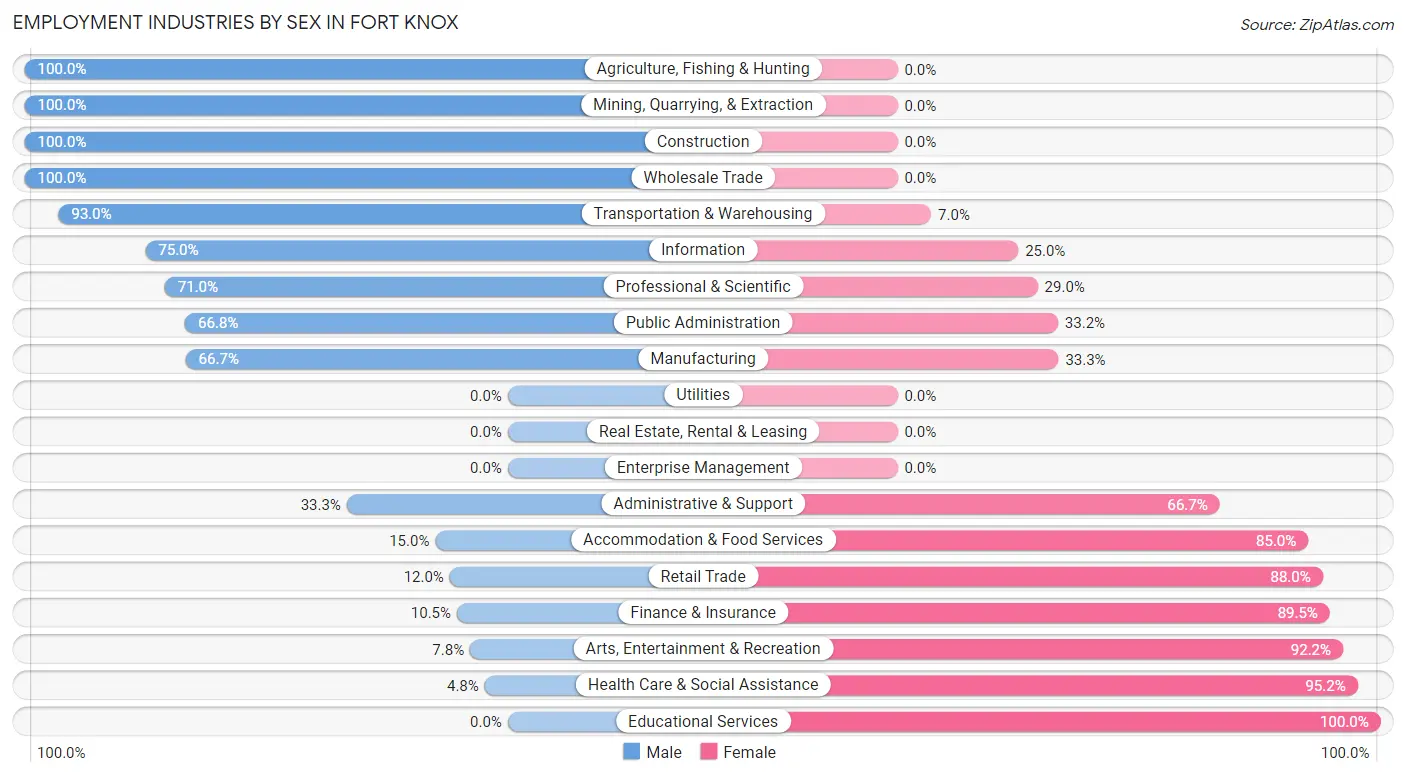
Employment Industries by Sex in Fort Knox
The Fort Knox industries that see more men than women are Agriculture, Fishing & Hunting (100.0%), Mining, Quarrying, & Extraction (100.0%), and Construction (100.0%), whereas the industries that tend to have a higher number of women are Educational Services (100.0%), Health Care & Social Assistance (95.2%), and Arts, Entertainment & Recreation (92.2%).
| Industry | Male | Female |
| Agriculture, Fishing & Hunting | 42 (100.0%) | 0 (0.0%) |
| Mining, Quarrying, & Extraction | 2 (100.0%) | 0 (0.0%) |
| Construction | 67 (100.0%) | 0 (0.0%) |
| Manufacturing | 90 (66.7%) | 45 (33.3%) |
| Wholesale Trade | 6 (100.0%) | 0 (0.0%) |
| Retail Trade | 37 (12.0%) | 271 (88.0%) |
| Transportation & Warehousing | 40 (93.0%) | 3 (7.0%) |
| Utilities | 0 (0.0%) | 0 (0.0%) |
| Information | 30 (75.0%) | 10 (25.0%) |
| Finance & Insurance | 2 (10.5%) | 17 (89.5%) |
| Real Estate, Rental & Leasing | 0 (0.0%) | 0 (0.0%) |
| Professional & Scientific | 44 (71.0%) | 18 (29.0%) |
| Enterprise Management | 0 (0.0%) | 0 (0.0%) |
| Administrative & Support | 12 (33.3%) | 24 (66.7%) |
| Educational Services | 0 (0.0%) | 68 (100.0%) |
| Health Care & Social Assistance | 16 (4.8%) | 319 (95.2%) |
| Arts, Entertainment & Recreation | 5 (7.8%) | 59 (92.2%) |
| Accommodation & Food Services | 12 (15.0%) | 68 (85.0%) |
| Public Administration | 197 (66.8%) | 98 (33.2%) |
| Total | 612 (37.7%) | 1,010 (62.3%) |
Education in Fort Knox
School Enrollment in Fort Knox
The most common levels of schooling among the 2,919 students in Fort Knox are elementary school (720 | 24.7%), middle school (538 | 18.4%), and college / undergraduate (535 | 18.3%).
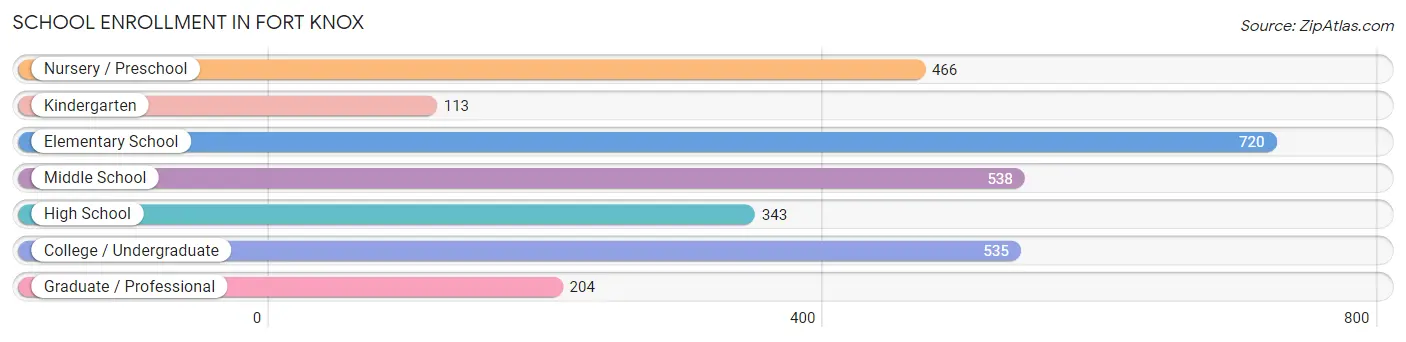
| School Level | # Students | % Students |
| Nursery / Preschool | 466 | 16.0% |
| Kindergarten | 113 | 3.9% |
| Elementary School | 720 | 24.7% |
| Middle School | 538 | 18.4% |
| High School | 343 | 11.7% |
| College / Undergraduate | 535 | 18.3% |
| Graduate / Professional | 204 | 7.0% |
| Total | 2,919 | 100.0% |
School Enrollment by Age by Funding Source in Fort Knox
Out of a total of 2,919 students who are enrolled in schools in Fort Knox, 368 (12.6%) attend a private institution, while the remaining 2,551 (87.4%) are enrolled in public schools. The age group of 25 to 34 year olds has the highest likelihood of being enrolled in private schools, with 58 (22.1% in the age bracket) enrolled. Conversely, the age group of 18 to 19 year olds has the lowest likelihood of being enrolled in a private school, with 62 (96.9% in the age bracket) attending a public institution.
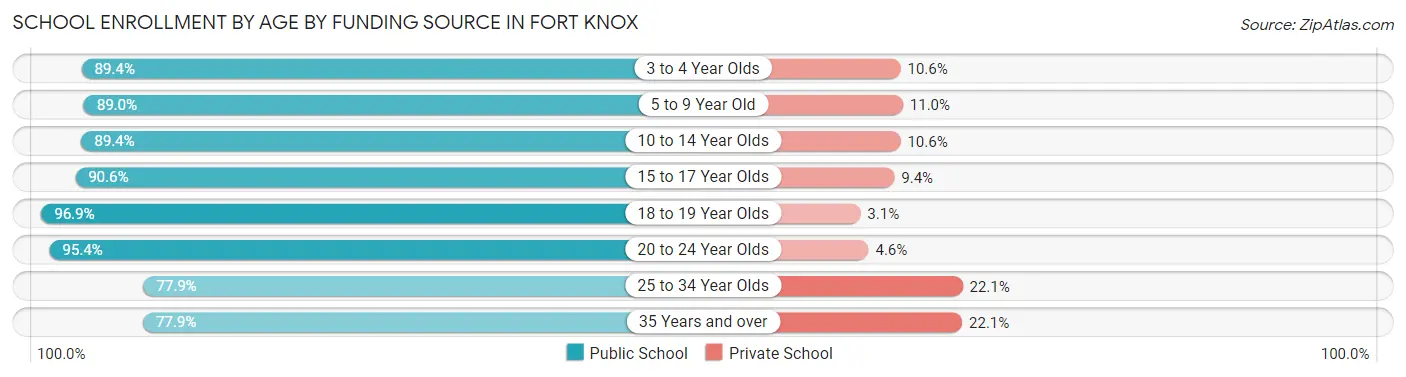
| Age Bracket | Public School | Private School |
| 3 to 4 Year Olds | 405 (89.4%) | 48 (10.6%) |
| 5 to 9 Year Old | 718 (89.0%) | 89 (11.0%) |
| 10 to 14 Year Olds | 575 (89.4%) | 68 (10.6%) |
| 15 to 17 Year Olds | 211 (90.6%) | 22 (9.4%) |
| 18 to 19 Year Olds | 62 (96.9%) | 2 (3.1%) |
| 20 to 24 Year Olds | 103 (95.4%) | 5 (4.6%) |
| 25 to 34 Year Olds | 204 (77.9%) | 58 (22.1%) |
| 35 Years and over | 272 (77.9%) | 77 (22.1%) |
| Total | 2,551 (87.4%) | 368 (12.6%) |
Educational Attainment by Field of Study in Fort Knox
Business (591 | 29.7%), arts & humanities (391 | 19.6%), science & technology (242 | 12.1%), psychology (220 | 11.1%), and computers & mathematics (95 | 4.8%) are the most common fields of study among 1,991 individuals in Fort Knox who have obtained a bachelor's degree or higher.
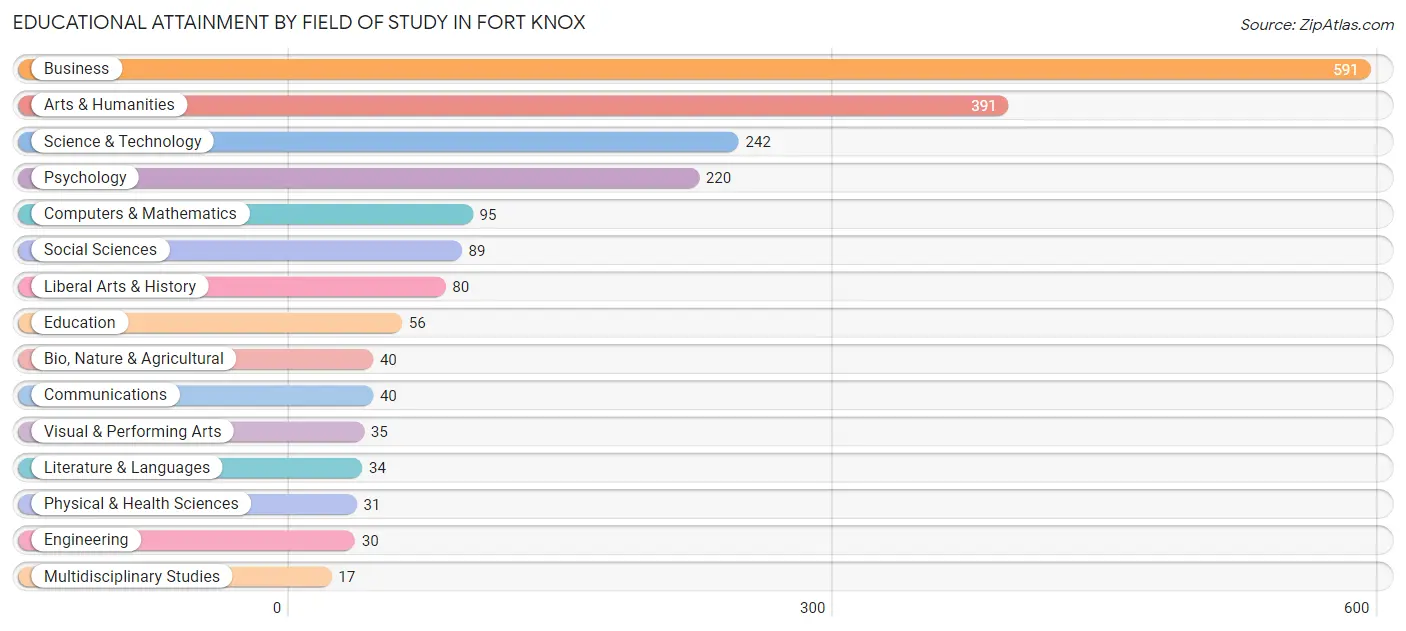
| Field of Study | # Graduates | % Graduates |
| Computers & Mathematics | 95 | 4.8% |
| Bio, Nature & Agricultural | 40 | 2.0% |
| Physical & Health Sciences | 31 | 1.6% |
| Psychology | 220 | 11.1% |
| Social Sciences | 89 | 4.5% |
| Engineering | 30 | 1.5% |
| Multidisciplinary Studies | 17 | 0.9% |
| Science & Technology | 242 | 12.1% |
| Business | 591 | 29.7% |
| Education | 56 | 2.8% |
| Literature & Languages | 34 | 1.7% |
| Liberal Arts & History | 80 | 4.0% |
| Visual & Performing Arts | 35 | 1.8% |
| Communications | 40 | 2.0% |
| Arts & Humanities | 391 | 19.6% |
| Total | 1,991 | 100.0% |
Transportation & Commute in Fort Knox
Vehicle Availability by Sex in Fort Knox
The most prevalent vehicle ownership categories in Fort Knox are males with 2 vehicles (1,087, accounting for 60.6%) and females with 2 vehicles (822, making up 86.1%).
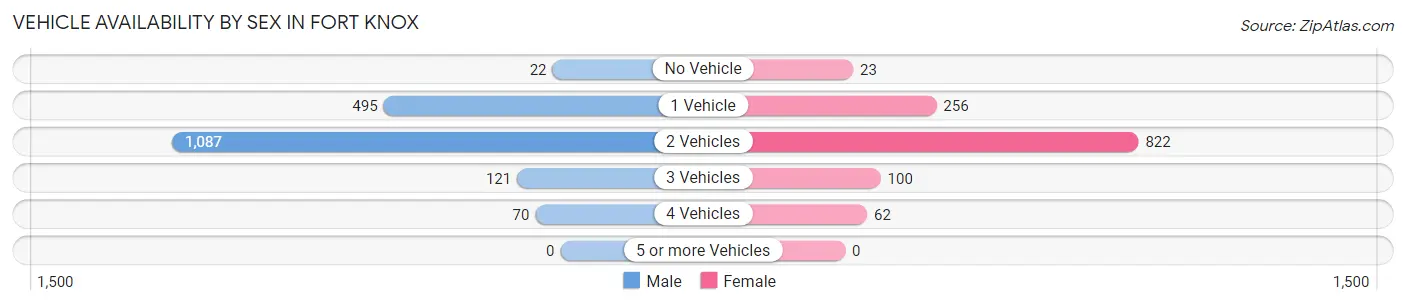
| Vehicles Available | Male | Female |
| No Vehicle | 22 (1.2%) | 23 (1.8%) |
| 1 Vehicle | 495 (27.6%) | 256 (20.3%) |
| 2 Vehicles | 1,087 (60.6%) | 822 (65.1%) |
| 3 Vehicles | 121 (6.7%) | 100 (7.9%) |
| 4 Vehicles | 70 (3.9%) | 62 (4.9%) |
| 5 or more Vehicles | 0 (0.0%) | 0 (0.0%) |
| Total | 1,795 (100.0%) | 1,263 (100.0%) |
Commute Time in Fort Knox
The most frequently occuring commute durations in Fort Knox are 5 to 9 minutes (1,741 commuters, 38.7%), 10 to 14 minutes (1,048 commuters, 23.3%), and 15 to 19 minutes (606 commuters, 13.5%).
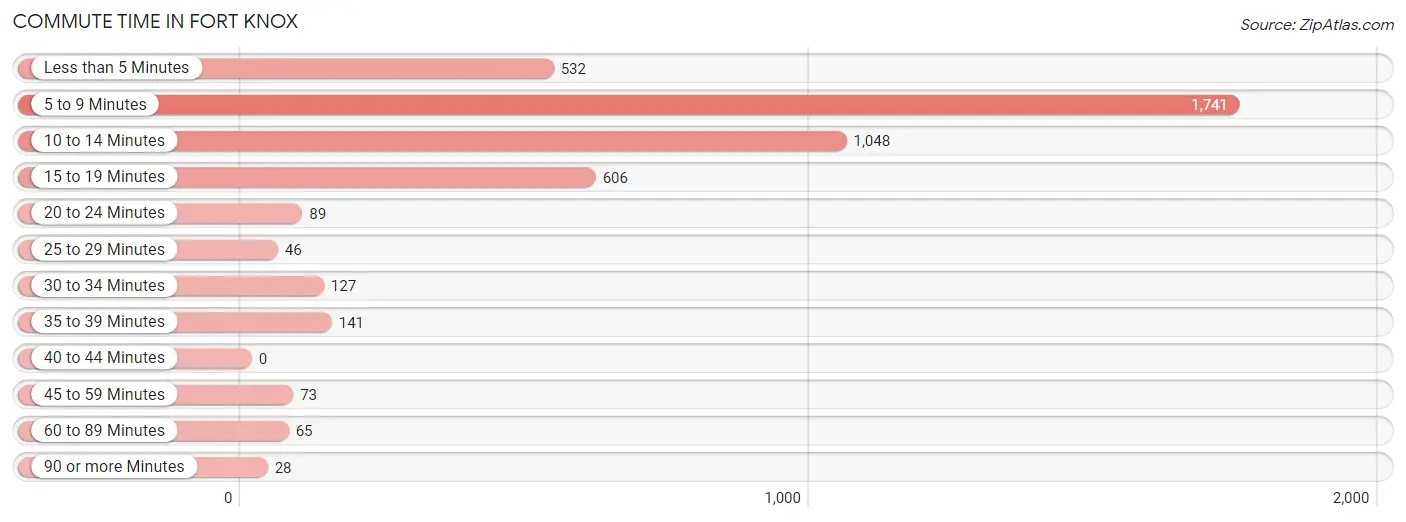
| Commute Time | # Commuters | % Commuters |
| Less than 5 Minutes | 532 | 11.8% |
| 5 to 9 Minutes | 1,741 | 38.7% |
| 10 to 14 Minutes | 1,048 | 23.3% |
| 15 to 19 Minutes | 606 | 13.5% |
| 20 to 24 Minutes | 89 | 2.0% |
| 25 to 29 Minutes | 46 | 1.0% |
| 30 to 34 Minutes | 127 | 2.8% |
| 35 to 39 Minutes | 141 | 3.1% |
| 40 to 44 Minutes | 0 | 0.0% |
| 45 to 59 Minutes | 73 | 1.6% |
| 60 to 89 Minutes | 65 | 1.5% |
| 90 or more Minutes | 28 | 0.6% |
Commute Time by Sex in Fort Knox
The most common commute times in Fort Knox are 5 to 9 minutes (1,387 commuters, 43.1%) for males and 5 to 9 minutes (354 commuters, 27.6%) for females.
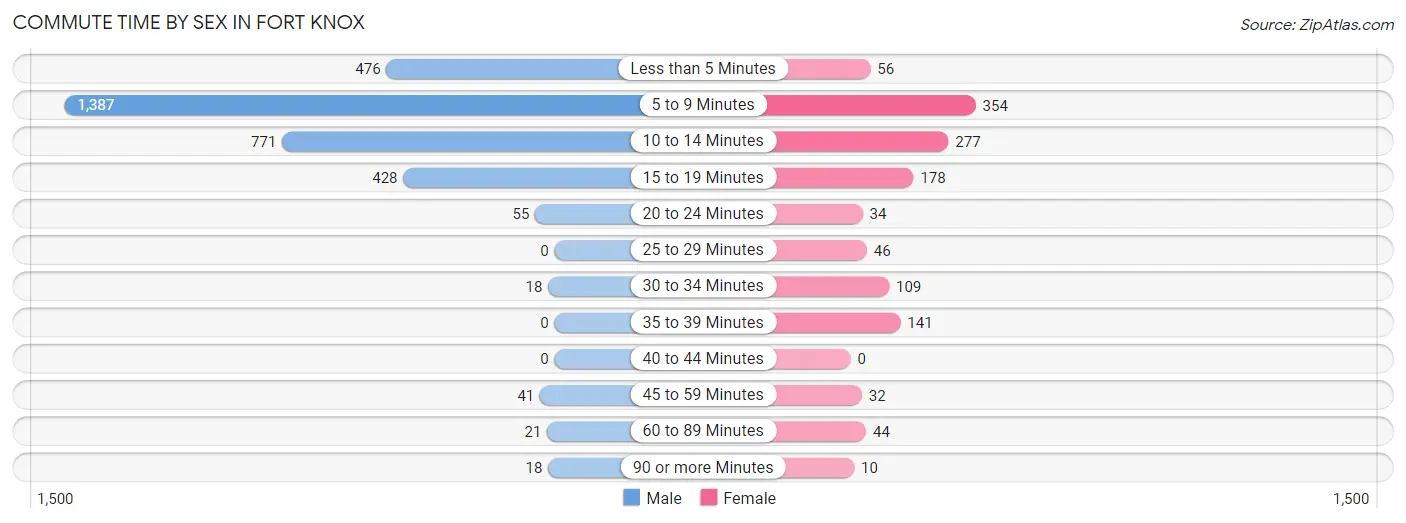
| Commute Time | Male | Female |
| Less than 5 Minutes | 476 (14.8%) | 56 (4.4%) |
| 5 to 9 Minutes | 1,387 (43.1%) | 354 (27.6%) |
| 10 to 14 Minutes | 771 (24.0%) | 277 (21.6%) |
| 15 to 19 Minutes | 428 (13.3%) | 178 (13.9%) |
| 20 to 24 Minutes | 55 (1.7%) | 34 (2.6%) |
| 25 to 29 Minutes | 0 (0.0%) | 46 (3.6%) |
| 30 to 34 Minutes | 18 (0.6%) | 109 (8.5%) |
| 35 to 39 Minutes | 0 (0.0%) | 141 (11.0%) |
| 40 to 44 Minutes | 0 (0.0%) | 0 (0.0%) |
| 45 to 59 Minutes | 41 (1.3%) | 32 (2.5%) |
| 60 to 89 Minutes | 21 (0.6%) | 44 (3.4%) |
| 90 or more Minutes | 18 (0.6%) | 10 (0.8%) |
Time of Departure to Work by Sex in Fort Knox
The most frequent times of departure to work in Fort Knox are 6:00 AM to 6:29 AM (683, 21.2%) for males and 7:30 AM to 7:59 AM (198, 15.5%) for females.
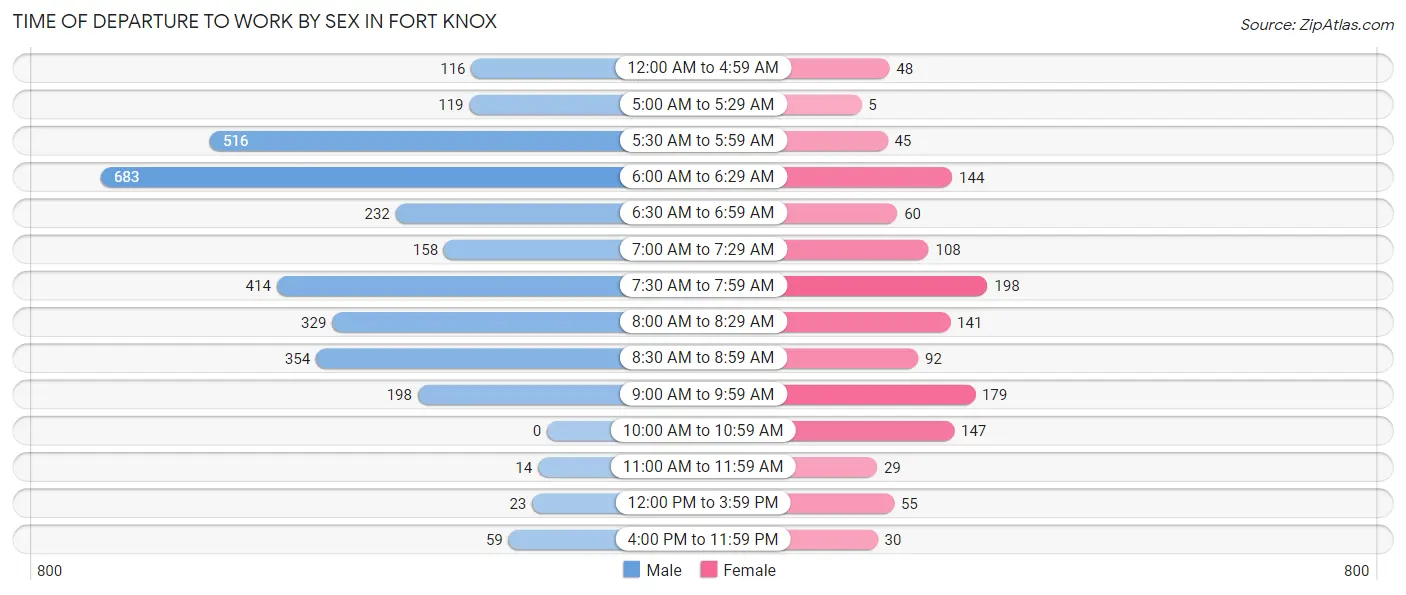
| Time of Departure | Male | Female |
| 12:00 AM to 4:59 AM | 116 (3.6%) | 48 (3.7%) |
| 5:00 AM to 5:29 AM | 119 (3.7%) | 5 (0.4%) |
| 5:30 AM to 5:59 AM | 516 (16.1%) | 45 (3.5%) |
| 6:00 AM to 6:29 AM | 683 (21.2%) | 144 (11.2%) |
| 6:30 AM to 6:59 AM | 232 (7.2%) | 60 (4.7%) |
| 7:00 AM to 7:29 AM | 158 (4.9%) | 108 (8.4%) |
| 7:30 AM to 7:59 AM | 414 (12.9%) | 198 (15.5%) |
| 8:00 AM to 8:29 AM | 329 (10.2%) | 141 (11.0%) |
| 8:30 AM to 8:59 AM | 354 (11.0%) | 92 (7.2%) |
| 9:00 AM to 9:59 AM | 198 (6.2%) | 179 (14.0%) |
| 10:00 AM to 10:59 AM | 0 (0.0%) | 147 (11.5%) |
| 11:00 AM to 11:59 AM | 14 (0.4%) | 29 (2.3%) |
| 12:00 PM to 3:59 PM | 23 (0.7%) | 55 (4.3%) |
| 4:00 PM to 11:59 PM | 59 (1.8%) | 30 (2.3%) |
| Total | 3,215 (100.0%) | 1,281 (100.0%) |
Housing Occupancy in Fort Knox
Occupancy by Ownership in Fort Knox
Of the total 2,288 dwellings in Fort Knox, owner-occupied units account for 15 (0.7%), while renter-occupied units make up 2,273 (99.3%).
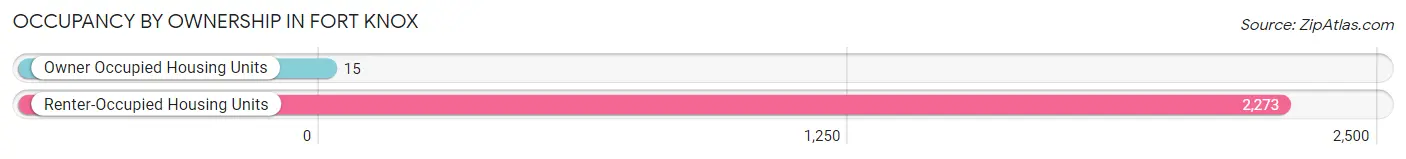
| Occupancy | # Housing Units | % Housing Units |
| Owner Occupied Housing Units | 15 | 0.7% |
| Renter-Occupied Housing Units | 2,273 | 99.3% |
| Total Occupied Housing Units | 2,288 | 100.0% |
Occupancy by Household Size in Fort Knox
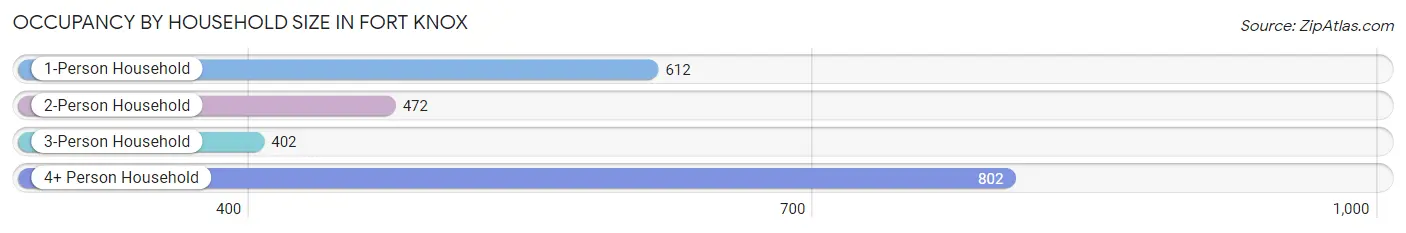
| Household Size | # Housing Units | % Housing Units |
| 1-Person Household | 612 | 26.8% |
| 2-Person Household | 472 | 20.6% |
| 3-Person Household | 402 | 17.6% |
| 4+ Person Household | 802 | 35.0% |
| Total Housing Units | 2,288 | 100.0% |
Occupancy by Ownership by Household Size in Fort Knox
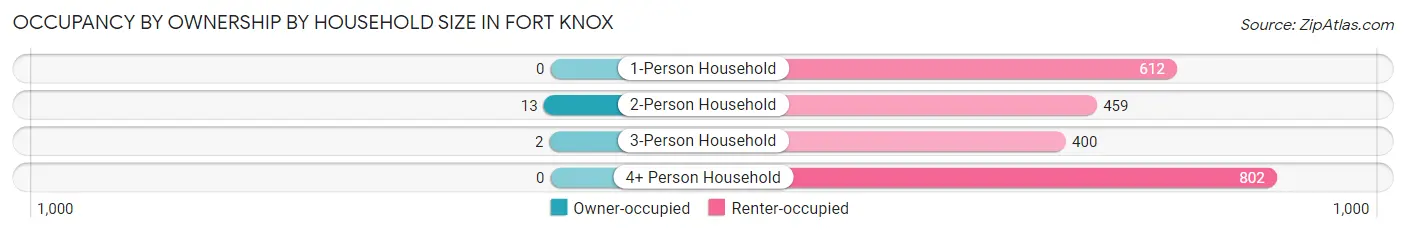
| Household Size | Owner-occupied | Renter-occupied |
| 1-Person Household | 0 (0.0%) | 612 (100.0%) |
| 2-Person Household | 13 (2.8%) | 459 (97.3%) |
| 3-Person Household | 2 (0.5%) | 400 (99.5%) |
| 4+ Person Household | 0 (0.0%) | 802 (100.0%) |
| Total Housing Units | 15 (0.7%) | 2,273 (99.3%) |
Occupancy by Educational Attainment in Fort Knox
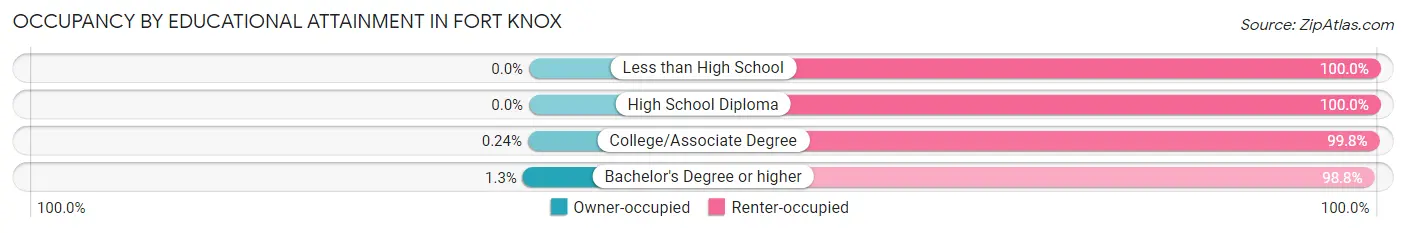
| Household Size | Owner-occupied | Renter-occupied |
| Less than High School | 0 (0.0%) | 54 (100.0%) |
| High School Diploma | 0 (0.0%) | 363 (100.0%) |
| College/Associate Degree | 2 (0.2%) | 832 (99.8%) |
| Bachelor's Degree or higher | 13 (1.3%) | 1,024 (98.8%) |
Occupancy by Age of Householder in Fort Knox
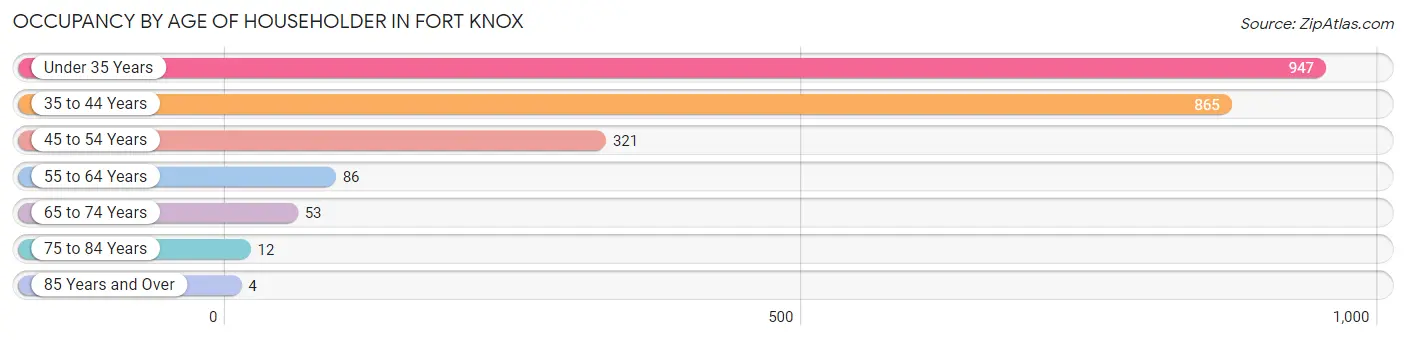
| Age Bracket | # Households | % Households |
| Under 35 Years | 947 | 41.4% |
| 35 to 44 Years | 865 | 37.8% |
| 45 to 54 Years | 321 | 14.0% |
| 55 to 64 Years | 86 | 3.8% |
| 65 to 74 Years | 53 | 2.3% |
| 75 to 84 Years | 12 | 0.5% |
| 85 Years and Over | 4 | 0.2% |
| Total | 2,288 | 100.0% |
Housing Finances in Fort Knox
Median Income by Occupancy in Fort Knox
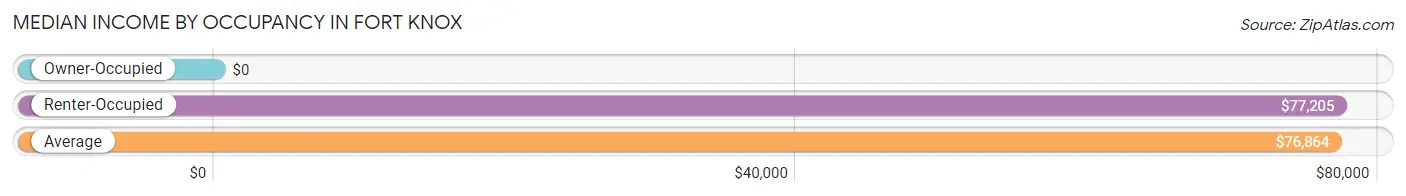
| Occupancy Type | # Households | Median Income |
| Owner-Occupied | 15 (0.7%) | $0 |
| Renter-Occupied | 2,273 (99.3%) | $77,205 |
| Average | 2,288 (100.0%) | $76,864 |
Occupancy by Householder Income Bracket in Fort Knox
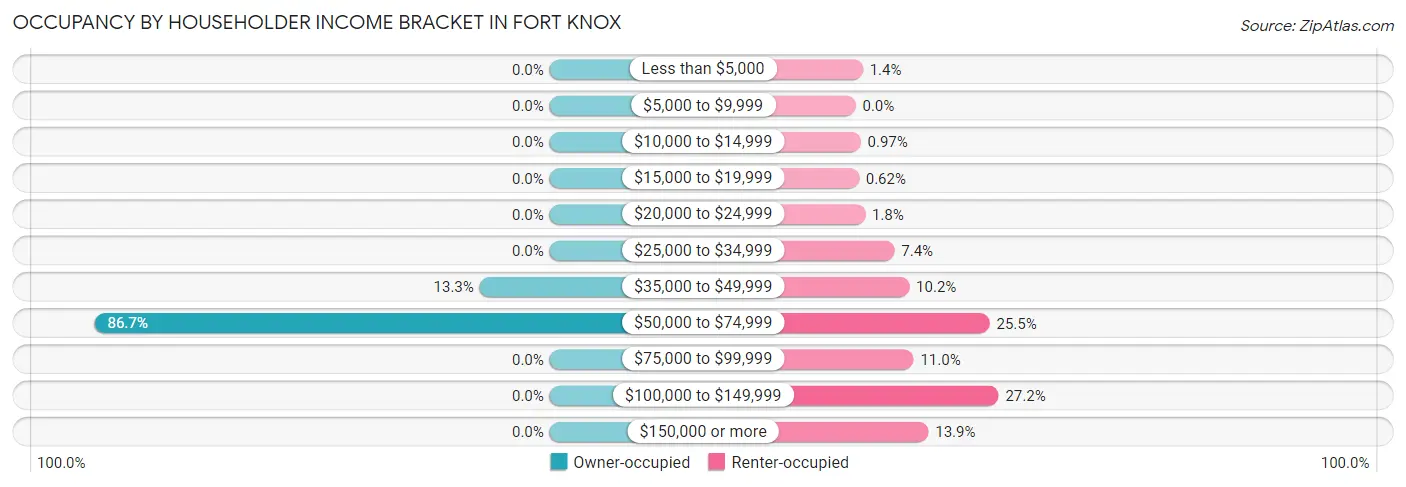
| Income Bracket | Owner-occupied | Renter-occupied |
| Less than $5,000 | 0 (0.0%) | 31 (1.4%) |
| $5,000 to $9,999 | 0 (0.0%) | 0 (0.0%) |
| $10,000 to $14,999 | 0 (0.0%) | 22 (1.0%) |
| $15,000 to $19,999 | 0 (0.0%) | 14 (0.6%) |
| $20,000 to $24,999 | 0 (0.0%) | 41 (1.8%) |
| $25,000 to $34,999 | 0 (0.0%) | 168 (7.4%) |
| $35,000 to $49,999 | 2 (13.3%) | 232 (10.2%) |
| $50,000 to $74,999 | 13 (86.7%) | 580 (25.5%) |
| $75,000 to $99,999 | 0 (0.0%) | 251 (11.0%) |
| $100,000 to $149,999 | 0 (0.0%) | 619 (27.2%) |
| $150,000 or more | 0 (0.0%) | 315 (13.9%) |
| Total | 15 (100.0%) | 2,273 (100.0%) |
Monthly Housing Cost Tiers in Fort Knox
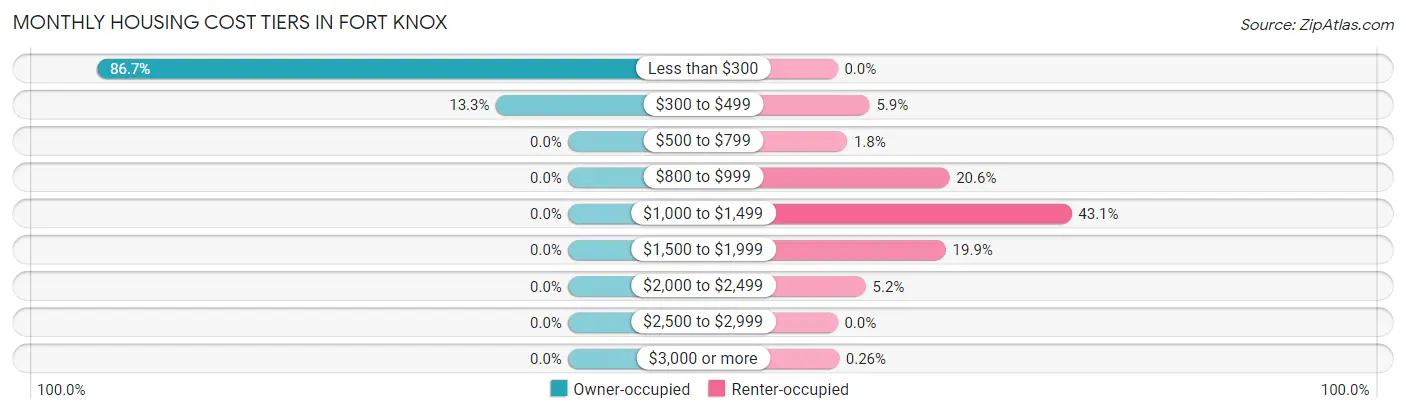
| Monthly Cost | Owner-occupied | Renter-occupied |
| Less than $300 | 13 (86.7%) | 0 (0.0%) |
| $300 to $499 | 2 (13.3%) | 134 (5.9%) |
| $500 to $799 | 0 (0.0%) | 40 (1.8%) |
| $800 to $999 | 0 (0.0%) | 468 (20.6%) |
| $1,000 to $1,499 | 0 (0.0%) | 979 (43.1%) |
| $1,500 to $1,999 | 0 (0.0%) | 453 (19.9%) |
| $2,000 to $2,499 | 0 (0.0%) | 118 (5.2%) |
| $2,500 to $2,999 | 0 (0.0%) | 0 (0.0%) |
| $3,000 or more | 0 (0.0%) | 6 (0.3%) |
| Total | 15 (100.0%) | 2,273 (100.0%) |
Physical Housing Characteristics in Fort Knox
Housing Structures in Fort Knox
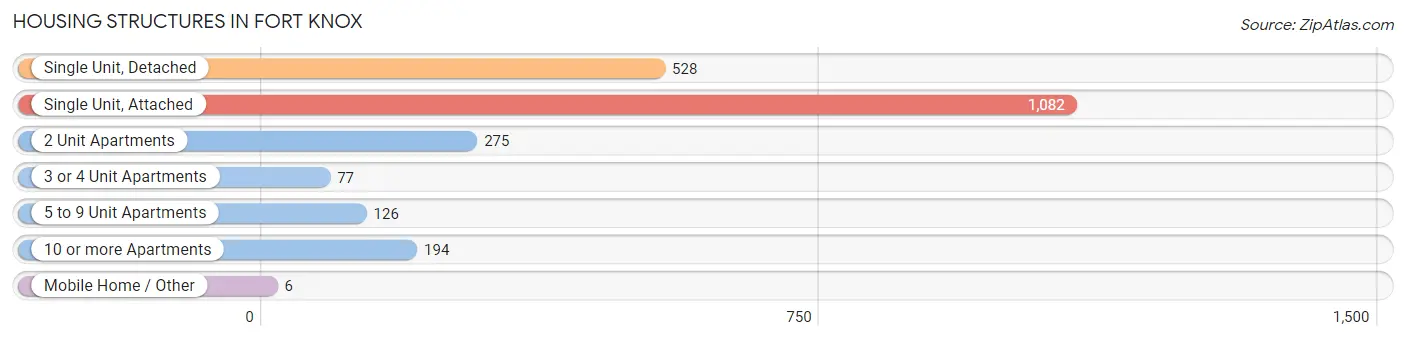
| Structure Type | # Housing Units | % Housing Units |
| Single Unit, Detached | 528 | 23.1% |
| Single Unit, Attached | 1,082 | 47.3% |
| 2 Unit Apartments | 275 | 12.0% |
| 3 or 4 Unit Apartments | 77 | 3.4% |
| 5 to 9 Unit Apartments | 126 | 5.5% |
| 10 or more Apartments | 194 | 8.5% |
| Mobile Home / Other | 6 | 0.3% |
| Total | 2,288 | 100.0% |
Housing Structures by Occupancy in Fort Knox
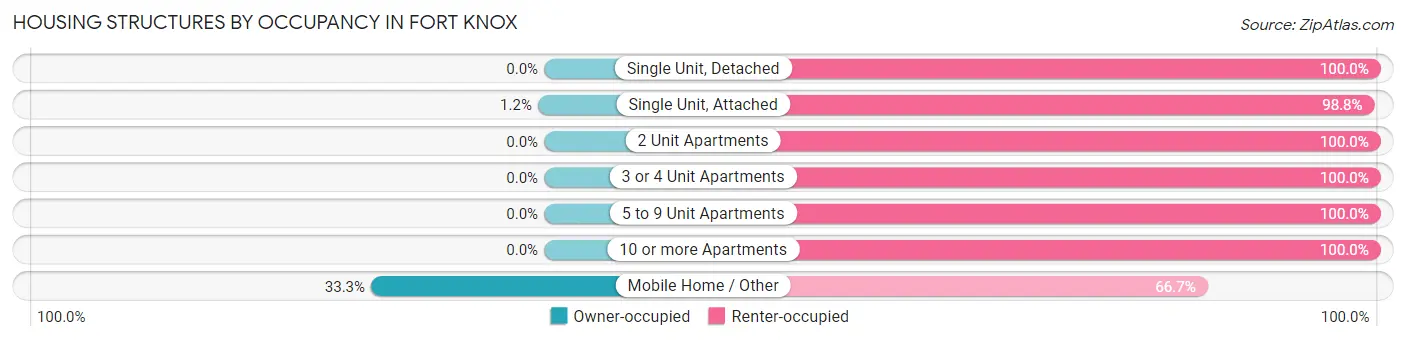
| Structure Type | Owner-occupied | Renter-occupied |
| Single Unit, Detached | 0 (0.0%) | 528 (100.0%) |
| Single Unit, Attached | 13 (1.2%) | 1,069 (98.8%) |
| 2 Unit Apartments | 0 (0.0%) | 275 (100.0%) |
| 3 or 4 Unit Apartments | 0 (0.0%) | 77 (100.0%) |
| 5 to 9 Unit Apartments | 0 (0.0%) | 126 (100.0%) |
| 10 or more Apartments | 0 (0.0%) | 194 (100.0%) |
| Mobile Home / Other | 2 (33.3%) | 4 (66.7%) |
| Total | 15 (0.7%) | 2,273 (99.3%) |
Housing Structures by Number of Rooms in Fort Knox
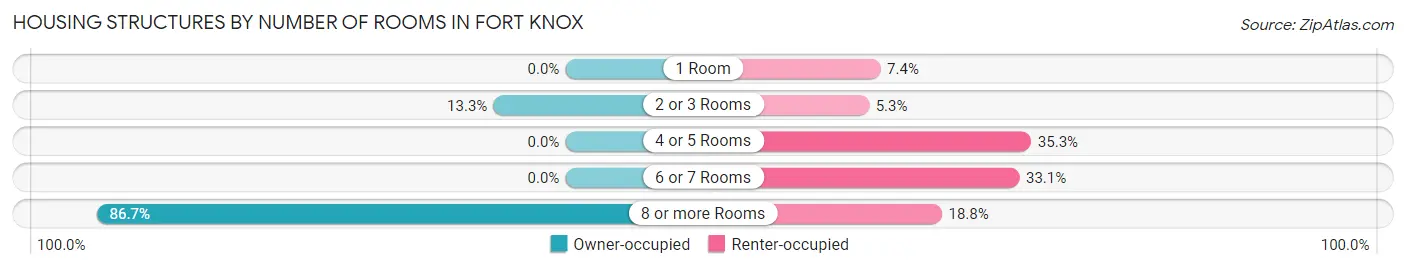
| Number of Rooms | Owner-occupied | Renter-occupied |
| 1 Room | 0 (0.0%) | 169 (7.4%) |
| 2 or 3 Rooms | 2 (13.3%) | 121 (5.3%) |
| 4 or 5 Rooms | 0 (0.0%) | 803 (35.3%) |
| 6 or 7 Rooms | 0 (0.0%) | 753 (33.1%) |
| 8 or more Rooms | 13 (86.7%) | 427 (18.8%) |
| Total | 15 (100.0%) | 2,273 (100.0%) |
Housing Structure by Heating Type in Fort Knox
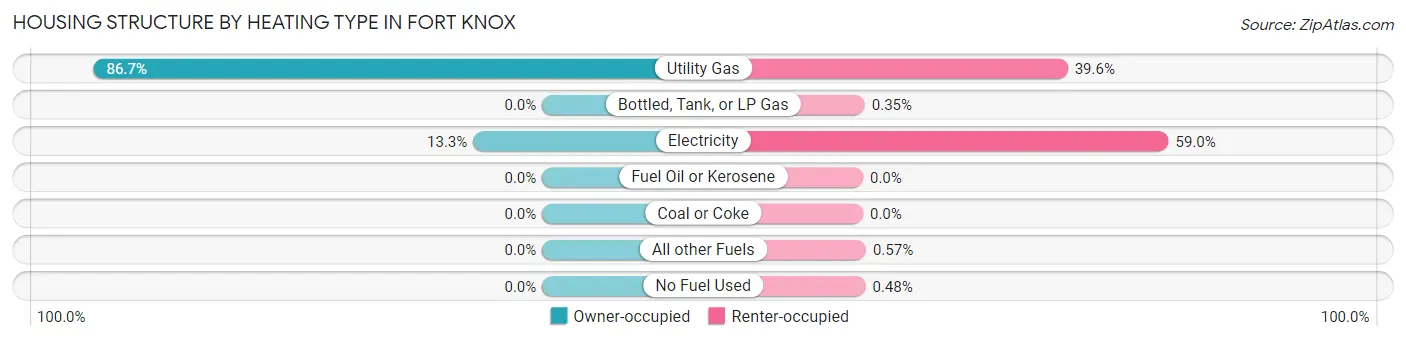
| Heating Type | Owner-occupied | Renter-occupied |
| Utility Gas | 13 (86.7%) | 899 (39.6%) |
| Bottled, Tank, or LP Gas | 0 (0.0%) | 8 (0.4%) |
| Electricity | 2 (13.3%) | 1,342 (59.0%) |
| Fuel Oil or Kerosene | 0 (0.0%) | 0 (0.0%) |
| Coal or Coke | 0 (0.0%) | 0 (0.0%) |
| All other Fuels | 0 (0.0%) | 13 (0.6%) |
| No Fuel Used | 0 (0.0%) | 11 (0.5%) |
| Total | 15 (100.0%) | 2,273 (100.0%) |
Household Vehicle Usage in Fort Knox
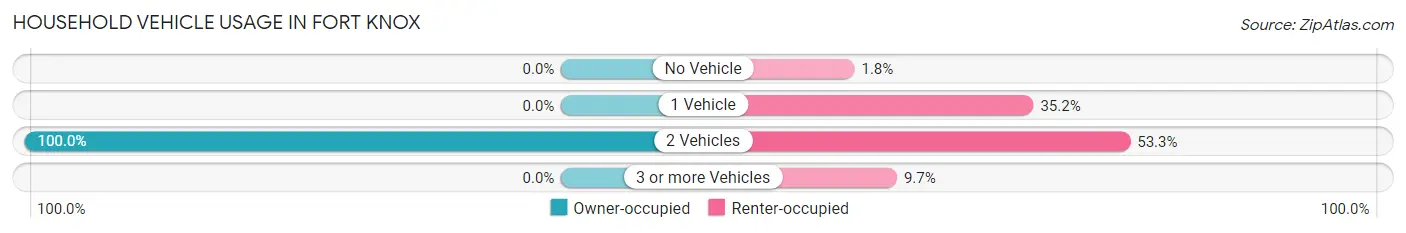
| Vehicles per Household | Owner-occupied | Renter-occupied |
| No Vehicle | 0 (0.0%) | 41 (1.8%) |
| 1 Vehicle | 0 (0.0%) | 800 (35.2%) |
| 2 Vehicles | 15 (100.0%) | 1,211 (53.3%) |
| 3 or more Vehicles | 0 (0.0%) | 221 (9.7%) |
| Total | 15 (100.0%) | 2,273 (100.0%) |
Real Estate & Mortgages in Fort Knox
Real Estate and Mortgage Overview in Fort Knox
| Characteristic | Without Mortgage | With Mortgage |
| Housing Units | 15 | 0 |
| Median Property Value | - | - |
| Median Household Income | - | - |
| Monthly Housing Costs | - | - |
| Real Estate Taxes | - | - |
Property Value by Mortgage Status in Fort Knox
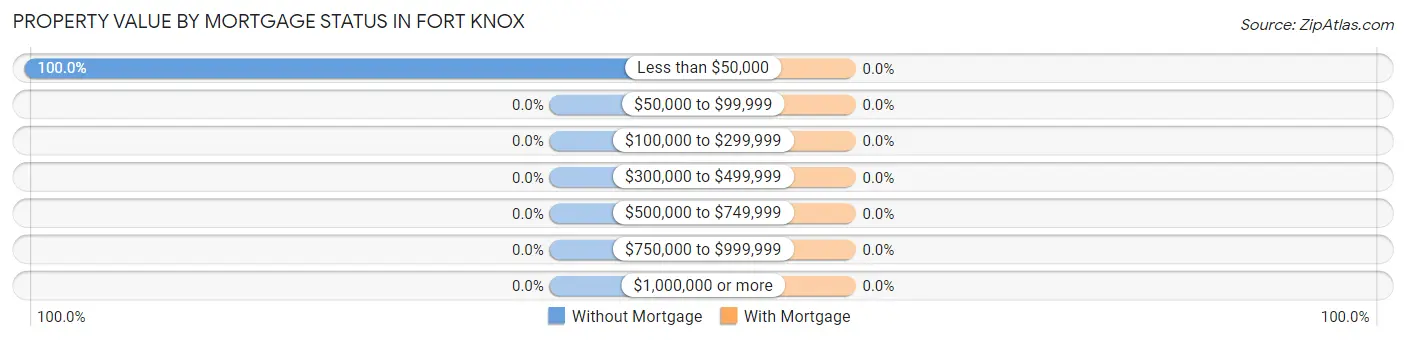
| Property Value | Without Mortgage | With Mortgage |
| Less than $50,000 | 15 (100.0%) | 0 (0.0%) |
| $50,000 to $99,999 | 0 (0.0%) | 0 (0.0%) |
| $100,000 to $299,999 | 0 (0.0%) | 0 (0.0%) |
| $300,000 to $499,999 | 0 (0.0%) | 0 (0.0%) |
| $500,000 to $749,999 | 0 (0.0%) | 0 (0.0%) |
| $750,000 to $999,999 | 0 (0.0%) | 0 (0.0%) |
| $1,000,000 or more | 0 (0.0%) | 0 (0.0%) |
| Total | 15 (100.0%) | 0 (0.0%) |
Household Income by Mortgage Status in Fort Knox
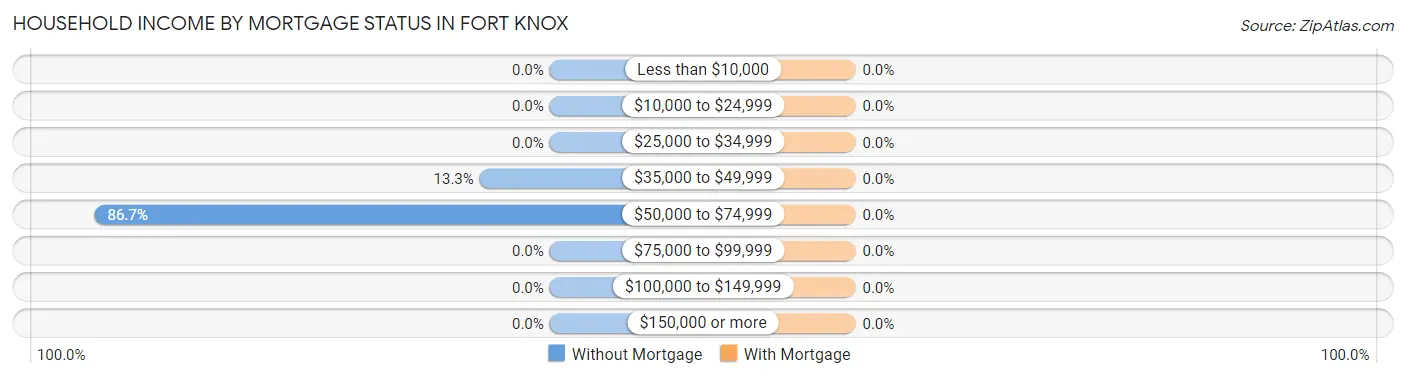
| Household Income | Without Mortgage | With Mortgage |
| Less than $10,000 | 0 (0.0%) | 0 (0.0%) |
| $10,000 to $24,999 | 0 (0.0%) | 0 (0.0%) |
| $25,000 to $34,999 | 0 (0.0%) | 0 (0.0%) |
| $35,000 to $49,999 | 2 (13.3%) | 0 (0.0%) |
| $50,000 to $74,999 | 13 (86.7%) | 0 (0.0%) |
| $75,000 to $99,999 | 0 (0.0%) | 0 (0.0%) |
| $100,000 to $149,999 | 0 (0.0%) | 0 (0.0%) |
| $150,000 or more | 0 (0.0%) | 0 (0.0%) |
| Total | 15 (100.0%) | 0 (0.0%) |
Property Value to Household Income Ratio in Fort Knox
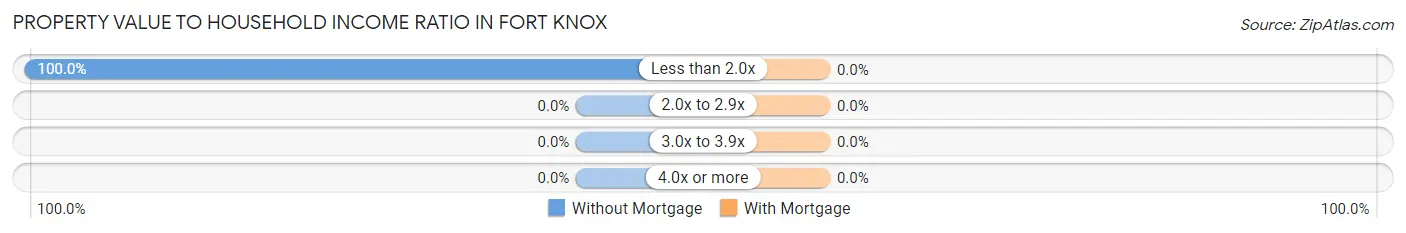
| Value-to-Income Ratio | Without Mortgage | With Mortgage |
| Less than 2.0x | 15 (100.0%) | 0 (0.0%) |
| 2.0x to 2.9x | 0 (0.0%) | 0 (0.0%) |
| 3.0x to 3.9x | 0 (0.0%) | 0 (0.0%) |
| 4.0x or more | 0 (0.0%) | 0 (0.0%) |
| Total | 15 (100.0%) | 0 (0.0%) |
Real Estate Taxes by Mortgage Status in Fort Knox
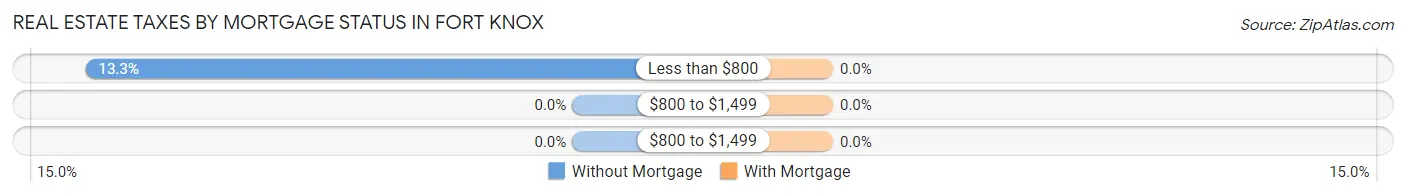
| Property Taxes | Without Mortgage | With Mortgage |
| Less than $800 | 2 (13.3%) | 0 (0.0%) |
| $800 to $1,499 | 0 (0.0%) | 0 (0.0%) |
| $800 to $1,499 | 0 (0.0%) | 0 (0.0%) |
| Total | 15 (100.0%) | 0 (0.0%) |
Health & Disability in Fort Knox
Health Insurance Coverage by Age in Fort Knox
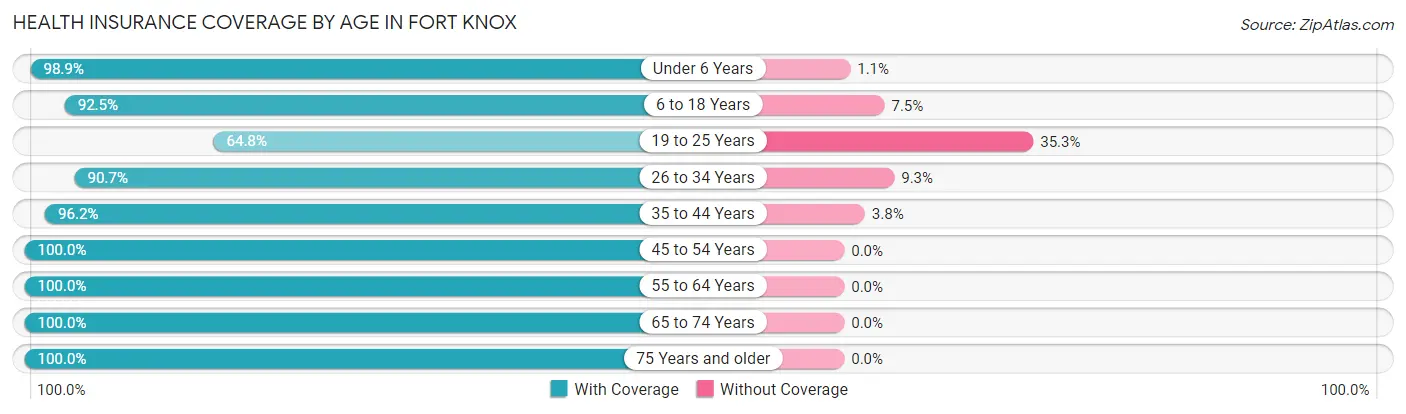
| Age Bracket | With Coverage | Without Coverage |
| Under 6 Years | 1,062 (98.9%) | 12 (1.1%) |
| 6 to 18 Years | 1,566 (92.5%) | 127 (7.5%) |
| 19 to 25 Years | 270 (64.7%) | 147 (35.2%) |
| 26 to 34 Years | 769 (90.7%) | 79 (9.3%) |
| 35 to 44 Years | 827 (96.2%) | 33 (3.8%) |
| 45 to 54 Years | 319 (100.0%) | 0 (0.0%) |
| 55 to 64 Years | 138 (100.0%) | 0 (0.0%) |
| 65 to 74 Years | 80 (100.0%) | 0 (0.0%) |
| 75 Years and older | 45 (100.0%) | 0 (0.0%) |
| Total | 5,076 (92.7%) | 398 (7.3%) |
Health Insurance Coverage by Citizenship Status in Fort Knox
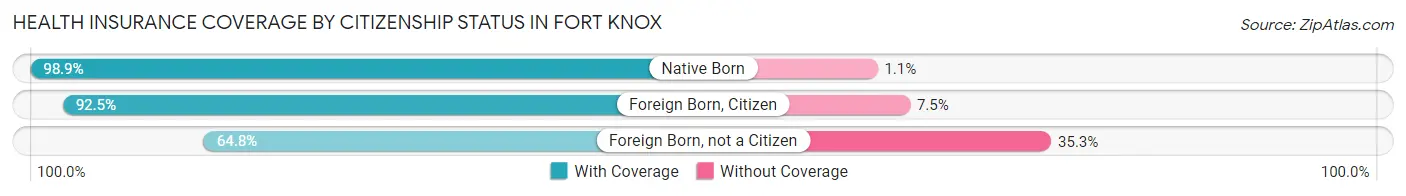
| Citizenship Status | With Coverage | Without Coverage |
| Native Born | 1,062 (98.9%) | 12 (1.1%) |
| Foreign Born, Citizen | 1,566 (92.5%) | 127 (7.5%) |
| Foreign Born, not a Citizen | 270 (64.7%) | 147 (35.2%) |
Health Insurance Coverage by Household Income in Fort Knox
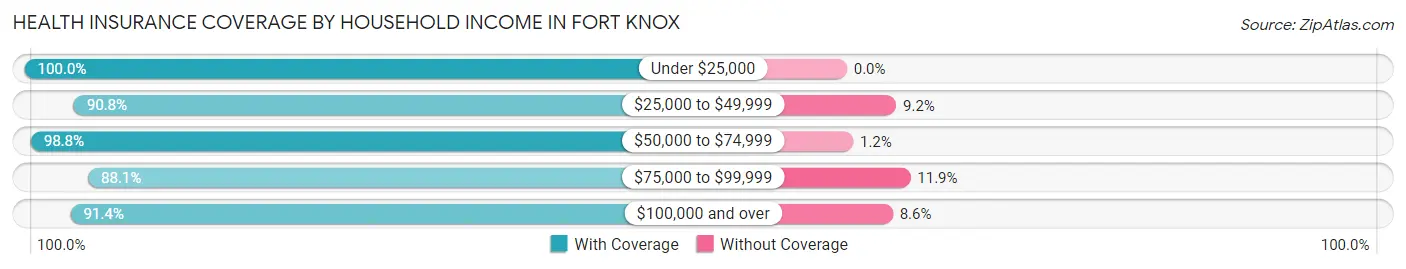
| Household Income | With Coverage | Without Coverage |
| Under $25,000 | 230 (100.0%) | 0 (0.0%) |
| $25,000 to $49,999 | 688 (90.8%) | 70 (9.2%) |
| $50,000 to $74,999 | 1,014 (98.8%) | 12 (1.2%) |
| $75,000 to $99,999 | 488 (88.1%) | 66 (11.9%) |
| $100,000 and over | 2,656 (91.4%) | 250 (8.6%) |
Public vs Private Health Insurance Coverage by Age in Fort Knox
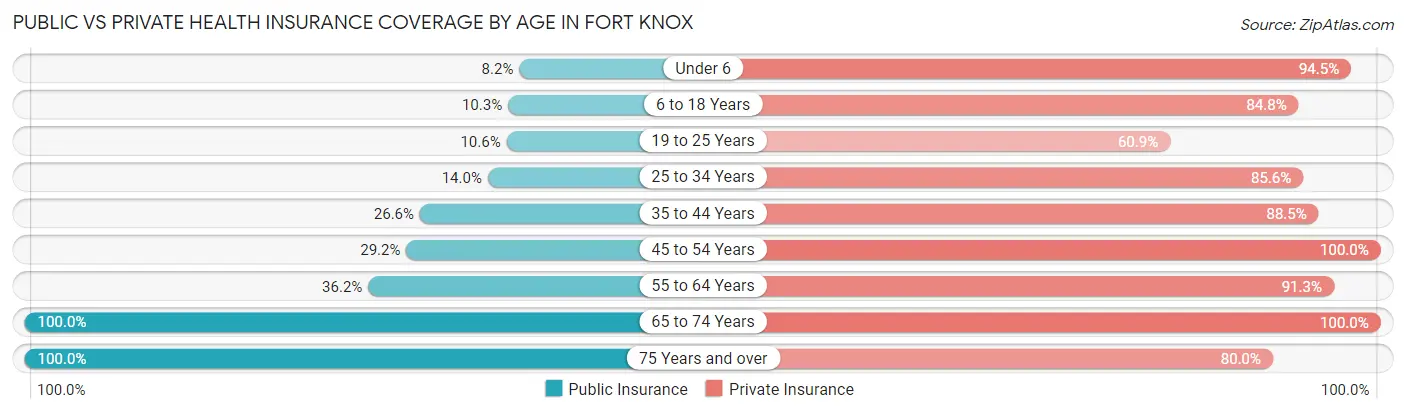
| Age Bracket | Public Insurance | Private Insurance |
| Under 6 | 88 (8.2%) | 1,015 (94.5%) |
| 6 to 18 Years | 174 (10.3%) | 1,435 (84.8%) |
| 19 to 25 Years | 44 (10.5%) | 254 (60.9%) |
| 25 to 34 Years | 119 (14.0%) | 726 (85.6%) |
| 35 to 44 Years | 229 (26.6%) | 761 (88.5%) |
| 45 to 54 Years | 93 (29.1%) | 319 (100.0%) |
| 55 to 64 Years | 50 (36.2%) | 126 (91.3%) |
| 65 to 74 Years | 80 (100.0%) | 80 (100.0%) |
| 75 Years and over | 45 (100.0%) | 36 (80.0%) |
| Total | 922 (16.8%) | 4,752 (86.8%) |
Disability Status by Sex by Age in Fort Knox
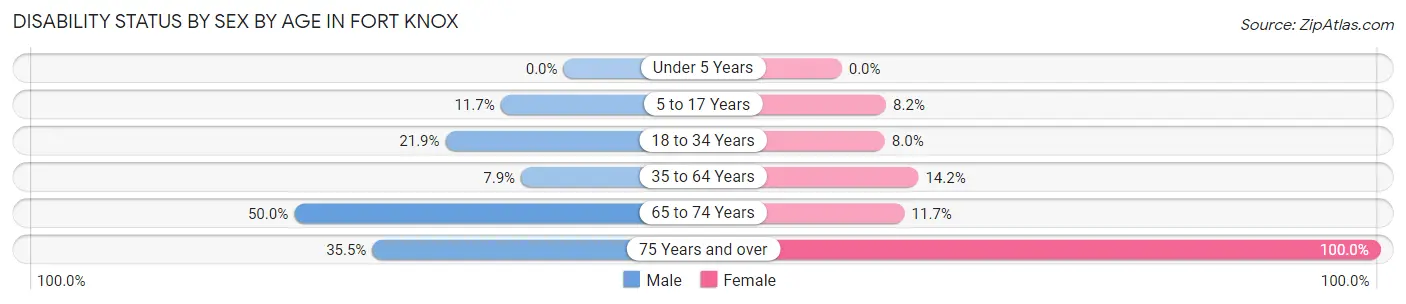
| Age Bracket | Male | Female |
| Under 5 Years | 0 (0.0%) | 0 (0.0%) |
| 5 to 17 Years | 91 (11.7%) | 76 (8.2%) |
| 18 to 34 Years | 83 (21.9%) | 77 (8.0%) |
| 35 to 64 Years | 29 (7.9%) | 135 (14.2%) |
| 65 to 74 Years | 10 (50.0%) | 7 (11.7%) |
| 75 Years and over | 11 (35.5%) | 14 (100.0%) |
Disability Class by Sex by Age in Fort Knox
Disability Class: Hearing Difficulty
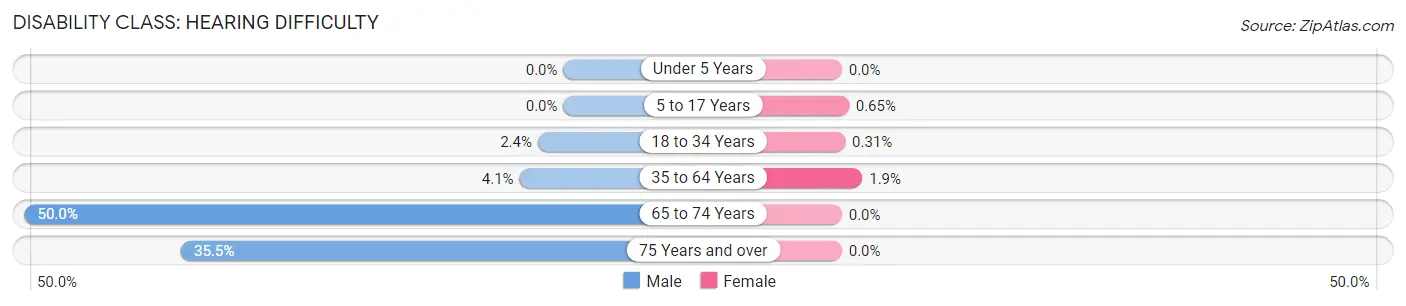
| Age Bracket | Male | Female |
| Under 5 Years | 0 (0.0%) | 0 (0.0%) |
| 5 to 17 Years | 0 (0.0%) | 6 (0.6%) |
| 18 to 34 Years | 9 (2.4%) | 3 (0.3%) |
| 35 to 64 Years | 15 (4.1%) | 18 (1.9%) |
| 65 to 74 Years | 10 (50.0%) | 0 (0.0%) |
| 75 Years and over | 11 (35.5%) | 0 (0.0%) |
Disability Class: Vision Difficulty
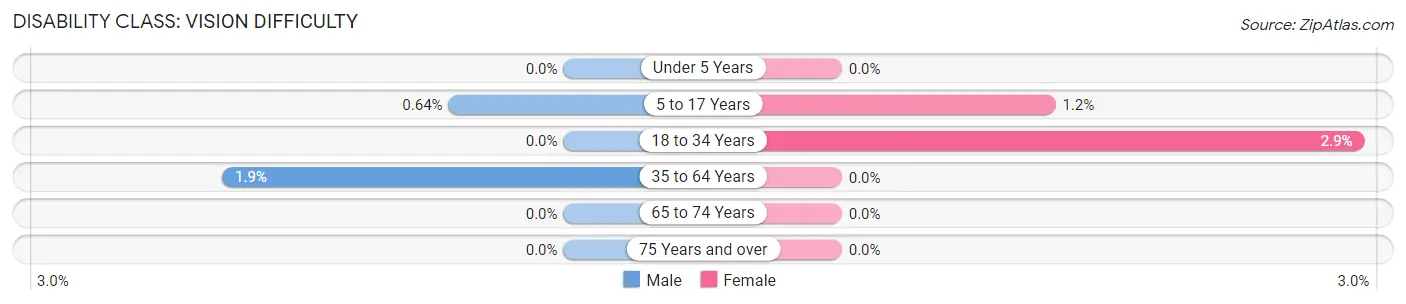
| Age Bracket | Male | Female |
| Under 5 Years | 0 (0.0%) | 0 (0.0%) |
| 5 to 17 Years | 5 (0.6%) | 11 (1.2%) |
| 18 to 34 Years | 0 (0.0%) | 28 (2.9%) |
| 35 to 64 Years | 7 (1.9%) | 0 (0.0%) |
| 65 to 74 Years | 0 (0.0%) | 0 (0.0%) |
| 75 Years and over | 0 (0.0%) | 0 (0.0%) |
Disability Class: Cognitive Difficulty
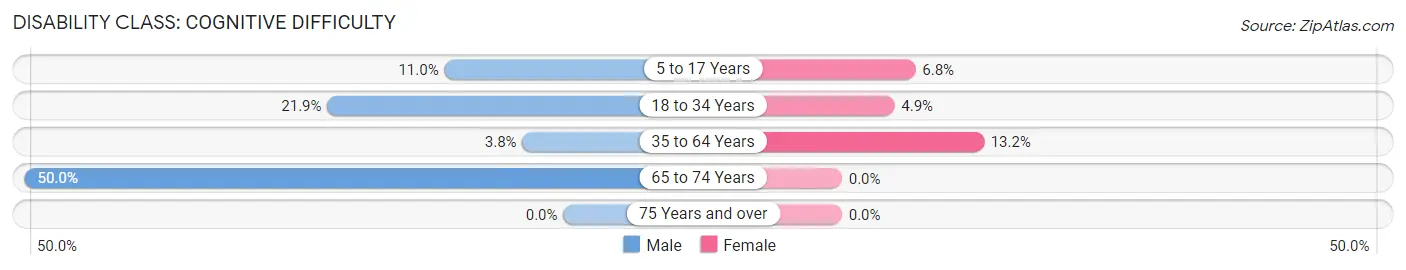
| Age Bracket | Male | Female |
| 5 to 17 Years | 86 (11.0%) | 63 (6.8%) |
| 18 to 34 Years | 83 (21.9%) | 47 (4.9%) |
| 35 to 64 Years | 14 (3.8%) | 125 (13.2%) |
| 65 to 74 Years | 10 (50.0%) | 0 (0.0%) |
| 75 Years and over | 0 (0.0%) | 0 (0.0%) |
Disability Class: Ambulatory Difficulty
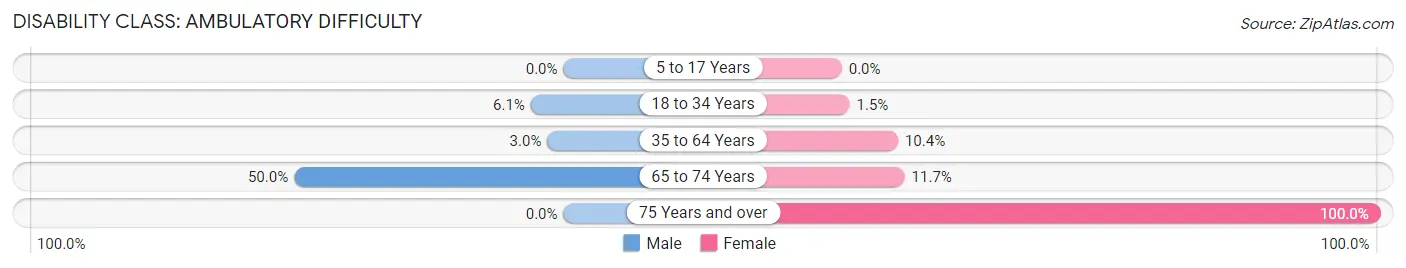
| Age Bracket | Male | Female |
| 5 to 17 Years | 0 (0.0%) | 0 (0.0%) |
| 18 to 34 Years | 23 (6.1%) | 14 (1.5%) |
| 35 to 64 Years | 11 (3.0%) | 99 (10.4%) |
| 65 to 74 Years | 10 (50.0%) | 7 (11.7%) |
| 75 Years and over | 0 (0.0%) | 14 (100.0%) |
Disability Class: Self-Care Difficulty
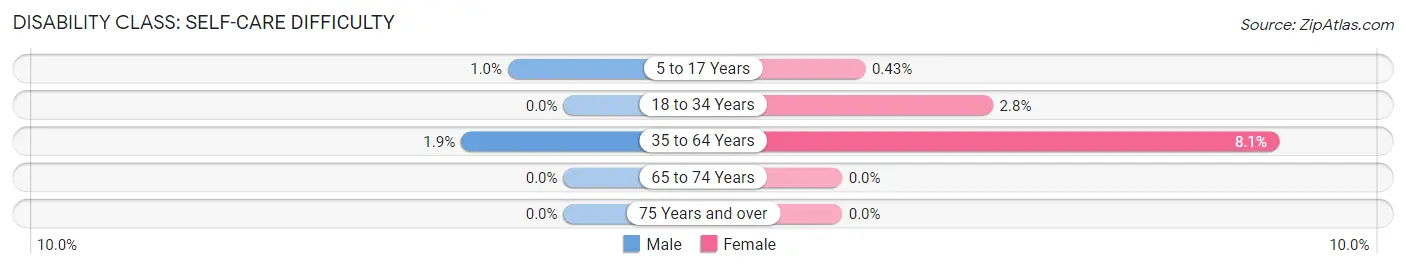
| Age Bracket | Male | Female |
| 5 to 17 Years | 8 (1.0%) | 4 (0.4%) |
| 18 to 34 Years | 0 (0.0%) | 27 (2.8%) |
| 35 to 64 Years | 7 (1.9%) | 77 (8.1%) |
| 65 to 74 Years | 0 (0.0%) | 0 (0.0%) |
| 75 Years and over | 0 (0.0%) | 0 (0.0%) |
Technology Access in Fort Knox
Computing Device Access in Fort Knox
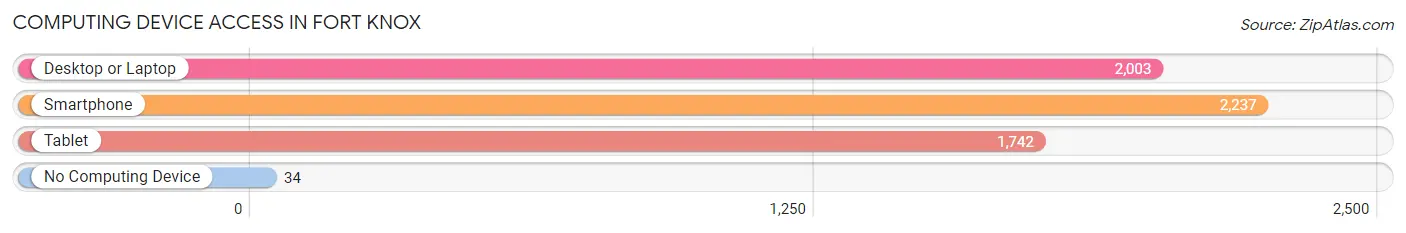
| Device Type | # Households | % Households |
| Desktop or Laptop | 2,003 | 87.5% |
| Smartphone | 2,237 | 97.8% |
| Tablet | 1,742 | 76.1% |
| No Computing Device | 34 | 1.5% |
| Total | 2,288 | 100.0% |
Internet Access in Fort Knox
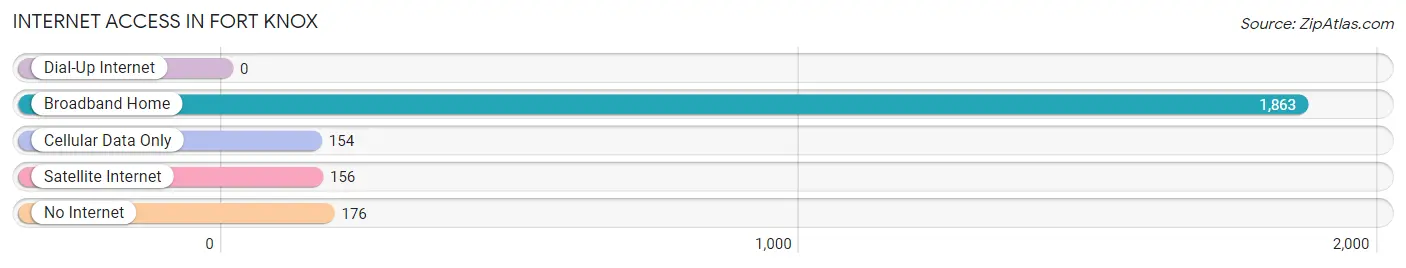
| Internet Type | # Households | % Households |
| Dial-Up Internet | 0 | 0.0% |
| Broadband Home | 1,863 | 81.4% |
| Cellular Data Only | 154 | 6.7% |
| Satellite Internet | 156 | 6.8% |
| No Internet | 176 | 7.7% |
| Total | 2,288 | 100.0% |
Fort Knox Summary
Fort Knox is a United States Army post located in Kentucky, near the city of Louisville. It is the home of the United States Army Human Resources Command, the United States Army Armor Center, and the United States Army Armor School. It is also the site of the United States Bullion Depository, which is the repository for the United States' gold reserves.
History
Fort Knox was established in 1918 as a United States Army post. It was named after Major General Henry Knox, who was the first Secretary of War under the United States Constitution. The post was originally used as a training center for the United States Army during World War I. After the war, the post was used as a demobilization center for returning soldiers.
In 1933, the United States Bullion Depository was established at Fort Knox. The depository was used to store the United States' gold reserves, and it is still in use today.
In 1940, the post was used as a training center for the United States Army during World War II. After the war, the post was used as a demobilization center for returning soldiers.
In 1950, the post was used as a training center for the United States Army during the Korean War. After the war, the post was used as a demobilization center for returning soldiers.
In the 1960s, the post was used as a training center for the United States Army during the Vietnam War. After the war, the post was used as a demobilization center for returning soldiers.
In the 1970s, the post was used as a training center for the United States Army during the Cold War. After the Cold War, the post was used as a demobilization center for returning soldiers.
Geography
Fort Knox is located in Hardin County, Kentucky, near the city of Louisville. It is situated on the north side of the Ohio River, and is approximately 40 miles south of Cincinnati, Ohio. The post is located in a rural area, and is surrounded by rolling hills and farmland.
Economy
Fort Knox is home to the United States Army Human Resources Command, the United States Army Armor Center, and the United States Army Armor School. These organizations provide employment opportunities for military personnel and civilians.
The post is also home to the United States Bullion Depository, which is the repository for the United States' gold reserves. The depository provides employment opportunities for security personnel.
Demographics
As of the 2010 census, the population of Fort Knox was 9,721. The racial makeup of the post was 79.3% White, 11.2% African American, 0.7% Native American, 2.2% Asian, 0.1% Pacific Islander, 4.2% from other races, and 2.5% from two or more races. Hispanic or Latino of any race were 8.2% of the population.
The median household income at Fort Knox was $45,845, and the median family income was $50,845. The per capita income at Fort Knox was $20,845. About 4.2% of families and 5.2% of the population were below the poverty line, including 6.2% of those under age 18 and 4.2% of those age 65 or over.
Common Questions
What is Per Capita Income in Fort Knox?
Per Capita income in Fort Knox is $31,450.
What is the Median Family Income in Fort Knox?
Median Family Income in Fort Knox is $84,063.
What is the Median Household income in Fort Knox?
Median Household Income in Fort Knox is $76,864.
What is Income or Wage Gap in Fort Knox?
Income or Wage Gap in Fort Knox is 0.5%.
Women in Fort Knox earn 99.5 cents for every dollar earned by a man.
What is Family Income Deficit in Fort Knox?
Family Income Deficit in Fort Knox is $17,264.
Families that are below poverty line in Fort Knox earn $17,264 less on average than the poverty threshold level.
What is Inequality or Gini Index in Fort Knox?
Inequality or Gini Index in Fort Knox is 0.33.
What is the Total Population of Fort Knox?
Total Population of Fort Knox is 8,655.
What is the Total Male Population of Fort Knox?
Total Male Population of Fort Knox is 4,794.
What is the Total Female Population of Fort Knox?
Total Female Population of Fort Knox is 3,861.
What is the Ratio of Males per 100 Females in Fort Knox?
There are 124.16 Males per 100 Females in Fort Knox.
What is the Ratio of Females per 100 Males in Fort Knox?
There are 80.54 Females per 100 Males in Fort Knox.
What is the Median Population Age in Fort Knox?
Median Population Age in Fort Knox is 24.7 Years.
What is the Average Family Size in Fort Knox
Average Family Size in Fort Knox is 3.9 People.
What is the Average Household Size in Fort Knox
Average Household Size in Fort Knox is 3.1 People.
How Large is the Labor Force in Fort Knox?
There are 4,881 People in the Labor Forcein in Fort Knox.
What is the Percentage of People in the Labor Force in Fort Knox?
79.5% of People are in the Labor Force in Fort Knox.
What is the Unemployment Rate in Fort Knox?
Unemployment Rate in Fort Knox is 8.8%.