Bull Creek, MO Map & Demographics
Bull Creek Map
Bull Creek Overview
$12,044
PER CAPITA INCOME
$35,625
AVG FAMILY INCOME
$29,881
AVG HOUSEHOLD INCOME
20.9%
WAGE / INCOME GAP [ % ]
79.1¢/ $1
WAGE / INCOME GAP [ $ ]
0.33
INEQUALITY / GINI INDEX
567
TOTAL POPULATION
245
MALE POPULATION
322
FEMALE POPULATION
76.09
MALES / 100 FEMALES
131.43
FEMALES / 100 MALES
25.4
MEDIAN AGE
3.6
AVG FAMILY SIZE
3.0
AVG HOUSEHOLD SIZE
233
LABOR FORCE [ PEOPLE ]
66.0%
PERCENT IN LABOR FORCE
5.2%
UNEMPLOYMENT RATE
Income in Bull Creek
Income Overview in Bull Creek
Per Capita Income in Bull Creek is $12,044, while median incomes of families and households are $35,625 and $29,881 respectively.
| Characteristic | Number | Measure |
| Per Capita Income | 567 | $12,044 |
| Median Family Income | 138 | $35,625 |
| Mean Family Income | 138 | $40,488 |
| Median Household Income | 188 | $29,881 |
| Mean Household Income | 188 | $36,377 |
| Income Deficit | 138 | $0 |
| Wage / Income Gap (%) | 567 | 20.87% |
| Wage / Income Gap ($) | 567 | 79.13¢ per $1 |
| Gini / Inequality Index | 567 | 0.33 |
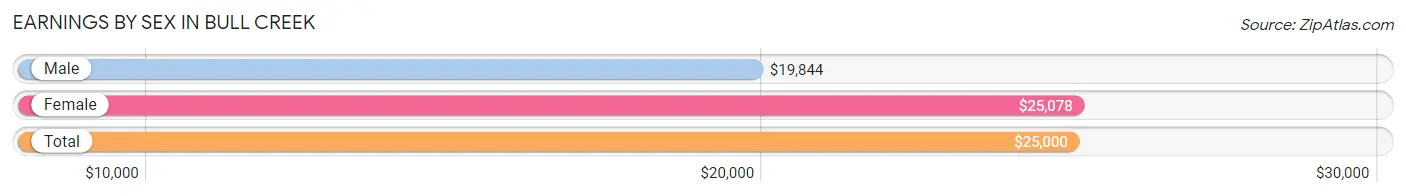
Earnings by Sex in Bull Creek
Average Earnings in Bull Creek are $25,000, $19,844 for men and $25,078 for women, a difference of 20.9%.
| Sex | Number | Average Earnings |
| Male | 110 (47.4%) | $19,844 |
| Female | 122 (52.6%) | $25,078 |
| Total | 232 (100.0%) | $25,000 |
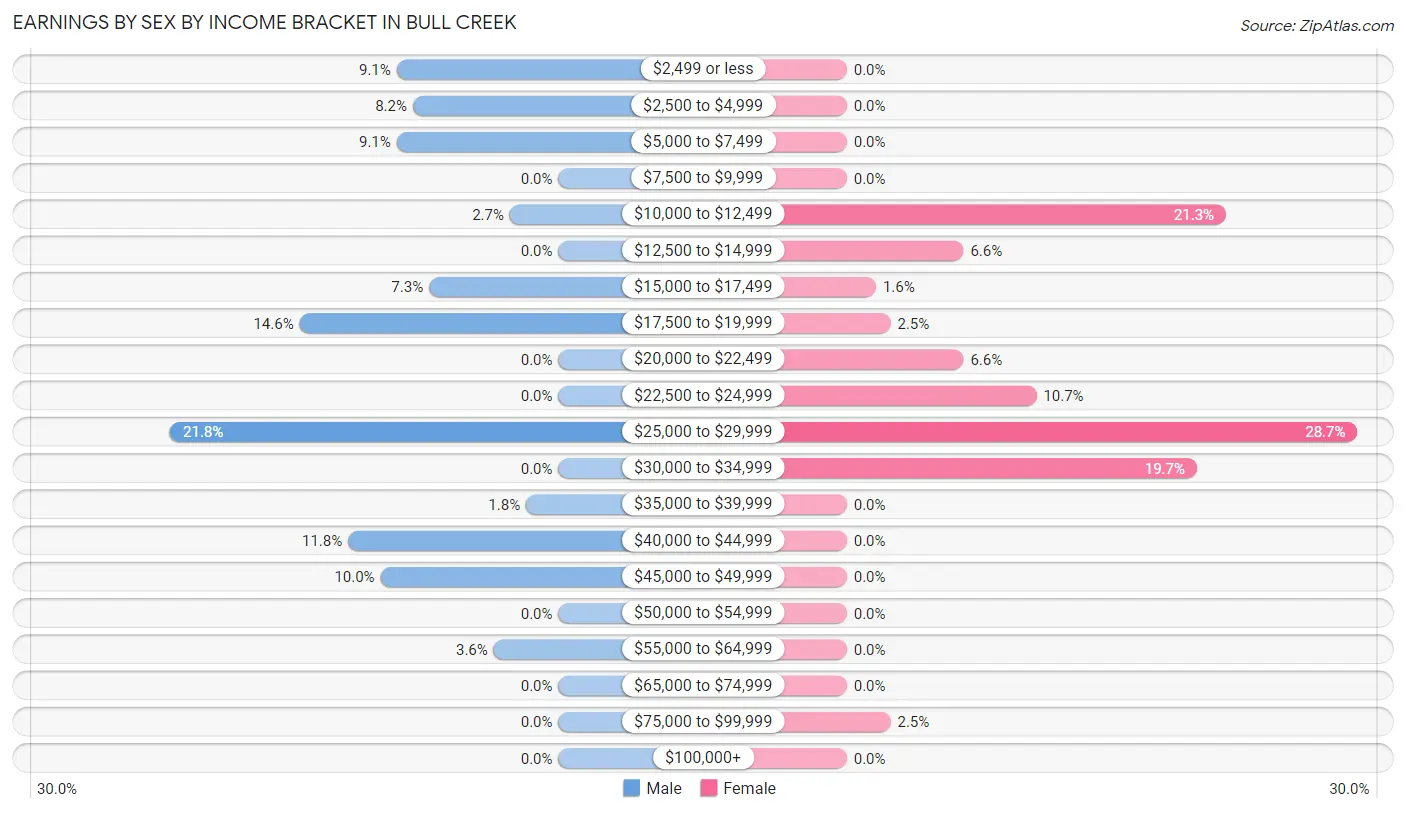
Earnings by Sex by Income Bracket in Bull Creek
The most common earnings brackets in Bull Creek are $25,000 to $29,999 for men (24 | 21.8%) and $25,000 to $29,999 for women (35 | 28.7%).
| Income | Male | Female |
| $2,499 or less | 10 (9.1%) | 0 (0.0%) |
| $2,500 to $4,999 | 9 (8.2%) | 0 (0.0%) |
| $5,000 to $7,499 | 10 (9.1%) | 0 (0.0%) |
| $7,500 to $9,999 | 0 (0.0%) | 0 (0.0%) |
| $10,000 to $12,499 | 3 (2.7%) | 26 (21.3%) |
| $12,500 to $14,999 | 0 (0.0%) | 8 (6.6%) |
| $15,000 to $17,499 | 8 (7.3%) | 2 (1.6%) |
| $17,500 to $19,999 | 16 (14.5%) | 3 (2.5%) |
| $20,000 to $22,499 | 0 (0.0%) | 8 (6.6%) |
| $22,500 to $24,999 | 0 (0.0%) | 13 (10.7%) |
| $25,000 to $29,999 | 24 (21.8%) | 35 (28.7%) |
| $30,000 to $34,999 | 0 (0.0%) | 24 (19.7%) |
| $35,000 to $39,999 | 2 (1.8%) | 0 (0.0%) |
| $40,000 to $44,999 | 13 (11.8%) | 0 (0.0%) |
| $45,000 to $49,999 | 11 (10.0%) | 0 (0.0%) |
| $50,000 to $54,999 | 0 (0.0%) | 0 (0.0%) |
| $55,000 to $64,999 | 4 (3.6%) | 0 (0.0%) |
| $65,000 to $74,999 | 0 (0.0%) | 0 (0.0%) |
| $75,000 to $99,999 | 0 (0.0%) | 3 (2.5%) |
| $100,000+ | 0 (0.0%) | 0 (0.0%) |
| Total | 110 (100.0%) | 122 (100.0%) |
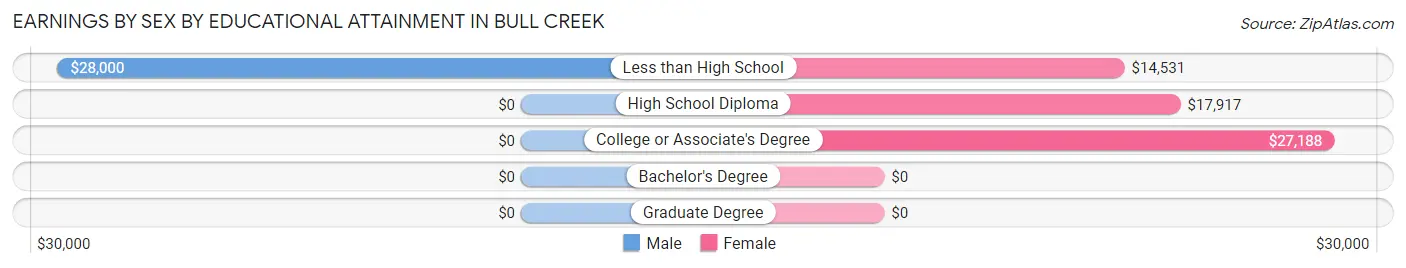
Earnings by Sex by Educational Attainment in Bull Creek
Average earnings in Bull Creek are $28,417 for men and $25,781 for women, a difference of 9.3%. Men with an educational attainment of less than high school enjoy the highest average annual earnings of $28,000, while those with less than high school education earn the least with $28,000. Women with an educational attainment of college or associate's degree earn the most with the average annual earnings of $27,188, while those with less than high school education have the smallest earnings of $14,531.
| Educational Attainment | Male Income | Female Income |
| Less than High School | $28,000 | $14,531 |
| High School Diploma | - | - |
| College or Associate's Degree | - | - |
| Bachelor's Degree | - | - |
| Graduate Degree | - | - |
| Total | $28,417 | $25,781 |
Family Income in Bull Creek
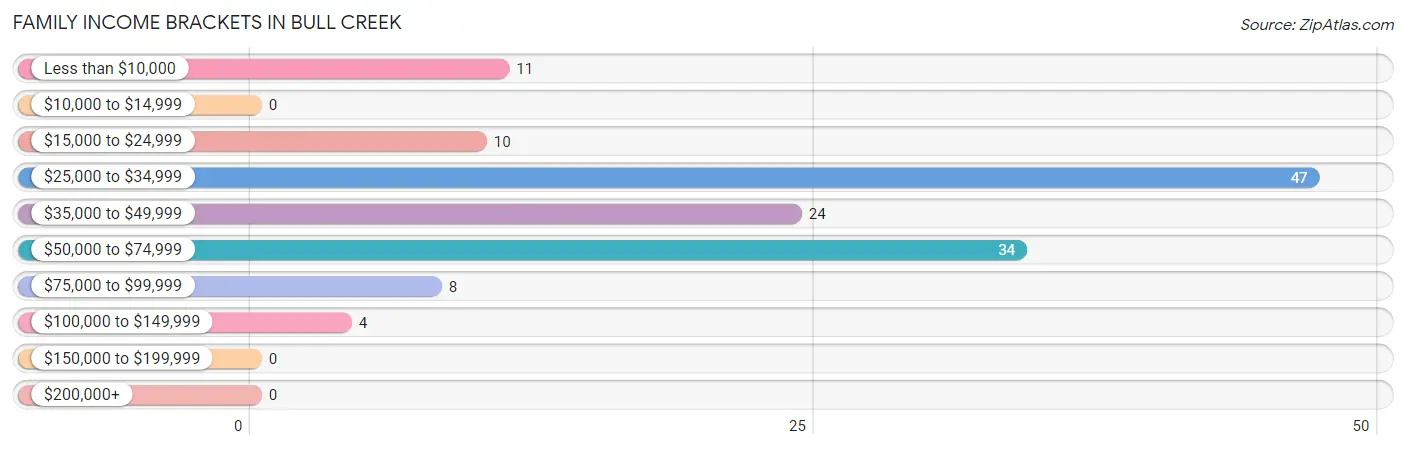
Family Income Brackets in Bull Creek
According to the Bull Creek family income data, there are 47 families falling into the $25,000 to $34,999 income range, which is the most common income bracket and makes up 34.1% of all families.
| Income Bracket | # Families | % Families |
| Less than $10,000 | 11 | 8.0% |
| $10,000 to $14,999 | 0 | 0.0% |
| $15,000 to $24,999 | 10 | 7.2% |
| $25,000 to $34,999 | 47 | 34.1% |
| $35,000 to $49,999 | 24 | 17.4% |
| $50,000 to $74,999 | 34 | 24.6% |
| $75,000 to $99,999 | 8 | 5.8% |
| $100,000 to $149,999 | 4 | 2.9% |
| $150,000 to $199,999 | 0 | 0.0% |
| $200,000+ | 0 | 0.0% |
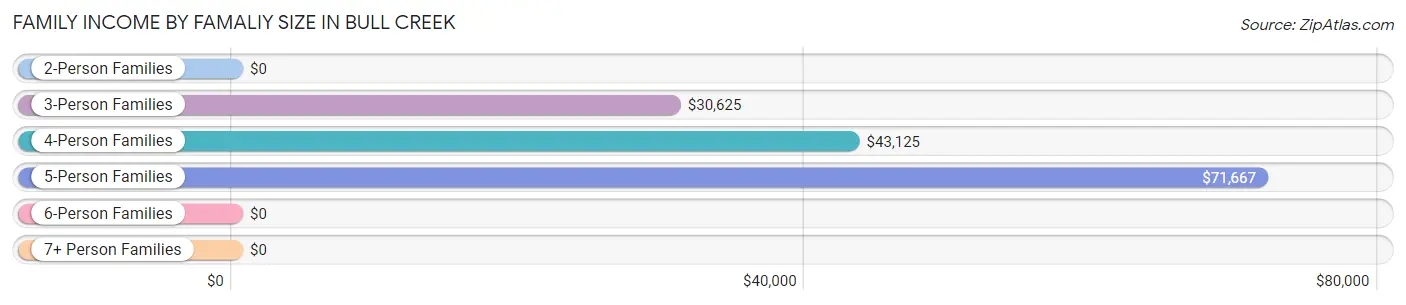
Family Income by Famaliy Size in Bull Creek
5-person families (18 | 13.0%) account for the highest median family income in Bull Creek with $71,667 per family, while 5-person families (18 | 13.0%) have the highest median income of $14,333 per family member.
| Income Bracket | # Families | Median Income |
| 2-Person Families | 34 (24.6%) | $0 |
| 3-Person Families | 43 (31.2%) | $30,625 |
| 4-Person Families | 29 (21.0%) | $43,125 |
| 5-Person Families | 18 (13.0%) | $71,667 |
| 6-Person Families | 8 (5.8%) | $0 |
| 7+ Person Families | 6 (4.3%) | $0 |
| Total | 138 (100.0%) | $35,625 |
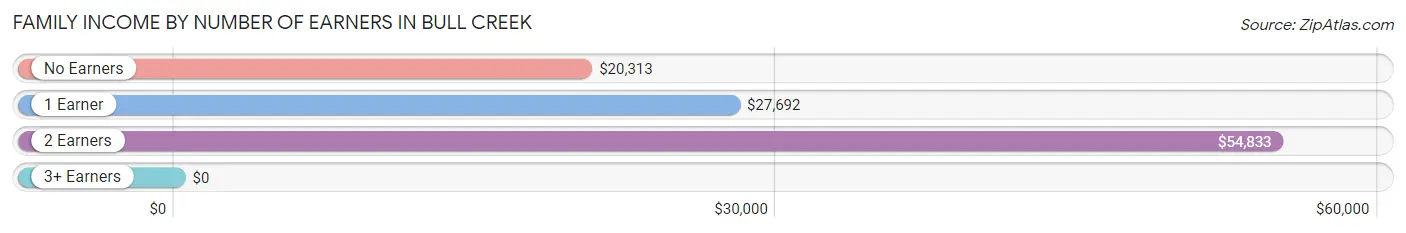
Family Income by Number of Earners in Bull Creek
| Number of Earners | # Families | Median Income |
| No Earners | 21 (15.2%) | $20,313 |
| 1 Earner | 54 (39.1%) | $27,692 |
| 2 Earners | 56 (40.6%) | $54,833 |
| 3+ Earners | 7 (5.1%) | $0 |
| Total | 138 (100.0%) | $35,625 |
Household Income in Bull Creek
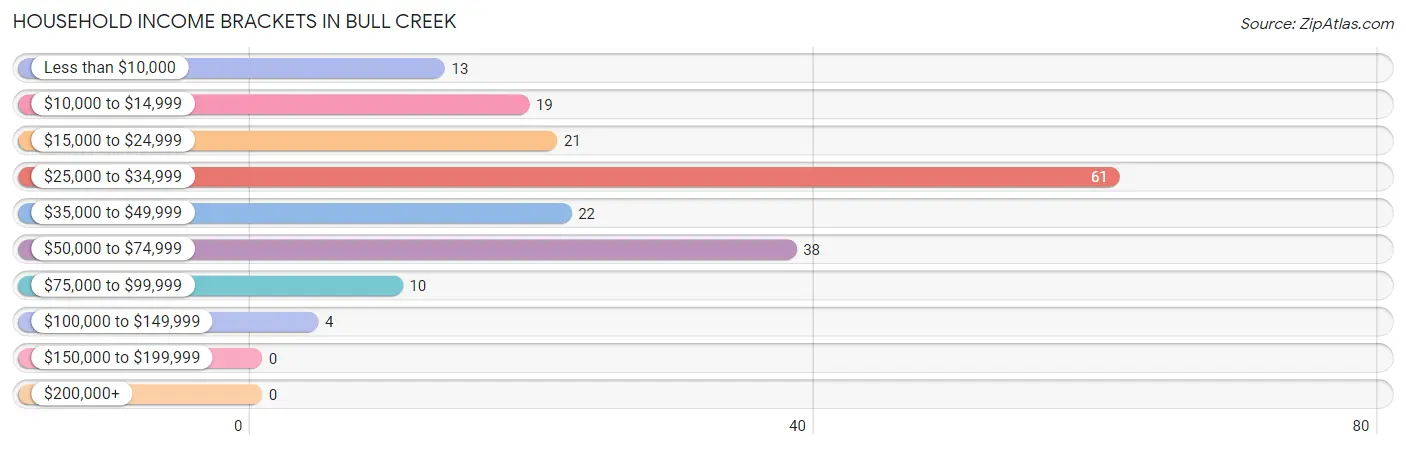
Household Income Brackets in Bull Creek
With 61 households falling in the category, the $25,000 to $34,999 income range is the most frequent in Bull Creek, accounting for 32.5% of all households.
| Income Bracket | # Households | % Households |
| Less than $10,000 | 13 | 6.9% |
| $10,000 to $14,999 | 19 | 10.1% |
| $15,000 to $24,999 | 21 | 11.2% |
| $25,000 to $34,999 | 61 | 32.4% |
| $35,000 to $49,999 | 22 | 11.7% |
| $50,000 to $74,999 | 38 | 20.2% |
| $75,000 to $99,999 | 10 | 5.3% |
| $100,000 to $149,999 | 4 | 2.1% |
| $150,000 to $199,999 | 0 | 0.0% |
| $200,000+ | 0 | 0.0% |
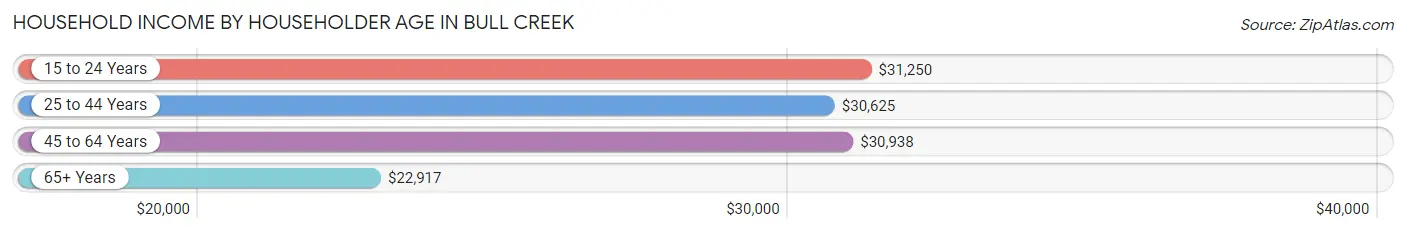
Household Income by Householder Age in Bull Creek
The median household income in Bull Creek is $29,881, with the highest median household income of $31,250 found in the 15 to 24 years age bracket for the primary householder. A total of 24 households (12.8%) fall into this category. Meanwhile, the 65+ years age bracket for the primary householder has the lowest median household income of $22,917, with 21 households (11.2%) in this group.
| Income Bracket | # Households | Median Income |
| 15 to 24 Years | 24 (12.8%) | $31,250 |
| 25 to 44 Years | 100 (53.2%) | $30,625 |
| 45 to 64 Years | 43 (22.9%) | $30,938 |
| 65+ Years | 21 (11.2%) | $22,917 |
| Total | 188 (100.0%) | $29,881 |
Poverty in Bull Creek
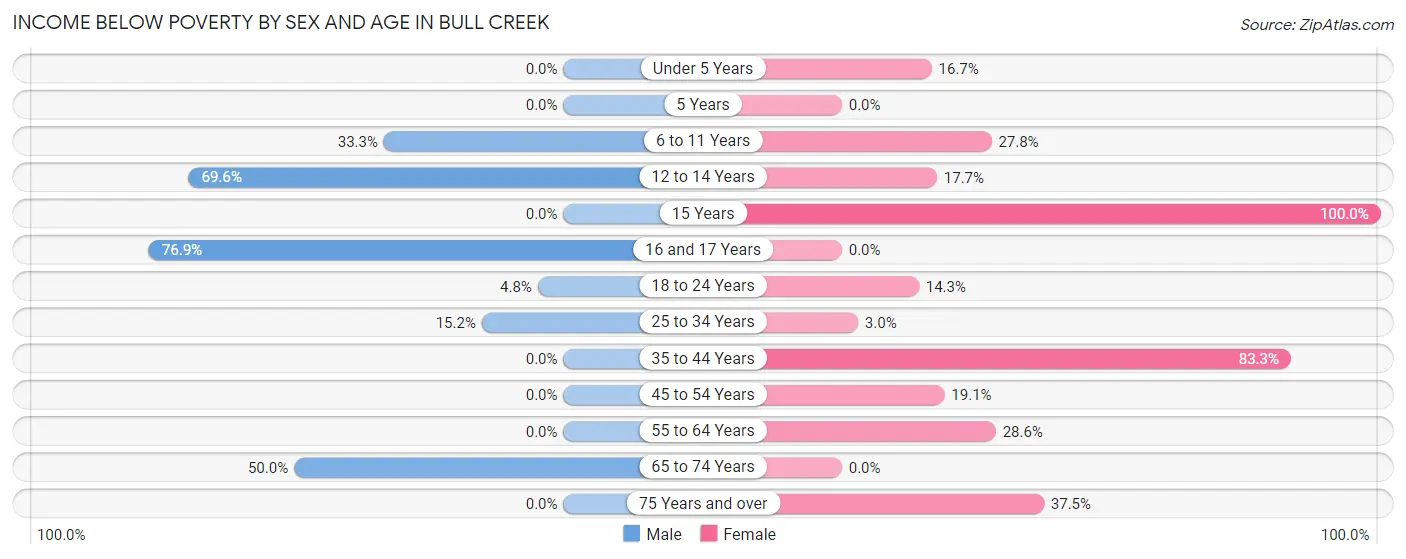
Income Below Poverty by Sex and Age in Bull Creek
With 20.4% poverty level for males and 26.1% for females among the residents of Bull Creek, 16 and 17 year old males and 15 year old females are the most vulnerable to poverty, with 10 males (76.9%) and 3 females (100.0%) in their respective age groups living below the poverty level.
| Age Bracket | Male | Female |
| Under 5 Years | 0 (0.0%) | 2 (16.7%) |
| 5 Years | 0 (0.0%) | 0 (0.0%) |
| 6 to 11 Years | 16 (33.3%) | 20 (27.8%) |
| 12 to 14 Years | 16 (69.6%) | 3 (17.6%) |
| 15 Years | 0 (0.0%) | 3 (100.0%) |
| 16 and 17 Years | 10 (76.9%) | 0 (0.0%) |
| 18 to 24 Years | 1 (4.8%) | 4 (14.3%) |
| 25 to 34 Years | 5 (15.1%) | 2 (3.0%) |
| 35 to 44 Years | 0 (0.0%) | 35 (83.3%) |
| 45 to 54 Years | 0 (0.0%) | 4 (19.1%) |
| 55 to 64 Years | 0 (0.0%) | 8 (28.6%) |
| 65 to 74 Years | 2 (50.0%) | 0 (0.0%) |
| 75 Years and over | 0 (0.0%) | 3 (37.5%) |
| Total | 50 (20.4%) | 84 (26.1%) |
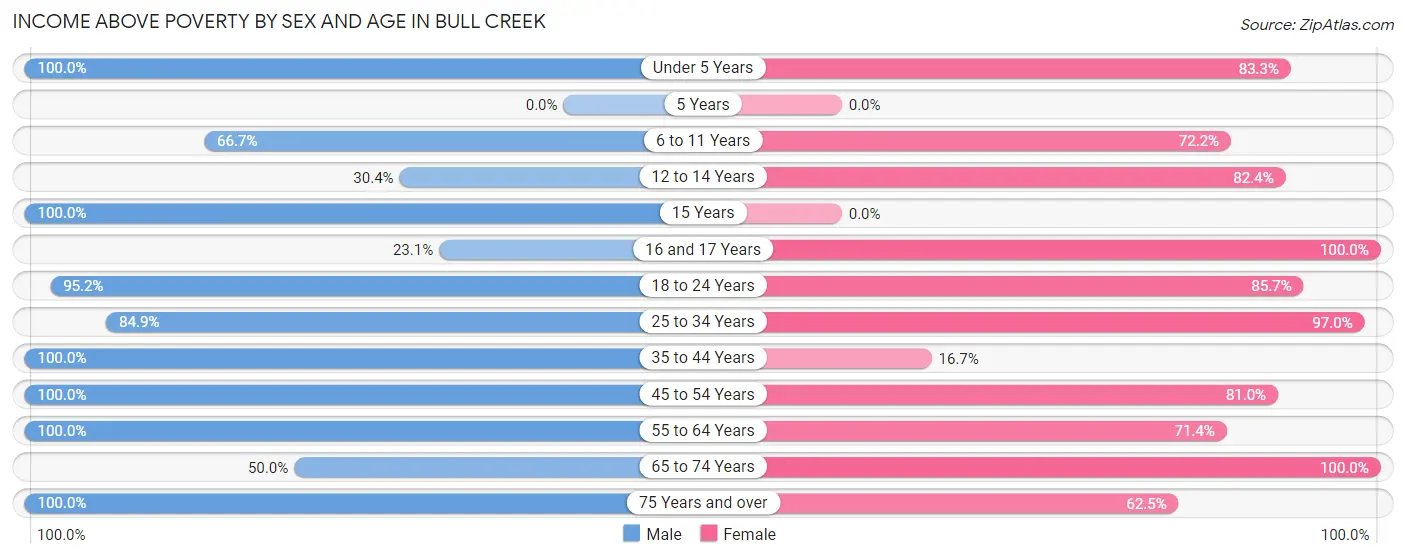
Income Above Poverty by Sex and Age in Bull Creek
According to the poverty statistics in Bull Creek, males aged under 5 years and females aged 16 and 17 years are the age groups that are most secure financially, with 100.0% of males and 100.0% of females in these age groups living above the poverty line.
| Age Bracket | Male | Female |
| Under 5 Years | 35 (100.0%) | 10 (83.3%) |
| 5 Years | 0 (0.0%) | 0 (0.0%) |
| 6 to 11 Years | 32 (66.7%) | 52 (72.2%) |
| 12 to 14 Years | 7 (30.4%) | 14 (82.4%) |
| 15 Years | 4 (100.0%) | 0 (0.0%) |
| 16 and 17 Years | 3 (23.1%) | 2 (100.0%) |
| 18 to 24 Years | 20 (95.2%) | 24 (85.7%) |
| 25 to 34 Years | 28 (84.9%) | 65 (97.0%) |
| 35 to 44 Years | 33 (100.0%) | 7 (16.7%) |
| 45 to 54 Years | 10 (100.0%) | 17 (80.9%) |
| 55 to 64 Years | 15 (100.0%) | 20 (71.4%) |
| 65 to 74 Years | 2 (50.0%) | 22 (100.0%) |
| 75 Years and over | 6 (100.0%) | 5 (62.5%) |
| Total | 195 (79.6%) | 238 (73.9%) |
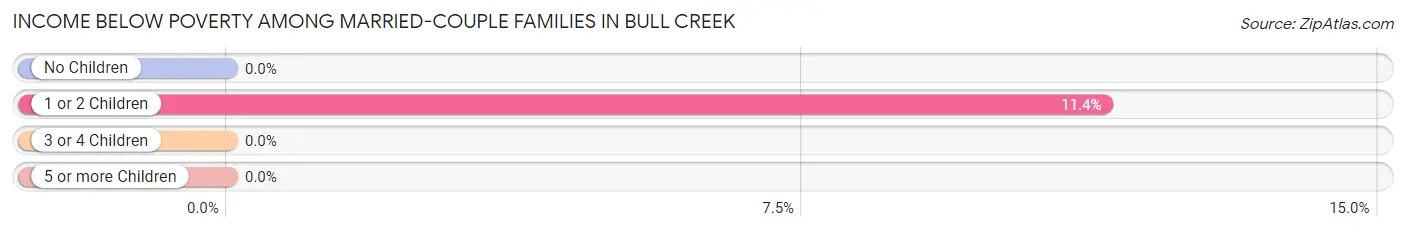
Income Below Poverty Among Married-Couple Families in Bull Creek
The poverty statistics for married-couple families in Bull Creek show that 4.6% or 4 of the total 86 families live below the poverty line. Families with 1 or 2 children have the highest poverty rate of 11.4%, comprising of 4 families. On the other hand, families with no children have the lowest poverty rate of 0.0%, which includes 0 families.
| Children | Above Poverty | Below Poverty |
| No Children | 34 (100.0%) | 0 (0.0%) |
| 1 or 2 Children | 31 (88.6%) | 4 (11.4%) |
| 3 or 4 Children | 15 (100.0%) | 0 (0.0%) |
| 5 or more Children | 2 (100.0%) | 0 (0.0%) |
| Total | 82 (95.4%) | 4 (4.6%) |
Income Below Poverty Among Single-Parent Households in Bull Creek
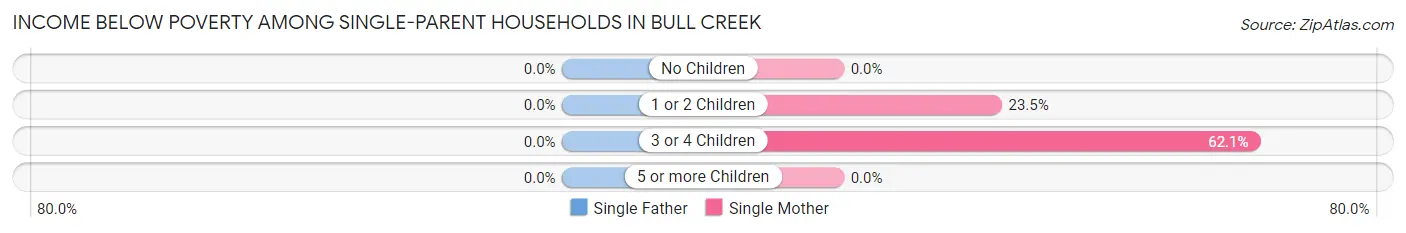
| Children | Single Father | Single Mother |
| No Children | 0 (0.0%) | 0 (0.0%) |
| 1 or 2 Children | 0 (0.0%) | 4 (23.5%) |
| 3 or 4 Children | 0 (0.0%) | 18 (62.1%) |
| 5 or more Children | 0 (0.0%) | 0 (0.0%) |
| Total | 0 (0.0%) | 22 (47.8%) |
Income Below Poverty Among Married-Couple vs Single-Parent Households in Bull Creek
The poverty data for Bull Creek shows that 4 of the married-couple family households (4.6%) and 22 of the single-parent households (42.3%) are living below the poverty level. Within the married-couple family households, those with 1 or 2 children have the highest poverty rate, with 4 households (11.4%) falling below the poverty line. Among the single-parent households, those with 3 or 4 children have the highest poverty rate, with 18 household (62.1%) living below poverty.
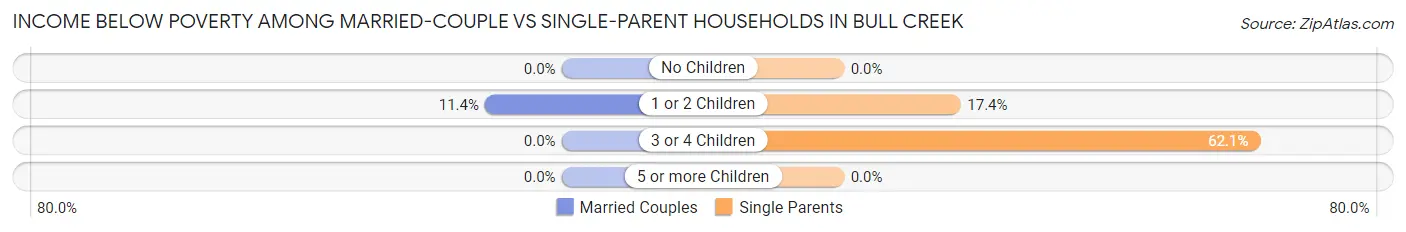
| Children | Married-Couple Families | Single-Parent Households |
| No Children | 0 (0.0%) | 0 (0.0%) |
| 1 or 2 Children | 4 (11.4%) | 4 (17.4%) |
| 3 or 4 Children | 0 (0.0%) | 18 (62.1%) |
| 5 or more Children | 0 (0.0%) | 0 (0.0%) |
| Total | 4 (4.6%) | 22 (42.3%) |
Race in Bull Creek
The most populous races in Bull Creek are White / Caucasian (483 | 85.2%), Hispanic or Latino (47 | 8.3%), and Two or more Races (44 | 7.8%).
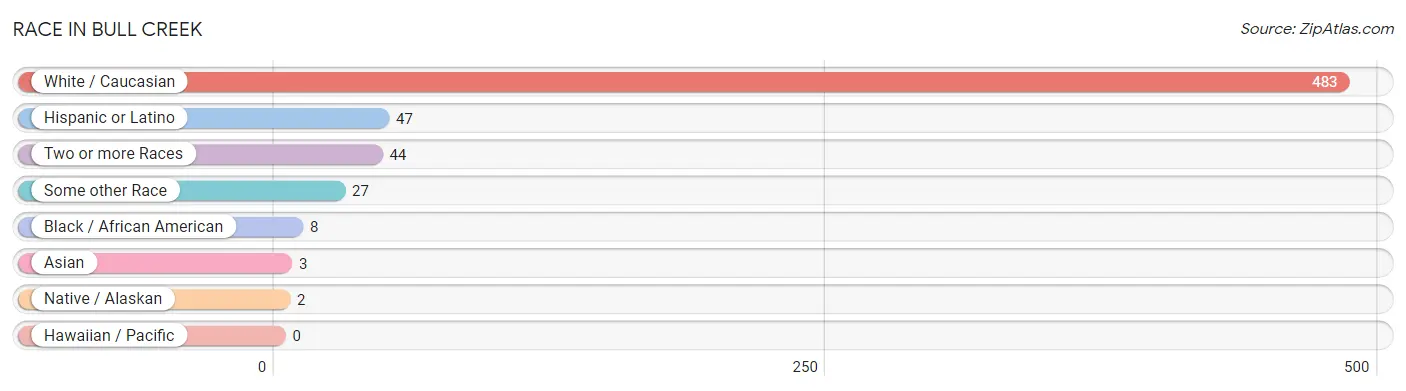
| Race | # Population | % Population |
| Asian | 3 | 0.5% |
| Black / African American | 8 | 1.4% |
| Hawaiian / Pacific | 0 | 0.0% |
| Hispanic or Latino | 47 | 8.3% |
| Native / Alaskan | 2 | 0.4% |
| White / Caucasian | 483 | 85.2% |
| Two or more Races | 44 | 7.8% |
| Some other Race | 27 | 4.8% |
| Total | 567 | 100.0% |
Ancestry in Bull Creek
The most populous ancestries reported in Bull Creek are German (134 | 23.6%), Irish (105 | 18.5%), American (60 | 10.6%), Mexican (47 | 8.3%), and Italian (32 | 5.6%), together accounting for 66.7% of all Bull Creek residents.
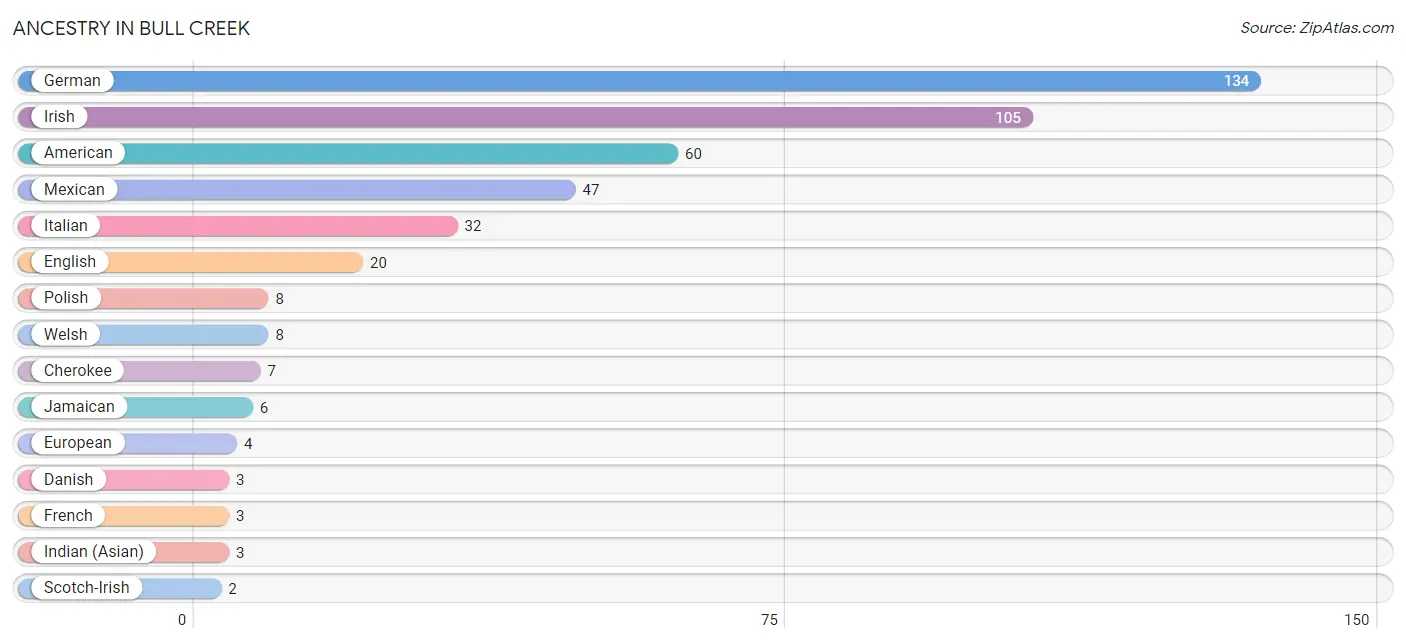
| Ancestry | # Population | % Population |
| American | 60 | 10.6% |
| Cherokee | 7 | 1.2% |
| Chippewa | 1 | 0.2% |
| Danish | 3 | 0.5% |
| English | 20 | 3.5% |
| European | 4 | 0.7% |
| French | 3 | 0.5% |
| French Canadian | 1 | 0.2% |
| German | 134 | 23.6% |
| Indian (Asian) | 3 | 0.5% |
| Irish | 105 | 18.5% |
| Italian | 32 | 5.6% |
| Jamaican | 6 | 1.1% |
| Mexican | 47 | 8.3% |
| Polish | 8 | 1.4% |
| Scotch-Irish | 2 | 0.4% |
| Welsh | 8 | 1.4% | View All 17 Rows |
Immigrants in Bull Creek
The most numerous immigrant groups reported in Bull Creek came from Asia (3 | 0.5%), China (3 | 0.5%), Eastern Asia (3 | 0.5%), Africa (1 | 0.2%), and Middle Africa (1 | 0.2%), together accounting for 1.9% of all Bull Creek residents.
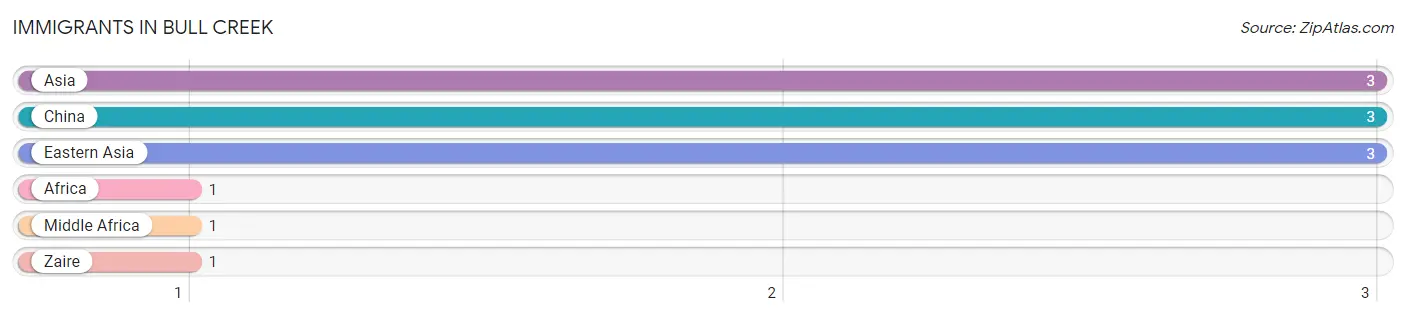
| Immigration Origin | # Population | % Population |
| Africa | 1 | 0.2% |
| Asia | 3 | 0.5% |
| China | 3 | 0.5% |
| Eastern Asia | 3 | 0.5% |
| Middle Africa | 1 | 0.2% |
| Zaire | 1 | 0.2% | View All 6 Rows |
Sex and Age in Bull Creek
Sex and Age in Bull Creek
The most populous age groups in Bull Creek are 10 to 14 Years (47 | 19.2%) for men and 5 to 9 Years (46 | 14.3%) for women.
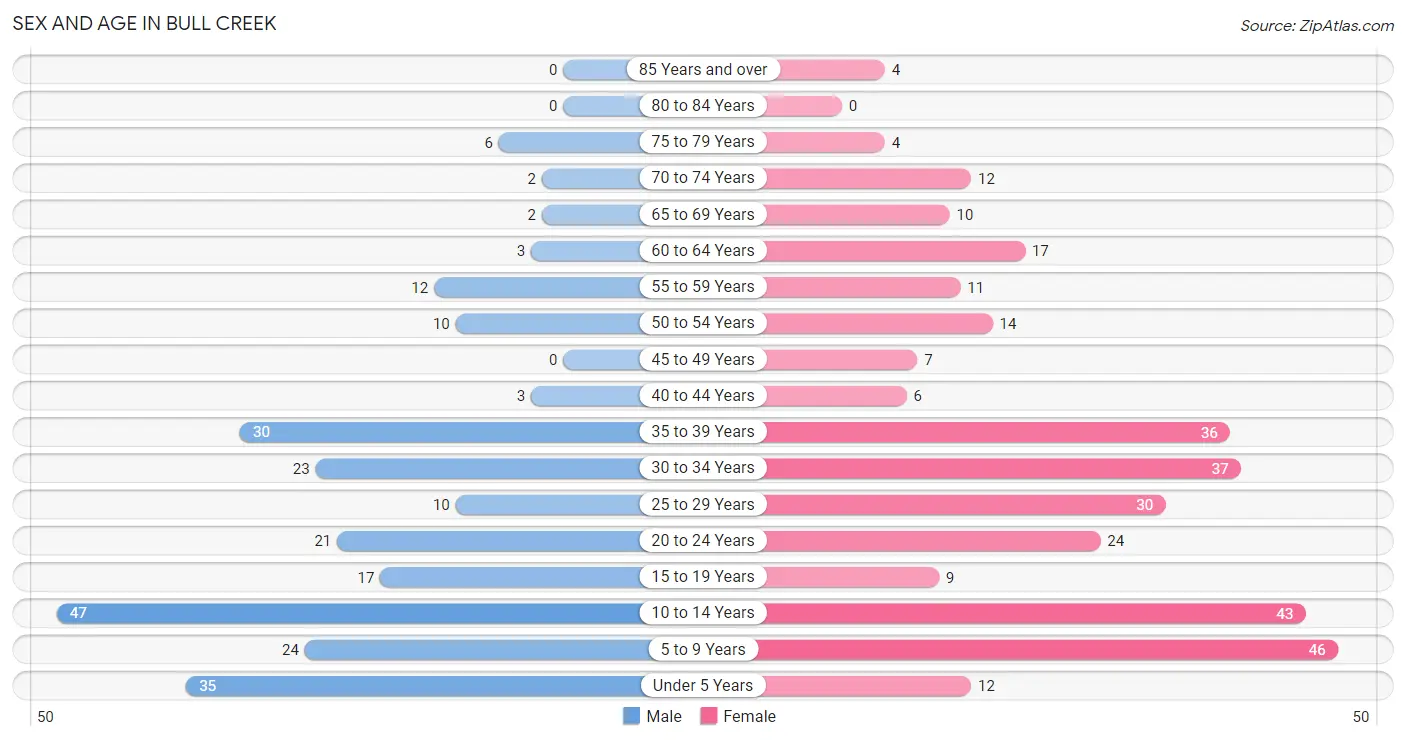
| Age Bracket | Male | Female |
| Under 5 Years | 35 (14.3%) | 12 (3.7%) |
| 5 to 9 Years | 24 (9.8%) | 46 (14.3%) |
| 10 to 14 Years | 47 (19.2%) | 43 (13.4%) |
| 15 to 19 Years | 17 (6.9%) | 9 (2.8%) |
| 20 to 24 Years | 21 (8.6%) | 24 (7.4%) |
| 25 to 29 Years | 10 (4.1%) | 30 (9.3%) |
| 30 to 34 Years | 23 (9.4%) | 37 (11.5%) |
| 35 to 39 Years | 30 (12.2%) | 36 (11.2%) |
| 40 to 44 Years | 3 (1.2%) | 6 (1.9%) |
| 45 to 49 Years | 0 (0.0%) | 7 (2.2%) |
| 50 to 54 Years | 10 (4.1%) | 14 (4.3%) |
| 55 to 59 Years | 12 (4.9%) | 11 (3.4%) |
| 60 to 64 Years | 3 (1.2%) | 17 (5.3%) |
| 65 to 69 Years | 2 (0.8%) | 10 (3.1%) |
| 70 to 74 Years | 2 (0.8%) | 12 (3.7%) |
| 75 to 79 Years | 6 (2.5%) | 4 (1.2%) |
| 80 to 84 Years | 0 (0.0%) | 0 (0.0%) |
| 85 Years and over | 0 (0.0%) | 4 (1.2%) |
| Total | 245 (100.0%) | 322 (100.0%) |
Families and Households in Bull Creek
Median Family Size in Bull Creek
The median family size in Bull Creek is 3.59 persons per family, with single female/mother families (46 | 33.3%) accounting for the largest median family size of 4.09 persons per family. On the other hand, married-couple families (86 | 62.3%) represent the smallest median family size with 3.33 persons per family.
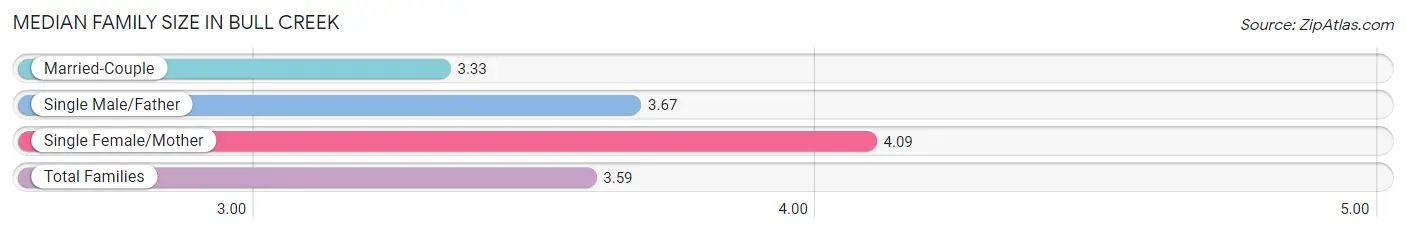
| Family Type | # Families | Family Size |
| Married-Couple | 86 (62.3%) | 3.33 |
| Single Male/Father | 6 (4.3%) | 3.67 |
| Single Female/Mother | 46 (33.3%) | 4.09 |
| Total Families | 138 (100.0%) | 3.59 |
Median Household Size in Bull Creek
The median household size in Bull Creek is 3.02 persons per household, with single female/mother households (46 | 24.5%) accounting for the largest median household size of 4.48 persons per household. non-family households (50 | 26.6%) represent the smallest median household size with 1.06 persons per household.
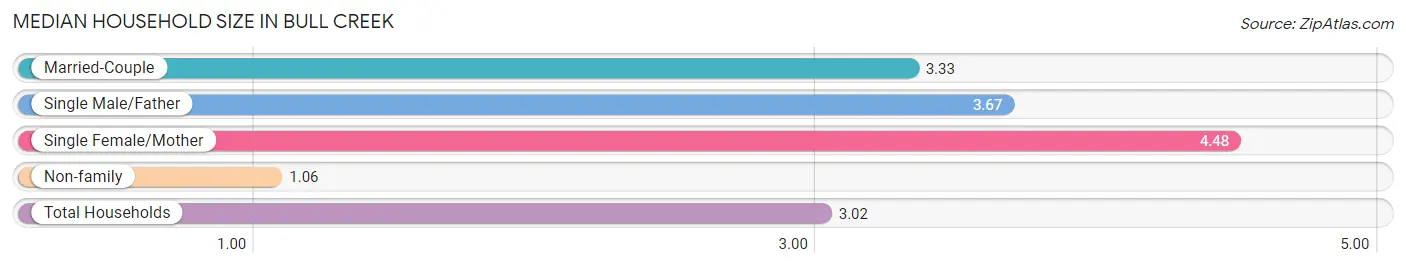
| Household Type | # Households | Household Size |
| Married-Couple | 86 (45.7%) | 3.33 |
| Single Male/Father | 6 (3.2%) | 3.67 |
| Single Female/Mother | 46 (24.5%) | 4.48 |
| Non-family | 50 (26.6%) | 1.06 |
| Total Households | 188 (100.0%) | 3.02 |
Household Size by Marriage Status in Bull Creek
Out of a total of 188 households in Bull Creek, 138 (73.4%) are family households, while 50 (26.6%) are nonfamily households. The most numerous type of family households are 4-person households, comprising 40, and the most common type of nonfamily households are 1-person households, comprising 48.
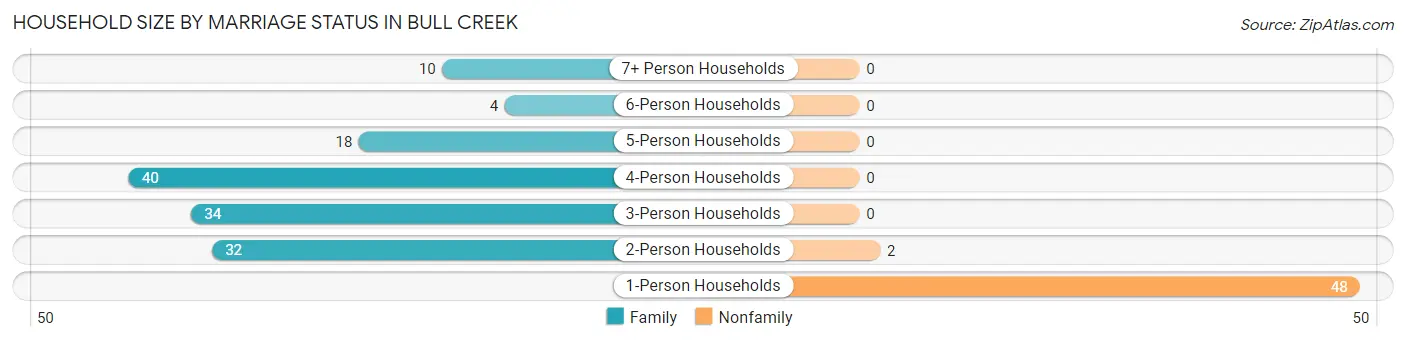
| Household Size | Family Households | Nonfamily Households |
| 1-Person Households | - | 48 (25.5%) |
| 2-Person Households | 32 (17.0%) | 2 (1.1%) |
| 3-Person Households | 34 (18.1%) | 0 (0.0%) |
| 4-Person Households | 40 (21.3%) | 0 (0.0%) |
| 5-Person Households | 18 (9.6%) | 0 (0.0%) |
| 6-Person Households | 4 (2.1%) | 0 (0.0%) |
| 7+ Person Households | 10 (5.3%) | 0 (0.0%) |
| Total | 138 (73.4%) | 50 (26.6%) |
Female Fertility in Bull Creek
Fertility by Age in Bull Creek
Average fertility rate in Bull Creek is 81.0 births per 1,000 women. Women in the age bracket of 20 to 34 years have the highest fertility rate with 132.0 births per 1,000 women. Women in the age bracket of 20 to 34 years acount for 100.0% of all women with births.
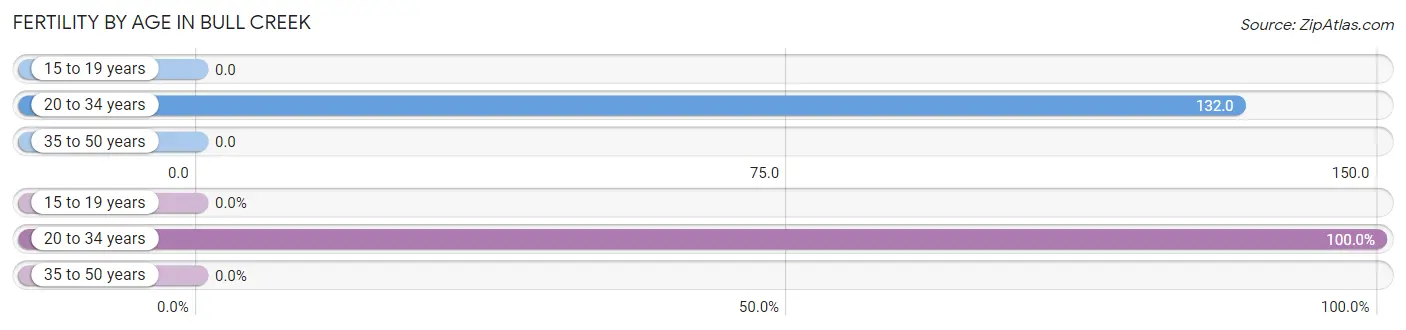
| Age Bracket | Women with Births | Births / 1,000 Women |
| 15 to 19 years | 0 (0.0%) | 0.0 |
| 20 to 34 years | 12 (100.0%) | 132.0 |
| 35 to 50 years | 0 (0.0%) | 0.0 |
| Total | 12 (100.0%) | 81.0 |
Fertility by Age by Marriage Status in Bull Creek
83.3% of women with births (12) in Bull Creek are married. The highest percentage of unmarried women with births falls into 20 to 34 years age bracket with 16.7% of them unmarried at the time of birth, while the lowest percentage of unmarried women with births belong to 20 to 34 years age bracket with 16.7% of them unmarried.
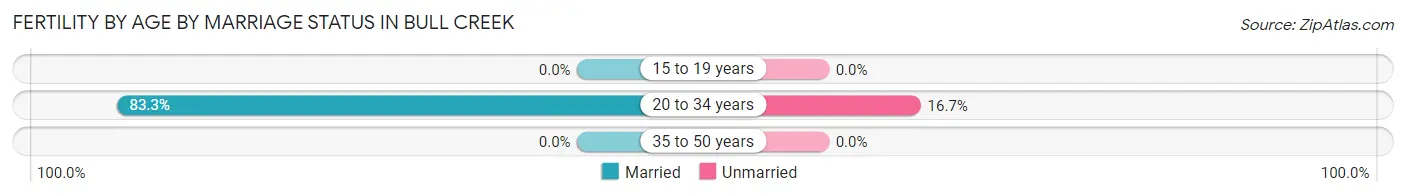
| Age Bracket | Married | Unmarried |
| 15 to 19 years | 0 (0.0%) | 0 (0.0%) |
| 20 to 34 years | 10 (83.3%) | 2 (16.7%) |
| 35 to 50 years | 0 (0.0%) | 0 (0.0%) |
| Total | 10 (83.3%) | 2 (16.7%) |
Fertility by Education in Bull Creek
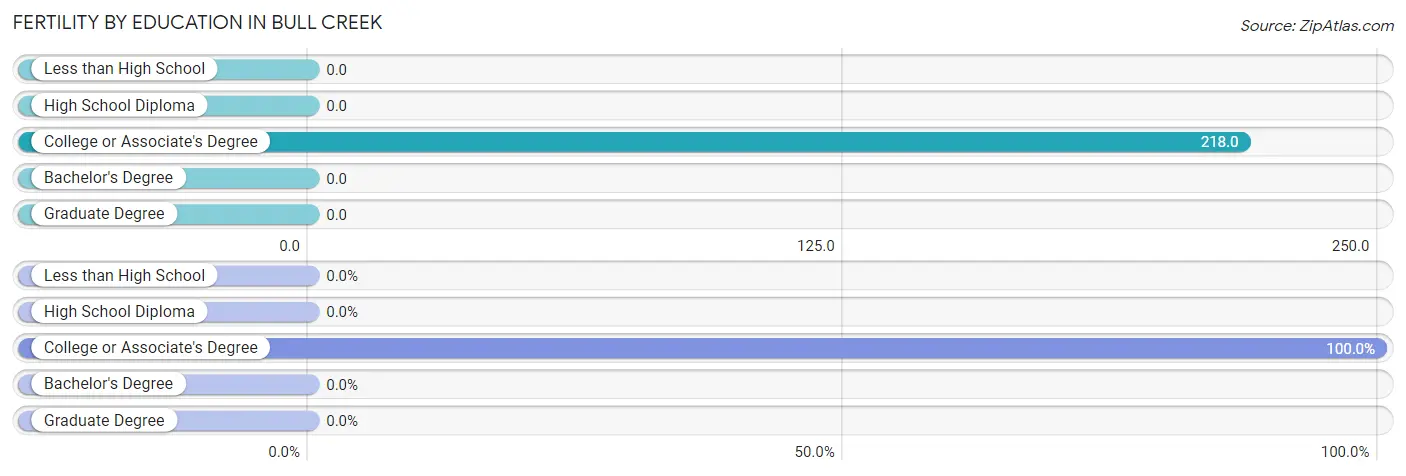
| Educational Attainment | Women with Births | Births / 1,000 Women |
| Less than High School | 0 (0.0%) | 0.0 |
| High School Diploma | 0 (0.0%) | 0.0 |
| College or Associate's Degree | 12 (100.0%) | 218.0 |
| Bachelor's Degree | 0 (0.0%) | 0.0 |
| Graduate Degree | 0 (0.0%) | 0.0 |
| Total | 12 (100.0%) | 81.0 |
Fertility by Education by Marriage Status in Bull Creek
16.7% of women with births in Bull Creek are unmarried. Women with the educational attainment of college or associate's degree are most likely to be married with 83.3% of them married at childbirth, while women with the educational attainment of college or associate's degree are least likely to be married with 16.7% of them unmarried at childbirth.
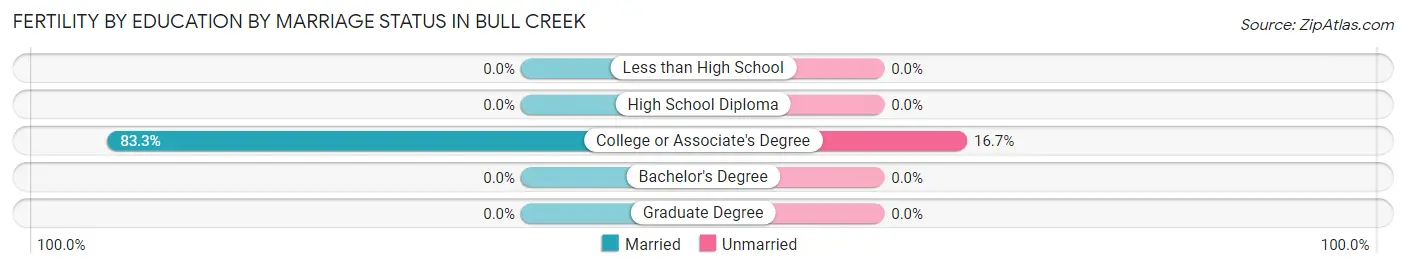
| Educational Attainment | Married | Unmarried |
| Less than High School | 0 (0.0%) | 0 (0.0%) |
| High School Diploma | 0 (0.0%) | 0 (0.0%) |
| College or Associate's Degree | 10 (83.3%) | 2 (16.7%) |
| Bachelor's Degree | 0 (0.0%) | 0 (0.0%) |
| Graduate Degree | 0 (0.0%) | 0 (0.0%) |
| Total | 10 (83.3%) | 2 (16.7%) |
Employment Characteristics in Bull Creek
Employment by Class of Employer in Bull Creek
Among the 206 employed individuals in Bull Creek, private company employees (156 | 75.7%), self-employed (not incorporated) (24 | 11.7%), and not-for-profit organizations (20 | 9.7%) make up the most common classes of employment.
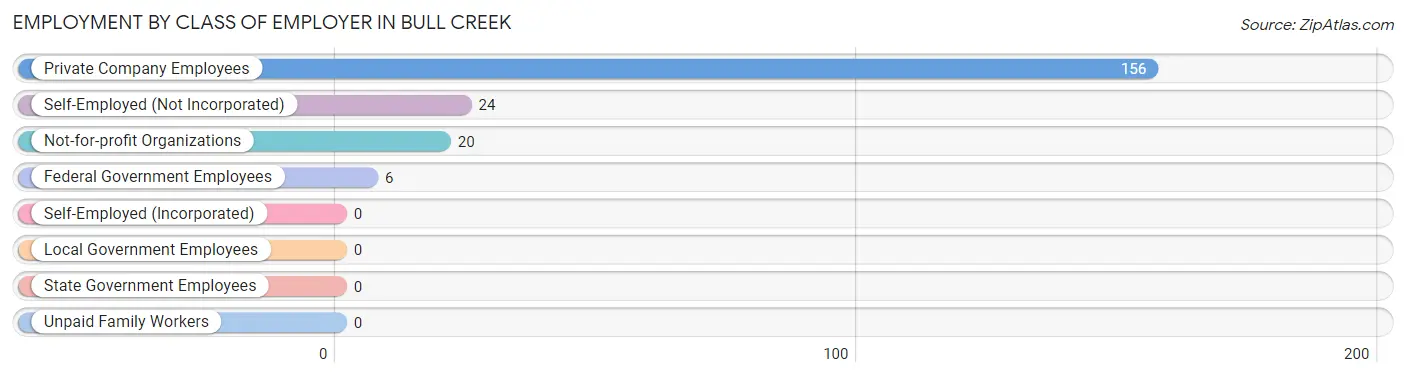
| Employer Class | # Employees | % Employees |
| Private Company Employees | 156 | 75.7% |
| Self-Employed (Incorporated) | 0 | 0.0% |
| Self-Employed (Not Incorporated) | 24 | 11.7% |
| Not-for-profit Organizations | 20 | 9.7% |
| Local Government Employees | 0 | 0.0% |
| State Government Employees | 0 | 0.0% |
| Federal Government Employees | 6 | 2.9% |
| Unpaid Family Workers | 0 | 0.0% |
| Total | 206 | 100.0% |
Employment Status by Age in Bull Creek
According to the labor force statistics for Bull Creek, out of the total population over 16 years of age (353), 66.0% or 233 individuals are in the labor force, with 5.2% or 12 of them unemployed. The age group with the highest labor force participation rate is 25 to 29 years, with 100.0% or 40 individuals in the labor force. Within the labor force, the 16 to 19 years age range has the highest percentage of unemployed individuals, with 43.8% or 7 of them being unemployed.
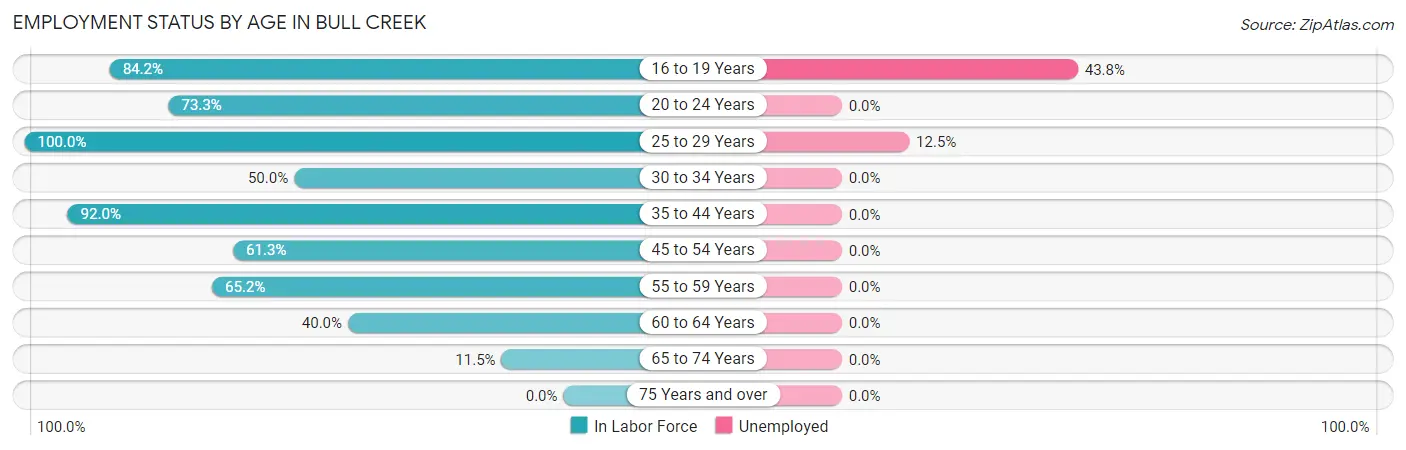
| Age Bracket | In Labor Force | Unemployed |
| 16 to 19 Years | 16 (84.2%) | 7 (43.8%) |
| 20 to 24 Years | 33 (73.3%) | 0 (0.0%) |
| 25 to 29 Years | 40 (100.0%) | 5 (12.5%) |
| 30 to 34 Years | 30 (50.0%) | 0 (0.0%) |
| 35 to 44 Years | 69 (92.0%) | 0 (0.0%) |
| 45 to 54 Years | 19 (61.3%) | 0 (0.0%) |
| 55 to 59 Years | 15 (65.2%) | 0 (0.0%) |
| 60 to 64 Years | 8 (40.0%) | 0 (0.0%) |
| 65 to 74 Years | 3 (11.5%) | 0 (0.0%) |
| 75 Years and over | 0 (0.0%) | 0 (0.0%) |
| Total | 233 (66.0%) | 12 (5.2%) |
Employment Status by Educational Attainment in Bull Creek
According to labor force statistics for Bull Creek, 72.7% of individuals (181) out of the total population between 25 and 64 years of age (249) are in the labor force, with 2.8% or 5 of them being unemployed. The group with the highest labor force participation rate are those with the educational attainment of bachelor's degree or higher, with 100.0% or 3 individuals in the labor force. Within the labor force, individuals with less than high school education have the highest percentage of unemployment, with 10.0% or 5 of them being unemployed.
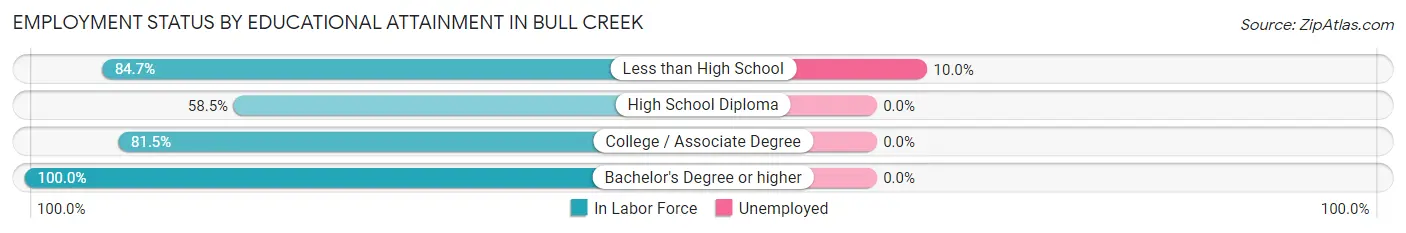
| Educational Attainment | In Labor Force | Unemployed |
| Less than High School | 50 (84.7%) | 6 (10.0%) |
| High School Diploma | 62 (58.5%) | 0 (0.0%) |
| College / Associate Degree | 66 (81.5%) | 0 (0.0%) |
| Bachelor's Degree or higher | 3 (100.0%) | 0 (0.0%) |
| Total | 181 (72.7%) | 7 (2.8%) |
Employment Occupations by Sex in Bull Creek
Management, Business, Science and Arts Occupations
The most common Management, Business, Science and Arts occupations in Bull Creek are Management (8 | 3.6%), and Health Diagnosing & Treating (3 | 1.4%).
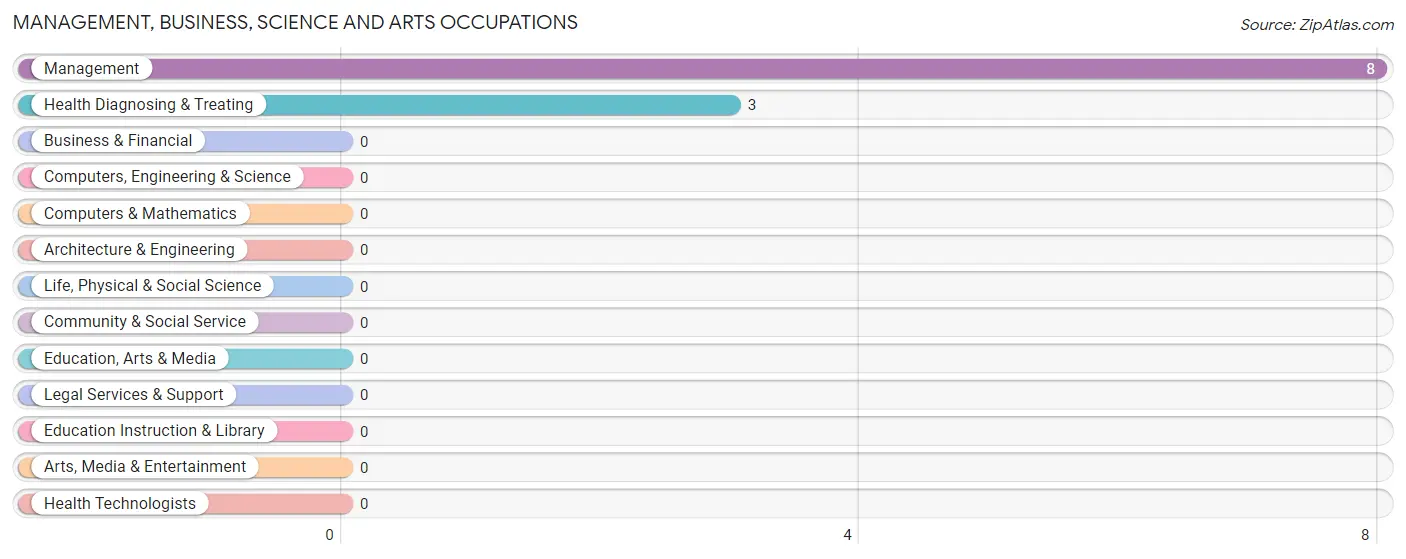
Management, Business, Science and Arts Occupations by Sex
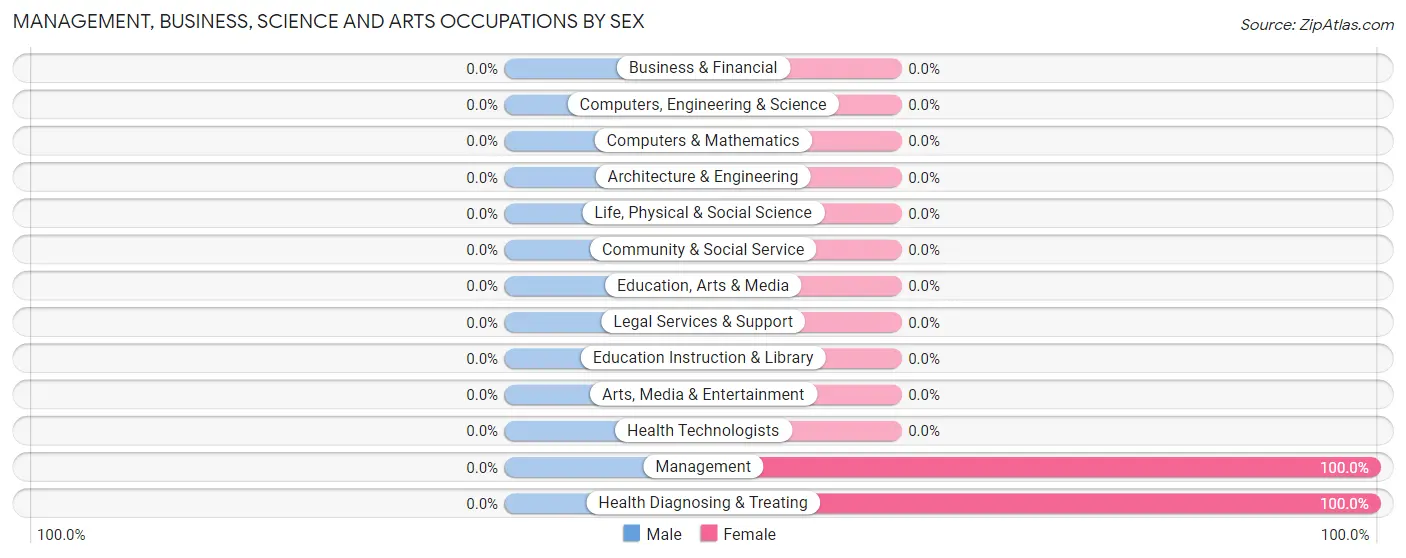
| Occupation | Male | Female |
| Management | 0 (0.0%) | 8 (100.0%) |
| Business & Financial | 0 (0.0%) | 0 (0.0%) |
| Computers, Engineering & Science | 0 (0.0%) | 0 (0.0%) |
| Computers & Mathematics | 0 (0.0%) | 0 (0.0%) |
| Architecture & Engineering | 0 (0.0%) | 0 (0.0%) |
| Life, Physical & Social Science | 0 (0.0%) | 0 (0.0%) |
| Community & Social Service | 0 (0.0%) | 0 (0.0%) |
| Education, Arts & Media | 0 (0.0%) | 0 (0.0%) |
| Legal Services & Support | 0 (0.0%) | 0 (0.0%) |
| Education Instruction & Library | 0 (0.0%) | 0 (0.0%) |
| Arts, Media & Entertainment | 0 (0.0%) | 0 (0.0%) |
| Health Diagnosing & Treating | 0 (0.0%) | 3 (100.0%) |
| Health Technologists | 0 (0.0%) | 0 (0.0%) |
| Total (Category) | 0 (0.0%) | 11 (100.0%) |
| Total (Overall) | 99 (44.8%) | 122 (55.2%) |
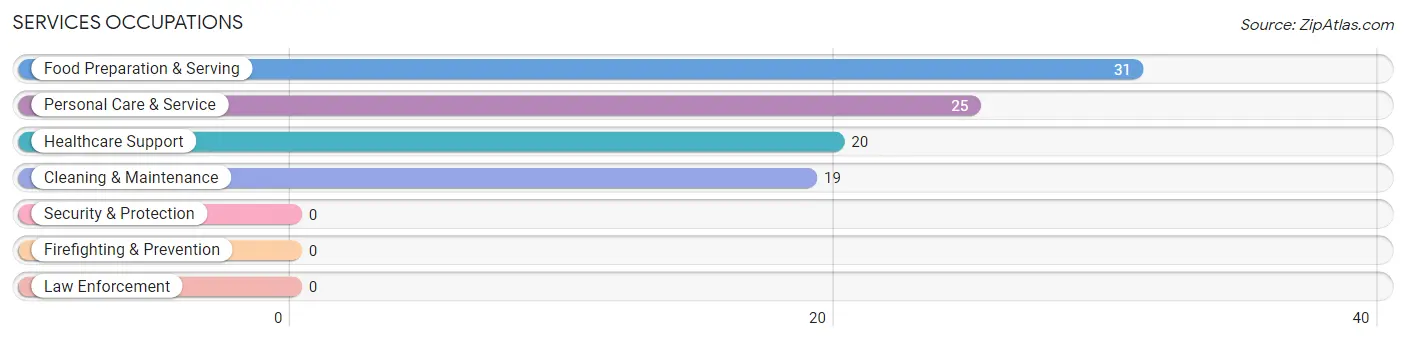
Services Occupations
The most common Services occupations in Bull Creek are Food Preparation & Serving (31 | 14.0%), Personal Care & Service (25 | 11.3%), Healthcare Support (20 | 9.0%), and Cleaning & Maintenance (19 | 8.6%).
Services Occupations by Sex
Within the Services occupations in Bull Creek, the most male-oriented occupations are Cleaning & Maintenance (100.0%), Food Preparation & Serving (58.1%), and Personal Care & Service (36.0%), while the most female-oriented occupations are Healthcare Support (100.0%), Personal Care & Service (64.0%), and Food Preparation & Serving (41.9%).
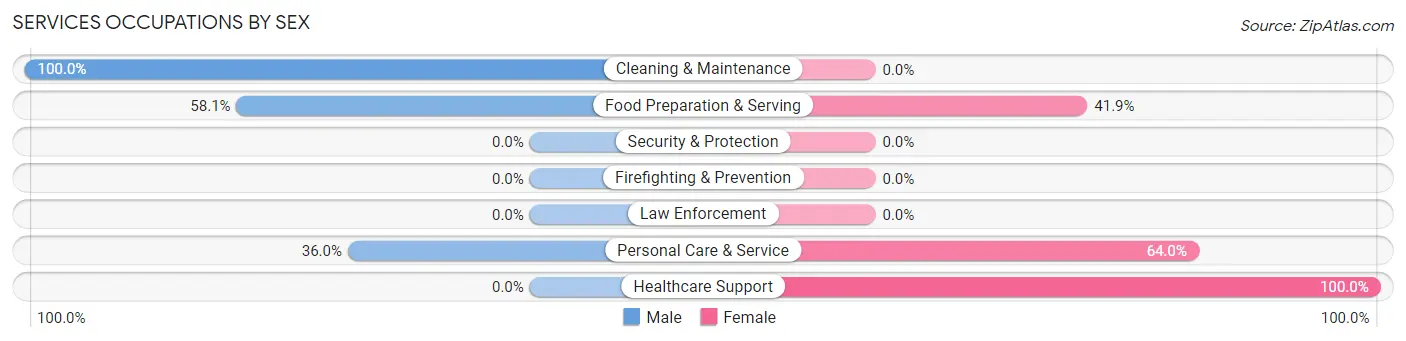
| Occupation | Male | Female |
| Healthcare Support | 0 (0.0%) | 20 (100.0%) |
| Security & Protection | 0 (0.0%) | 0 (0.0%) |
| Firefighting & Prevention | 0 (0.0%) | 0 (0.0%) |
| Law Enforcement | 0 (0.0%) | 0 (0.0%) |
| Food Preparation & Serving | 18 (58.1%) | 13 (41.9%) |
| Cleaning & Maintenance | 19 (100.0%) | 0 (0.0%) |
| Personal Care & Service | 9 (36.0%) | 16 (64.0%) |
| Total (Category) | 46 (48.4%) | 49 (51.6%) |
| Total (Overall) | 99 (44.8%) | 122 (55.2%) |
Sales and Office Occupations
The most common Sales and Office occupations in Bull Creek are Sales & Related (33 | 14.9%), and Office & Administration (19 | 8.6%).

Sales and Office Occupations by Sex
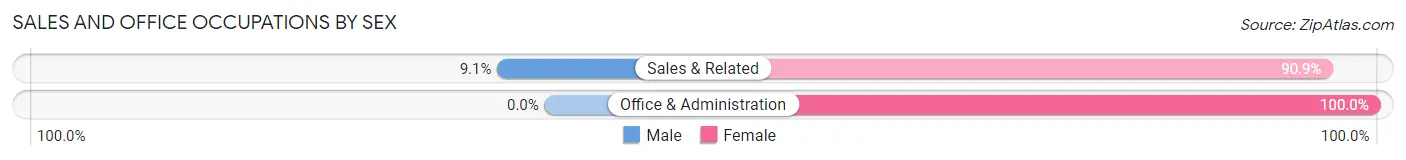
| Occupation | Male | Female |
| Sales & Related | 3 (9.1%) | 30 (90.9%) |
| Office & Administration | 0 (0.0%) | 19 (100.0%) |
| Total (Category) | 3 (5.8%) | 49 (94.2%) |
| Total (Overall) | 99 (44.8%) | 122 (55.2%) |
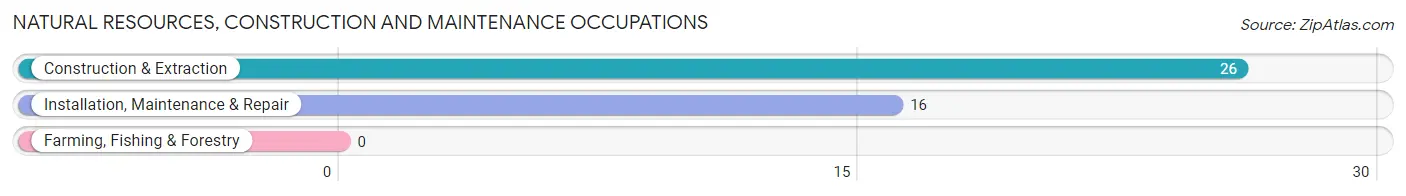
Natural Resources, Construction and Maintenance Occupations
The most common Natural Resources, Construction and Maintenance occupations in Bull Creek are Construction & Extraction (26 | 11.8%), and Installation, Maintenance & Repair (16 | 7.2%).
Natural Resources, Construction and Maintenance Occupations by Sex
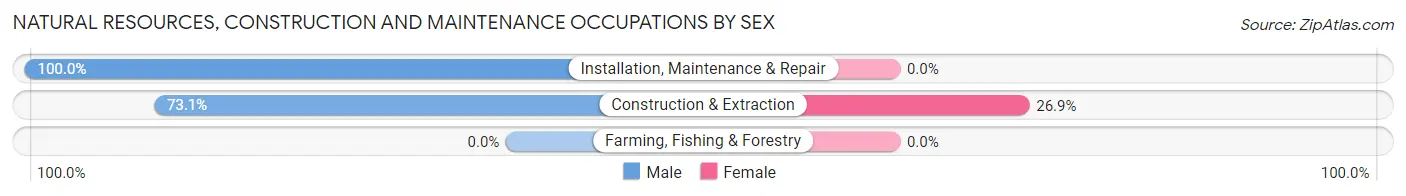
| Occupation | Male | Female |
| Farming, Fishing & Forestry | 0 (0.0%) | 0 (0.0%) |
| Construction & Extraction | 19 (73.1%) | 7 (26.9%) |
| Installation, Maintenance & Repair | 16 (100.0%) | 0 (0.0%) |
| Total (Category) | 35 (83.3%) | 7 (16.7%) |
| Total (Overall) | 99 (44.8%) | 122 (55.2%) |
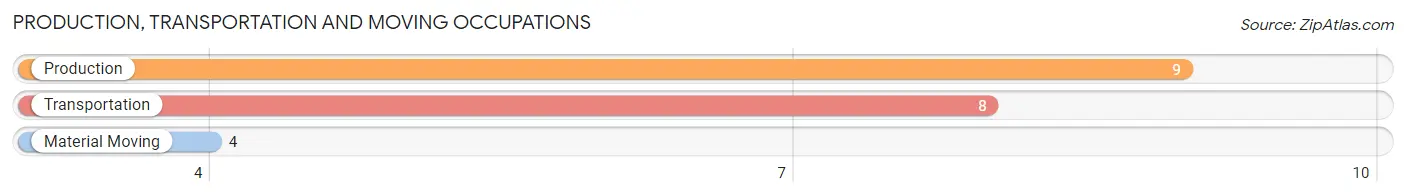
Production, Transportation and Moving Occupations
The most common Production, Transportation and Moving occupations in Bull Creek are Production (9 | 4.1%), Transportation (8 | 3.6%), and Material Moving (4 | 1.8%).
Production, Transportation and Moving Occupations by Sex
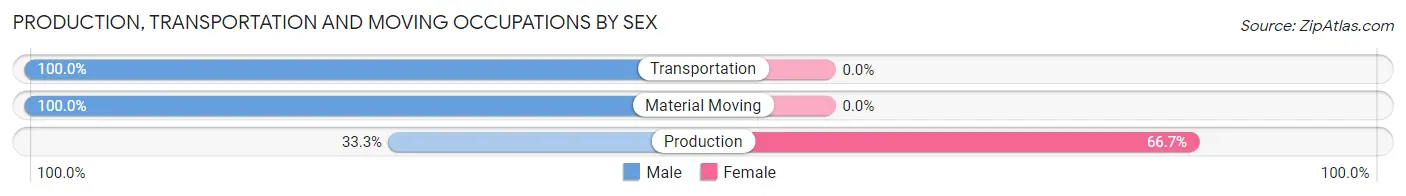
| Occupation | Male | Female |
| Production | 3 (33.3%) | 6 (66.7%) |
| Transportation | 8 (100.0%) | 0 (0.0%) |
| Material Moving | 4 (100.0%) | 0 (0.0%) |
| Total (Category) | 15 (71.4%) | 6 (28.6%) |
| Total (Overall) | 99 (44.8%) | 122 (55.2%) |
Employment Industries by Sex in Bull Creek
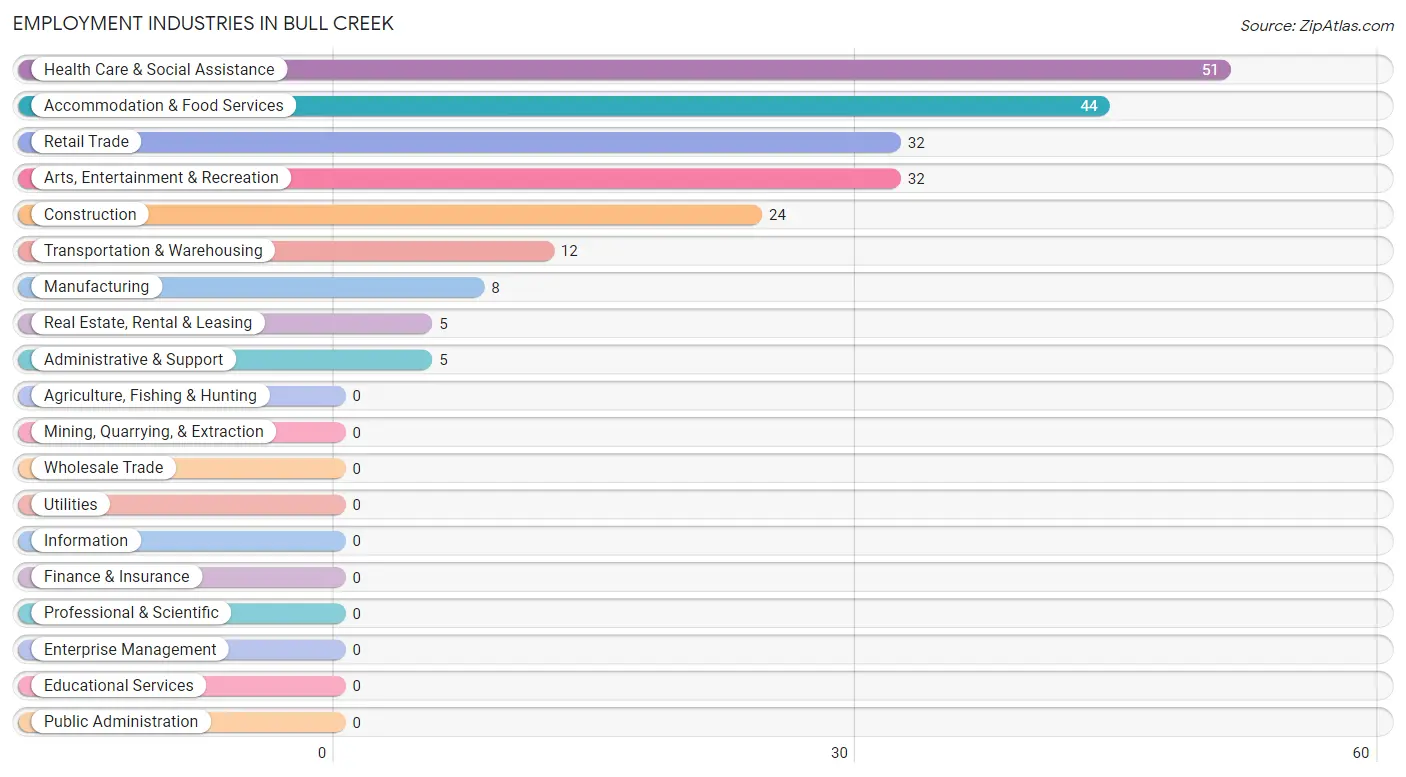
Employment Industries in Bull Creek
The major employment industries in Bull Creek include Health Care & Social Assistance (51 | 23.1%), Accommodation & Food Services (44 | 19.9%), Retail Trade (32 | 14.5%), Arts, Entertainment & Recreation (32 | 14.5%), and Construction (24 | 10.9%).
Employment Industries by Sex in Bull Creek
The Bull Creek industries that see more men than women are Transportation & Warehousing (100.0%), Real Estate, Rental & Leasing (100.0%), and Construction (79.2%), whereas the industries that tend to have a higher number of women are Health Care & Social Assistance (100.0%), Retail Trade (78.1%), and Manufacturing (62.5%).
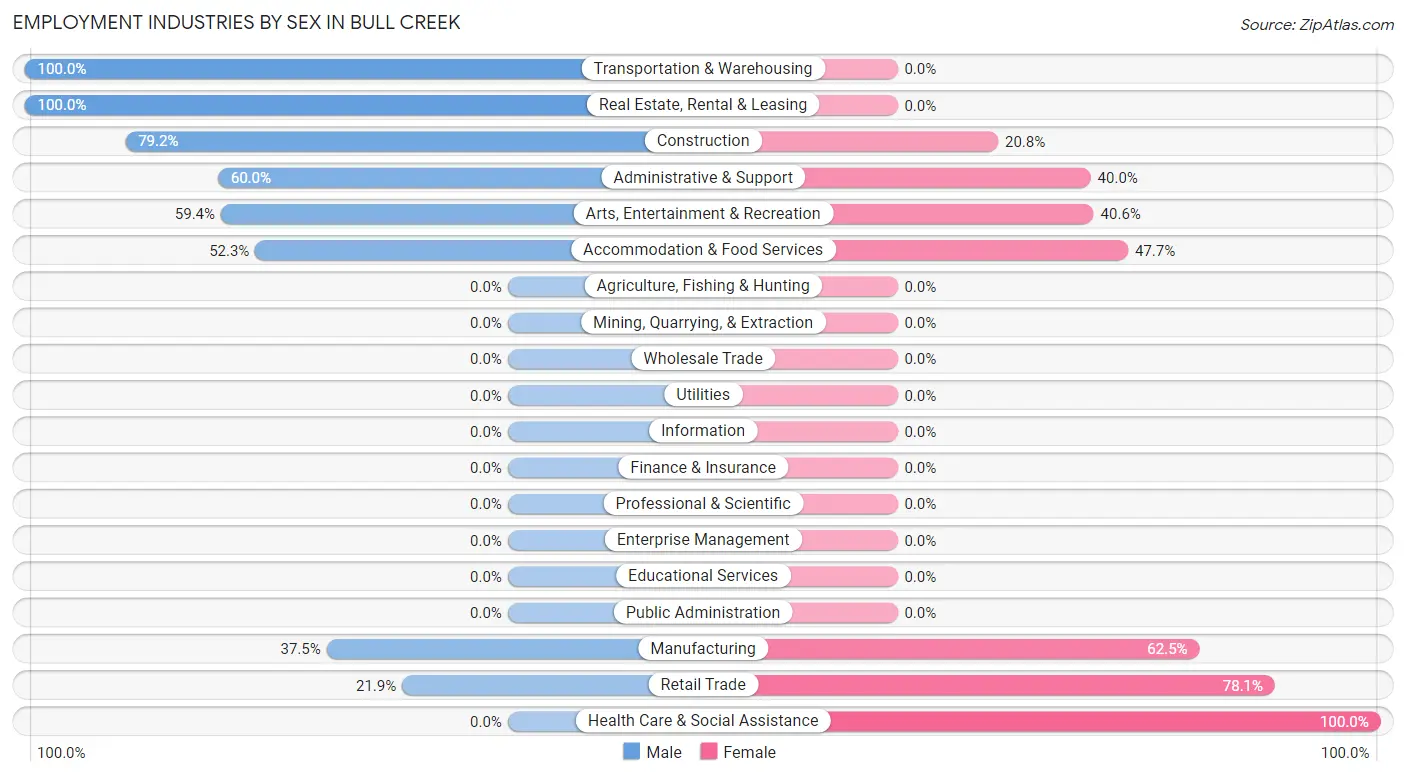
| Industry | Male | Female |
| Agriculture, Fishing & Hunting | 0 (0.0%) | 0 (0.0%) |
| Mining, Quarrying, & Extraction | 0 (0.0%) | 0 (0.0%) |
| Construction | 19 (79.2%) | 5 (20.8%) |
| Manufacturing | 3 (37.5%) | 5 (62.5%) |
| Wholesale Trade | 0 (0.0%) | 0 (0.0%) |
| Retail Trade | 7 (21.9%) | 25 (78.1%) |
| Transportation & Warehousing | 12 (100.0%) | 0 (0.0%) |
| Utilities | 0 (0.0%) | 0 (0.0%) |
| Information | 0 (0.0%) | 0 (0.0%) |
| Finance & Insurance | 0 (0.0%) | 0 (0.0%) |
| Real Estate, Rental & Leasing | 5 (100.0%) | 0 (0.0%) |
| Professional & Scientific | 0 (0.0%) | 0 (0.0%) |
| Enterprise Management | 0 (0.0%) | 0 (0.0%) |
| Administrative & Support | 3 (60.0%) | 2 (40.0%) |
| Educational Services | 0 (0.0%) | 0 (0.0%) |
| Health Care & Social Assistance | 0 (0.0%) | 51 (100.0%) |
| Arts, Entertainment & Recreation | 19 (59.4%) | 13 (40.6%) |
| Accommodation & Food Services | 23 (52.3%) | 21 (47.7%) |
| Public Administration | 0 (0.0%) | 0 (0.0%) |
| Total | 99 (44.8%) | 122 (55.2%) |
Education in Bull Creek
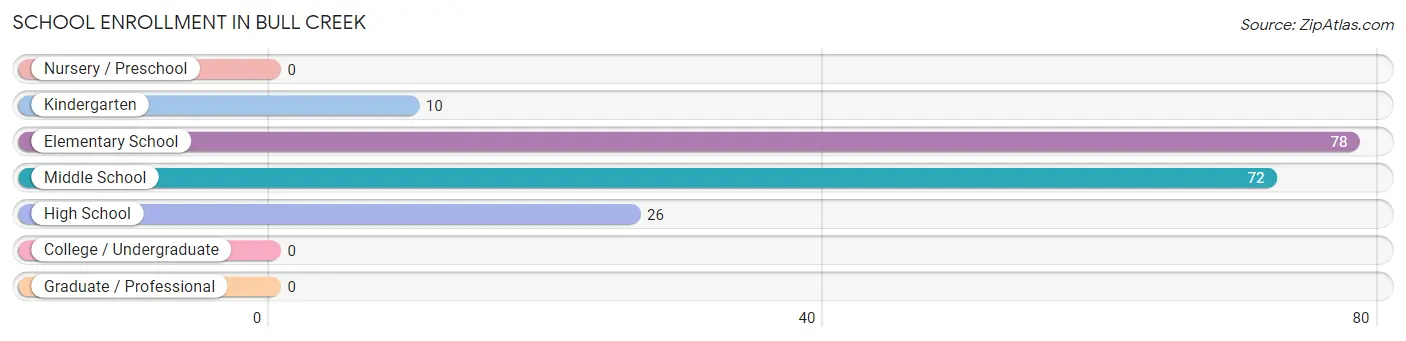
School Enrollment in Bull Creek
The most common levels of schooling among the 186 students in Bull Creek are elementary school (78 | 41.9%), middle school (72 | 38.7%), and high school (26 | 14.0%).
| School Level | # Students | % Students |
| Nursery / Preschool | 0 | 0.0% |
| Kindergarten | 10 | 5.4% |
| Elementary School | 78 | 41.9% |
| Middle School | 72 | 38.7% |
| High School | 26 | 14.0% |
| College / Undergraduate | 0 | 0.0% |
| Graduate / Professional | 0 | 0.0% |
| Total | 186 | 100.0% |
School Enrollment by Age by Funding Source in Bull Creek
Out of a total of 186 students who are enrolled in schools in Bull Creek, 4 (2.2%) attend a private institution, while the remaining 182 (97.8%) are enrolled in public schools. The age group of 10 to 14 year olds has the highest likelihood of being enrolled in private schools, with 4 (4.4% in the age bracket) enrolled. Conversely, the age group of 5 to 9 year old has the lowest likelihood of being enrolled in a private school, with 70 (100.0% in the age bracket) attending a public institution.
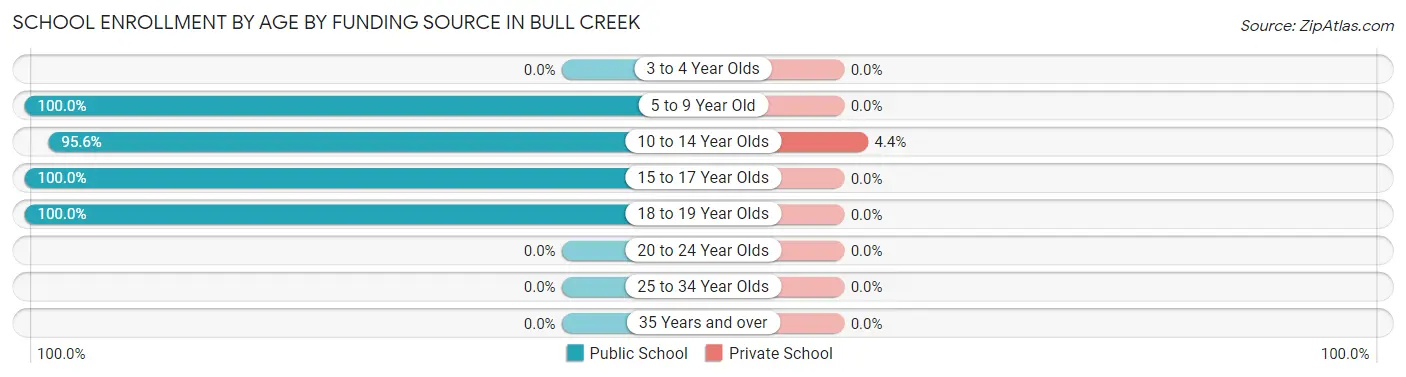
| Age Bracket | Public School | Private School |
| 3 to 4 Year Olds | 0 (0.0%) | 0 (0.0%) |
| 5 to 9 Year Old | 70 (100.0%) | 0 (0.0%) |
| 10 to 14 Year Olds | 86 (95.6%) | 4 (4.4%) |
| 15 to 17 Year Olds | 22 (100.0%) | 0 (0.0%) |
| 18 to 19 Year Olds | 4 (100.0%) | 0 (0.0%) |
| 20 to 24 Year Olds | 0 (0.0%) | 0 (0.0%) |
| 25 to 34 Year Olds | 0 (0.0%) | 0 (0.0%) |
| 35 Years and over | 0 (0.0%) | 0 (0.0%) |
| Total | 182 (97.8%) | 4 (2.2%) |
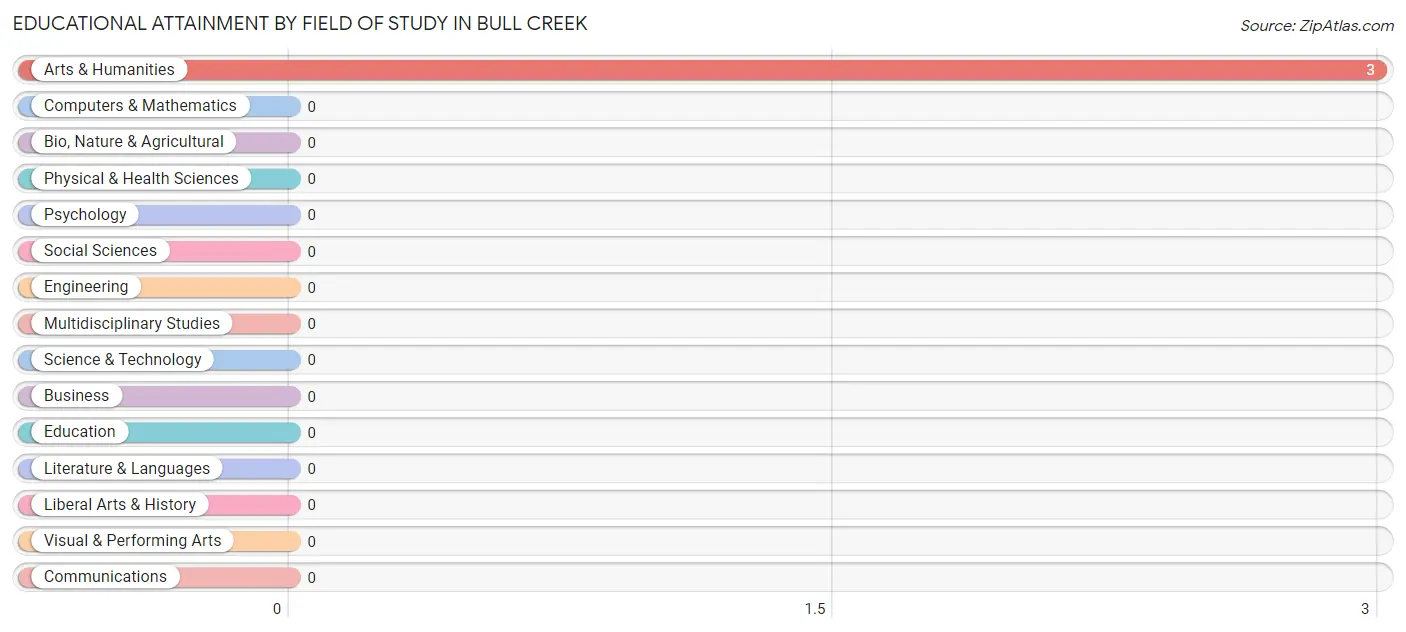
Educational Attainment by Field of Study in Bull Creek
, and arts & humanities (3 | 100.0%) are the most common fields of study among 3 individuals in Bull Creek who have obtained a bachelor's degree or higher.
| Field of Study | # Graduates | % Graduates |
| Computers & Mathematics | 0 | 0.0% |
| Bio, Nature & Agricultural | 0 | 0.0% |
| Physical & Health Sciences | 0 | 0.0% |
| Psychology | 0 | 0.0% |
| Social Sciences | 0 | 0.0% |
| Engineering | 0 | 0.0% |
| Multidisciplinary Studies | 0 | 0.0% |
| Science & Technology | 0 | 0.0% |
| Business | 0 | 0.0% |
| Education | 0 | 0.0% |
| Literature & Languages | 0 | 0.0% |
| Liberal Arts & History | 0 | 0.0% |
| Visual & Performing Arts | 0 | 0.0% |
| Communications | 0 | 0.0% |
| Arts & Humanities | 3 | 100.0% |
| Total | 3 | 100.0% |
Transportation & Commute in Bull Creek
Vehicle Availability by Sex in Bull Creek
The most prevalent vehicle ownership categories in Bull Creek are males with 2 vehicles (52, accounting for 53.1%) and females with 2 vehicles (43, making up 48.1%).
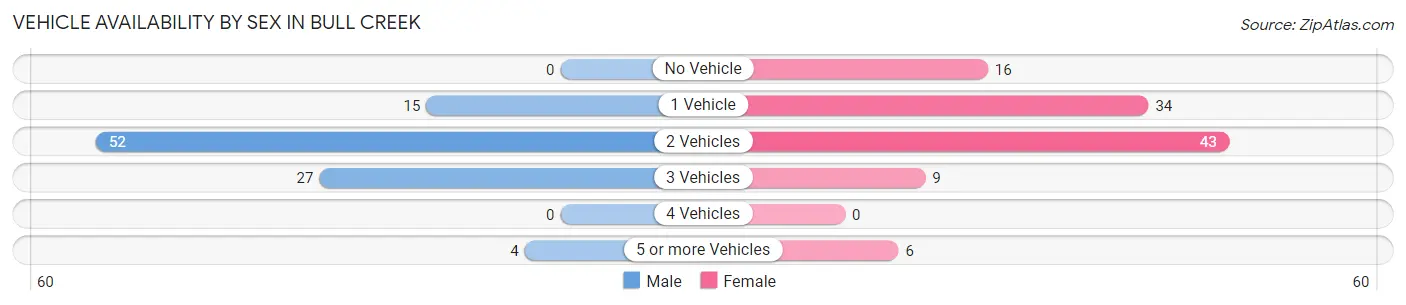
| Vehicles Available | Male | Female |
| No Vehicle | 0 (0.0%) | 16 (14.8%) |
| 1 Vehicle | 15 (15.3%) | 34 (31.5%) |
| 2 Vehicles | 52 (53.1%) | 43 (39.8%) |
| 3 Vehicles | 27 (27.6%) | 9 (8.3%) |
| 4 Vehicles | 0 (0.0%) | 0 (0.0%) |
| 5 or more Vehicles | 4 (4.1%) | 6 (5.6%) |
| Total | 98 (100.0%) | 108 (100.0%) |
Commute Time in Bull Creek
The most frequently occuring commute durations in Bull Creek are 15 to 19 minutes (62 commuters, 35.2%), 20 to 24 minutes (38 commuters, 21.6%), and 10 to 14 minutes (29 commuters, 16.5%).
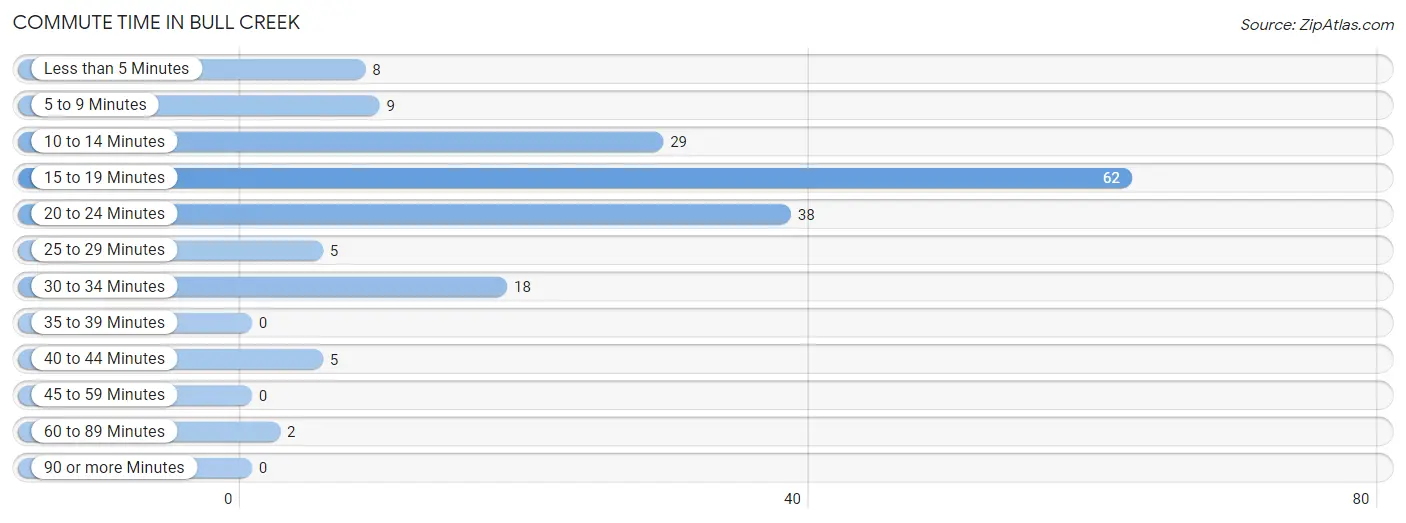
| Commute Time | # Commuters | % Commuters |
| Less than 5 Minutes | 8 | 4.5% |
| 5 to 9 Minutes | 9 | 5.1% |
| 10 to 14 Minutes | 29 | 16.5% |
| 15 to 19 Minutes | 62 | 35.2% |
| 20 to 24 Minutes | 38 | 21.6% |
| 25 to 29 Minutes | 5 | 2.8% |
| 30 to 34 Minutes | 18 | 10.2% |
| 35 to 39 Minutes | 0 | 0.0% |
| 40 to 44 Minutes | 5 | 2.8% |
| 45 to 59 Minutes | 0 | 0.0% |
| 60 to 89 Minutes | 2 | 1.1% |
| 90 or more Minutes | 0 | 0.0% |
Commute Time by Sex in Bull Creek
The most common commute times in Bull Creek are 15 to 19 minutes (50 commuters, 51.0%) for males and 10 to 14 minutes (29 commuters, 37.2%) for females.
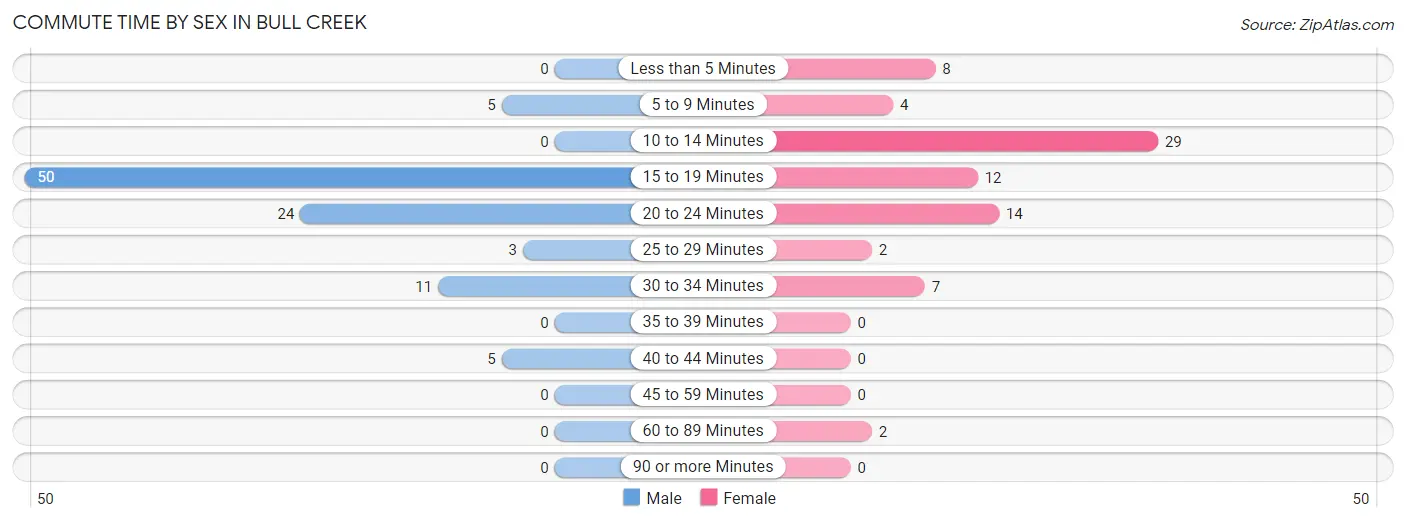
| Commute Time | Male | Female |
| Less than 5 Minutes | 0 (0.0%) | 8 (10.3%) |
| 5 to 9 Minutes | 5 (5.1%) | 4 (5.1%) |
| 10 to 14 Minutes | 0 (0.0%) | 29 (37.2%) |
| 15 to 19 Minutes | 50 (51.0%) | 12 (15.4%) |
| 20 to 24 Minutes | 24 (24.5%) | 14 (17.9%) |
| 25 to 29 Minutes | 3 (3.1%) | 2 (2.6%) |
| 30 to 34 Minutes | 11 (11.2%) | 7 (9.0%) |
| 35 to 39 Minutes | 0 (0.0%) | 0 (0.0%) |
| 40 to 44 Minutes | 5 (5.1%) | 0 (0.0%) |
| 45 to 59 Minutes | 0 (0.0%) | 0 (0.0%) |
| 60 to 89 Minutes | 0 (0.0%) | 2 (2.6%) |
| 90 or more Minutes | 0 (0.0%) | 0 (0.0%) |
Time of Departure to Work by Sex in Bull Creek
The most frequent times of departure to work in Bull Creek are 12:00 PM to 3:59 PM (20, 20.4%) for males and 7:30 AM to 7:59 AM (16, 20.5%) for females.
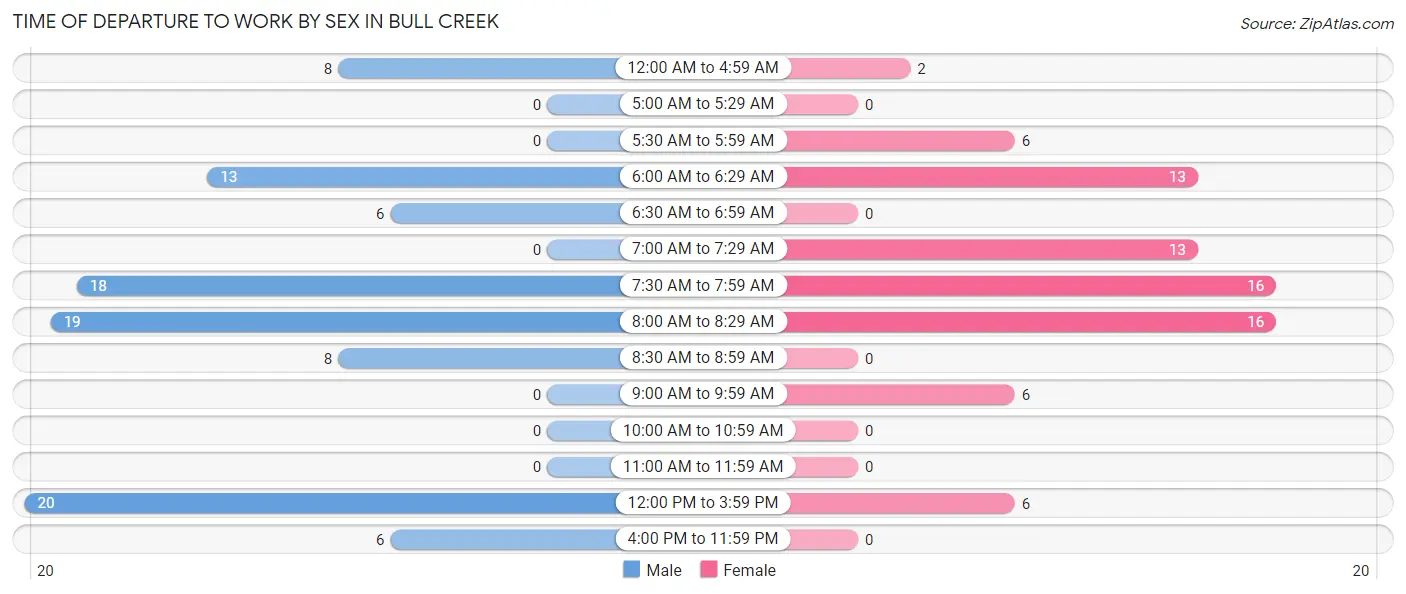
| Time of Departure | Male | Female |
| 12:00 AM to 4:59 AM | 8 (8.2%) | 2 (2.6%) |
| 5:00 AM to 5:29 AM | 0 (0.0%) | 0 (0.0%) |
| 5:30 AM to 5:59 AM | 0 (0.0%) | 6 (7.7%) |
| 6:00 AM to 6:29 AM | 13 (13.3%) | 13 (16.7%) |
| 6:30 AM to 6:59 AM | 6 (6.1%) | 0 (0.0%) |
| 7:00 AM to 7:29 AM | 0 (0.0%) | 13 (16.7%) |
| 7:30 AM to 7:59 AM | 18 (18.4%) | 16 (20.5%) |
| 8:00 AM to 8:29 AM | 19 (19.4%) | 16 (20.5%) |
| 8:30 AM to 8:59 AM | 8 (8.2%) | 0 (0.0%) |
| 9:00 AM to 9:59 AM | 0 (0.0%) | 6 (7.7%) |
| 10:00 AM to 10:59 AM | 0 (0.0%) | 0 (0.0%) |
| 11:00 AM to 11:59 AM | 0 (0.0%) | 0 (0.0%) |
| 12:00 PM to 3:59 PM | 20 (20.4%) | 6 (7.7%) |
| 4:00 PM to 11:59 PM | 6 (6.1%) | 0 (0.0%) |
| Total | 98 (100.0%) | 78 (100.0%) |
Housing Occupancy in Bull Creek
Occupancy by Ownership in Bull Creek
Of the total 188 dwellings in Bull Creek, owner-occupied units account for 8 (4.3%), while renter-occupied units make up 180 (95.7%).
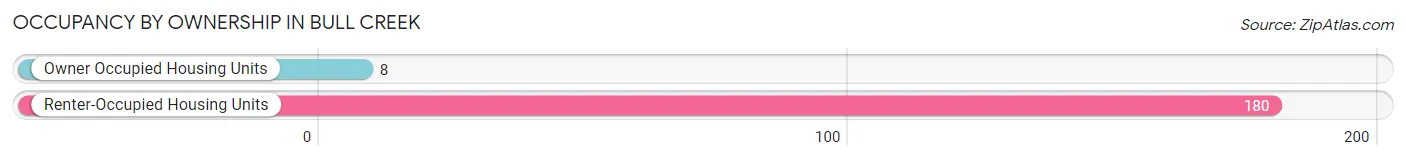
| Occupancy | # Housing Units | % Housing Units |
| Owner Occupied Housing Units | 8 | 4.3% |
| Renter-Occupied Housing Units | 180 | 95.7% |
| Total Occupied Housing Units | 188 | 100.0% |
Occupancy by Household Size in Bull Creek
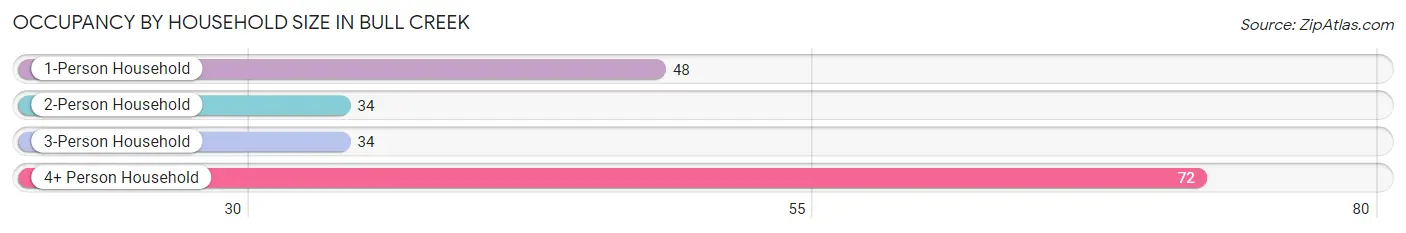
| Household Size | # Housing Units | % Housing Units |
| 1-Person Household | 48 | 25.5% |
| 2-Person Household | 34 | 18.1% |
| 3-Person Household | 34 | 18.1% |
| 4+ Person Household | 72 | 38.3% |
| Total Housing Units | 188 | 100.0% |
Occupancy by Ownership by Household Size in Bull Creek
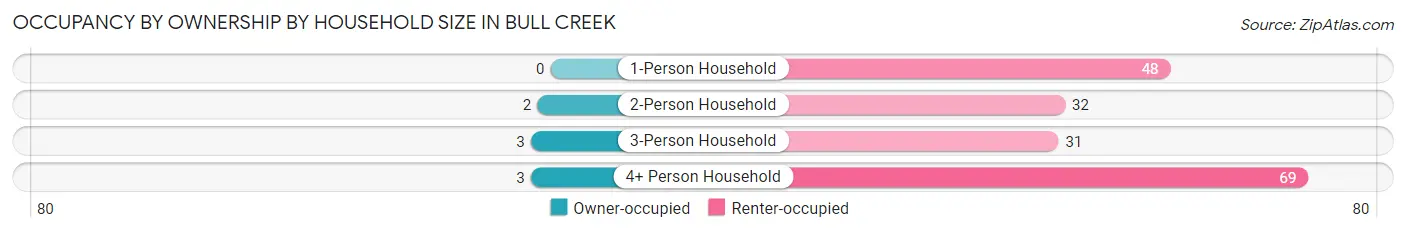
| Household Size | Owner-occupied | Renter-occupied |
| 1-Person Household | 0 (0.0%) | 48 (100.0%) |
| 2-Person Household | 2 (5.9%) | 32 (94.1%) |
| 3-Person Household | 3 (8.8%) | 31 (91.2%) |
| 4+ Person Household | 3 (4.2%) | 69 (95.8%) |
| Total Housing Units | 8 (4.3%) | 180 (95.7%) |
Occupancy by Educational Attainment in Bull Creek
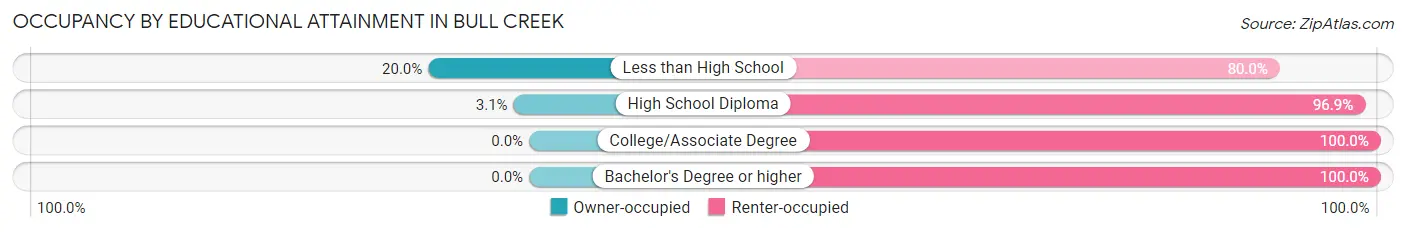
| Household Size | Owner-occupied | Renter-occupied |
| Less than High School | 5 (20.0%) | 20 (80.0%) |
| High School Diploma | 3 (3.1%) | 94 (96.9%) |
| College/Associate Degree | 0 (0.0%) | 63 (100.0%) |
| Bachelor's Degree or higher | 0 (0.0%) | 3 (100.0%) |
Occupancy by Age of Householder in Bull Creek
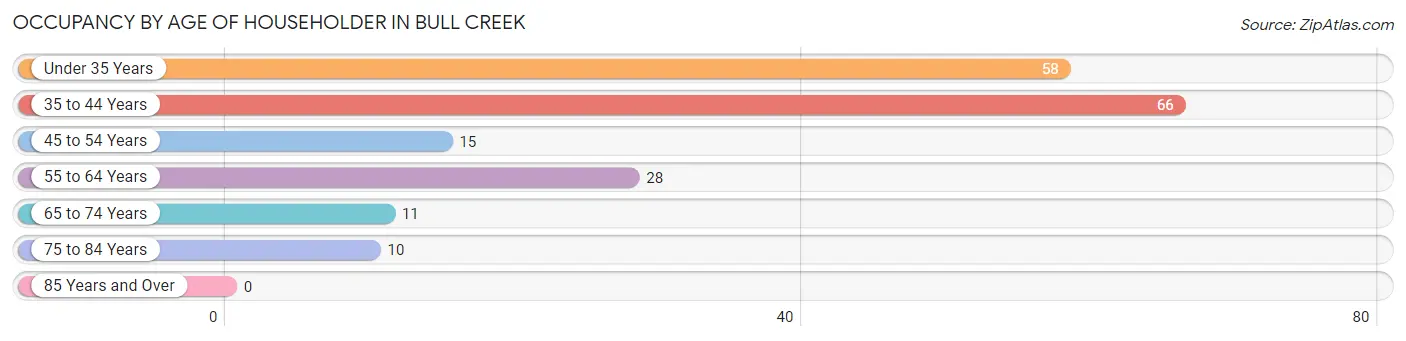
| Age Bracket | # Households | % Households |
| Under 35 Years | 58 | 30.8% |
| 35 to 44 Years | 66 | 35.1% |
| 45 to 54 Years | 15 | 8.0% |
| 55 to 64 Years | 28 | 14.9% |
| 65 to 74 Years | 11 | 5.9% |
| 75 to 84 Years | 10 | 5.3% |
| 85 Years and Over | 0 | 0.0% |
| Total | 188 | 100.0% |
Housing Finances in Bull Creek
Median Income by Occupancy in Bull Creek
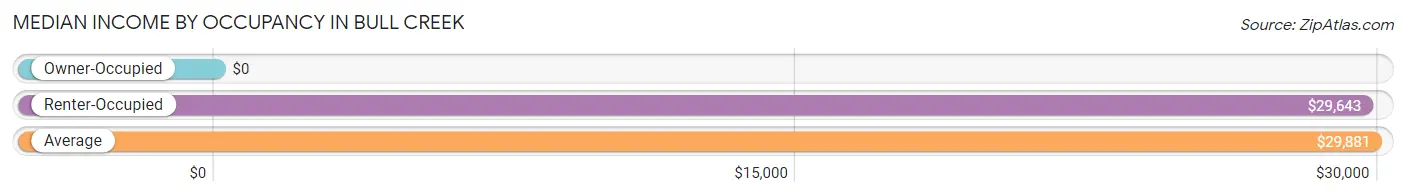
| Occupancy Type | # Households | Median Income |
| Owner-Occupied | 8 (4.3%) | $0 |
| Renter-Occupied | 180 (95.7%) | $29,643 |
| Average | 188 (100.0%) | $29,881 |
Occupancy by Householder Income Bracket in Bull Creek
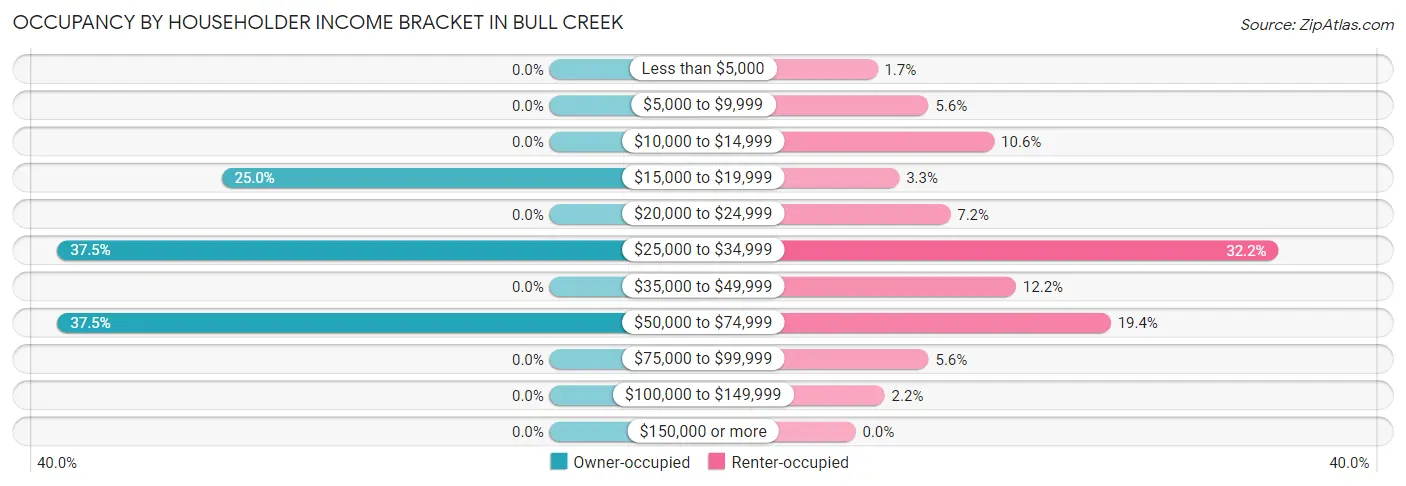
| Income Bracket | Owner-occupied | Renter-occupied |
| Less than $5,000 | 0 (0.0%) | 3 (1.7%) |
| $5,000 to $9,999 | 0 (0.0%) | 10 (5.6%) |
| $10,000 to $14,999 | 0 (0.0%) | 19 (10.6%) |
| $15,000 to $19,999 | 2 (25.0%) | 6 (3.3%) |
| $20,000 to $24,999 | 0 (0.0%) | 13 (7.2%) |
| $25,000 to $34,999 | 3 (37.5%) | 58 (32.2%) |
| $35,000 to $49,999 | 0 (0.0%) | 22 (12.2%) |
| $50,000 to $74,999 | 3 (37.5%) | 35 (19.4%) |
| $75,000 to $99,999 | 0 (0.0%) | 10 (5.6%) |
| $100,000 to $149,999 | 0 (0.0%) | 4 (2.2%) |
| $150,000 or more | 0 (0.0%) | 0 (0.0%) |
| Total | 8 (100.0%) | 180 (100.0%) |
Monthly Housing Cost Tiers in Bull Creek
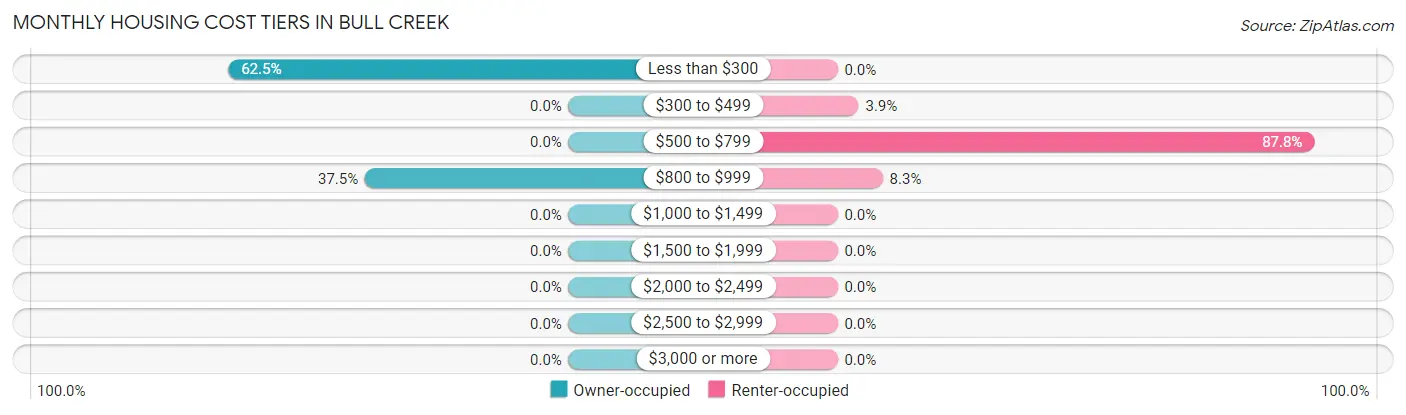
| Monthly Cost | Owner-occupied | Renter-occupied |
| Less than $300 | 5 (62.5%) | 0 (0.0%) |
| $300 to $499 | 0 (0.0%) | 7 (3.9%) |
| $500 to $799 | 0 (0.0%) | 158 (87.8%) |
| $800 to $999 | 3 (37.5%) | 15 (8.3%) |
| $1,000 to $1,499 | 0 (0.0%) | 0 (0.0%) |
| $1,500 to $1,999 | 0 (0.0%) | 0 (0.0%) |
| $2,000 to $2,499 | 0 (0.0%) | 0 (0.0%) |
| $2,500 to $2,999 | 0 (0.0%) | 0 (0.0%) |
| $3,000 or more | 0 (0.0%) | 0 (0.0%) |
| Total | 8 (100.0%) | 180 (100.0%) |
Physical Housing Characteristics in Bull Creek
Housing Structures in Bull Creek
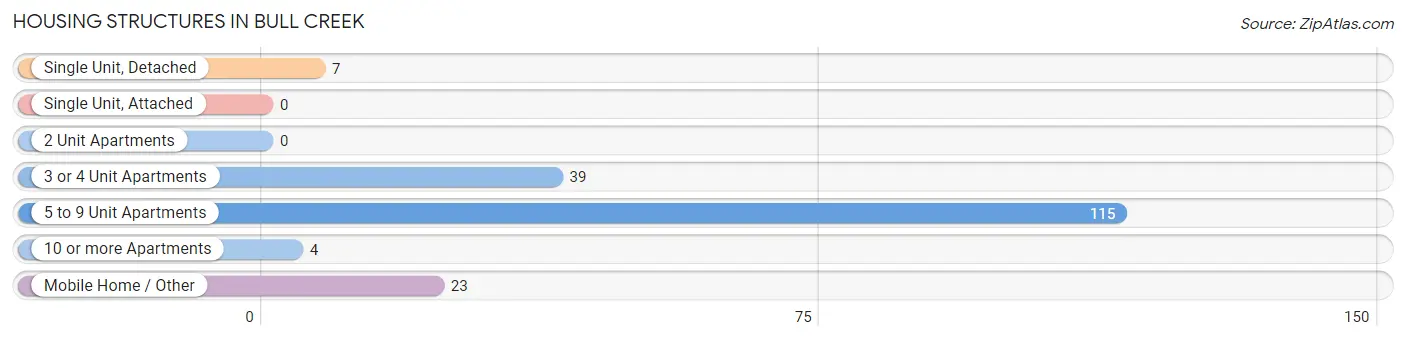
| Structure Type | # Housing Units | % Housing Units |
| Single Unit, Detached | 7 | 3.7% |
| Single Unit, Attached | 0 | 0.0% |
| 2 Unit Apartments | 0 | 0.0% |
| 3 or 4 Unit Apartments | 39 | 20.7% |
| 5 to 9 Unit Apartments | 115 | 61.2% |
| 10 or more Apartments | 4 | 2.1% |
| Mobile Home / Other | 23 | 12.2% |
| Total | 188 | 100.0% |
Housing Structures by Occupancy in Bull Creek
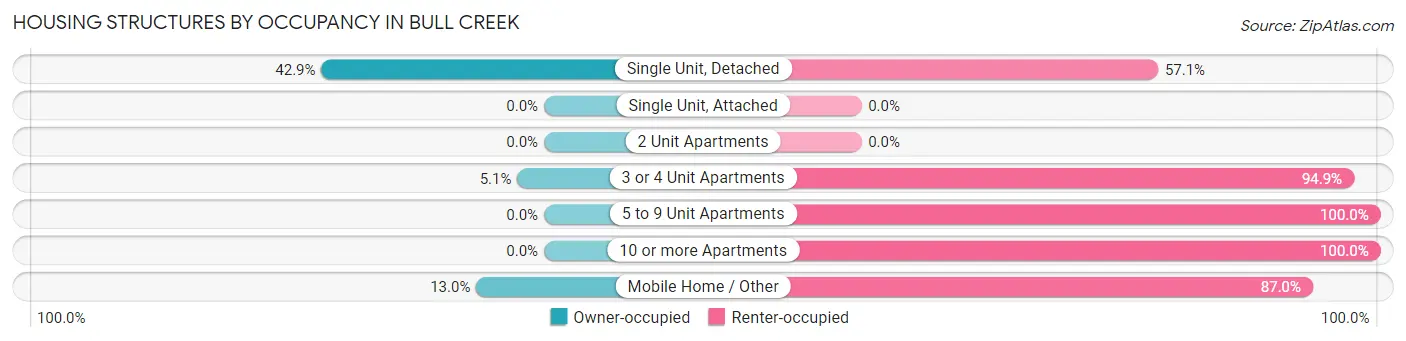
| Structure Type | Owner-occupied | Renter-occupied |
| Single Unit, Detached | 3 (42.9%) | 4 (57.1%) |
| Single Unit, Attached | 0 (0.0%) | 0 (0.0%) |
| 2 Unit Apartments | 0 (0.0%) | 0 (0.0%) |
| 3 or 4 Unit Apartments | 2 (5.1%) | 37 (94.9%) |
| 5 to 9 Unit Apartments | 0 (0.0%) | 115 (100.0%) |
| 10 or more Apartments | 0 (0.0%) | 4 (100.0%) |
| Mobile Home / Other | 3 (13.0%) | 20 (87.0%) |
| Total | 8 (4.3%) | 180 (95.7%) |
Housing Structures by Number of Rooms in Bull Creek
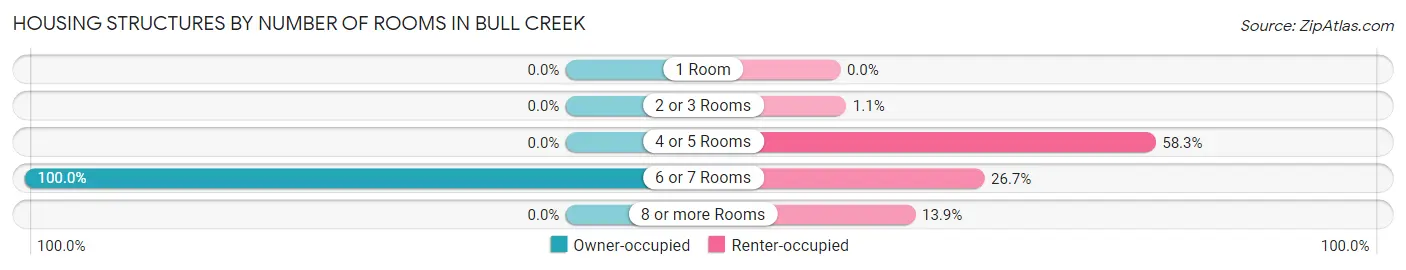
| Number of Rooms | Owner-occupied | Renter-occupied |
| 1 Room | 0 (0.0%) | 0 (0.0%) |
| 2 or 3 Rooms | 0 (0.0%) | 2 (1.1%) |
| 4 or 5 Rooms | 0 (0.0%) | 105 (58.3%) |
| 6 or 7 Rooms | 8 (100.0%) | 48 (26.7%) |
| 8 or more Rooms | 0 (0.0%) | 25 (13.9%) |
| Total | 8 (100.0%) | 180 (100.0%) |
Housing Structure by Heating Type in Bull Creek
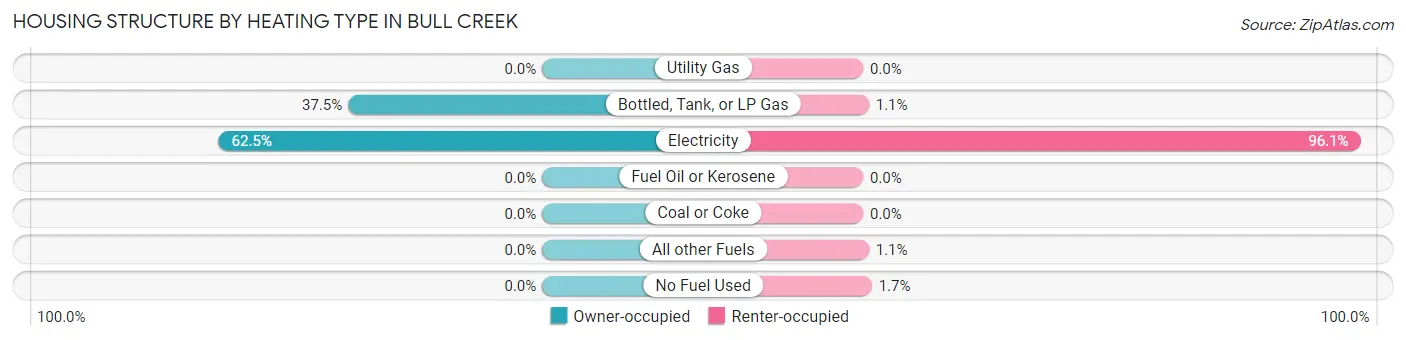
| Heating Type | Owner-occupied | Renter-occupied |
| Utility Gas | 0 (0.0%) | 0 (0.0%) |
| Bottled, Tank, or LP Gas | 3 (37.5%) | 2 (1.1%) |
| Electricity | 5 (62.5%) | 173 (96.1%) |
| Fuel Oil or Kerosene | 0 (0.0%) | 0 (0.0%) |
| Coal or Coke | 0 (0.0%) | 0 (0.0%) |
| All other Fuels | 0 (0.0%) | 2 (1.1%) |
| No Fuel Used | 0 (0.0%) | 3 (1.7%) |
| Total | 8 (100.0%) | 180 (100.0%) |
Household Vehicle Usage in Bull Creek
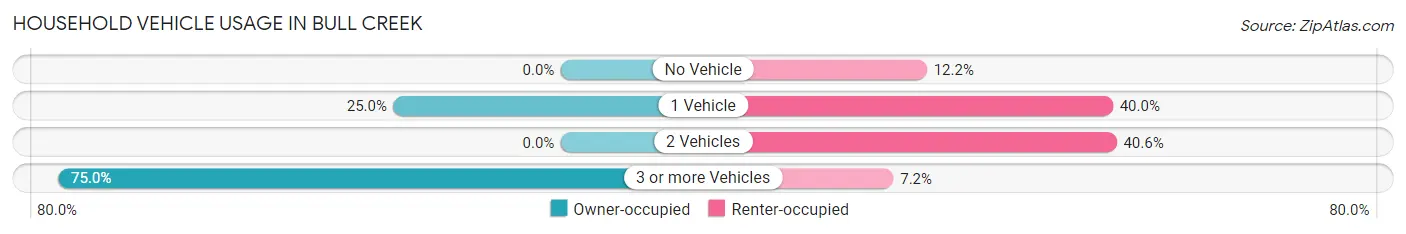
| Vehicles per Household | Owner-occupied | Renter-occupied |
| No Vehicle | 0 (0.0%) | 22 (12.2%) |
| 1 Vehicle | 2 (25.0%) | 72 (40.0%) |
| 2 Vehicles | 0 (0.0%) | 73 (40.6%) |
| 3 or more Vehicles | 6 (75.0%) | 13 (7.2%) |
| Total | 8 (100.0%) | 180 (100.0%) |
Real Estate & Mortgages in Bull Creek
Real Estate and Mortgage Overview in Bull Creek
| Characteristic | Without Mortgage | With Mortgage |
| Housing Units | 5 | 3 |
| Median Property Value | - | - |
| Median Household Income | - | - |
| Monthly Housing Costs | - | - |
| Real Estate Taxes | - | - |
Property Value by Mortgage Status in Bull Creek
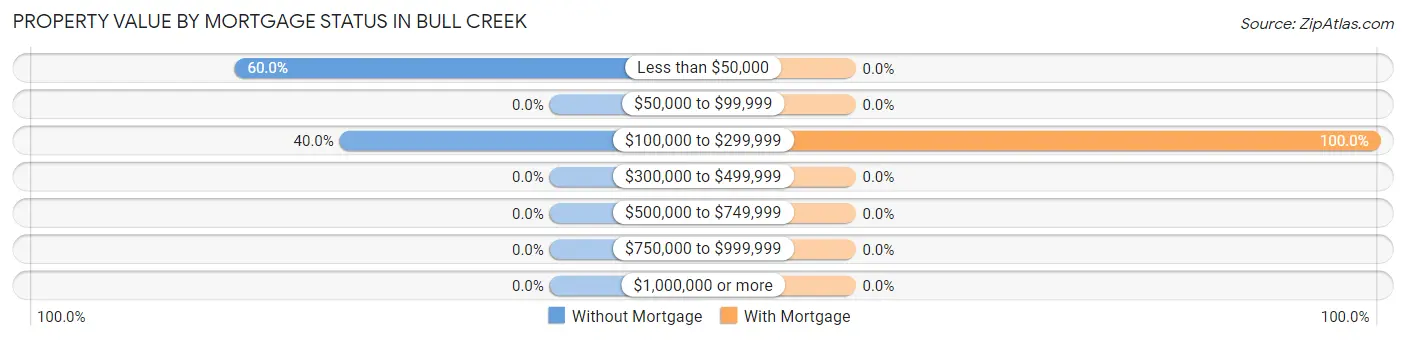
| Property Value | Without Mortgage | With Mortgage |
| Less than $50,000 | 3 (60.0%) | 0 (0.0%) |
| $50,000 to $99,999 | 0 (0.0%) | 0 (0.0%) |
| $100,000 to $299,999 | 2 (40.0%) | 3 (100.0%) |
| $300,000 to $499,999 | 0 (0.0%) | 0 (0.0%) |
| $500,000 to $749,999 | 0 (0.0%) | 0 (0.0%) |
| $750,000 to $999,999 | 0 (0.0%) | 0 (0.0%) |
| $1,000,000 or more | 0 (0.0%) | 0 (0.0%) |
| Total | 5 (100.0%) | 3 (100.0%) |
Household Income by Mortgage Status in Bull Creek
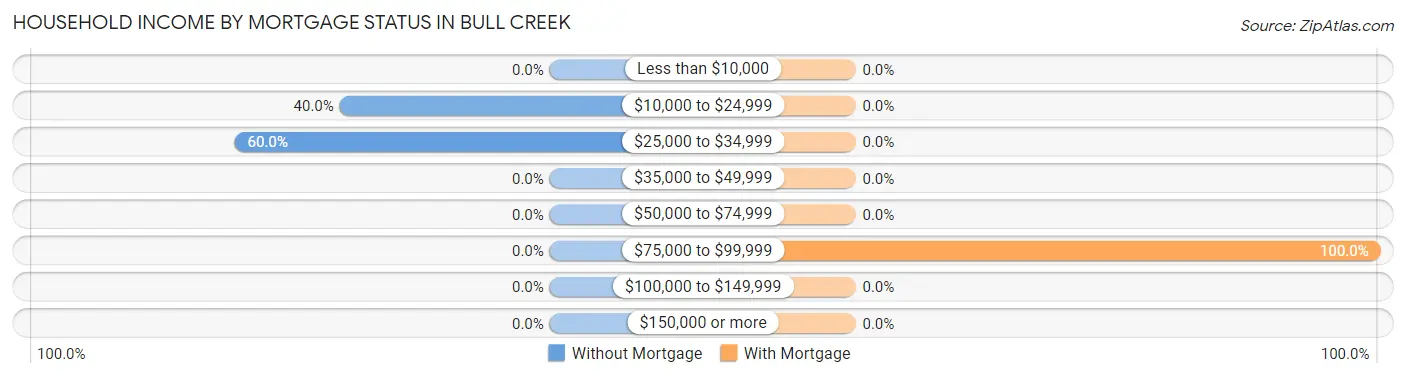
| Household Income | Without Mortgage | With Mortgage |
| Less than $10,000 | 0 (0.0%) | 0 (0.0%) |
| $10,000 to $24,999 | 2 (40.0%) | 0 (0.0%) |
| $25,000 to $34,999 | 3 (60.0%) | 0 (0.0%) |
| $35,000 to $49,999 | 0 (0.0%) | 0 (0.0%) |
| $50,000 to $74,999 | 0 (0.0%) | 0 (0.0%) |
| $75,000 to $99,999 | 0 (0.0%) | 3 (100.0%) |
| $100,000 to $149,999 | 0 (0.0%) | 0 (0.0%) |
| $150,000 or more | 0 (0.0%) | 0 (0.0%) |
| Total | 5 (100.0%) | 3 (100.0%) |
Property Value to Household Income Ratio in Bull Creek
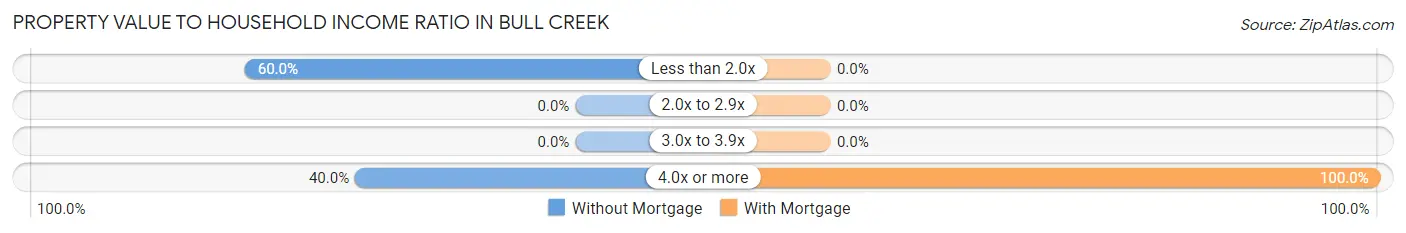
| Value-to-Income Ratio | Without Mortgage | With Mortgage |
| Less than 2.0x | 3 (60.0%) | 0 (0.0%) |
| 2.0x to 2.9x | 0 (0.0%) | 0 (0.0%) |
| 3.0x to 3.9x | 0 (0.0%) | 0 (0.0%) |
| 4.0x or more | 2 (40.0%) | 3 (100.0%) |
| Total | 5 (100.0%) | 3 (100.0%) |
Real Estate Taxes by Mortgage Status in Bull Creek

| Property Taxes | Without Mortgage | With Mortgage |
| Less than $800 | 0 (0.0%) | 0 (0.0%) |
| $800 to $1,499 | 2 (40.0%) | 0 (0.0%) |
| $800 to $1,499 | 0 (0.0%) | 3 (100.0%) |
| Total | 5 (100.0%) | 3 (100.0%) |
Health & Disability in Bull Creek
Health Insurance Coverage by Age in Bull Creek
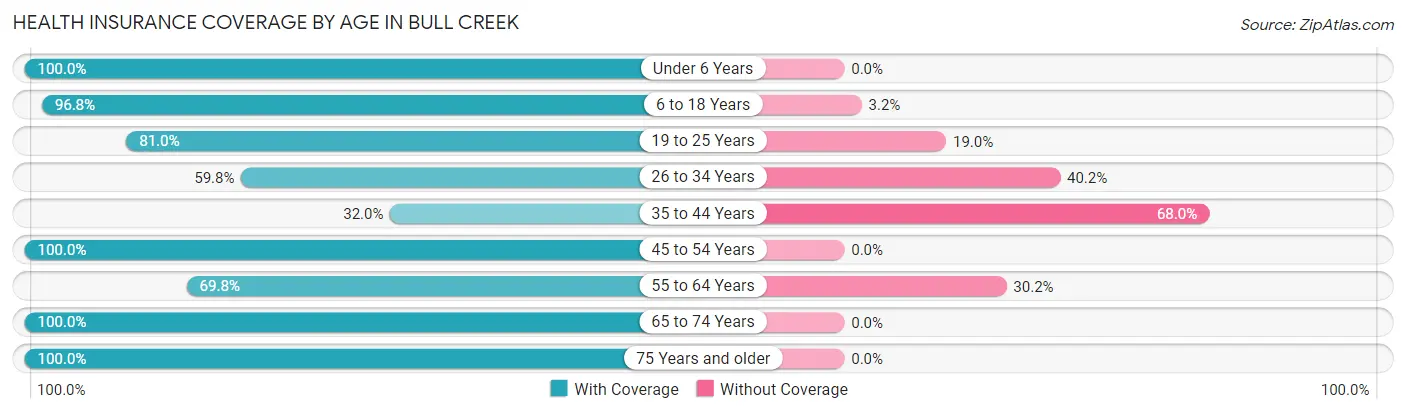
| Age Bracket | With Coverage | Without Coverage |
| Under 6 Years | 47 (100.0%) | 0 (0.0%) |
| 6 to 18 Years | 180 (96.8%) | 6 (3.2%) |
| 19 to 25 Years | 47 (81.0%) | 11 (19.0%) |
| 26 to 34 Years | 52 (59.8%) | 35 (40.2%) |
| 35 to 44 Years | 24 (32.0%) | 51 (68.0%) |
| 45 to 54 Years | 31 (100.0%) | 0 (0.0%) |
| 55 to 64 Years | 30 (69.8%) | 13 (30.2%) |
| 65 to 74 Years | 26 (100.0%) | 0 (0.0%) |
| 75 Years and older | 14 (100.0%) | 0 (0.0%) |
| Total | 451 (79.5%) | 116 (20.5%) |
Health Insurance Coverage by Citizenship Status in Bull Creek

| Citizenship Status | With Coverage | Without Coverage |
| Native Born | 47 (100.0%) | 0 (0.0%) |
| Foreign Born, Citizen | 180 (96.8%) | 6 (3.2%) |
| Foreign Born, not a Citizen | 47 (81.0%) | 11 (19.0%) |
Health Insurance Coverage by Household Income in Bull Creek
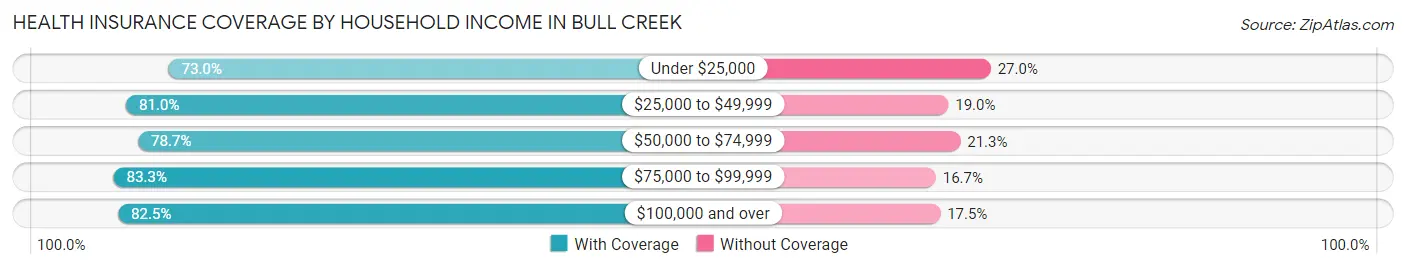
| Household Income | With Coverage | Without Coverage |
| Under $25,000 | 65 (73.0%) | 24 (27.0%) |
| $25,000 to $49,999 | 213 (81.0%) | 50 (19.0%) |
| $50,000 to $74,999 | 100 (78.7%) | 27 (21.3%) |
| $75,000 to $99,999 | 40 (83.3%) | 8 (16.7%) |
| $100,000 and over | 33 (82.5%) | 7 (17.5%) |
Public vs Private Health Insurance Coverage by Age in Bull Creek
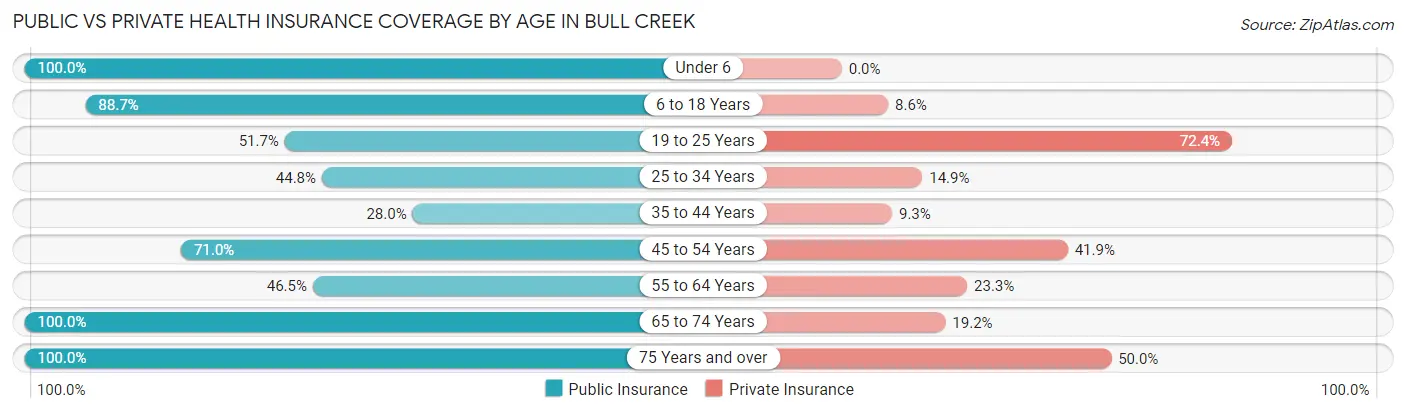
| Age Bracket | Public Insurance | Private Insurance |
| Under 6 | 47 (100.0%) | 0 (0.0%) |
| 6 to 18 Years | 165 (88.7%) | 16 (8.6%) |
| 19 to 25 Years | 30 (51.7%) | 42 (72.4%) |
| 25 to 34 Years | 39 (44.8%) | 13 (14.9%) |
| 35 to 44 Years | 21 (28.0%) | 7 (9.3%) |
| 45 to 54 Years | 22 (71.0%) | 13 (41.9%) |
| 55 to 64 Years | 20 (46.5%) | 10 (23.3%) |
| 65 to 74 Years | 26 (100.0%) | 5 (19.2%) |
| 75 Years and over | 14 (100.0%) | 7 (50.0%) |
| Total | 384 (67.7%) | 113 (19.9%) |
Disability Status by Sex by Age in Bull Creek
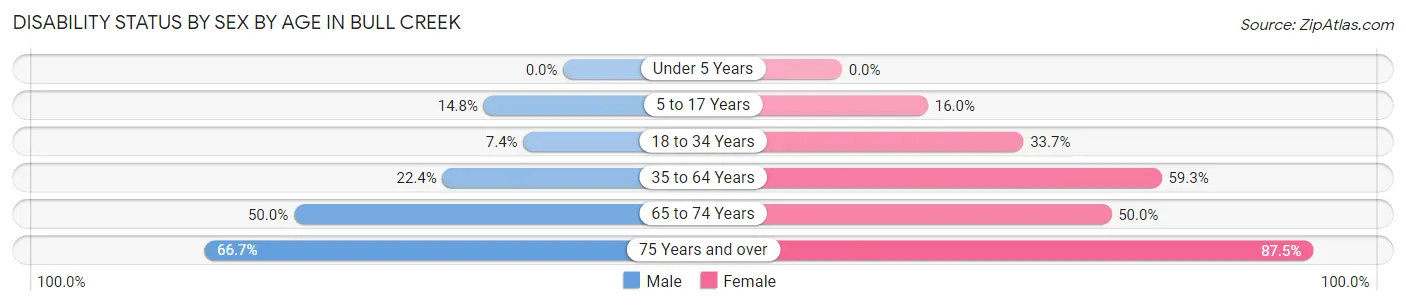
| Age Bracket | Male | Female |
| Under 5 Years | 0 (0.0%) | 0 (0.0%) |
| 5 to 17 Years | 13 (14.8%) | 15 (16.0%) |
| 18 to 34 Years | 4 (7.4%) | 32 (33.7%) |
| 35 to 64 Years | 13 (22.4%) | 54 (59.3%) |
| 65 to 74 Years | 2 (50.0%) | 11 (50.0%) |
| 75 Years and over | 4 (66.7%) | 7 (87.5%) |
Disability Class by Sex by Age in Bull Creek
Disability Class: Hearing Difficulty
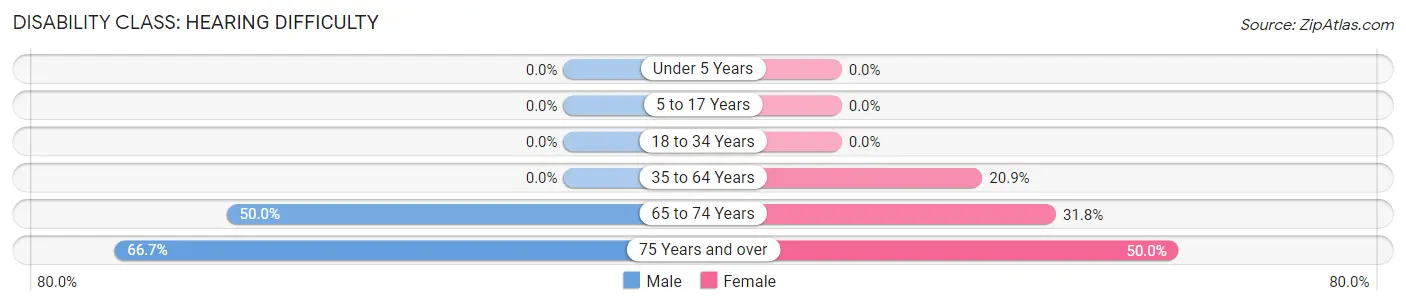
| Age Bracket | Male | Female |
| Under 5 Years | 0 (0.0%) | 0 (0.0%) |
| 5 to 17 Years | 0 (0.0%) | 0 (0.0%) |
| 18 to 34 Years | 0 (0.0%) | 0 (0.0%) |
| 35 to 64 Years | 0 (0.0%) | 19 (20.9%) |
| 65 to 74 Years | 2 (50.0%) | 7 (31.8%) |
| 75 Years and over | 4 (66.7%) | 4 (50.0%) |
Disability Class: Vision Difficulty
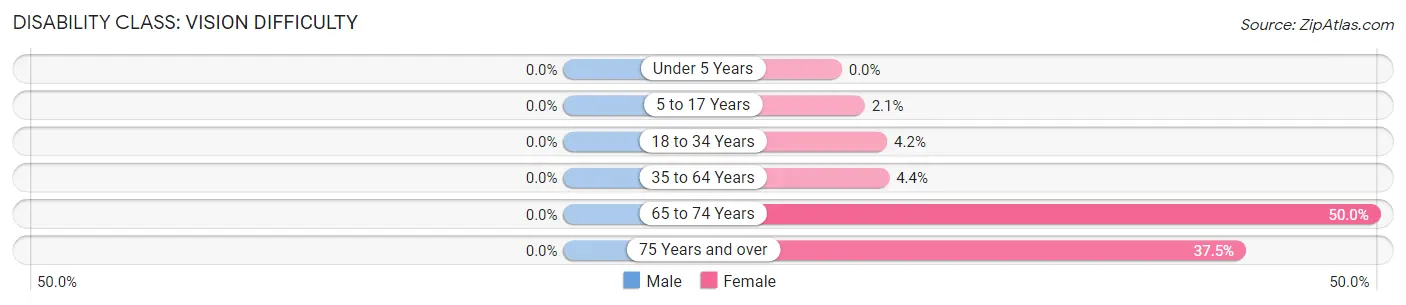
| Age Bracket | Male | Female |
| Under 5 Years | 0 (0.0%) | 0 (0.0%) |
| 5 to 17 Years | 0 (0.0%) | 2 (2.1%) |
| 18 to 34 Years | 0 (0.0%) | 4 (4.2%) |
| 35 to 64 Years | 0 (0.0%) | 4 (4.4%) |
| 65 to 74 Years | 0 (0.0%) | 11 (50.0%) |
| 75 Years and over | 0 (0.0%) | 3 (37.5%) |
Disability Class: Cognitive Difficulty
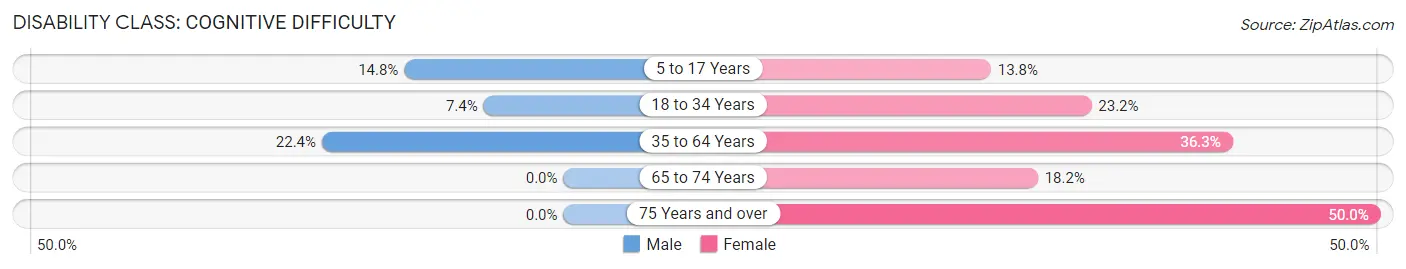
| Age Bracket | Male | Female |
| 5 to 17 Years | 13 (14.8%) | 13 (13.8%) |
| 18 to 34 Years | 4 (7.4%) | 22 (23.2%) |
| 35 to 64 Years | 13 (22.4%) | 33 (36.3%) |
| 65 to 74 Years | 0 (0.0%) | 4 (18.2%) |
| 75 Years and over | 0 (0.0%) | 4 (50.0%) |
Disability Class: Ambulatory Difficulty
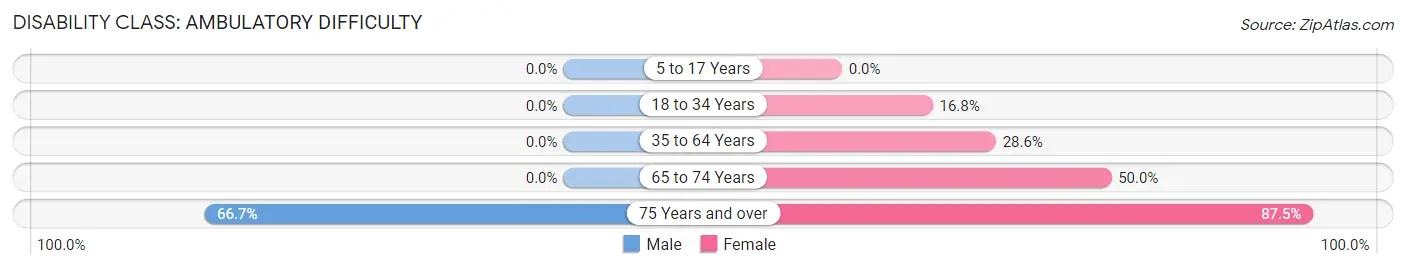
| Age Bracket | Male | Female |
| 5 to 17 Years | 0 (0.0%) | 0 (0.0%) |
| 18 to 34 Years | 0 (0.0%) | 16 (16.8%) |
| 35 to 64 Years | 0 (0.0%) | 26 (28.6%) |
| 65 to 74 Years | 0 (0.0%) | 11 (50.0%) |
| 75 Years and over | 4 (66.7%) | 7 (87.5%) |
Disability Class: Self-Care Difficulty
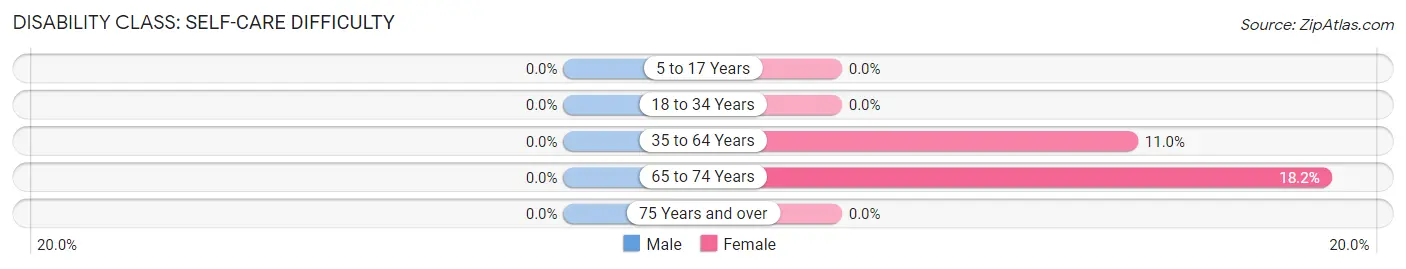
| Age Bracket | Male | Female |
| 5 to 17 Years | 0 (0.0%) | 0 (0.0%) |
| 18 to 34 Years | 0 (0.0%) | 0 (0.0%) |
| 35 to 64 Years | 0 (0.0%) | 10 (11.0%) |
| 65 to 74 Years | 0 (0.0%) | 4 (18.2%) |
| 75 Years and over | 0 (0.0%) | 0 (0.0%) |
Technology Access in Bull Creek
Computing Device Access in Bull Creek
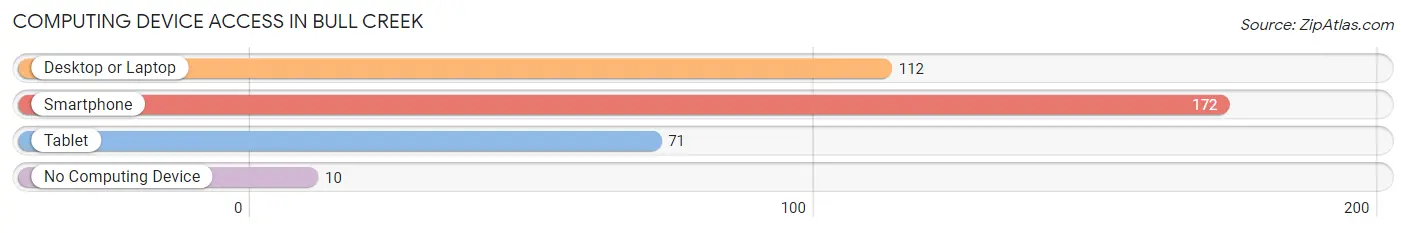
| Device Type | # Households | % Households |
| Desktop or Laptop | 112 | 59.6% |
| Smartphone | 172 | 91.5% |
| Tablet | 71 | 37.8% |
| No Computing Device | 10 | 5.3% |
| Total | 188 | 100.0% |
Internet Access in Bull Creek
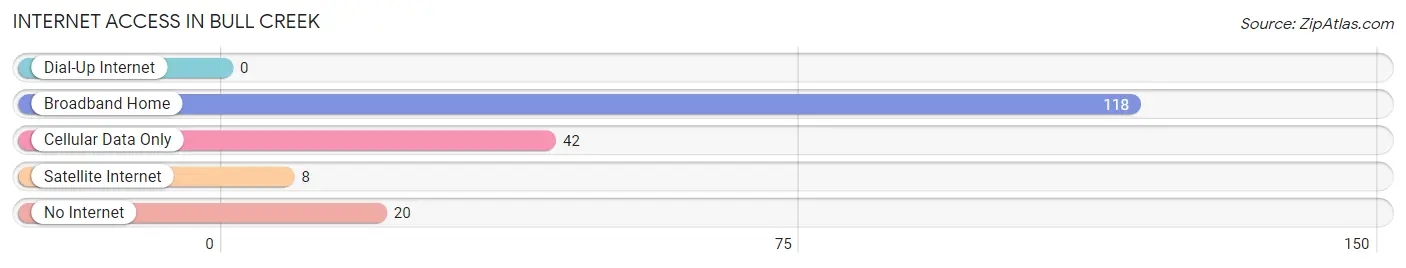
| Internet Type | # Households | % Households |
| Dial-Up Internet | 0 | 0.0% |
| Broadband Home | 118 | 62.8% |
| Cellular Data Only | 42 | 22.3% |
| Satellite Internet | 8 | 4.3% |
| No Internet | 20 | 10.6% |
| Total | 188 | 100.0% |
Bull Creek Summary
Creek, Missouri is a small town located in the Ozark Mountains of the state of Missouri. It is situated in the southeastern corner of the state, near the Arkansas border. The town is located in Howell County, and is part of the West Plains Micropolitan Statistical Area. The population of the town was estimated to be around 500 people in 2020.
History
The area that is now known as Bull Creek was first settled in the early 1800s by settlers from the Ozark region of Missouri. The town was originally known as “Bull Creek Settlement” and was established in 1837. The town was named after the nearby Bull Creek, which was named after a bull that was killed by a hunter in the area.
The town was initially a small farming community, but it soon grew to become a bustling center of commerce. In the late 1800s, the town was home to several stores, a post office, a blacksmith shop, and a hotel. The town also had a school, a church, and a cemetery.
In the early 1900s, the town began to decline as the railroad bypassed it. The town was eventually abandoned in the 1940s, and the population dwindled to just a few people. In the late 1990s, the town was revitalized and the population began to grow again.
Geography
Bull Creek is located in the Ozark Mountains of Missouri. The town is situated in the southeastern corner of the state, near the Arkansas border. The town is located in Howell County, and is part of the West Plains Micropolitan Statistical Area.
The town is situated in a valley surrounded by hills and mountains. The town is located near the Bull Creek, which is a tributary of the White River. The town is also located near the Mark Twain National Forest, which is a popular destination for outdoor recreation.
Economy
The economy of Bull Creek is largely based on agriculture and tourism. The town is home to several farms, which produce a variety of crops, including corn, soybeans, and hay. The town is also home to several tourist attractions, including the Bull Creek Wildlife Refuge, which is a popular destination for bird watching and other outdoor activities.
The town is also home to several small businesses, including restaurants, stores, and other services. The town is also home to several churches, which provide spiritual guidance to the residents of the town.
Demographics
The population of Bull Creek was estimated to be around 500 people in 2020. The town is predominantly white, with a small minority population. The median age of the population is around 40 years old. The town has a low unemployment rate, and the median household income is around $40,000.
Conclusion
Bull Creek, Missouri is a small town located in the Ozark Mountains of the state of Missouri. The town is situated in the southeastern corner of the state, near the Arkansas border. The town is home to several farms, which produce a variety of crops, and is also home to several tourist attractions. The town is predominantly white, with a small minority population, and the median age of the population is around 40 years old. The town has a low unemployment rate, and the median household income is around $40,000.
Common Questions
What is Per Capita Income in Bull Creek?
Per Capita income in Bull Creek is $12,044.
What is the Median Family Income in Bull Creek?
Median Family Income in Bull Creek is $35,625.
What is the Median Household income in Bull Creek?
Median Household Income in Bull Creek is $29,881.
What is Income or Wage Gap in Bull Creek?
Income or Wage Gap in Bull Creek is 20.9%.
Women in Bull Creek earn 79.1 cents for every dollar earned by a man.
What is Inequality or Gini Index in Bull Creek?
Inequality or Gini Index in Bull Creek is 0.33.
What is the Total Population of Bull Creek?
Total Population of Bull Creek is 567.
What is the Total Male Population of Bull Creek?
Total Male Population of Bull Creek is 245.
What is the Total Female Population of Bull Creek?
Total Female Population of Bull Creek is 322.
What is the Ratio of Males per 100 Females in Bull Creek?
There are 76.09 Males per 100 Females in Bull Creek.
What is the Ratio of Females per 100 Males in Bull Creek?
There are 131.43 Females per 100 Males in Bull Creek.
What is the Median Population Age in Bull Creek?
Median Population Age in Bull Creek is 25.4 Years.
What is the Average Family Size in Bull Creek
Average Family Size in Bull Creek is 3.6 People.
What is the Average Household Size in Bull Creek
Average Household Size in Bull Creek is 3.0 People.
How Large is the Labor Force in Bull Creek?
There are 233 People in the Labor Forcein in Bull Creek.
What is the Percentage of People in the Labor Force in Bull Creek?
66.0% of People are in the Labor Force in Bull Creek.
What is the Unemployment Rate in Bull Creek?
Unemployment Rate in Bull Creek is 5.2%.