Riverland, MN Map & Demographics
Riverland Map
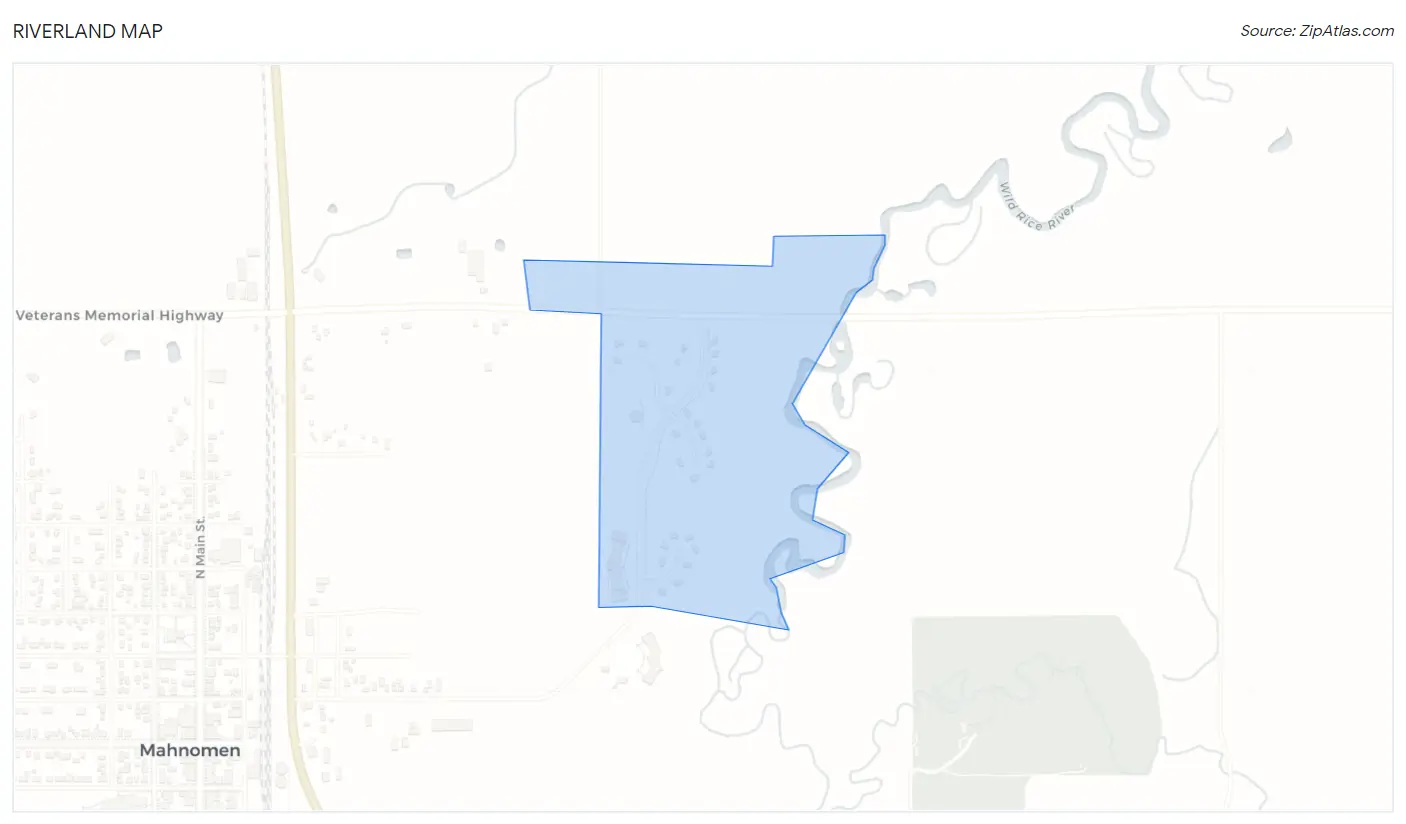
Riverland Overview
$9,386
PER CAPITA INCOME
$28,542
AVG FAMILY INCOME
$28,654
AVG HOUSEHOLD INCOME
20.9%
WAGE / INCOME GAP [ % ]
79.1¢/ $1
WAGE / INCOME GAP [ $ ]
$13,692
FAMILY INCOME DEFICIT
0.44
INEQUALITY / GINI INDEX
299
TOTAL POPULATION
128
MALE POPULATION
171
FEMALE POPULATION
74.85
MALES / 100 FEMALES
133.59
FEMALES / 100 MALES
19.7
MEDIAN AGE
3.8
AVG FAMILY SIZE
3.7
AVG HOUSEHOLD SIZE
101
LABOR FORCE [ PEOPLE ]
57.7%
PERCENT IN LABOR FORCE
27.7%
UNEMPLOYMENT RATE
Income in Riverland
Income Overview in Riverland
Per Capita Income in Riverland is $9,386, while median incomes of families and households are $28,542 and $28,654 respectively.
| Characteristic | Number | Measure |
| Per Capita Income | 299 | $9,386 |
| Median Family Income | 72 | $28,542 |
| Mean Family Income | 72 | $31,819 |
| Median Household Income | 80 | $28,654 |
| Mean Household Income | 80 | $32,066 |
| Income Deficit | 72 | $13,692 |
| Wage / Income Gap (%) | 299 | 20.93% |
| Wage / Income Gap ($) | 299 | 79.07¢ per $1 |
| Gini / Inequality Index | 299 | 0.44 |
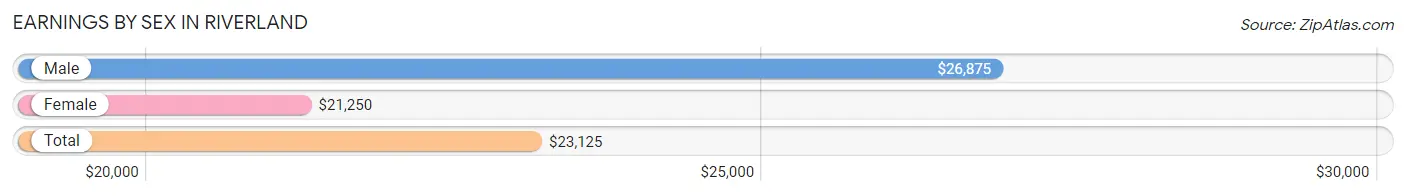
Earnings by Sex in Riverland
Average Earnings in Riverland are $23,125, $26,875 for men and $21,250 for women, a difference of 20.9%.
| Sex | Number | Average Earnings |
| Male | 43 (51.2%) | $26,875 |
| Female | 41 (48.8%) | $21,250 |
| Total | 84 (100.0%) | $23,125 |
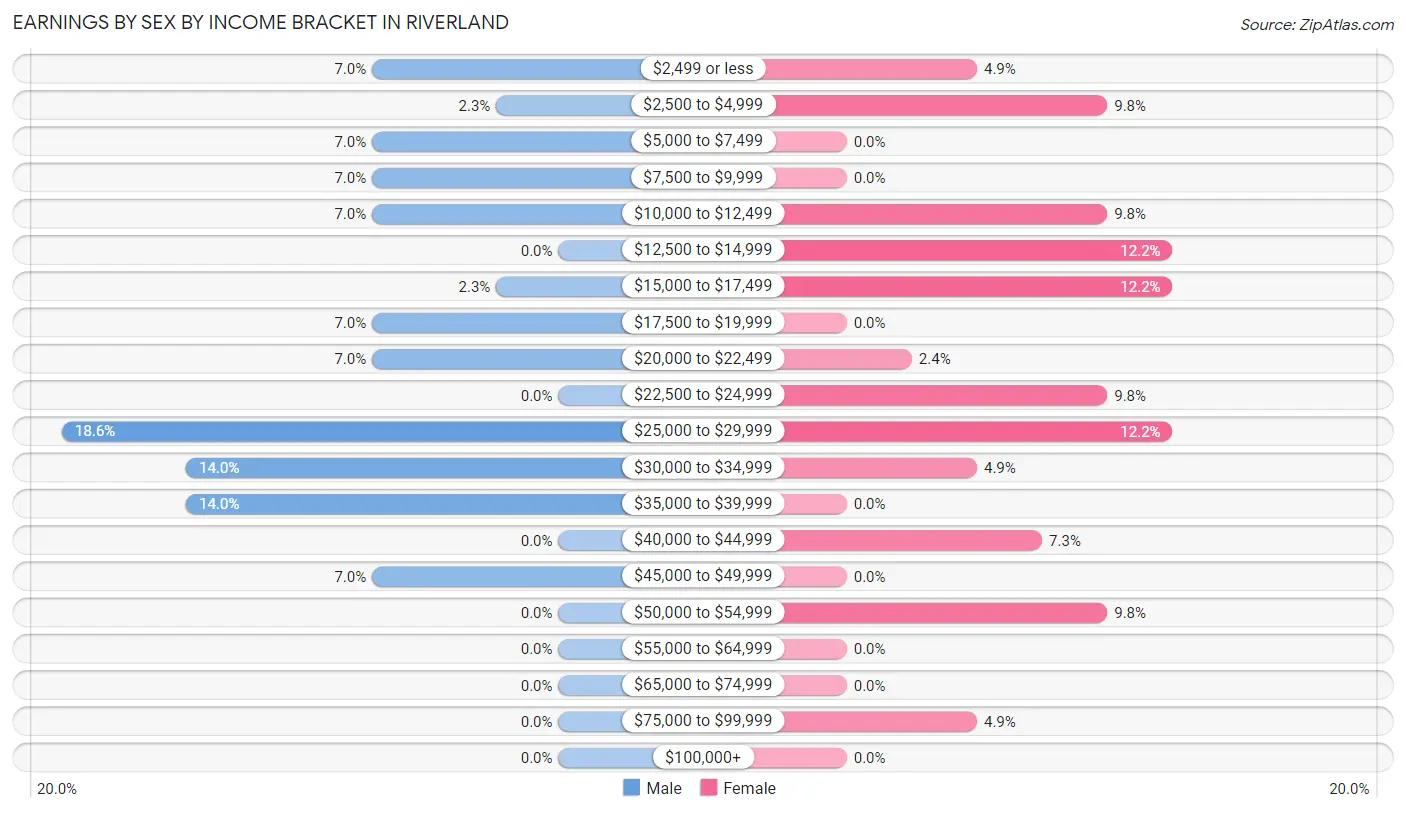
Earnings by Sex by Income Bracket in Riverland
The most common earnings brackets in Riverland are $25,000 to $29,999 for men (8 | 18.6%) and $12,500 to $14,999 for women (5 | 12.2%).
| Income | Male | Female |
| $2,499 or less | 3 (7.0%) | 2 (4.9%) |
| $2,500 to $4,999 | 1 (2.3%) | 4 (9.8%) |
| $5,000 to $7,499 | 3 (7.0%) | 0 (0.0%) |
| $7,500 to $9,999 | 3 (7.0%) | 0 (0.0%) |
| $10,000 to $12,499 | 3 (7.0%) | 4 (9.8%) |
| $12,500 to $14,999 | 0 (0.0%) | 5 (12.2%) |
| $15,000 to $17,499 | 1 (2.3%) | 5 (12.2%) |
| $17,500 to $19,999 | 3 (7.0%) | 0 (0.0%) |
| $20,000 to $22,499 | 3 (7.0%) | 1 (2.4%) |
| $22,500 to $24,999 | 0 (0.0%) | 4 (9.8%) |
| $25,000 to $29,999 | 8 (18.6%) | 5 (12.2%) |
| $30,000 to $34,999 | 6 (14.0%) | 2 (4.9%) |
| $35,000 to $39,999 | 6 (14.0%) | 0 (0.0%) |
| $40,000 to $44,999 | 0 (0.0%) | 3 (7.3%) |
| $45,000 to $49,999 | 3 (7.0%) | 0 (0.0%) |
| $50,000 to $54,999 | 0 (0.0%) | 4 (9.8%) |
| $55,000 to $64,999 | 0 (0.0%) | 0 (0.0%) |
| $65,000 to $74,999 | 0 (0.0%) | 0 (0.0%) |
| $75,000 to $99,999 | 0 (0.0%) | 2 (4.9%) |
| $100,000+ | 0 (0.0%) | 0 (0.0%) |
| Total | 43 (100.0%) | 41 (100.0%) |
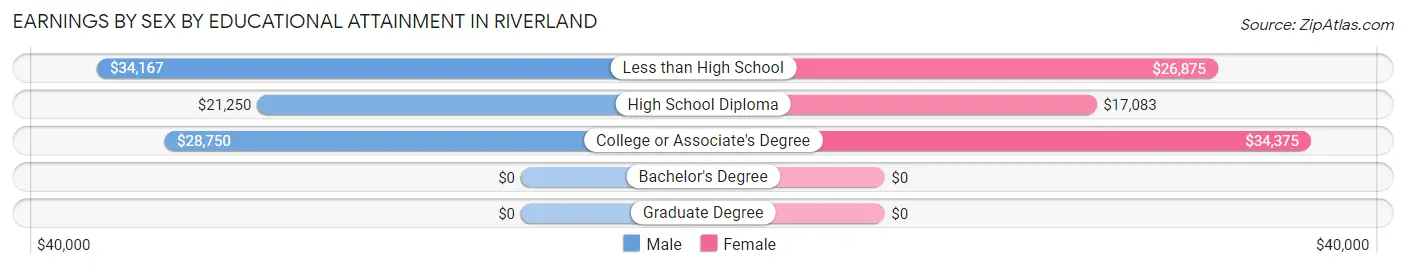
Earnings by Sex by Educational Attainment in Riverland
Average earnings in Riverland are $28,750 for men and $26,250 for women, a difference of 8.7%. Men with an educational attainment of less than high school enjoy the highest average annual earnings of $34,167, while those with high school diploma education earn the least with $21,250. Women with an educational attainment of college or associate's degree earn the most with the average annual earnings of $34,375, while those with high school diploma education have the smallest earnings of $17,083.
| Educational Attainment | Male Income | Female Income |
| Less than High School | $34,167 | $26,875 |
| High School Diploma | $21,250 | $17,083 |
| College or Associate's Degree | $28,750 | $34,375 |
| Bachelor's Degree | - | - |
| Graduate Degree | - | - |
| Total | $28,750 | $26,250 |
Family Income in Riverland
Family Income Brackets in Riverland
According to the Riverland family income data, there are 18 families falling into the $25,000 to $34,999 income range, which is the most common income bracket and makes up 25.0% of all families.
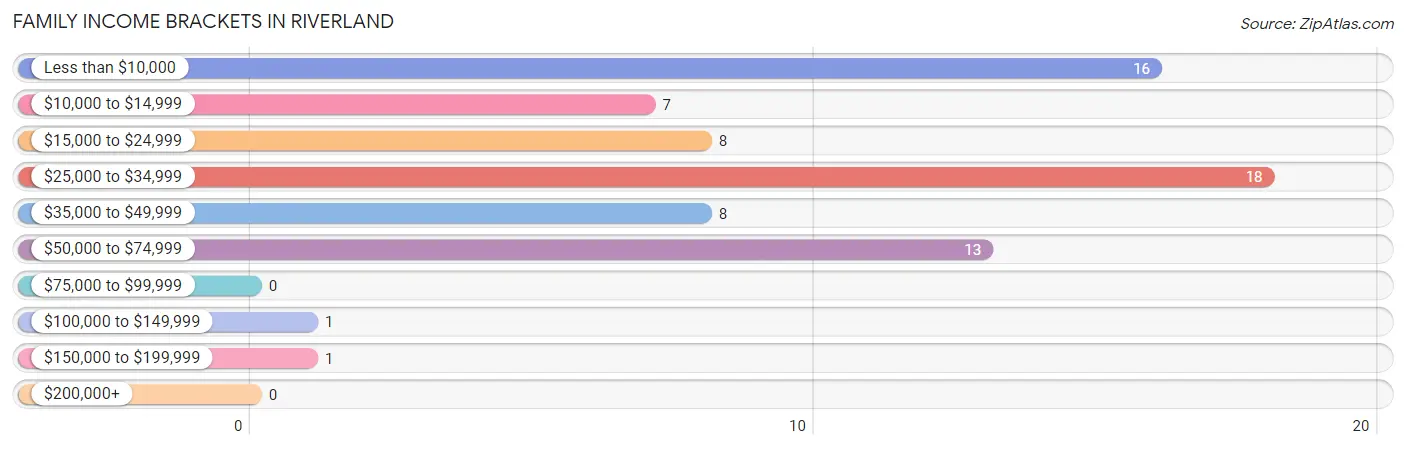
| Income Bracket | # Families | % Families |
| Less than $10,000 | 16 | 22.2% |
| $10,000 to $14,999 | 7 | 9.7% |
| $15,000 to $24,999 | 8 | 11.1% |
| $25,000 to $34,999 | 18 | 25.0% |
| $35,000 to $49,999 | 8 | 11.1% |
| $50,000 to $74,999 | 13 | 18.1% |
| $75,000 to $99,999 | 0 | 0.0% |
| $100,000 to $149,999 | 1 | 1.4% |
| $150,000 to $199,999 | 1 | 1.4% |
| $200,000+ | 0 | 0.0% |
Family Income by Famaliy Size in Riverland
5-person families (9 | 12.5%) account for the highest median family income in Riverland with $48,125 per family, while 5-person families (9 | 12.5%) have the highest median income of $9,625 per family member.
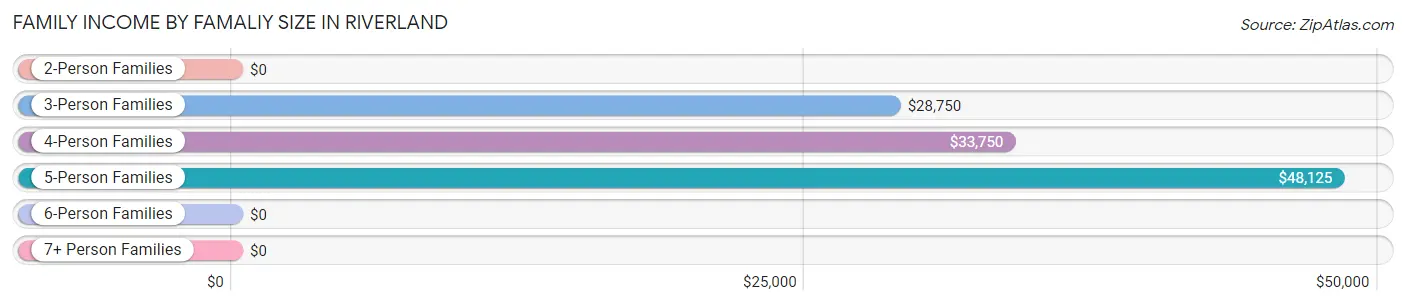
| Income Bracket | # Families | Median Income |
| 2-Person Families | 29 (40.3%) | $0 |
| 3-Person Families | 10 (13.9%) | $28,750 |
| 4-Person Families | 15 (20.8%) | $33,750 |
| 5-Person Families | 9 (12.5%) | $48,125 |
| 6-Person Families | 4 (5.6%) | $0 |
| 7+ Person Families | 5 (6.9%) | $0 |
| Total | 72 (100.0%) | $28,542 |
Family Income by Number of Earners in Riverland
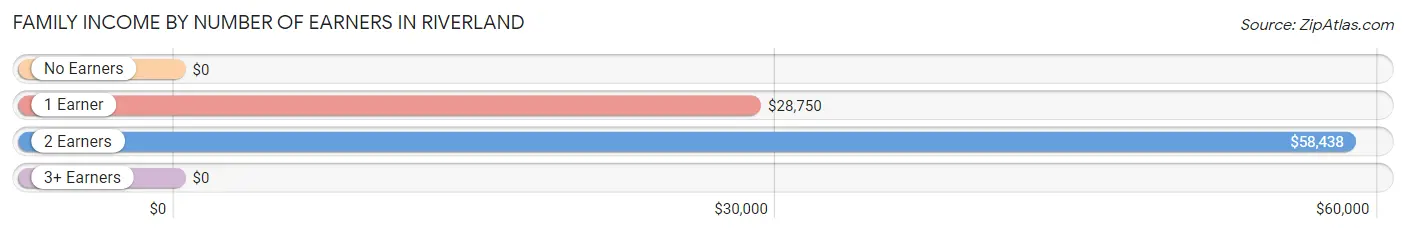
| Number of Earners | # Families | Median Income |
| No Earners | 19 (26.4%) | $0 |
| 1 Earner | 34 (47.2%) | $28,750 |
| 2 Earners | 19 (26.4%) | $58,438 |
| 3+ Earners | 0 (0.0%) | $0 |
| Total | 72 (100.0%) | $28,542 |
Household Income in Riverland
Household Income Brackets in Riverland
With 19 households falling in the category, the $25,000 to $34,999 income range is the most frequent in Riverland, accounting for 23.7% of all households.
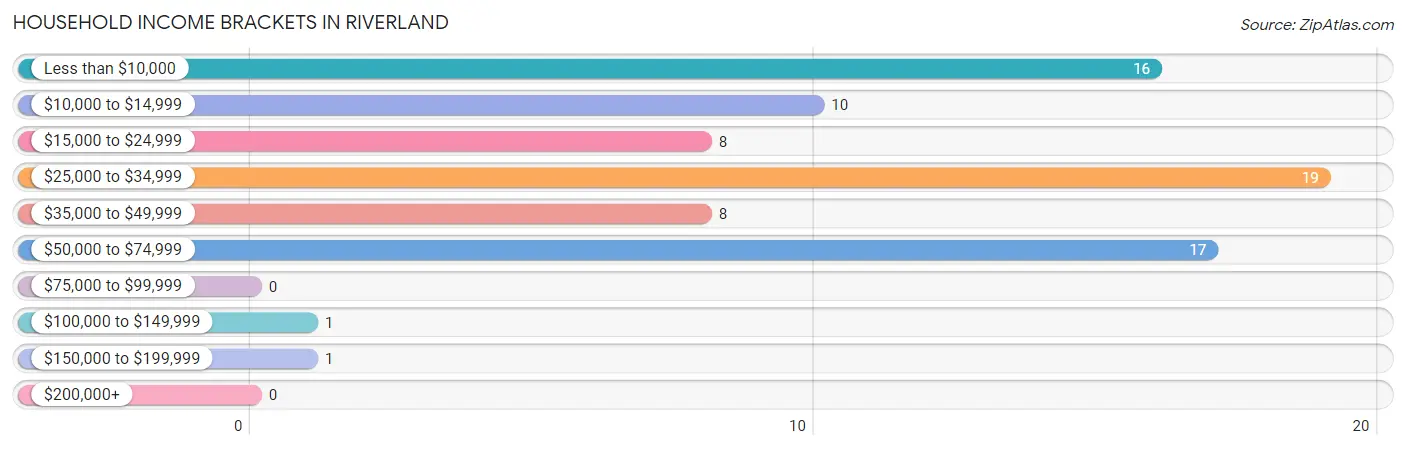
| Income Bracket | # Households | % Households |
| Less than $10,000 | 16 | 20.0% |
| $10,000 to $14,999 | 10 | 12.5% |
| $15,000 to $24,999 | 8 | 10.0% |
| $25,000 to $34,999 | 19 | 23.8% |
| $35,000 to $49,999 | 8 | 10.0% |
| $50,000 to $74,999 | 17 | 21.3% |
| $75,000 to $99,999 | 0 | 0.0% |
| $100,000 to $149,999 | 1 | 1.3% |
| $150,000 to $199,999 | 1 | 1.3% |
| $200,000+ | 0 | 0.0% |
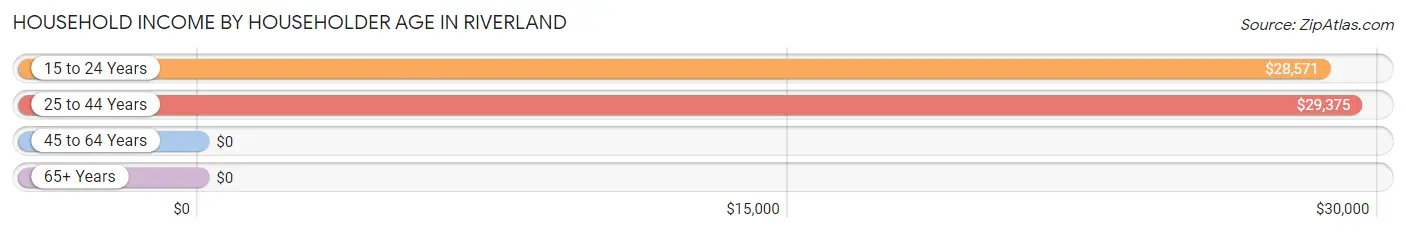
Household Income by Householder Age in Riverland
The median household income in Riverland is $28,654, with the highest median household income of $29,375 found in the 25 to 44 years age bracket for the primary householder. A total of 38 households (47.5%) fall into this category. Meanwhile, the 45 to 64 years age bracket for the primary householder has the lowest median household income of $0, with 22 households (27.5%) in this group.
| Income Bracket | # Households | Median Income |
| 15 to 24 Years | 14 (17.5%) | $28,571 |
| 25 to 44 Years | 38 (47.5%) | $29,375 |
| 45 to 64 Years | 22 (27.5%) | $0 |
| 65+ Years | 6 (7.5%) | $0 |
| Total | 80 (100.0%) | $28,654 |
Poverty in Riverland
Income Below Poverty by Sex and Age in Riverland
With 40.6% poverty level for males and 63.2% for females among the residents of Riverland, 5 year old males and 16 and 17 year old females are the most vulnerable to poverty, with 2 males (100.0%) and 3 females (100.0%) in their respective age groups living below the poverty level.
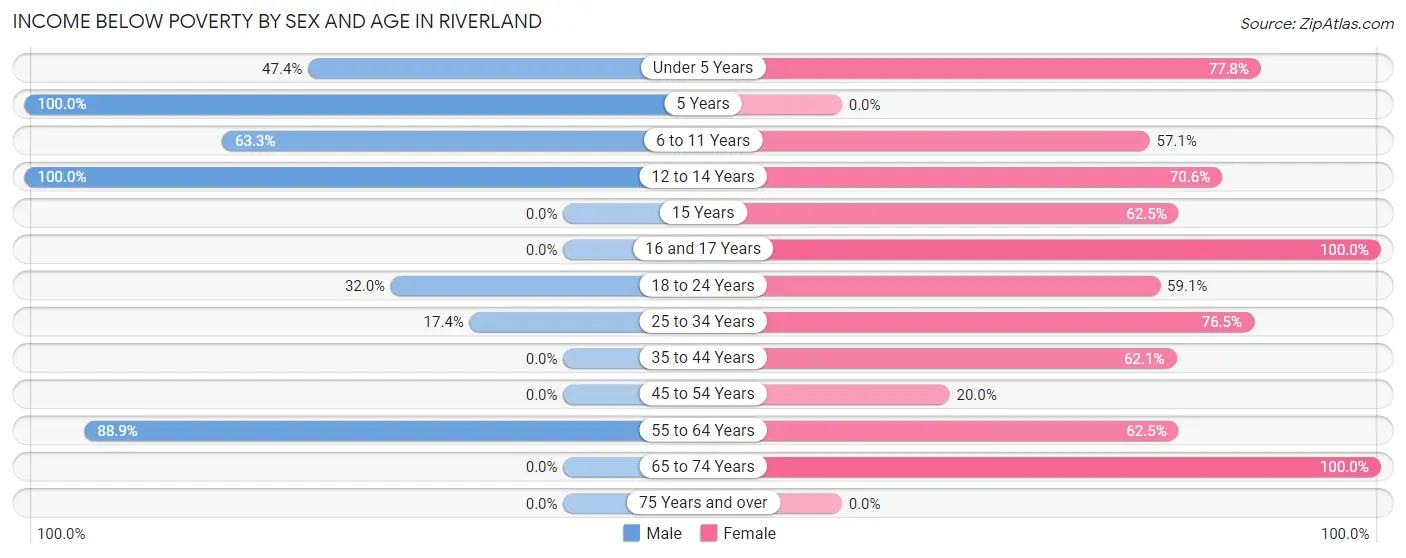
| Age Bracket | Male | Female |
| Under 5 Years | 9 (47.4%) | 14 (77.8%) |
| 5 Years | 2 (100.0%) | 0 (0.0%) |
| 6 to 11 Years | 19 (63.3%) | 16 (57.1%) |
| 12 to 14 Years | 2 (100.0%) | 12 (70.6%) |
| 15 Years | 0 (0.0%) | 5 (62.5%) |
| 16 and 17 Years | 0 (0.0%) | 3 (100.0%) |
| 18 to 24 Years | 8 (32.0%) | 13 (59.1%) |
| 25 to 34 Years | 4 (17.4%) | 13 (76.5%) |
| 35 to 44 Years | 0 (0.0%) | 18 (62.1%) |
| 45 to 54 Years | 0 (0.0%) | 3 (20.0%) |
| 55 to 64 Years | 8 (88.9%) | 5 (62.5%) |
| 65 to 74 Years | 0 (0.0%) | 6 (100.0%) |
| 75 Years and over | 0 (0.0%) | 0 (0.0%) |
| Total | 52 (40.6%) | 108 (63.2%) |
Income Above Poverty by Sex and Age in Riverland
According to the poverty statistics in Riverland, males aged 16 and 17 years and females aged 45 to 54 years are the age groups that are most secure financially, with 100.0% of males and 80.0% of females in these age groups living above the poverty line.
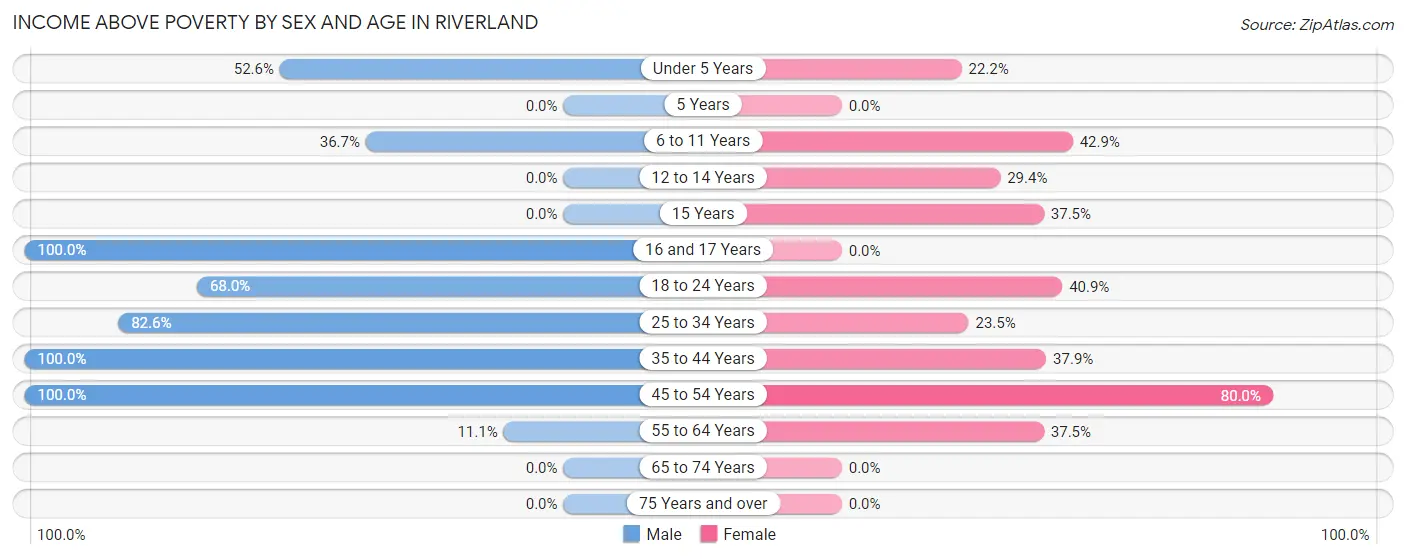
| Age Bracket | Male | Female |
| Under 5 Years | 10 (52.6%) | 4 (22.2%) |
| 5 Years | 0 (0.0%) | 0 (0.0%) |
| 6 to 11 Years | 11 (36.7%) | 12 (42.9%) |
| 12 to 14 Years | 0 (0.0%) | 5 (29.4%) |
| 15 Years | 0 (0.0%) | 3 (37.5%) |
| 16 and 17 Years | 11 (100.0%) | 0 (0.0%) |
| 18 to 24 Years | 17 (68.0%) | 9 (40.9%) |
| 25 to 34 Years | 19 (82.6%) | 4 (23.5%) |
| 35 to 44 Years | 3 (100.0%) | 11 (37.9%) |
| 45 to 54 Years | 4 (100.0%) | 12 (80.0%) |
| 55 to 64 Years | 1 (11.1%) | 3 (37.5%) |
| 65 to 74 Years | 0 (0.0%) | 0 (0.0%) |
| 75 Years and over | 0 (0.0%) | 0 (0.0%) |
| Total | 76 (59.4%) | 63 (36.8%) |
Income Below Poverty Among Married-Couple Families in Riverland
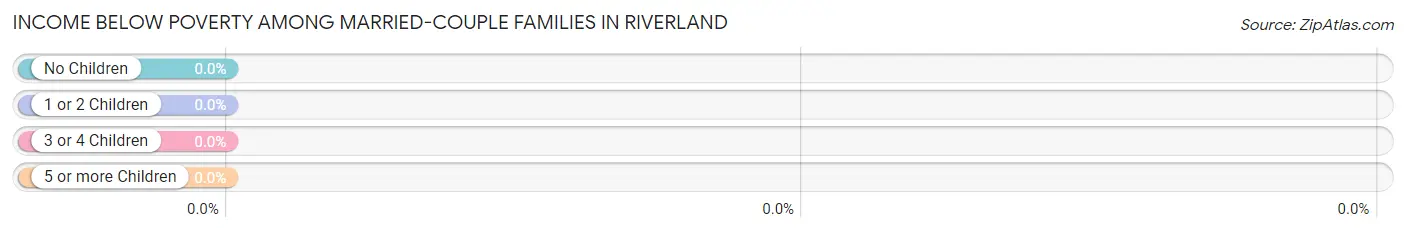
| Children | Above Poverty | Below Poverty |
| No Children | 1 (100.0%) | 0 (0.0%) |
| 1 or 2 Children | 8 (100.0%) | 0 (0.0%) |
| 3 or 4 Children | 2 (100.0%) | 0 (0.0%) |
| 5 or more Children | 0 (0.0%) | 0 (0.0%) |
| Total | 11 (100.0%) | 0 (0.0%) |
Income Below Poverty Among Single-Parent Households in Riverland
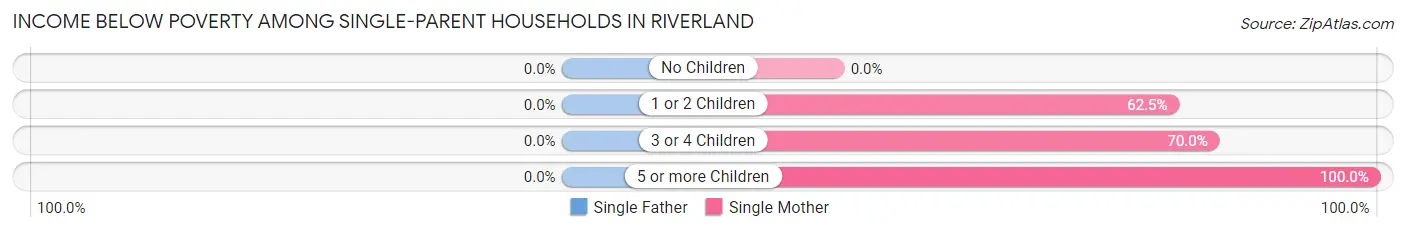
| Children | Single Father | Single Mother |
| No Children | 0 (0.0%) | 0 (0.0%) |
| 1 or 2 Children | 0 (0.0%) | 25 (62.5%) |
| 3 or 4 Children | 0 (0.0%) | 7 (70.0%) |
| 5 or more Children | 0 (0.0%) | 5 (100.0%) |
| Total | 0 (0.0%) | 37 (67.3%) |
Income Below Poverty Among Married-Couple vs Single-Parent Households in Riverland
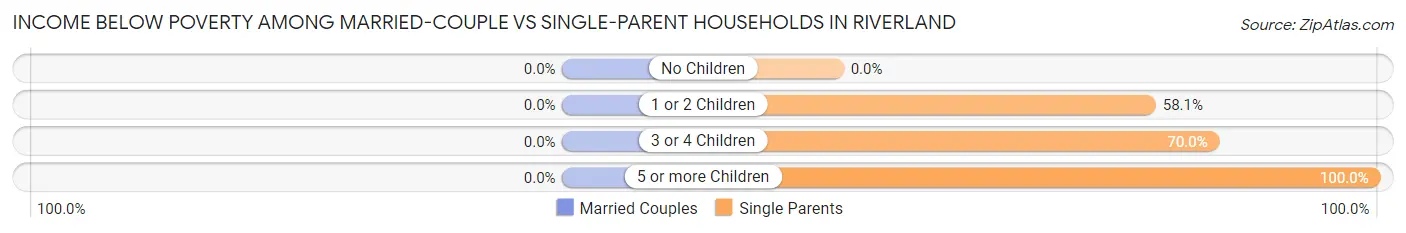
| Children | Married-Couple Families | Single-Parent Households |
| No Children | 0 (0.0%) | 0 (0.0%) |
| 1 or 2 Children | 0 (0.0%) | 25 (58.1%) |
| 3 or 4 Children | 0 (0.0%) | 7 (70.0%) |
| 5 or more Children | 0 (0.0%) | 5 (100.0%) |
| Total | 0 (0.0%) | 37 (60.7%) |
Race in Riverland
The most populous races in Riverland are Native / Alaskan (226 | 75.6%), Two or more Races (62 | 20.7%), and Hispanic or Latino (12 | 4.0%).
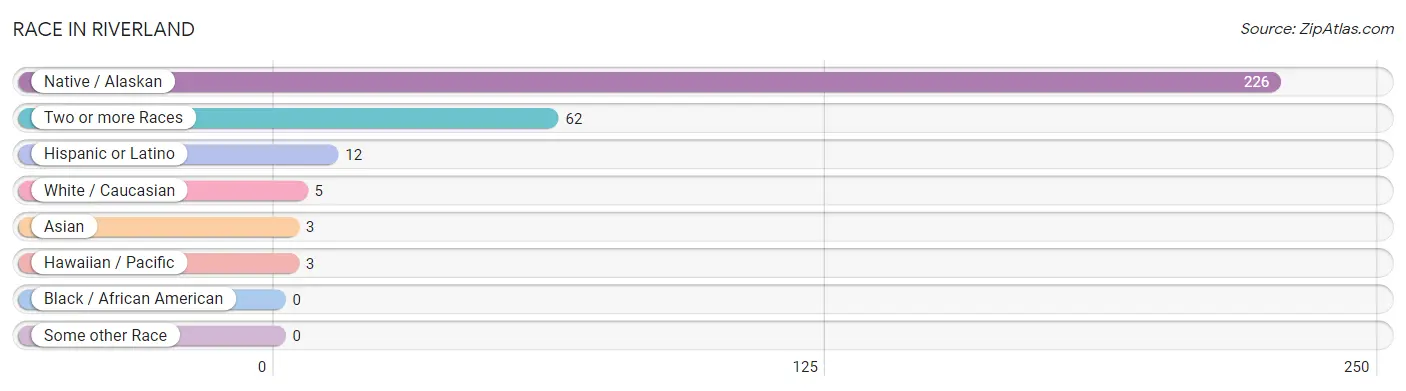
| Race | # Population | % Population |
| Asian | 3 | 1.0% |
| Black / African American | 0 | 0.0% |
| Hawaiian / Pacific | 3 | 1.0% |
| Hispanic or Latino | 12 | 4.0% |
| Native / Alaskan | 226 | 75.6% |
| White / Caucasian | 5 | 1.7% |
| Two or more Races | 62 | 20.7% |
| Some other Race | 0 | 0.0% |
| Total | 299 | 100.0% |
Ancestry in Riverland
The most populous ancestries reported in Riverland are Chippewa (261 | 87.3%), Norwegian (17 | 5.7%), Irish (13 | 4.3%), Mexican (12 | 4.0%), and German (11 | 3.7%), together accounting for 105.0% of all Riverland residents.
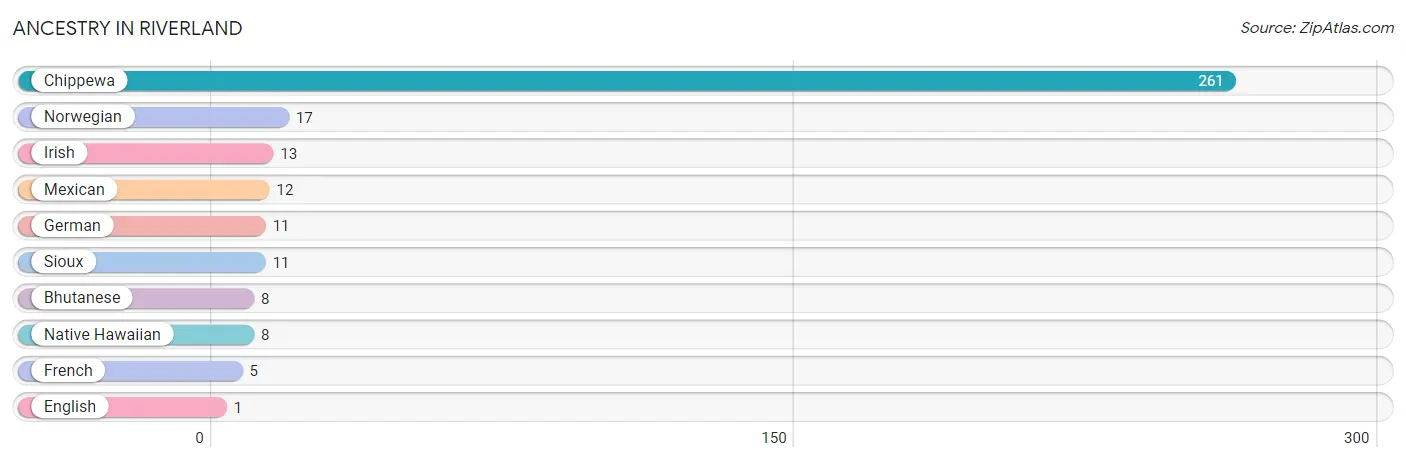
| Ancestry | # Population | % Population |
| Bhutanese | 8 | 2.7% |
| Chippewa | 261 | 87.3% |
| English | 1 | 0.3% |
| French | 5 | 1.7% |
| German | 11 | 3.7% |
| Irish | 13 | 4.3% |
| Mexican | 12 | 4.0% |
| Native Hawaiian | 8 | 2.7% |
| Norwegian | 17 | 5.7% |
| Sioux | 11 | 3.7% | View All 10 Rows |
Immigrants in Riverland
The most numerous immigrant groups reported in Riverland came from , and Canada (7 | 2.3%), together accounting for 2.3% of all Riverland residents.

| Immigration Origin | # Population | % Population |
| Canada | 7 | 2.3% | View All 1 Rows |
Sex and Age in Riverland
Sex and Age in Riverland
The most populous age groups in Riverland are 20 to 24 Years (25 | 19.5%) for men and 10 to 14 Years (26 | 15.2%) for women.
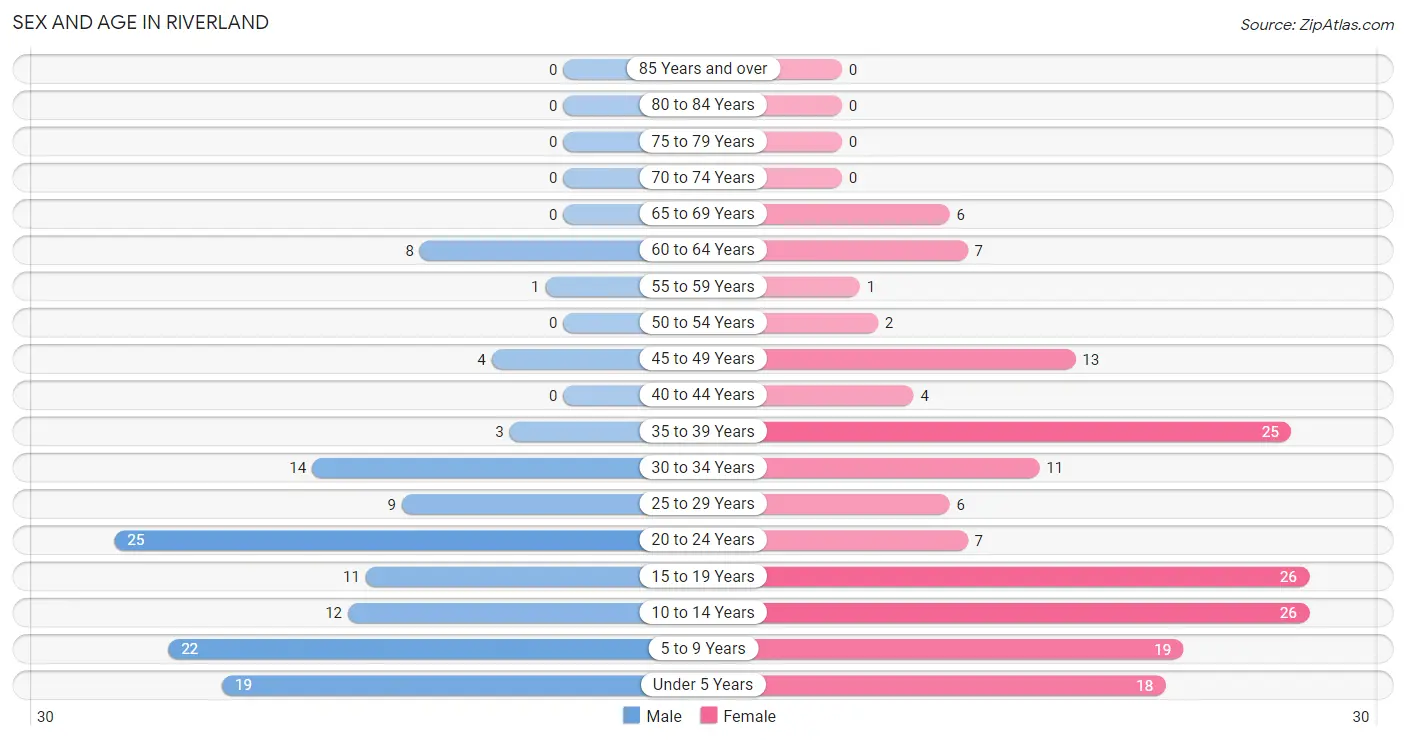
| Age Bracket | Male | Female |
| Under 5 Years | 19 (14.8%) | 18 (10.5%) |
| 5 to 9 Years | 22 (17.2%) | 19 (11.1%) |
| 10 to 14 Years | 12 (9.4%) | 26 (15.2%) |
| 15 to 19 Years | 11 (8.6%) | 26 (15.2%) |
| 20 to 24 Years | 25 (19.5%) | 7 (4.1%) |
| 25 to 29 Years | 9 (7.0%) | 6 (3.5%) |
| 30 to 34 Years | 14 (10.9%) | 11 (6.4%) |
| 35 to 39 Years | 3 (2.3%) | 25 (14.6%) |
| 40 to 44 Years | 0 (0.0%) | 4 (2.3%) |
| 45 to 49 Years | 4 (3.1%) | 13 (7.6%) |
| 50 to 54 Years | 0 (0.0%) | 2 (1.2%) |
| 55 to 59 Years | 1 (0.8%) | 1 (0.6%) |
| 60 to 64 Years | 8 (6.2%) | 7 (4.1%) |
| 65 to 69 Years | 0 (0.0%) | 6 (3.5%) |
| 70 to 74 Years | 0 (0.0%) | 0 (0.0%) |
| 75 to 79 Years | 0 (0.0%) | 0 (0.0%) |
| 80 to 84 Years | 0 (0.0%) | 0 (0.0%) |
| 85 Years and over | 0 (0.0%) | 0 (0.0%) |
| Total | 128 (100.0%) | 171 (100.0%) |
Families and Households in Riverland
Median Family Size in Riverland
The median family size in Riverland is 3.82 persons per family, with married-couple families (11 | 15.3%) accounting for the largest median family size of 5.45 persons per family. On the other hand, single male/father families (6 | 8.3%) represent the smallest median family size with 2.83 persons per family.
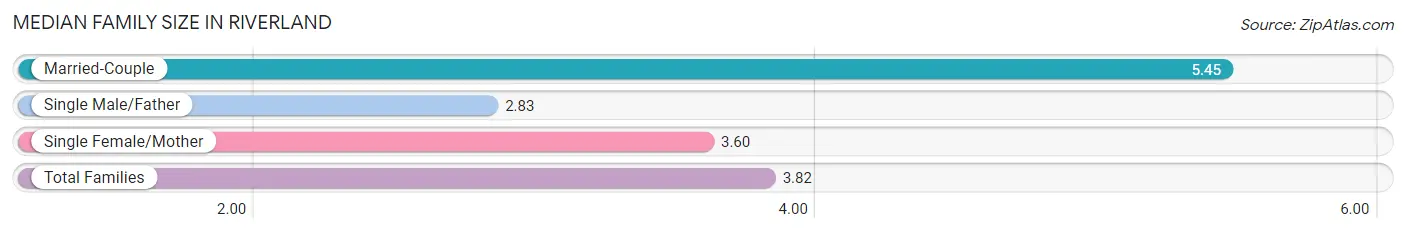
| Family Type | # Families | Family Size |
| Married-Couple | 11 (15.3%) | 5.45 |
| Single Male/Father | 6 (8.3%) | 2.83 |
| Single Female/Mother | 55 (76.4%) | 3.60 |
| Total Families | 72 (100.0%) | 3.82 |
Median Household Size in Riverland
The median household size in Riverland is 3.74 persons per household, with married-couple households (11 | 13.8%) accounting for the largest median household size of 5.45 persons per household. non-family households (8 | 10.0%) represent the smallest median household size with 1.50 persons per household.
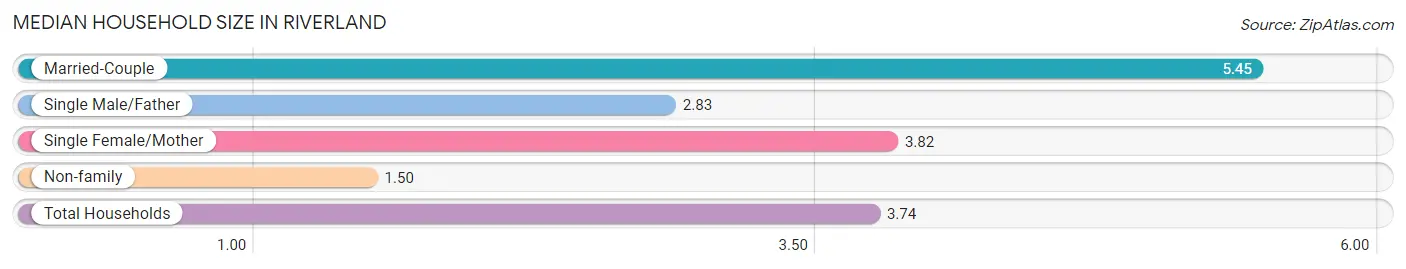
| Household Type | # Households | Household Size |
| Married-Couple | 11 (13.8%) | 5.45 |
| Single Male/Father | 6 (7.5%) | 2.83 |
| Single Female/Mother | 55 (68.8%) | 3.82 |
| Non-family | 8 (10.0%) | 1.50 |
| Total Households | 80 (100.0%) | 3.74 |
Household Size by Marriage Status in Riverland
Out of a total of 80 households in Riverland, 72 (90.0%) are family households, while 8 (10.0%) are nonfamily households. The most numerous type of family households are 2-person households, comprising 26, and the most common type of nonfamily households are 1-person households, comprising 5.
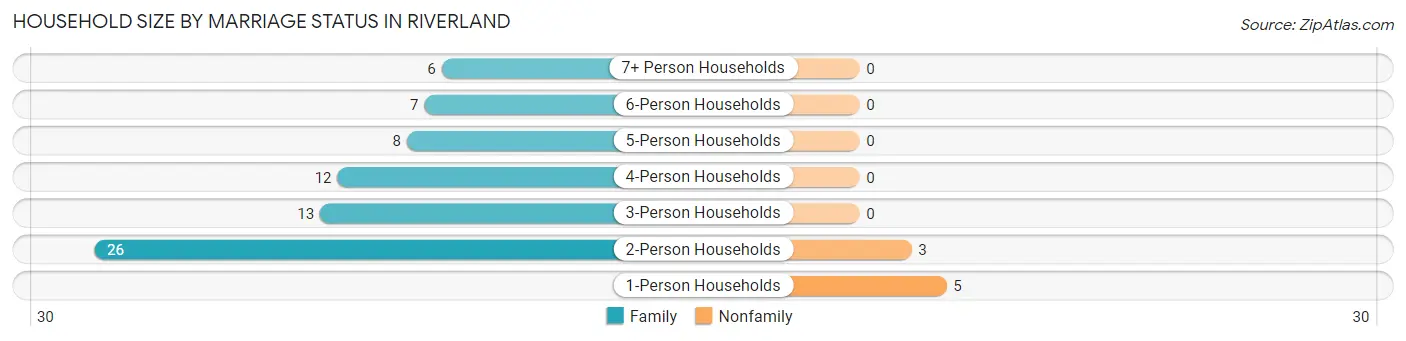
| Household Size | Family Households | Nonfamily Households |
| 1-Person Households | - | 5 (6.2%) |
| 2-Person Households | 26 (32.5%) | 3 (3.7%) |
| 3-Person Households | 13 (16.3%) | 0 (0.0%) |
| 4-Person Households | 12 (15.0%) | 0 (0.0%) |
| 5-Person Households | 8 (10.0%) | 0 (0.0%) |
| 6-Person Households | 7 (8.7%) | 0 (0.0%) |
| 7+ Person Households | 6 (7.5%) | 0 (0.0%) |
| Total | 72 (90.0%) | 8 (10.0%) |
Female Fertility in Riverland
Fertility by Age in Riverland
Average fertility rate in Riverland is 152.0 births per 1,000 women. Women in the age bracket of 20 to 34 years have the highest fertility rate with 333.0 births per 1,000 women. Women in the age bracket of 20 to 34 years acount for 57.1% of all women with births.
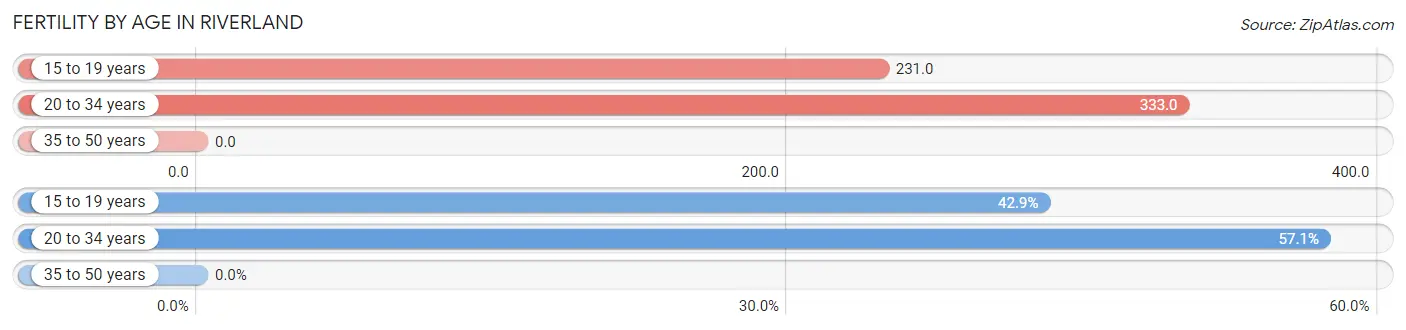
| Age Bracket | Women with Births | Births / 1,000 Women |
| 15 to 19 years | 6 (42.9%) | 231.0 |
| 20 to 34 years | 8 (57.1%) | 333.0 |
| 35 to 50 years | 0 (0.0%) | 0.0 |
| Total | 14 (100.0%) | 152.0 |
Fertility by Age by Marriage Status in Riverland
42.9% of women with births (14) in Riverland are married. The highest percentage of unmarried women with births falls into 15 to 19 years age bracket with 100.0% of them unmarried at the time of birth, while the lowest percentage of unmarried women with births belong to 20 to 34 years age bracket with 25.0% of them unmarried.
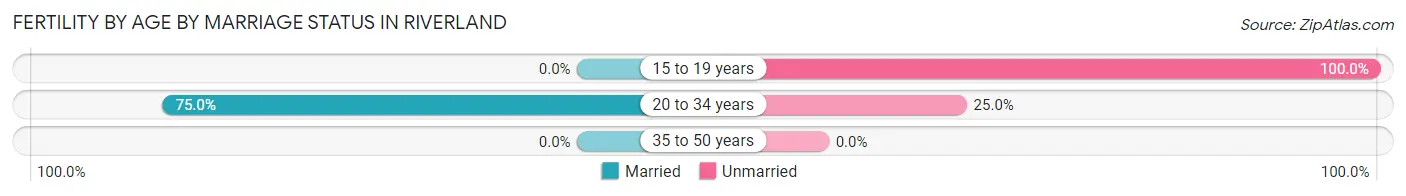
| Age Bracket | Married | Unmarried |
| 15 to 19 years | 0 (0.0%) | 6 (100.0%) |
| 20 to 34 years | 6 (75.0%) | 2 (25.0%) |
| 35 to 50 years | 0 (0.0%) | 0 (0.0%) |
| Total | 6 (42.9%) | 8 (57.1%) |
Fertility by Education in Riverland
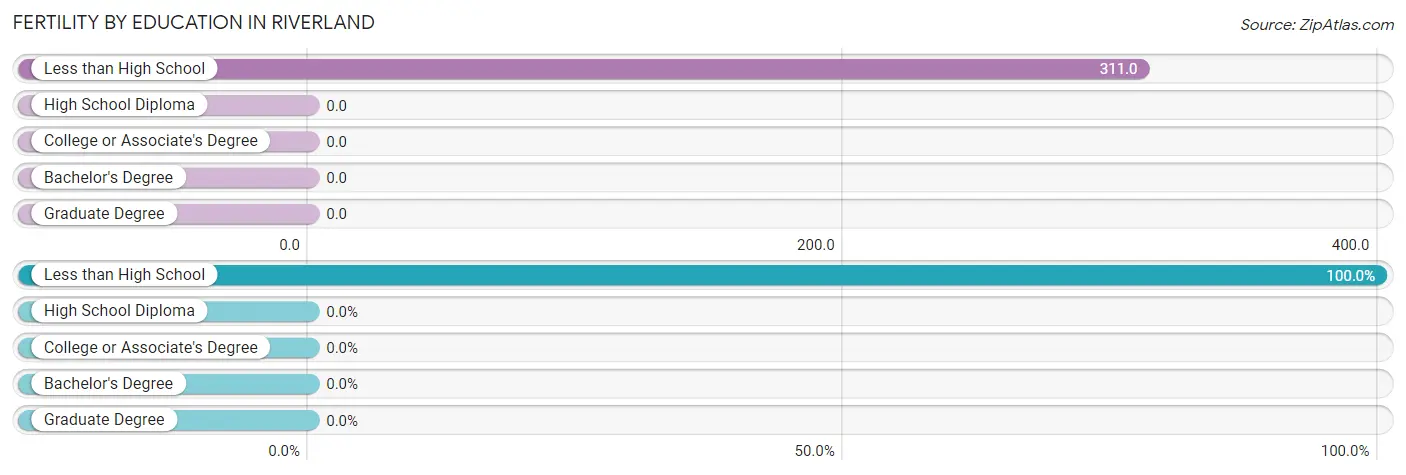
| Educational Attainment | Women with Births | Births / 1,000 Women |
| Less than High School | 14 (100.0%) | 311.0 |
| High School Diploma | 0 (0.0%) | 0.0 |
| College or Associate's Degree | 0 (0.0%) | 0.0 |
| Bachelor's Degree | 0 (0.0%) | 0.0 |
| Graduate Degree | 0 (0.0%) | 0.0 |
| Total | 14 (100.0%) | 152.0 |
Fertility by Education by Marriage Status in Riverland
57.1% of women with births in Riverland are unmarried. Women with the educational attainment of less than high school are most likely to be married with 42.9% of them married at childbirth, while women with the educational attainment of less than high school are least likely to be married with 57.1% of them unmarried at childbirth.
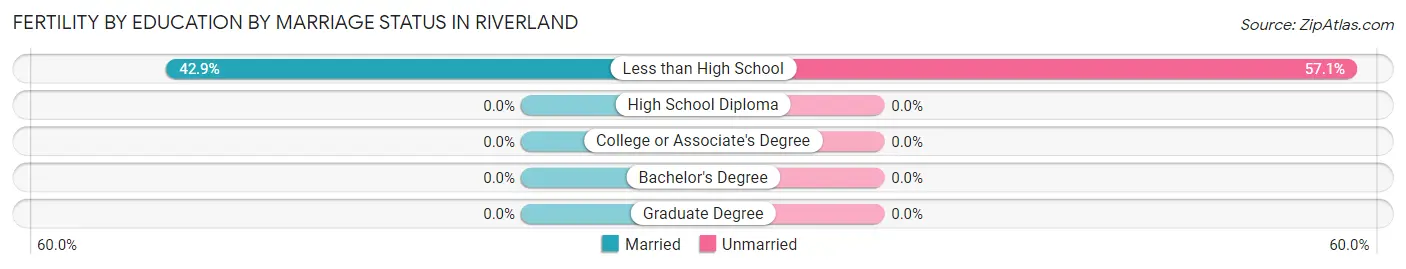
| Educational Attainment | Married | Unmarried |
| Less than High School | 6 (42.9%) | 8 (57.1%) |
| High School Diploma | 0 (0.0%) | 0 (0.0%) |
| College or Associate's Degree | 0 (0.0%) | 0 (0.0%) |
| Bachelor's Degree | 0 (0.0%) | 0 (0.0%) |
| Graduate Degree | 0 (0.0%) | 0 (0.0%) |
| Total | 6 (42.9%) | 8 (57.1%) |
Employment Characteristics in Riverland
Employment by Class of Employer in Riverland
Among the 66 employed individuals in Riverland, private company employees (29 | 43.9%), local government employees (24 | 36.4%), and not-for-profit organizations (10 | 15.1%) make up the most common classes of employment.
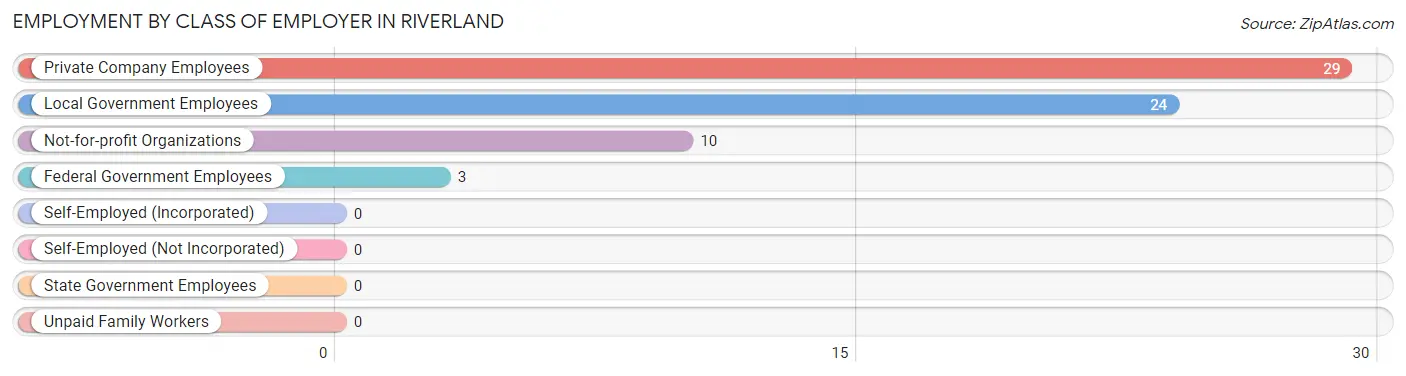
| Employer Class | # Employees | % Employees |
| Private Company Employees | 29 | 43.9% |
| Self-Employed (Incorporated) | 0 | 0.0% |
| Self-Employed (Not Incorporated) | 0 | 0.0% |
| Not-for-profit Organizations | 10 | 15.1% |
| Local Government Employees | 24 | 36.4% |
| State Government Employees | 0 | 0.0% |
| Federal Government Employees | 3 | 4.5% |
| Unpaid Family Workers | 0 | 0.0% |
| Total | 66 | 100.0% |
Employment Status by Age in Riverland
According to the labor force statistics for Riverland, out of the total population over 16 years of age (175), 57.7% or 101 individuals are in the labor force, with 27.7% or 28 of them unemployed. The age group with the highest labor force participation rate is 20 to 24 years, with 84.4% or 27 individuals in the labor force. Within the labor force, the 20 to 24 years age range has the highest percentage of unemployed individuals, with 63.0% or 17 of them being unemployed.
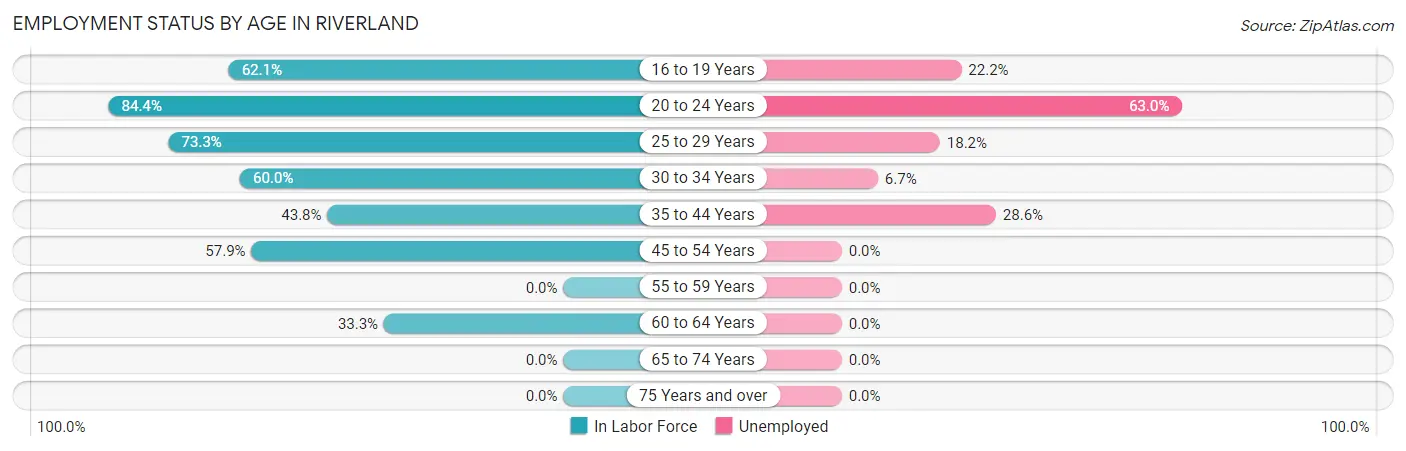
| Age Bracket | In Labor Force | Unemployed |
| 16 to 19 Years | 18 (62.1%) | 4 (22.2%) |
| 20 to 24 Years | 27 (84.4%) | 17 (63.0%) |
| 25 to 29 Years | 11 (73.3%) | 2 (18.2%) |
| 30 to 34 Years | 15 (60.0%) | 1 (6.7%) |
| 35 to 44 Years | 14 (43.8%) | 4 (28.6%) |
| 45 to 54 Years | 11 (57.9%) | 0 (0.0%) |
| 55 to 59 Years | 0 (0.0%) | 0 (0.0%) |
| 60 to 64 Years | 5 (33.3%) | 0 (0.0%) |
| 65 to 74 Years | 0 (0.0%) | 0 (0.0%) |
| 75 Years and over | 0 (0.0%) | 0 (0.0%) |
| Total | 101 (57.7%) | 28 (27.7%) |
Employment Status by Educational Attainment in Riverland
According to labor force statistics for Riverland, 51.9% of individuals (56) out of the total population between 25 and 64 years of age (108) are in the labor force, with 12.5% or 7 of them being unemployed. The group with the highest labor force participation rate are those with the educational attainment of high school diploma, with 56.3% or 18 individuals in the labor force. Within the labor force, individuals with high school diploma education have the highest percentage of unemployment, with 22.2% or 4 of them being unemployed.
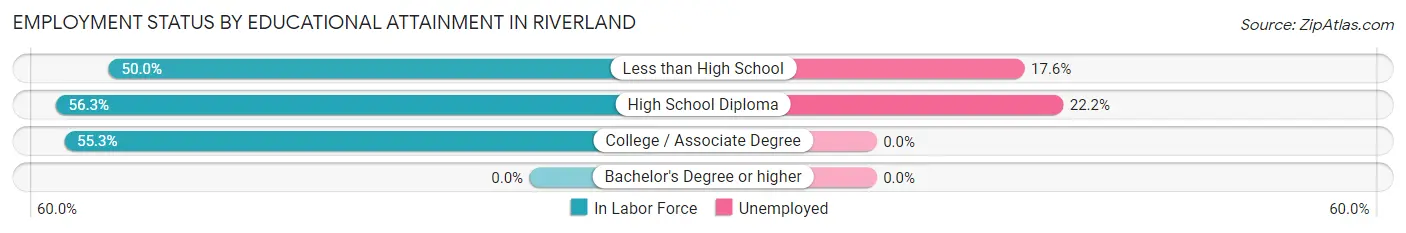
| Educational Attainment | In Labor Force | Unemployed |
| Less than High School | 17 (50.0%) | 6 (17.6%) |
| High School Diploma | 18 (56.3%) | 7 (22.2%) |
| College / Associate Degree | 21 (55.3%) | 0 (0.0%) |
| Bachelor's Degree or higher | 0 (0.0%) | 0 (0.0%) |
| Total | 56 (51.9%) | 14 (12.5%) |
Employment Occupations by Sex in Riverland
Management, Business, Science and Arts Occupations
The most common Management, Business, Science and Arts occupations in Riverland are Health Diagnosing & Treating (7 | 9.6%), Management (3 | 4.1%), Community & Social Service (3 | 4.1%), and Education, Arts & Media (3 | 4.1%).
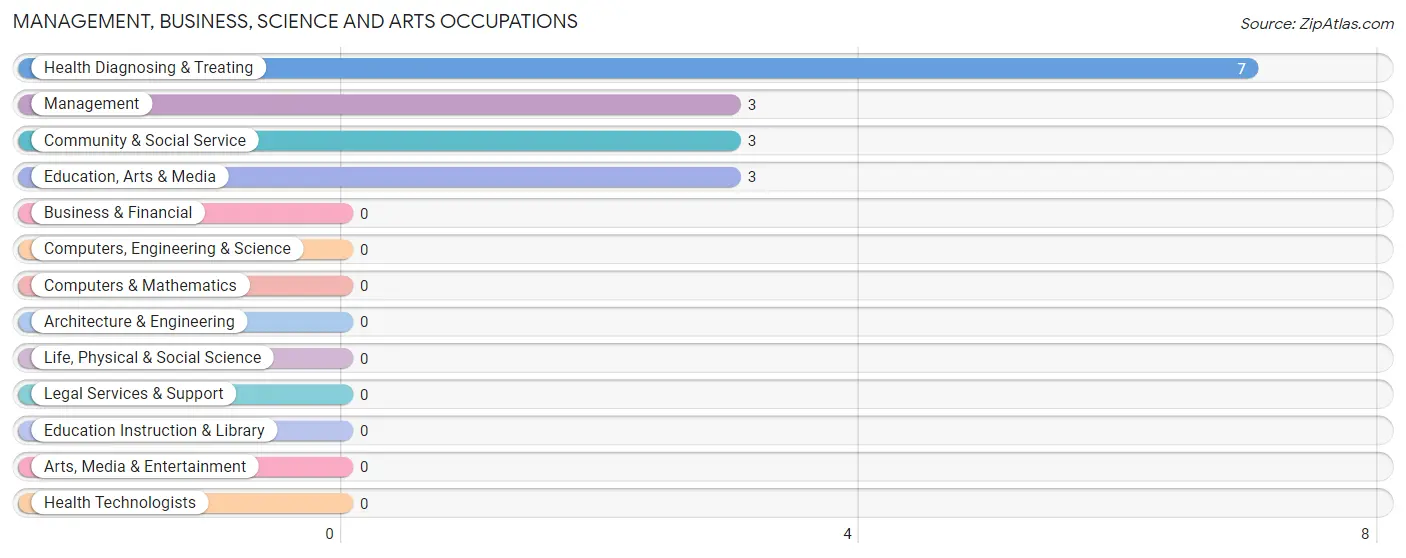
Management, Business, Science and Arts Occupations by Sex
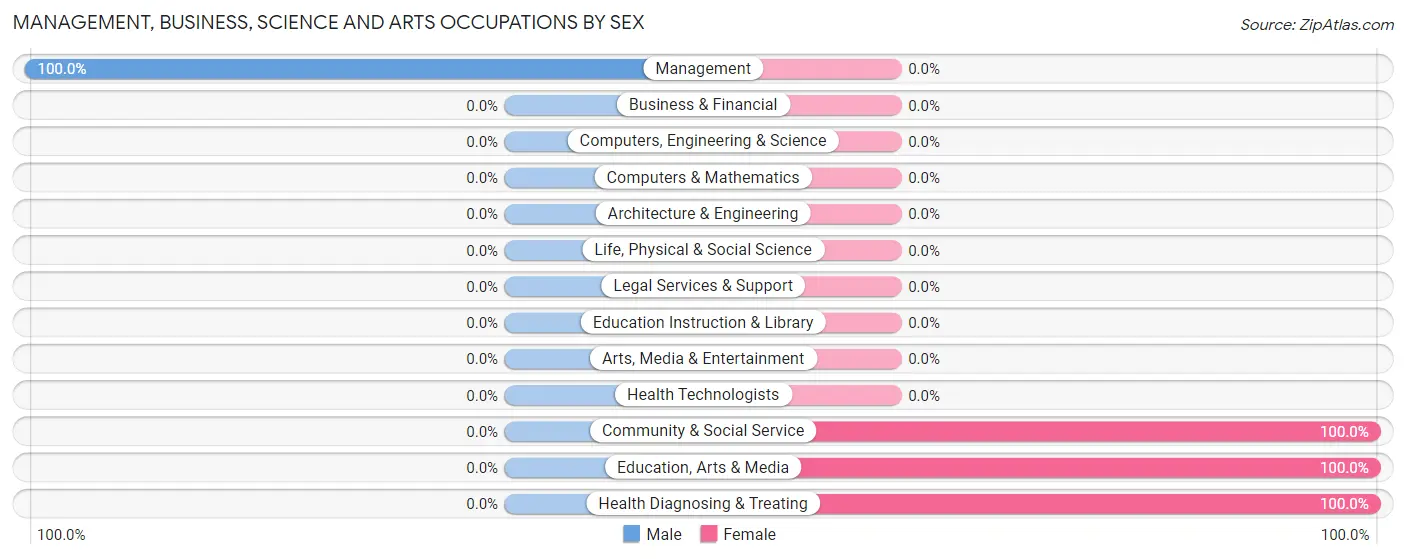
| Occupation | Male | Female |
| Management | 3 (100.0%) | 0 (0.0%) |
| Business & Financial | 0 (0.0%) | 0 (0.0%) |
| Computers, Engineering & Science | 0 (0.0%) | 0 (0.0%) |
| Computers & Mathematics | 0 (0.0%) | 0 (0.0%) |
| Architecture & Engineering | 0 (0.0%) | 0 (0.0%) |
| Life, Physical & Social Science | 0 (0.0%) | 0 (0.0%) |
| Community & Social Service | 0 (0.0%) | 3 (100.0%) |
| Education, Arts & Media | 0 (0.0%) | 3 (100.0%) |
| Legal Services & Support | 0 (0.0%) | 0 (0.0%) |
| Education Instruction & Library | 0 (0.0%) | 0 (0.0%) |
| Arts, Media & Entertainment | 0 (0.0%) | 0 (0.0%) |
| Health Diagnosing & Treating | 0 (0.0%) | 7 (100.0%) |
| Health Technologists | 0 (0.0%) | 0 (0.0%) |
| Total (Category) | 3 (23.1%) | 10 (76.9%) |
| Total (Overall) | 40 (54.8%) | 33 (45.2%) |
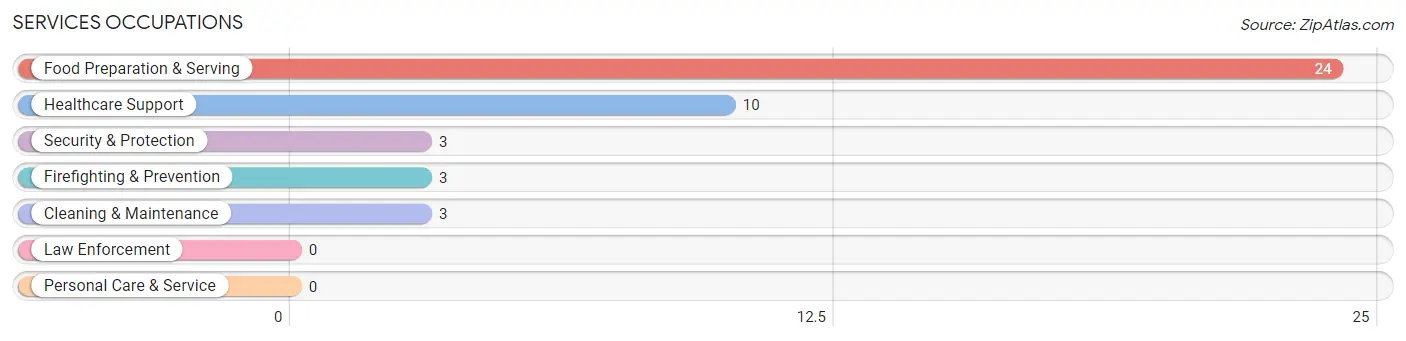
Services Occupations
The most common Services occupations in Riverland are Food Preparation & Serving (24 | 32.9%), Healthcare Support (10 | 13.7%), Security & Protection (3 | 4.1%), Firefighting & Prevention (3 | 4.1%), and Cleaning & Maintenance (3 | 4.1%).
Services Occupations by Sex
Within the Services occupations in Riverland, the most male-oriented occupations are Security & Protection (100.0%), Firefighting & Prevention (100.0%), and Cleaning & Maintenance (100.0%), while the most female-oriented occupations are Healthcare Support (70.0%), and Food Preparation & Serving (4.2%).
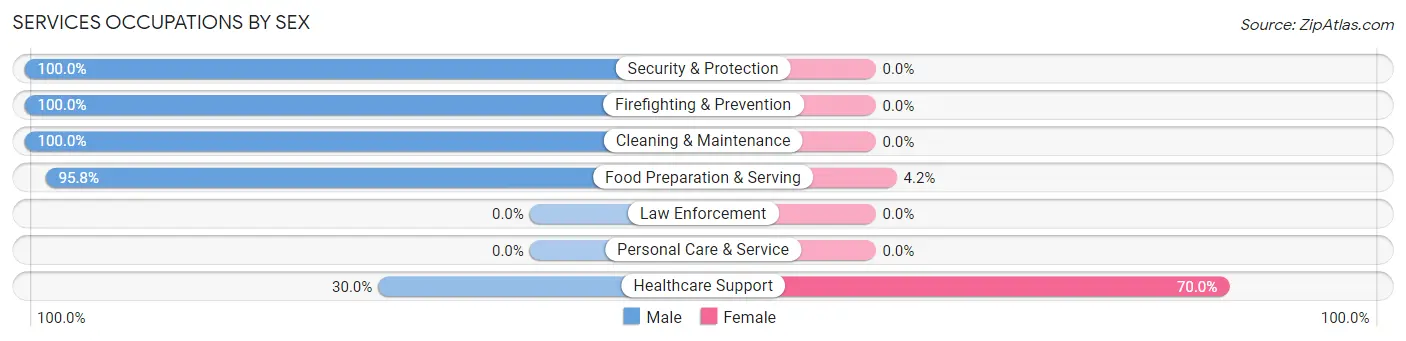
| Occupation | Male | Female |
| Healthcare Support | 3 (30.0%) | 7 (70.0%) |
| Security & Protection | 3 (100.0%) | 0 (0.0%) |
| Firefighting & Prevention | 3 (100.0%) | 0 (0.0%) |
| Law Enforcement | 0 (0.0%) | 0 (0.0%) |
| Food Preparation & Serving | 23 (95.8%) | 1 (4.2%) |
| Cleaning & Maintenance | 3 (100.0%) | 0 (0.0%) |
| Personal Care & Service | 0 (0.0%) | 0 (0.0%) |
| Total (Category) | 32 (80.0%) | 8 (20.0%) |
| Total (Overall) | 40 (54.8%) | 33 (45.2%) |
Sales and Office Occupations
The most common Sales and Office occupations in Riverland are , and Sales & Related (8 | 11.0%).
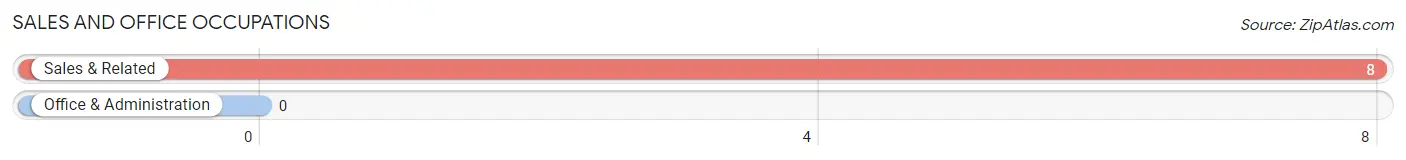
Sales and Office Occupations by Sex
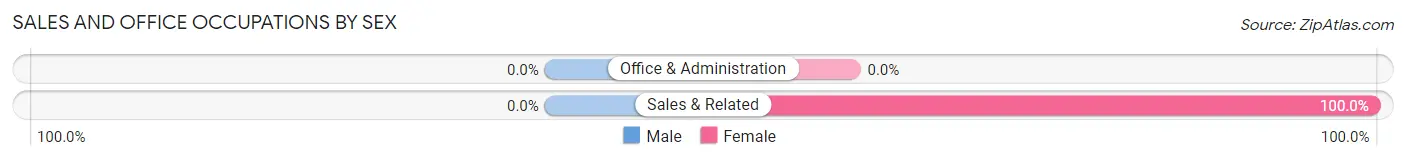
| Occupation | Male | Female |
| Sales & Related | 0 (0.0%) | 8 (100.0%) |
| Office & Administration | 0 (0.0%) | 0 (0.0%) |
| Total (Category) | 0 (0.0%) | 8 (100.0%) |
| Total (Overall) | 40 (54.8%) | 33 (45.2%) |
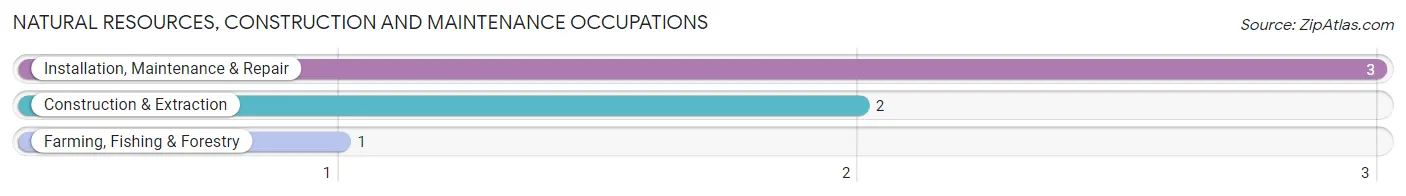
Natural Resources, Construction and Maintenance Occupations
The most common Natural Resources, Construction and Maintenance occupations in Riverland are Installation, Maintenance & Repair (3 | 4.1%), Construction & Extraction (2 | 2.7%), and Farming, Fishing & Forestry (1 | 1.4%).
Natural Resources, Construction and Maintenance Occupations by Sex
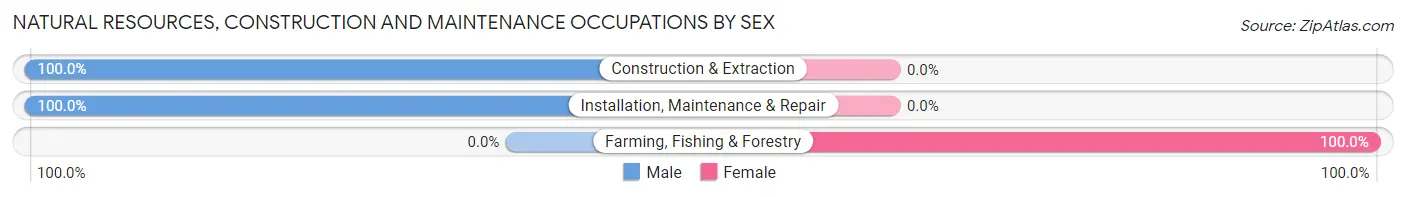
| Occupation | Male | Female |
| Farming, Fishing & Forestry | 0 (0.0%) | 1 (100.0%) |
| Construction & Extraction | 2 (100.0%) | 0 (0.0%) |
| Installation, Maintenance & Repair | 3 (100.0%) | 0 (0.0%) |
| Total (Category) | 5 (83.3%) | 1 (16.7%) |
| Total (Overall) | 40 (54.8%) | 33 (45.2%) |
Production, Transportation and Moving Occupations
The most common Production, Transportation and Moving occupations in Riverland are , and Production (6 | 8.2%).
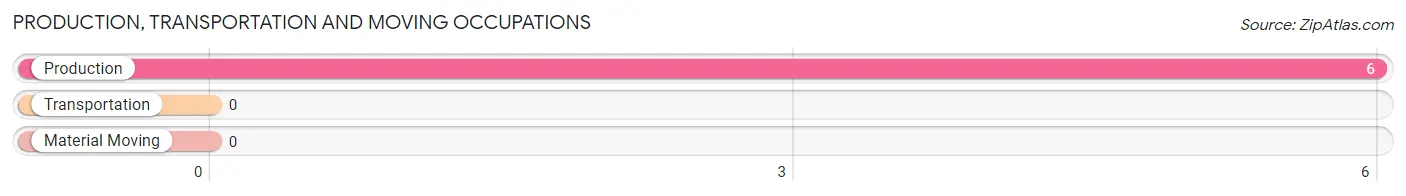
Production, Transportation and Moving Occupations by Sex
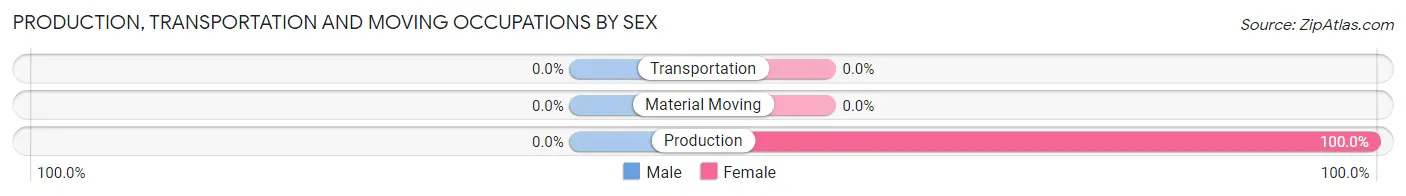
| Occupation | Male | Female |
| Production | 0 (0.0%) | 6 (100.0%) |
| Transportation | 0 (0.0%) | 0 (0.0%) |
| Material Moving | 0 (0.0%) | 0 (0.0%) |
| Total (Category) | 0 (0.0%) | 6 (100.0%) |
| Total (Overall) | 40 (54.8%) | 33 (45.2%) |
Employment Industries by Sex in Riverland
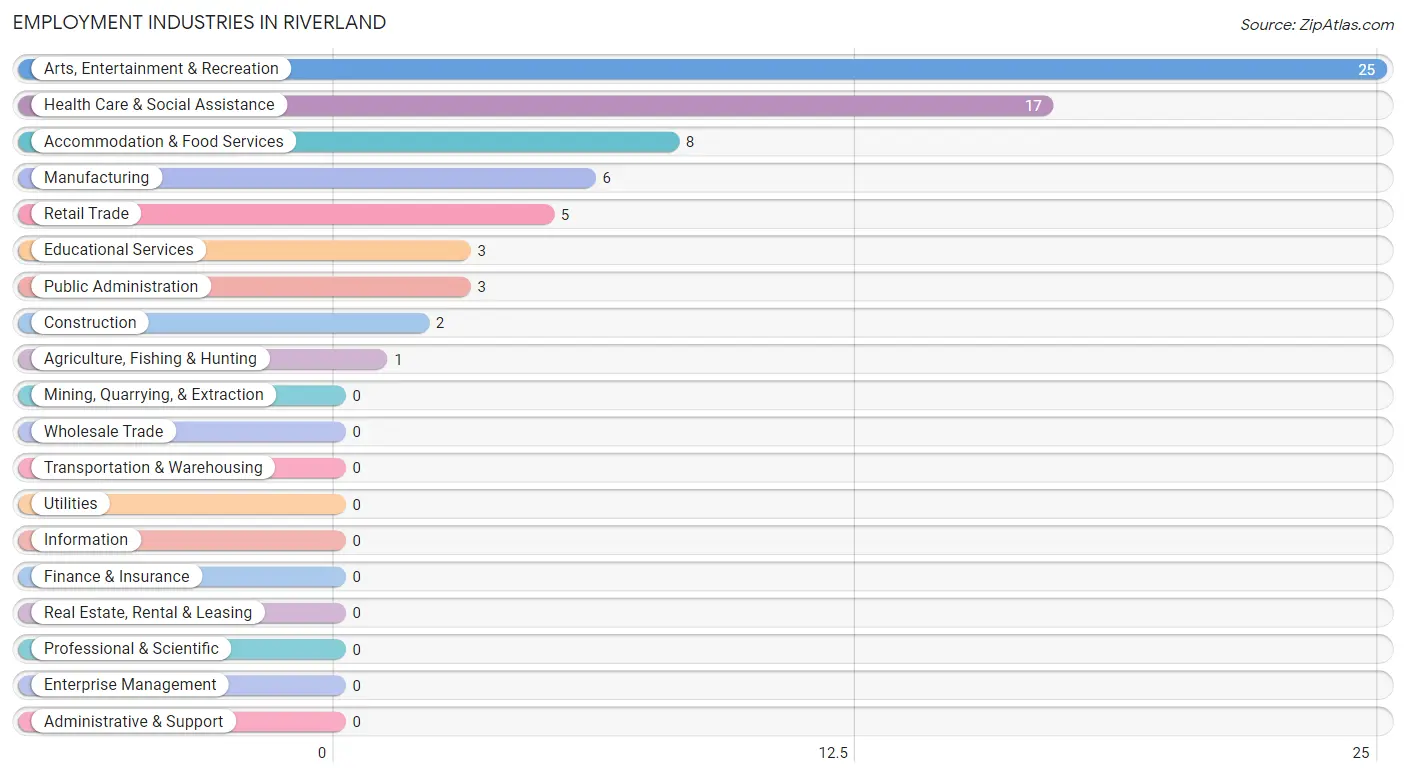
Employment Industries in Riverland
The major employment industries in Riverland include Arts, Entertainment & Recreation (25 | 34.3%), Health Care & Social Assistance (17 | 23.3%), Accommodation & Food Services (8 | 11.0%), Manufacturing (6 | 8.2%), and Retail Trade (5 | 6.9%).
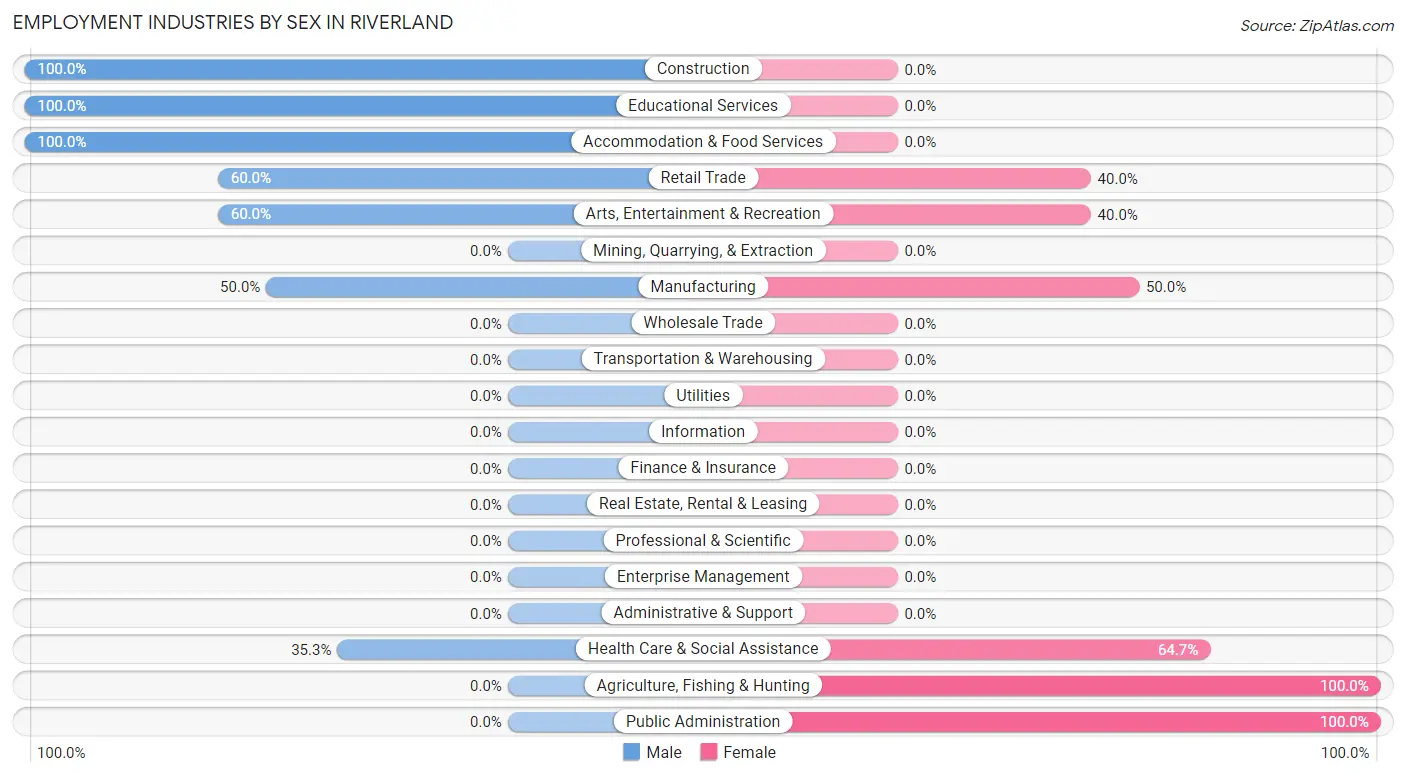
Employment Industries by Sex in Riverland
The Riverland industries that see more men than women are Construction (100.0%), Educational Services (100.0%), and Accommodation & Food Services (100.0%), whereas the industries that tend to have a higher number of women are Agriculture, Fishing & Hunting (100.0%), Public Administration (100.0%), and Health Care & Social Assistance (64.7%).
| Industry | Male | Female |
| Agriculture, Fishing & Hunting | 0 (0.0%) | 1 (100.0%) |
| Mining, Quarrying, & Extraction | 0 (0.0%) | 0 (0.0%) |
| Construction | 2 (100.0%) | 0 (0.0%) |
| Manufacturing | 3 (50.0%) | 3 (50.0%) |
| Wholesale Trade | 0 (0.0%) | 0 (0.0%) |
| Retail Trade | 3 (60.0%) | 2 (40.0%) |
| Transportation & Warehousing | 0 (0.0%) | 0 (0.0%) |
| Utilities | 0 (0.0%) | 0 (0.0%) |
| Information | 0 (0.0%) | 0 (0.0%) |
| Finance & Insurance | 0 (0.0%) | 0 (0.0%) |
| Real Estate, Rental & Leasing | 0 (0.0%) | 0 (0.0%) |
| Professional & Scientific | 0 (0.0%) | 0 (0.0%) |
| Enterprise Management | 0 (0.0%) | 0 (0.0%) |
| Administrative & Support | 0 (0.0%) | 0 (0.0%) |
| Educational Services | 3 (100.0%) | 0 (0.0%) |
| Health Care & Social Assistance | 6 (35.3%) | 11 (64.7%) |
| Arts, Entertainment & Recreation | 15 (60.0%) | 10 (40.0%) |
| Accommodation & Food Services | 8 (100.0%) | 0 (0.0%) |
| Public Administration | 0 (0.0%) | 3 (100.0%) |
| Total | 40 (54.8%) | 33 (45.2%) |
Education in Riverland
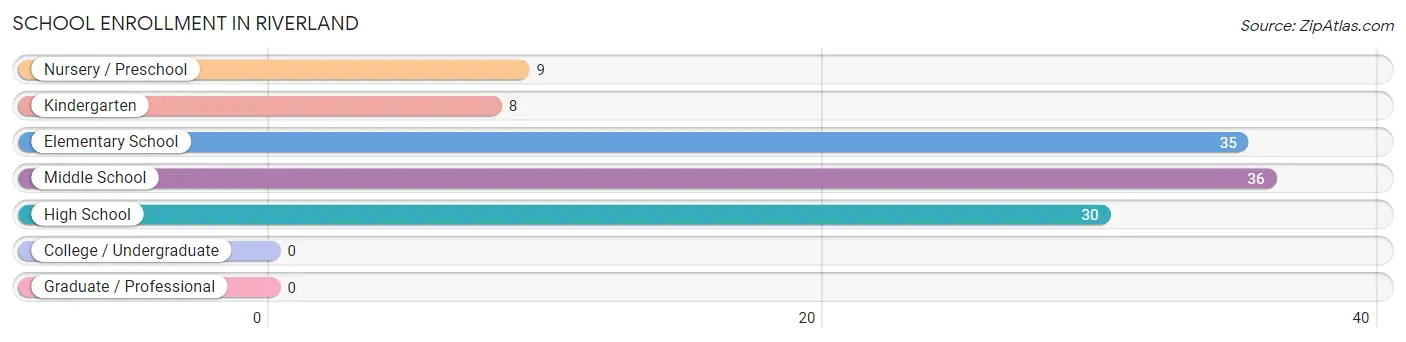
School Enrollment in Riverland
The most common levels of schooling among the 118 students in Riverland are middle school (36 | 30.5%), elementary school (35 | 29.7%), and high school (30 | 25.4%).
| School Level | # Students | % Students |
| Nursery / Preschool | 9 | 7.6% |
| Kindergarten | 8 | 6.8% |
| Elementary School | 35 | 29.7% |
| Middle School | 36 | 30.5% |
| High School | 30 | 25.4% |
| College / Undergraduate | 0 | 0.0% |
| Graduate / Professional | 0 | 0.0% |
| Total | 118 | 100.0% |
School Enrollment by Age by Funding Source in Riverland
Out of a total of 118 students who are enrolled in schools in Riverland, 2 (1.7%) attend a private institution, while the remaining 116 (98.3%) are enrolled in public schools. The age group of 5 to 9 year old has the highest likelihood of being enrolled in private schools, with 2 (5.1% in the age bracket) enrolled. Conversely, the age group of 3 to 4 year olds has the lowest likelihood of being enrolled in a private school, with 9 (100.0% in the age bracket) attending a public institution.
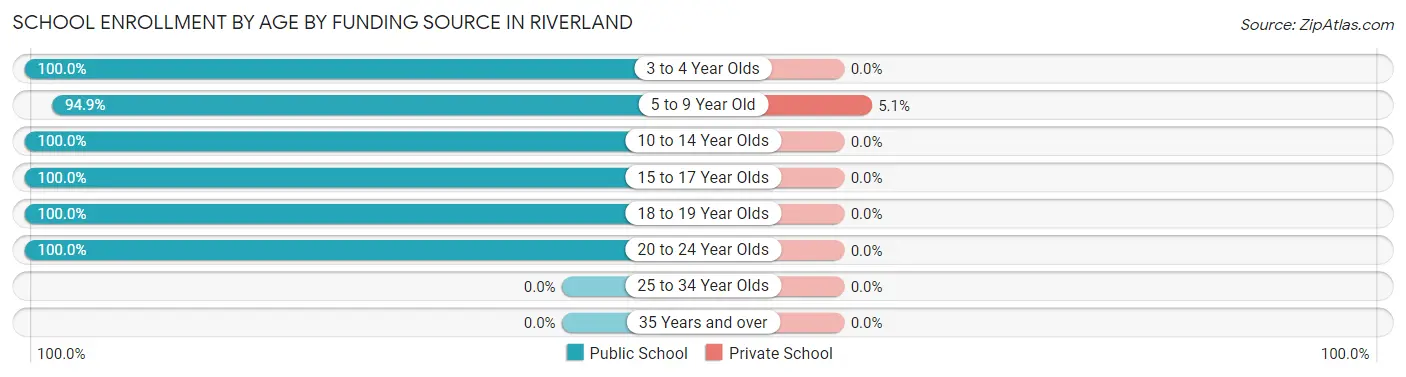
| Age Bracket | Public School | Private School |
| 3 to 4 Year Olds | 9 (100.0%) | 0 (0.0%) |
| 5 to 9 Year Old | 37 (94.9%) | 2 (5.1%) |
| 10 to 14 Year Olds | 38 (100.0%) | 0 (0.0%) |
| 15 to 17 Year Olds | 22 (100.0%) | 0 (0.0%) |
| 18 to 19 Year Olds | 4 (100.0%) | 0 (0.0%) |
| 20 to 24 Year Olds | 6 (100.0%) | 0 (0.0%) |
| 25 to 34 Year Olds | 0 (0.0%) | 0 (0.0%) |
| 35 Years and over | 0 (0.0%) | 0 (0.0%) |
| Total | 116 (98.3%) | 2 (1.7%) |
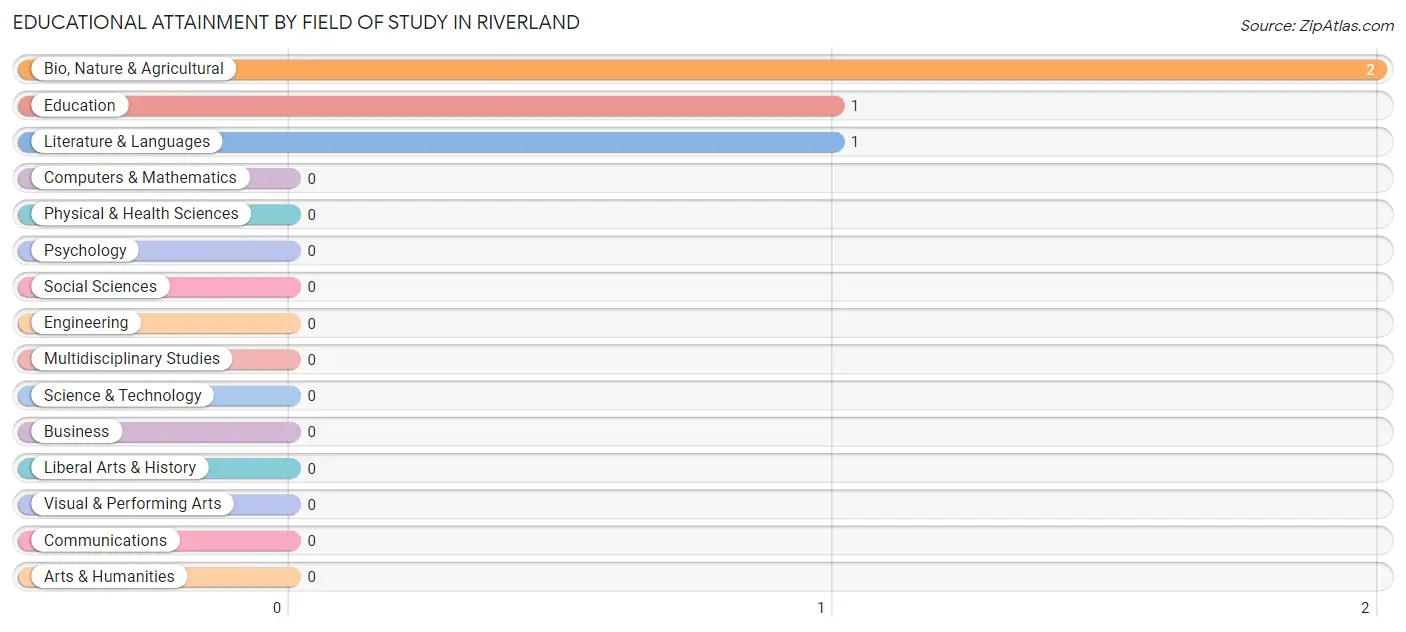
Educational Attainment by Field of Study in Riverland
Bio, nature & agricultural (2 | 50.0%), education (1 | 25.0%), and literature & languages (1 | 25.0%) are the most common fields of study among 4 individuals in Riverland who have obtained a bachelor's degree or higher.
| Field of Study | # Graduates | % Graduates |
| Computers & Mathematics | 0 | 0.0% |
| Bio, Nature & Agricultural | 2 | 50.0% |
| Physical & Health Sciences | 0 | 0.0% |
| Psychology | 0 | 0.0% |
| Social Sciences | 0 | 0.0% |
| Engineering | 0 | 0.0% |
| Multidisciplinary Studies | 0 | 0.0% |
| Science & Technology | 0 | 0.0% |
| Business | 0 | 0.0% |
| Education | 1 | 25.0% |
| Literature & Languages | 1 | 25.0% |
| Liberal Arts & History | 0 | 0.0% |
| Visual & Performing Arts | 0 | 0.0% |
| Communications | 0 | 0.0% |
| Arts & Humanities | 0 | 0.0% |
| Total | 4 | 100.0% |
Transportation & Commute in Riverland
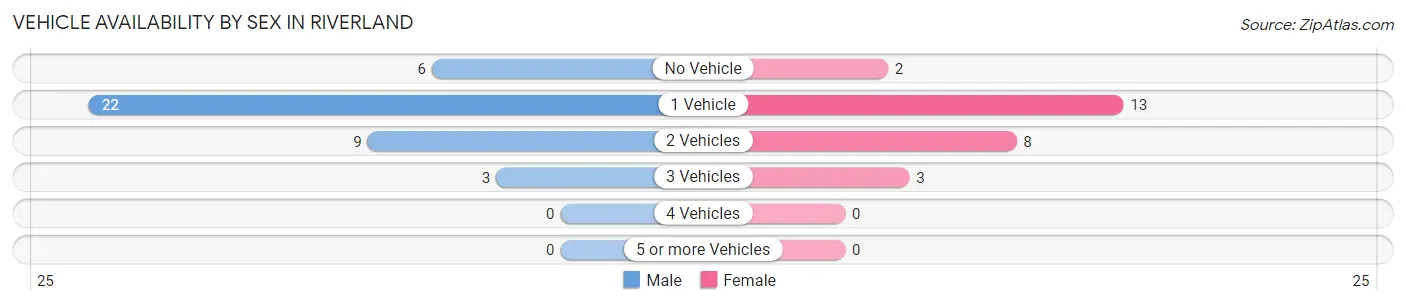
Vehicle Availability by Sex in Riverland
The most prevalent vehicle ownership categories in Riverland are males with 1 vehicle (22, accounting for 55.0%) and females with 1 vehicle (13, making up 84.6%).
| Vehicles Available | Male | Female |
| No Vehicle | 6 (15.0%) | 2 (7.7%) |
| 1 Vehicle | 22 (55.0%) | 13 (50.0%) |
| 2 Vehicles | 9 (22.5%) | 8 (30.8%) |
| 3 Vehicles | 3 (7.5%) | 3 (11.5%) |
| 4 Vehicles | 0 (0.0%) | 0 (0.0%) |
| 5 or more Vehicles | 0 (0.0%) | 0 (0.0%) |
| Total | 40 (100.0%) | 26 (100.0%) |
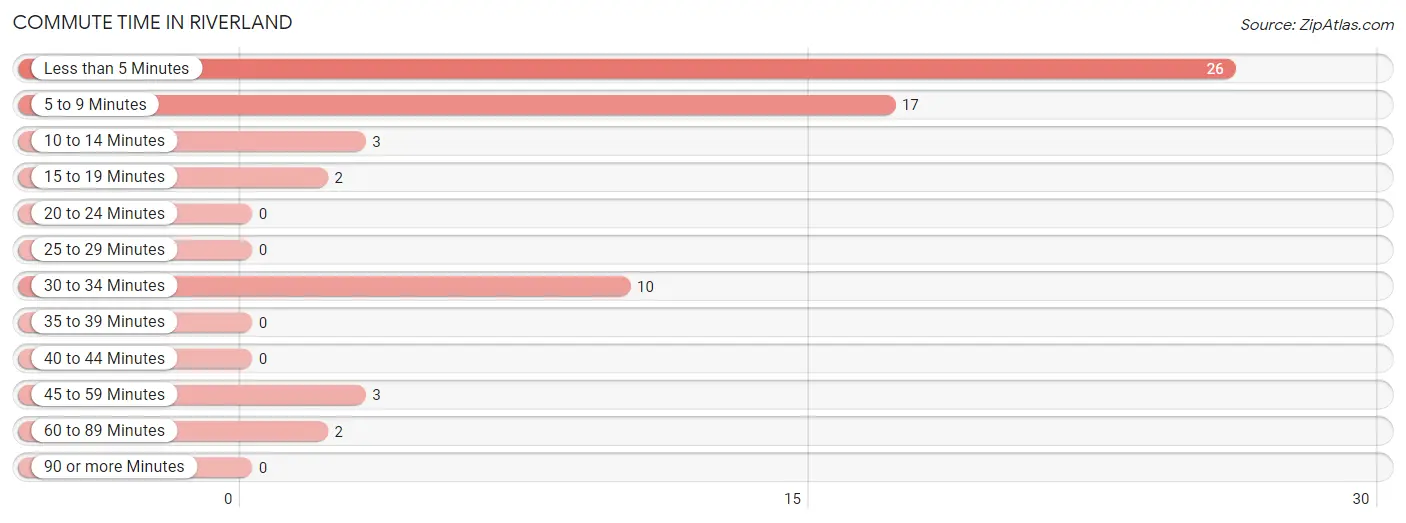
Commute Time in Riverland
The most frequently occuring commute durations in Riverland are less than 5 minutes (26 commuters, 41.3%), 5 to 9 minutes (17 commuters, 27.0%), and 30 to 34 minutes (10 commuters, 15.9%).
| Commute Time | # Commuters | % Commuters |
| Less than 5 Minutes | 26 | 41.3% |
| 5 to 9 Minutes | 17 | 27.0% |
| 10 to 14 Minutes | 3 | 4.8% |
| 15 to 19 Minutes | 2 | 3.2% |
| 20 to 24 Minutes | 0 | 0.0% |
| 25 to 29 Minutes | 0 | 0.0% |
| 30 to 34 Minutes | 10 | 15.9% |
| 35 to 39 Minutes | 0 | 0.0% |
| 40 to 44 Minutes | 0 | 0.0% |
| 45 to 59 Minutes | 3 | 4.8% |
| 60 to 89 Minutes | 2 | 3.2% |
| 90 or more Minutes | 0 | 0.0% |
Commute Time by Sex in Riverland
The most common commute times in Riverland are less than 5 minutes (16 commuters, 43.2%) for males and less than 5 minutes (10 commuters, 38.5%) for females.
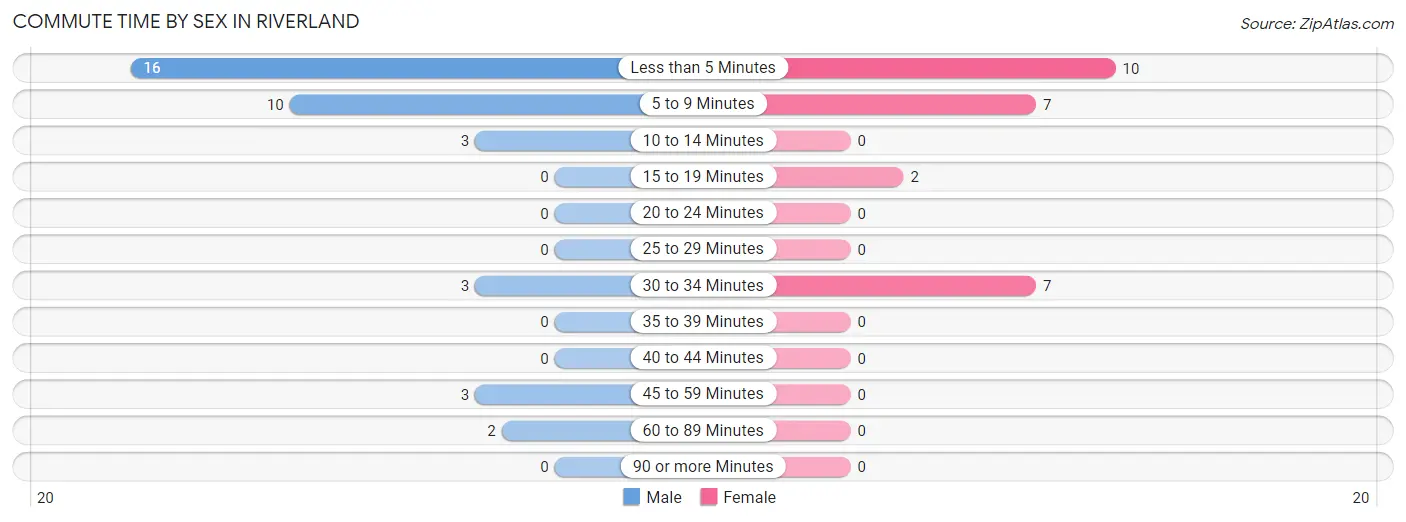
| Commute Time | Male | Female |
| Less than 5 Minutes | 16 (43.2%) | 10 (38.5%) |
| 5 to 9 Minutes | 10 (27.0%) | 7 (26.9%) |
| 10 to 14 Minutes | 3 (8.1%) | 0 (0.0%) |
| 15 to 19 Minutes | 0 (0.0%) | 2 (7.7%) |
| 20 to 24 Minutes | 0 (0.0%) | 0 (0.0%) |
| 25 to 29 Minutes | 0 (0.0%) | 0 (0.0%) |
| 30 to 34 Minutes | 3 (8.1%) | 7 (26.9%) |
| 35 to 39 Minutes | 0 (0.0%) | 0 (0.0%) |
| 40 to 44 Minutes | 0 (0.0%) | 0 (0.0%) |
| 45 to 59 Minutes | 3 (8.1%) | 0 (0.0%) |
| 60 to 89 Minutes | 2 (5.4%) | 0 (0.0%) |
| 90 or more Minutes | 0 (0.0%) | 0 (0.0%) |
Time of Departure to Work by Sex in Riverland
The most frequent times of departure to work in Riverland are 7:30 AM to 7:59 AM (9, 24.3%) for males and 7:30 AM to 7:59 AM (8, 30.8%) for females.
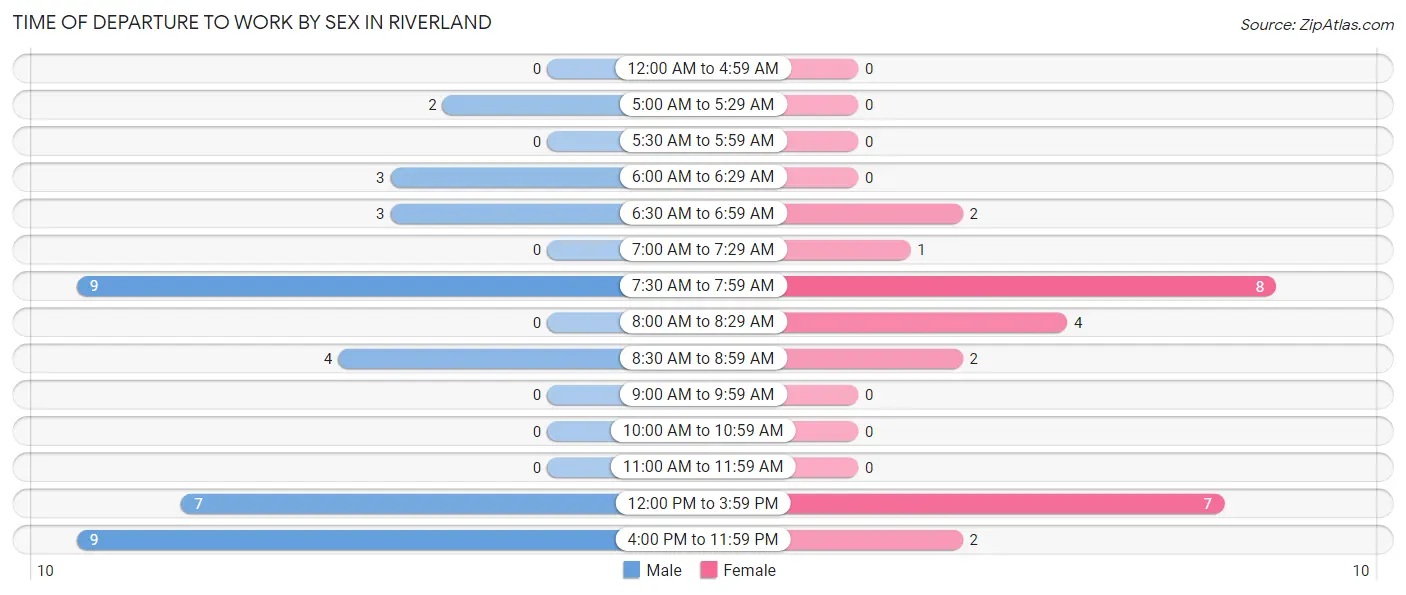
| Time of Departure | Male | Female |
| 12:00 AM to 4:59 AM | 0 (0.0%) | 0 (0.0%) |
| 5:00 AM to 5:29 AM | 2 (5.4%) | 0 (0.0%) |
| 5:30 AM to 5:59 AM | 0 (0.0%) | 0 (0.0%) |
| 6:00 AM to 6:29 AM | 3 (8.1%) | 0 (0.0%) |
| 6:30 AM to 6:59 AM | 3 (8.1%) | 2 (7.7%) |
| 7:00 AM to 7:29 AM | 0 (0.0%) | 1 (3.8%) |
| 7:30 AM to 7:59 AM | 9 (24.3%) | 8 (30.8%) |
| 8:00 AM to 8:29 AM | 0 (0.0%) | 4 (15.4%) |
| 8:30 AM to 8:59 AM | 4 (10.8%) | 2 (7.7%) |
| 9:00 AM to 9:59 AM | 0 (0.0%) | 0 (0.0%) |
| 10:00 AM to 10:59 AM | 0 (0.0%) | 0 (0.0%) |
| 11:00 AM to 11:59 AM | 0 (0.0%) | 0 (0.0%) |
| 12:00 PM to 3:59 PM | 7 (18.9%) | 7 (26.9%) |
| 4:00 PM to 11:59 PM | 9 (24.3%) | 2 (7.7%) |
| Total | 37 (100.0%) | 26 (100.0%) |
Housing Occupancy in Riverland
Occupancy by Ownership in Riverland
Of the total 80 dwellings in Riverland, owner-occupied units account for 1 (1.3%), while renter-occupied units make up 79 (98.8%).
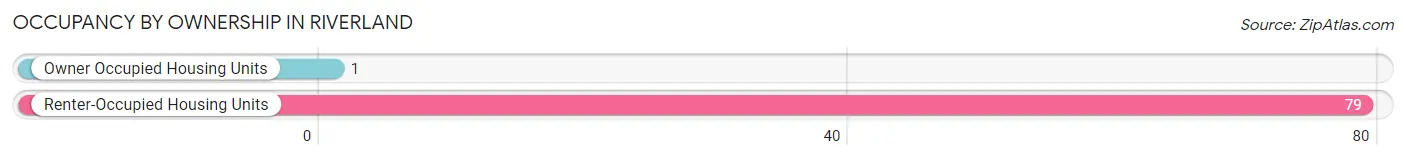
| Occupancy | # Housing Units | % Housing Units |
| Owner Occupied Housing Units | 1 | 1.3% |
| Renter-Occupied Housing Units | 79 | 98.8% |
| Total Occupied Housing Units | 80 | 100.0% |
Occupancy by Household Size in Riverland
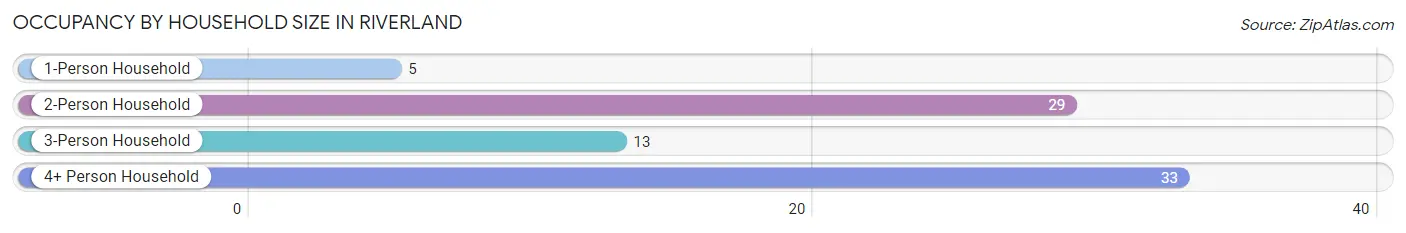
| Household Size | # Housing Units | % Housing Units |
| 1-Person Household | 5 | 6.2% |
| 2-Person Household | 29 | 36.2% |
| 3-Person Household | 13 | 16.3% |
| 4+ Person Household | 33 | 41.2% |
| Total Housing Units | 80 | 100.0% |
Occupancy by Ownership by Household Size in Riverland
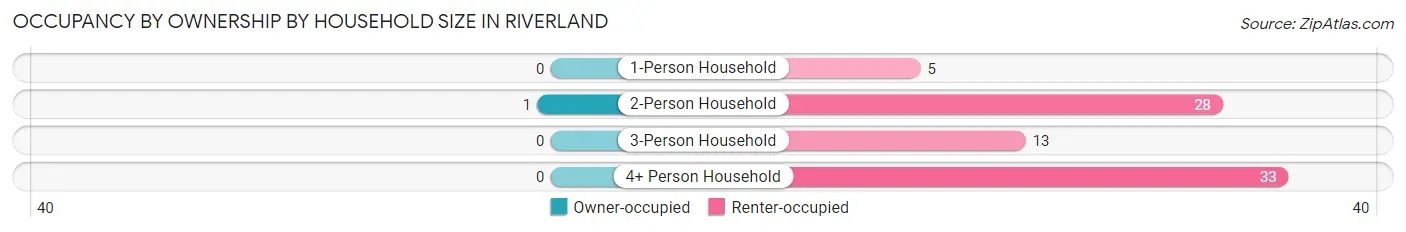
| Household Size | Owner-occupied | Renter-occupied |
| 1-Person Household | 0 (0.0%) | 5 (100.0%) |
| 2-Person Household | 1 (3.5%) | 28 (96.6%) |
| 3-Person Household | 0 (0.0%) | 13 (100.0%) |
| 4+ Person Household | 0 (0.0%) | 33 (100.0%) |
| Total Housing Units | 1 (1.3%) | 79 (98.8%) |
Occupancy by Educational Attainment in Riverland
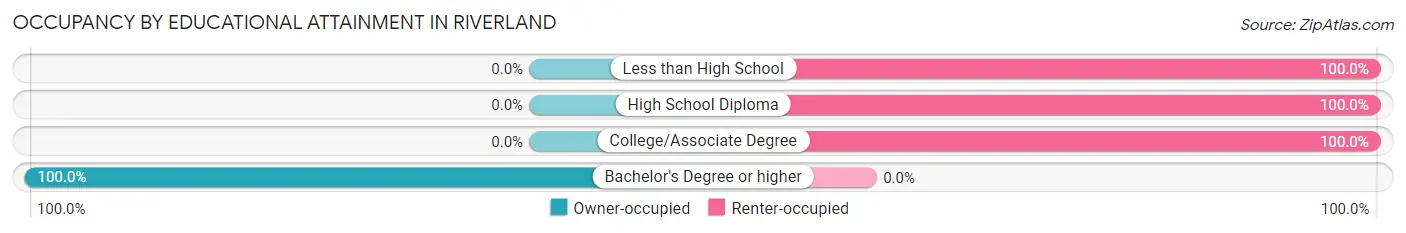
| Household Size | Owner-occupied | Renter-occupied |
| Less than High School | 0 (0.0%) | 24 (100.0%) |
| High School Diploma | 0 (0.0%) | 21 (100.0%) |
| College/Associate Degree | 0 (0.0%) | 34 (100.0%) |
| Bachelor's Degree or higher | 1 (100.0%) | 0 (0.0%) |
Occupancy by Age of Householder in Riverland
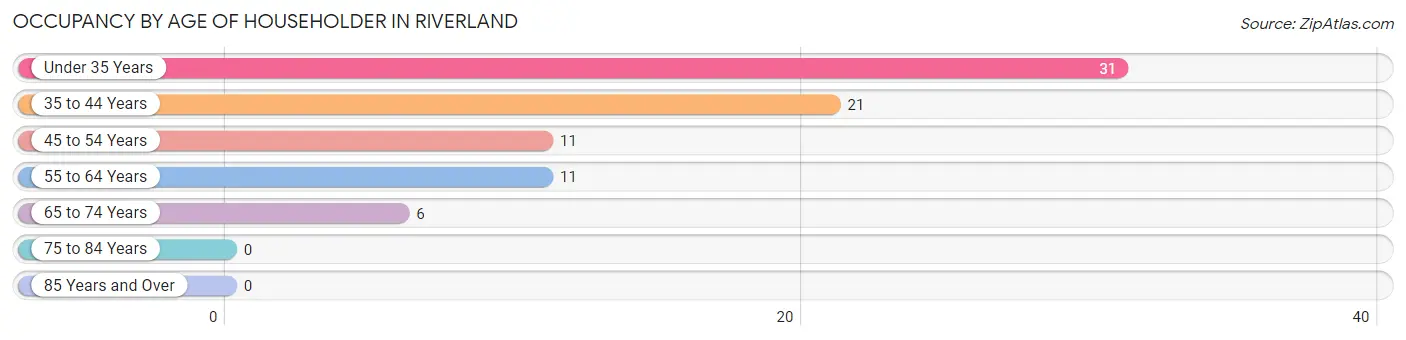
| Age Bracket | # Households | % Households |
| Under 35 Years | 31 | 38.8% |
| 35 to 44 Years | 21 | 26.3% |
| 45 to 54 Years | 11 | 13.8% |
| 55 to 64 Years | 11 | 13.8% |
| 65 to 74 Years | 6 | 7.5% |
| 75 to 84 Years | 0 | 0.0% |
| 85 Years and Over | 0 | 0.0% |
| Total | 80 | 100.0% |
Housing Finances in Riverland
Median Income by Occupancy in Riverland
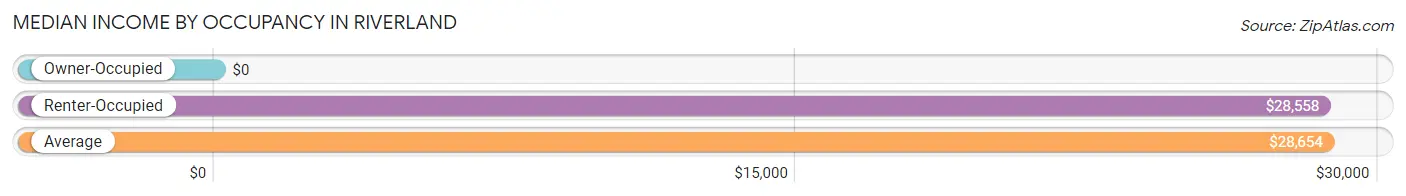
| Occupancy Type | # Households | Median Income |
| Owner-Occupied | 1 (1.3%) | $0 |
| Renter-Occupied | 79 (98.8%) | $28,558 |
| Average | 80 (100.0%) | $28,654 |
Occupancy by Householder Income Bracket in Riverland
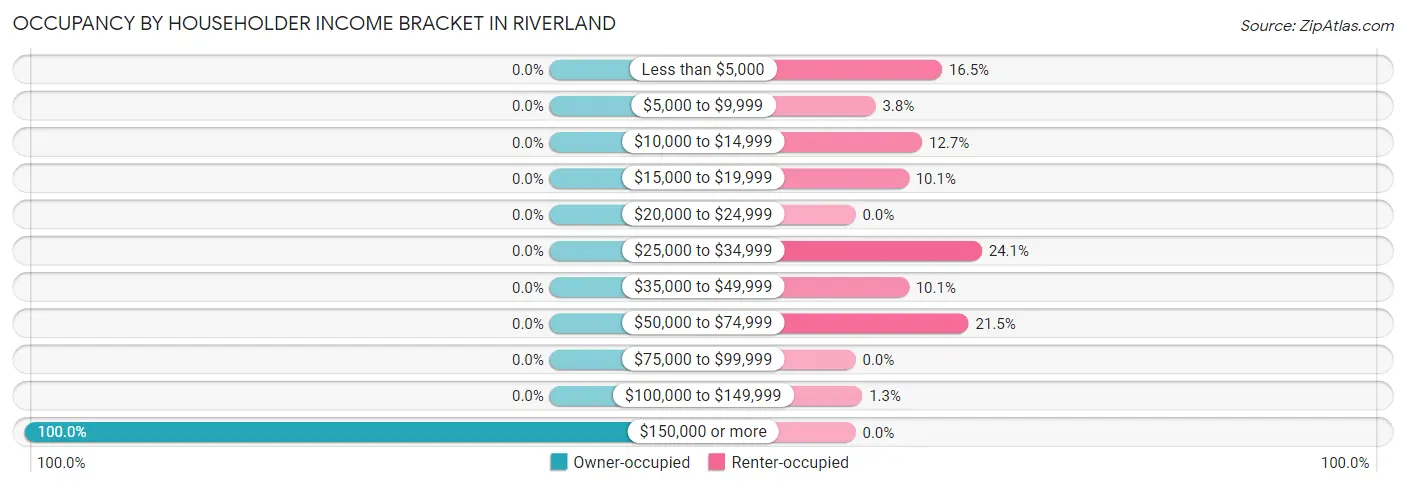
| Income Bracket | Owner-occupied | Renter-occupied |
| Less than $5,000 | 0 (0.0%) | 13 (16.5%) |
| $5,000 to $9,999 | 0 (0.0%) | 3 (3.8%) |
| $10,000 to $14,999 | 0 (0.0%) | 10 (12.7%) |
| $15,000 to $19,999 | 0 (0.0%) | 8 (10.1%) |
| $20,000 to $24,999 | 0 (0.0%) | 0 (0.0%) |
| $25,000 to $34,999 | 0 (0.0%) | 19 (24.0%) |
| $35,000 to $49,999 | 0 (0.0%) | 8 (10.1%) |
| $50,000 to $74,999 | 0 (0.0%) | 17 (21.5%) |
| $75,000 to $99,999 | 0 (0.0%) | 0 (0.0%) |
| $100,000 to $149,999 | 0 (0.0%) | 1 (1.3%) |
| $150,000 or more | 1 (100.0%) | 0 (0.0%) |
| Total | 1 (100.0%) | 79 (100.0%) |
Monthly Housing Cost Tiers in Riverland
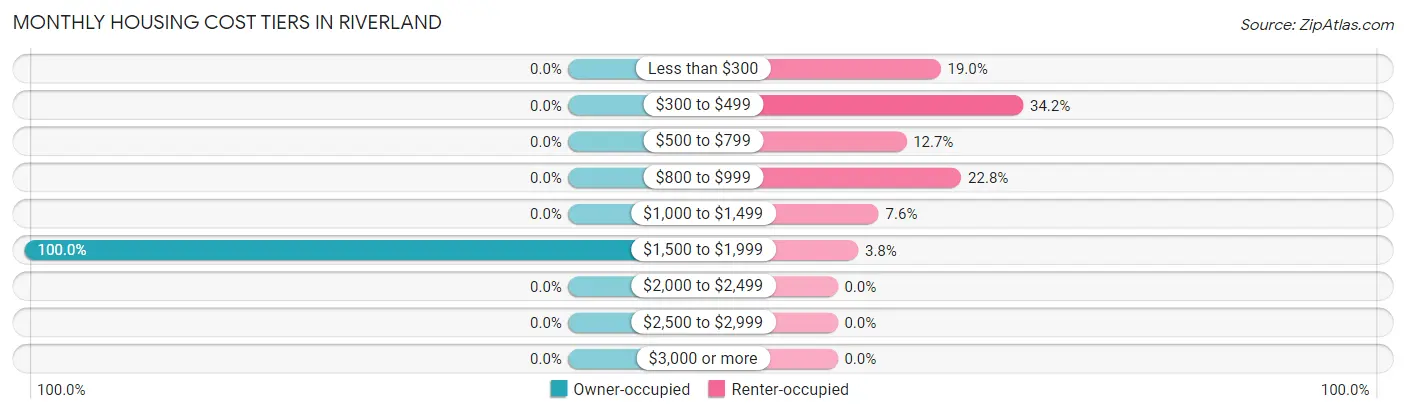
| Monthly Cost | Owner-occupied | Renter-occupied |
| Less than $300 | 0 (0.0%) | 15 (19.0%) |
| $300 to $499 | 0 (0.0%) | 27 (34.2%) |
| $500 to $799 | 0 (0.0%) | 10 (12.7%) |
| $800 to $999 | 0 (0.0%) | 18 (22.8%) |
| $1,000 to $1,499 | 0 (0.0%) | 6 (7.6%) |
| $1,500 to $1,999 | 1 (100.0%) | 3 (3.8%) |
| $2,000 to $2,499 | 0 (0.0%) | 0 (0.0%) |
| $2,500 to $2,999 | 0 (0.0%) | 0 (0.0%) |
| $3,000 or more | 0 (0.0%) | 0 (0.0%) |
| Total | 1 (100.0%) | 79 (100.0%) |
Physical Housing Characteristics in Riverland
Housing Structures in Riverland
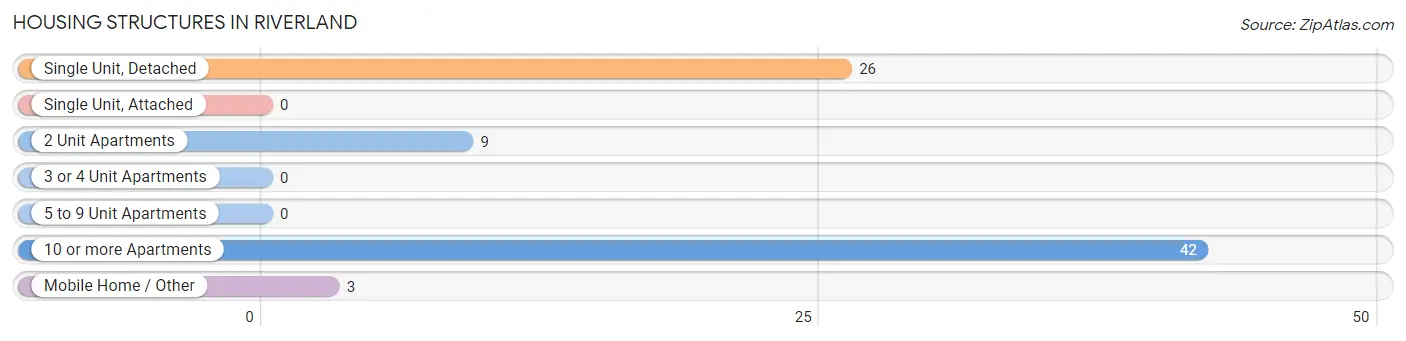
| Structure Type | # Housing Units | % Housing Units |
| Single Unit, Detached | 26 | 32.5% |
| Single Unit, Attached | 0 | 0.0% |
| 2 Unit Apartments | 9 | 11.3% |
| 3 or 4 Unit Apartments | 0 | 0.0% |
| 5 to 9 Unit Apartments | 0 | 0.0% |
| 10 or more Apartments | 42 | 52.5% |
| Mobile Home / Other | 3 | 3.7% |
| Total | 80 | 100.0% |
Housing Structures by Occupancy in Riverland
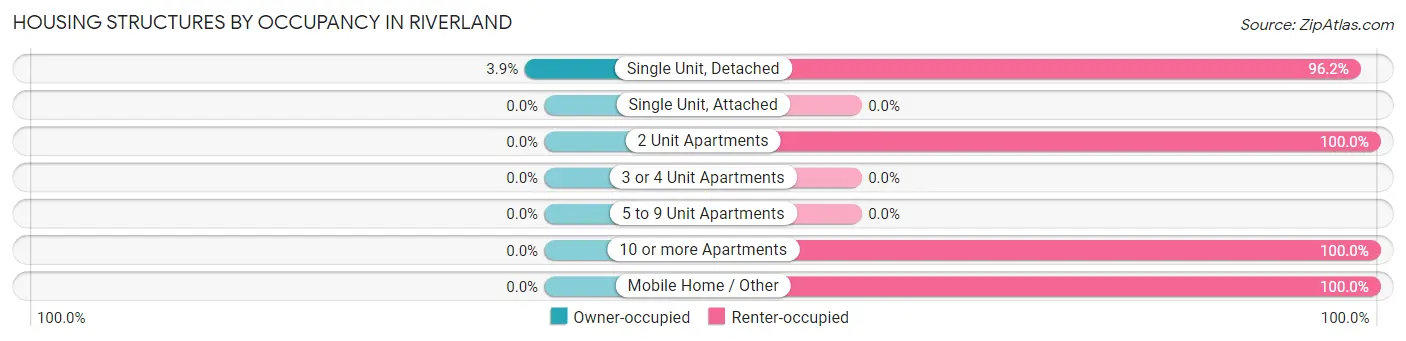
| Structure Type | Owner-occupied | Renter-occupied |
| Single Unit, Detached | 1 (3.8%) | 25 (96.2%) |
| Single Unit, Attached | 0 (0.0%) | 0 (0.0%) |
| 2 Unit Apartments | 0 (0.0%) | 9 (100.0%) |
| 3 or 4 Unit Apartments | 0 (0.0%) | 0 (0.0%) |
| 5 to 9 Unit Apartments | 0 (0.0%) | 0 (0.0%) |
| 10 or more Apartments | 0 (0.0%) | 42 (100.0%) |
| Mobile Home / Other | 0 (0.0%) | 3 (100.0%) |
| Total | 1 (1.3%) | 79 (98.8%) |
Housing Structures by Number of Rooms in Riverland
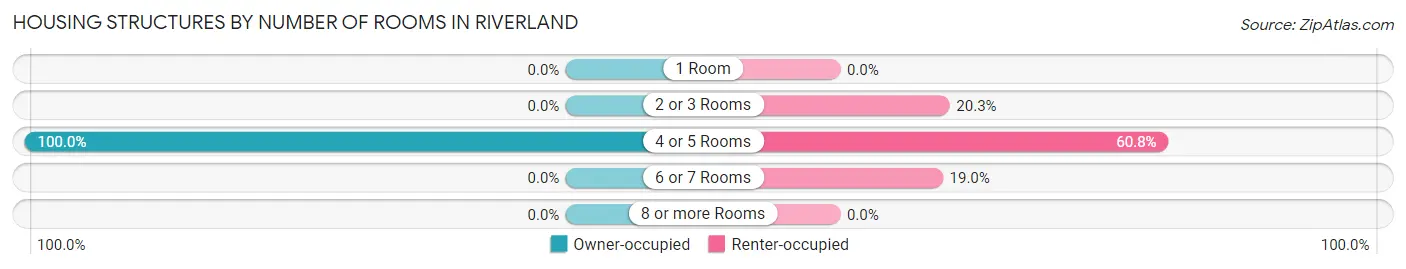
| Number of Rooms | Owner-occupied | Renter-occupied |
| 1 Room | 0 (0.0%) | 0 (0.0%) |
| 2 or 3 Rooms | 0 (0.0%) | 16 (20.3%) |
| 4 or 5 Rooms | 1 (100.0%) | 48 (60.8%) |
| 6 or 7 Rooms | 0 (0.0%) | 15 (19.0%) |
| 8 or more Rooms | 0 (0.0%) | 0 (0.0%) |
| Total | 1 (100.0%) | 79 (100.0%) |
Housing Structure by Heating Type in Riverland
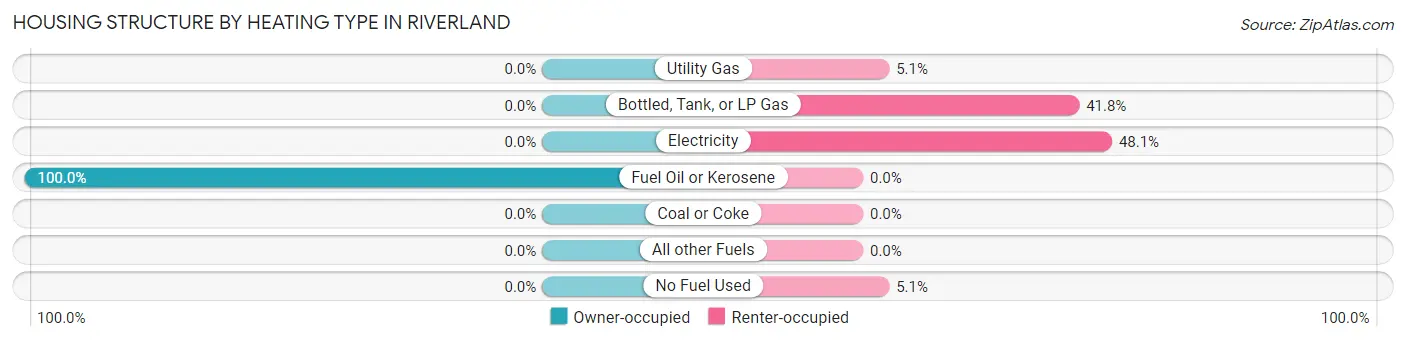
| Heating Type | Owner-occupied | Renter-occupied |
| Utility Gas | 0 (0.0%) | 4 (5.1%) |
| Bottled, Tank, or LP Gas | 0 (0.0%) | 33 (41.8%) |
| Electricity | 0 (0.0%) | 38 (48.1%) |
| Fuel Oil or Kerosene | 1 (100.0%) | 0 (0.0%) |
| Coal or Coke | 0 (0.0%) | 0 (0.0%) |
| All other Fuels | 0 (0.0%) | 0 (0.0%) |
| No Fuel Used | 0 (0.0%) | 4 (5.1%) |
| Total | 1 (100.0%) | 79 (100.0%) |
Household Vehicle Usage in Riverland
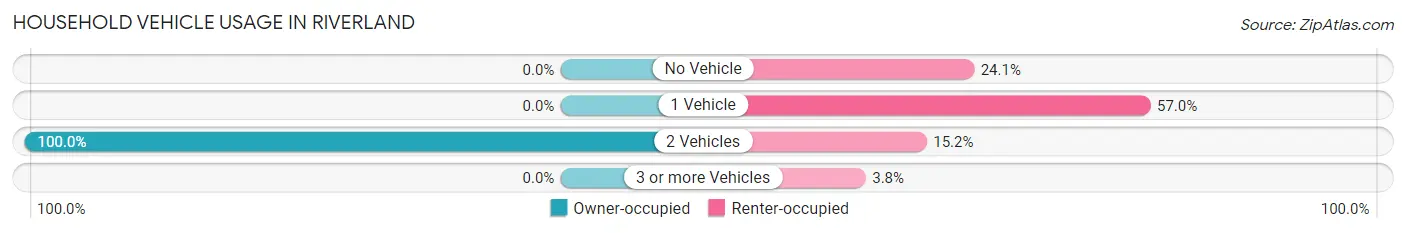
| Vehicles per Household | Owner-occupied | Renter-occupied |
| No Vehicle | 0 (0.0%) | 19 (24.0%) |
| 1 Vehicle | 0 (0.0%) | 45 (57.0%) |
| 2 Vehicles | 1 (100.0%) | 12 (15.2%) |
| 3 or more Vehicles | 0 (0.0%) | 3 (3.8%) |
| Total | 1 (100.0%) | 79 (100.0%) |
Real Estate & Mortgages in Riverland
Real Estate and Mortgage Overview in Riverland
| Characteristic | Without Mortgage | With Mortgage |
| Housing Units | 0 | 1 |
| Median Property Value | - | - |
| Median Household Income | - | - |
| Monthly Housing Costs | - | - |
| Real Estate Taxes | - | - |
Property Value by Mortgage Status in Riverland
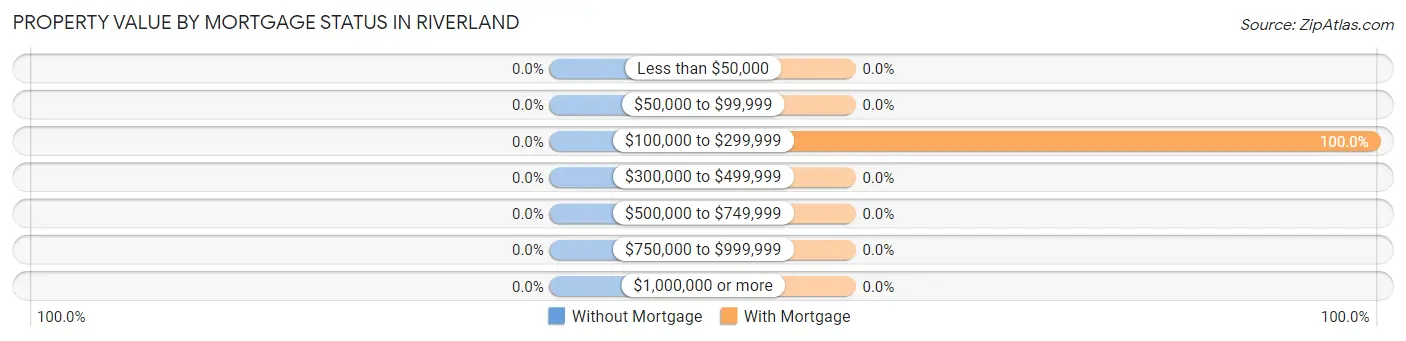
| Property Value | Without Mortgage | With Mortgage |
| Less than $50,000 | 0 (0.0%) | 0 (0.0%) |
| $50,000 to $99,999 | 0 (0.0%) | 0 (0.0%) |
| $100,000 to $299,999 | 0 (0.0%) | 1 (100.0%) |
| $300,000 to $499,999 | 0 (0.0%) | 0 (0.0%) |
| $500,000 to $749,999 | 0 (0.0%) | 0 (0.0%) |
| $750,000 to $999,999 | 0 (0.0%) | 0 (0.0%) |
| $1,000,000 or more | 0 (0.0%) | 0 (0.0%) |
| Total | 0 (0.0%) | 1 (100.0%) |
Household Income by Mortgage Status in Riverland
| Household Income | Without Mortgage | With Mortgage |
| Less than $10,000 | 0 (0.0%) | 0 (0.0%) |
| $10,000 to $24,999 | 0 (0.0%) | 0 (0.0%) |
| $25,000 to $34,999 | 0 (0.0%) | 0 (0.0%) |
| $35,000 to $49,999 | 0 (0.0%) | 0 (0.0%) |
| $50,000 to $74,999 | 0 (0.0%) | 0 (0.0%) |
| $75,000 to $99,999 | 0 (0.0%) | 0 (0.0%) |
| $100,000 to $149,999 | 0 (0.0%) | 0 (0.0%) |
| $150,000 or more | 0 (0.0%) | 0 (0.0%) |
| Total | 0 (0.0%) | 1 (100.0%) |
Property Value to Household Income Ratio in Riverland
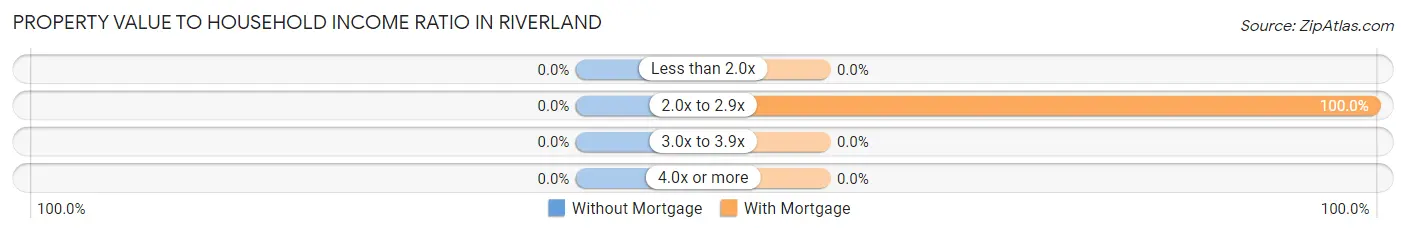
| Value-to-Income Ratio | Without Mortgage | With Mortgage |
| Less than 2.0x | 0 (0.0%) | 0 (0.0%) |
| 2.0x to 2.9x | 0 (0.0%) | 1 (100.0%) |
| 3.0x to 3.9x | 0 (0.0%) | 0 (0.0%) |
| 4.0x or more | 0 (0.0%) | 0 (0.0%) |
| Total | 0 (0.0%) | 1 (100.0%) |
Real Estate Taxes by Mortgage Status in Riverland
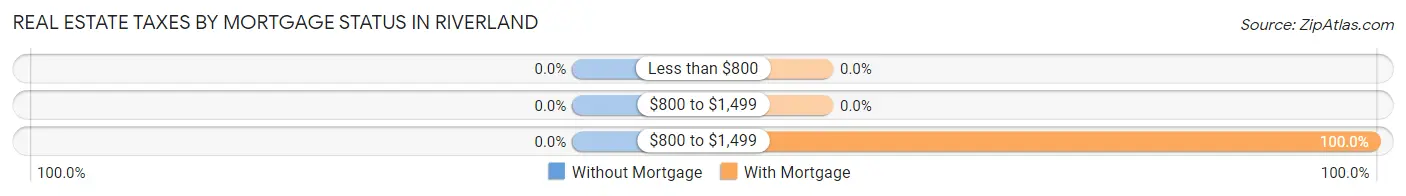
| Property Taxes | Without Mortgage | With Mortgage |
| Less than $800 | 0 (0.0%) | 0 (0.0%) |
| $800 to $1,499 | 0 (0.0%) | 0 (0.0%) |
| $800 to $1,499 | 0 (0.0%) | 1 (100.0%) |
| Total | 0 (0.0%) | 1 (100.0%) |
Health & Disability in Riverland
Health Insurance Coverage by Age in Riverland
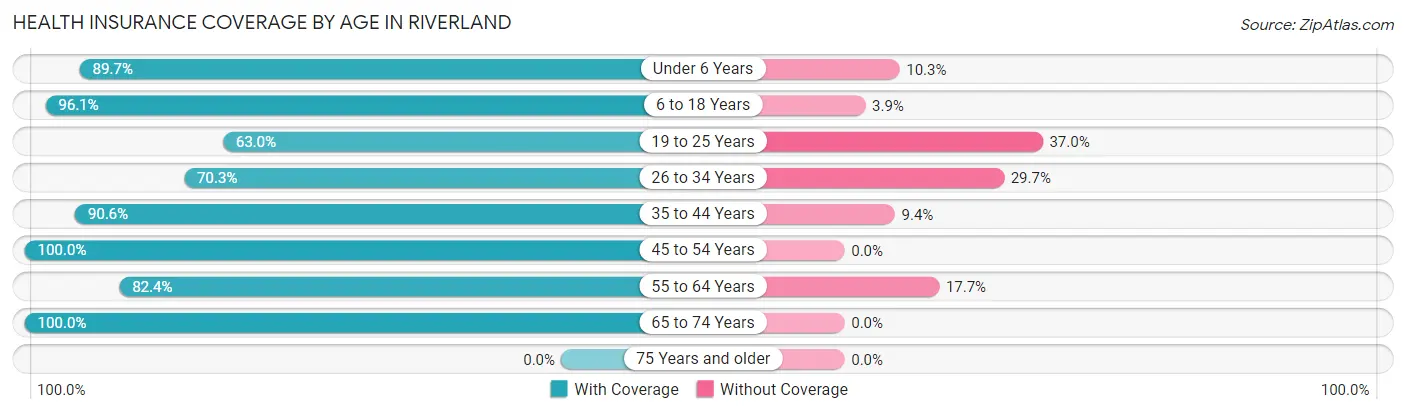
| Age Bracket | With Coverage | Without Coverage |
| Under 6 Years | 35 (89.7%) | 4 (10.3%) |
| 6 to 18 Years | 99 (96.1%) | 4 (3.9%) |
| 19 to 25 Years | 29 (63.0%) | 17 (37.0%) |
| 26 to 34 Years | 26 (70.3%) | 11 (29.7%) |
| 35 to 44 Years | 29 (90.6%) | 3 (9.4%) |
| 45 to 54 Years | 19 (100.0%) | 0 (0.0%) |
| 55 to 64 Years | 14 (82.4%) | 3 (17.6%) |
| 65 to 74 Years | 6 (100.0%) | 0 (0.0%) |
| 75 Years and older | 0 (0.0%) | 0 (0.0%) |
| Total | 257 (86.0%) | 42 (14.1%) |
Health Insurance Coverage by Citizenship Status in Riverland
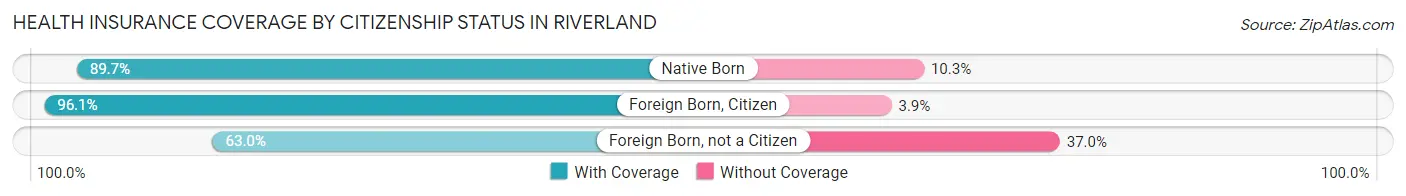
| Citizenship Status | With Coverage | Without Coverage |
| Native Born | 35 (89.7%) | 4 (10.3%) |
| Foreign Born, Citizen | 99 (96.1%) | 4 (3.9%) |
| Foreign Born, not a Citizen | 29 (63.0%) | 17 (37.0%) |
Health Insurance Coverage by Household Income in Riverland
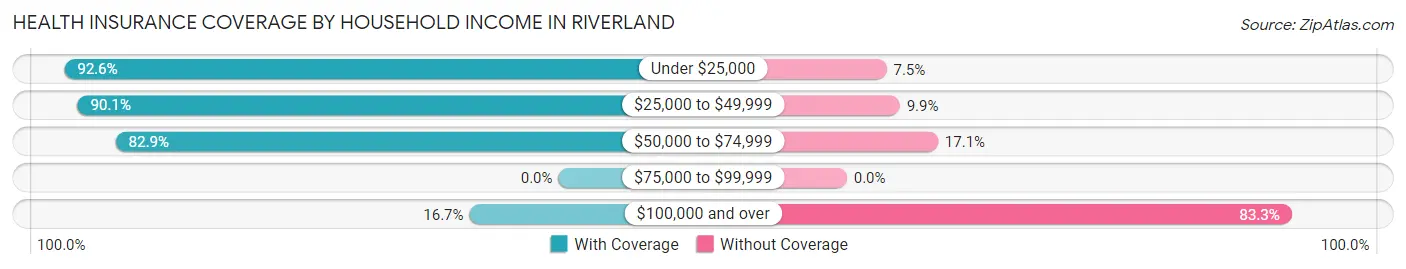
| Household Income | With Coverage | Without Coverage |
| Under $25,000 | 87 (92.5%) | 7 (7.4%) |
| $25,000 to $49,999 | 100 (90.1%) | 11 (9.9%) |
| $50,000 to $74,999 | 68 (82.9%) | 14 (17.1%) |
| $75,000 to $99,999 | 0 (0.0%) | 0 (0.0%) |
| $100,000 and over | 2 (16.7%) | 10 (83.3%) |
Public vs Private Health Insurance Coverage by Age in Riverland
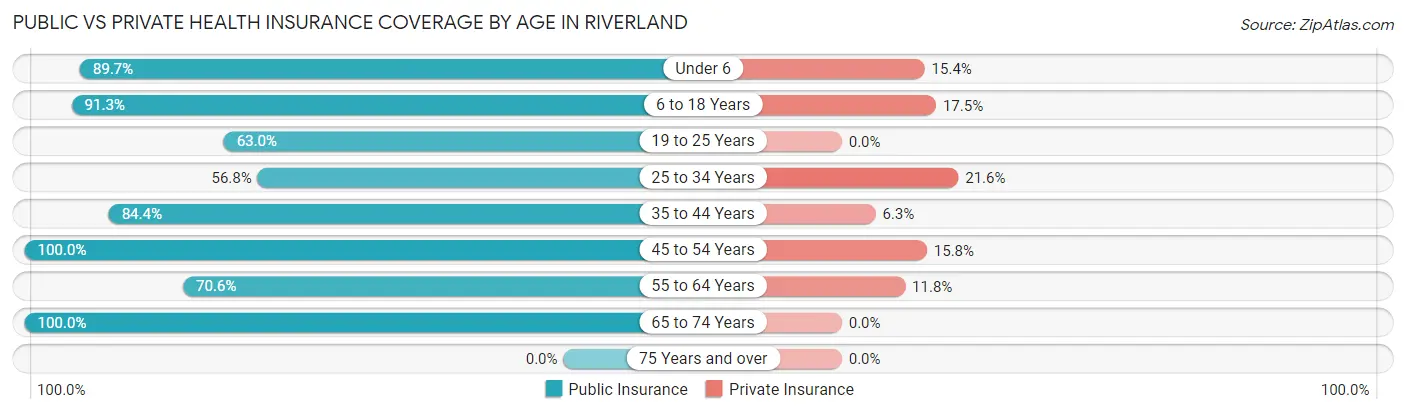
| Age Bracket | Public Insurance | Private Insurance |
| Under 6 | 35 (89.7%) | 6 (15.4%) |
| 6 to 18 Years | 94 (91.3%) | 18 (17.5%) |
| 19 to 25 Years | 29 (63.0%) | 0 (0.0%) |
| 25 to 34 Years | 21 (56.8%) | 8 (21.6%) |
| 35 to 44 Years | 27 (84.4%) | 2 (6.2%) |
| 45 to 54 Years | 19 (100.0%) | 3 (15.8%) |
| 55 to 64 Years | 12 (70.6%) | 2 (11.8%) |
| 65 to 74 Years | 6 (100.0%) | 0 (0.0%) |
| 75 Years and over | 0 (0.0%) | 0 (0.0%) |
| Total | 243 (81.3%) | 39 (13.0%) |
Disability Status by Sex by Age in Riverland
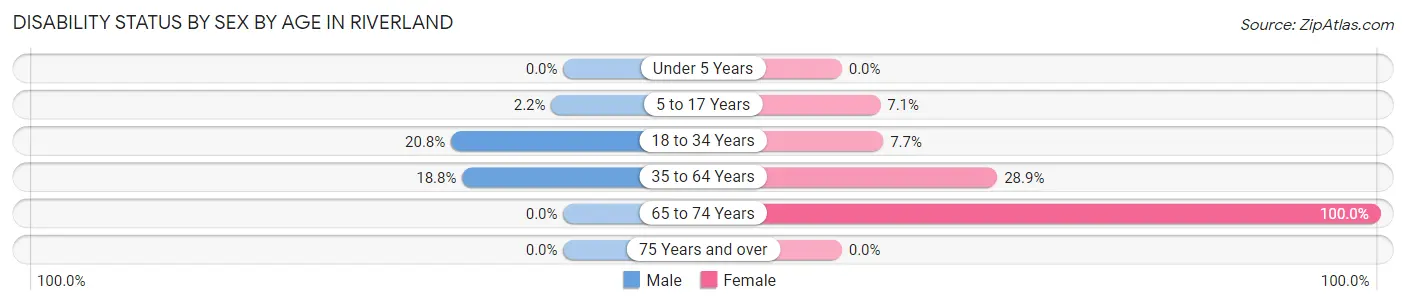
| Age Bracket | Male | Female |
| Under 5 Years | 0 (0.0%) | 0 (0.0%) |
| 5 to 17 Years | 1 (2.2%) | 4 (7.1%) |
| 18 to 34 Years | 10 (20.8%) | 3 (7.7%) |
| 35 to 64 Years | 3 (18.8%) | 15 (28.8%) |
| 65 to 74 Years | 0 (0.0%) | 6 (100.0%) |
| 75 Years and over | 0 (0.0%) | 0 (0.0%) |
Disability Class by Sex by Age in Riverland
Disability Class: Hearing Difficulty
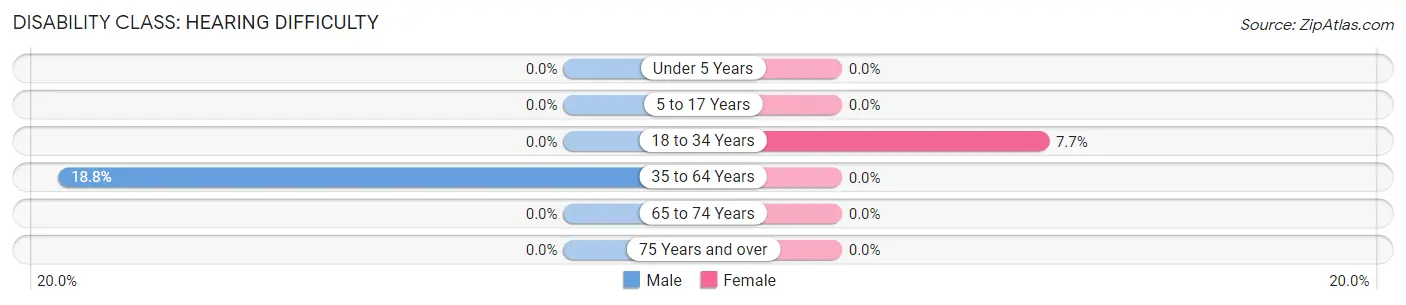
| Age Bracket | Male | Female |
| Under 5 Years | 0 (0.0%) | 0 (0.0%) |
| 5 to 17 Years | 0 (0.0%) | 0 (0.0%) |
| 18 to 34 Years | 0 (0.0%) | 3 (7.7%) |
| 35 to 64 Years | 3 (18.8%) | 0 (0.0%) |
| 65 to 74 Years | 0 (0.0%) | 0 (0.0%) |
| 75 Years and over | 0 (0.0%) | 0 (0.0%) |
Disability Class: Vision Difficulty
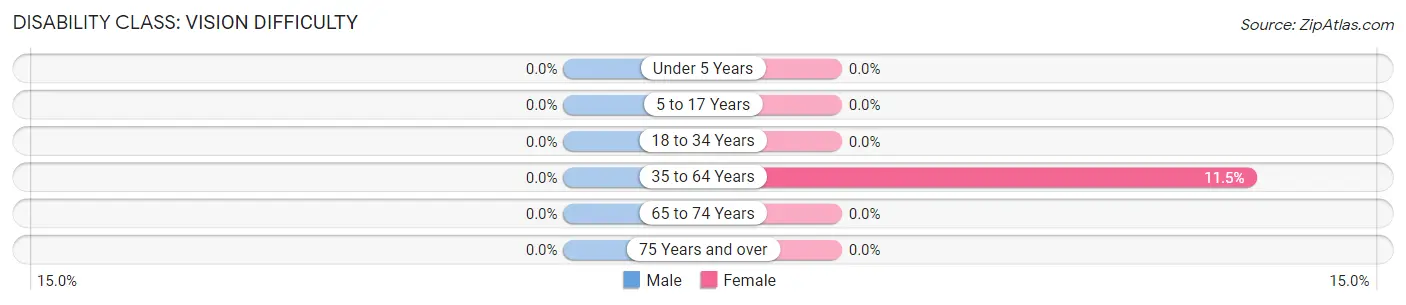
| Age Bracket | Male | Female |
| Under 5 Years | 0 (0.0%) | 0 (0.0%) |
| 5 to 17 Years | 0 (0.0%) | 0 (0.0%) |
| 18 to 34 Years | 0 (0.0%) | 0 (0.0%) |
| 35 to 64 Years | 0 (0.0%) | 6 (11.5%) |
| 65 to 74 Years | 0 (0.0%) | 0 (0.0%) |
| 75 Years and over | 0 (0.0%) | 0 (0.0%) |
Disability Class: Cognitive Difficulty
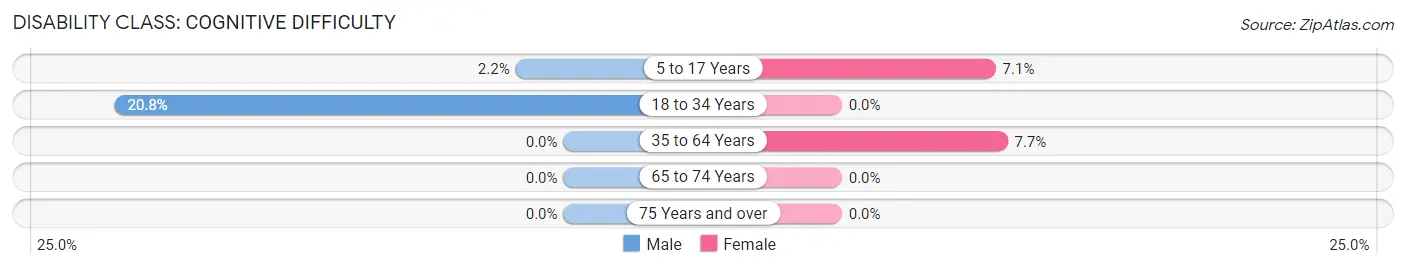
| Age Bracket | Male | Female |
| 5 to 17 Years | 1 (2.2%) | 4 (7.1%) |
| 18 to 34 Years | 10 (20.8%) | 0 (0.0%) |
| 35 to 64 Years | 0 (0.0%) | 4 (7.7%) |
| 65 to 74 Years | 0 (0.0%) | 0 (0.0%) |
| 75 Years and over | 0 (0.0%) | 0 (0.0%) |
Disability Class: Ambulatory Difficulty
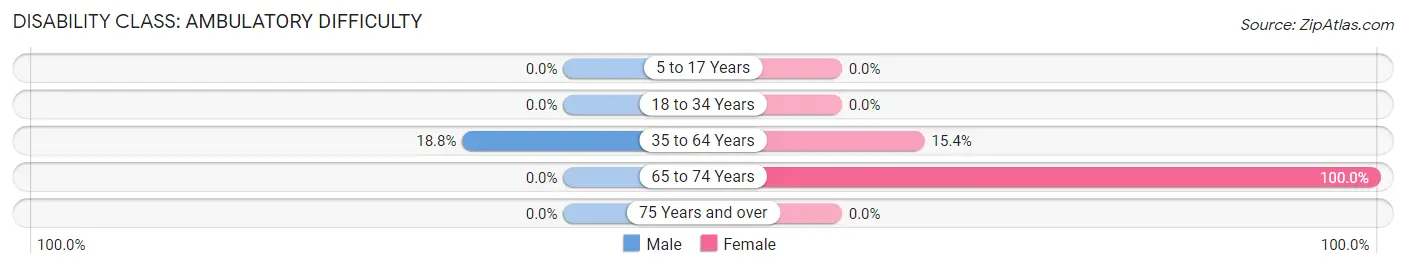
| Age Bracket | Male | Female |
| 5 to 17 Years | 0 (0.0%) | 0 (0.0%) |
| 18 to 34 Years | 0 (0.0%) | 0 (0.0%) |
| 35 to 64 Years | 3 (18.8%) | 8 (15.4%) |
| 65 to 74 Years | 0 (0.0%) | 6 (100.0%) |
| 75 Years and over | 0 (0.0%) | 0 (0.0%) |
Disability Class: Self-Care Difficulty
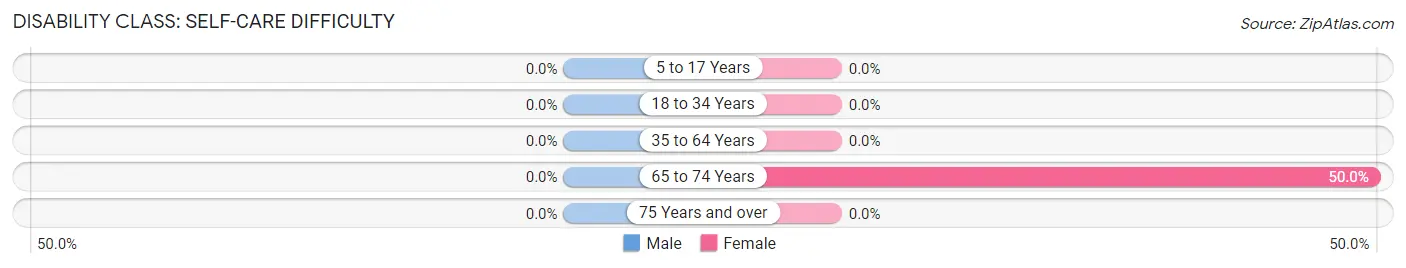
| Age Bracket | Male | Female |
| 5 to 17 Years | 0 (0.0%) | 0 (0.0%) |
| 18 to 34 Years | 0 (0.0%) | 0 (0.0%) |
| 35 to 64 Years | 0 (0.0%) | 0 (0.0%) |
| 65 to 74 Years | 0 (0.0%) | 3 (50.0%) |
| 75 Years and over | 0 (0.0%) | 0 (0.0%) |
Technology Access in Riverland
Computing Device Access in Riverland
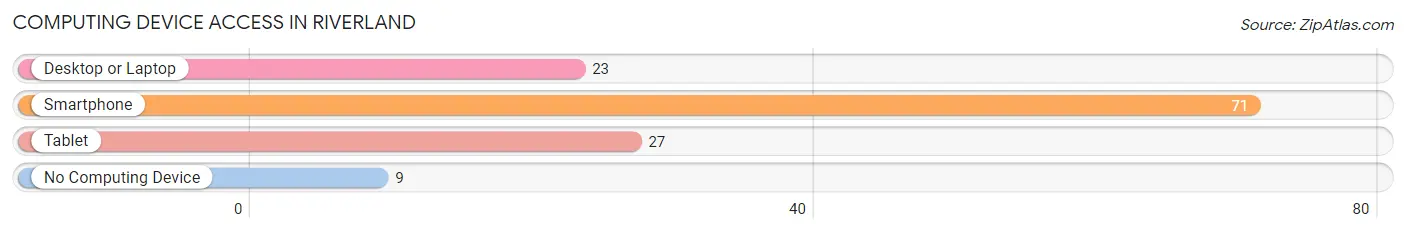
| Device Type | # Households | % Households |
| Desktop or Laptop | 23 | 28.7% |
| Smartphone | 71 | 88.7% |
| Tablet | 27 | 33.8% |
| No Computing Device | 9 | 11.3% |
| Total | 80 | 100.0% |
Internet Access in Riverland
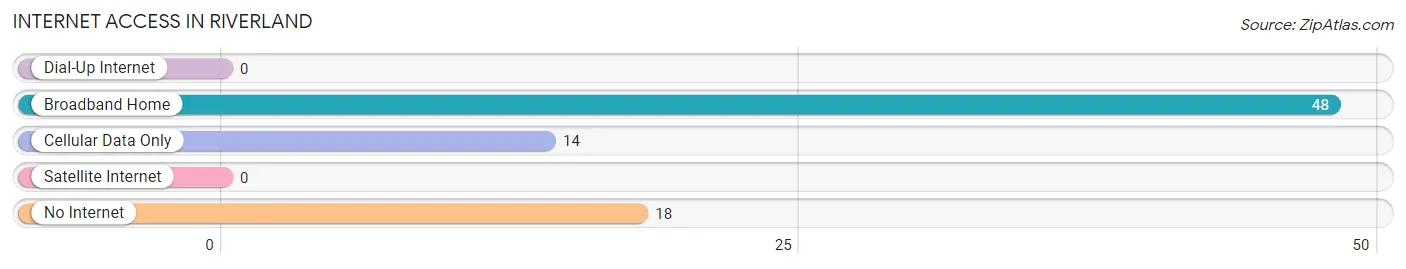
| Internet Type | # Households | % Households |
| Dial-Up Internet | 0 | 0.0% |
| Broadband Home | 48 | 60.0% |
| Cellular Data Only | 14 | 17.5% |
| Satellite Internet | 0 | 0.0% |
| No Internet | 18 | 22.5% |
| Total | 80 | 100.0% |
Riverland Summary
Riverland, Minnesota is a small city located in the southeastern corner of the state, just north of the Iowa border. It is part of the Albert Lea metropolitan area and is home to a population of just over 4,000 people. The city is situated on the banks of the Cedar River, which is a major tributary of the Mississippi River.
History
The area that is now Riverland was first settled in the early 1800s by a group of settlers from New England. The settlers were attracted to the area due to its fertile soil and abundant natural resources. The first permanent settlement was established in 1854 and was named Riverland. The town was named after the nearby Cedar River, which was an important transportation route for the settlers.
The town grew slowly but steadily over the next few decades, and by the turn of the century, it had become a thriving agricultural community. The town was also home to a number of small businesses, including a flour mill, a sawmill, and a brickyard.
In the early 1900s, the town began to experience a period of rapid growth. This was due in part to the construction of the Albert Lea and Southern Railroad, which connected Riverland to the larger cities of Albert Lea and Austin. The railroad also allowed for the shipment of goods and services to and from the town.
The town continued to grow throughout the 20th century, and by the year 2000, it had a population of just over 4,000 people.
Geography
Riverland is located in the southeastern corner of Minnesota, just north of the Iowa border. It is part of the Albert Lea metropolitan area and is situated on the banks of the Cedar River. The city is located at an elevation of 945 feet above sea level and has a total area of 2.2 square miles.
The city is located in a region of rolling hills and is surrounded by farmland. The climate in the area is generally mild, with hot summers and cold winters. The average annual temperature is around 50 degrees Fahrenheit.
Economy
The economy of Riverland is largely based on agriculture and manufacturing. The city is home to a number of small businesses, including a flour mill, a sawmill, and a brickyard. The city is also home to a number of manufacturing companies, including a plastics manufacturer and a metal fabrication company.
The city is also home to a number of retail stores, including a grocery store, a hardware store, and a variety of other shops. The city is also home to a number of restaurants and bars.
Demographics
As of the 2010 census, the population of Riverland was 4,072. The racial makeup of the city was 97.3% White, 0.7% African American, 0.3% Native American, 0.2% Asian, 0.1% Pacific Islander, and 1.4% from other races. The median household income in the city was $41,944, and the median family income was $50,917.
The city is home to a number of churches, including the Riverland United Methodist Church, the Riverland Lutheran Church, and the Riverland Baptist Church. The city is also home to a number of schools, including Riverland Elementary School, Riverland Middle School, and Riverland High School.
Common Questions
What is Per Capita Income in Riverland?
Per Capita income in Riverland is $9,386.
What is the Median Family Income in Riverland?
Median Family Income in Riverland is $28,542.
What is the Median Household income in Riverland?
Median Household Income in Riverland is $28,654.
What is Income or Wage Gap in Riverland?
Income or Wage Gap in Riverland is 20.9%.
Women in Riverland earn 79.1 cents for every dollar earned by a man.
What is Family Income Deficit in Riverland?
Family Income Deficit in Riverland is $13,692.
Families that are below poverty line in Riverland earn $13,692 less on average than the poverty threshold level.
What is Inequality or Gini Index in Riverland?
Inequality or Gini Index in Riverland is 0.44.
What is the Total Population of Riverland?
Total Population of Riverland is 299.
What is the Total Male Population of Riverland?
Total Male Population of Riverland is 128.
What is the Total Female Population of Riverland?
Total Female Population of Riverland is 171.
What is the Ratio of Males per 100 Females in Riverland?
There are 74.85 Males per 100 Females in Riverland.
What is the Ratio of Females per 100 Males in Riverland?
There are 133.59 Females per 100 Males in Riverland.
What is the Median Population Age in Riverland?
Median Population Age in Riverland is 19.7 Years.
What is the Average Family Size in Riverland
Average Family Size in Riverland is 3.8 People.
What is the Average Household Size in Riverland
Average Household Size in Riverland is 3.7 People.
How Large is the Labor Force in Riverland?
There are 101 People in the Labor Forcein in Riverland.
What is the Percentage of People in the Labor Force in Riverland?
57.7% of People are in the Labor Force in Riverland.
What is the Unemployment Rate in Riverland?
Unemployment Rate in Riverland is 27.7%.