Wheeler AFB, HI Map & Demographics
Wheeler AFB Map
Wheeler AFB Overview
$31,691
PER CAPITA INCOME
$77,500
AVG FAMILY INCOME
$74,844
AVG HOUSEHOLD INCOME
32.9%
WAGE / INCOME GAP [ % ]
67.1¢/ $1
WAGE / INCOME GAP [ $ ]
0.31
INEQUALITY / GINI INDEX
2,219
TOTAL POPULATION
1,262
MALE POPULATION
957
FEMALE POPULATION
131.87
MALES / 100 FEMALES
75.83
FEMALES / 100 MALES
24.6
MEDIAN AGE
2.7
AVG FAMILY SIZE
2.5
AVG HOUSEHOLD SIZE
1,325
LABOR FORCE [ PEOPLE ]
81.2%
PERCENT IN LABOR FORCE
8.6%
UNEMPLOYMENT RATE
Income in Wheeler AFB
Income Overview in Wheeler AFB
Per Capita Income in Wheeler AFB is $31,691, while median incomes of families and households are $77,500 and $74,844 respectively.
| Characteristic | Number | Measure |
| Per Capita Income | 2,219 | $31,691 |
| Median Family Income | 682 | $77,500 |
| Mean Family Income | 682 | $85,001 |
| Median Household Income | 808 | $74,844 |
| Mean Household Income | 808 | $82,588 |
| Income Deficit | 682 | $0 |
| Wage / Income Gap (%) | 2,219 | 32.94% |
| Wage / Income Gap ($) | 2,219 | 67.06¢ per $1 |
| Gini / Inequality Index | 2,219 | 0.31 |
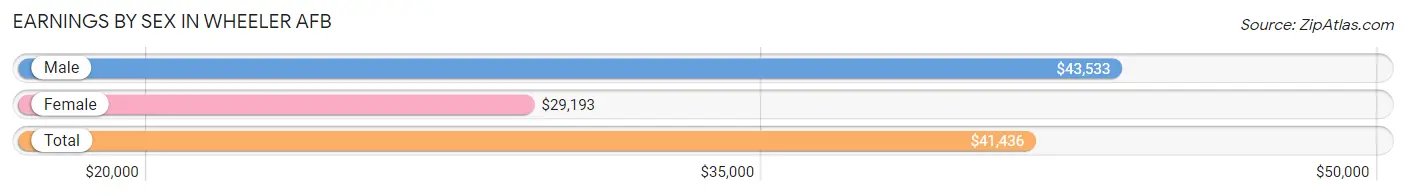
Earnings by Sex in Wheeler AFB
Average Earnings in Wheeler AFB are $41,436, $43,533 for men and $29,193 for women, a difference of 32.9%.
| Sex | Number | Average Earnings |
| Male | 982 (72.2%) | $43,533 |
| Female | 379 (27.9%) | $29,193 |
| Total | 1,361 (100.0%) | $41,436 |
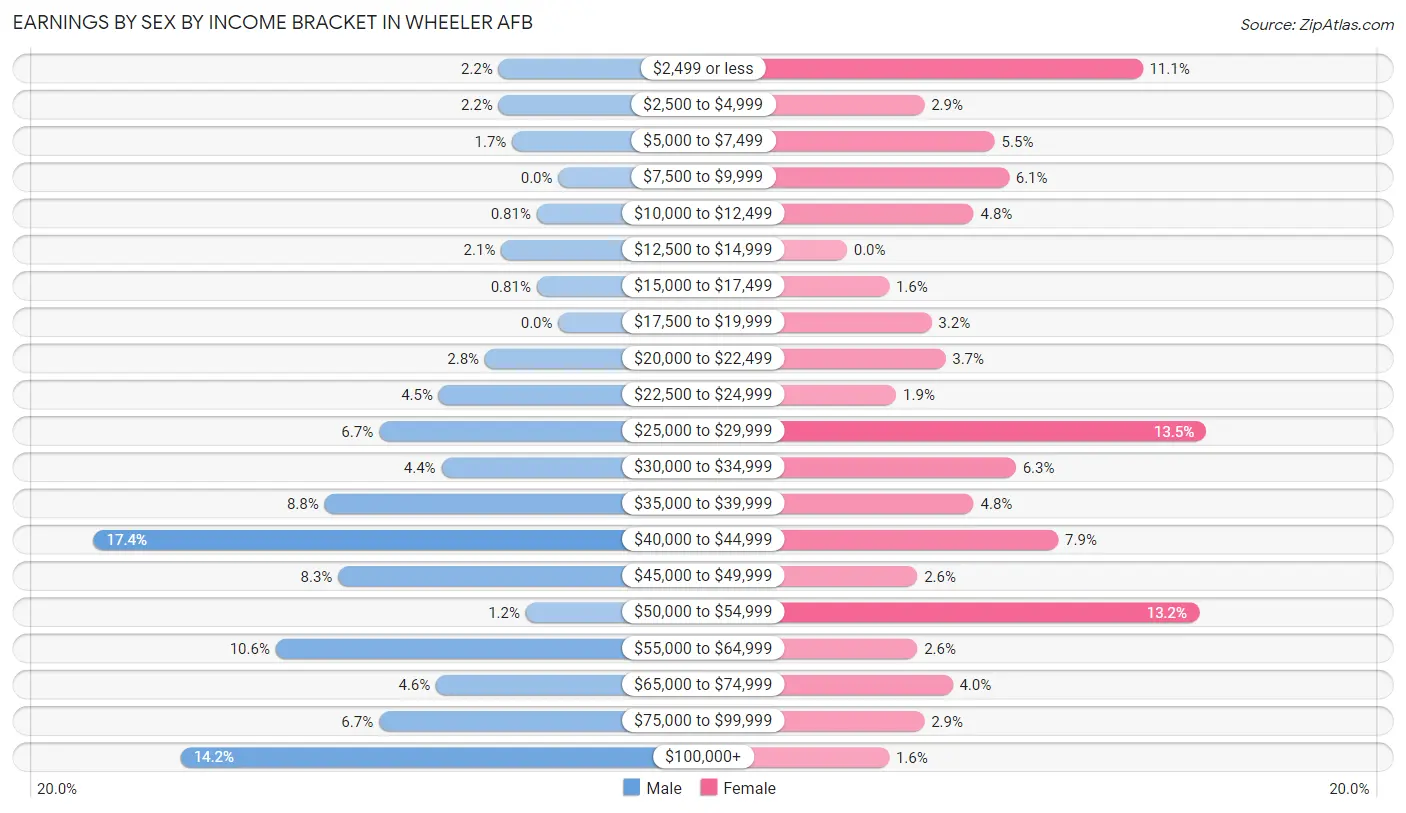
Earnings by Sex by Income Bracket in Wheeler AFB
The most common earnings brackets in Wheeler AFB are $40,000 to $44,999 for men (171 | 17.4%) and $25,000 to $29,999 for women (51 | 13.5%).
| Income | Male | Female |
| $2,499 or less | 22 (2.2%) | 42 (11.1%) |
| $2,500 to $4,999 | 22 (2.2%) | 11 (2.9%) |
| $5,000 to $7,499 | 17 (1.7%) | 21 (5.5%) |
| $7,500 to $9,999 | 0 (0.0%) | 23 (6.1%) |
| $10,000 to $12,499 | 8 (0.8%) | 18 (4.8%) |
| $12,500 to $14,999 | 21 (2.1%) | 0 (0.0%) |
| $15,000 to $17,499 | 8 (0.8%) | 6 (1.6%) |
| $17,500 to $19,999 | 0 (0.0%) | 12 (3.2%) |
| $20,000 to $22,499 | 27 (2.8%) | 14 (3.7%) |
| $22,500 to $24,999 | 44 (4.5%) | 7 (1.8%) |
| $25,000 to $29,999 | 66 (6.7%) | 51 (13.5%) |
| $30,000 to $34,999 | 43 (4.4%) | 24 (6.3%) |
| $35,000 to $39,999 | 86 (8.8%) | 18 (4.8%) |
| $40,000 to $44,999 | 171 (17.4%) | 30 (7.9%) |
| $45,000 to $49,999 | 81 (8.3%) | 10 (2.6%) |
| $50,000 to $54,999 | 12 (1.2%) | 50 (13.2%) |
| $55,000 to $64,999 | 104 (10.6%) | 10 (2.6%) |
| $65,000 to $74,999 | 45 (4.6%) | 15 (4.0%) |
| $75,000 to $99,999 | 66 (6.7%) | 11 (2.9%) |
| $100,000+ | 139 (14.1%) | 6 (1.6%) |
| Total | 982 (100.0%) | 379 (100.0%) |
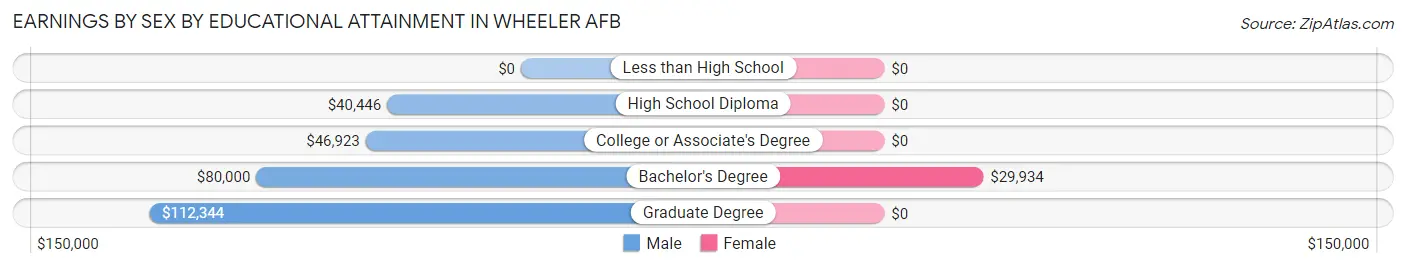
Earnings by Sex by Educational Attainment in Wheeler AFB
Average earnings in Wheeler AFB are $55,638 for men and $31,607 for women, a difference of 43.2%. Men with an educational attainment of graduate degree enjoy the highest average annual earnings of $112,344, while those with high school diploma education earn the least with $40,446. Women with an educational attainment of bachelor's degree earn the most with the average annual earnings of $29,934, while those with bachelor's degree education have the smallest earnings of $29,934.
| Educational Attainment | Male Income | Female Income |
| Less than High School | - | - |
| High School Diploma | $40,446 | $0 |
| College or Associate's Degree | $46,923 | $0 |
| Bachelor's Degree | $80,000 | $29,934 |
| Graduate Degree | $112,344 | $0 |
| Total | $55,638 | $31,607 |
Family Income in Wheeler AFB
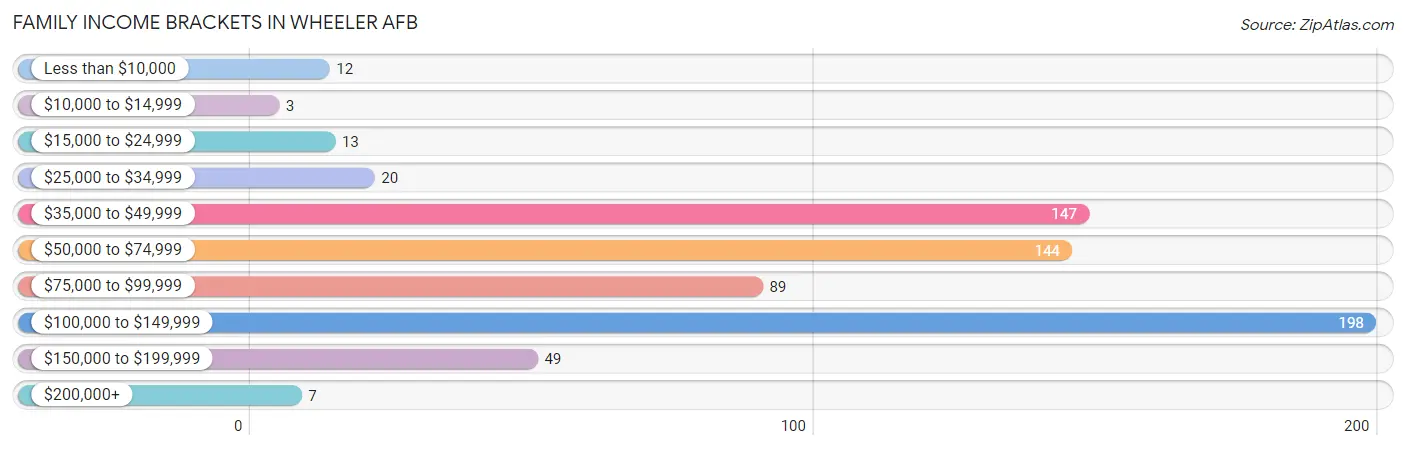
Family Income Brackets in Wheeler AFB
According to the Wheeler AFB family income data, there are 198 families falling into the $100,000 to $149,999 income range, which is the most common income bracket and makes up 29.0% of all families. Conversely, the $10,000 to $14,999 income bracket is the least frequent group with only 3 families (0.4%) belonging to this category.
| Income Bracket | # Families | % Families |
| Less than $10,000 | 12 | 1.8% |
| $10,000 to $14,999 | 3 | 0.4% |
| $15,000 to $24,999 | 13 | 1.9% |
| $25,000 to $34,999 | 20 | 2.9% |
| $35,000 to $49,999 | 147 | 21.6% |
| $50,000 to $74,999 | 144 | 21.1% |
| $75,000 to $99,999 | 89 | 13.0% |
| $100,000 to $149,999 | 198 | 29.0% |
| $150,000 to $199,999 | 49 | 7.2% |
| $200,000+ | 7 | 1.0% |
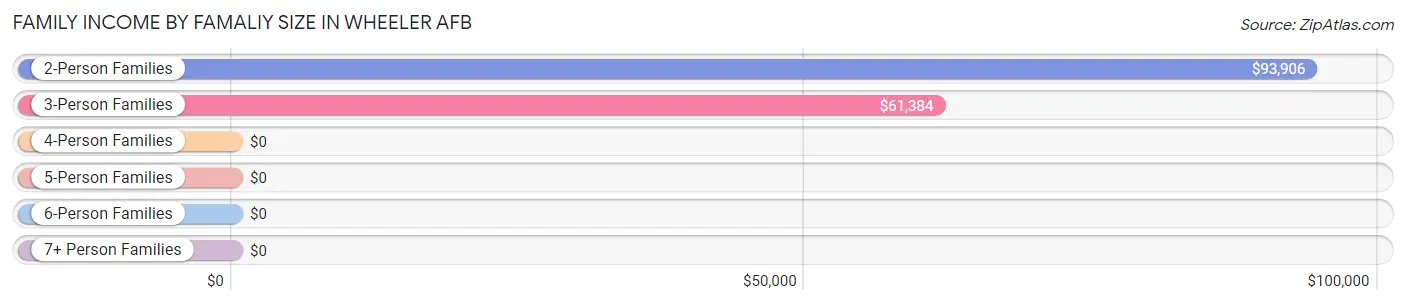
Family Income by Famaliy Size in Wheeler AFB
2-person families (371 | 54.4%) account for the highest median family income in Wheeler AFB with $93,906 per family, while 2-person families (371 | 54.4%) have the highest median income of $46,953 per family member.
| Income Bracket | # Families | Median Income |
| 2-Person Families | 371 (54.4%) | $93,906 |
| 3-Person Families | 149 (21.8%) | $61,384 |
| 4-Person Families | 101 (14.8%) | $0 |
| 5-Person Families | 53 (7.8%) | $0 |
| 6-Person Families | 8 (1.2%) | $0 |
| 7+ Person Families | 0 (0.0%) | $0 |
| Total | 682 (100.0%) | $77,500 |
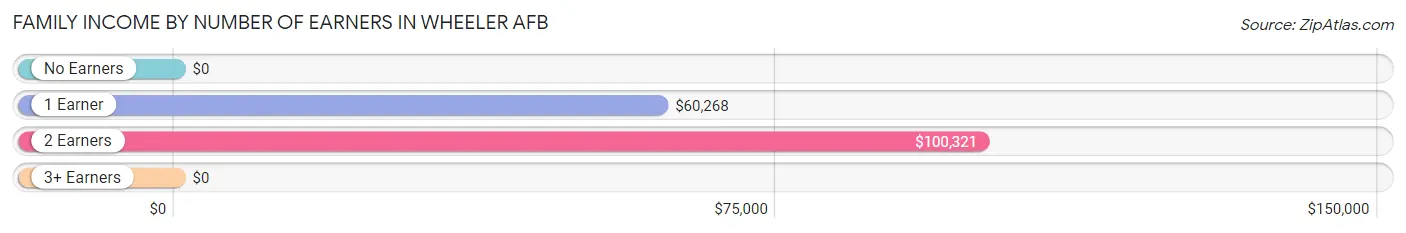
Family Income by Number of Earners in Wheeler AFB
| Number of Earners | # Families | Median Income |
| No Earners | 7 (1.0%) | $0 |
| 1 Earner | 304 (44.6%) | $60,268 |
| 2 Earners | 368 (54.0%) | $100,321 |
| 3+ Earners | 3 (0.4%) | $0 |
| Total | 682 (100.0%) | $77,500 |
Household Income in Wheeler AFB
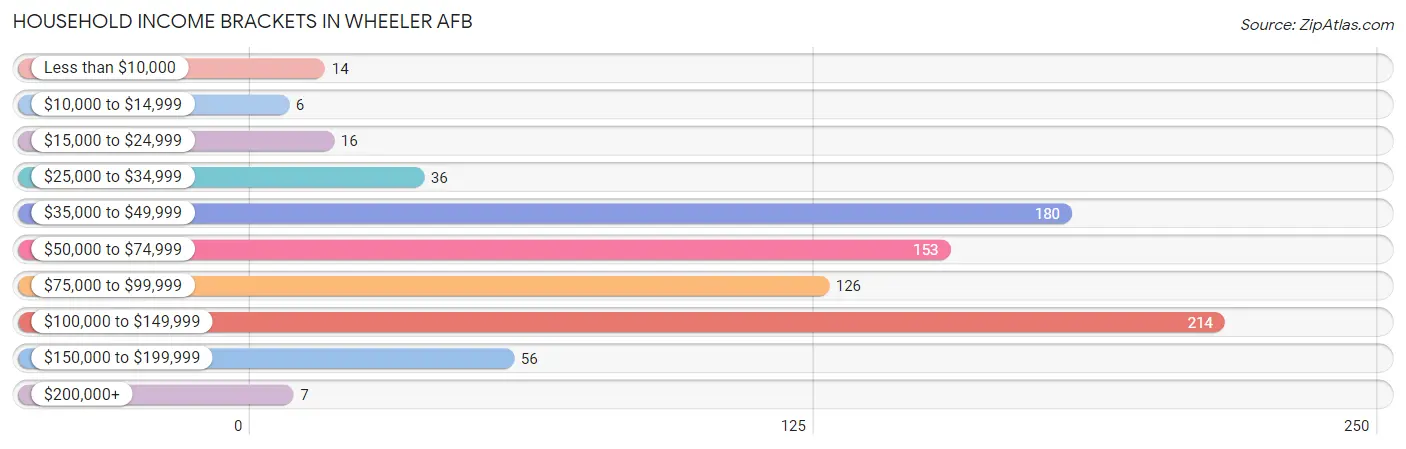
Household Income Brackets in Wheeler AFB
With 214 households falling in the category, the $100,000 to $149,999 income range is the most frequent in Wheeler AFB, accounting for 26.5% of all households. In contrast, only 6 households (0.7%) fall into the $10,000 to $14,999 income bracket, making it the least populous group.
| Income Bracket | # Households | % Households |
| Less than $10,000 | 14 | 1.7% |
| $10,000 to $14,999 | 6 | 0.7% |
| $15,000 to $24,999 | 16 | 2.0% |
| $25,000 to $34,999 | 36 | 4.5% |
| $35,000 to $49,999 | 180 | 22.3% |
| $50,000 to $74,999 | 153 | 18.9% |
| $75,000 to $99,999 | 126 | 15.6% |
| $100,000 to $149,999 | 214 | 26.5% |
| $150,000 to $199,999 | 56 | 6.9% |
| $200,000+ | 7 | 0.9% |
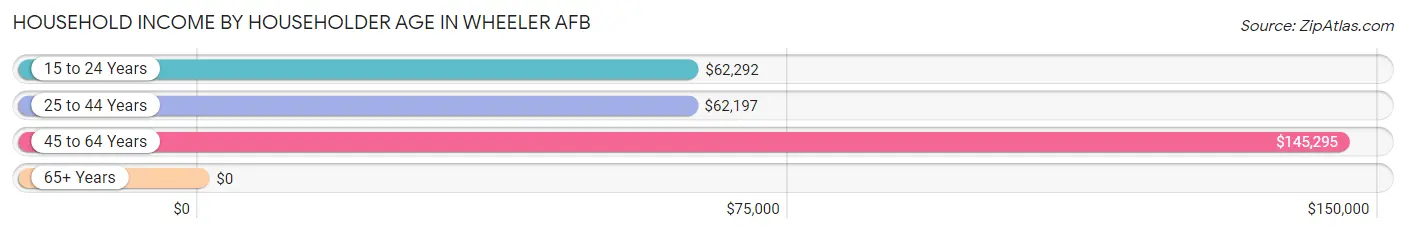
Household Income by Householder Age in Wheeler AFB
The median household income in Wheeler AFB is $74,844, with the highest median household income of $145,295 found in the 45 to 64 years age bracket for the primary householder. A total of 141 households (17.4%) fall into this category. Meanwhile, the 65+ years age bracket for the primary householder has the lowest median household income of $0, with 5 households (0.6%) in this group.
| Income Bracket | # Households | Median Income |
| 15 to 24 Years | 222 (27.5%) | $62,292 |
| 25 to 44 Years | 440 (54.5%) | $62,197 |
| 45 to 64 Years | 141 (17.4%) | $145,295 |
| 65+ Years | 5 (0.6%) | $0 |
| Total | 808 (100.0%) | $74,844 |
Poverty in Wheeler AFB
Income Below Poverty by Sex and Age in Wheeler AFB
With 3.3% poverty level for males and 6.7% for females among the residents of Wheeler AFB, 15 year old males and 75 year old and over females are the most vulnerable to poverty, with 7 males (41.2%) and 7 females (100.0%) in their respective age groups living below the poverty level.
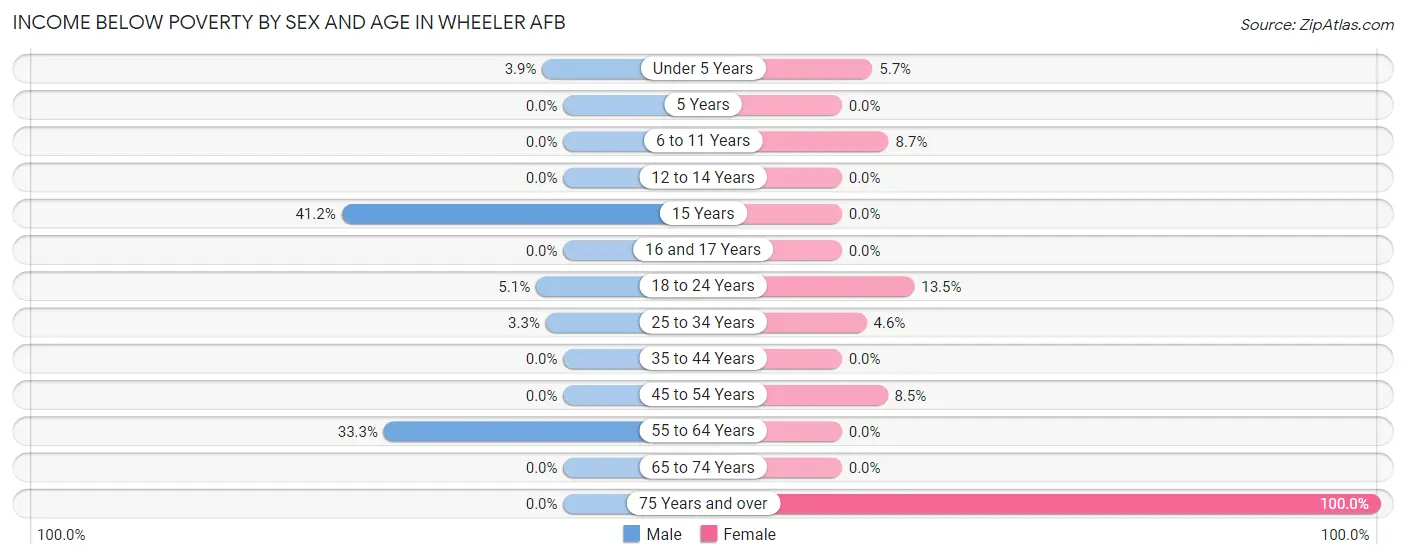
| Age Bracket | Male | Female |
| Under 5 Years | 5 (3.9%) | 8 (5.7%) |
| 5 Years | 0 (0.0%) | 0 (0.0%) |
| 6 to 11 Years | 0 (0.0%) | 10 (8.7%) |
| 12 to 14 Years | 0 (0.0%) | 0 (0.0%) |
| 15 Years | 7 (41.2%) | 0 (0.0%) |
| 16 and 17 Years | 0 (0.0%) | 0 (0.0%) |
| 18 to 24 Years | 12 (5.1%) | 21 (13.5%) |
| 25 to 34 Years | 10 (3.3%) | 11 (4.6%) |
| 35 to 44 Years | 0 (0.0%) | 0 (0.0%) |
| 45 to 54 Years | 0 (0.0%) | 5 (8.5%) |
| 55 to 64 Years | 2 (33.3%) | 0 (0.0%) |
| 65 to 74 Years | 0 (0.0%) | 0 (0.0%) |
| 75 Years and over | 0 (0.0%) | 7 (100.0%) |
| Total | 36 (3.3%) | 62 (6.7%) |
Income Above Poverty by Sex and Age in Wheeler AFB
According to the poverty statistics in Wheeler AFB, males aged 5 years and females aged 5 years are the age groups that are most secure financially, with 100.0% of males and 100.0% of females in these age groups living above the poverty line.
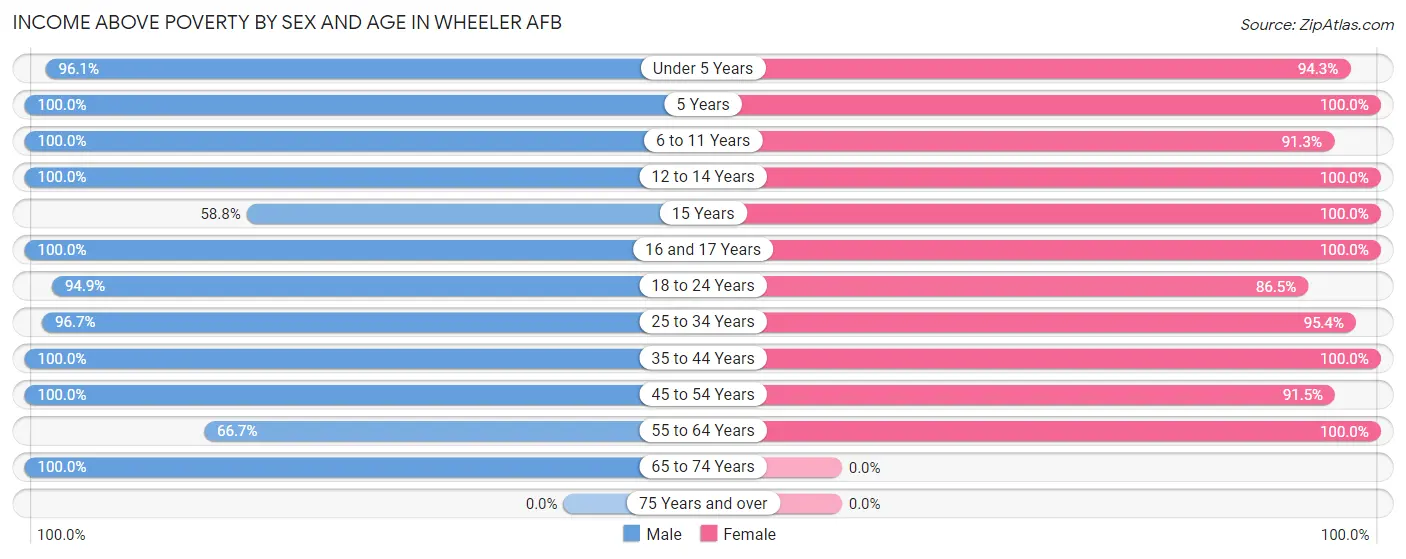
| Age Bracket | Male | Female |
| Under 5 Years | 123 (96.1%) | 133 (94.3%) |
| 5 Years | 15 (100.0%) | 45 (100.0%) |
| 6 to 11 Years | 61 (100.0%) | 105 (91.3%) |
| 12 to 14 Years | 13 (100.0%) | 42 (100.0%) |
| 15 Years | 10 (58.8%) | 10 (100.0%) |
| 16 and 17 Years | 20 (100.0%) | 9 (100.0%) |
| 18 to 24 Years | 224 (94.9%) | 135 (86.5%) |
| 25 to 34 Years | 296 (96.7%) | 228 (95.4%) |
| 35 to 44 Years | 113 (100.0%) | 93 (100.0%) |
| 45 to 54 Years | 178 (100.0%) | 54 (91.5%) |
| 55 to 64 Years | 4 (66.7%) | 5 (100.0%) |
| 65 to 74 Years | 5 (100.0%) | 0 (0.0%) |
| 75 Years and over | 0 (0.0%) | 0 (0.0%) |
| Total | 1,062 (96.7%) | 859 (93.3%) |
Income Below Poverty Among Married-Couple Families in Wheeler AFB
The poverty statistics for married-couple families in Wheeler AFB show that 2.6% or 16 of the total 621 families live below the poverty line. Families with 1 or 2 children have the highest poverty rate of 3.7%, comprising of 9 families. On the other hand, families with 3 or 4 children have the lowest poverty rate of 0.0%, which includes 0 families.
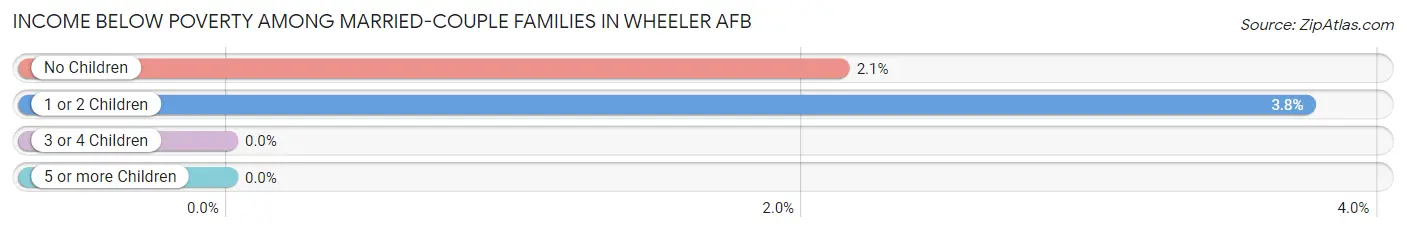
| Children | Above Poverty | Below Poverty |
| No Children | 321 (97.9%) | 7 (2.1%) |
| 1 or 2 Children | 231 (96.3%) | 9 (3.7%) |
| 3 or 4 Children | 53 (100.0%) | 0 (0.0%) |
| 5 or more Children | 0 (0.0%) | 0 (0.0%) |
| Total | 605 (97.4%) | 16 (2.6%) |
Income Below Poverty Among Single-Parent Households in Wheeler AFB
According to the poverty data in Wheeler AFB, 33.3% or 2 single-father households and 18.2% or 10 single-mother households are living below the poverty line. Among single-father households, those with no children have the highest poverty rate, with 2 households (33.3%) experiencing poverty. Likewise, among single-mother households, those with 3 or 4 children have the highest poverty rate, with 5 households (100.0%) falling below the poverty line.
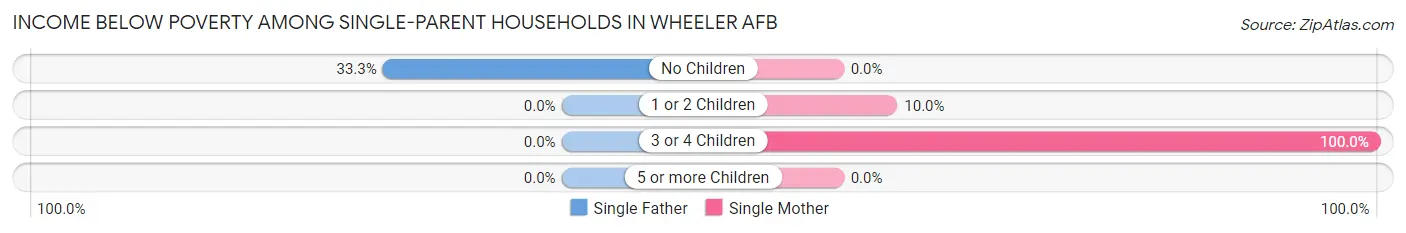
| Children | Single Father | Single Mother |
| No Children | 2 (33.3%) | 0 (0.0%) |
| 1 or 2 Children | 0 (0.0%) | 5 (10.0%) |
| 3 or 4 Children | 0 (0.0%) | 5 (100.0%) |
| 5 or more Children | 0 (0.0%) | 0 (0.0%) |
| Total | 2 (33.3%) | 10 (18.2%) |
Income Below Poverty Among Married-Couple vs Single-Parent Households in Wheeler AFB
The poverty data for Wheeler AFB shows that 16 of the married-couple family households (2.6%) and 12 of the single-parent households (19.7%) are living below the poverty level. Within the married-couple family households, those with 1 or 2 children have the highest poverty rate, with 9 households (3.7%) falling below the poverty line. Among the single-parent households, those with 3 or 4 children have the highest poverty rate, with 5 household (100.0%) living below poverty.
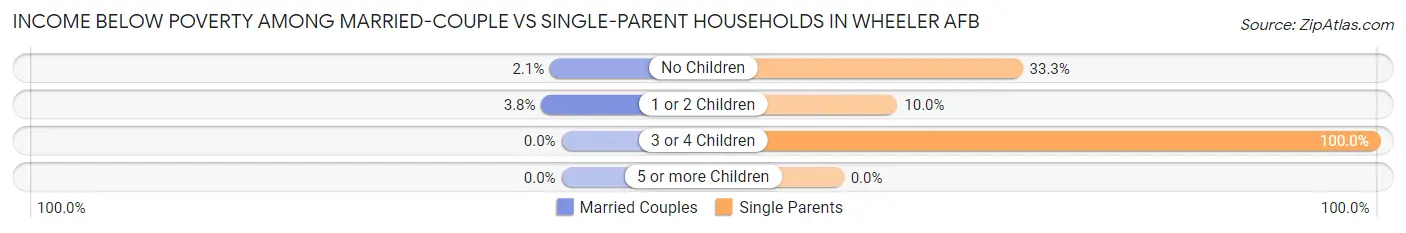
| Children | Married-Couple Families | Single-Parent Households |
| No Children | 7 (2.1%) | 2 (33.3%) |
| 1 or 2 Children | 9 (3.7%) | 5 (10.0%) |
| 3 or 4 Children | 0 (0.0%) | 5 (100.0%) |
| 5 or more Children | 0 (0.0%) | 0 (0.0%) |
| Total | 16 (2.6%) | 12 (19.7%) |
Race in Wheeler AFB
The most populous races in Wheeler AFB are White / Caucasian (1,235 | 55.7%), Hispanic or Latino (563 | 25.4%), and Two or more Races (443 | 20.0%).
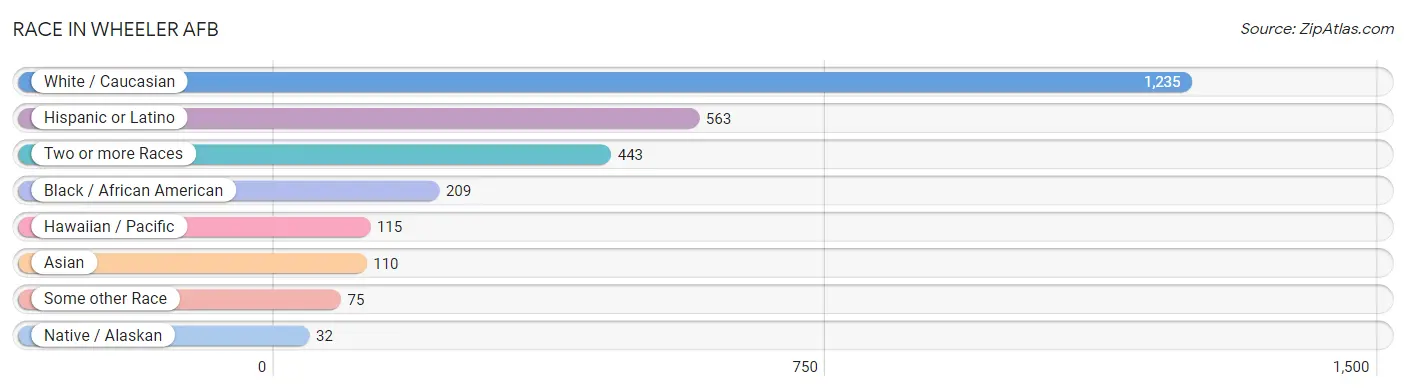
| Race | # Population | % Population |
| Asian | 110 | 5.0% |
| Black / African American | 209 | 9.4% |
| Hawaiian / Pacific | 115 | 5.2% |
| Hispanic or Latino | 563 | 25.4% |
| Native / Alaskan | 32 | 1.4% |
| White / Caucasian | 1,235 | 55.7% |
| Two or more Races | 443 | 20.0% |
| Some other Race | 75 | 3.4% |
| Total | 2,219 | 100.0% |
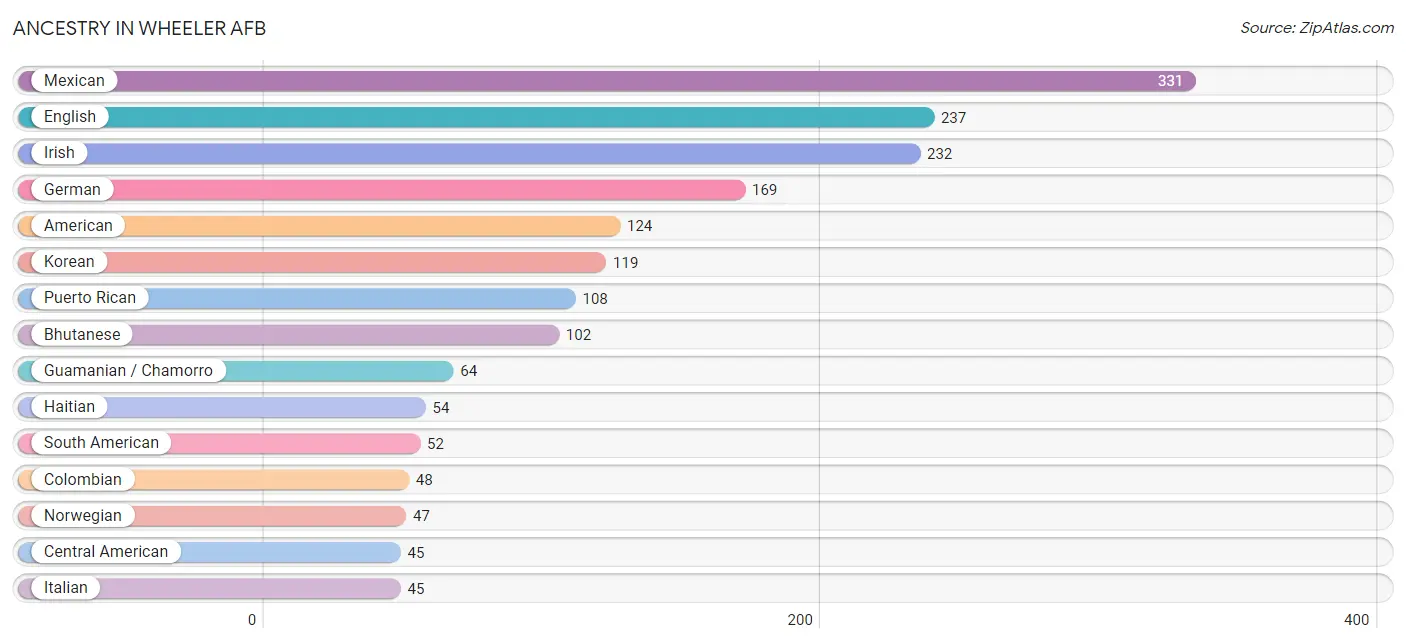
Ancestry in Wheeler AFB
The most populous ancestries reported in Wheeler AFB are Mexican (331 | 14.9%), English (237 | 10.7%), Irish (232 | 10.5%), German (169 | 7.6%), and American (124 | 5.6%), together accounting for 49.3% of all Wheeler AFB residents.
| Ancestry | # Population | % Population |
| African | 23 | 1.0% |
| American | 124 | 5.6% |
| Argentinean | 4 | 0.2% |
| Bangladeshi | 5 | 0.2% |
| Bhutanese | 102 | 4.6% |
| Brazilian | 3 | 0.1% |
| British | 26 | 1.2% |
| Burmese | 9 | 0.4% |
| Celtic | 13 | 0.6% |
| Central American | 45 | 2.0% |
| Choctaw | 4 | 0.2% |
| Colombian | 48 | 2.2% |
| Czech | 10 | 0.4% |
| Dutch | 34 | 1.5% |
| English | 237 | 10.7% |
| European | 20 | 0.9% |
| Finnish | 3 | 0.1% |
| French | 19 | 0.9% |
| French Canadian | 9 | 0.4% |
| German | 169 | 7.6% |
| Guamanian / Chamorro | 64 | 2.9% |
| Guatemalan | 9 | 0.4% |
| Haitian | 54 | 2.4% |
| Honduran | 10 | 0.4% |
| Hopi | 14 | 0.6% |
| Indian (Asian) | 4 | 0.2% |
| Irish | 232 | 10.5% |
| Italian | 45 | 2.0% |
| Korean | 119 | 5.4% |
| Mexican | 331 | 14.9% |
| Mexican American Indian | 12 | 0.5% |
| Native Hawaiian | 42 | 1.9% |
| Navajo | 21 | 0.9% |
| Northern European | 3 | 0.1% |
| Norwegian | 47 | 2.1% |
| Panamanian | 4 | 0.2% |
| Polish | 12 | 0.5% |
| Portuguese | 6 | 0.3% |
| Pueblo | 4 | 0.2% |
| Puerto Rican | 108 | 4.9% |
| Salvadoran | 17 | 0.8% |
| Samoan | 14 | 0.6% |
| Scandinavian | 21 | 0.9% |
| Scotch-Irish | 10 | 0.4% |
| Scottish | 10 | 0.4% |
| South American | 52 | 2.3% |
| Spaniard | 20 | 0.9% |
| Spanish | 7 | 0.3% |
| Sri Lankan | 16 | 0.7% |
| Subsaharan African | 23 | 1.0% |
| Swedish | 21 | 0.9% |
| Swiss | 11 | 0.5% |
| Ukrainian | 4 | 0.2% | View All 53 Rows |
Immigrants in Wheeler AFB
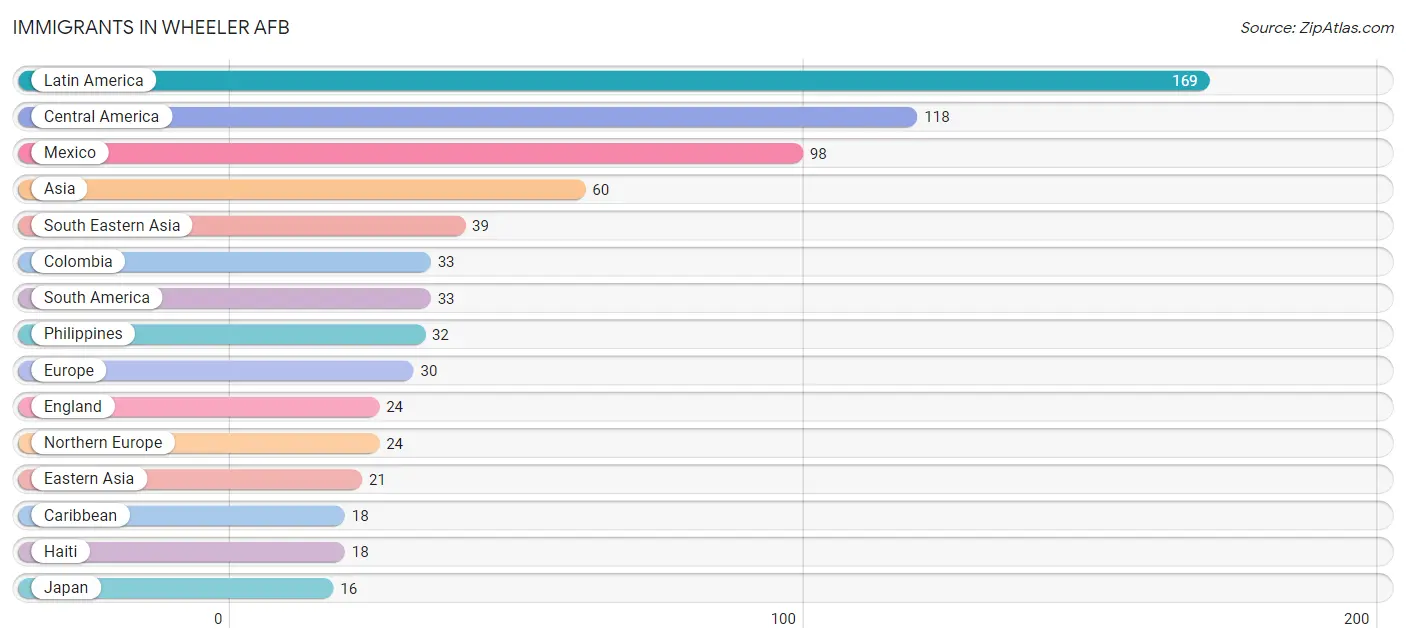
The most numerous immigrant groups reported in Wheeler AFB came from Latin America (169 | 7.6%), Central America (118 | 5.3%), Mexico (98 | 4.4%), Asia (60 | 2.7%), and South Eastern Asia (39 | 1.8%), together accounting for 21.8% of all Wheeler AFB residents.
| Immigration Origin | # Population | % Population |
| Africa | 6 | 0.3% |
| Asia | 60 | 2.7% |
| Belize | 14 | 0.6% |
| Canada | 8 | 0.4% |
| Caribbean | 18 | 0.8% |
| Central America | 118 | 5.3% |
| Colombia | 33 | 1.5% |
| Eastern Asia | 21 | 0.9% |
| Eastern Europe | 6 | 0.3% |
| England | 24 | 1.1% |
| Europe | 30 | 1.3% |
| Guatemala | 6 | 0.3% |
| Haiti | 18 | 0.8% |
| Japan | 16 | 0.7% |
| Korea | 5 | 0.2% |
| Latin America | 169 | 7.6% |
| Mexico | 98 | 4.4% |
| Micronesia | 12 | 0.5% |
| Northern Europe | 24 | 1.1% |
| Oceania | 12 | 0.5% |
| Philippines | 32 | 1.4% |
| South America | 33 | 1.5% |
| South Eastern Asia | 39 | 1.8% |
| Thailand | 5 | 0.2% |
| Ukraine | 6 | 0.3% |
| Vietnam | 2 | 0.1% |
| Western Africa | 6 | 0.3% | View All 27 Rows |
Sex and Age in Wheeler AFB
Sex and Age in Wheeler AFB
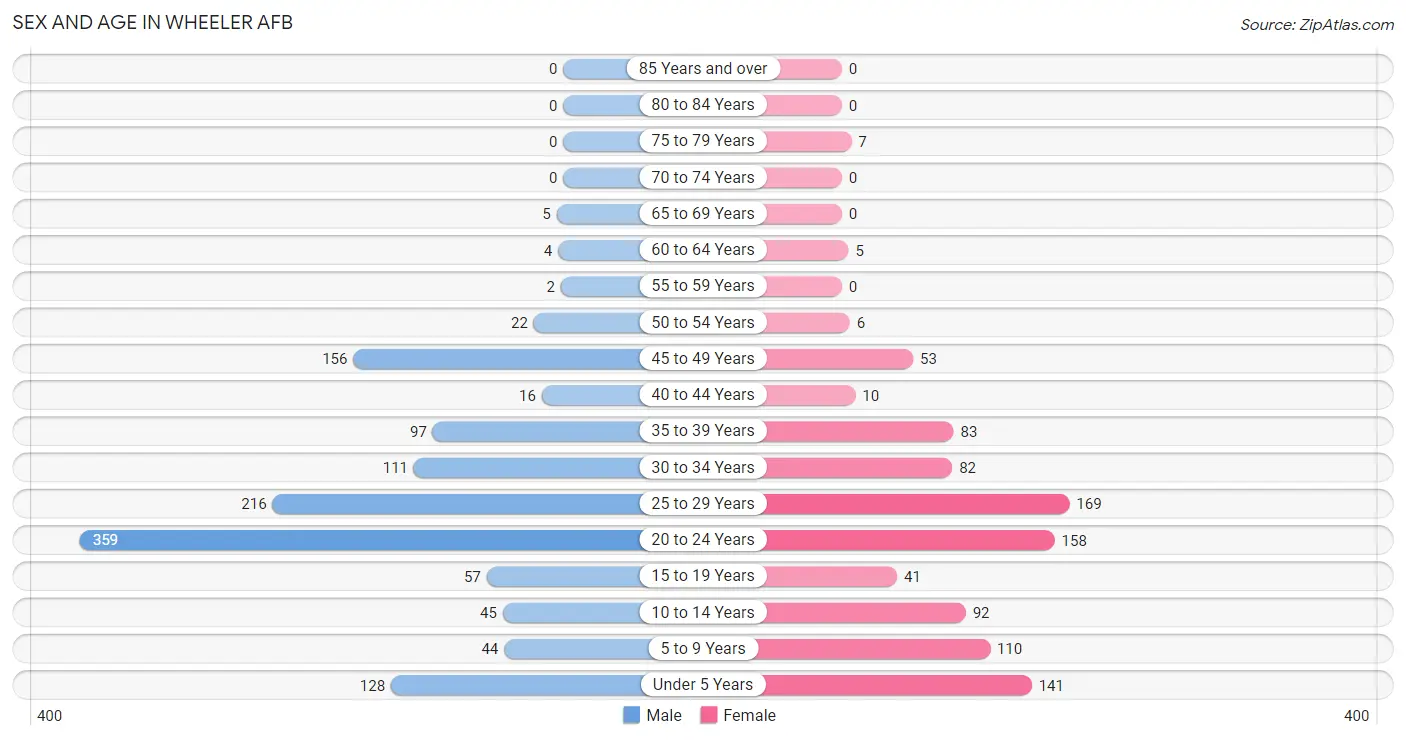
The most populous age groups in Wheeler AFB are 20 to 24 Years (359 | 28.4%) for men and 25 to 29 Years (169 | 17.7%) for women.
| Age Bracket | Male | Female |
| Under 5 Years | 128 (10.1%) | 141 (14.7%) |
| 5 to 9 Years | 44 (3.5%) | 110 (11.5%) |
| 10 to 14 Years | 45 (3.6%) | 92 (9.6%) |
| 15 to 19 Years | 57 (4.5%) | 41 (4.3%) |
| 20 to 24 Years | 359 (28.4%) | 158 (16.5%) |
| 25 to 29 Years | 216 (17.1%) | 169 (17.7%) |
| 30 to 34 Years | 111 (8.8%) | 82 (8.6%) |
| 35 to 39 Years | 97 (7.7%) | 83 (8.7%) |
| 40 to 44 Years | 16 (1.3%) | 10 (1.0%) |
| 45 to 49 Years | 156 (12.4%) | 53 (5.5%) |
| 50 to 54 Years | 22 (1.7%) | 6 (0.6%) |
| 55 to 59 Years | 2 (0.2%) | 0 (0.0%) |
| 60 to 64 Years | 4 (0.3%) | 5 (0.5%) |
| 65 to 69 Years | 5 (0.4%) | 0 (0.0%) |
| 70 to 74 Years | 0 (0.0%) | 0 (0.0%) |
| 75 to 79 Years | 0 (0.0%) | 7 (0.7%) |
| 80 to 84 Years | 0 (0.0%) | 0 (0.0%) |
| 85 Years and over | 0 (0.0%) | 0 (0.0%) |
| Total | 1,262 (100.0%) | 957 (100.0%) |
Families and Households in Wheeler AFB
Median Family Size in Wheeler AFB
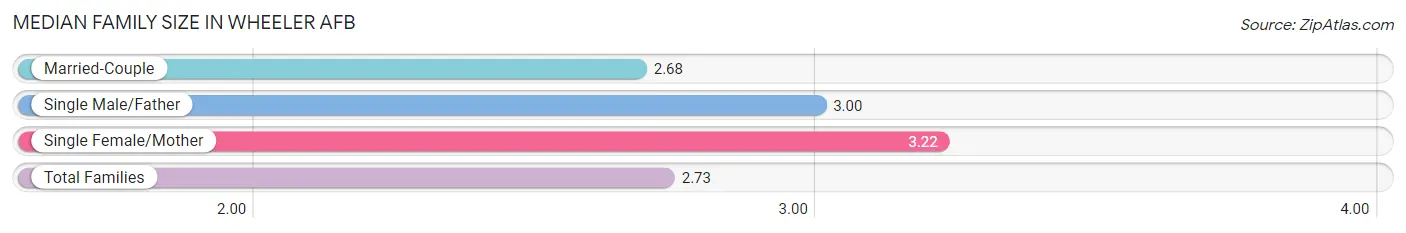
The median family size in Wheeler AFB is 2.73 persons per family, with single female/mother families (55 | 8.1%) accounting for the largest median family size of 3.22 persons per family. On the other hand, married-couple families (621 | 91.1%) represent the smallest median family size with 2.68 persons per family.
| Family Type | # Families | Family Size |
| Married-Couple | 621 (91.1%) | 2.68 |
| Single Male/Father | 6 (0.9%) | 3.00 |
| Single Female/Mother | 55 (8.1%) | 3.22 |
| Total Families | 682 (100.0%) | 2.73 |
Median Household Size in Wheeler AFB
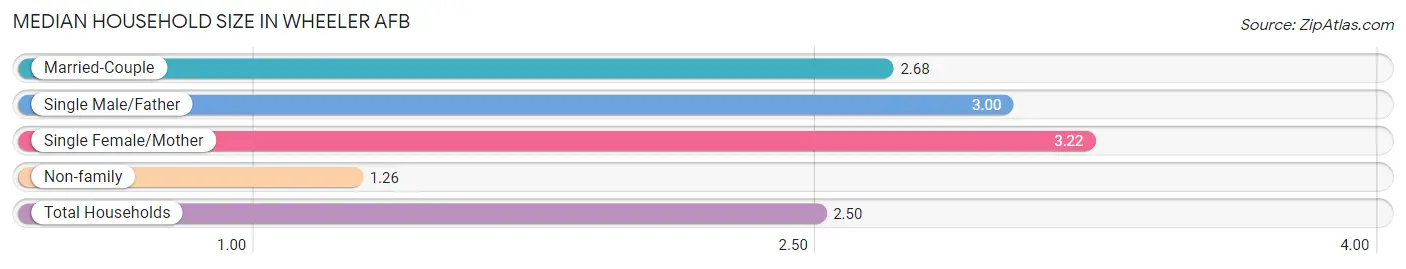
The median household size in Wheeler AFB is 2.50 persons per household, with single female/mother households (55 | 6.8%) accounting for the largest median household size of 3.22 persons per household. non-family households (126 | 15.6%) represent the smallest median household size with 1.26 persons per household.
| Household Type | # Households | Household Size |
| Married-Couple | 621 (76.9%) | 2.68 |
| Single Male/Father | 6 (0.7%) | 3.00 |
| Single Female/Mother | 55 (6.8%) | 3.22 |
| Non-family | 126 (15.6%) | 1.26 |
| Total Households | 808 (100.0%) | 2.50 |
Household Size by Marriage Status in Wheeler AFB
Out of a total of 808 households in Wheeler AFB, 682 (84.4%) are family households, while 126 (15.6%) are nonfamily households. The most numerous type of family households are 2-person households, comprising 371, and the most common type of nonfamily households are 1-person households, comprising 96.
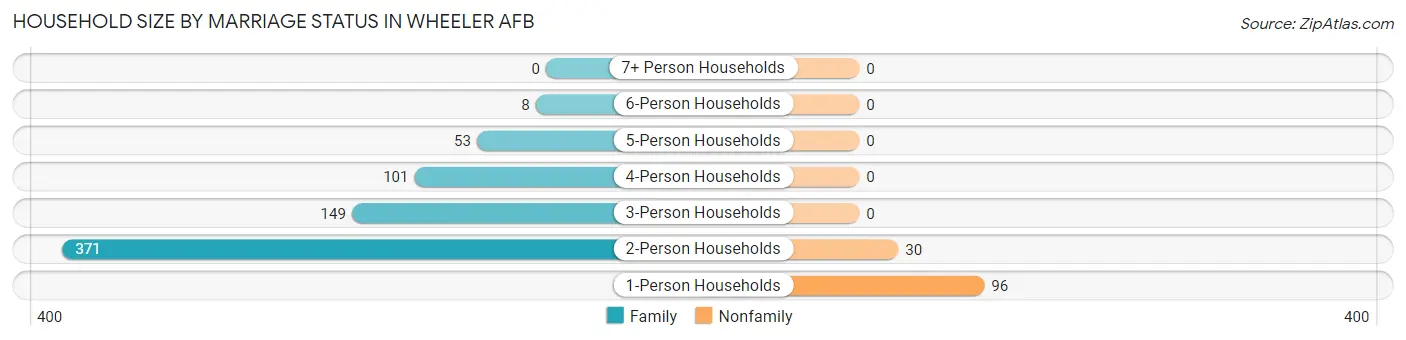
| Household Size | Family Households | Nonfamily Households |
| 1-Person Households | - | 96 (11.9%) |
| 2-Person Households | 371 (45.9%) | 30 (3.7%) |
| 3-Person Households | 149 (18.4%) | 0 (0.0%) |
| 4-Person Households | 101 (12.5%) | 0 (0.0%) |
| 5-Person Households | 53 (6.6%) | 0 (0.0%) |
| 6-Person Households | 8 (1.0%) | 0 (0.0%) |
| 7+ Person Households | 0 (0.0%) | 0 (0.0%) |
| Total | 682 (84.4%) | 126 (15.6%) |
Female Fertility in Wheeler AFB
Fertility by Age in Wheeler AFB
Average fertility rate in Wheeler AFB is 82.0 births per 1,000 women. Women in the age bracket of 20 to 34 years have the highest fertility rate with 120.0 births per 1,000 women. Women in the age bracket of 20 to 34 years acount for 100.0% of all women with births.
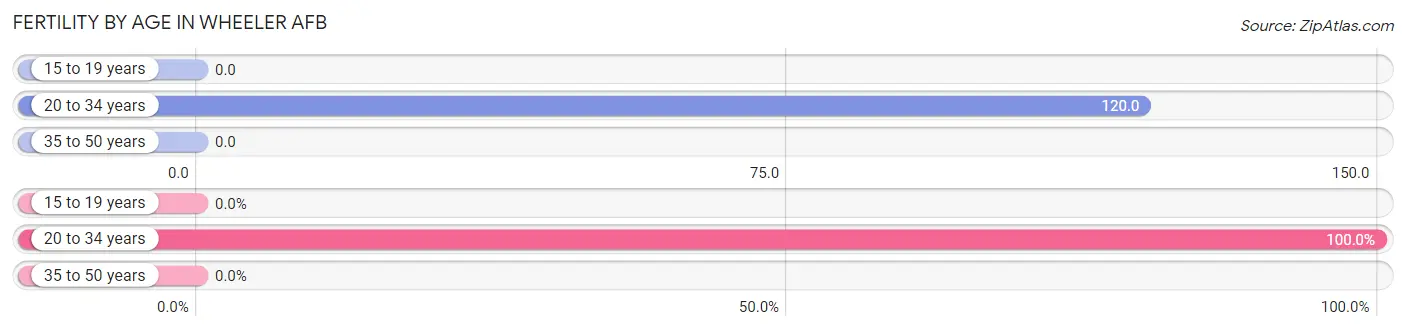
| Age Bracket | Women with Births | Births / 1,000 Women |
| 15 to 19 years | 0 (0.0%) | 0.0 |
| 20 to 34 years | 49 (100.0%) | 120.0 |
| 35 to 50 years | 0 (0.0%) | 0.0 |
| Total | 49 (100.0%) | 82.0 |
Fertility by Age by Marriage Status in Wheeler AFB
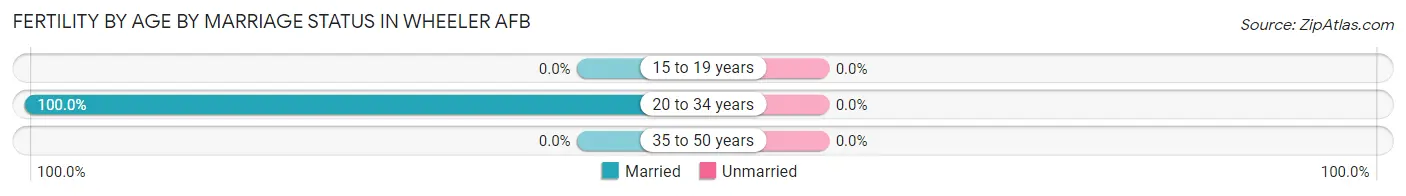
| Age Bracket | Married | Unmarried |
| 15 to 19 years | 0 (0.0%) | 0 (0.0%) |
| 20 to 34 years | 49 (100.0%) | 0 (0.0%) |
| 35 to 50 years | 0 (0.0%) | 0 (0.0%) |
| Total | 49 (100.0%) | 0 (0.0%) |
Fertility by Education in Wheeler AFB
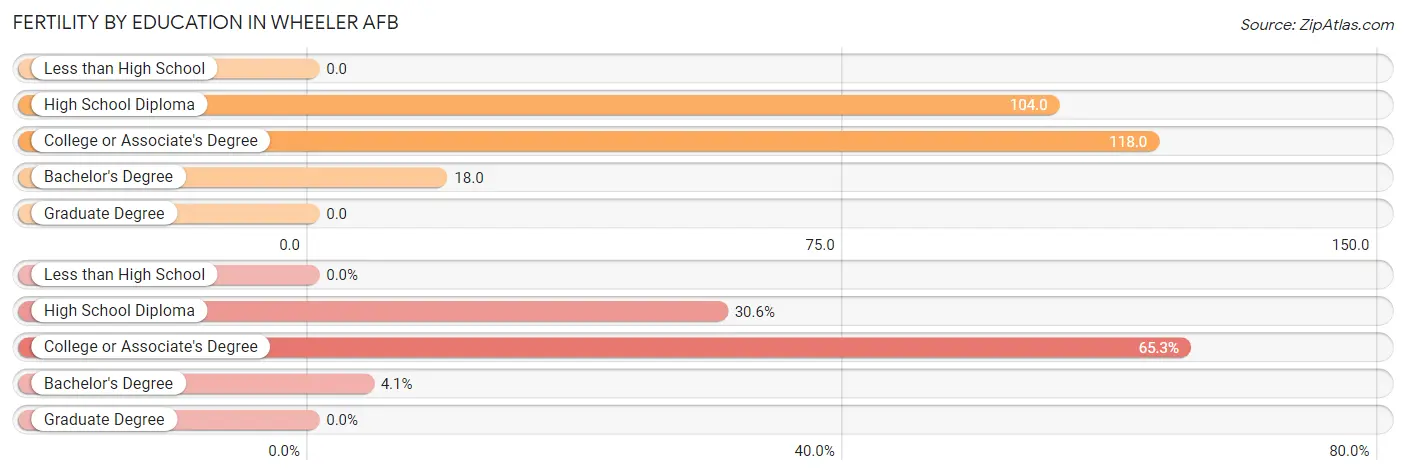
| Educational Attainment | Women with Births | Births / 1,000 Women |
| Less than High School | 0 (0.0%) | 0.0 |
| High School Diploma | 15 (30.6%) | 104.0 |
| College or Associate's Degree | 32 (65.3%) | 118.0 |
| Bachelor's Degree | 2 (4.1%) | 18.0 |
| Graduate Degree | 0 (0.0%) | 0.0 |
| Total | 49 (100.0%) | 82.0 |
Fertility by Education by Marriage Status in Wheeler AFB
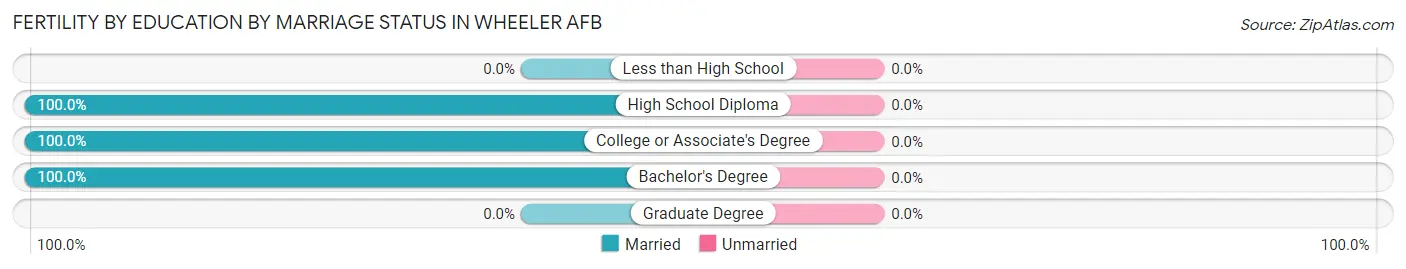
| Educational Attainment | Married | Unmarried |
| Less than High School | 0 (0.0%) | 0 (0.0%) |
| High School Diploma | 15 (100.0%) | 0 (0.0%) |
| College or Associate's Degree | 32 (100.0%) | 0 (0.0%) |
| Bachelor's Degree | 2 (100.0%) | 0 (0.0%) |
| Graduate Degree | 0 (0.0%) | 0 (0.0%) |
| Total | 49 (100.0%) | 0 (0.0%) |
Employment Characteristics in Wheeler AFB
Employment by Class of Employer in Wheeler AFB
Among the 1,268 employed individuals in Wheeler AFB, federal government employees (954 | 75.2%), private company employees (149 | 11.7%), and not-for-profit organizations (69 | 5.4%) make up the most common classes of employment.
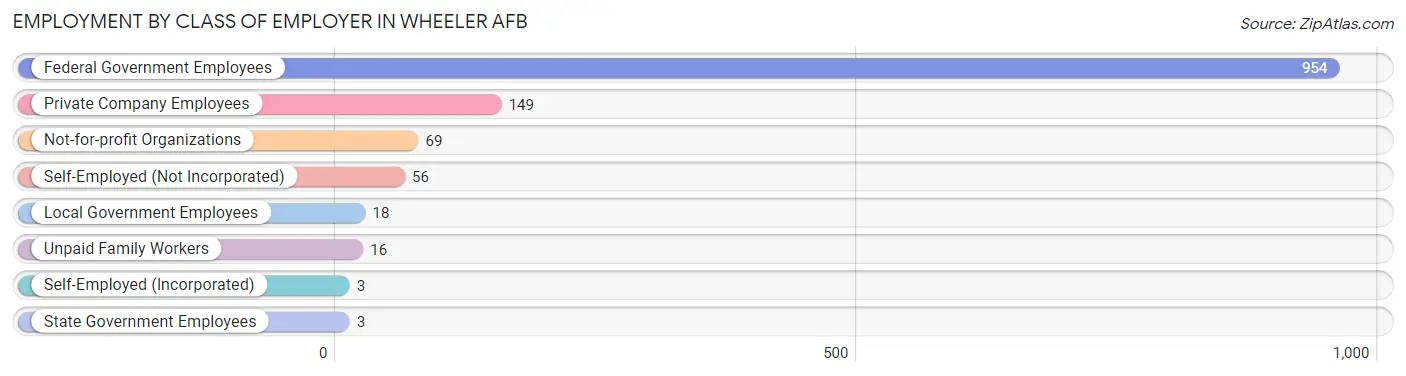
| Employer Class | # Employees | % Employees |
| Private Company Employees | 149 | 11.7% |
| Self-Employed (Incorporated) | 3 | 0.2% |
| Self-Employed (Not Incorporated) | 56 | 4.4% |
| Not-for-profit Organizations | 69 | 5.4% |
| Local Government Employees | 18 | 1.4% |
| State Government Employees | 3 | 0.2% |
| Federal Government Employees | 954 | 75.2% |
| Unpaid Family Workers | 16 | 1.3% |
| Total | 1,268 | 100.0% |
Employment Status by Age in Wheeler AFB
According to the labor force statistics for Wheeler AFB, out of the total population over 16 years of age (1,632), 81.2% or 1,325 individuals are in the labor force, with 8.6% or 114 of them unemployed. The age group with the highest labor force participation rate is 65 to 74 years, with 100.0% or 5 individuals in the labor force. Within the labor force, the 16 to 19 years age range has the highest percentage of unemployed individuals, with 76.9% or 38 of them being unemployed.
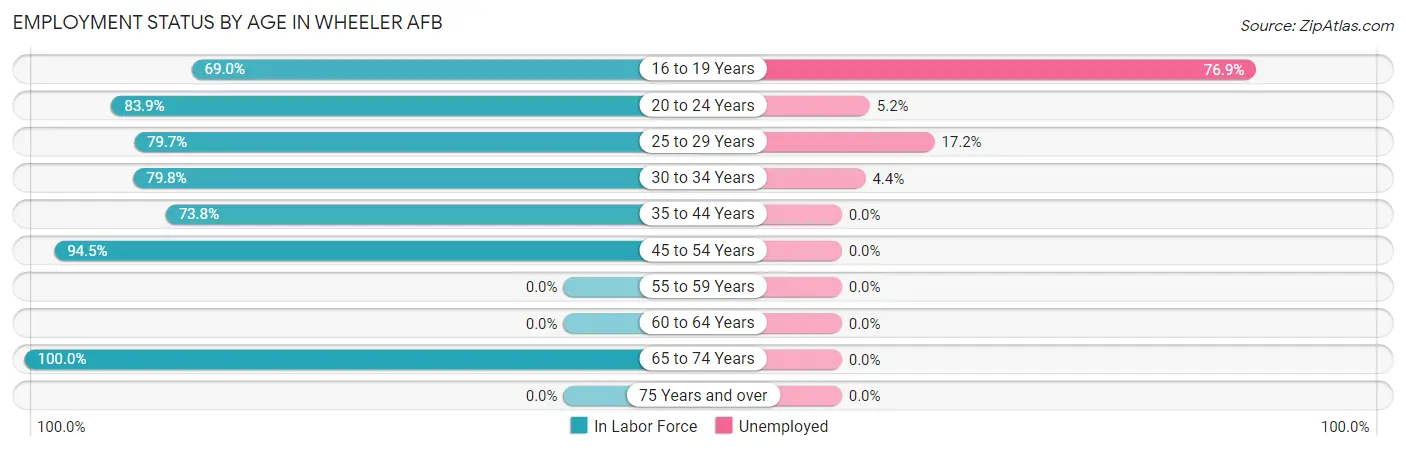
| Age Bracket | In Labor Force | Unemployed |
| 16 to 19 Years | 49 (69.0%) | 38 (76.9%) |
| 20 to 24 Years | 434 (83.9%) | 23 (5.2%) |
| 25 to 29 Years | 307 (79.7%) | 53 (17.2%) |
| 30 to 34 Years | 154 (79.8%) | 7 (4.4%) |
| 35 to 44 Years | 152 (73.8%) | 0 (0.0%) |
| 45 to 54 Years | 224 (94.5%) | 0 (0.0%) |
| 55 to 59 Years | 0 (0.0%) | 0 (0.0%) |
| 60 to 64 Years | 0 (0.0%) | 0 (0.0%) |
| 65 to 74 Years | 5 (100.0%) | 0 (0.0%) |
| 75 Years and over | 0 (0.0%) | 0 (0.0%) |
| Total | 1,325 (81.2%) | 114 (8.6%) |
Employment Status by Educational Attainment in Wheeler AFB
According to labor force statistics for Wheeler AFB, 81.1% of individuals (837) out of the total population between 25 and 64 years of age (1,032) are in the labor force, with 5.0% or 42 of them being unemployed. The group with the highest labor force participation rate are those with the educational attainment of less than high school, with 100.0% or 14 individuals in the labor force. Within the labor force, individuals with college / associate degree education have the highest percentage of unemployment, with 8.3% or 35 of them being unemployed.

| Educational Attainment | In Labor Force | Unemployed |
| Less than High School | 14 (100.0%) | 0 (0.0%) |
| High School Diploma | 148 (77.1%) | 0 (0.0%) |
| College / Associate Degree | 419 (81.7%) | 43 (8.3%) |
| Bachelor's Degree or higher | 256 (81.8%) | 5 (1.6%) |
| Total | 837 (81.1%) | 52 (5.0%) |
Employment Occupations by Sex in Wheeler AFB
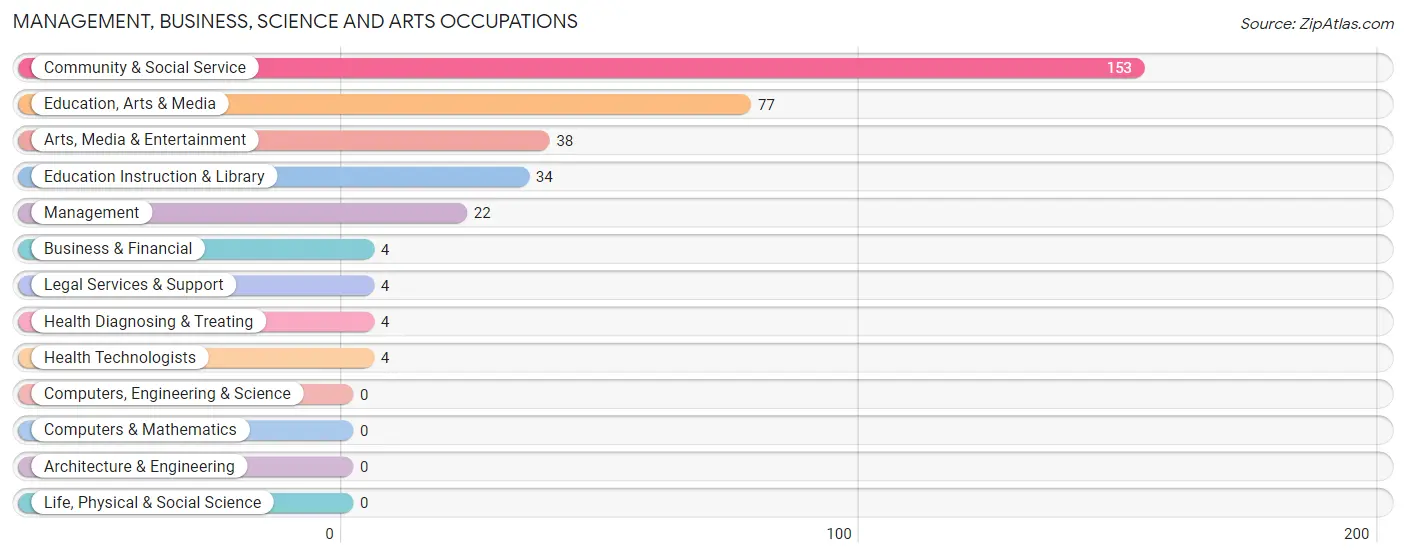
Management, Business, Science and Arts Occupations
The most common Management, Business, Science and Arts occupations in Wheeler AFB are Community & Social Service (153 | 32.9%), Education, Arts & Media (77 | 16.6%), Arts, Media & Entertainment (38 | 8.2%), Education Instruction & Library (34 | 7.3%), and Management (22 | 4.7%).
Management, Business, Science and Arts Occupations by Sex
Within the Management, Business, Science and Arts occupations in Wheeler AFB, the most male-oriented occupations are Business & Financial (100.0%), Education, Arts & Media (92.2%), and Management (81.8%), while the most female-oriented occupations are Legal Services & Support (100.0%), Education Instruction & Library (100.0%), and Health Diagnosing & Treating (100.0%).
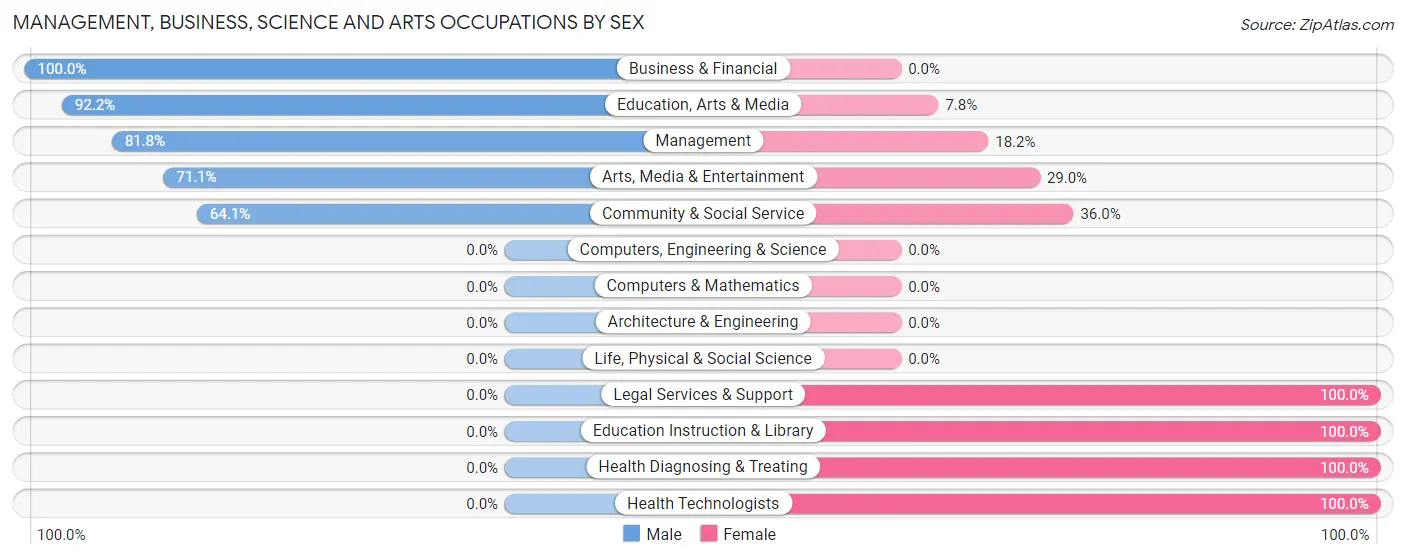
| Occupation | Male | Female |
| Management | 18 (81.8%) | 4 (18.2%) |
| Business & Financial | 4 (100.0%) | 0 (0.0%) |
| Computers, Engineering & Science | 0 (0.0%) | 0 (0.0%) |
| Computers & Mathematics | 0 (0.0%) | 0 (0.0%) |
| Architecture & Engineering | 0 (0.0%) | 0 (0.0%) |
| Life, Physical & Social Science | 0 (0.0%) | 0 (0.0%) |
| Community & Social Service | 98 (64.0%) | 55 (35.9%) |
| Education, Arts & Media | 71 (92.2%) | 6 (7.8%) |
| Legal Services & Support | 0 (0.0%) | 4 (100.0%) |
| Education Instruction & Library | 0 (0.0%) | 34 (100.0%) |
| Arts, Media & Entertainment | 27 (71.1%) | 11 (28.9%) |
| Health Diagnosing & Treating | 0 (0.0%) | 4 (100.0%) |
| Health Technologists | 0 (0.0%) | 4 (100.0%) |
| Total (Category) | 120 (65.6%) | 63 (34.4%) |
| Total (Overall) | 264 (56.8%) | 201 (43.2%) |
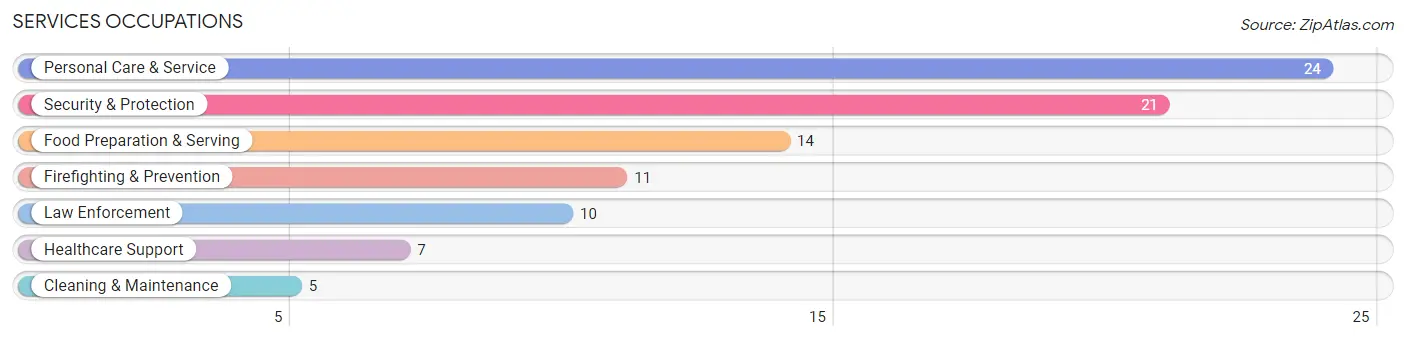
Services Occupations
The most common Services occupations in Wheeler AFB are Personal Care & Service (24 | 5.2%), Security & Protection (21 | 4.5%), Food Preparation & Serving (14 | 3.0%), Firefighting & Prevention (11 | 2.4%), and Law Enforcement (10 | 2.1%).
Services Occupations by Sex
Within the Services occupations in Wheeler AFB, the most male-oriented occupations are Security & Protection (100.0%), Firefighting & Prevention (100.0%), and Law Enforcement (100.0%), while the most female-oriented occupations are Healthcare Support (100.0%), Personal Care & Service (100.0%), and Food Preparation & Serving (35.7%).
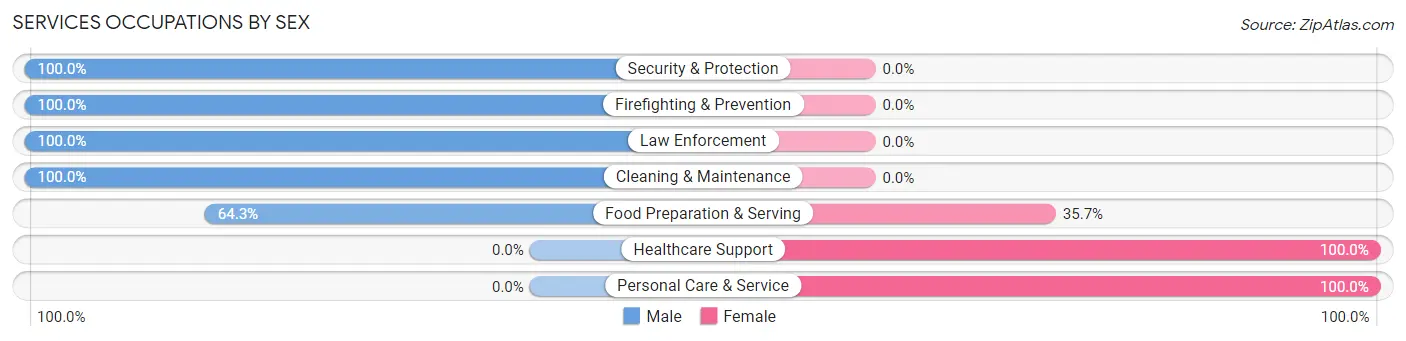
| Occupation | Male | Female |
| Healthcare Support | 0 (0.0%) | 7 (100.0%) |
| Security & Protection | 21 (100.0%) | 0 (0.0%) |
| Firefighting & Prevention | 11 (100.0%) | 0 (0.0%) |
| Law Enforcement | 10 (100.0%) | 0 (0.0%) |
| Food Preparation & Serving | 9 (64.3%) | 5 (35.7%) |
| Cleaning & Maintenance | 5 (100.0%) | 0 (0.0%) |
| Personal Care & Service | 0 (0.0%) | 24 (100.0%) |
| Total (Category) | 35 (49.3%) | 36 (50.7%) |
| Total (Overall) | 264 (56.8%) | 201 (43.2%) |
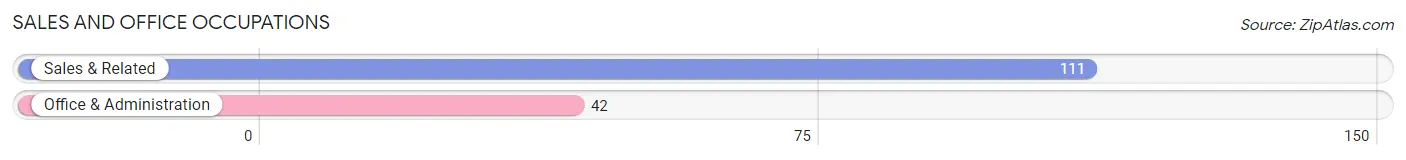
Sales and Office Occupations
The most common Sales and Office occupations in Wheeler AFB are Sales & Related (111 | 23.9%), and Office & Administration (42 | 9.0%).
Sales and Office Occupations by Sex
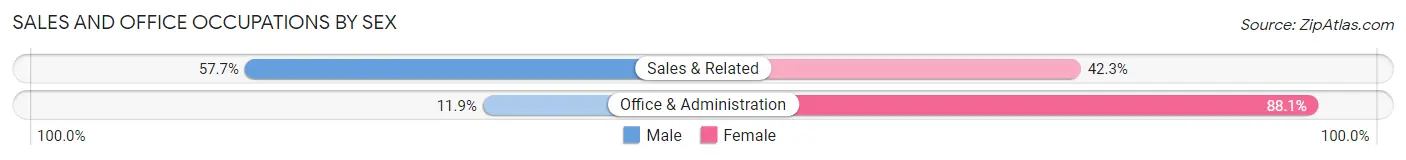
| Occupation | Male | Female |
| Sales & Related | 64 (57.7%) | 47 (42.3%) |
| Office & Administration | 5 (11.9%) | 37 (88.1%) |
| Total (Category) | 69 (45.1%) | 84 (54.9%) |
| Total (Overall) | 264 (56.8%) | 201 (43.2%) |
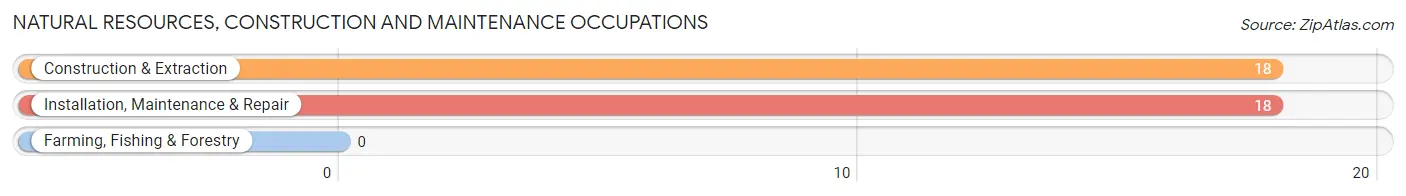
Natural Resources, Construction and Maintenance Occupations
The most common Natural Resources, Construction and Maintenance occupations in Wheeler AFB are Construction & Extraction (18 | 3.9%), and Installation, Maintenance & Repair (18 | 3.9%).
Natural Resources, Construction and Maintenance Occupations by Sex
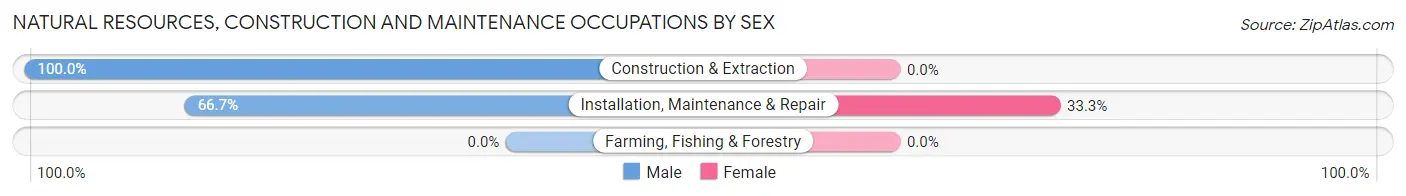
| Occupation | Male | Female |
| Farming, Fishing & Forestry | 0 (0.0%) | 0 (0.0%) |
| Construction & Extraction | 18 (100.0%) | 0 (0.0%) |
| Installation, Maintenance & Repair | 12 (66.7%) | 6 (33.3%) |
| Total (Category) | 30 (83.3%) | 6 (16.7%) |
| Total (Overall) | 264 (56.8%) | 201 (43.2%) |
Production, Transportation and Moving Occupations
The most common Production, Transportation and Moving occupations in Wheeler AFB are , and Material Moving (22 | 4.7%).
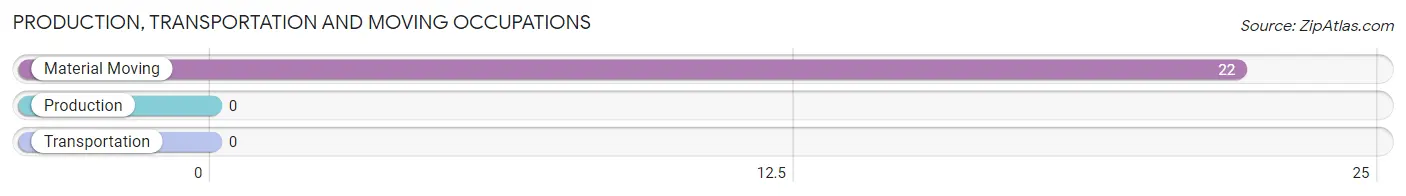
Production, Transportation and Moving Occupations by Sex
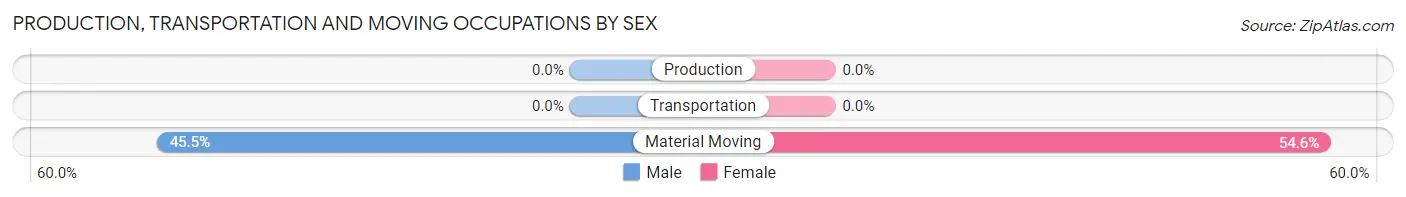
| Occupation | Male | Female |
| Production | 0 (0.0%) | 0 (0.0%) |
| Transportation | 0 (0.0%) | 0 (0.0%) |
| Material Moving | 10 (45.5%) | 12 (54.5%) |
| Total (Category) | 10 (45.5%) | 12 (54.5%) |
| Total (Overall) | 264 (56.8%) | 201 (43.2%) |
Employment Industries by Sex in Wheeler AFB
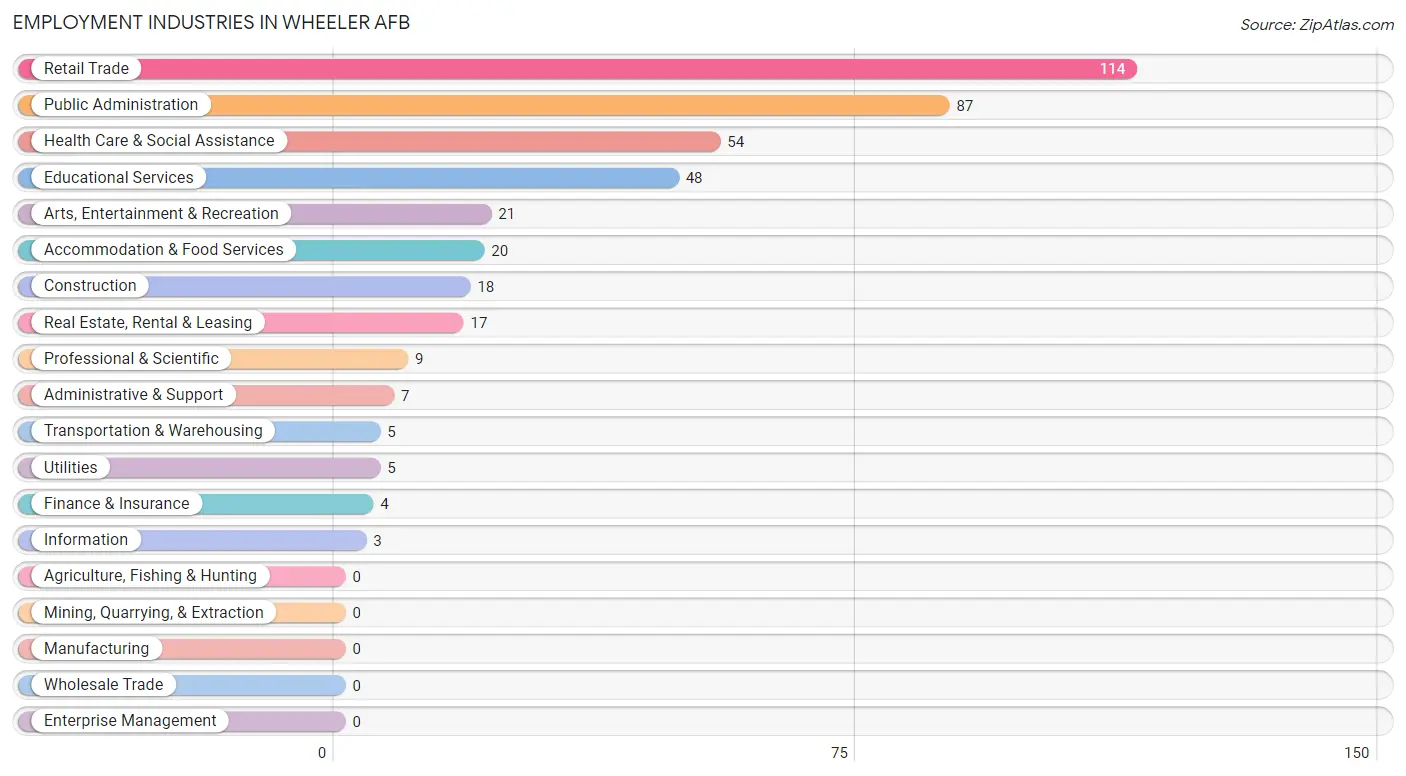
Employment Industries in Wheeler AFB
The major employment industries in Wheeler AFB include Retail Trade (114 | 24.5%), Public Administration (87 | 18.7%), Health Care & Social Assistance (54 | 11.6%), Educational Services (48 | 10.3%), and Arts, Entertainment & Recreation (21 | 4.5%).
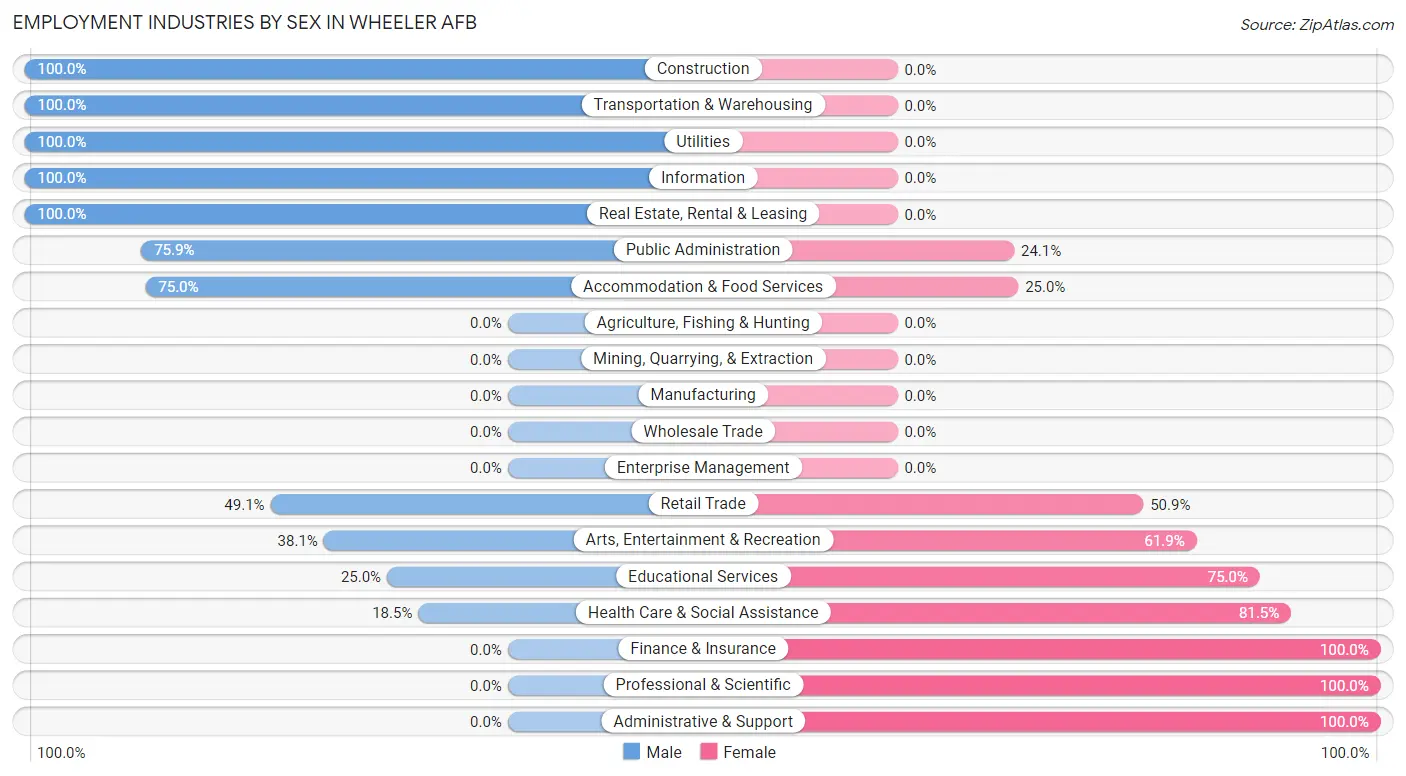
Employment Industries by Sex in Wheeler AFB
The Wheeler AFB industries that see more men than women are Construction (100.0%), Transportation & Warehousing (100.0%), and Utilities (100.0%), whereas the industries that tend to have a higher number of women are Finance & Insurance (100.0%), Professional & Scientific (100.0%), and Administrative & Support (100.0%).
| Industry | Male | Female |
| Agriculture, Fishing & Hunting | 0 (0.0%) | 0 (0.0%) |
| Mining, Quarrying, & Extraction | 0 (0.0%) | 0 (0.0%) |
| Construction | 18 (100.0%) | 0 (0.0%) |
| Manufacturing | 0 (0.0%) | 0 (0.0%) |
| Wholesale Trade | 0 (0.0%) | 0 (0.0%) |
| Retail Trade | 56 (49.1%) | 58 (50.9%) |
| Transportation & Warehousing | 5 (100.0%) | 0 (0.0%) |
| Utilities | 5 (100.0%) | 0 (0.0%) |
| Information | 3 (100.0%) | 0 (0.0%) |
| Finance & Insurance | 0 (0.0%) | 4 (100.0%) |
| Real Estate, Rental & Leasing | 17 (100.0%) | 0 (0.0%) |
| Professional & Scientific | 0 (0.0%) | 9 (100.0%) |
| Enterprise Management | 0 (0.0%) | 0 (0.0%) |
| Administrative & Support | 0 (0.0%) | 7 (100.0%) |
| Educational Services | 12 (25.0%) | 36 (75.0%) |
| Health Care & Social Assistance | 10 (18.5%) | 44 (81.5%) |
| Arts, Entertainment & Recreation | 8 (38.1%) | 13 (61.9%) |
| Accommodation & Food Services | 15 (75.0%) | 5 (25.0%) |
| Public Administration | 66 (75.9%) | 21 (24.1%) |
| Total | 264 (56.8%) | 201 (43.2%) |
Education in Wheeler AFB
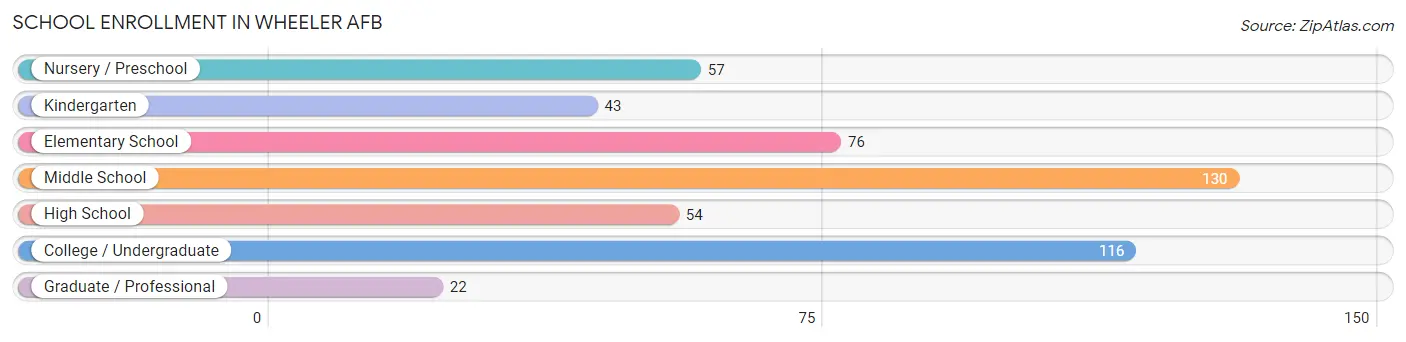
School Enrollment in Wheeler AFB
The most common levels of schooling among the 498 students in Wheeler AFB are middle school (130 | 26.1%), college / undergraduate (116 | 23.3%), and elementary school (76 | 15.3%).
| School Level | # Students | % Students |
| Nursery / Preschool | 57 | 11.5% |
| Kindergarten | 43 | 8.6% |
| Elementary School | 76 | 15.3% |
| Middle School | 130 | 26.1% |
| High School | 54 | 10.8% |
| College / Undergraduate | 116 | 23.3% |
| Graduate / Professional | 22 | 4.4% |
| Total | 498 | 100.0% |
School Enrollment by Age by Funding Source in Wheeler AFB
Out of a total of 498 students who are enrolled in schools in Wheeler AFB, 122 (24.5%) attend a private institution, while the remaining 376 (75.5%) are enrolled in public schools. The age group of 3 to 4 year olds has the highest likelihood of being enrolled in private schools, with 30 (71.4% in the age bracket) enrolled. Conversely, the age group of 15 to 17 year olds has the lowest likelihood of being enrolled in a private school, with 56 (100.0% in the age bracket) attending a public institution.
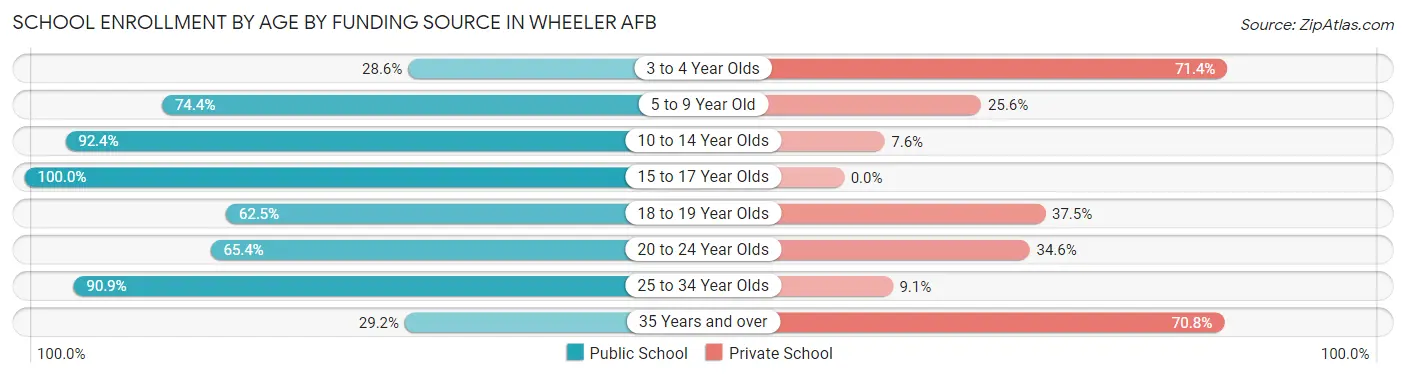
| Age Bracket | Public School | Private School |
| 3 to 4 Year Olds | 12 (28.6%) | 30 (71.4%) |
| 5 to 9 Year Old | 93 (74.4%) | 32 (25.6%) |
| 10 to 14 Year Olds | 122 (92.4%) | 10 (7.6%) |
| 15 to 17 Year Olds | 56 (100.0%) | 0 (0.0%) |
| 18 to 19 Year Olds | 5 (62.5%) | 3 (37.5%) |
| 20 to 24 Year Olds | 51 (65.4%) | 27 (34.6%) |
| 25 to 34 Year Olds | 30 (90.9%) | 3 (9.1%) |
| 35 Years and over | 7 (29.2%) | 17 (70.8%) |
| Total | 376 (75.5%) | 122 (24.5%) |
Educational Attainment by Field of Study in Wheeler AFB
Business (79 | 23.1%), arts & humanities (58 | 17.0%), social sciences (51 | 14.9%), psychology (32 | 9.4%), and science & technology (23 | 6.7%) are the most common fields of study among 342 individuals in Wheeler AFB who have obtained a bachelor's degree or higher.
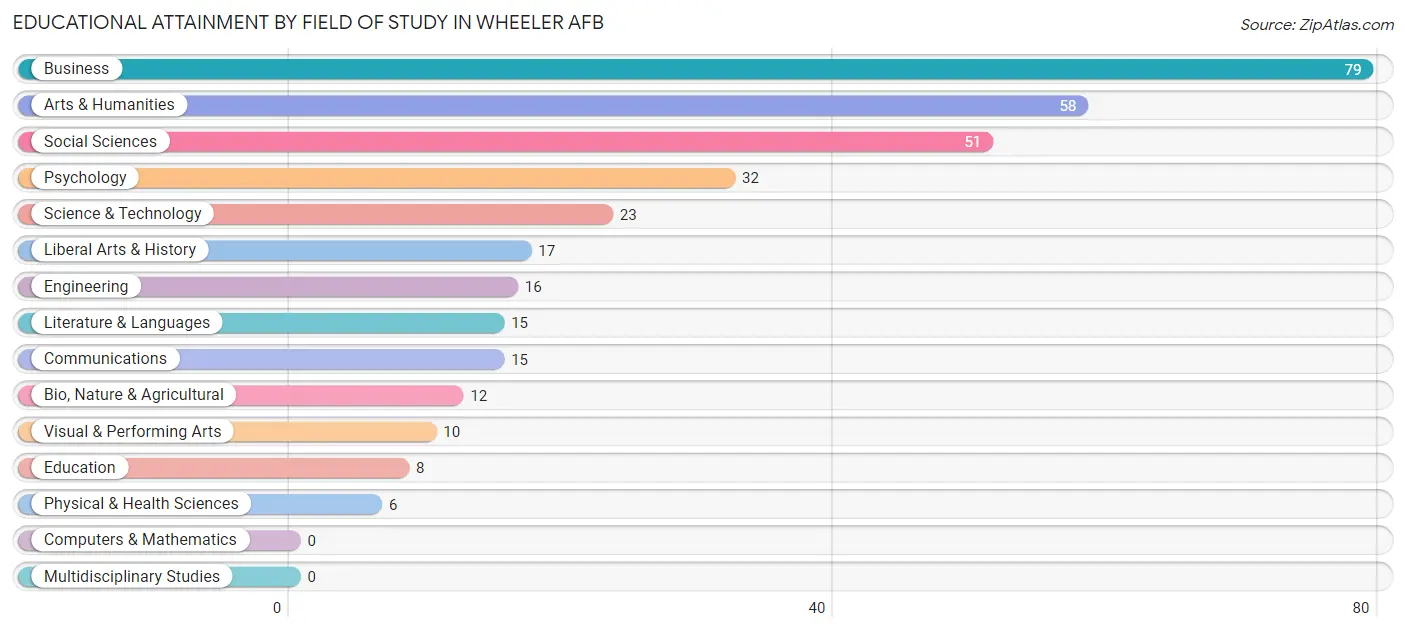
| Field of Study | # Graduates | % Graduates |
| Computers & Mathematics | 0 | 0.0% |
| Bio, Nature & Agricultural | 12 | 3.5% |
| Physical & Health Sciences | 6 | 1.8% |
| Psychology | 32 | 9.4% |
| Social Sciences | 51 | 14.9% |
| Engineering | 16 | 4.7% |
| Multidisciplinary Studies | 0 | 0.0% |
| Science & Technology | 23 | 6.7% |
| Business | 79 | 23.1% |
| Education | 8 | 2.3% |
| Literature & Languages | 15 | 4.4% |
| Liberal Arts & History | 17 | 5.0% |
| Visual & Performing Arts | 10 | 2.9% |
| Communications | 15 | 4.4% |
| Arts & Humanities | 58 | 17.0% |
| Total | 342 | 100.0% |
Transportation & Commute in Wheeler AFB
Vehicle Availability by Sex in Wheeler AFB
The most prevalent vehicle ownership categories in Wheeler AFB are males with 2 vehicles (384, accounting for 48.2%) and females with 2 vehicles (170, making up 139.1%).
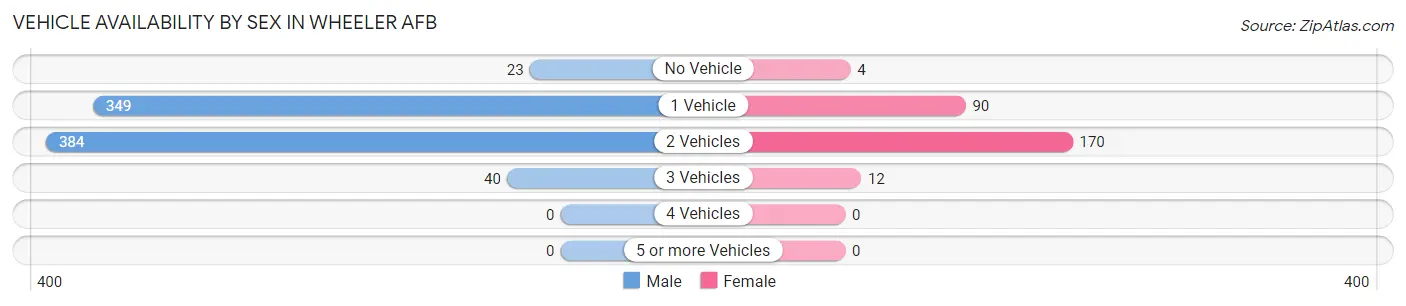
| Vehicles Available | Male | Female |
| No Vehicle | 23 (2.9%) | 4 (1.5%) |
| 1 Vehicle | 349 (43.8%) | 90 (32.6%) |
| 2 Vehicles | 384 (48.2%) | 170 (61.6%) |
| 3 Vehicles | 40 (5.0%) | 12 (4.3%) |
| 4 Vehicles | 0 (0.0%) | 0 (0.0%) |
| 5 or more Vehicles | 0 (0.0%) | 0 (0.0%) |
| Total | 796 (100.0%) | 276 (100.0%) |
Commute Time in Wheeler AFB
The most frequently occuring commute durations in Wheeler AFB are 5 to 9 minutes (328 commuters, 26.9%), 15 to 19 minutes (305 commuters, 25.0%), and 10 to 14 minutes (264 commuters, 21.6%).
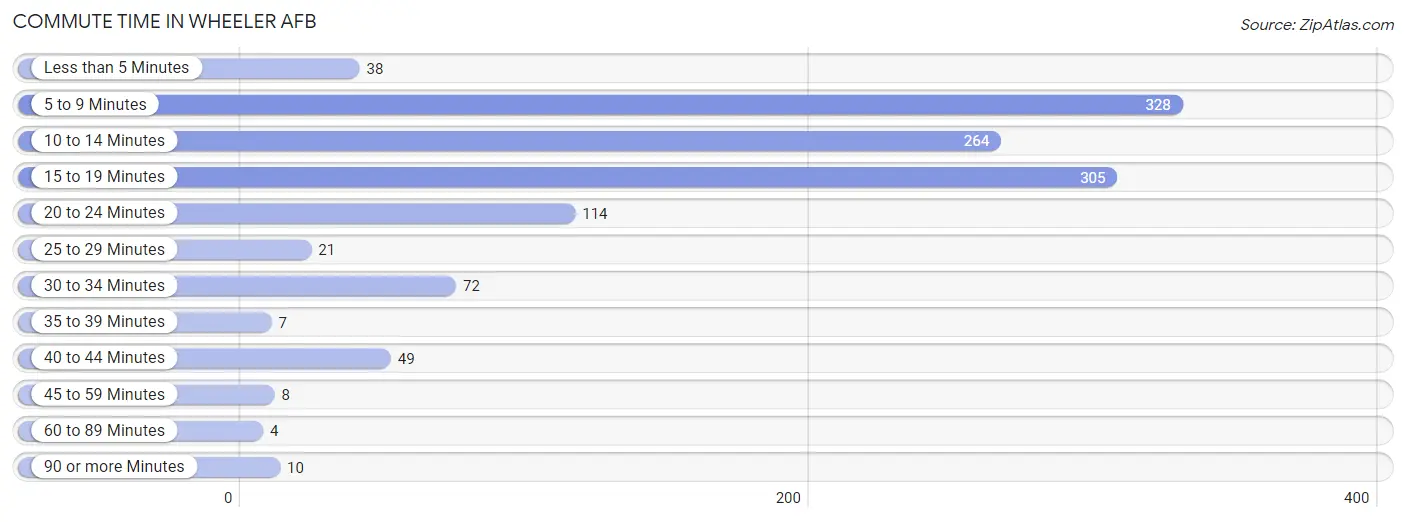
| Commute Time | # Commuters | % Commuters |
| Less than 5 Minutes | 38 | 3.1% |
| 5 to 9 Minutes | 328 | 26.9% |
| 10 to 14 Minutes | 264 | 21.6% |
| 15 to 19 Minutes | 305 | 25.0% |
| 20 to 24 Minutes | 114 | 9.3% |
| 25 to 29 Minutes | 21 | 1.7% |
| 30 to 34 Minutes | 72 | 5.9% |
| 35 to 39 Minutes | 7 | 0.6% |
| 40 to 44 Minutes | 49 | 4.0% |
| 45 to 59 Minutes | 8 | 0.7% |
| 60 to 89 Minutes | 4 | 0.3% |
| 90 or more Minutes | 10 | 0.8% |
Commute Time by Sex in Wheeler AFB
The most common commute times in Wheeler AFB are 5 to 9 minutes (282 commuters, 29.7%) for males and 15 to 19 minutes (101 commuters, 37.3%) for females.
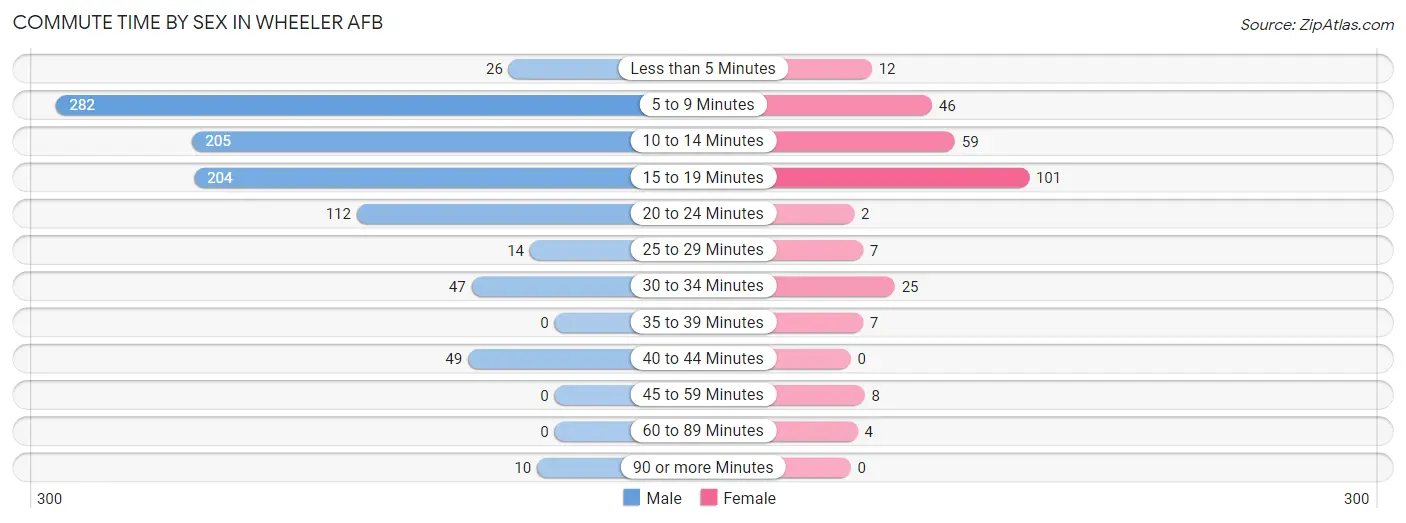
| Commute Time | Male | Female |
| Less than 5 Minutes | 26 (2.7%) | 12 (4.4%) |
| 5 to 9 Minutes | 282 (29.7%) | 46 (17.0%) |
| 10 to 14 Minutes | 205 (21.6%) | 59 (21.8%) |
| 15 to 19 Minutes | 204 (21.5%) | 101 (37.3%) |
| 20 to 24 Minutes | 112 (11.8%) | 2 (0.7%) |
| 25 to 29 Minutes | 14 (1.5%) | 7 (2.6%) |
| 30 to 34 Minutes | 47 (5.0%) | 25 (9.2%) |
| 35 to 39 Minutes | 0 (0.0%) | 7 (2.6%) |
| 40 to 44 Minutes | 49 (5.2%) | 0 (0.0%) |
| 45 to 59 Minutes | 0 (0.0%) | 8 (2.9%) |
| 60 to 89 Minutes | 0 (0.0%) | 4 (1.5%) |
| 90 or more Minutes | 10 (1.1%) | 0 (0.0%) |
Time of Departure to Work by Sex in Wheeler AFB
The most frequent times of departure to work in Wheeler AFB are 5:30 AM to 5:59 AM (175, 18.4%) for males and 8:00 AM to 8:29 AM (42, 15.5%) for females.
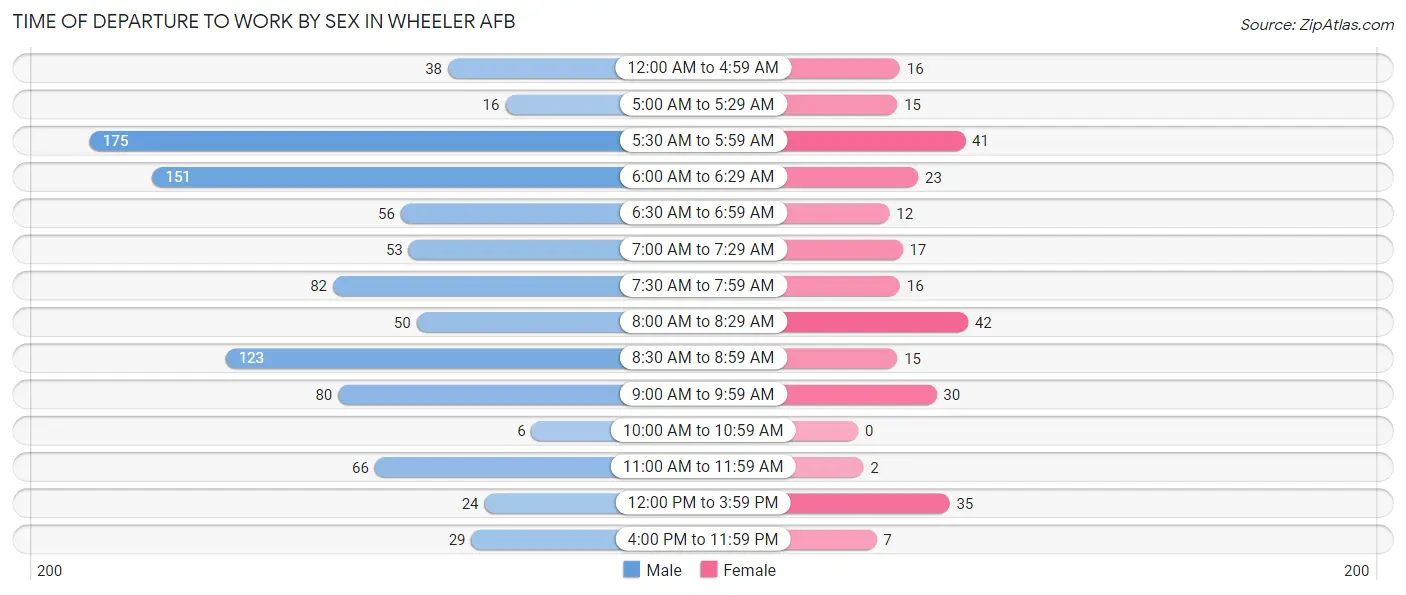
| Time of Departure | Male | Female |
| 12:00 AM to 4:59 AM | 38 (4.0%) | 16 (5.9%) |
| 5:00 AM to 5:29 AM | 16 (1.7%) | 15 (5.5%) |
| 5:30 AM to 5:59 AM | 175 (18.4%) | 41 (15.1%) |
| 6:00 AM to 6:29 AM | 151 (15.9%) | 23 (8.5%) |
| 6:30 AM to 6:59 AM | 56 (5.9%) | 12 (4.4%) |
| 7:00 AM to 7:29 AM | 53 (5.6%) | 17 (6.3%) |
| 7:30 AM to 7:59 AM | 82 (8.6%) | 16 (5.9%) |
| 8:00 AM to 8:29 AM | 50 (5.3%) | 42 (15.5%) |
| 8:30 AM to 8:59 AM | 123 (13.0%) | 15 (5.5%) |
| 9:00 AM to 9:59 AM | 80 (8.4%) | 30 (11.1%) |
| 10:00 AM to 10:59 AM | 6 (0.6%) | 0 (0.0%) |
| 11:00 AM to 11:59 AM | 66 (7.0%) | 2 (0.7%) |
| 12:00 PM to 3:59 PM | 24 (2.5%) | 35 (12.9%) |
| 4:00 PM to 11:59 PM | 29 (3.1%) | 7 (2.6%) |
| Total | 949 (100.0%) | 271 (100.0%) |
Housing Occupancy in Wheeler AFB
Occupancy by Ownership in Wheeler AFB
Of the total 808 dwellings in Wheeler AFB, owner-occupied units account for 4 (0.5%), while renter-occupied units make up 804 (99.5%).
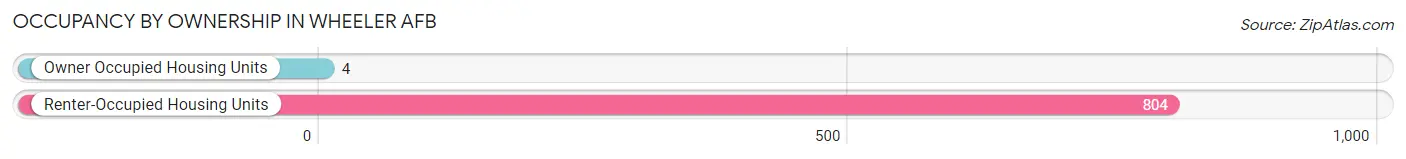
| Occupancy | # Housing Units | % Housing Units |
| Owner Occupied Housing Units | 4 | 0.5% |
| Renter-Occupied Housing Units | 804 | 99.5% |
| Total Occupied Housing Units | 808 | 100.0% |
Occupancy by Household Size in Wheeler AFB
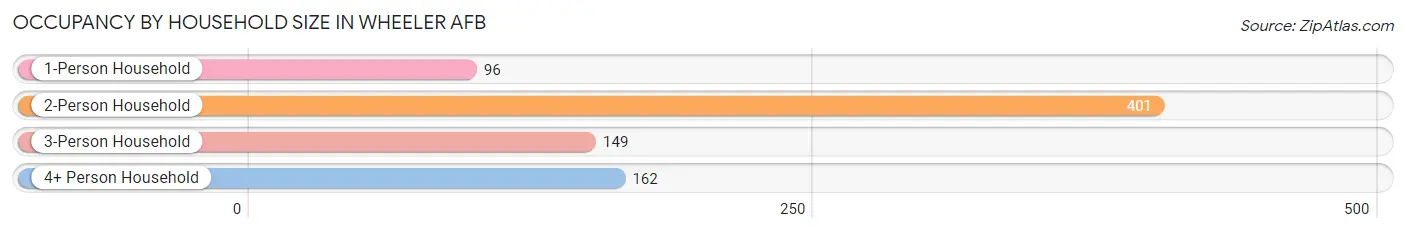
| Household Size | # Housing Units | % Housing Units |
| 1-Person Household | 96 | 11.9% |
| 2-Person Household | 401 | 49.6% |
| 3-Person Household | 149 | 18.4% |
| 4+ Person Household | 162 | 20.1% |
| Total Housing Units | 808 | 100.0% |
Occupancy by Ownership by Household Size in Wheeler AFB

| Household Size | Owner-occupied | Renter-occupied |
| 1-Person Household | 4 (4.2%) | 92 (95.8%) |
| 2-Person Household | 0 (0.0%) | 401 (100.0%) |
| 3-Person Household | 0 (0.0%) | 149 (100.0%) |
| 4+ Person Household | 0 (0.0%) | 162 (100.0%) |
| Total Housing Units | 4 (0.5%) | 804 (99.5%) |
Occupancy by Educational Attainment in Wheeler AFB
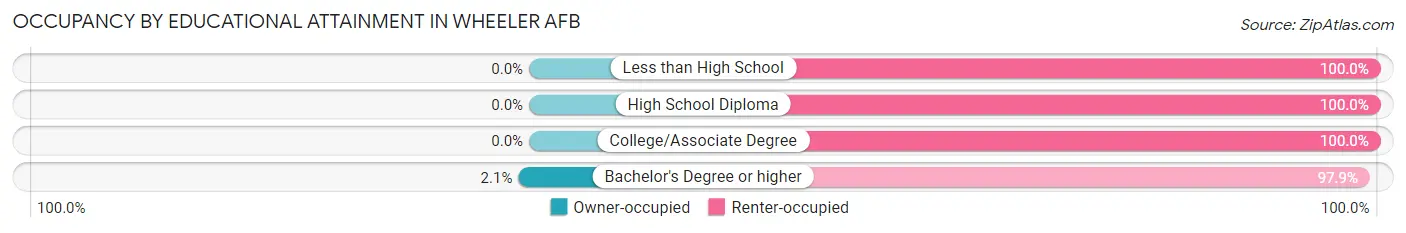
| Household Size | Owner-occupied | Renter-occupied |
| Less than High School | 0 (0.0%) | 14 (100.0%) |
| High School Diploma | 0 (0.0%) | 134 (100.0%) |
| College/Associate Degree | 0 (0.0%) | 472 (100.0%) |
| Bachelor's Degree or higher | 4 (2.1%) | 184 (97.9%) |
Occupancy by Age of Householder in Wheeler AFB
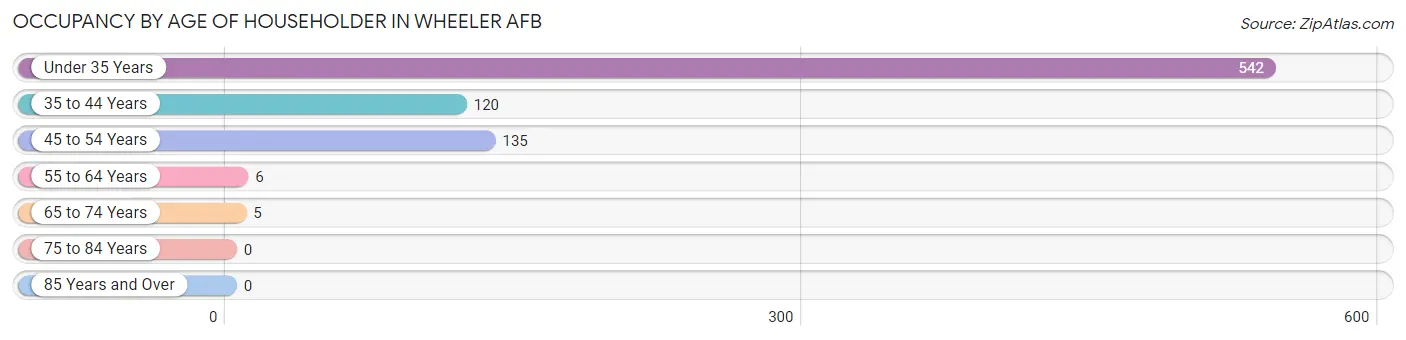
| Age Bracket | # Households | % Households |
| Under 35 Years | 542 | 67.1% |
| 35 to 44 Years | 120 | 14.8% |
| 45 to 54 Years | 135 | 16.7% |
| 55 to 64 Years | 6 | 0.7% |
| 65 to 74 Years | 5 | 0.6% |
| 75 to 84 Years | 0 | 0.0% |
| 85 Years and Over | 0 | 0.0% |
| Total | 808 | 100.0% |
Housing Finances in Wheeler AFB
Median Income by Occupancy in Wheeler AFB
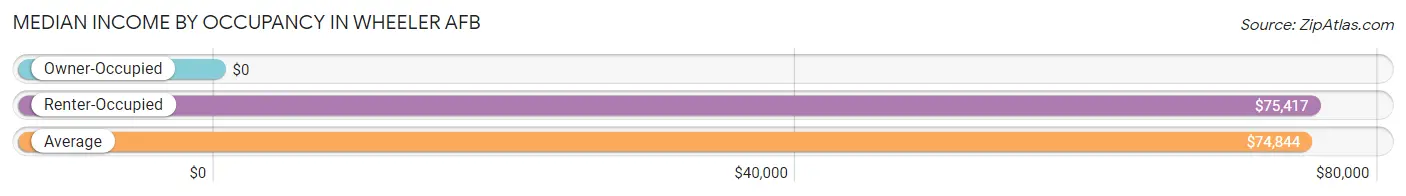
| Occupancy Type | # Households | Median Income |
| Owner-Occupied | 4 (0.5%) | $0 |
| Renter-Occupied | 804 (99.5%) | $75,417 |
| Average | 808 (100.0%) | $74,844 |
Occupancy by Householder Income Bracket in Wheeler AFB
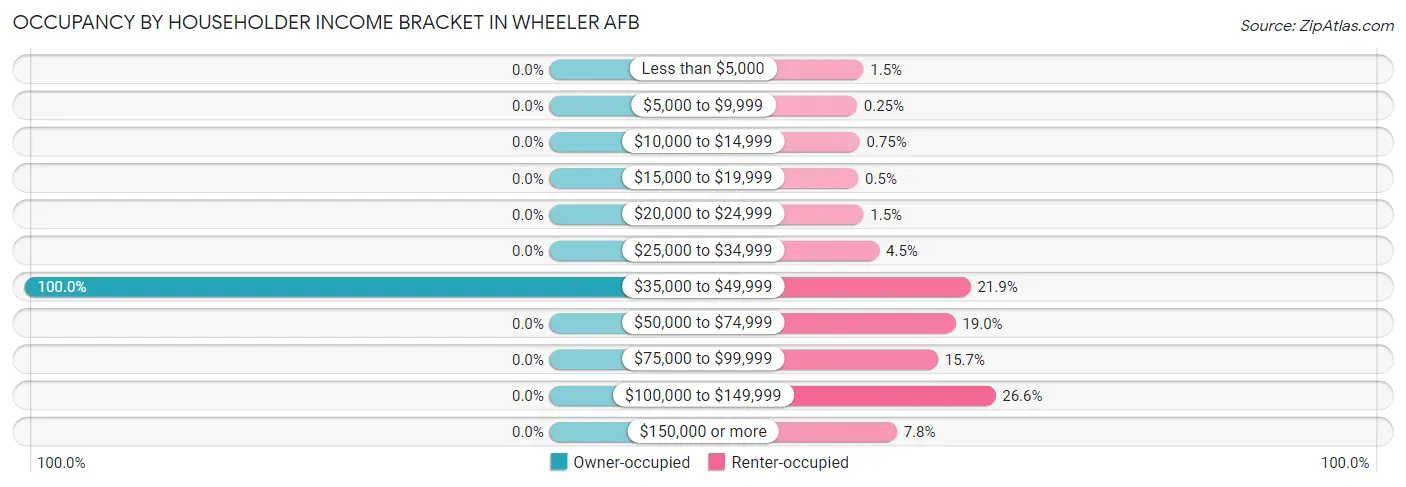
| Income Bracket | Owner-occupied | Renter-occupied |
| Less than $5,000 | 0 (0.0%) | 12 (1.5%) |
| $5,000 to $9,999 | 0 (0.0%) | 2 (0.3%) |
| $10,000 to $14,999 | 0 (0.0%) | 6 (0.7%) |
| $15,000 to $19,999 | 0 (0.0%) | 4 (0.5%) |
| $20,000 to $24,999 | 0 (0.0%) | 12 (1.5%) |
| $25,000 to $34,999 | 0 (0.0%) | 36 (4.5%) |
| $35,000 to $49,999 | 4 (100.0%) | 176 (21.9%) |
| $50,000 to $74,999 | 0 (0.0%) | 153 (19.0%) |
| $75,000 to $99,999 | 0 (0.0%) | 126 (15.7%) |
| $100,000 to $149,999 | 0 (0.0%) | 214 (26.6%) |
| $150,000 or more | 0 (0.0%) | 63 (7.8%) |
| Total | 4 (100.0%) | 804 (100.0%) |
Monthly Housing Cost Tiers in Wheeler AFB
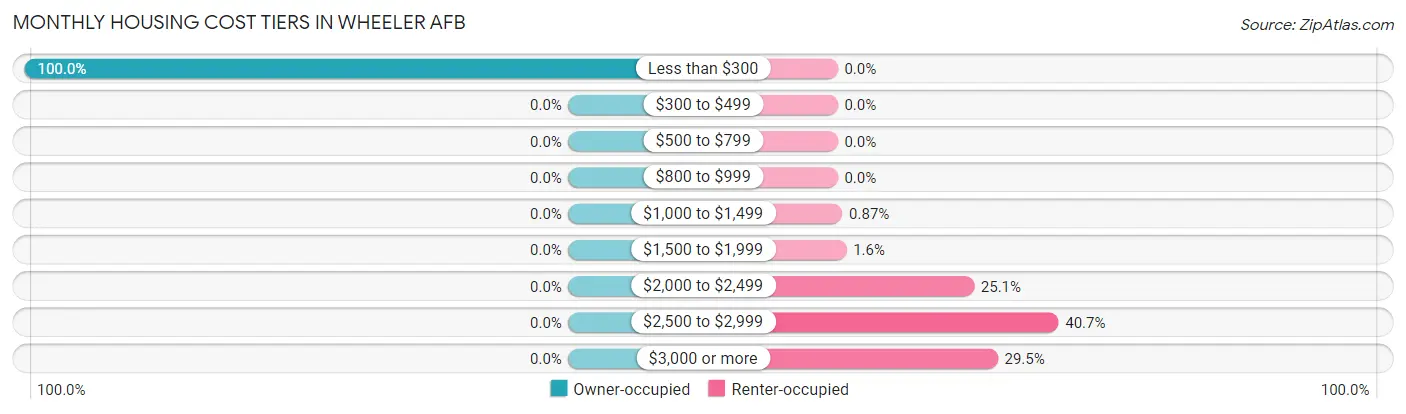
| Monthly Cost | Owner-occupied | Renter-occupied |
| Less than $300 | 4 (100.0%) | 0 (0.0%) |
| $300 to $499 | 0 (0.0%) | 0 (0.0%) |
| $500 to $799 | 0 (0.0%) | 0 (0.0%) |
| $800 to $999 | 0 (0.0%) | 0 (0.0%) |
| $1,000 to $1,499 | 0 (0.0%) | 7 (0.9%) |
| $1,500 to $1,999 | 0 (0.0%) | 13 (1.6%) |
| $2,000 to $2,499 | 0 (0.0%) | 202 (25.1%) |
| $2,500 to $2,999 | 0 (0.0%) | 327 (40.7%) |
| $3,000 or more | 0 (0.0%) | 237 (29.5%) |
| Total | 4 (100.0%) | 804 (100.0%) |
Physical Housing Characteristics in Wheeler AFB
Housing Structures in Wheeler AFB
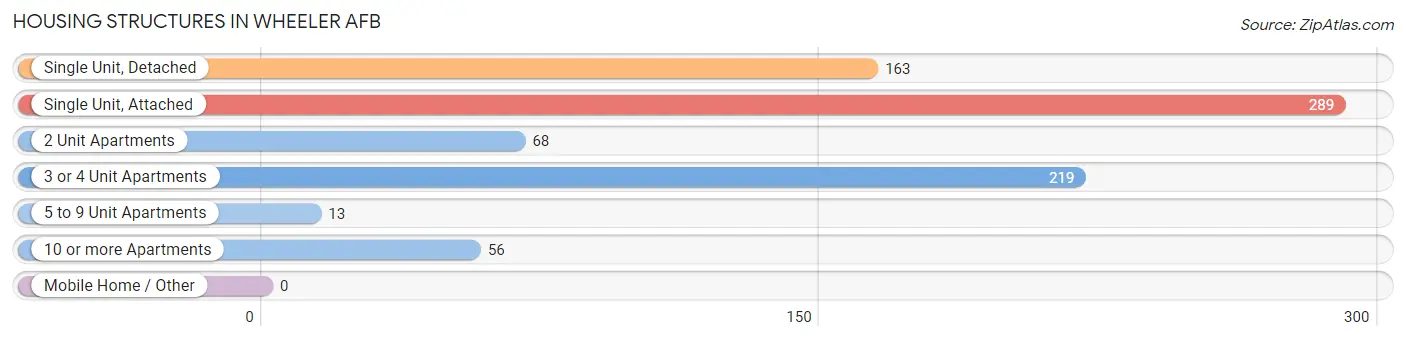
| Structure Type | # Housing Units | % Housing Units |
| Single Unit, Detached | 163 | 20.2% |
| Single Unit, Attached | 289 | 35.8% |
| 2 Unit Apartments | 68 | 8.4% |
| 3 or 4 Unit Apartments | 219 | 27.1% |
| 5 to 9 Unit Apartments | 13 | 1.6% |
| 10 or more Apartments | 56 | 6.9% |
| Mobile Home / Other | 0 | 0.0% |
| Total | 808 | 100.0% |
Housing Structures by Occupancy in Wheeler AFB
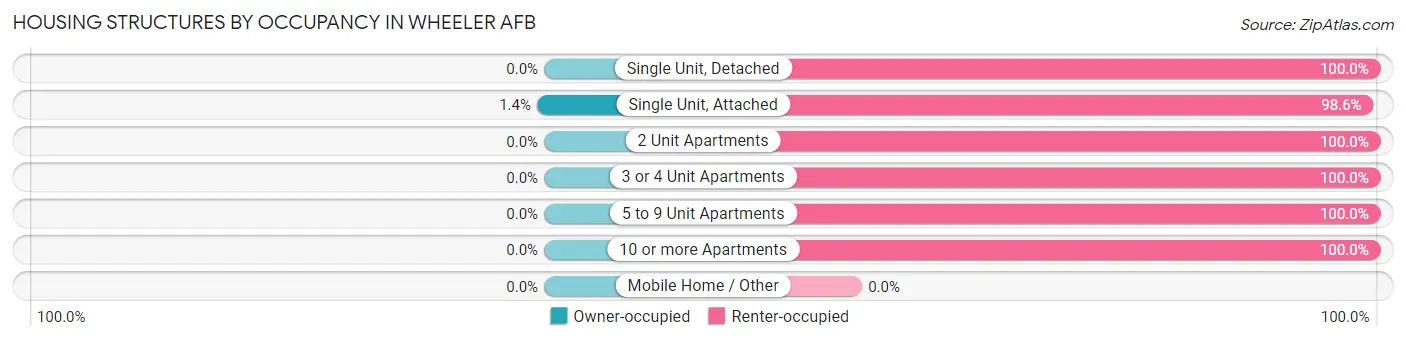
| Structure Type | Owner-occupied | Renter-occupied |
| Single Unit, Detached | 0 (0.0%) | 163 (100.0%) |
| Single Unit, Attached | 4 (1.4%) | 285 (98.6%) |
| 2 Unit Apartments | 0 (0.0%) | 68 (100.0%) |
| 3 or 4 Unit Apartments | 0 (0.0%) | 219 (100.0%) |
| 5 to 9 Unit Apartments | 0 (0.0%) | 13 (100.0%) |
| 10 or more Apartments | 0 (0.0%) | 56 (100.0%) |
| Mobile Home / Other | 0 (0.0%) | 0 (0.0%) |
| Total | 4 (0.5%) | 804 (99.5%) |
Housing Structures by Number of Rooms in Wheeler AFB
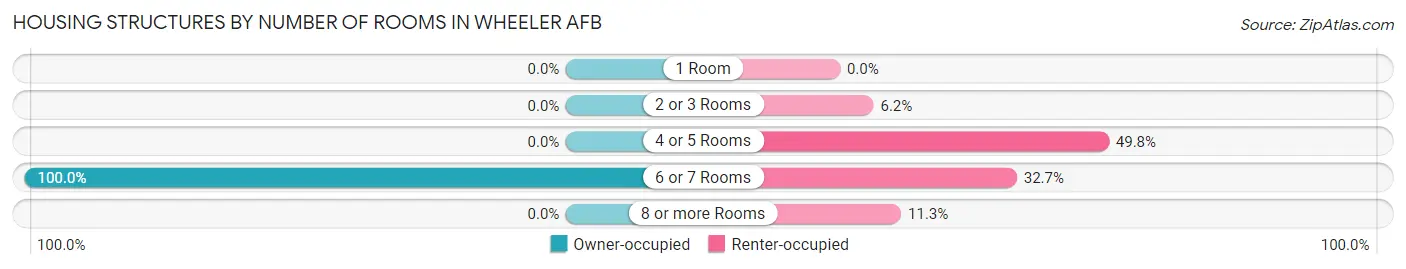
| Number of Rooms | Owner-occupied | Renter-occupied |
| 1 Room | 0 (0.0%) | 0 (0.0%) |
| 2 or 3 Rooms | 0 (0.0%) | 50 (6.2%) |
| 4 or 5 Rooms | 0 (0.0%) | 400 (49.7%) |
| 6 or 7 Rooms | 4 (100.0%) | 263 (32.7%) |
| 8 or more Rooms | 0 (0.0%) | 91 (11.3%) |
| Total | 4 (100.0%) | 804 (100.0%) |
Housing Structure by Heating Type in Wheeler AFB
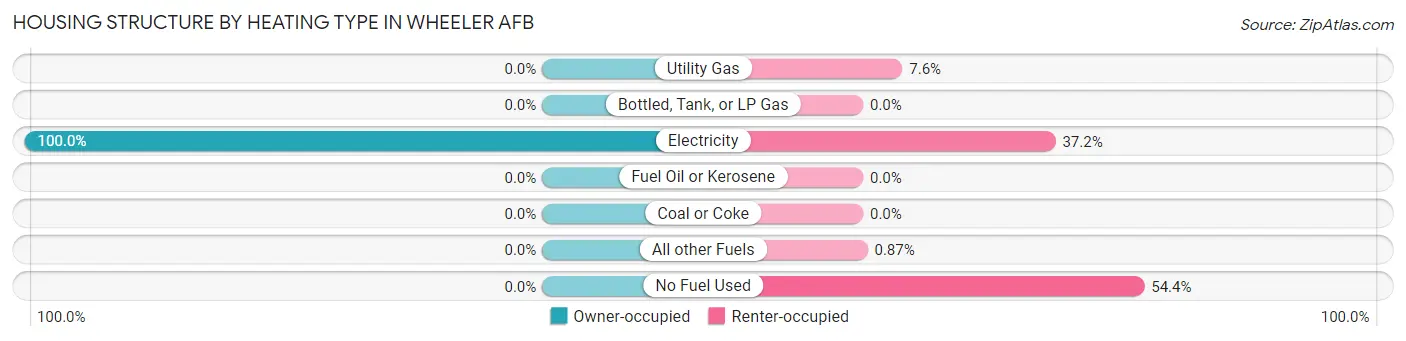
| Heating Type | Owner-occupied | Renter-occupied |
| Utility Gas | 0 (0.0%) | 61 (7.6%) |
| Bottled, Tank, or LP Gas | 0 (0.0%) | 0 (0.0%) |
| Electricity | 4 (100.0%) | 299 (37.2%) |
| Fuel Oil or Kerosene | 0 (0.0%) | 0 (0.0%) |
| Coal or Coke | 0 (0.0%) | 0 (0.0%) |
| All other Fuels | 0 (0.0%) | 7 (0.9%) |
| No Fuel Used | 0 (0.0%) | 437 (54.3%) |
| Total | 4 (100.0%) | 804 (100.0%) |
Household Vehicle Usage in Wheeler AFB
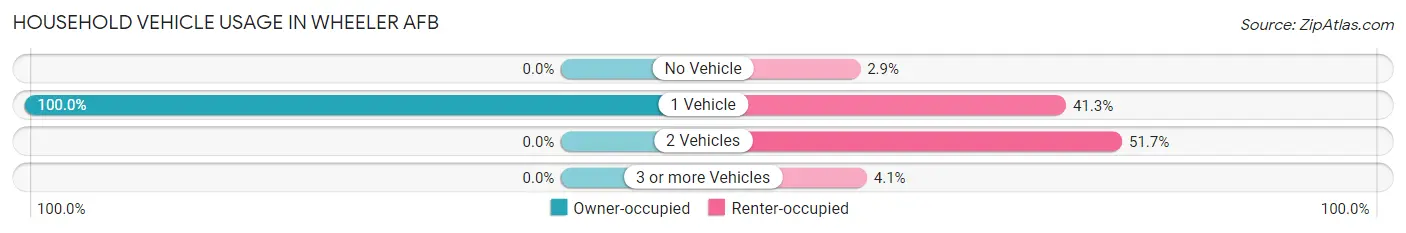
| Vehicles per Household | Owner-occupied | Renter-occupied |
| No Vehicle | 0 (0.0%) | 23 (2.9%) |
| 1 Vehicle | 4 (100.0%) | 332 (41.3%) |
| 2 Vehicles | 0 (0.0%) | 416 (51.7%) |
| 3 or more Vehicles | 0 (0.0%) | 33 (4.1%) |
| Total | 4 (100.0%) | 804 (100.0%) |
Real Estate & Mortgages in Wheeler AFB
Real Estate and Mortgage Overview in Wheeler AFB
| Characteristic | Without Mortgage | With Mortgage |
| Housing Units | 4 | 0 |
| Median Property Value | - | - |
| Median Household Income | - | - |
| Monthly Housing Costs | - | - |
| Real Estate Taxes | - | - |
Property Value by Mortgage Status in Wheeler AFB
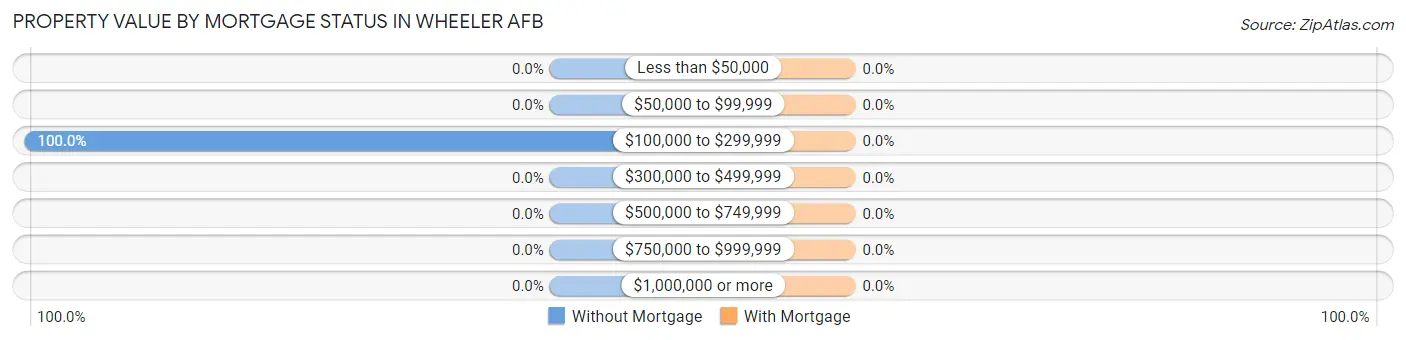
| Property Value | Without Mortgage | With Mortgage |
| Less than $50,000 | 0 (0.0%) | 0 (0.0%) |
| $50,000 to $99,999 | 0 (0.0%) | 0 (0.0%) |
| $100,000 to $299,999 | 4 (100.0%) | 0 (0.0%) |
| $300,000 to $499,999 | 0 (0.0%) | 0 (0.0%) |
| $500,000 to $749,999 | 0 (0.0%) | 0 (0.0%) |
| $750,000 to $999,999 | 0 (0.0%) | 0 (0.0%) |
| $1,000,000 or more | 0 (0.0%) | 0 (0.0%) |
| Total | 4 (100.0%) | 0 (0.0%) |
Household Income by Mortgage Status in Wheeler AFB
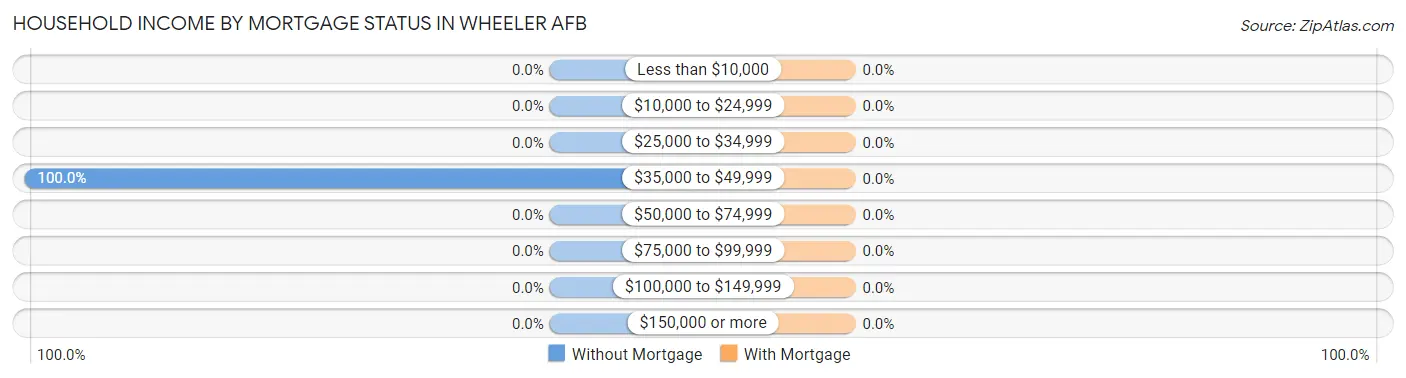
| Household Income | Without Mortgage | With Mortgage |
| Less than $10,000 | 0 (0.0%) | 0 (0.0%) |
| $10,000 to $24,999 | 0 (0.0%) | 0 (0.0%) |
| $25,000 to $34,999 | 0 (0.0%) | 0 (0.0%) |
| $35,000 to $49,999 | 4 (100.0%) | 0 (0.0%) |
| $50,000 to $74,999 | 0 (0.0%) | 0 (0.0%) |
| $75,000 to $99,999 | 0 (0.0%) | 0 (0.0%) |
| $100,000 to $149,999 | 0 (0.0%) | 0 (0.0%) |
| $150,000 or more | 0 (0.0%) | 0 (0.0%) |
| Total | 4 (100.0%) | 0 (0.0%) |
Property Value to Household Income Ratio in Wheeler AFB
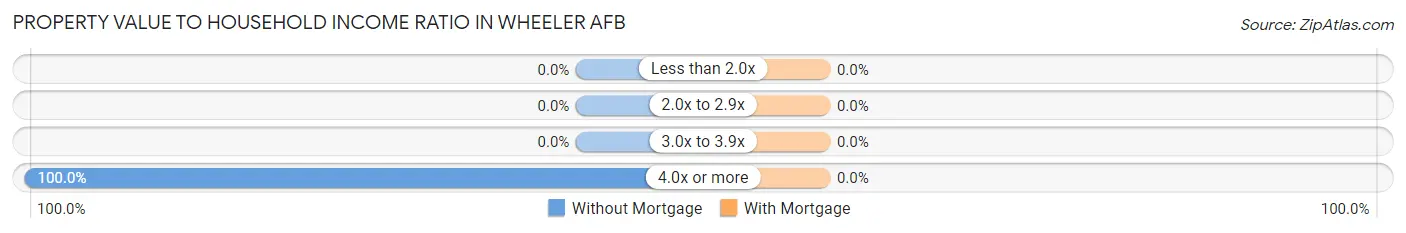
| Value-to-Income Ratio | Without Mortgage | With Mortgage |
| Less than 2.0x | 0 (0.0%) | 0 (0.0%) |
| 2.0x to 2.9x | 0 (0.0%) | 0 (0.0%) |
| 3.0x to 3.9x | 0 (0.0%) | 0 (0.0%) |
| 4.0x or more | 4 (100.0%) | 0 (0.0%) |
| Total | 4 (100.0%) | 0 (0.0%) |
Real Estate Taxes by Mortgage Status in Wheeler AFB
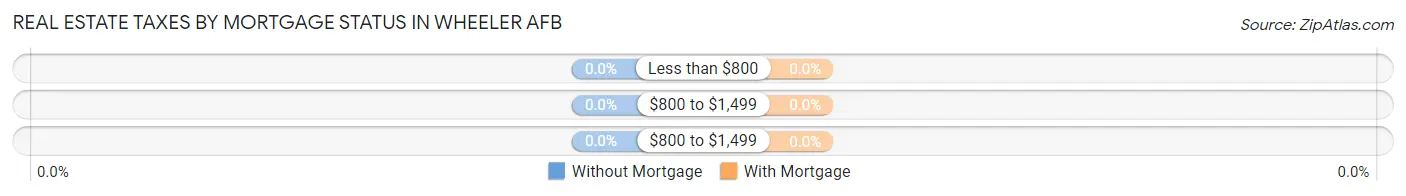
| Property Taxes | Without Mortgage | With Mortgage |
| Less than $800 | 0 (0.0%) | 0 (0.0%) |
| $800 to $1,499 | 0 (0.0%) | 0 (0.0%) |
| $800 to $1,499 | 0 (0.0%) | 0 (0.0%) |
| Total | 4 (100.0%) | 0 (0.0%) |
Health & Disability in Wheeler AFB
Health Insurance Coverage by Age in Wheeler AFB
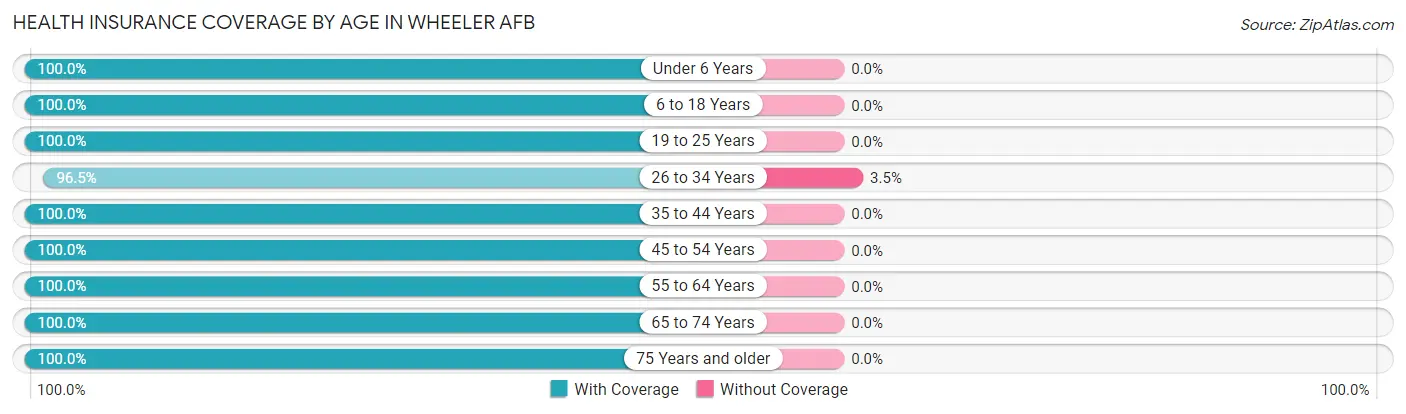
| Age Bracket | With Coverage | Without Coverage |
| Under 6 Years | 329 (100.0%) | 0 (0.0%) |
| 6 to 18 Years | 298 (100.0%) | 0 (0.0%) |
| 19 to 25 Years | 232 (100.0%) | 0 (0.0%) |
| 26 to 34 Years | 192 (96.5%) | 7 (3.5%) |
| 35 to 44 Years | 117 (100.0%) | 0 (0.0%) |
| 45 to 54 Years | 187 (100.0%) | 0 (0.0%) |
| 55 to 64 Years | 11 (100.0%) | 0 (0.0%) |
| 65 to 74 Years | 5 (100.0%) | 0 (0.0%) |
| 75 Years and older | 7 (100.0%) | 0 (0.0%) |
| Total | 1,378 (99.5%) | 7 (0.5%) |
Health Insurance Coverage by Citizenship Status in Wheeler AFB
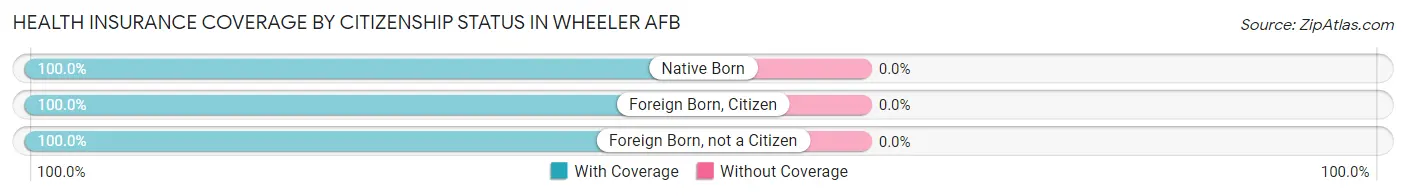
| Citizenship Status | With Coverage | Without Coverage |
| Native Born | 329 (100.0%) | 0 (0.0%) |
| Foreign Born, Citizen | 298 (100.0%) | 0 (0.0%) |
| Foreign Born, not a Citizen | 232 (100.0%) | 0 (0.0%) |
Health Insurance Coverage by Household Income in Wheeler AFB
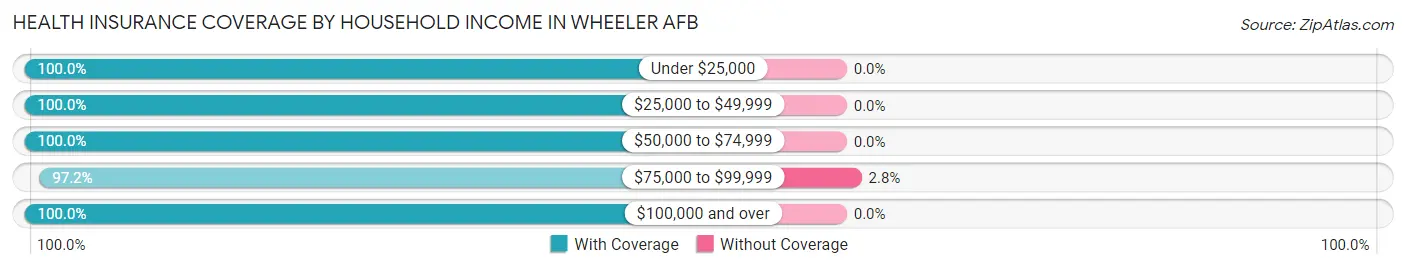
| Household Income | With Coverage | Without Coverage |
| Under $25,000 | 76 (100.0%) | 0 (0.0%) |
| $25,000 to $49,999 | 323 (100.0%) | 0 (0.0%) |
| $50,000 to $74,999 | 222 (100.0%) | 0 (0.0%) |
| $75,000 to $99,999 | 246 (97.2%) | 7 (2.8%) |
| $100,000 and over | 511 (100.0%) | 0 (0.0%) |
Public vs Private Health Insurance Coverage by Age in Wheeler AFB
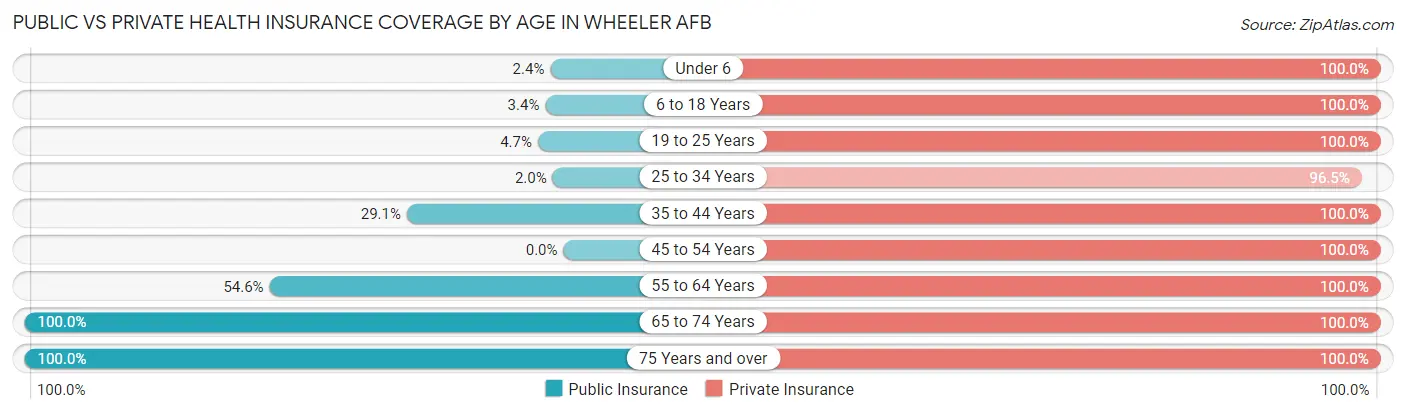
| Age Bracket | Public Insurance | Private Insurance |
| Under 6 | 8 (2.4%) | 329 (100.0%) |
| 6 to 18 Years | 10 (3.4%) | 298 (100.0%) |
| 19 to 25 Years | 11 (4.7%) | 232 (100.0%) |
| 25 to 34 Years | 4 (2.0%) | 192 (96.5%) |
| 35 to 44 Years | 34 (29.1%) | 117 (100.0%) |
| 45 to 54 Years | 0 (0.0%) | 187 (100.0%) |
| 55 to 64 Years | 6 (54.5%) | 11 (100.0%) |
| 65 to 74 Years | 5 (100.0%) | 5 (100.0%) |
| 75 Years and over | 7 (100.0%) | 7 (100.0%) |
| Total | 85 (6.1%) | 1,378 (99.5%) |
Disability Status by Sex by Age in Wheeler AFB
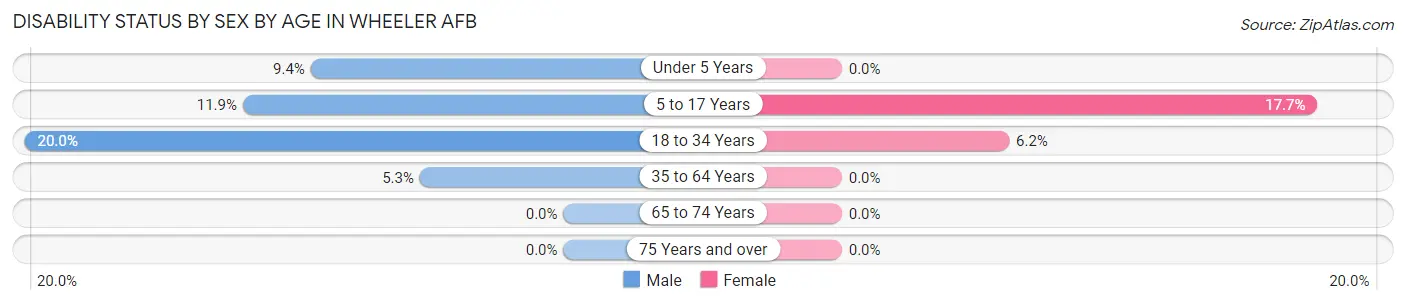
| Age Bracket | Male | Female |
| Under 5 Years | 12 (9.4%) | 0 (0.0%) |
| 5 to 17 Years | 15 (11.9%) | 39 (17.6%) |
| 18 to 34 Years | 24 (20.0%) | 20 (6.2%) |
| 35 to 64 Years | 9 (5.3%) | 0 (0.0%) |
| 65 to 74 Years | 0 (0.0%) | 0 (0.0%) |
| 75 Years and over | 0 (0.0%) | 0 (0.0%) |
Disability Class by Sex by Age in Wheeler AFB
Disability Class: Hearing Difficulty
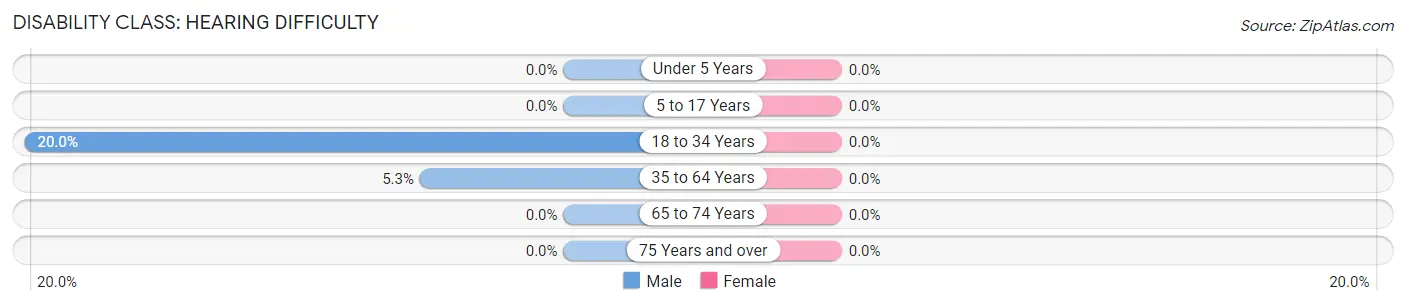
| Age Bracket | Male | Female |
| Under 5 Years | 0 (0.0%) | 0 (0.0%) |
| 5 to 17 Years | 0 (0.0%) | 0 (0.0%) |
| 18 to 34 Years | 24 (20.0%) | 0 (0.0%) |
| 35 to 64 Years | 9 (5.3%) | 0 (0.0%) |
| 65 to 74 Years | 0 (0.0%) | 0 (0.0%) |
| 75 Years and over | 0 (0.0%) | 0 (0.0%) |
Disability Class: Vision Difficulty
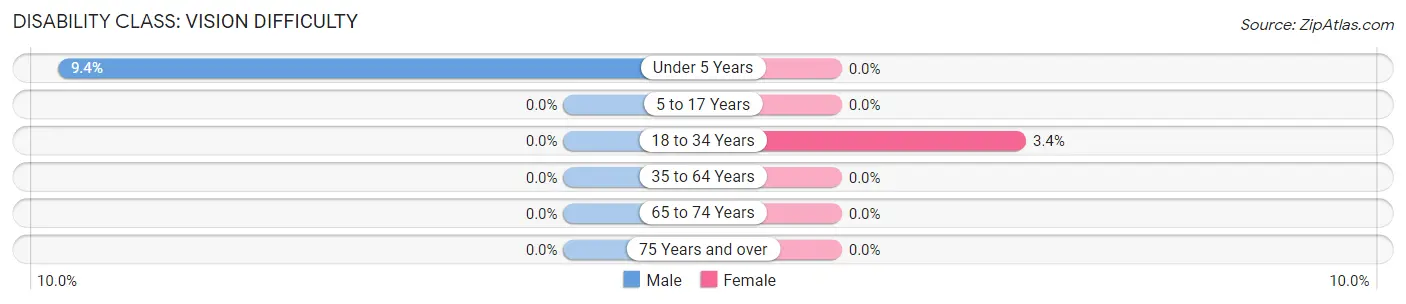
| Age Bracket | Male | Female |
| Under 5 Years | 12 (9.4%) | 0 (0.0%) |
| 5 to 17 Years | 0 (0.0%) | 0 (0.0%) |
| 18 to 34 Years | 0 (0.0%) | 11 (3.4%) |
| 35 to 64 Years | 0 (0.0%) | 0 (0.0%) |
| 65 to 74 Years | 0 (0.0%) | 0 (0.0%) |
| 75 Years and over | 0 (0.0%) | 0 (0.0%) |
Disability Class: Cognitive Difficulty
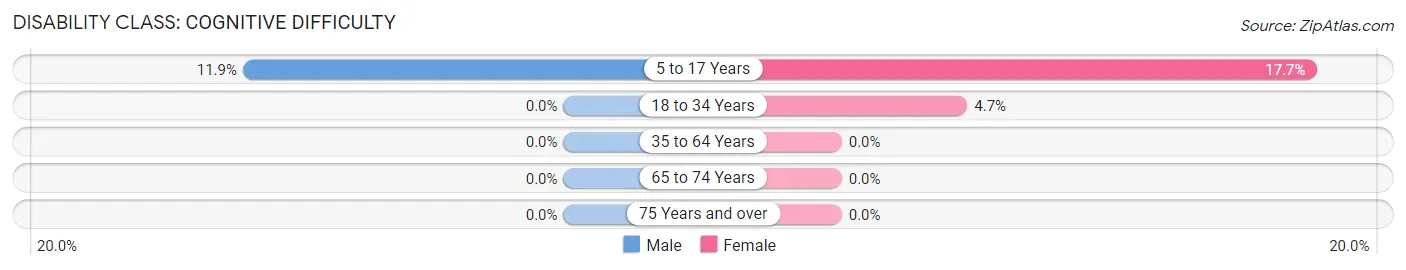
| Age Bracket | Male | Female |
| 5 to 17 Years | 15 (11.9%) | 39 (17.6%) |
| 18 to 34 Years | 0 (0.0%) | 15 (4.7%) |
| 35 to 64 Years | 0 (0.0%) | 0 (0.0%) |
| 65 to 74 Years | 0 (0.0%) | 0 (0.0%) |
| 75 Years and over | 0 (0.0%) | 0 (0.0%) |
Disability Class: Ambulatory Difficulty
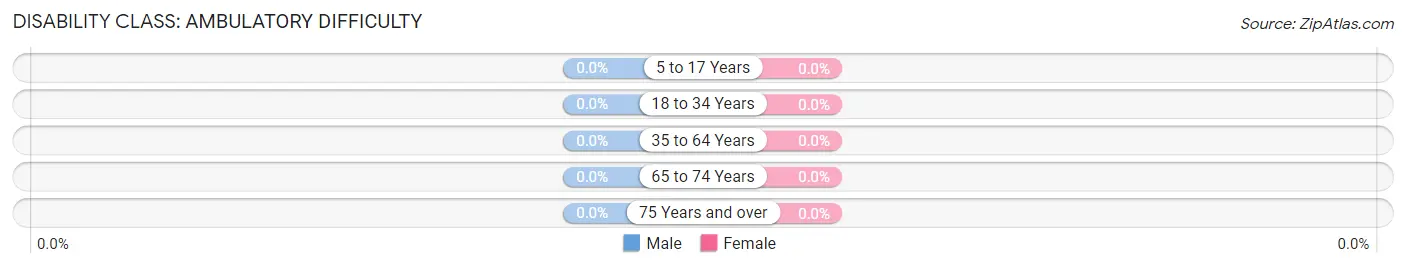
| Age Bracket | Male | Female |
| 5 to 17 Years | 0 (0.0%) | 0 (0.0%) |
| 18 to 34 Years | 0 (0.0%) | 0 (0.0%) |
| 35 to 64 Years | 0 (0.0%) | 0 (0.0%) |
| 65 to 74 Years | 0 (0.0%) | 0 (0.0%) |
| 75 Years and over | 0 (0.0%) | 0 (0.0%) |
Disability Class: Self-Care Difficulty
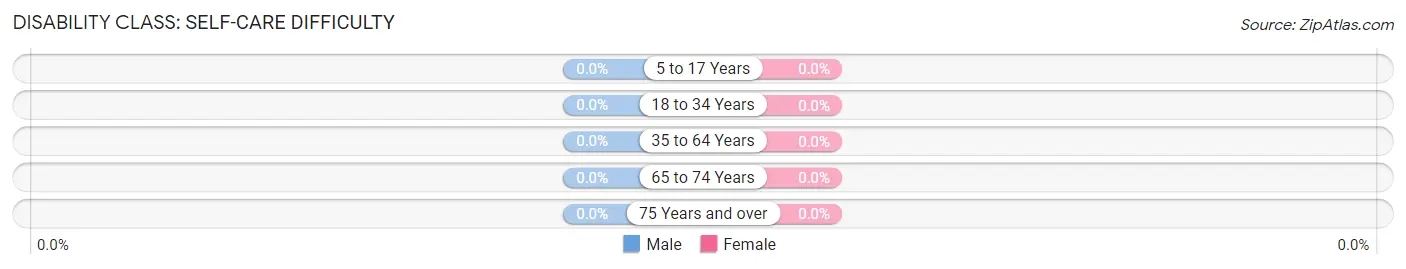
| Age Bracket | Male | Female |
| 5 to 17 Years | 0 (0.0%) | 0 (0.0%) |
| 18 to 34 Years | 0 (0.0%) | 0 (0.0%) |
| 35 to 64 Years | 0 (0.0%) | 0 (0.0%) |
| 65 to 74 Years | 0 (0.0%) | 0 (0.0%) |
| 75 Years and over | 0 (0.0%) | 0 (0.0%) |
Technology Access in Wheeler AFB
Computing Device Access in Wheeler AFB
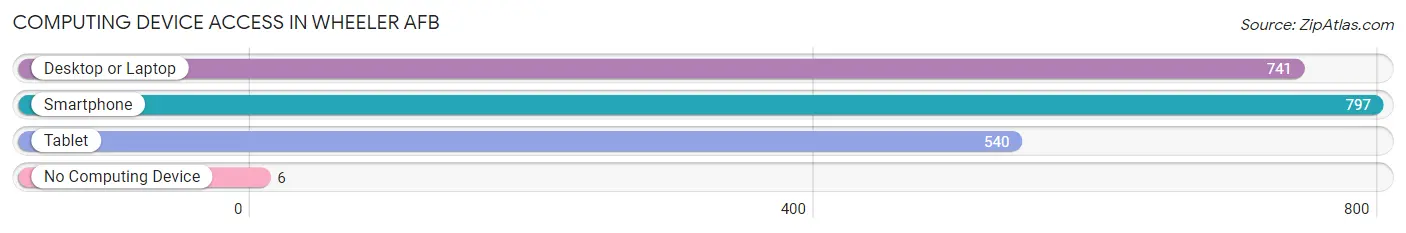
| Device Type | # Households | % Households |
| Desktop or Laptop | 741 | 91.7% |
| Smartphone | 797 | 98.6% |
| Tablet | 540 | 66.8% |
| No Computing Device | 6 | 0.7% |
| Total | 808 | 100.0% |
Internet Access in Wheeler AFB
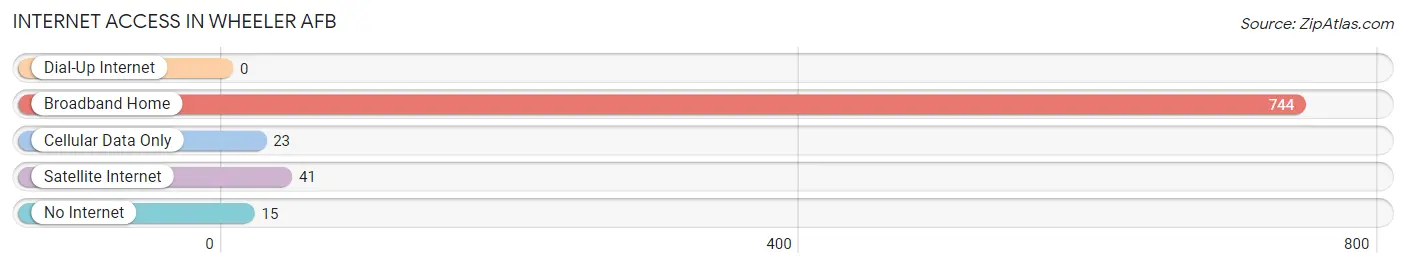
| Internet Type | # Households | % Households |
| Dial-Up Internet | 0 | 0.0% |
| Broadband Home | 744 | 92.1% |
| Cellular Data Only | 23 | 2.9% |
| Satellite Internet | 41 | 5.1% |
| No Internet | 15 | 1.9% |
| Total | 808 | 100.0% |
Wheeler AFB Summary
Wheeler Army Airfield, located in the city of Wahiawa, Hawaii, is a United States Army airfield and the home of the 25th Infantry Division. It is the only active military airfield on the island of Oahu and is the oldest airfield in the state of Hawaii. The airfield was originally established in 1922 as a training base for the Army Air Corps and was named after Major Sheldon H. Wheeler, a World War I aviator who was killed in action in France in 1918.
History
Wheeler Army Airfield was established in 1922 as a training base for the Army Air Corps. It was named after Major Sheldon H. Wheeler, a World War I aviator who was killed in action in France in 1918. The airfield was initially used as a training base for the Army Air Corps and was later used as a staging area for the Pacific Theater during World War II. During the war, the airfield was used to launch bombing raids against Japanese targets in the Pacific. After the war, the airfield was used as a staging area for the Korean War and the Vietnam War.
In the late 1950s, the airfield was transferred to the United States Air Force and was used as a base for the Strategic Air Command. In the 1960s, the airfield was transferred back to the Army and was used as a base for the 25th Infantry Division. The airfield has since been used as a staging area for operations in Iraq and Afghanistan.
Geography
Wheeler Army Airfield is located in the city of Wahiawa, Hawaii, on the island of Oahu. The airfield is situated on the northern side of the island, approximately 20 miles northwest of Honolulu. The airfield is surrounded by the Waianae Mountains to the west and the Koolau Mountains to the east. The airfield is located at an elevation of approximately 1,000 feet above sea level.
Economy
The economy of Wheeler Army Airfield is largely dependent on the military presence at the airfield. The airfield is home to the 25th Infantry Division and provides employment opportunities for military personnel and civilian contractors. The airfield also serves as a staging area for military operations in the Pacific region. In addition, the airfield is home to a number of businesses that provide services to the military and civilian personnel stationed at the airfield.
Demographics
As of the 2010 census, the population of Wheeler Army Airfield was 1,845. The racial makeup of the airfield was 75.3% White, 11.2% Asian, 8.2% African American, 0.7% Native American, 0.2% Pacific Islander, and 4.6% from other races. The median household income was $45,938 and the median family income was $50,938. The per capita income was $20,938. The population was spread out with 18.2% under the age of 18, 8.2% from 18 to 24, 33.2% from 25 to 44, 25.2% from 45 to 64, and 15.2% who were 65 years of age or older.
Common Questions
What is Per Capita Income in Wheeler AFB?
Per Capita income in Wheeler AFB is $31,691.
What is the Median Family Income in Wheeler AFB?
Median Family Income in Wheeler AFB is $77,500.
What is the Median Household income in Wheeler AFB?
Median Household Income in Wheeler AFB is $74,844.
What is Income or Wage Gap in Wheeler AFB?
Income or Wage Gap in Wheeler AFB is 32.9%.
Women in Wheeler AFB earn 67.1 cents for every dollar earned by a man.
What is Inequality or Gini Index in Wheeler AFB?
Inequality or Gini Index in Wheeler AFB is 0.31.
What is the Total Population of Wheeler AFB?
Total Population of Wheeler AFB is 2,219.
What is the Total Male Population of Wheeler AFB?
Total Male Population of Wheeler AFB is 1,262.
What is the Total Female Population of Wheeler AFB?
Total Female Population of Wheeler AFB is 957.
What is the Ratio of Males per 100 Females in Wheeler AFB?
There are 131.87 Males per 100 Females in Wheeler AFB.
What is the Ratio of Females per 100 Males in Wheeler AFB?
There are 75.83 Females per 100 Males in Wheeler AFB.
What is the Median Population Age in Wheeler AFB?
Median Population Age in Wheeler AFB is 24.6 Years.
What is the Average Family Size in Wheeler AFB
Average Family Size in Wheeler AFB is 2.7 People.
What is the Average Household Size in Wheeler AFB
Average Household Size in Wheeler AFB is 2.5 People.
How Large is the Labor Force in Wheeler AFB?
There are 1,325 People in the Labor Forcein in Wheeler AFB.
What is the Percentage of People in the Labor Force in Wheeler AFB?
81.2% of People are in the Labor Force in Wheeler AFB.
What is the Unemployment Rate in Wheeler AFB?
Unemployment Rate in Wheeler AFB is 8.6%.