Penney Farms, FL Map & Demographics
Penney Farms Map
Penney Farms Overview
$33,239
PER CAPITA INCOME
$87,039
AVG FAMILY INCOME
$63,333
AVG HOUSEHOLD INCOME
54.3%
WAGE / INCOME GAP [ % ]
45.7¢/ $1
WAGE / INCOME GAP [ $ ]
0.38
INEQUALITY / GINI INDEX
721
TOTAL POPULATION
314
MALE POPULATION
407
FEMALE POPULATION
77.15
MALES / 100 FEMALES
129.62
FEMALES / 100 MALES
76.5
MEDIAN AGE
2.5
AVG FAMILY SIZE
1.9
AVG HOUSEHOLD SIZE
61
LABOR FORCE [ PEOPLE ]
9.1%
PERCENT IN LABOR FORCE
Penney Farms Zip Codes
Income in Penney Farms
Income Overview in Penney Farms
Per Capita Income in Penney Farms is $33,239, while median incomes of families and households are $87,039 and $63,333 respectively.
| Characteristic | Number | Measure |
| Per Capita Income | 721 | $33,239 |
| Median Family Income | 173 | $87,039 |
| Mean Family Income | 173 | $97,011 |
| Median Household Income | 294 | $63,333 |
| Mean Household Income | 294 | $74,737 |
| Income Deficit | 173 | $0 |
| Wage / Income Gap (%) | 721 | 54.29% |
| Wage / Income Gap ($) | 721 | 45.71¢ per $1 |
| Gini / Inequality Index | 721 | 0.38 |
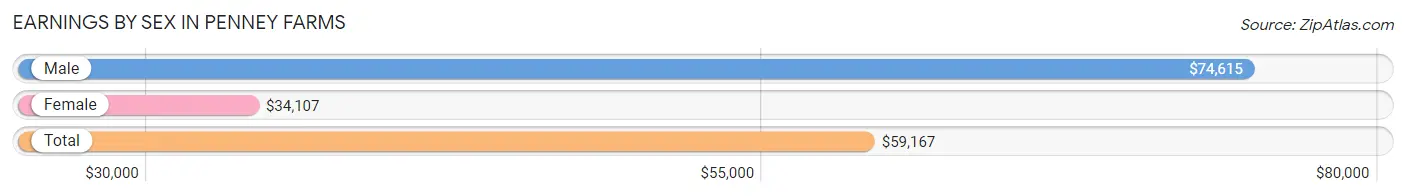
Earnings by Sex in Penney Farms
Average Earnings in Penney Farms are $59,167, $74,615 for men and $34,107 for women, a difference of 54.3%.
| Sex | Number | Average Earnings |
| Male | 42 (60.0%) | $74,615 |
| Female | 28 (40.0%) | $34,107 |
| Total | 70 (100.0%) | $59,167 |
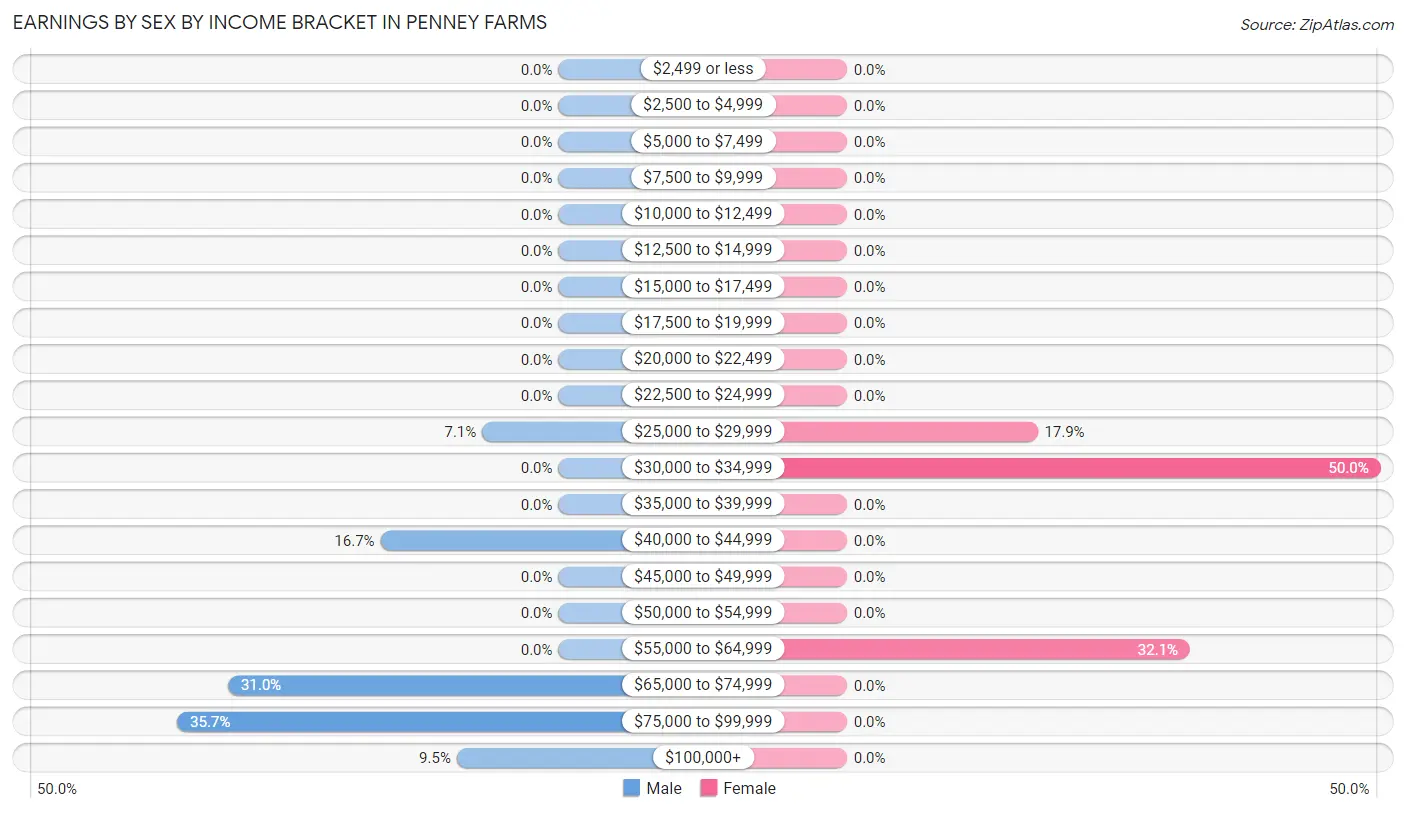
Earnings by Sex by Income Bracket in Penney Farms
The most common earnings brackets in Penney Farms are $75,000 to $99,999 for men (15 | 35.7%) and $30,000 to $34,999 for women (14 | 50.0%).
| Income | Male | Female |
| $2,499 or less | 0 (0.0%) | 0 (0.0%) |
| $2,500 to $4,999 | 0 (0.0%) | 0 (0.0%) |
| $5,000 to $7,499 | 0 (0.0%) | 0 (0.0%) |
| $7,500 to $9,999 | 0 (0.0%) | 0 (0.0%) |
| $10,000 to $12,499 | 0 (0.0%) | 0 (0.0%) |
| $12,500 to $14,999 | 0 (0.0%) | 0 (0.0%) |
| $15,000 to $17,499 | 0 (0.0%) | 0 (0.0%) |
| $17,500 to $19,999 | 0 (0.0%) | 0 (0.0%) |
| $20,000 to $22,499 | 0 (0.0%) | 0 (0.0%) |
| $22,500 to $24,999 | 0 (0.0%) | 0 (0.0%) |
| $25,000 to $29,999 | 3 (7.1%) | 5 (17.9%) |
| $30,000 to $34,999 | 0 (0.0%) | 14 (50.0%) |
| $35,000 to $39,999 | 0 (0.0%) | 0 (0.0%) |
| $40,000 to $44,999 | 7 (16.7%) | 0 (0.0%) |
| $45,000 to $49,999 | 0 (0.0%) | 0 (0.0%) |
| $50,000 to $54,999 | 0 (0.0%) | 0 (0.0%) |
| $55,000 to $64,999 | 0 (0.0%) | 9 (32.1%) |
| $65,000 to $74,999 | 13 (30.9%) | 0 (0.0%) |
| $75,000 to $99,999 | 15 (35.7%) | 0 (0.0%) |
| $100,000+ | 4 (9.5%) | 0 (0.0%) |
| Total | 42 (100.0%) | 28 (100.0%) |
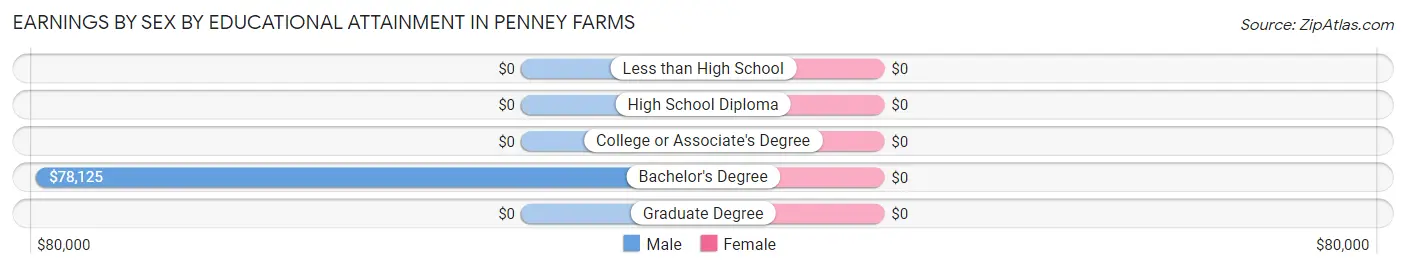
Earnings by Sex by Educational Attainment in Penney Farms
| Educational Attainment | Male Income | Female Income |
| Less than High School | - | - |
| High School Diploma | - | - |
| College or Associate's Degree | - | - |
| Bachelor's Degree | $78,125 | $0 |
| Graduate Degree | - | - |
| Total | $74,615 | $34,107 |
Family Income in Penney Farms
Family Income Brackets in Penney Farms
According to the Penney Farms family income data, there are 42 families falling into the $100,000 to $149,999 income range, which is the most common income bracket and makes up 24.3% of all families.
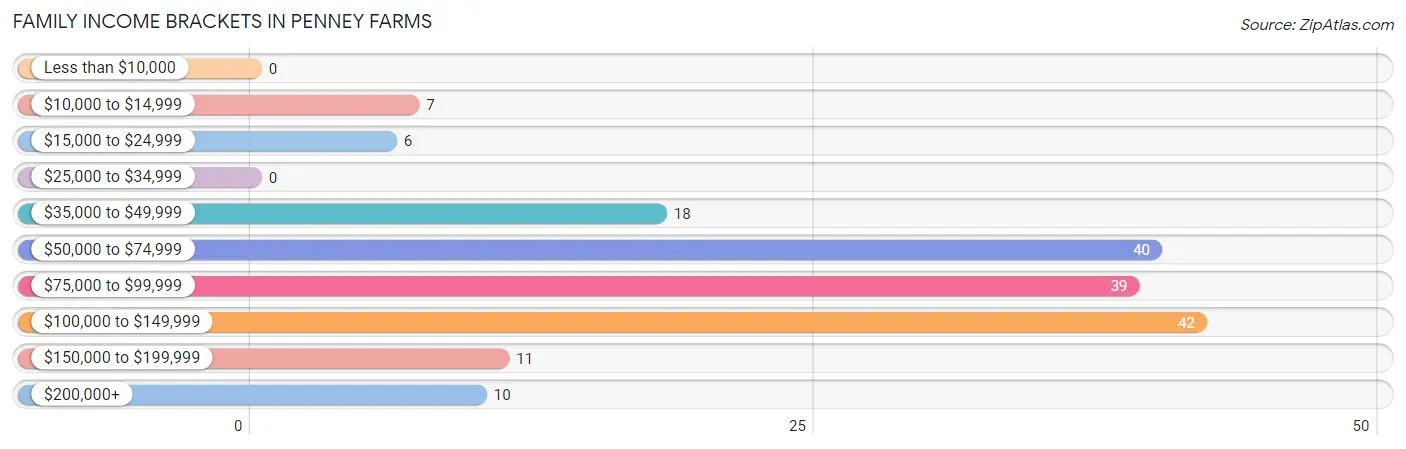
| Income Bracket | # Families | % Families |
| Less than $10,000 | 0 | 0.0% |
| $10,000 to $14,999 | 7 | 4.0% |
| $15,000 to $24,999 | 6 | 3.5% |
| $25,000 to $34,999 | 0 | 0.0% |
| $35,000 to $49,999 | 18 | 10.4% |
| $50,000 to $74,999 | 40 | 23.1% |
| $75,000 to $99,999 | 39 | 22.5% |
| $100,000 to $149,999 | 42 | 24.3% |
| $150,000 to $199,999 | 11 | 6.4% |
| $200,000+ | 10 | 5.8% |
Family Income by Famaliy Size in Penney Farms
2-person families (159 | 91.9%) account for the highest median family income in Penney Farms with $86,118 per family, while 2-person families (159 | 91.9%) have the highest median income of $43,059 per family member.
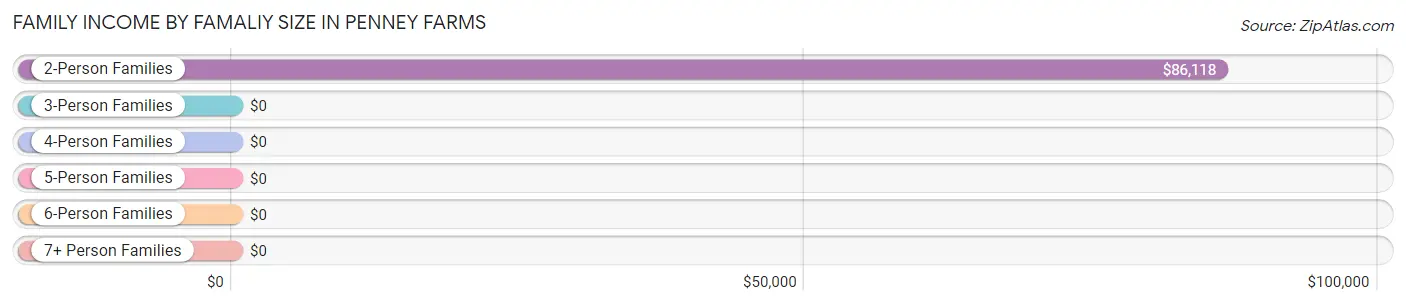
| Income Bracket | # Families | Median Income |
| 2-Person Families | 159 (91.9%) | $86,118 |
| 3-Person Families | 0 (0.0%) | $0 |
| 4-Person Families | 0 (0.0%) | $0 |
| 5-Person Families | 0 (0.0%) | $0 |
| 6-Person Families | 0 (0.0%) | $0 |
| 7+ Person Families | 14 (8.1%) | $0 |
| Total | 173 (100.0%) | $87,039 |
Family Income by Number of Earners in Penney Farms
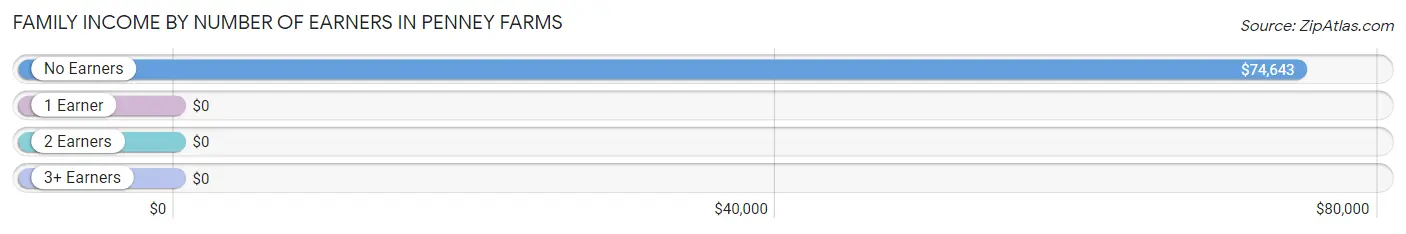
| Number of Earners | # Families | Median Income |
| No Earners | 140 (80.9%) | $74,643 |
| 1 Earner | 9 (5.2%) | $0 |
| 2 Earners | 24 (13.9%) | $0 |
| 3+ Earners | 0 (0.0%) | $0 |
| Total | 173 (100.0%) | $87,039 |
Household Income in Penney Farms
Household Income Brackets in Penney Farms
With 68 households falling in the category, the $50,000 to $74,999 income range is the most frequent in Penney Farms, accounting for 23.1% of all households. In contrast, only 3 households (1.0%) fall into the less than $10,000 income bracket, making it the least populous group.
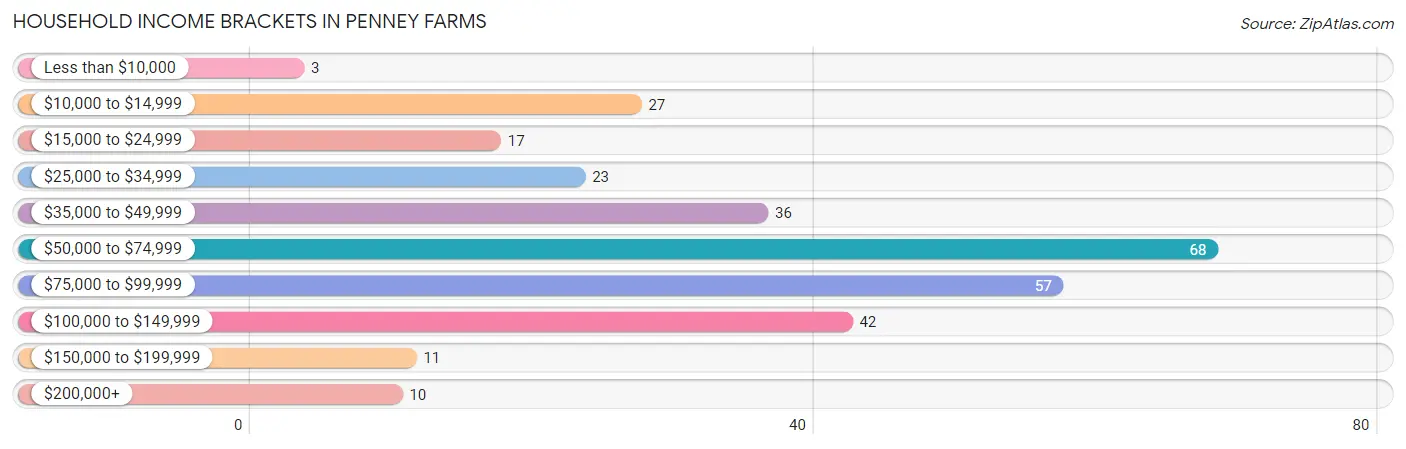
| Income Bracket | # Households | % Households |
| Less than $10,000 | 3 | 1.0% |
| $10,000 to $14,999 | 27 | 9.2% |
| $15,000 to $24,999 | 17 | 5.8% |
| $25,000 to $34,999 | 23 | 7.8% |
| $35,000 to $49,999 | 36 | 12.2% |
| $50,000 to $74,999 | 68 | 23.1% |
| $75,000 to $99,999 | 57 | 19.4% |
| $100,000 to $149,999 | 42 | 14.3% |
| $150,000 to $199,999 | 11 | 3.7% |
| $200,000+ | 10 | 3.4% |
Household Income by Householder Age in Penney Farms
The median household income in Penney Farms is $63,333, with the highest median household income of $62,857 found in the 65+ years age bracket for the primary householder. A total of 266 households (90.5%) fall into this category.
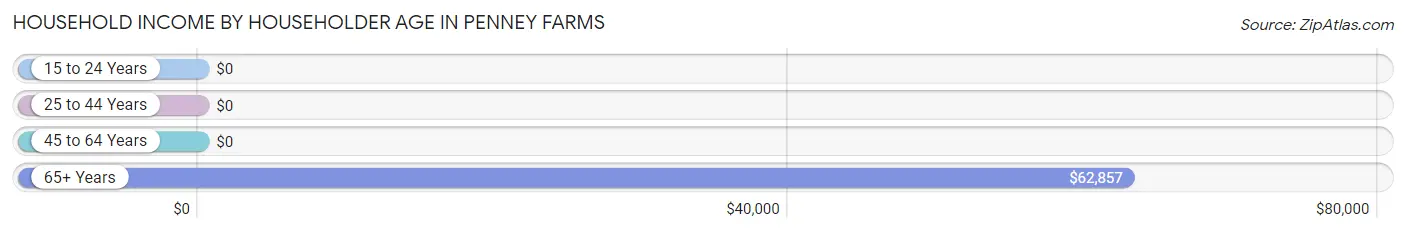
| Income Bracket | # Households | Median Income |
| 15 to 24 Years | 0 (0.0%) | $0 |
| 25 to 44 Years | 14 (4.8%) | $0 |
| 45 to 64 Years | 14 (4.8%) | $0 |
| 65+ Years | 266 (90.5%) | $62,857 |
| Total | 294 (100.0%) | $63,333 |
Poverty in Penney Farms
Income Below Poverty by Sex and Age in Penney Farms
With 11.3% poverty level for males and 8.0% for females among the residents of Penney Farms, 35 to 44 year old males and 55 to 64 year old females are the most vulnerable to poverty, with 30 males (69.8%) and 7 females (100.0%) in their respective age groups living below the poverty level.
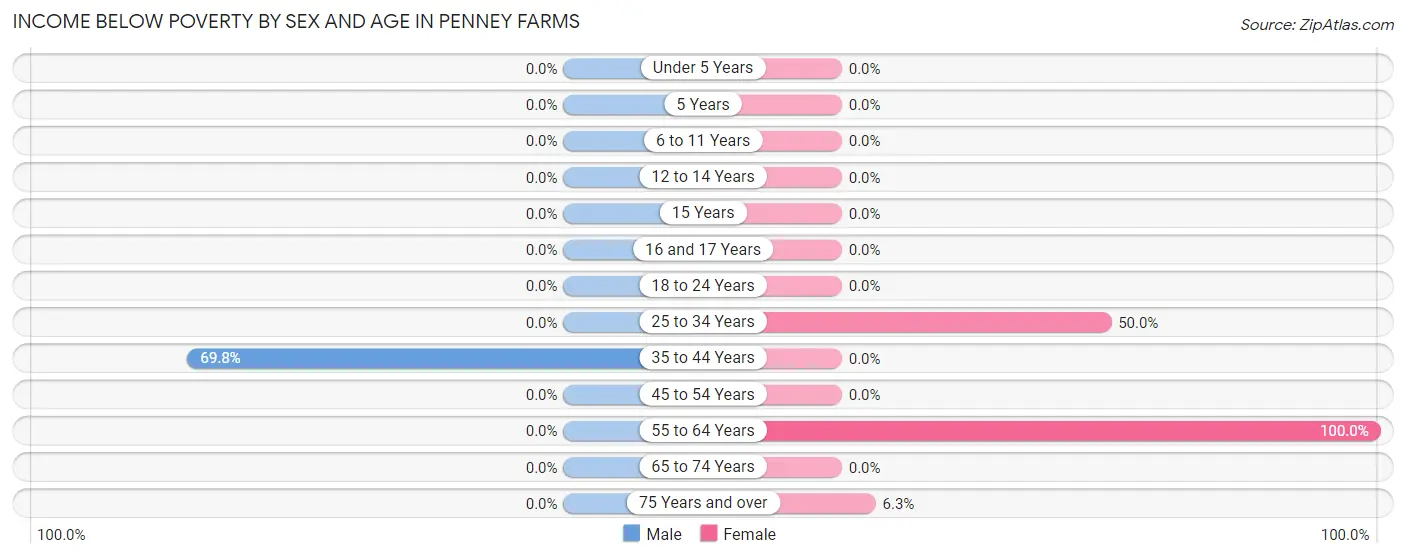
| Age Bracket | Male | Female |
| Under 5 Years | 0 (0.0%) | 0 (0.0%) |
| 5 Years | 0 (0.0%) | 0 (0.0%) |
| 6 to 11 Years | 0 (0.0%) | 0 (0.0%) |
| 12 to 14 Years | 0 (0.0%) | 0 (0.0%) |
| 15 Years | 0 (0.0%) | 0 (0.0%) |
| 16 and 17 Years | 0 (0.0%) | 0 (0.0%) |
| 18 to 24 Years | 0 (0.0%) | 0 (0.0%) |
| 25 to 34 Years | 0 (0.0%) | 7 (50.0%) |
| 35 to 44 Years | 30 (69.8%) | 0 (0.0%) |
| 45 to 54 Years | 0 (0.0%) | 0 (0.0%) |
| 55 to 64 Years | 0 (0.0%) | 7 (100.0%) |
| 65 to 74 Years | 0 (0.0%) | 0 (0.0%) |
| 75 Years and over | 0 (0.0%) | 12 (6.3%) |
| Total | 30 (11.3%) | 26 (8.0%) |
Income Above Poverty by Sex and Age in Penney Farms
According to the poverty statistics in Penney Farms, males aged under 5 years and females aged 15 years are the age groups that are most secure financially, with 100.0% of males and 100.0% of females in these age groups living above the poverty line.
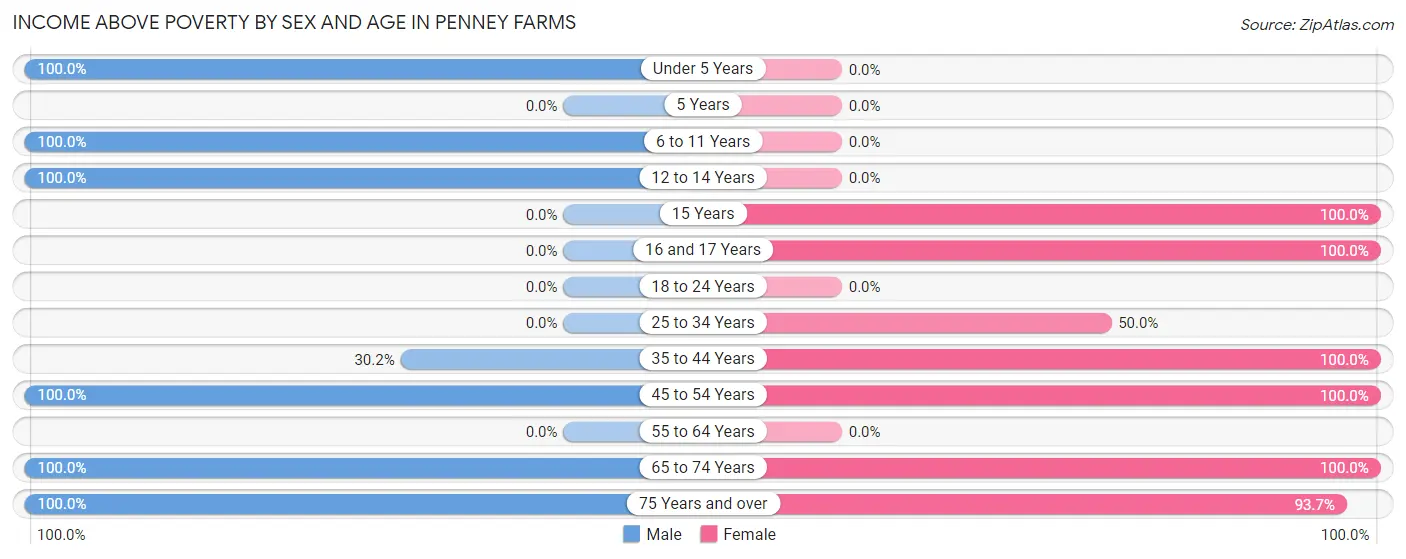
| Age Bracket | Male | Female |
| Under 5 Years | 14 (100.0%) | 0 (0.0%) |
| 5 Years | 0 (0.0%) | 0 (0.0%) |
| 6 to 11 Years | 12 (100.0%) | 0 (0.0%) |
| 12 to 14 Years | 12 (100.0%) | 0 (0.0%) |
| 15 Years | 0 (0.0%) | 12 (100.0%) |
| 16 and 17 Years | 0 (0.0%) | 22 (100.0%) |
| 18 to 24 Years | 0 (0.0%) | 0 (0.0%) |
| 25 to 34 Years | 0 (0.0%) | 7 (50.0%) |
| 35 to 44 Years | 13 (30.2%) | 14 (100.0%) |
| 45 to 54 Years | 7 (100.0%) | 9 (100.0%) |
| 55 to 64 Years | 0 (0.0%) | 0 (0.0%) |
| 65 to 74 Years | 36 (100.0%) | 55 (100.0%) |
| 75 Years and over | 142 (100.0%) | 179 (93.7%) |
| Total | 236 (88.7%) | 298 (92.0%) |
Income Below Poverty Among Married-Couple Families in Penney Farms
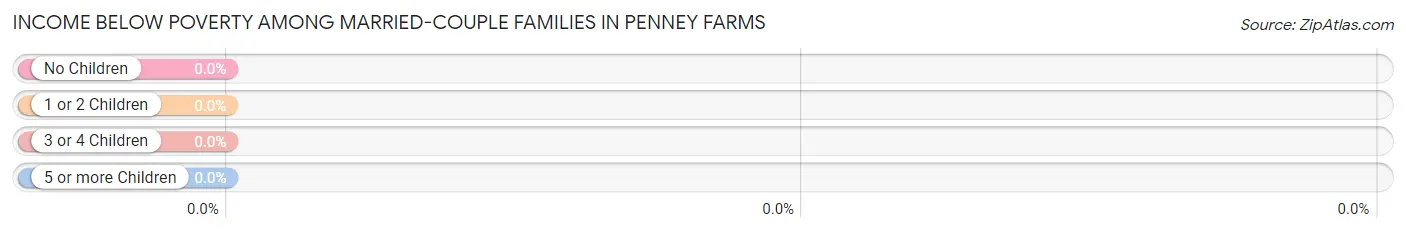
| Children | Above Poverty | Below Poverty |
| No Children | 136 (100.0%) | 0 (0.0%) |
| 1 or 2 Children | 0 (0.0%) | 0 (0.0%) |
| 3 or 4 Children | 0 (0.0%) | 0 (0.0%) |
| 5 or more Children | 14 (100.0%) | 0 (0.0%) |
| Total | 150 (100.0%) | 0 (0.0%) |
Income Below Poverty Among Single-Parent Households in Penney Farms
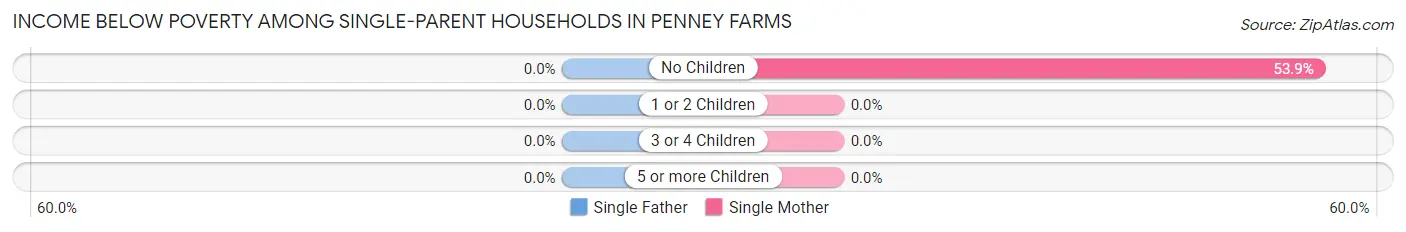
| Children | Single Father | Single Mother |
| No Children | 0 (0.0%) | 7 (53.8%) |
| 1 or 2 Children | 0 (0.0%) | 0 (0.0%) |
| 3 or 4 Children | 0 (0.0%) | 0 (0.0%) |
| 5 or more Children | 0 (0.0%) | 0 (0.0%) |
| Total | 0 (0.0%) | 7 (53.8%) |
Income Below Poverty Among Married-Couple vs Single-Parent Households in Penney Farms
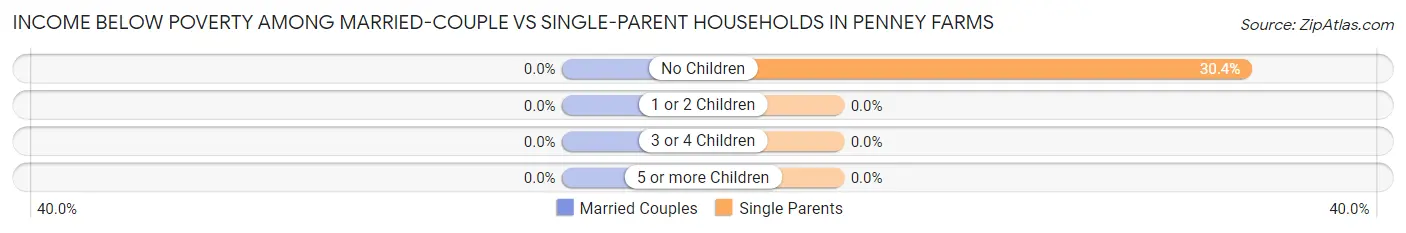
| Children | Married-Couple Families | Single-Parent Households |
| No Children | 0 (0.0%) | 7 (30.4%) |
| 1 or 2 Children | 0 (0.0%) | 0 (0.0%) |
| 3 or 4 Children | 0 (0.0%) | 0 (0.0%) |
| 5 or more Children | 0 (0.0%) | 0 (0.0%) |
| Total | 0 (0.0%) | 7 (30.4%) |
Race in Penney Farms
The most populous races in Penney Farms are White / Caucasian (670 | 92.9%), Black / African American (42 | 5.8%), and Hispanic or Latino (9 | 1.3%).
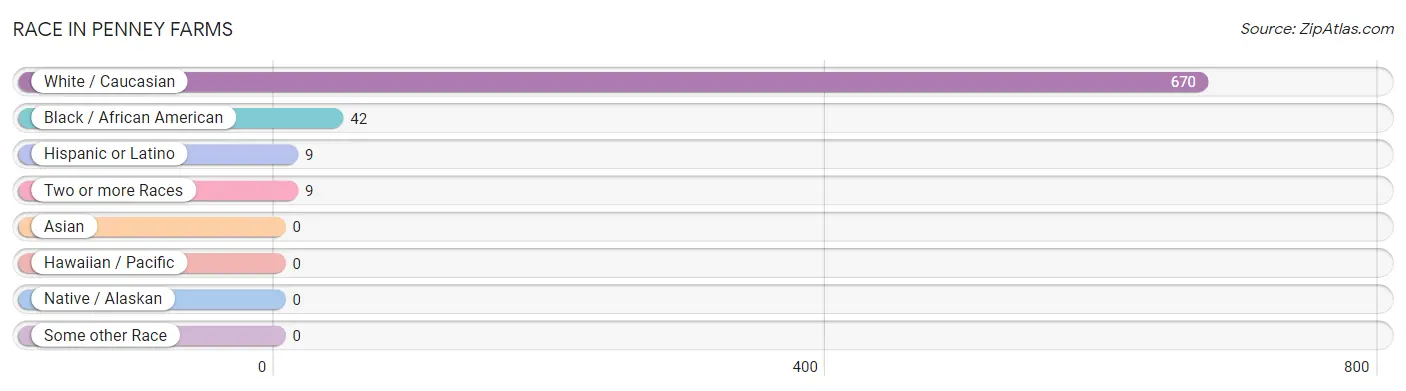
| Race | # Population | % Population |
| Asian | 0 | 0.0% |
| Black / African American | 42 | 5.8% |
| Hawaiian / Pacific | 0 | 0.0% |
| Hispanic or Latino | 9 | 1.3% |
| Native / Alaskan | 0 | 0.0% |
| White / Caucasian | 670 | 92.9% |
| Two or more Races | 9 | 1.3% |
| Some other Race | 0 | 0.0% |
| Total | 721 | 100.0% |
Ancestry in Penney Farms
The most populous ancestries reported in Penney Farms are English (122 | 16.9%), German (99 | 13.7%), American (70 | 9.7%), Irish (50 | 6.9%), and Scotch-Irish (44 | 6.1%), together accounting for 53.4% of all Penney Farms residents.
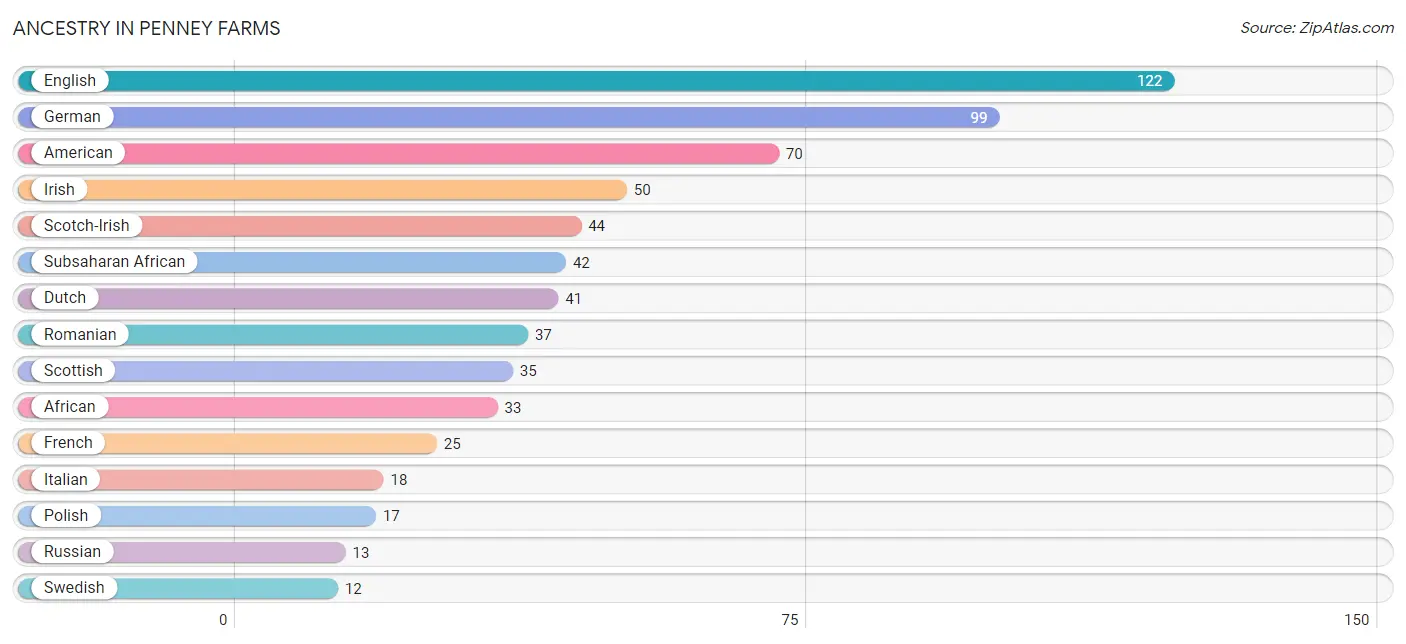
| Ancestry | # Population | % Population |
| African | 33 | 4.6% |
| American | 70 | 9.7% |
| Cuban | 9 | 1.3% |
| Czechoslovakian | 9 | 1.3% |
| Danish | 8 | 1.1% |
| Dutch | 41 | 5.7% |
| English | 122 | 16.9% |
| French | 25 | 3.5% |
| German | 99 | 13.7% |
| Hungarian | 6 | 0.8% |
| Irish | 50 | 6.9% |
| Italian | 18 | 2.5% |
| Northern European | 6 | 0.8% |
| Norwegian | 6 | 0.8% |
| Polish | 17 | 2.4% |
| Romanian | 37 | 5.1% |
| Russian | 13 | 1.8% |
| Scotch-Irish | 44 | 6.1% |
| Scottish | 35 | 4.9% |
| South African | 9 | 1.3% |
| Subsaharan African | 42 | 5.8% |
| Swedish | 12 | 1.7% |
| Swiss | 7 | 1.0% |
| Ukrainian | 9 | 1.3% |
| Welsh | 6 | 0.8% | View All 25 Rows |
Immigrants in Penney Farms
The most numerous immigrant groups reported in Penney Farms came from Africa (9 | 1.3%), Caribbean (9 | 1.3%), Cuba (9 | 1.3%), Latin America (9 | 1.3%), and South Africa (9 | 1.3%), together accounting for 6.2% of all Penney Farms residents.
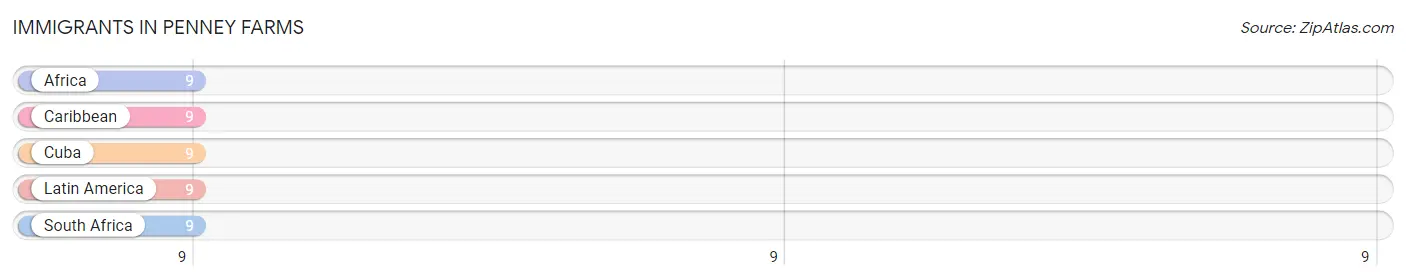
| Immigration Origin | # Population | % Population |
| Africa | 9 | 1.3% |
| Caribbean | 9 | 1.3% |
| Cuba | 9 | 1.3% |
| Latin America | 9 | 1.3% |
| South Africa | 9 | 1.3% | View All 5 Rows |
Sex and Age in Penney Farms
Sex and Age in Penney Farms
The most populous age groups in Penney Farms are 85 Years and over (63 | 20.1%) for men and 85 Years and over (123 | 30.2%) for women.
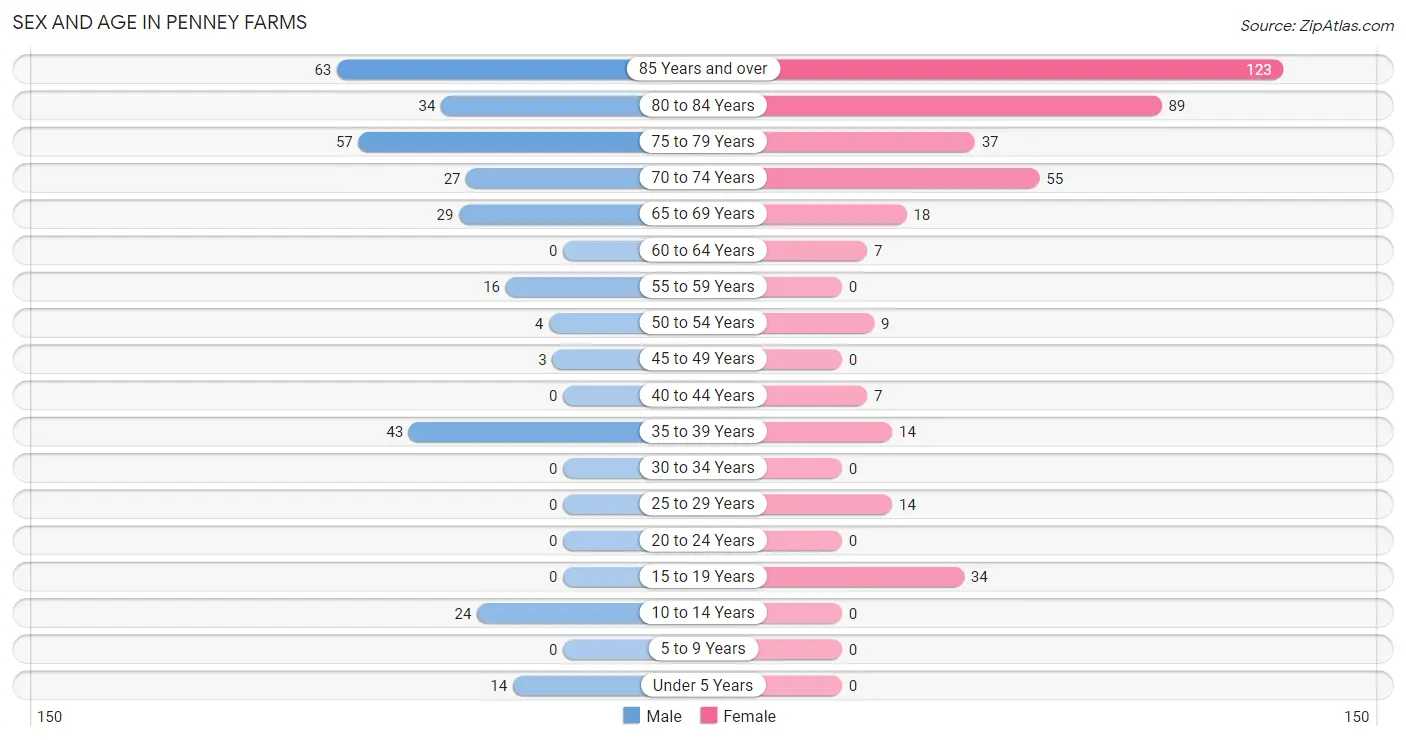
| Age Bracket | Male | Female |
| Under 5 Years | 14 (4.5%) | 0 (0.0%) |
| 5 to 9 Years | 0 (0.0%) | 0 (0.0%) |
| 10 to 14 Years | 24 (7.6%) | 0 (0.0%) |
| 15 to 19 Years | 0 (0.0%) | 34 (8.4%) |
| 20 to 24 Years | 0 (0.0%) | 0 (0.0%) |
| 25 to 29 Years | 0 (0.0%) | 14 (3.4%) |
| 30 to 34 Years | 0 (0.0%) | 0 (0.0%) |
| 35 to 39 Years | 43 (13.7%) | 14 (3.4%) |
| 40 to 44 Years | 0 (0.0%) | 7 (1.7%) |
| 45 to 49 Years | 3 (1.0%) | 0 (0.0%) |
| 50 to 54 Years | 4 (1.3%) | 9 (2.2%) |
| 55 to 59 Years | 16 (5.1%) | 0 (0.0%) |
| 60 to 64 Years | 0 (0.0%) | 7 (1.7%) |
| 65 to 69 Years | 29 (9.2%) | 18 (4.4%) |
| 70 to 74 Years | 27 (8.6%) | 55 (13.5%) |
| 75 to 79 Years | 57 (18.1%) | 37 (9.1%) |
| 80 to 84 Years | 34 (10.8%) | 89 (21.9%) |
| 85 Years and over | 63 (20.1%) | 123 (30.2%) |
| Total | 314 (100.0%) | 407 (100.0%) |
Families and Households in Penney Farms
Median Family Size in Penney Farms
The median family size in Penney Farms is 2.50 persons per family, with married-couple families (150 | 86.7%) accounting for the largest median family size of 2.55 persons per family. On the other hand, single female/mother families (13 | 7.5%) represent the smallest median family size with 2.15 persons per family.
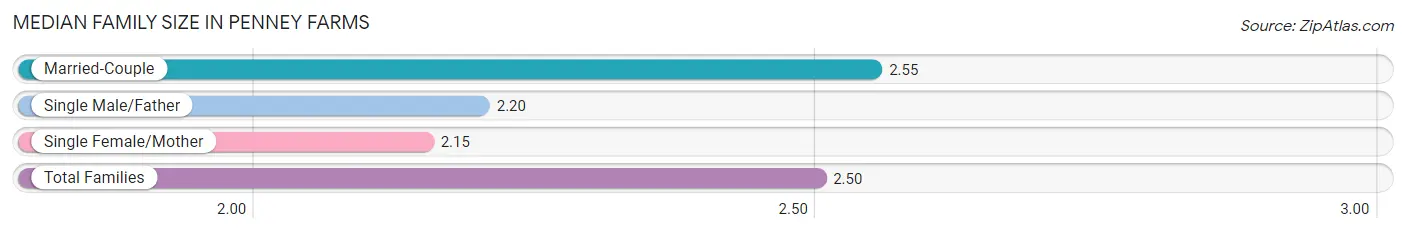
| Family Type | # Families | Family Size |
| Married-Couple | 150 (86.7%) | 2.55 |
| Single Male/Father | 10 (5.8%) | 2.20 |
| Single Female/Mother | 13 (7.5%) | 2.15 |
| Total Families | 173 (100.0%) | 2.50 |
Median Household Size in Penney Farms
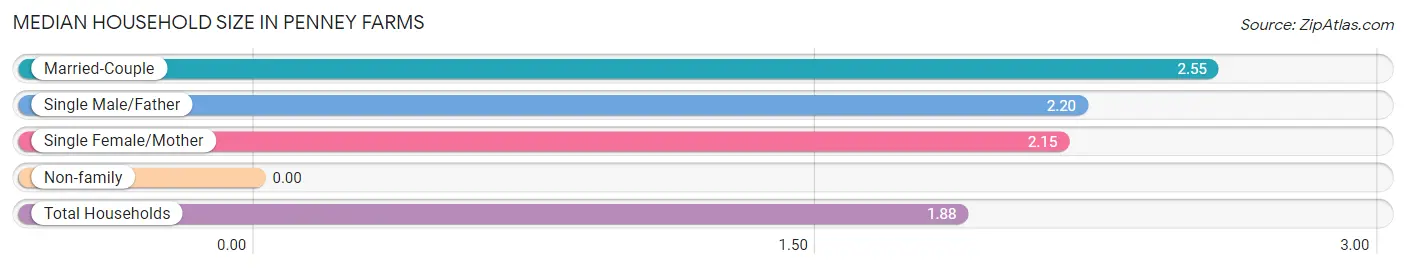
| Household Type | # Households | Household Size |
| Married-Couple | 150 (51.0%) | 2.55 |
| Single Male/Father | 10 (3.4%) | 2.20 |
| Single Female/Mother | 13 (4.4%) | 2.15 |
| Non-family | 121 (41.2%) | - |
| Total Households | 294 (100.0%) | 1.88 |
Household Size by Marriage Status in Penney Farms
Out of a total of 294 households in Penney Farms, 173 (58.8%) are family households, while 121 (41.2%) are nonfamily households. The most numerous type of family households are 2-person households, comprising 159, and the most common type of nonfamily households are 1-person households, comprising 121.
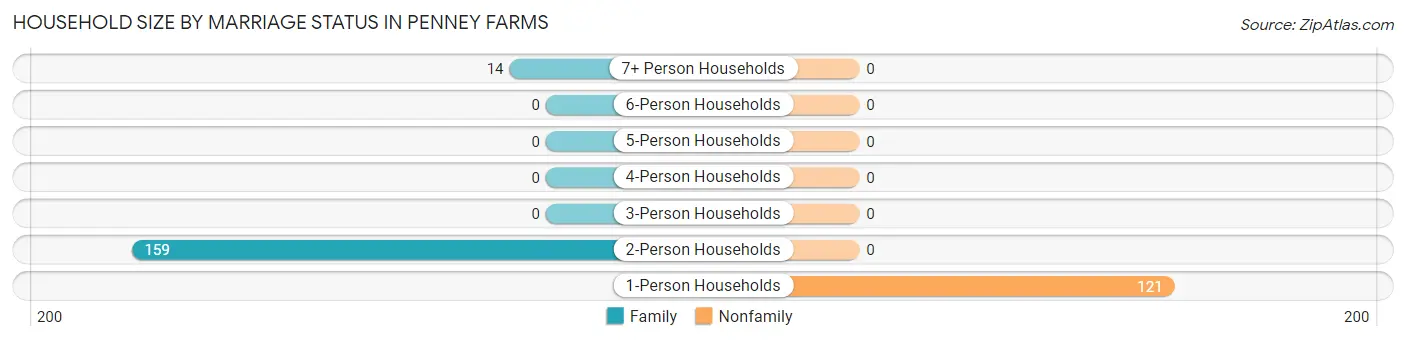
| Household Size | Family Households | Nonfamily Households |
| 1-Person Households | - | 121 (41.2%) |
| 2-Person Households | 159 (54.1%) | 0 (0.0%) |
| 3-Person Households | 0 (0.0%) | 0 (0.0%) |
| 4-Person Households | 0 (0.0%) | 0 (0.0%) |
| 5-Person Households | 0 (0.0%) | 0 (0.0%) |
| 6-Person Households | 0 (0.0%) | 0 (0.0%) |
| 7+ Person Households | 14 (4.8%) | 0 (0.0%) |
| Total | 173 (58.8%) | 121 (41.2%) |
Female Fertility in Penney Farms
Fertility by Age in Penney Farms
| Age Bracket | Women with Births | Births / 1,000 Women |
| 15 to 19 years | 0 (0.0%) | 0.0 |
| 20 to 34 years | 0 (0.0%) | 0.0 |
| 35 to 50 years | 0 (0.0%) | 0.0 |
| Total | 0 (0.0%) | 0.0 |
Fertility by Age by Marriage Status in Penney Farms
| Age Bracket | Married | Unmarried |
| 15 to 19 years | 0 (0.0%) | 0 (0.0%) |
| 20 to 34 years | 0 (0.0%) | 0 (0.0%) |
| 35 to 50 years | 0 (0.0%) | 0 (0.0%) |
| Total | 0 (0.0%) | 0 (0.0%) |
Fertility by Education in Penney Farms
| Educational Attainment | Women with Births | Births / 1,000 Women |
| Less than High School | 0 (0.0%) | 0.0 |
| High School Diploma | 0 (0.0%) | 0.0 |
| College or Associate's Degree | 0 (0.0%) | 0.0 |
| Bachelor's Degree | 0 (0.0%) | 0.0 |
| Graduate Degree | 0 (0.0%) | 0.0 |
| Total | 0 (0.0%) | 0.0 |
Fertility by Education by Marriage Status in Penney Farms
| Educational Attainment | Married | Unmarried |
| Less than High School | 0 (0.0%) | 0 (0.0%) |
| High School Diploma | 0 (0.0%) | 0 (0.0%) |
| College or Associate's Degree | 0 (0.0%) | 0 (0.0%) |
| Bachelor's Degree | 0 (0.0%) | 0 (0.0%) |
| Graduate Degree | 0 (0.0%) | 0 (0.0%) |
| Total | 0 (0.0%) | 0 (0.0%) |
Employment Characteristics in Penney Farms
Employment by Class of Employer in Penney Farms
Among the 53 employed individuals in Penney Farms, private company employees (46 | 86.8%), and self-employed (incorporated) (7 | 13.2%) make up the most common classes of employment.
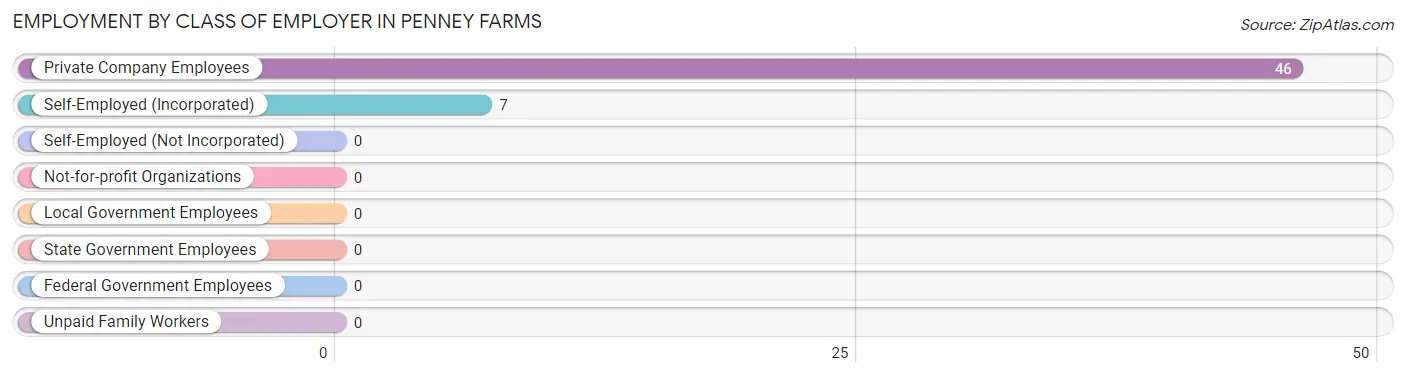
| Employer Class | # Employees | % Employees |
| Private Company Employees | 46 | 86.8% |
| Self-Employed (Incorporated) | 7 | 13.2% |
| Self-Employed (Not Incorporated) | 0 | 0.0% |
| Not-for-profit Organizations | 0 | 0.0% |
| Local Government Employees | 0 | 0.0% |
| State Government Employees | 0 | 0.0% |
| Federal Government Employees | 0 | 0.0% |
| Unpaid Family Workers | 0 | 0.0% |
| Total | 53 | 100.0% |
Employment Status by Age in Penney Farms
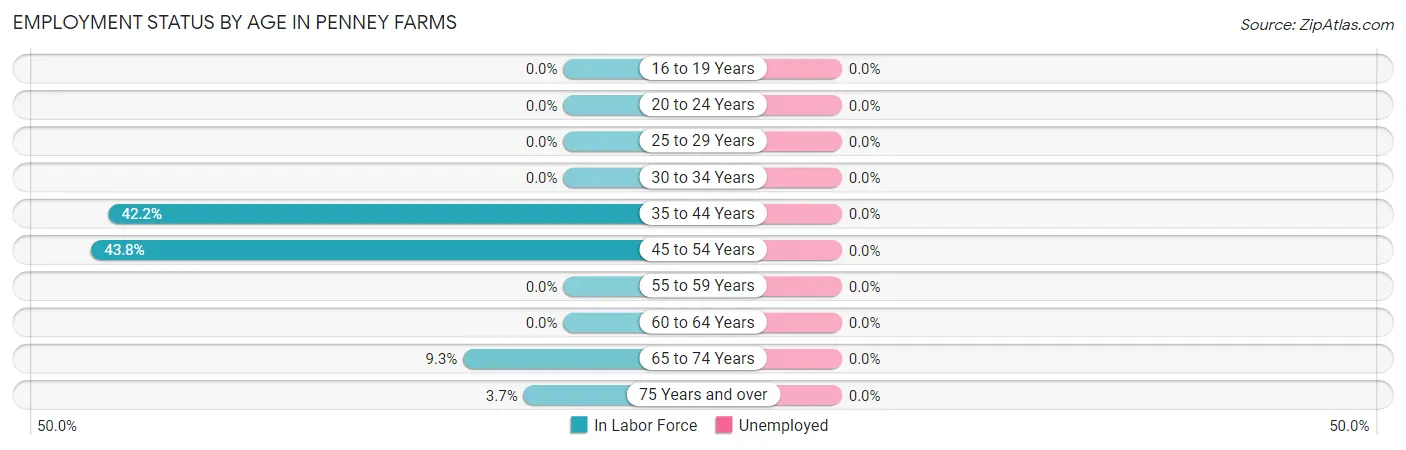
| Age Bracket | In Labor Force | Unemployed |
| 16 to 19 Years | 0 (0.0%) | 0 (0.0%) |
| 20 to 24 Years | 0 (0.0%) | 0 (0.0%) |
| 25 to 29 Years | 0 (0.0%) | 0 (0.0%) |
| 30 to 34 Years | 0 (0.0%) | 0 (0.0%) |
| 35 to 44 Years | 27 (42.2%) | 0 (0.0%) |
| 45 to 54 Years | 7 (43.8%) | 0 (0.0%) |
| 55 to 59 Years | 0 (0.0%) | 0 (0.0%) |
| 60 to 64 Years | 0 (0.0%) | 0 (0.0%) |
| 65 to 74 Years | 12 (9.3%) | 0 (0.0%) |
| 75 Years and over | 15 (3.7%) | 0 (0.0%) |
| Total | 61 (9.1%) | 0 (0.0%) |
Employment Status by Educational Attainment in Penney Farms
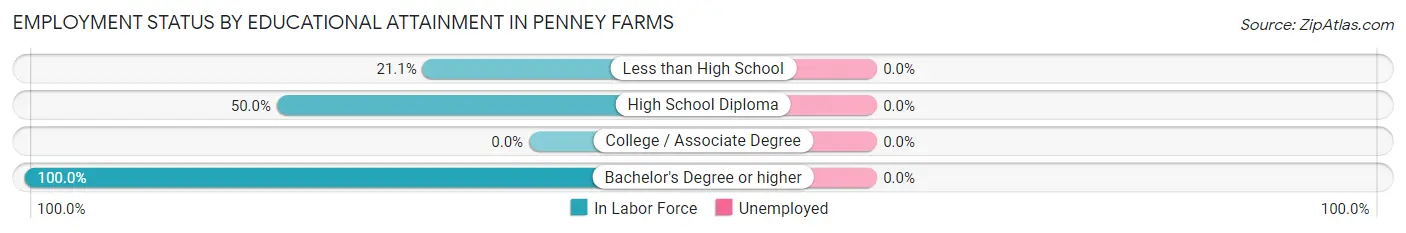
| Educational Attainment | In Labor Force | Unemployed |
| Less than High School | 16 (21.1%) | 0 (0.0%) |
| High School Diploma | 14 (50.0%) | 0 (0.0%) |
| College / Associate Degree | 0 (0.0%) | 0 (0.0%) |
| Bachelor's Degree or higher | 4 (100.0%) | 0 (0.0%) |
| Total | 34 (29.1%) | 0 (0.0%) |
Employment Occupations by Sex in Penney Farms
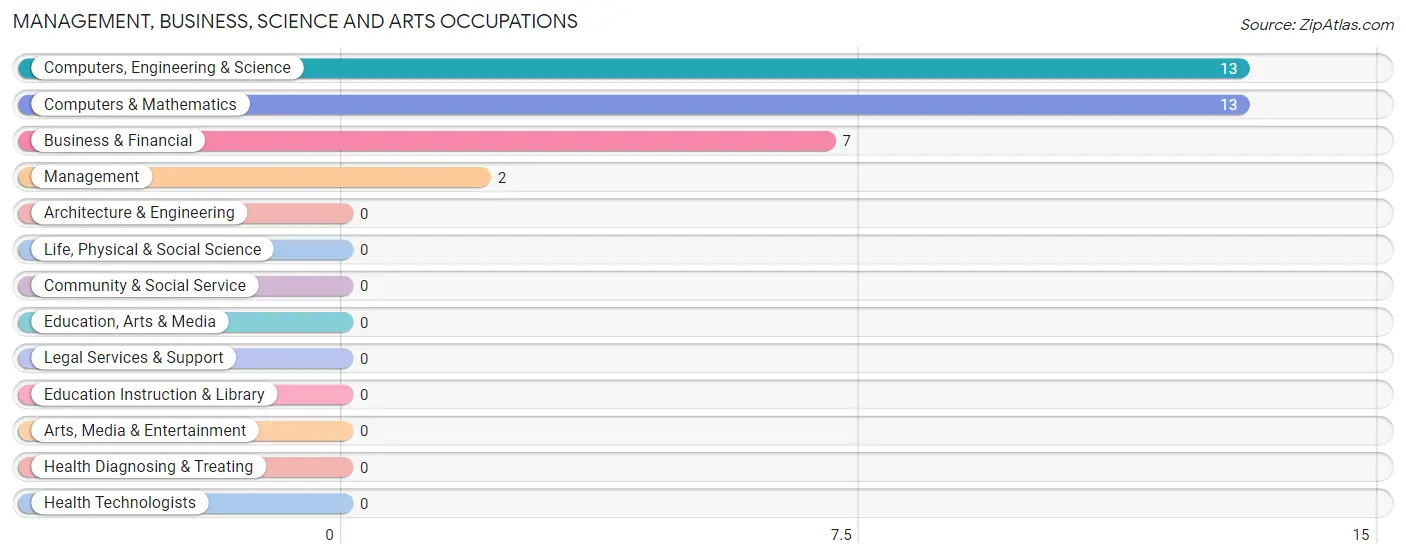
Management, Business, Science and Arts Occupations
The most common Management, Business, Science and Arts occupations in Penney Farms are Computers, Engineering & Science (13 | 21.3%), Computers & Mathematics (13 | 21.3%), Business & Financial (7 | 11.5%), and Management (2 | 3.3%).
Management, Business, Science and Arts Occupations by Sex
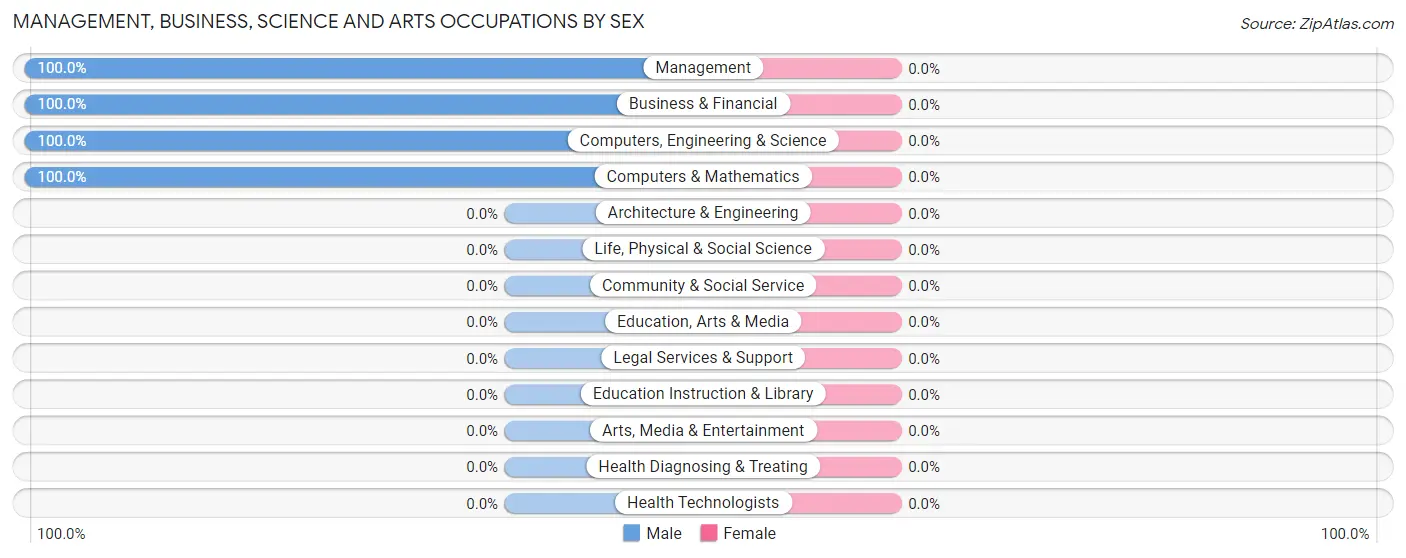
| Occupation | Male | Female |
| Management | 2 (100.0%) | 0 (0.0%) |
| Business & Financial | 7 (100.0%) | 0 (0.0%) |
| Computers, Engineering & Science | 13 (100.0%) | 0 (0.0%) |
| Computers & Mathematics | 13 (100.0%) | 0 (0.0%) |
| Architecture & Engineering | 0 (0.0%) | 0 (0.0%) |
| Life, Physical & Social Science | 0 (0.0%) | 0 (0.0%) |
| Community & Social Service | 0 (0.0%) | 0 (0.0%) |
| Education, Arts & Media | 0 (0.0%) | 0 (0.0%) |
| Legal Services & Support | 0 (0.0%) | 0 (0.0%) |
| Education Instruction & Library | 0 (0.0%) | 0 (0.0%) |
| Arts, Media & Entertainment | 0 (0.0%) | 0 (0.0%) |
| Health Diagnosing & Treating | 0 (0.0%) | 0 (0.0%) |
| Health Technologists | 0 (0.0%) | 0 (0.0%) |
| Total (Category) | 22 (100.0%) | 0 (0.0%) |
| Total (Overall) | 42 (68.9%) | 19 (31.1%) |
Services Occupations
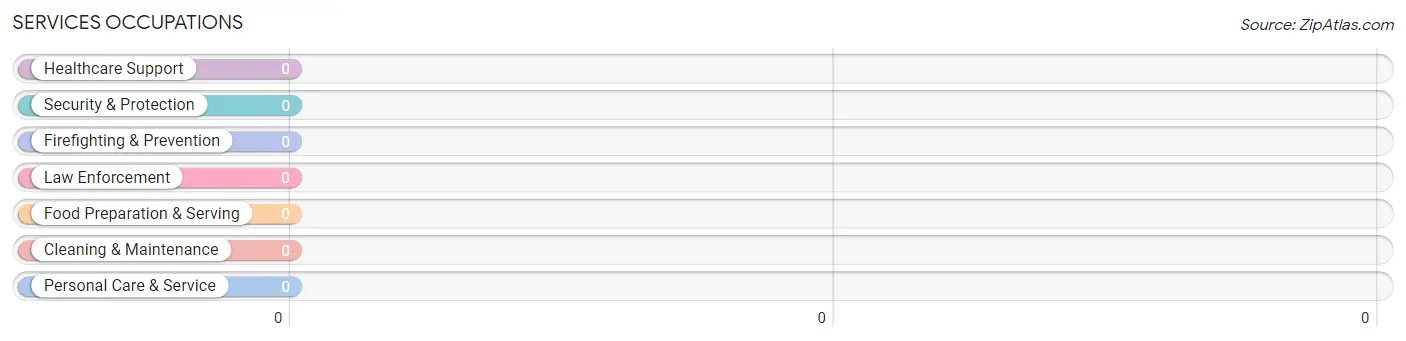
Services Occupations by Sex
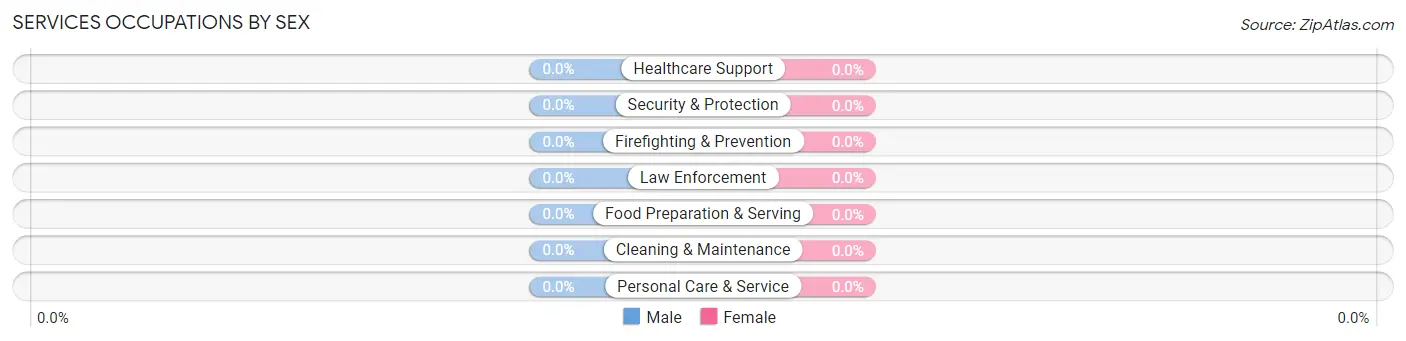
| Occupation | Male | Female |
| Healthcare Support | 0 (0.0%) | 0 (0.0%) |
| Security & Protection | 0 (0.0%) | 0 (0.0%) |
| Firefighting & Prevention | 0 (0.0%) | 0 (0.0%) |
| Law Enforcement | 0 (0.0%) | 0 (0.0%) |
| Food Preparation & Serving | 0 (0.0%) | 0 (0.0%) |
| Cleaning & Maintenance | 0 (0.0%) | 0 (0.0%) |
| Personal Care & Service | 0 (0.0%) | 0 (0.0%) |
| Total (Category) | 0 (0.0%) | 0 (0.0%) |
| Total (Overall) | 42 (68.9%) | 19 (31.1%) |
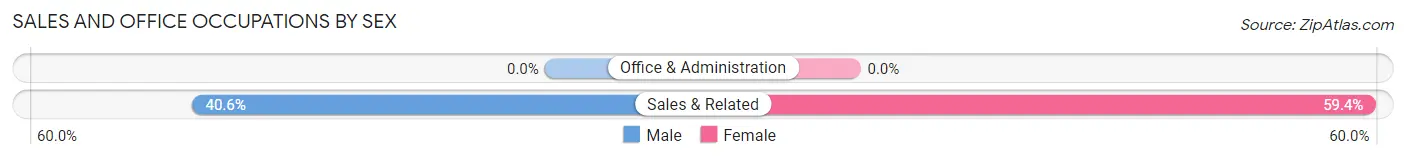
Sales and Office Occupations
The most common Sales and Office occupations in Penney Farms are , and Sales & Related (32 | 52.5%).
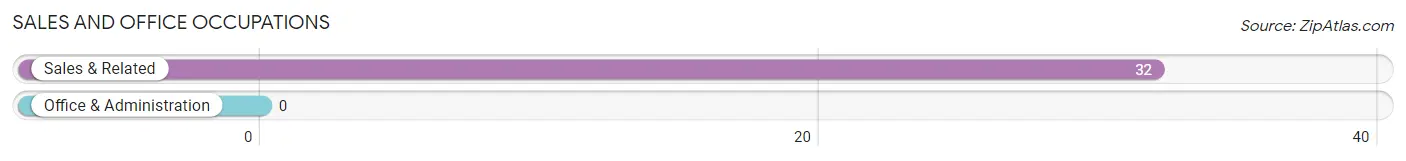
Sales and Office Occupations by Sex
| Occupation | Male | Female |
| Sales & Related | 13 (40.6%) | 19 (59.4%) |
| Office & Administration | 0 (0.0%) | 0 (0.0%) |
| Total (Category) | 13 (40.6%) | 19 (59.4%) |
| Total (Overall) | 42 (68.9%) | 19 (31.1%) |
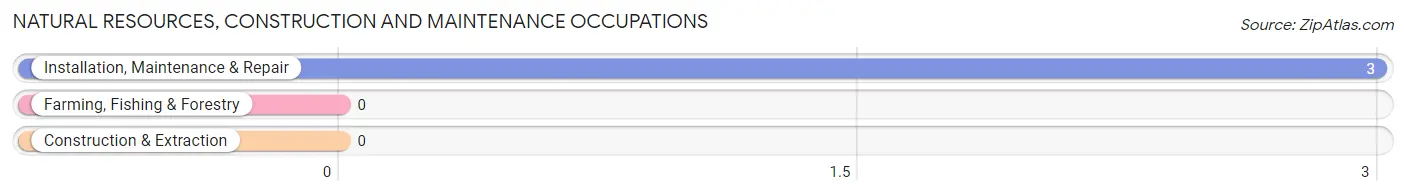
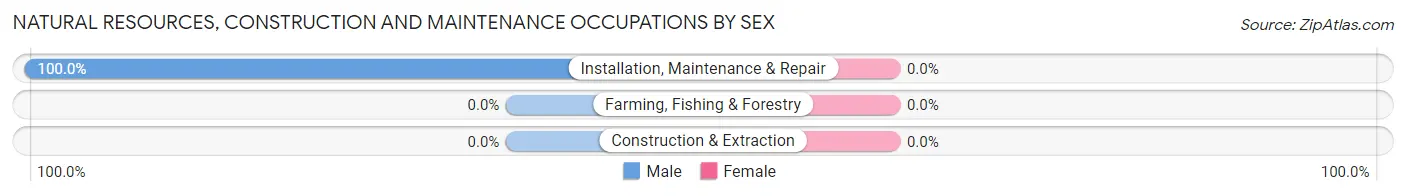
Natural Resources, Construction and Maintenance Occupations
The most common Natural Resources, Construction and Maintenance occupations in Penney Farms are , and Installation, Maintenance & Repair (3 | 4.9%).
Natural Resources, Construction and Maintenance Occupations by Sex
| Occupation | Male | Female |
| Farming, Fishing & Forestry | 0 (0.0%) | 0 (0.0%) |
| Construction & Extraction | 0 (0.0%) | 0 (0.0%) |
| Installation, Maintenance & Repair | 3 (100.0%) | 0 (0.0%) |
| Total (Category) | 3 (100.0%) | 0 (0.0%) |
| Total (Overall) | 42 (68.9%) | 19 (31.1%) |
Production, Transportation and Moving Occupations
The most common Production, Transportation and Moving occupations in Penney Farms are , and Transportation (4 | 6.6%).
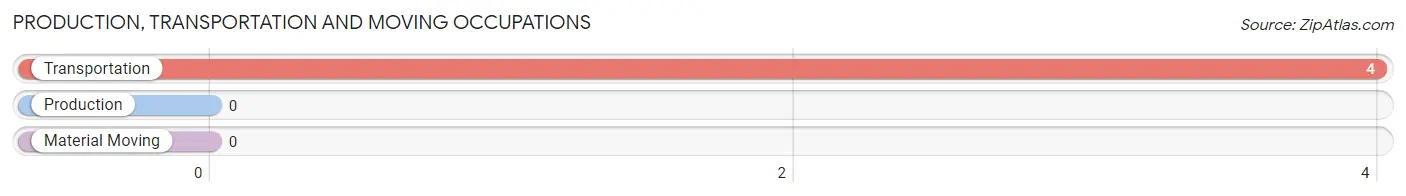
Production, Transportation and Moving Occupations by Sex
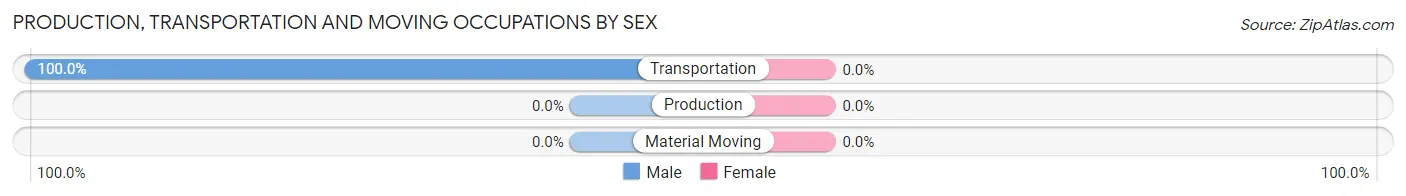
| Occupation | Male | Female |
| Production | 0 (0.0%) | 0 (0.0%) |
| Transportation | 4 (100.0%) | 0 (0.0%) |
| Material Moving | 0 (0.0%) | 0 (0.0%) |
| Total (Category) | 4 (100.0%) | 0 (0.0%) |
| Total (Overall) | 42 (68.9%) | 19 (31.1%) |
Employment Industries by Sex in Penney Farms
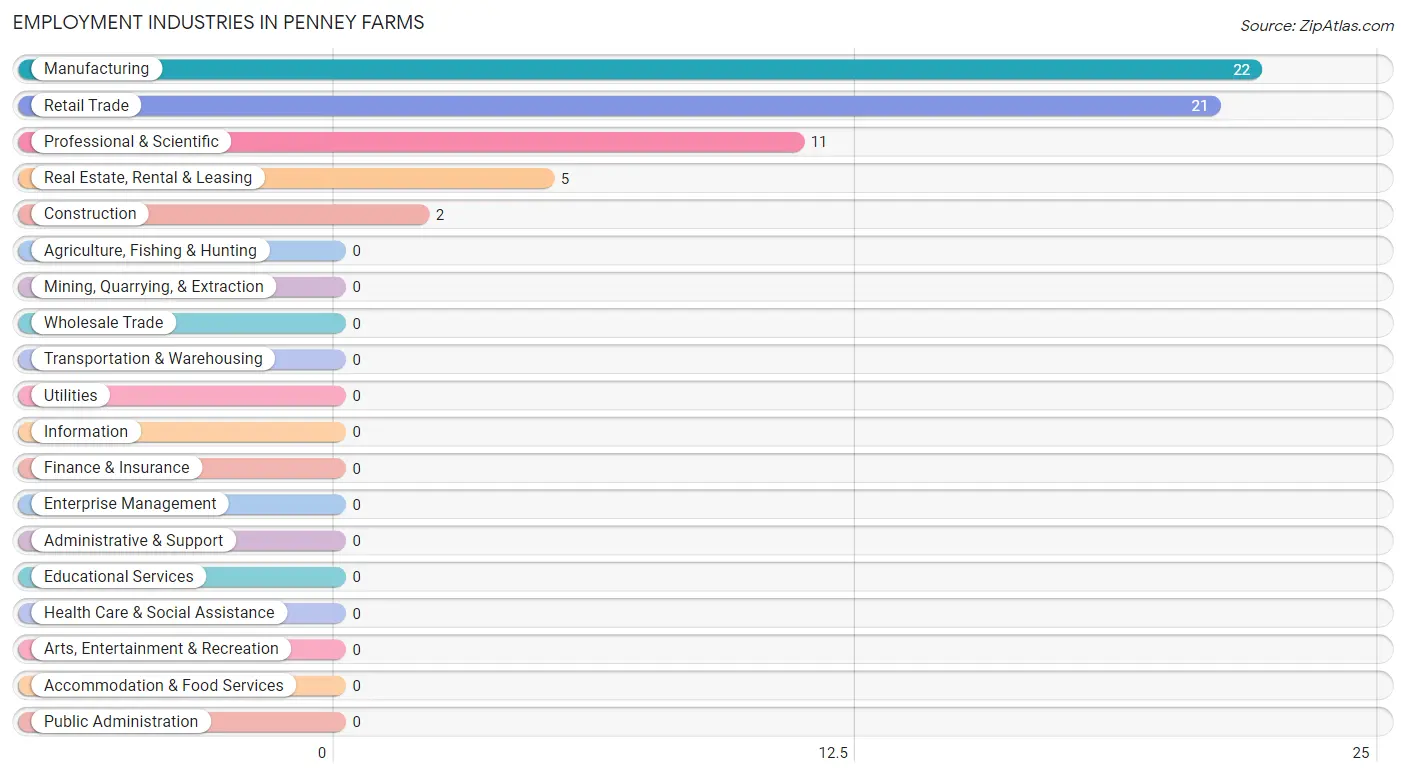
Employment Industries in Penney Farms
The major employment industries in Penney Farms include Manufacturing (22 | 36.1%), Retail Trade (21 | 34.4%), Professional & Scientific (11 | 18.0%), Real Estate, Rental & Leasing (5 | 8.2%), and Construction (2 | 3.3%).
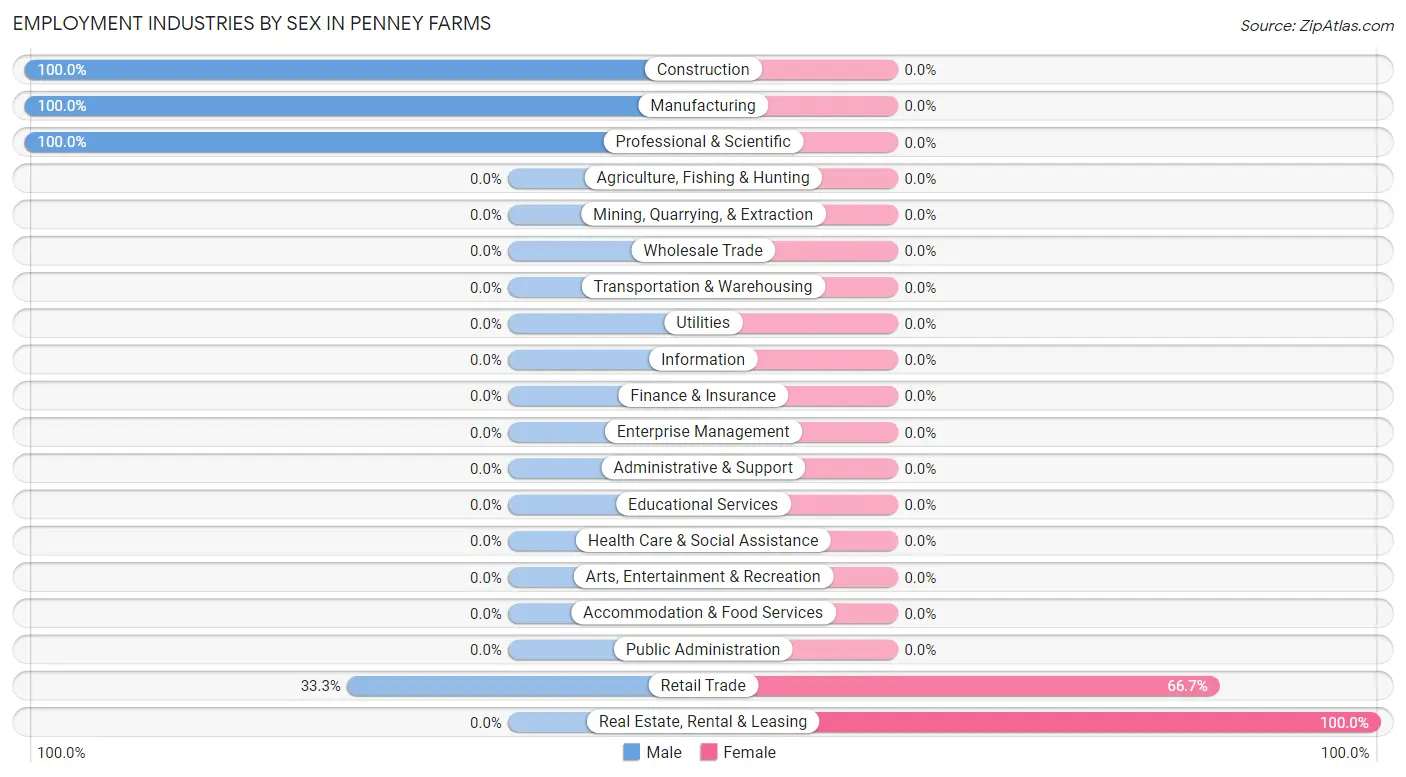
Employment Industries by Sex in Penney Farms
The Penney Farms industries that see more men than women are Construction (100.0%), Manufacturing (100.0%), and Professional & Scientific (100.0%), whereas the industries that tend to have a higher number of women are Real Estate, Rental & Leasing (100.0%), and Retail Trade (66.7%).
| Industry | Male | Female |
| Agriculture, Fishing & Hunting | 0 (0.0%) | 0 (0.0%) |
| Mining, Quarrying, & Extraction | 0 (0.0%) | 0 (0.0%) |
| Construction | 2 (100.0%) | 0 (0.0%) |
| Manufacturing | 22 (100.0%) | 0 (0.0%) |
| Wholesale Trade | 0 (0.0%) | 0 (0.0%) |
| Retail Trade | 7 (33.3%) | 14 (66.7%) |
| Transportation & Warehousing | 0 (0.0%) | 0 (0.0%) |
| Utilities | 0 (0.0%) | 0 (0.0%) |
| Information | 0 (0.0%) | 0 (0.0%) |
| Finance & Insurance | 0 (0.0%) | 0 (0.0%) |
| Real Estate, Rental & Leasing | 0 (0.0%) | 5 (100.0%) |
| Professional & Scientific | 11 (100.0%) | 0 (0.0%) |
| Enterprise Management | 0 (0.0%) | 0 (0.0%) |
| Administrative & Support | 0 (0.0%) | 0 (0.0%) |
| Educational Services | 0 (0.0%) | 0 (0.0%) |
| Health Care & Social Assistance | 0 (0.0%) | 0 (0.0%) |
| Arts, Entertainment & Recreation | 0 (0.0%) | 0 (0.0%) |
| Accommodation & Food Services | 0 (0.0%) | 0 (0.0%) |
| Public Administration | 0 (0.0%) | 0 (0.0%) |
| Total | 42 (68.9%) | 19 (31.1%) |
Education in Penney Farms
School Enrollment in Penney Farms
The most common levels of schooling among the 58 students in Penney Farms are high school (34 | 58.6%), and middle school (24 | 41.4%).
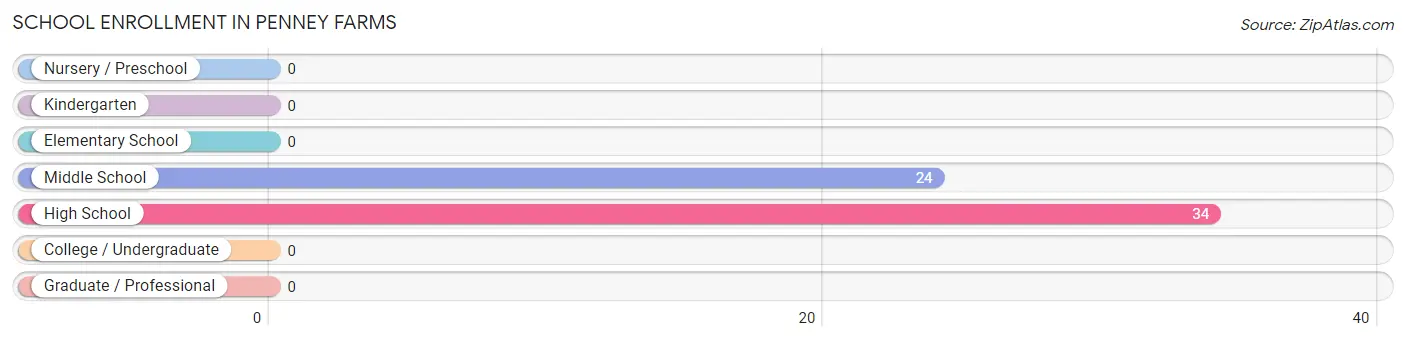
| School Level | # Students | % Students |
| Nursery / Preschool | 0 | 0.0% |
| Kindergarten | 0 | 0.0% |
| Elementary School | 0 | 0.0% |
| Middle School | 24 | 41.4% |
| High School | 34 | 58.6% |
| College / Undergraduate | 0 | 0.0% |
| Graduate / Professional | 0 | 0.0% |
| Total | 58 | 100.0% |
School Enrollment by Age by Funding Source in Penney Farms
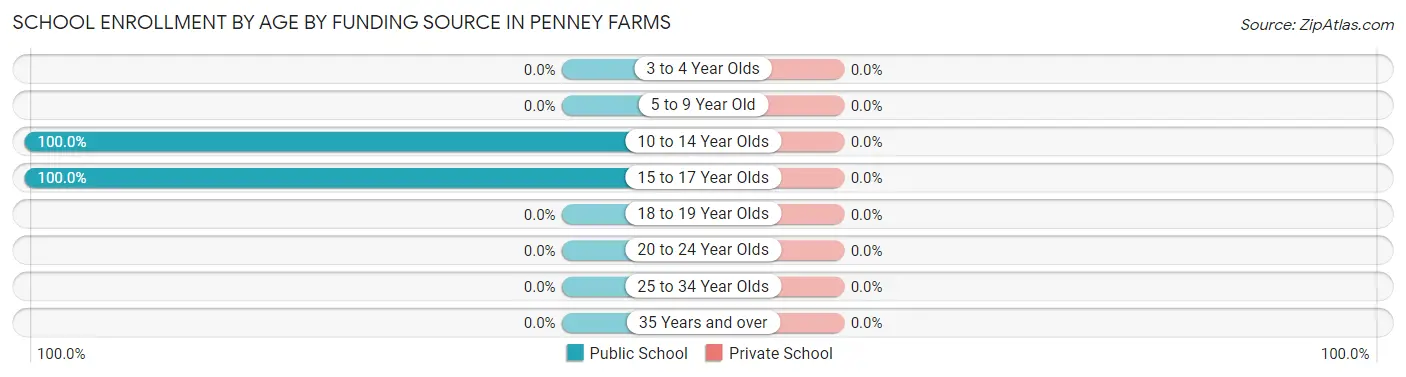
| Age Bracket | Public School | Private School |
| 3 to 4 Year Olds | 0 (0.0%) | 0 (0.0%) |
| 5 to 9 Year Old | 0 (0.0%) | 0 (0.0%) |
| 10 to 14 Year Olds | 24 (100.0%) | 0 (0.0%) |
| 15 to 17 Year Olds | 34 (100.0%) | 0 (0.0%) |
| 18 to 19 Year Olds | 0 (0.0%) | 0 (0.0%) |
| 20 to 24 Year Olds | 0 (0.0%) | 0 (0.0%) |
| 25 to 34 Year Olds | 0 (0.0%) | 0 (0.0%) |
| 35 Years and over | 0 (0.0%) | 0 (0.0%) |
| Total | 58 (100.0%) | 0 (0.0%) |
Educational Attainment by Field of Study in Penney Farms
Business (73 | 22.7%), education (68 | 21.2%), engineering (44 | 13.7%), liberal arts & history (34 | 10.6%), and literature & languages (20 | 6.2%) are the most common fields of study among 321 individuals in Penney Farms who have obtained a bachelor's degree or higher.
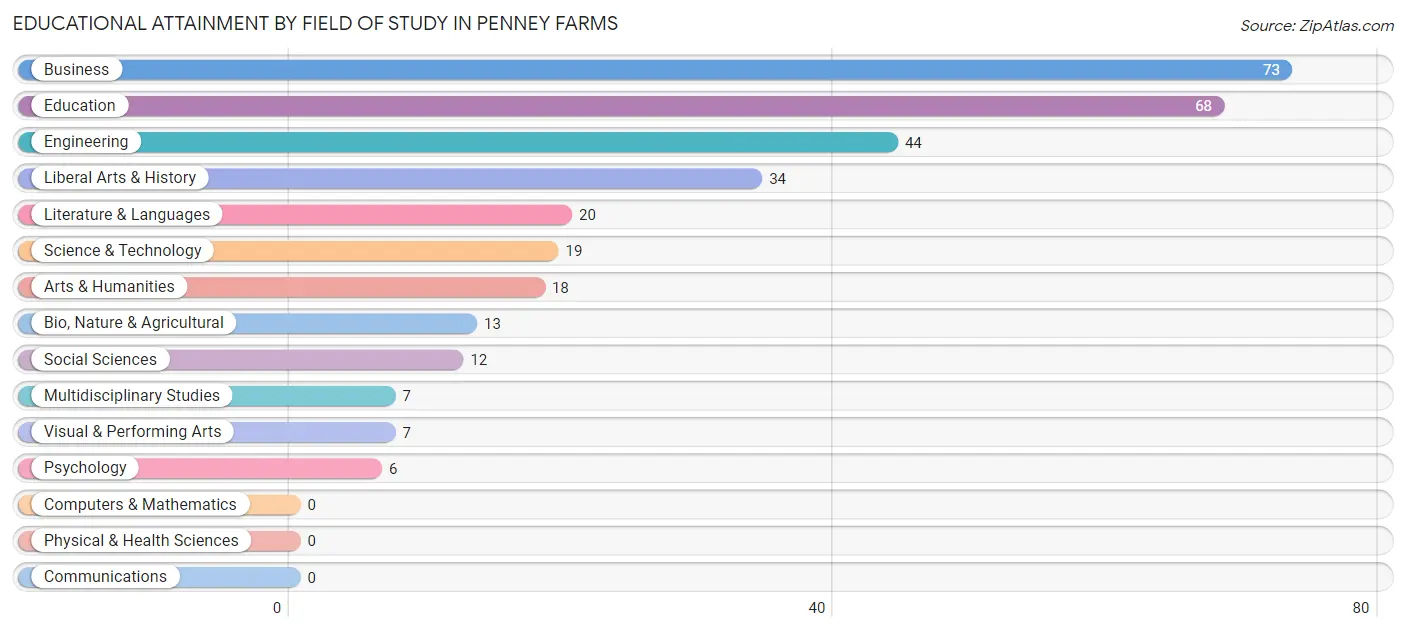
| Field of Study | # Graduates | % Graduates |
| Computers & Mathematics | 0 | 0.0% |
| Bio, Nature & Agricultural | 13 | 4.1% |
| Physical & Health Sciences | 0 | 0.0% |
| Psychology | 6 | 1.9% |
| Social Sciences | 12 | 3.7% |
| Engineering | 44 | 13.7% |
| Multidisciplinary Studies | 7 | 2.2% |
| Science & Technology | 19 | 5.9% |
| Business | 73 | 22.7% |
| Education | 68 | 21.2% |
| Literature & Languages | 20 | 6.2% |
| Liberal Arts & History | 34 | 10.6% |
| Visual & Performing Arts | 7 | 2.2% |
| Communications | 0 | 0.0% |
| Arts & Humanities | 18 | 5.6% |
| Total | 321 | 100.0% |
Transportation & Commute in Penney Farms
Vehicle Availability by Sex in Penney Farms
The most prevalent vehicle ownership categories in Penney Farms are males with 2 vehicles (31, accounting for 91.2%) and females with 2 vehicles (14, making up 163.2%).
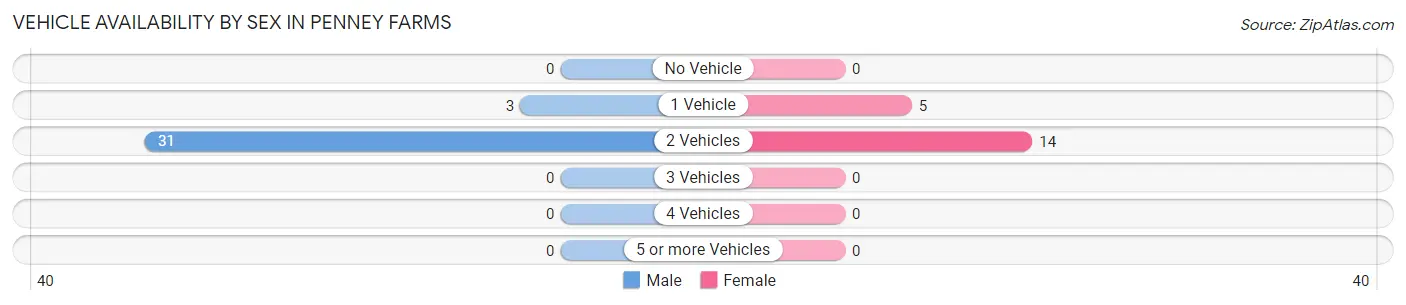
| Vehicles Available | Male | Female |
| No Vehicle | 0 (0.0%) | 0 (0.0%) |
| 1 Vehicle | 3 (8.8%) | 5 (26.3%) |
| 2 Vehicles | 31 (91.2%) | 14 (73.7%) |
| 3 Vehicles | 0 (0.0%) | 0 (0.0%) |
| 4 Vehicles | 0 (0.0%) | 0 (0.0%) |
| 5 or more Vehicles | 0 (0.0%) | 0 (0.0%) |
| Total | 34 (100.0%) | 19 (100.0%) |
Commute Time in Penney Farms
The most frequently occuring commute durations in Penney Farms are 60 to 89 minutes (13 commuters, 52.0%), less than 5 minutes (5 commuters, 20.0%), and 35 to 39 minutes (4 commuters, 16.0%).
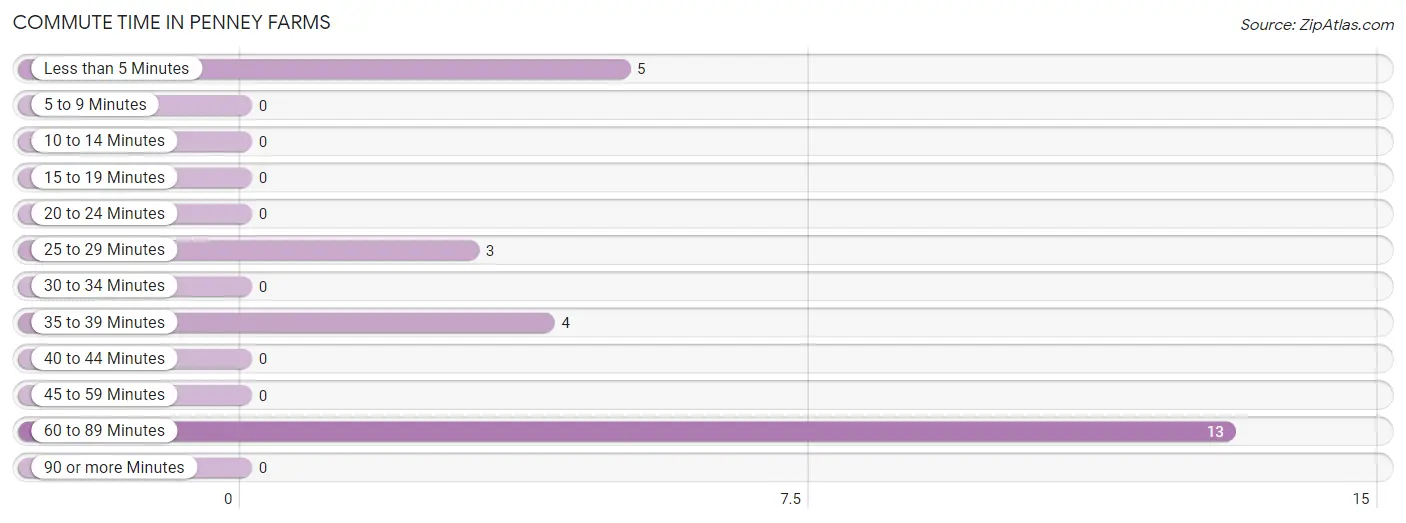
| Commute Time | # Commuters | % Commuters |
| Less than 5 Minutes | 5 | 20.0% |
| 5 to 9 Minutes | 0 | 0.0% |
| 10 to 14 Minutes | 0 | 0.0% |
| 15 to 19 Minutes | 0 | 0.0% |
| 20 to 24 Minutes | 0 | 0.0% |
| 25 to 29 Minutes | 3 | 12.0% |
| 30 to 34 Minutes | 0 | 0.0% |
| 35 to 39 Minutes | 4 | 16.0% |
| 40 to 44 Minutes | 0 | 0.0% |
| 45 to 59 Minutes | 0 | 0.0% |
| 60 to 89 Minutes | 13 | 52.0% |
| 90 or more Minutes | 0 | 0.0% |
Commute Time by Sex in Penney Farms
The most common commute times in Penney Farms are 60 to 89 minutes (13 commuters, 65.0%) for males and less than 5 minutes (5 commuters, 100.0%) for females.
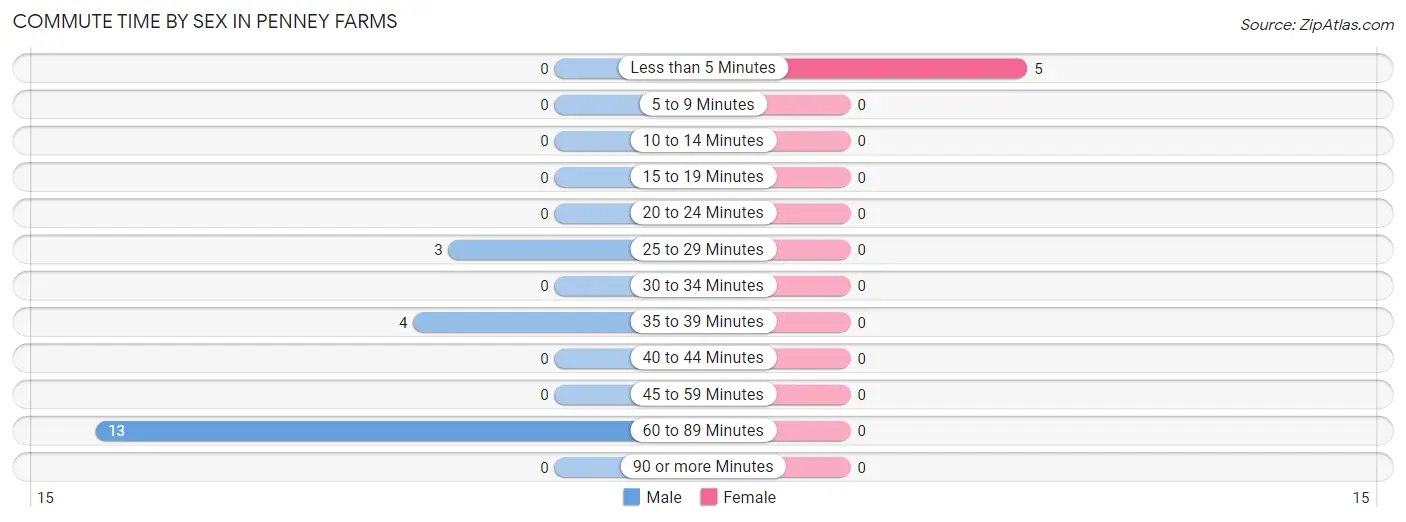
| Commute Time | Male | Female |
| Less than 5 Minutes | 0 (0.0%) | 5 (100.0%) |
| 5 to 9 Minutes | 0 (0.0%) | 0 (0.0%) |
| 10 to 14 Minutes | 0 (0.0%) | 0 (0.0%) |
| 15 to 19 Minutes | 0 (0.0%) | 0 (0.0%) |
| 20 to 24 Minutes | 0 (0.0%) | 0 (0.0%) |
| 25 to 29 Minutes | 3 (15.0%) | 0 (0.0%) |
| 30 to 34 Minutes | 0 (0.0%) | 0 (0.0%) |
| 35 to 39 Minutes | 4 (20.0%) | 0 (0.0%) |
| 40 to 44 Minutes | 0 (0.0%) | 0 (0.0%) |
| 45 to 59 Minutes | 0 (0.0%) | 0 (0.0%) |
| 60 to 89 Minutes | 13 (65.0%) | 0 (0.0%) |
| 90 or more Minutes | 0 (0.0%) | 0 (0.0%) |
Time of Departure to Work by Sex in Penney Farms
The most frequent times of departure to work in Penney Farms are 6:30 AM to 6:59 AM (13, 65.0%) for males and 8:30 AM to 8:59 AM (5, 100.0%) for females.
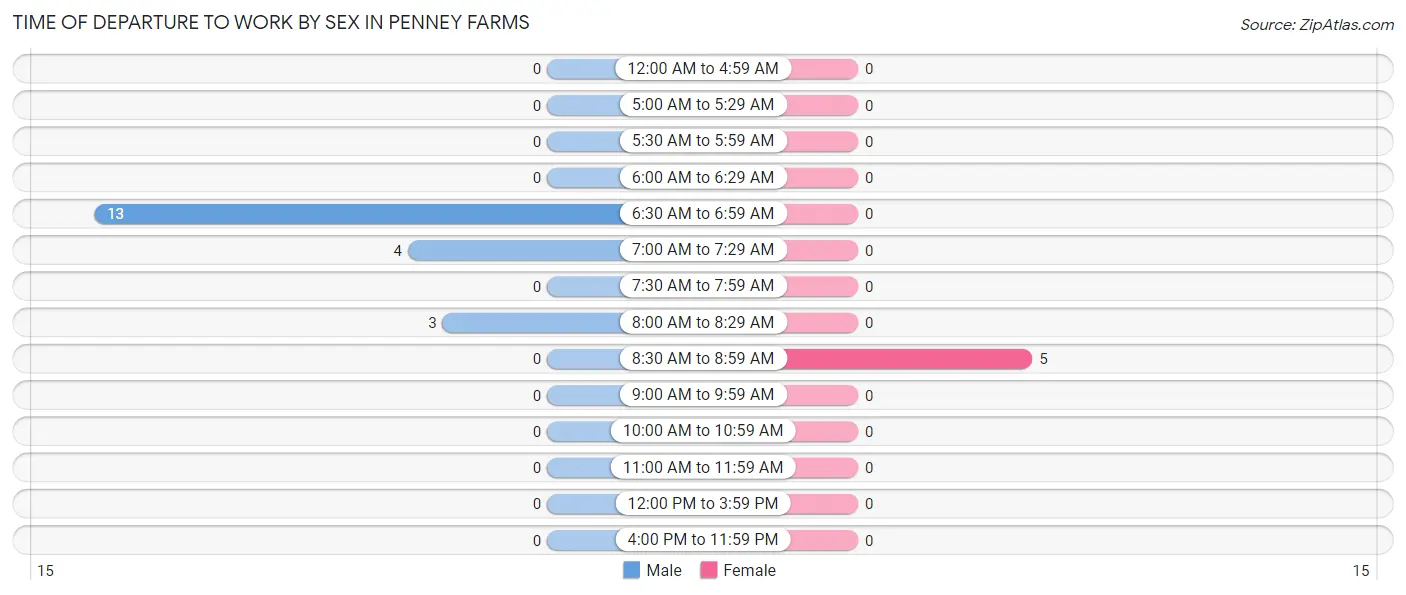
| Time of Departure | Male | Female |
| 12:00 AM to 4:59 AM | 0 (0.0%) | 0 (0.0%) |
| 5:00 AM to 5:29 AM | 0 (0.0%) | 0 (0.0%) |
| 5:30 AM to 5:59 AM | 0 (0.0%) | 0 (0.0%) |
| 6:00 AM to 6:29 AM | 0 (0.0%) | 0 (0.0%) |
| 6:30 AM to 6:59 AM | 13 (65.0%) | 0 (0.0%) |
| 7:00 AM to 7:29 AM | 4 (20.0%) | 0 (0.0%) |
| 7:30 AM to 7:59 AM | 0 (0.0%) | 0 (0.0%) |
| 8:00 AM to 8:29 AM | 3 (15.0%) | 0 (0.0%) |
| 8:30 AM to 8:59 AM | 0 (0.0%) | 5 (100.0%) |
| 9:00 AM to 9:59 AM | 0 (0.0%) | 0 (0.0%) |
| 10:00 AM to 10:59 AM | 0 (0.0%) | 0 (0.0%) |
| 11:00 AM to 11:59 AM | 0 (0.0%) | 0 (0.0%) |
| 12:00 PM to 3:59 PM | 0 (0.0%) | 0 (0.0%) |
| 4:00 PM to 11:59 PM | 0 (0.0%) | 0 (0.0%) |
| Total | 20 (100.0%) | 5 (100.0%) |
Housing Occupancy in Penney Farms
Occupancy by Ownership in Penney Farms
Of the total 294 dwellings in Penney Farms, owner-occupied units account for 29 (9.9%), while renter-occupied units make up 265 (90.1%).
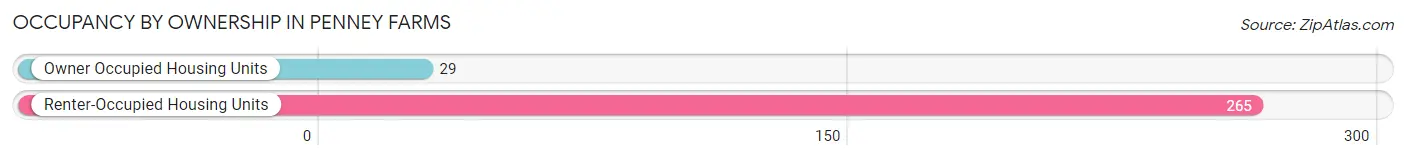
| Occupancy | # Housing Units | % Housing Units |
| Owner Occupied Housing Units | 29 | 9.9% |
| Renter-Occupied Housing Units | 265 | 90.1% |
| Total Occupied Housing Units | 294 | 100.0% |
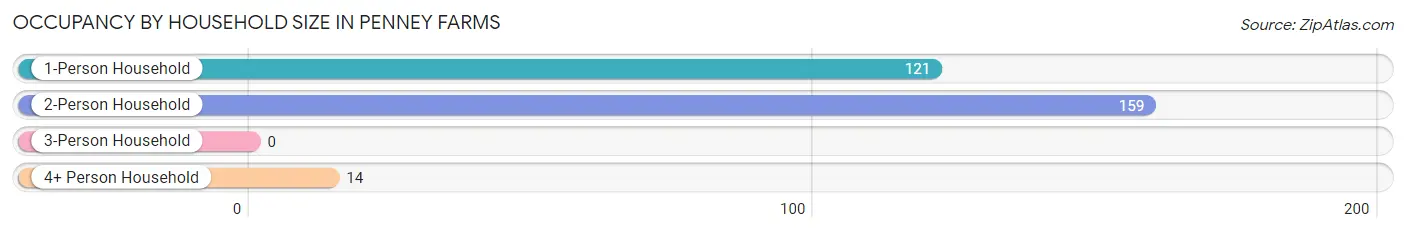
Occupancy by Household Size in Penney Farms
| Household Size | # Housing Units | % Housing Units |
| 1-Person Household | 121 | 41.2% |
| 2-Person Household | 159 | 54.1% |
| 3-Person Household | 0 | 0.0% |
| 4+ Person Household | 14 | 4.8% |
| Total Housing Units | 294 | 100.0% |
Occupancy by Ownership by Household Size in Penney Farms
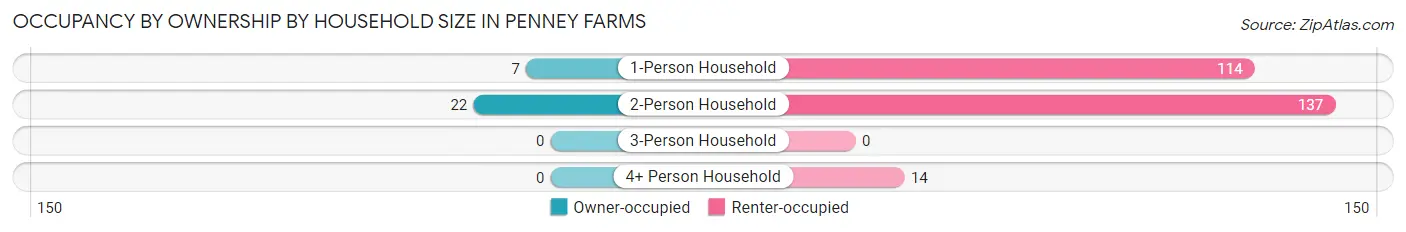
| Household Size | Owner-occupied | Renter-occupied |
| 1-Person Household | 7 (5.8%) | 114 (94.2%) |
| 2-Person Household | 22 (13.8%) | 137 (86.2%) |
| 3-Person Household | 0 (0.0%) | 0 (0.0%) |
| 4+ Person Household | 0 (0.0%) | 14 (100.0%) |
| Total Housing Units | 29 (9.9%) | 265 (90.1%) |
Occupancy by Educational Attainment in Penney Farms
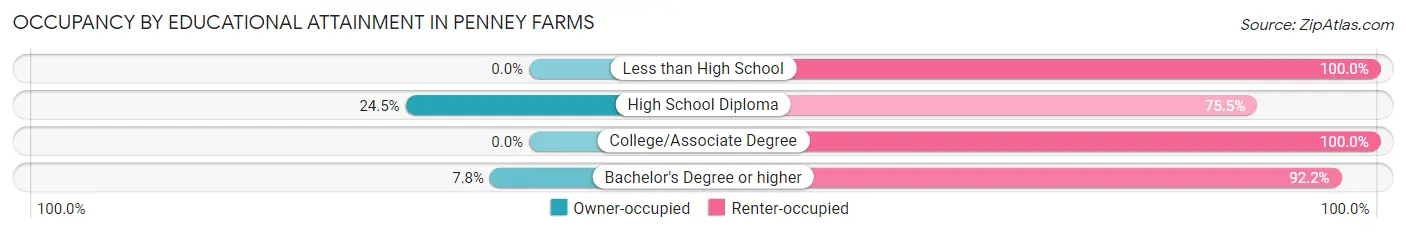
| Household Size | Owner-occupied | Renter-occupied |
| Less than High School | 0 (0.0%) | 3 (100.0%) |
| High School Diploma | 12 (24.5%) | 37 (75.5%) |
| College/Associate Degree | 0 (0.0%) | 23 (100.0%) |
| Bachelor's Degree or higher | 17 (7.8%) | 202 (92.2%) |
Occupancy by Age of Householder in Penney Farms
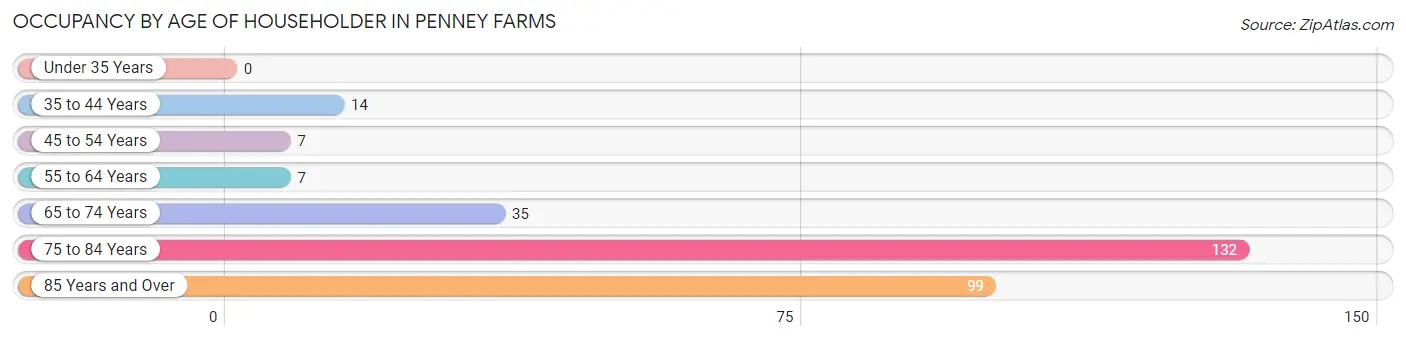
| Age Bracket | # Households | % Households |
| Under 35 Years | 0 | 0.0% |
| 35 to 44 Years | 14 | 4.8% |
| 45 to 54 Years | 7 | 2.4% |
| 55 to 64 Years | 7 | 2.4% |
| 65 to 74 Years | 35 | 11.9% |
| 75 to 84 Years | 132 | 44.9% |
| 85 Years and Over | 99 | 33.7% |
| Total | 294 | 100.0% |
Housing Finances in Penney Farms
Median Income by Occupancy in Penney Farms
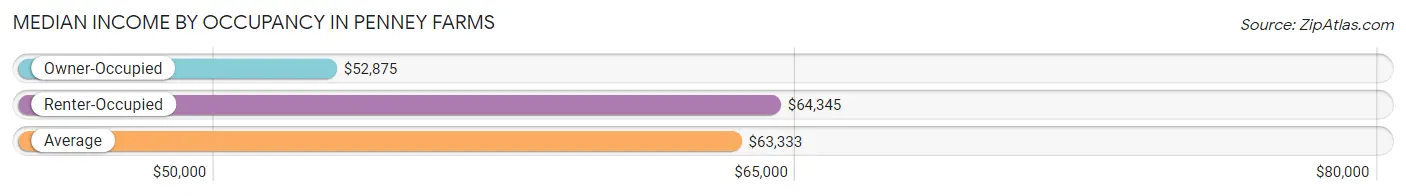
| Occupancy Type | # Households | Median Income |
| Owner-Occupied | 29 (9.9%) | $52,875 |
| Renter-Occupied | 265 (90.1%) | $64,345 |
| Average | 294 (100.0%) | $63,333 |
Occupancy by Householder Income Bracket in Penney Farms
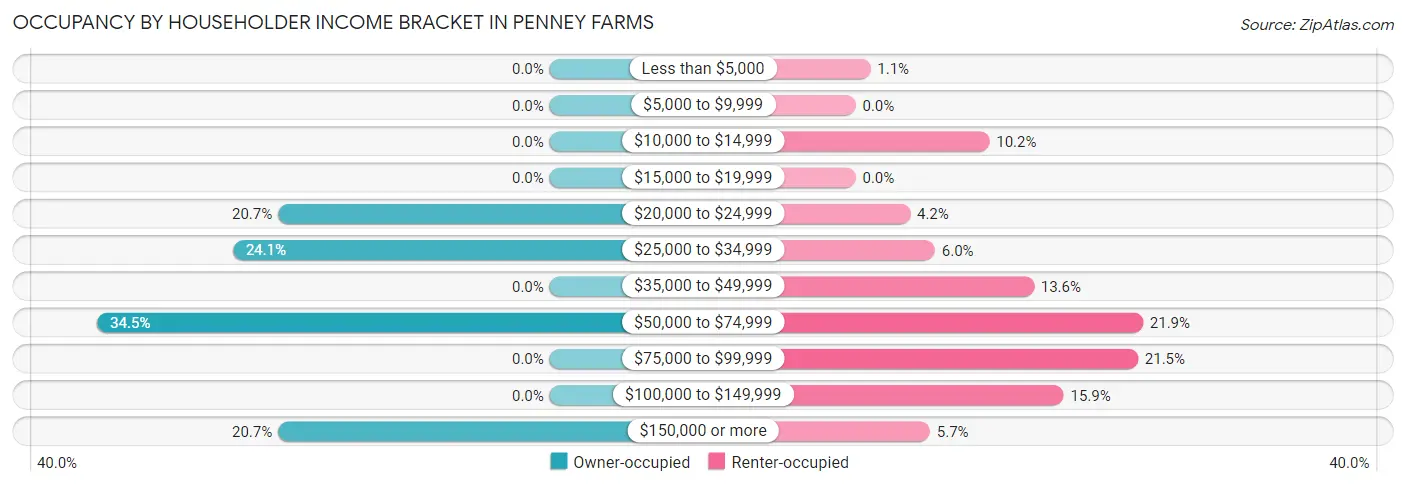
| Income Bracket | Owner-occupied | Renter-occupied |
| Less than $5,000 | 0 (0.0%) | 3 (1.1%) |
| $5,000 to $9,999 | 0 (0.0%) | 0 (0.0%) |
| $10,000 to $14,999 | 0 (0.0%) | 27 (10.2%) |
| $15,000 to $19,999 | 0 (0.0%) | 0 (0.0%) |
| $20,000 to $24,999 | 6 (20.7%) | 11 (4.2%) |
| $25,000 to $34,999 | 7 (24.1%) | 16 (6.0%) |
| $35,000 to $49,999 | 0 (0.0%) | 36 (13.6%) |
| $50,000 to $74,999 | 10 (34.5%) | 58 (21.9%) |
| $75,000 to $99,999 | 0 (0.0%) | 57 (21.5%) |
| $100,000 to $149,999 | 0 (0.0%) | 42 (15.9%) |
| $150,000 or more | 6 (20.7%) | 15 (5.7%) |
| Total | 29 (100.0%) | 265 (100.0%) |
Monthly Housing Cost Tiers in Penney Farms
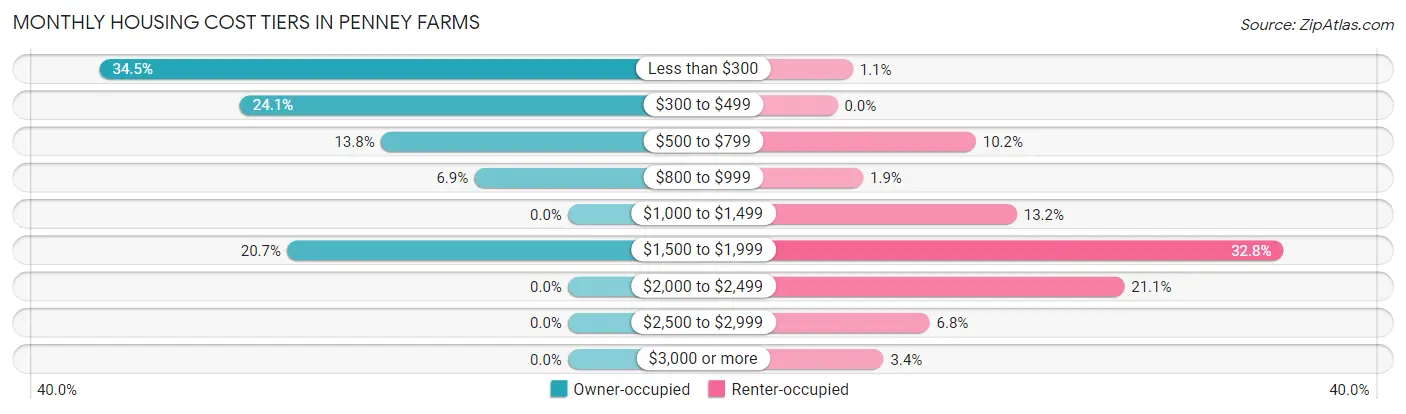
| Monthly Cost | Owner-occupied | Renter-occupied |
| Less than $300 | 10 (34.5%) | 3 (1.1%) |
| $300 to $499 | 7 (24.1%) | 0 (0.0%) |
| $500 to $799 | 4 (13.8%) | 27 (10.2%) |
| $800 to $999 | 2 (6.9%) | 5 (1.9%) |
| $1,000 to $1,499 | 0 (0.0%) | 35 (13.2%) |
| $1,500 to $1,999 | 6 (20.7%) | 87 (32.8%) |
| $2,000 to $2,499 | 0 (0.0%) | 56 (21.1%) |
| $2,500 to $2,999 | 0 (0.0%) | 18 (6.8%) |
| $3,000 or more | 0 (0.0%) | 9 (3.4%) |
| Total | 29 (100.0%) | 265 (100.0%) |
Physical Housing Characteristics in Penney Farms
Housing Structures in Penney Farms
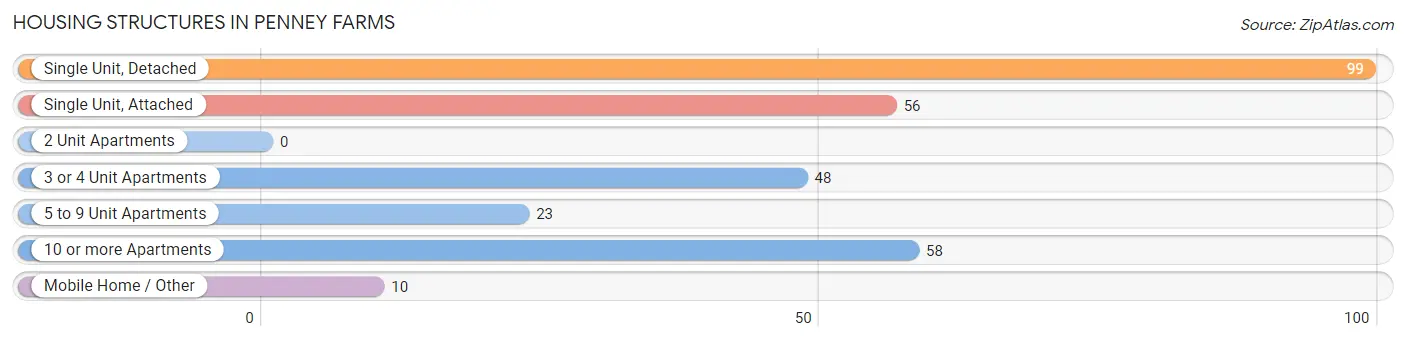
| Structure Type | # Housing Units | % Housing Units |
| Single Unit, Detached | 99 | 33.7% |
| Single Unit, Attached | 56 | 19.1% |
| 2 Unit Apartments | 0 | 0.0% |
| 3 or 4 Unit Apartments | 48 | 16.3% |
| 5 to 9 Unit Apartments | 23 | 7.8% |
| 10 or more Apartments | 58 | 19.7% |
| Mobile Home / Other | 10 | 3.4% |
| Total | 294 | 100.0% |
Housing Structures by Occupancy in Penney Farms
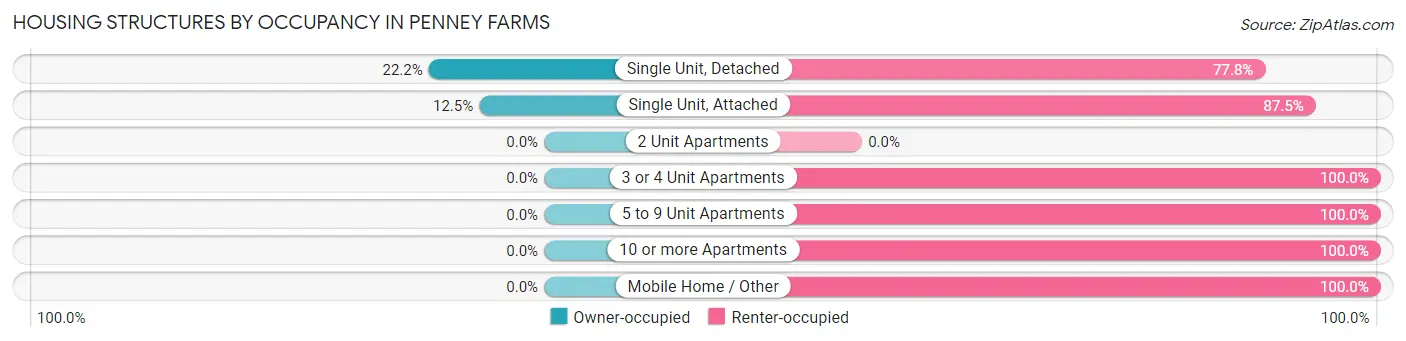
| Structure Type | Owner-occupied | Renter-occupied |
| Single Unit, Detached | 22 (22.2%) | 77 (77.8%) |
| Single Unit, Attached | 7 (12.5%) | 49 (87.5%) |
| 2 Unit Apartments | 0 (0.0%) | 0 (0.0%) |
| 3 or 4 Unit Apartments | 0 (0.0%) | 48 (100.0%) |
| 5 to 9 Unit Apartments | 0 (0.0%) | 23 (100.0%) |
| 10 or more Apartments | 0 (0.0%) | 58 (100.0%) |
| Mobile Home / Other | 0 (0.0%) | 10 (100.0%) |
| Total | 29 (9.9%) | 265 (90.1%) |
Housing Structures by Number of Rooms in Penney Farms
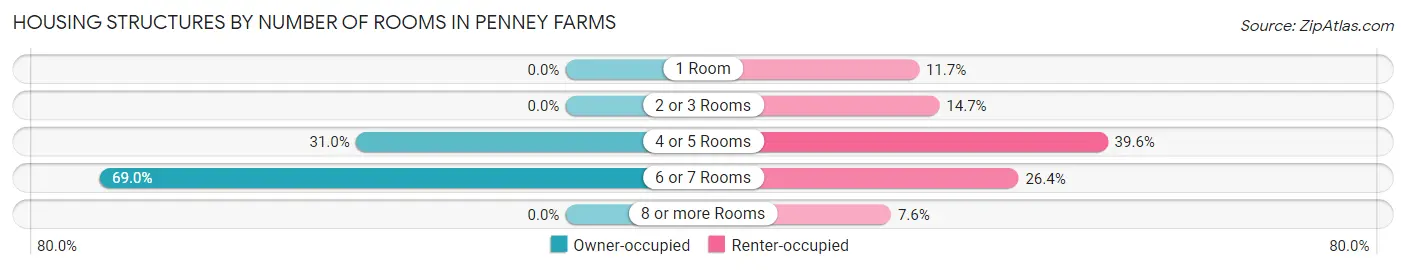
| Number of Rooms | Owner-occupied | Renter-occupied |
| 1 Room | 0 (0.0%) | 31 (11.7%) |
| 2 or 3 Rooms | 0 (0.0%) | 39 (14.7%) |
| 4 or 5 Rooms | 9 (31.0%) | 105 (39.6%) |
| 6 or 7 Rooms | 20 (69.0%) | 70 (26.4%) |
| 8 or more Rooms | 0 (0.0%) | 20 (7.5%) |
| Total | 29 (100.0%) | 265 (100.0%) |
Housing Structure by Heating Type in Penney Farms
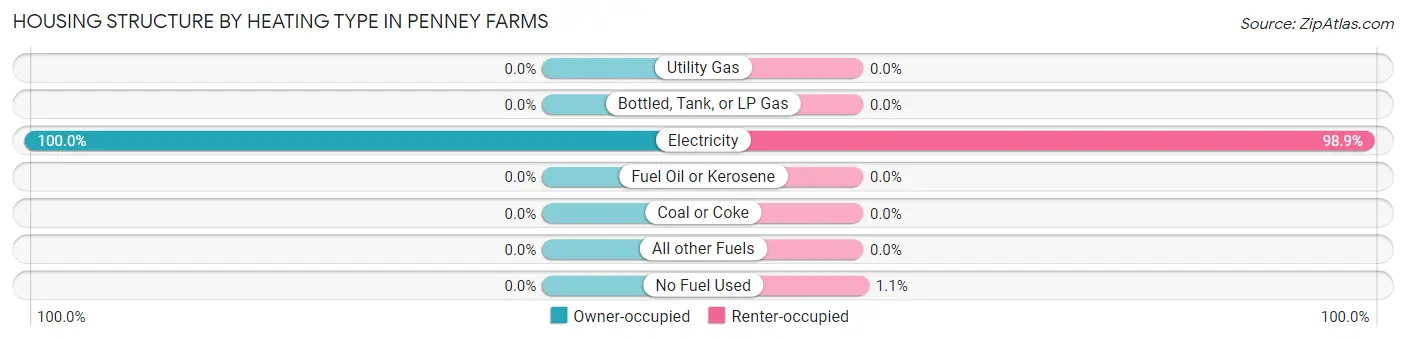
| Heating Type | Owner-occupied | Renter-occupied |
| Utility Gas | 0 (0.0%) | 0 (0.0%) |
| Bottled, Tank, or LP Gas | 0 (0.0%) | 0 (0.0%) |
| Electricity | 29 (100.0%) | 262 (98.9%) |
| Fuel Oil or Kerosene | 0 (0.0%) | 0 (0.0%) |
| Coal or Coke | 0 (0.0%) | 0 (0.0%) |
| All other Fuels | 0 (0.0%) | 0 (0.0%) |
| No Fuel Used | 0 (0.0%) | 3 (1.1%) |
| Total | 29 (100.0%) | 265 (100.0%) |
Household Vehicle Usage in Penney Farms
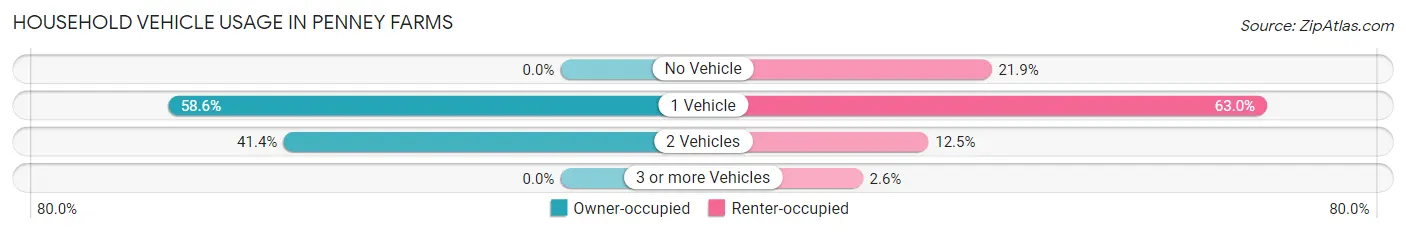
| Vehicles per Household | Owner-occupied | Renter-occupied |
| No Vehicle | 0 (0.0%) | 58 (21.9%) |
| 1 Vehicle | 17 (58.6%) | 167 (63.0%) |
| 2 Vehicles | 12 (41.4%) | 33 (12.4%) |
| 3 or more Vehicles | 0 (0.0%) | 7 (2.6%) |
| Total | 29 (100.0%) | 265 (100.0%) |
Real Estate & Mortgages in Penney Farms
Real Estate and Mortgage Overview in Penney Farms
| Characteristic | Without Mortgage | With Mortgage |
| Housing Units | 23 | 6 |
| Median Property Value | - | - |
| Median Household Income | - | - |
| Monthly Housing Costs | $361 | $0 |
| Real Estate Taxes | - | - |
Property Value by Mortgage Status in Penney Farms
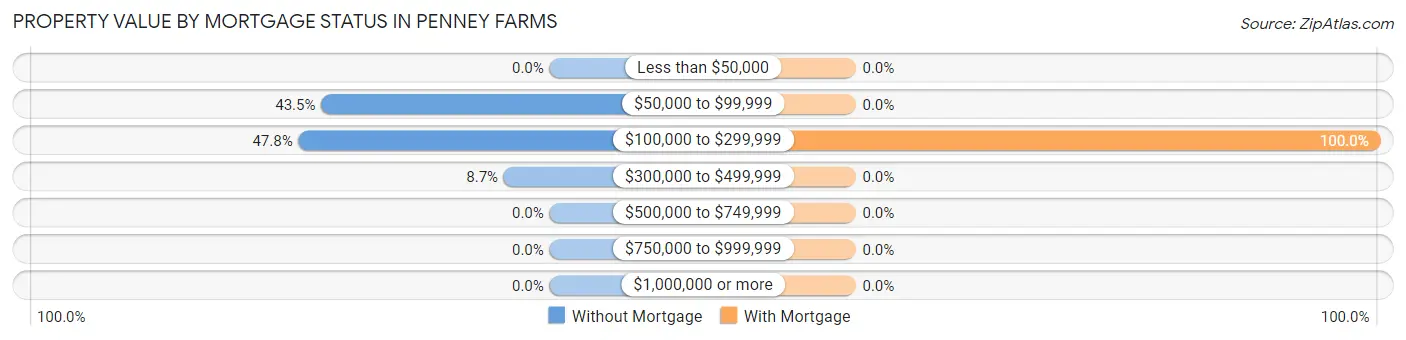
| Property Value | Without Mortgage | With Mortgage |
| Less than $50,000 | 0 (0.0%) | 0 (0.0%) |
| $50,000 to $99,999 | 10 (43.5%) | 0 (0.0%) |
| $100,000 to $299,999 | 11 (47.8%) | 6 (100.0%) |
| $300,000 to $499,999 | 2 (8.7%) | 0 (0.0%) |
| $500,000 to $749,999 | 0 (0.0%) | 0 (0.0%) |
| $750,000 to $999,999 | 0 (0.0%) | 0 (0.0%) |
| $1,000,000 or more | 0 (0.0%) | 0 (0.0%) |
| Total | 23 (100.0%) | 6 (100.0%) |
Household Income by Mortgage Status in Penney Farms
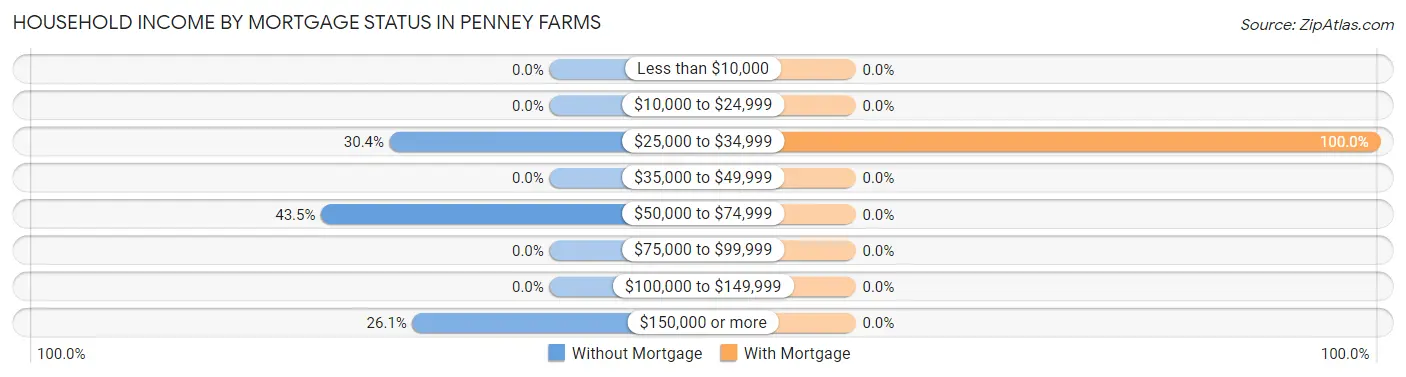
| Household Income | Without Mortgage | With Mortgage |
| Less than $10,000 | 0 (0.0%) | 0 (0.0%) |
| $10,000 to $24,999 | 0 (0.0%) | 0 (0.0%) |
| $25,000 to $34,999 | 7 (30.4%) | 6 (100.0%) |
| $35,000 to $49,999 | 0 (0.0%) | 0 (0.0%) |
| $50,000 to $74,999 | 10 (43.5%) | 0 (0.0%) |
| $75,000 to $99,999 | 0 (0.0%) | 0 (0.0%) |
| $100,000 to $149,999 | 0 (0.0%) | 0 (0.0%) |
| $150,000 or more | 6 (26.1%) | 0 (0.0%) |
| Total | 23 (100.0%) | 6 (100.0%) |
Property Value to Household Income Ratio in Penney Farms
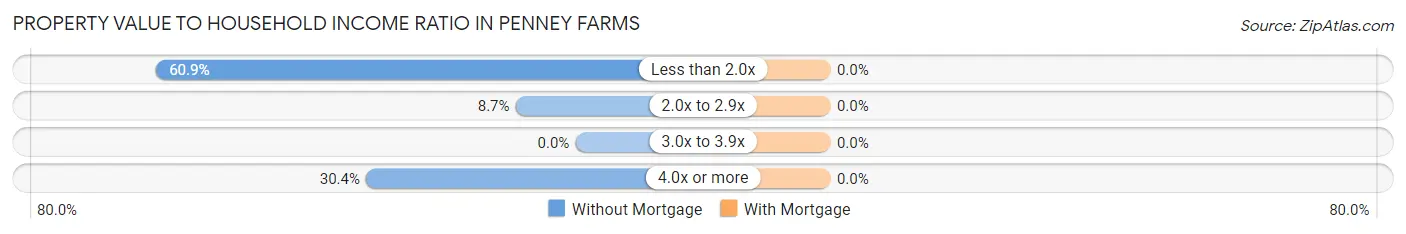
| Value-to-Income Ratio | Without Mortgage | With Mortgage |
| Less than 2.0x | 14 (60.9%) | 0 (0.0%) |
| 2.0x to 2.9x | 2 (8.7%) | 0 (0.0%) |
| 3.0x to 3.9x | 0 (0.0%) | 0 (0.0%) |
| 4.0x or more | 7 (30.4%) | 0 (0.0%) |
| Total | 23 (100.0%) | 6 (100.0%) |
Real Estate Taxes by Mortgage Status in Penney Farms
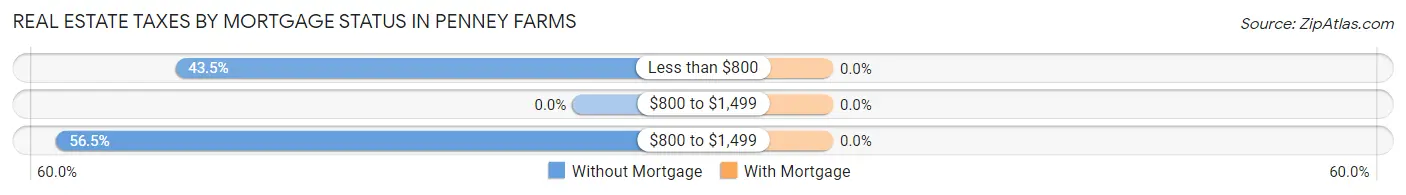
| Property Taxes | Without Mortgage | With Mortgage |
| Less than $800 | 10 (43.5%) | 0 (0.0%) |
| $800 to $1,499 | 0 (0.0%) | 0 (0.0%) |
| $800 to $1,499 | 13 (56.5%) | 0 (0.0%) |
| Total | 23 (100.0%) | 6 (100.0%) |
Health & Disability in Penney Farms
Health Insurance Coverage by Age in Penney Farms
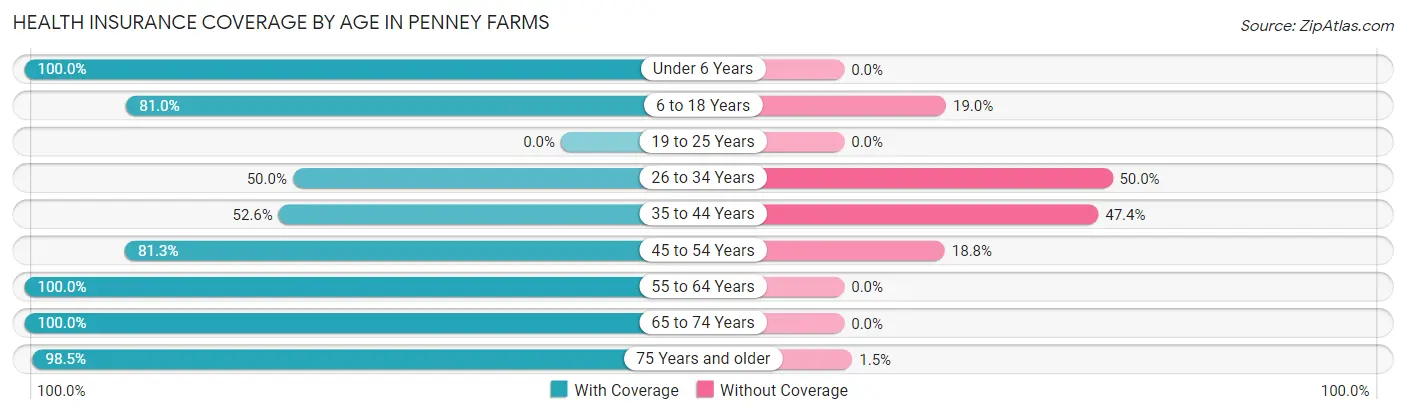
| Age Bracket | With Coverage | Without Coverage |
| Under 6 Years | 14 (100.0%) | 0 (0.0%) |
| 6 to 18 Years | 47 (81.0%) | 11 (19.0%) |
| 19 to 25 Years | 0 (0.0%) | 0 (0.0%) |
| 26 to 34 Years | 7 (50.0%) | 7 (50.0%) |
| 35 to 44 Years | 30 (52.6%) | 27 (47.4%) |
| 45 to 54 Years | 13 (81.2%) | 3 (18.8%) |
| 55 to 64 Years | 7 (100.0%) | 0 (0.0%) |
| 65 to 74 Years | 91 (100.0%) | 0 (0.0%) |
| 75 Years and older | 328 (98.5%) | 5 (1.5%) |
| Total | 537 (91.0%) | 53 (9.0%) |
Health Insurance Coverage by Citizenship Status in Penney Farms
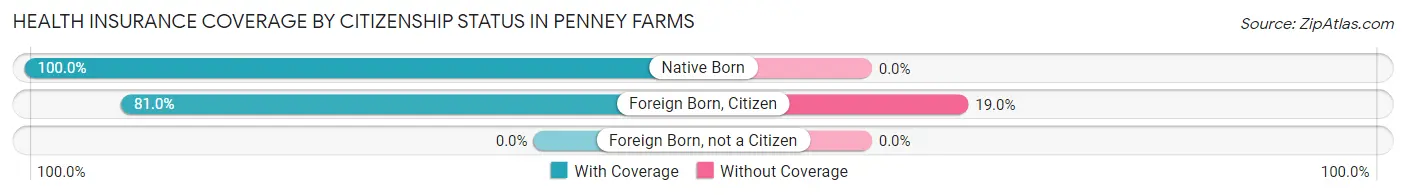
| Citizenship Status | With Coverage | Without Coverage |
| Native Born | 14 (100.0%) | 0 (0.0%) |
| Foreign Born, Citizen | 47 (81.0%) | 11 (19.0%) |
| Foreign Born, not a Citizen | 0 (0.0%) | 0 (0.0%) |
Health Insurance Coverage by Household Income in Penney Farms
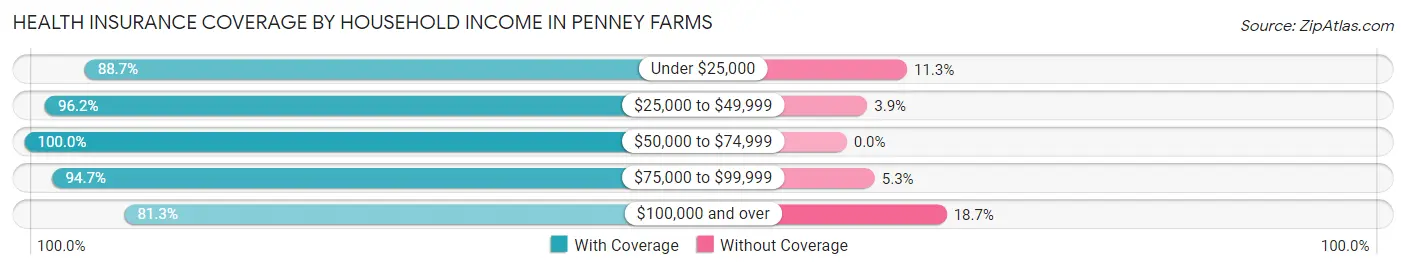
| Household Income | With Coverage | Without Coverage |
| Under $25,000 | 55 (88.7%) | 7 (11.3%) |
| $25,000 to $49,999 | 75 (96.2%) | 3 (3.8%) |
| $50,000 to $74,999 | 115 (100.0%) | 0 (0.0%) |
| $75,000 to $99,999 | 90 (94.7%) | 5 (5.3%) |
| $100,000 and over | 165 (81.3%) | 38 (18.7%) |
Public vs Private Health Insurance Coverage by Age in Penney Farms
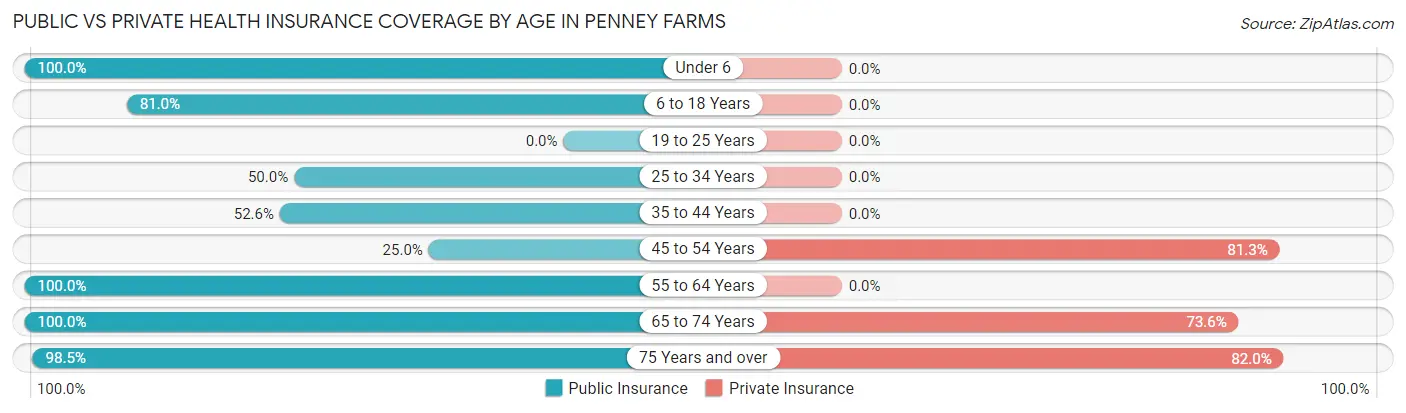
| Age Bracket | Public Insurance | Private Insurance |
| Under 6 | 14 (100.0%) | 0 (0.0%) |
| 6 to 18 Years | 47 (81.0%) | 0 (0.0%) |
| 19 to 25 Years | 0 (0.0%) | 0 (0.0%) |
| 25 to 34 Years | 7 (50.0%) | 0 (0.0%) |
| 35 to 44 Years | 30 (52.6%) | 0 (0.0%) |
| 45 to 54 Years | 4 (25.0%) | 13 (81.2%) |
| 55 to 64 Years | 7 (100.0%) | 0 (0.0%) |
| 65 to 74 Years | 91 (100.0%) | 67 (73.6%) |
| 75 Years and over | 328 (98.5%) | 273 (82.0%) |
| Total | 528 (89.5%) | 353 (59.8%) |
Disability Status by Sex by Age in Penney Farms
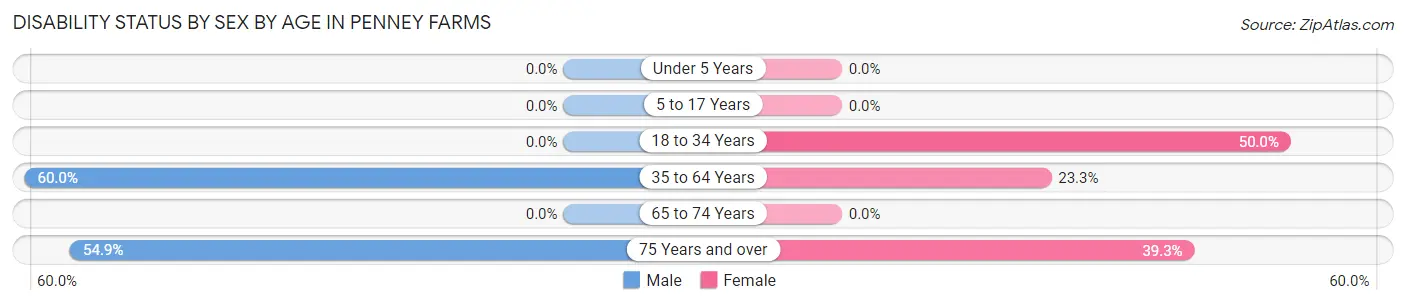
| Age Bracket | Male | Female |
| Under 5 Years | 0 (0.0%) | 0 (0.0%) |
| 5 to 17 Years | 0 (0.0%) | 0 (0.0%) |
| 18 to 34 Years | 0 (0.0%) | 7 (50.0%) |
| 35 to 64 Years | 30 (60.0%) | 7 (23.3%) |
| 65 to 74 Years | 0 (0.0%) | 0 (0.0%) |
| 75 Years and over | 78 (54.9%) | 75 (39.3%) |
Disability Class by Sex by Age in Penney Farms
Disability Class: Hearing Difficulty
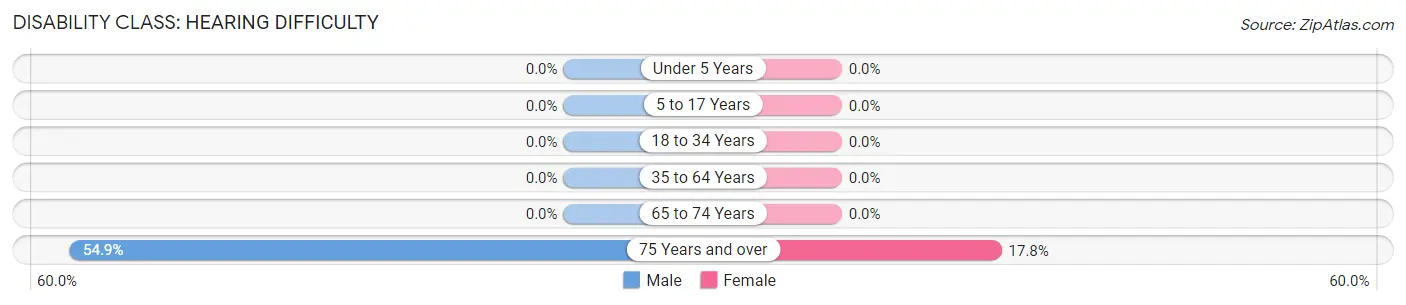
| Age Bracket | Male | Female |
| Under 5 Years | 0 (0.0%) | 0 (0.0%) |
| 5 to 17 Years | 0 (0.0%) | 0 (0.0%) |
| 18 to 34 Years | 0 (0.0%) | 0 (0.0%) |
| 35 to 64 Years | 0 (0.0%) | 0 (0.0%) |
| 65 to 74 Years | 0 (0.0%) | 0 (0.0%) |
| 75 Years and over | 78 (54.9%) | 34 (17.8%) |
Disability Class: Vision Difficulty
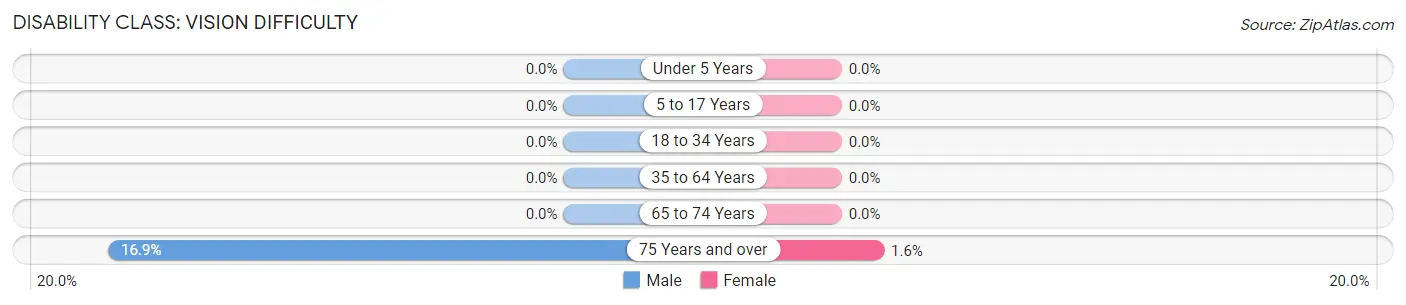
| Age Bracket | Male | Female |
| Under 5 Years | 0 (0.0%) | 0 (0.0%) |
| 5 to 17 Years | 0 (0.0%) | 0 (0.0%) |
| 18 to 34 Years | 0 (0.0%) | 0 (0.0%) |
| 35 to 64 Years | 0 (0.0%) | 0 (0.0%) |
| 65 to 74 Years | 0 (0.0%) | 0 (0.0%) |
| 75 Years and over | 24 (16.9%) | 3 (1.6%) |
Disability Class: Cognitive Difficulty
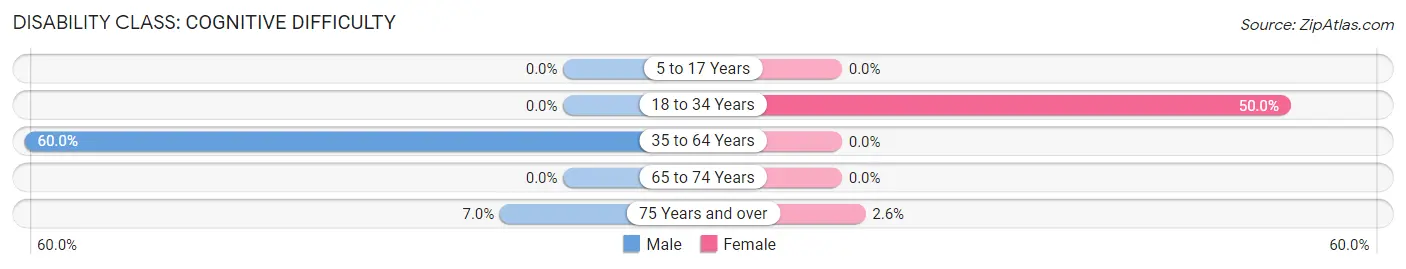
| Age Bracket | Male | Female |
| 5 to 17 Years | 0 (0.0%) | 0 (0.0%) |
| 18 to 34 Years | 0 (0.0%) | 7 (50.0%) |
| 35 to 64 Years | 30 (60.0%) | 0 (0.0%) |
| 65 to 74 Years | 0 (0.0%) | 0 (0.0%) |
| 75 Years and over | 10 (7.0%) | 5 (2.6%) |
Disability Class: Ambulatory Difficulty
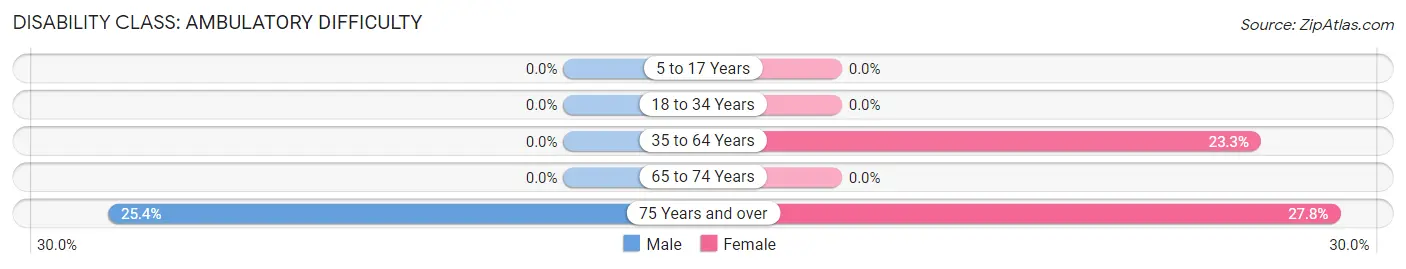
| Age Bracket | Male | Female |
| 5 to 17 Years | 0 (0.0%) | 0 (0.0%) |
| 18 to 34 Years | 0 (0.0%) | 0 (0.0%) |
| 35 to 64 Years | 0 (0.0%) | 7 (23.3%) |
| 65 to 74 Years | 0 (0.0%) | 0 (0.0%) |
| 75 Years and over | 36 (25.4%) | 53 (27.8%) |
Disability Class: Self-Care Difficulty
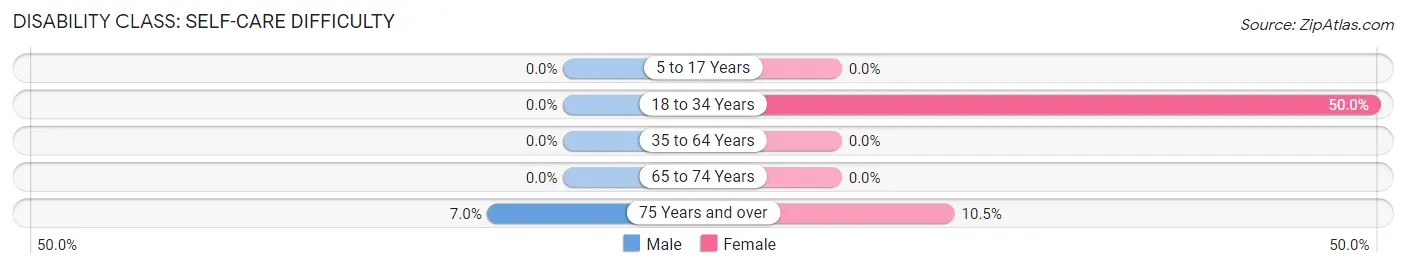
| Age Bracket | Male | Female |
| 5 to 17 Years | 0 (0.0%) | 0 (0.0%) |
| 18 to 34 Years | 0 (0.0%) | 7 (50.0%) |
| 35 to 64 Years | 0 (0.0%) | 0 (0.0%) |
| 65 to 74 Years | 0 (0.0%) | 0 (0.0%) |
| 75 Years and over | 10 (7.0%) | 20 (10.5%) |
Technology Access in Penney Farms
Computing Device Access in Penney Farms
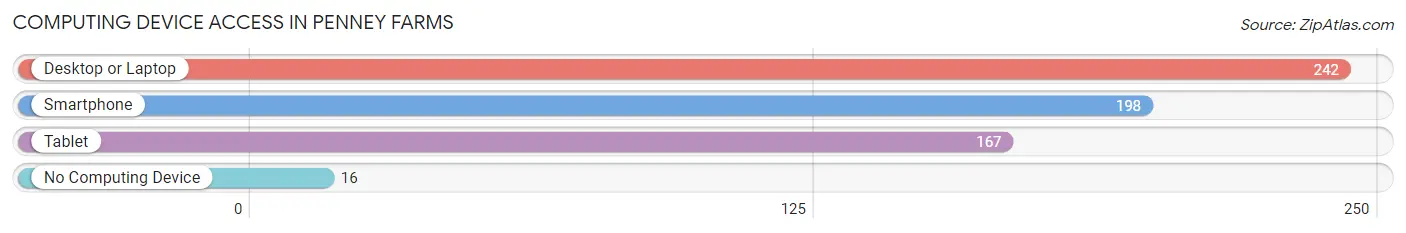
| Device Type | # Households | % Households |
| Desktop or Laptop | 242 | 82.3% |
| Smartphone | 198 | 67.3% |
| Tablet | 167 | 56.8% |
| No Computing Device | 16 | 5.4% |
| Total | 294 | 100.0% |
Internet Access in Penney Farms
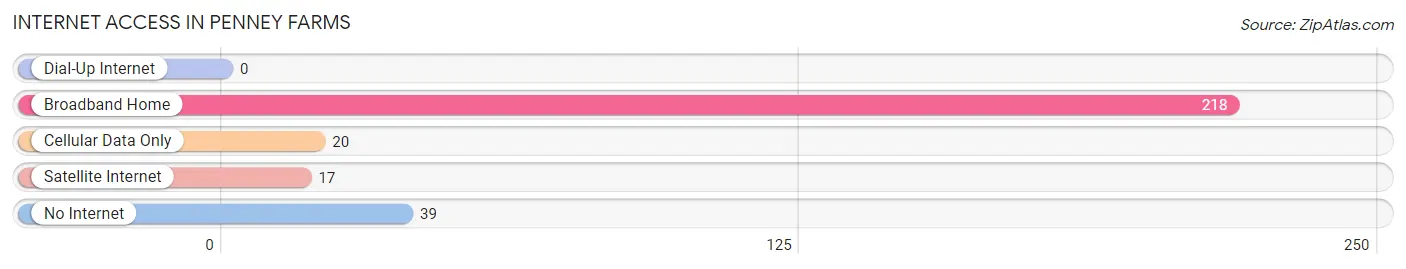
| Internet Type | # Households | % Households |
| Dial-Up Internet | 0 | 0.0% |
| Broadband Home | 218 | 74.2% |
| Cellular Data Only | 20 | 6.8% |
| Satellite Internet | 17 | 5.8% |
| No Internet | 39 | 13.3% |
| Total | 294 | 100.0% |
Penney Farms Summary
Penney Farms is a small town located in Clay County, Florida. It is situated on the St. Johns River, about 25 miles south of Jacksonville. The town was founded in 1926 by department store magnate J.C. Penney, who wanted to create a retirement community for elderly people of modest means. The town was incorporated in 1927 and has a population of about 600 people.
History
Penney Farms was founded in 1926 by J.C. Penney, the founder of the J.C. Penney department store chain. Penney had a vision of creating a retirement community for elderly people of modest means. He purchased a large tract of land in Clay County, Florida and began to develop the town. He built a hotel, a hospital, a church, a library, and a school. He also donated land for a park and a golf course.
Penney Farms was incorporated in 1927 and the town quickly grew. By the 1930s, the town had a population of over 1,000 people. The town was known for its hospitality and its strong sense of community.
In the 1950s, the town began to decline. The population dropped to about 500 people and the town began to struggle financially. In the 1970s, the town was declared a National Historic Landmark. This designation helped to preserve the town's historic buildings and attract new residents.
Geography
Penney Farms is located in Clay County, Florida. It is situated on the St. Johns River, about 25 miles south of Jacksonville. The town is surrounded by a number of small lakes and ponds, including Lake Asbury, Lake Geneva, and Lake Penney. The town is also home to a number of parks, including Penney Farms Park and Penney Farms Golf Course.
Economy
The economy of Penney Farms is largely based on tourism. The town is home to a number of historic sites, including the J.C. Penney Memorial Church and the Penney Farms Museum. The town also hosts a number of festivals and events throughout the year, including the Penney Farms Festival and the Penney Farms Art Festival.
The town is also home to a number of small businesses, including restaurants, shops, and art galleries. The town is also home to a number of bed and breakfasts, which attract visitors from all over the world.
Demographics
As of the 2010 census, the population of Penney Farms was 590. The racial makeup of the town was 94.3% White, 2.7% African American, 0.2% Native American, 0.2% Asian, 0.2% from other races, and 2.5% from two or more races. Hispanic or Latino of any race were 1.7% of the population.
The median income for a household in Penney Farms was $37,500, and the median income for a family was $45,000. The per capita income for the town was $19,000. About 8.3% of families and 10.3% of the population were below the poverty line, including 14.3% of those under age 18 and 8.3% of those age 65 or over.
Common Questions
What is Per Capita Income in Penney Farms?
Per Capita income in Penney Farms is $33,239.
What is the Median Family Income in Penney Farms?
Median Family Income in Penney Farms is $87,039.
What is the Median Household income in Penney Farms?
Median Household Income in Penney Farms is $63,333.
What is Income or Wage Gap in Penney Farms?
Income or Wage Gap in Penney Farms is 54.3%.
Women in Penney Farms earn 45.7 cents for every dollar earned by a man.
What is Inequality or Gini Index in Penney Farms?
Inequality or Gini Index in Penney Farms is 0.38.
What is the Total Population of Penney Farms?
Total Population of Penney Farms is 721.
What is the Total Male Population of Penney Farms?
Total Male Population of Penney Farms is 314.
What is the Total Female Population of Penney Farms?
Total Female Population of Penney Farms is 407.
What is the Ratio of Males per 100 Females in Penney Farms?
There are 77.15 Males per 100 Females in Penney Farms.
What is the Ratio of Females per 100 Males in Penney Farms?
There are 129.62 Females per 100 Males in Penney Farms.
What is the Median Population Age in Penney Farms?
Median Population Age in Penney Farms is 76.5 Years.
What is the Average Family Size in Penney Farms
Average Family Size in Penney Farms is 2.5 People.
What is the Average Household Size in Penney Farms
Average Household Size in Penney Farms is 1.9 People.
How Large is the Labor Force in Penney Farms?
There are 61 People in the Labor Forcein in Penney Farms.
What is the Percentage of People in the Labor Force in Penney Farms?
9.1% of People are in the Labor Force in Penney Farms.