Fort Leonard Wood, MO Map & Demographics
Fort Leonard Wood Map
Fort Leonard Wood Overview
$20,304
PER CAPITA INCOME
$72,782
AVG FAMILY INCOME
$64,890
AVG HOUSEHOLD INCOME
8.2%
WAGE / INCOME GAP [ % ]
91.8¢/ $1
WAGE / INCOME GAP [ $ ]
0.32
INEQUALITY / GINI INDEX
15,615
TOTAL POPULATION
9,503
MALE POPULATION
6,112
FEMALE POPULATION
155.48
MALES / 100 FEMALES
64.32
FEMALES / 100 MALES
20.6
MEDIAN AGE
4.0
AVG FAMILY SIZE
3.1
AVG HOUSEHOLD SIZE
10,950
LABOR FORCE [ PEOPLE ]
83.8%
PERCENT IN LABOR FORCE
4.3%
UNEMPLOYMENT RATE
Fort Leonard Wood Zip Codes
Fort Leonard Wood Area Codes
Income in Fort Leonard Wood
Income Overview in Fort Leonard Wood
Per Capita Income in Fort Leonard Wood is $20,304, while median incomes of families and households are $72,782 and $64,890 respectively.
| Characteristic | Number | Measure |
| Per Capita Income | 15,615 | $20,304 |
| Median Family Income | 1,424 | $72,782 |
| Mean Family Income | 1,424 | $81,917 |
| Median Household Income | 2,028 | $64,890 |
| Mean Household Income | 2,028 | $70,969 |
| Income Deficit | 1,424 | $0 |
| Wage / Income Gap (%) | 15,615 | 8.18% |
| Wage / Income Gap ($) | 15,615 | 91.82¢ per $1 |
| Gini / Inequality Index | 15,615 | 0.32 |
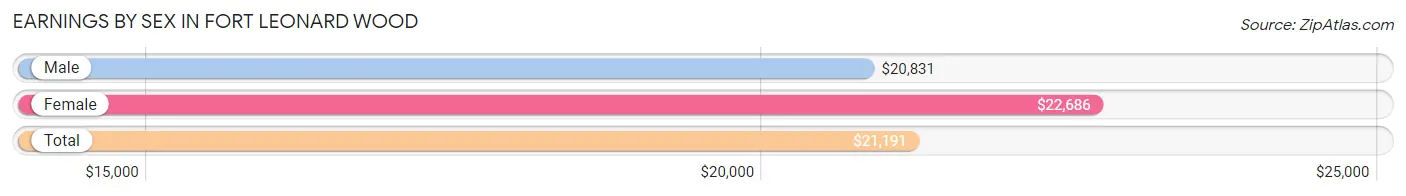
Earnings by Sex in Fort Leonard Wood
Average Earnings in Fort Leonard Wood are $21,191, $20,831 for men and $22,686 for women, a difference of 8.2%.
| Sex | Number | Average Earnings |
| Male | 7,347 (63.1%) | $20,831 |
| Female | 4,287 (36.8%) | $22,686 |
| Total | 11,634 (100.0%) | $21,191 |
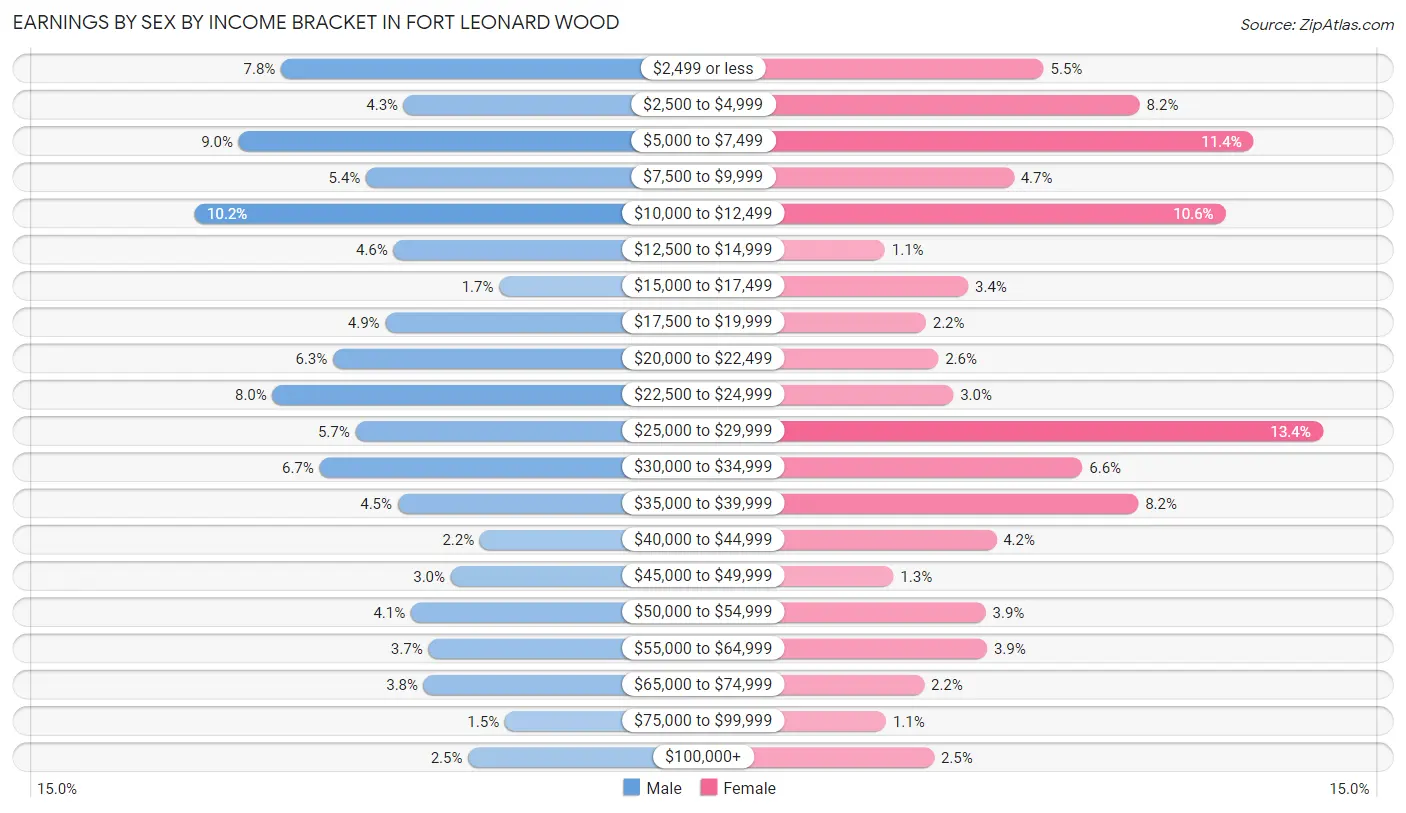
Earnings by Sex by Income Bracket in Fort Leonard Wood
The most common earnings brackets in Fort Leonard Wood are $10,000 to $12,499 for men (752 | 10.2%) and $25,000 to $29,999 for women (573 | 13.4%).
| Income | Male | Female |
| $2,499 or less | 572 (7.8%) | 237 (5.5%) |
| $2,500 to $4,999 | 319 (4.3%) | 353 (8.2%) |
| $5,000 to $7,499 | 660 (9.0%) | 490 (11.4%) |
| $7,500 to $9,999 | 397 (5.4%) | 201 (4.7%) |
| $10,000 to $12,499 | 752 (10.2%) | 456 (10.6%) |
| $12,500 to $14,999 | 340 (4.6%) | 46 (1.1%) |
| $15,000 to $17,499 | 122 (1.7%) | 146 (3.4%) |
| $17,500 to $19,999 | 357 (4.9%) | 95 (2.2%) |
| $20,000 to $22,499 | 465 (6.3%) | 110 (2.6%) |
| $22,500 to $24,999 | 590 (8.0%) | 128 (3.0%) |
| $25,000 to $29,999 | 419 (5.7%) | 573 (13.4%) |
| $30,000 to $34,999 | 493 (6.7%) | 284 (6.6%) |
| $35,000 to $39,999 | 331 (4.5%) | 351 (8.2%) |
| $40,000 to $44,999 | 162 (2.2%) | 180 (4.2%) |
| $45,000 to $49,999 | 222 (3.0%) | 56 (1.3%) |
| $50,000 to $54,999 | 304 (4.1%) | 167 (3.9%) |
| $55,000 to $64,999 | 268 (3.6%) | 169 (3.9%) |
| $65,000 to $74,999 | 278 (3.8%) | 93 (2.2%) |
| $75,000 to $99,999 | 110 (1.5%) | 47 (1.1%) |
| $100,000+ | 186 (2.5%) | 105 (2.5%) |
| Total | 7,347 (100.0%) | 4,287 (100.0%) |
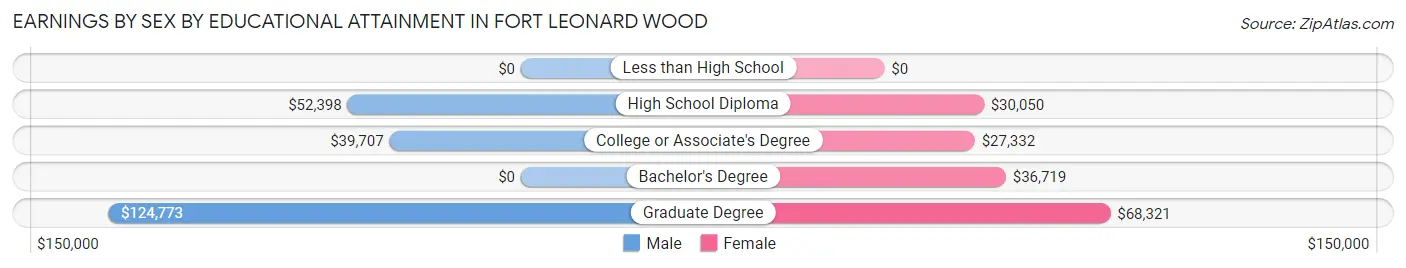
Earnings by Sex by Educational Attainment in Fort Leonard Wood
Average earnings in Fort Leonard Wood are $45,445 for men and $30,932 for women, a difference of 31.9%. Men with an educational attainment of graduate degree enjoy the highest average annual earnings of $124,773, while those with college or associate's degree education earn the least with $39,707. Women with an educational attainment of graduate degree earn the most with the average annual earnings of $68,321, while those with college or associate's degree education have the smallest earnings of $27,332.
| Educational Attainment | Male Income | Female Income |
| Less than High School | - | - |
| High School Diploma | $52,398 | $30,050 |
| College or Associate's Degree | $39,707 | $27,332 |
| Bachelor's Degree | - | - |
| Graduate Degree | $124,773 | $68,321 |
| Total | $45,445 | $30,932 |
Family Income in Fort Leonard Wood
Family Income Brackets in Fort Leonard Wood
According to the Fort Leonard Wood family income data, there are 540 families falling into the $50,000 to $74,999 income range, which is the most common income bracket and makes up 37.9% of all families. Conversely, the less than $10,000 income bracket is the least frequent group with only 9 families (0.6%) belonging to this category.
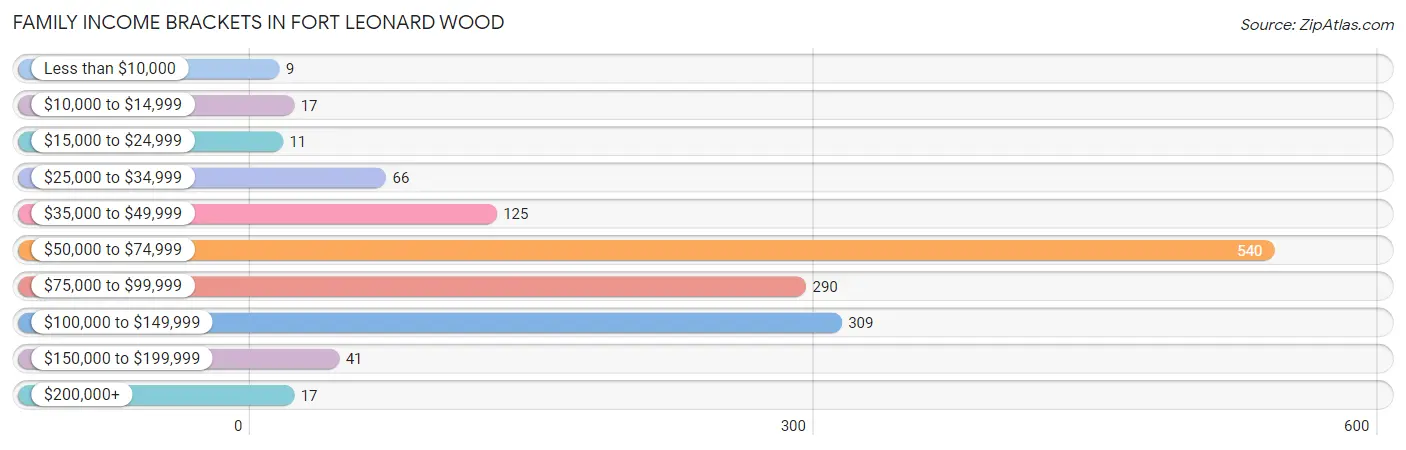
| Income Bracket | # Families | % Families |
| Less than $10,000 | 9 | 0.6% |
| $10,000 to $14,999 | 17 | 1.2% |
| $15,000 to $24,999 | 11 | 0.8% |
| $25,000 to $34,999 | 66 | 4.6% |
| $35,000 to $49,999 | 125 | 8.8% |
| $50,000 to $74,999 | 540 | 37.9% |
| $75,000 to $99,999 | 290 | 20.4% |
| $100,000 to $149,999 | 309 | 21.7% |
| $150,000 to $199,999 | 41 | 2.9% |
| $200,000+ | 17 | 1.2% |
Family Income by Famaliy Size in Fort Leonard Wood
3-person families (290 | 20.4%) account for the highest median family income in Fort Leonard Wood with $95,500 per family, while 2-person families (316 | 22.2%) have the highest median income of $31,889 per family member.
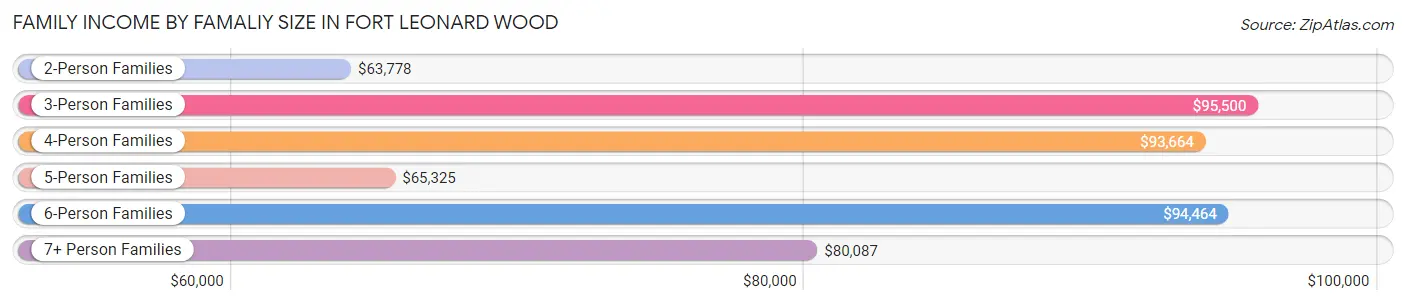
| Income Bracket | # Families | Median Income |
| 2-Person Families | 316 (22.2%) | $63,778 |
| 3-Person Families | 290 (20.4%) | $95,500 |
| 4-Person Families | 323 (22.7%) | $93,664 |
| 5-Person Families | 301 (21.1%) | $65,325 |
| 6-Person Families | 83 (5.8%) | $94,464 |
| 7+ Person Families | 111 (7.8%) | $80,087 |
| Total | 1,424 (100.0%) | $72,782 |
Family Income by Number of Earners in Fort Leonard Wood
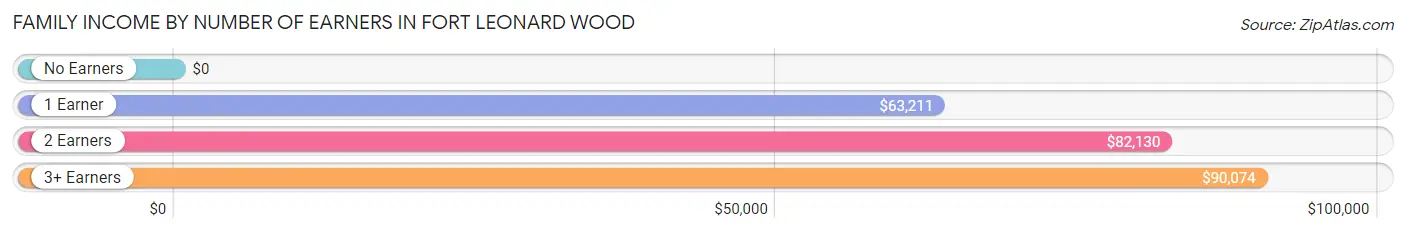
| Number of Earners | # Families | Median Income |
| No Earners | 8 (0.6%) | $0 |
| 1 Earner | 625 (43.9%) | $63,211 |
| 2 Earners | 748 (52.5%) | $82,130 |
| 3+ Earners | 43 (3.0%) | $90,074 |
| Total | 1,424 (100.0%) | $72,782 |
Household Income in Fort Leonard Wood
Household Income Brackets in Fort Leonard Wood
With 578 households falling in the category, the $50,000 to $74,999 income range is the most frequent in Fort Leonard Wood, accounting for 28.5% of all households. In contrast, only 16 households (0.8%) fall into the $200,000+ income bracket, making it the least populous group.
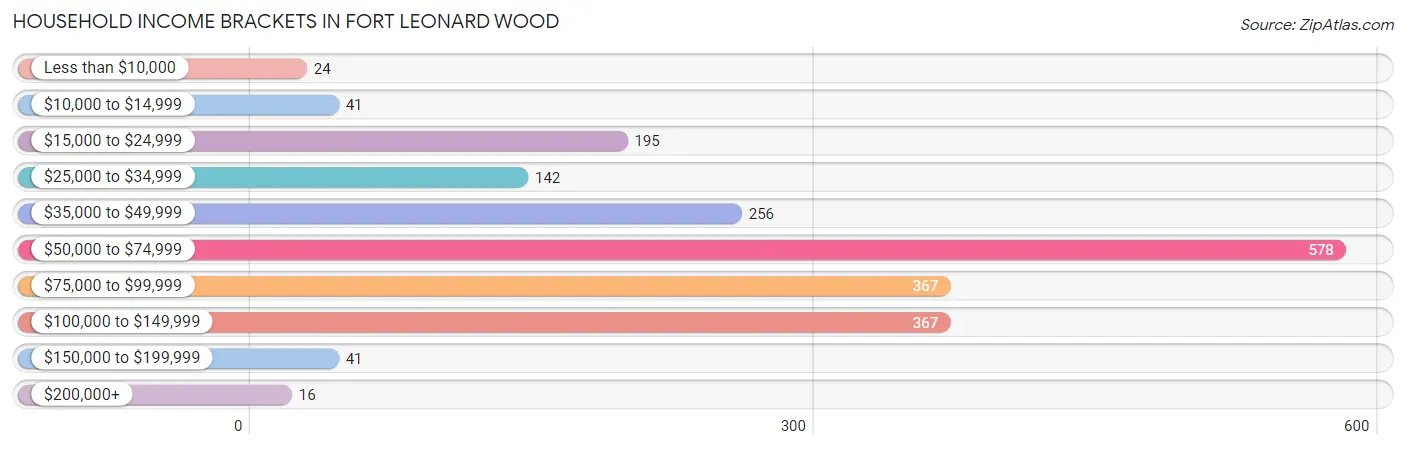
| Income Bracket | # Households | % Households |
| Less than $10,000 | 24 | 1.2% |
| $10,000 to $14,999 | 41 | 2.0% |
| $15,000 to $24,999 | 195 | 9.6% |
| $25,000 to $34,999 | 142 | 7.0% |
| $35,000 to $49,999 | 256 | 12.6% |
| $50,000 to $74,999 | 578 | 28.5% |
| $75,000 to $99,999 | 367 | 18.1% |
| $100,000 to $149,999 | 367 | 18.1% |
| $150,000 to $199,999 | 41 | 2.0% |
| $200,000+ | 16 | 0.8% |
Household Income by Householder Age in Fort Leonard Wood
The median household income in Fort Leonard Wood is $64,890, with the highest median household income of $108,364 found in the 45 to 64 years age bracket for the primary householder. A total of 348 households (17.2%) fall into this category. Meanwhile, the 65+ years age bracket for the primary householder has the lowest median household income of $0, with 22 households (1.1%) in this group.
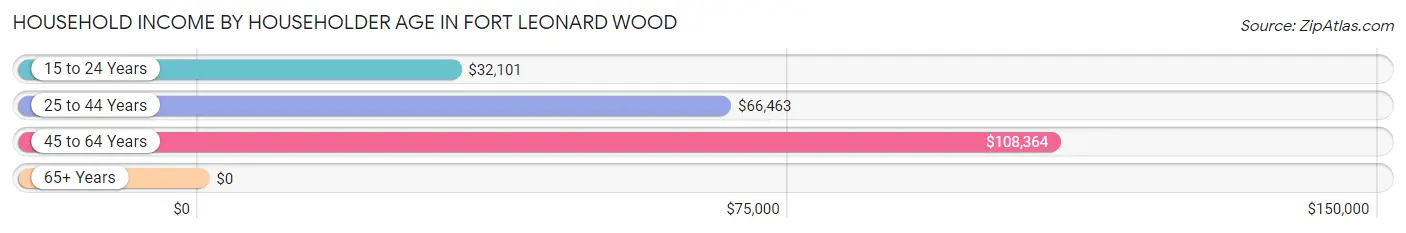
| Income Bracket | # Households | Median Income |
| 15 to 24 Years | 389 (19.2%) | $32,101 |
| 25 to 44 Years | 1,269 (62.6%) | $66,463 |
| 45 to 64 Years | 348 (17.2%) | $108,364 |
| 65+ Years | 22 (1.1%) | $0 |
| Total | 2,028 (100.0%) | $64,890 |
Poverty in Fort Leonard Wood
Income Below Poverty by Sex and Age in Fort Leonard Wood
With 4.9% poverty level for males and 7.5% for females among the residents of Fort Leonard Wood, under 5 year old males and 65 to 74 year old females are the most vulnerable to poverty, with 131 males (23.4%) and 17 females (37.8%) in their respective age groups living below the poverty level.
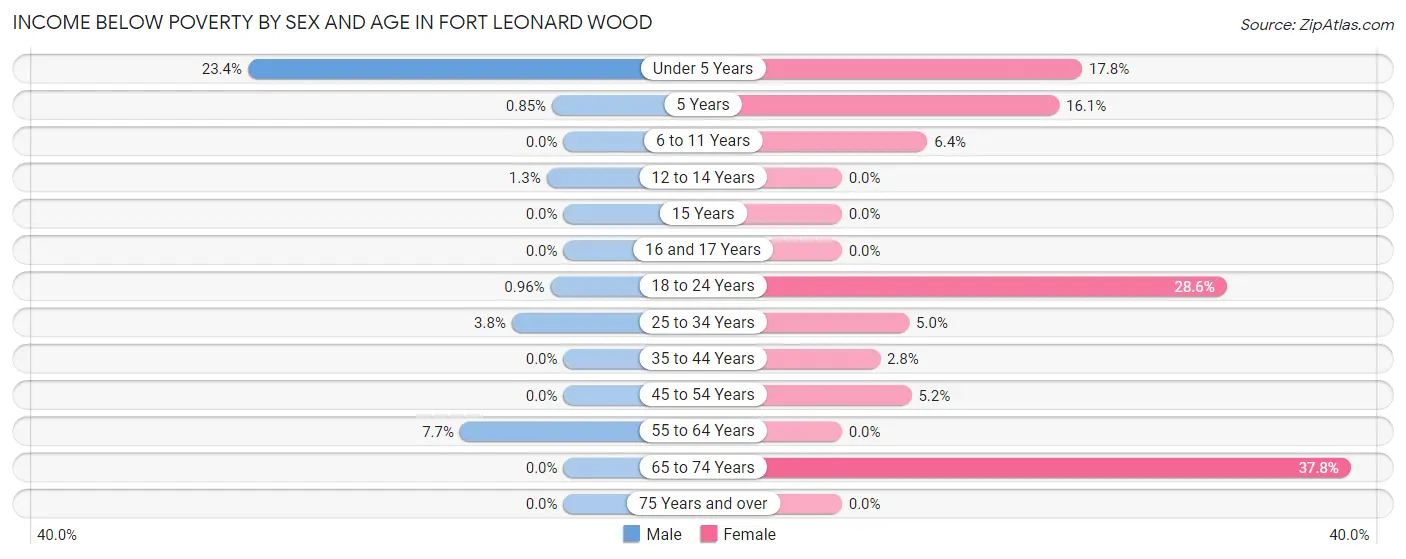
| Age Bracket | Male | Female |
| Under 5 Years | 131 (23.4%) | 66 (17.8%) |
| 5 Years | 1 (0.9%) | 10 (16.1%) |
| 6 to 11 Years | 0 (0.0%) | 27 (6.4%) |
| 12 to 14 Years | 2 (1.3%) | 0 (0.0%) |
| 15 Years | 0 (0.0%) | 0 (0.0%) |
| 16 and 17 Years | 0 (0.0%) | 0 (0.0%) |
| 18 to 24 Years | 5 (1.0%) | 40 (28.6%) |
| 25 to 34 Years | 26 (3.8%) | 32 (5.0%) |
| 35 to 44 Years | 0 (0.0%) | 16 (2.8%) |
| 45 to 54 Years | 0 (0.0%) | 17 (5.2%) |
| 55 to 64 Years | 3 (7.7%) | 0 (0.0%) |
| 65 to 74 Years | 0 (0.0%) | 17 (37.8%) |
| 75 Years and over | 0 (0.0%) | 0 (0.0%) |
| Total | 168 (4.9%) | 225 (7.5%) |
Income Above Poverty by Sex and Age in Fort Leonard Wood
According to the poverty statistics in Fort Leonard Wood, males aged 6 to 11 years and females aged 12 to 14 years are the age groups that are most secure financially, with 100.0% of males and 100.0% of females in these age groups living above the poverty line.
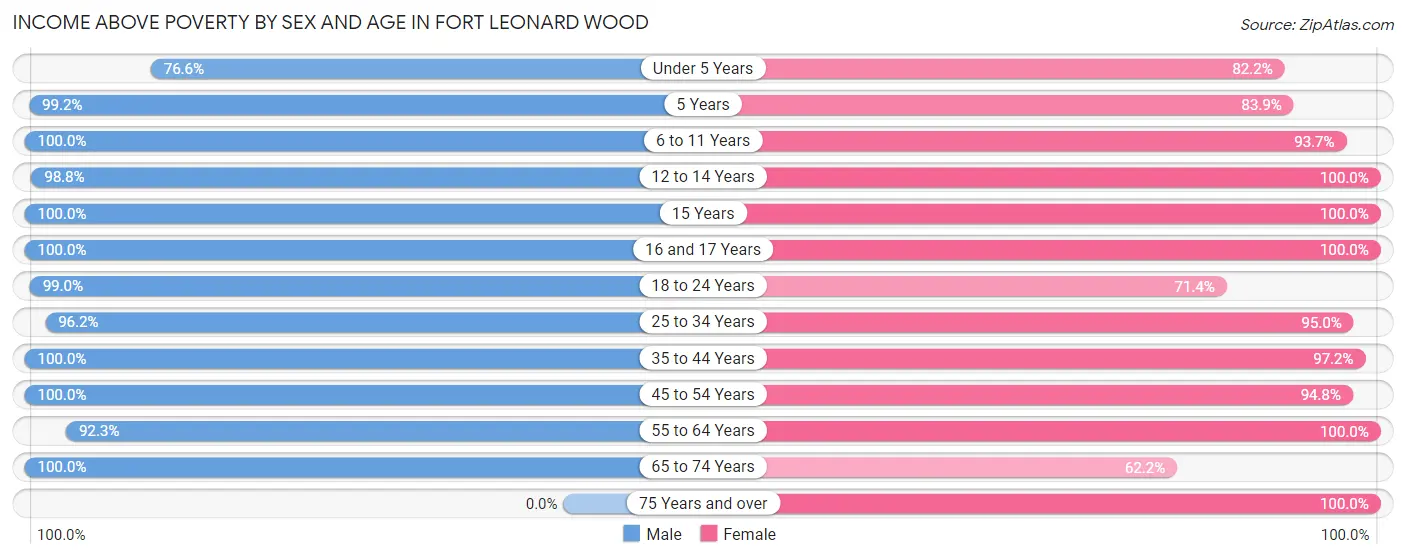
| Age Bracket | Male | Female |
| Under 5 Years | 428 (76.6%) | 304 (82.2%) |
| 5 Years | 116 (99.2%) | 52 (83.9%) |
| 6 to 11 Years | 639 (100.0%) | 398 (93.6%) |
| 12 to 14 Years | 158 (98.8%) | 171 (100.0%) |
| 15 Years | 19 (100.0%) | 26 (100.0%) |
| 16 and 17 Years | 71 (100.0%) | 85 (100.0%) |
| 18 to 24 Years | 517 (99.0%) | 100 (71.4%) |
| 25 to 34 Years | 652 (96.2%) | 608 (95.0%) |
| 35 to 44 Years | 476 (100.0%) | 548 (97.2%) |
| 45 to 54 Years | 114 (100.0%) | 312 (94.8%) |
| 55 to 64 Years | 36 (92.3%) | 120 (100.0%) |
| 65 to 74 Years | 7 (100.0%) | 28 (62.2%) |
| 75 Years and over | 0 (0.0%) | 5 (100.0%) |
| Total | 3,233 (95.1%) | 2,757 (92.4%) |
Income Below Poverty Among Married-Couple Families in Fort Leonard Wood
The poverty statistics for married-couple families in Fort Leonard Wood show that 2.0% or 25 of the total 1,243 families live below the poverty line. Families with 3 or 4 children have the highest poverty rate of 6.3%, comprising of 25 families. On the other hand, families with no children have the lowest poverty rate of 0.0%, which includes 0 families.
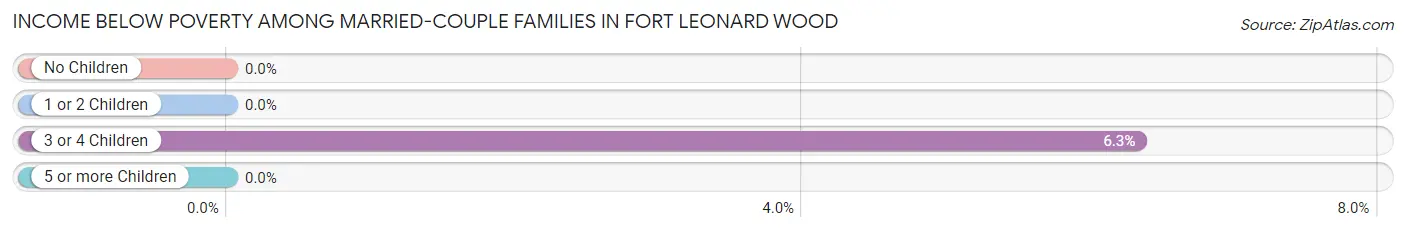
| Children | Above Poverty | Below Poverty |
| No Children | 250 (100.0%) | 0 (0.0%) |
| 1 or 2 Children | 544 (100.0%) | 0 (0.0%) |
| 3 or 4 Children | 370 (93.7%) | 25 (6.3%) |
| 5 or more Children | 54 (100.0%) | 0 (0.0%) |
| Total | 1,218 (98.0%) | 25 (2.0%) |
Income Below Poverty Among Single-Parent Households in Fort Leonard Wood
According to the poverty data in Fort Leonard Wood, 4.9% or 5 single-father households and 35.4% or 28 single-mother households are living below the poverty line. Among single-father households, those with 3 or 4 children have the highest poverty rate, with 5 households (62.5%) experiencing poverty. Likewise, among single-mother households, those with 1 or 2 children have the highest poverty rate, with 28 households (43.8%) falling below the poverty line.
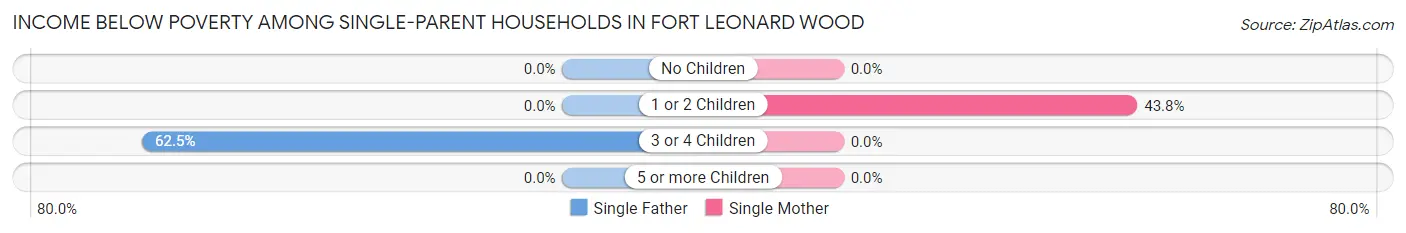
| Children | Single Father | Single Mother |
| No Children | 0 (0.0%) | 0 (0.0%) |
| 1 or 2 Children | 0 (0.0%) | 28 (43.8%) |
| 3 or 4 Children | 5 (62.5%) | 0 (0.0%) |
| 5 or more Children | 0 (0.0%) | 0 (0.0%) |
| Total | 5 (4.9%) | 28 (35.4%) |
Income Below Poverty Among Married-Couple vs Single-Parent Households in Fort Leonard Wood
The poverty data for Fort Leonard Wood shows that 25 of the married-couple family households (2.0%) and 33 of the single-parent households (18.2%) are living below the poverty level. Within the married-couple family households, those with 3 or 4 children have the highest poverty rate, with 25 households (6.3%) falling below the poverty line. Among the single-parent households, those with 3 or 4 children have the highest poverty rate, with 5 household (62.5%) living below poverty.
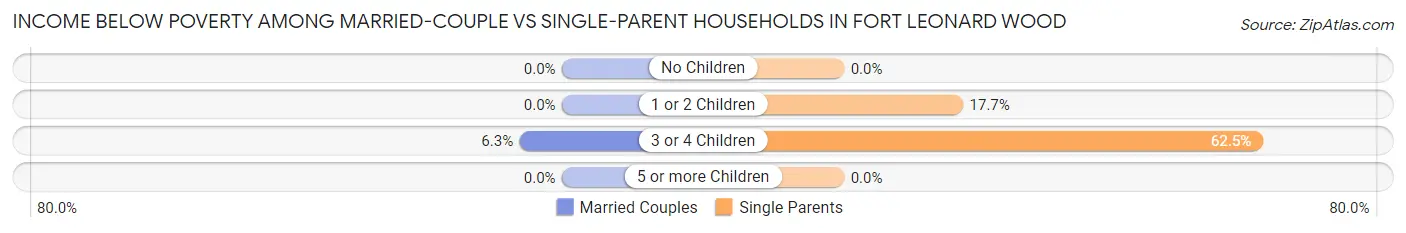
| Children | Married-Couple Families | Single-Parent Households |
| No Children | 0 (0.0%) | 0 (0.0%) |
| 1 or 2 Children | 0 (0.0%) | 28 (17.7%) |
| 3 or 4 Children | 25 (6.3%) | 5 (62.5%) |
| 5 or more Children | 0 (0.0%) | 0 (0.0%) |
| Total | 25 (2.0%) | 33 (18.2%) |
Race in Fort Leonard Wood
The most populous races in Fort Leonard Wood are White / Caucasian (8,853 | 56.7%), Hispanic or Latino (3,733 | 23.9%), and Black / African American (2,751 | 17.6%).
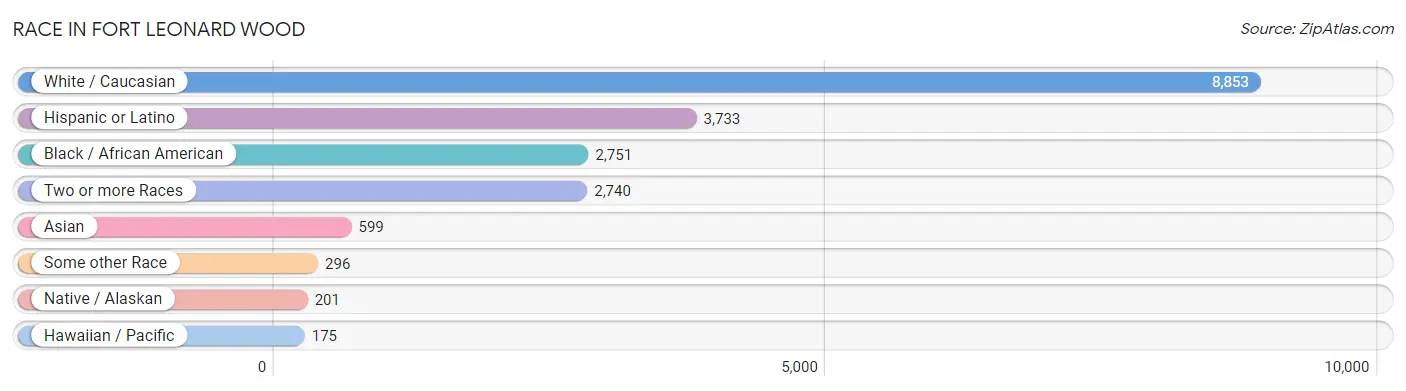
| Race | # Population | % Population |
| Asian | 599 | 3.8% |
| Black / African American | 2,751 | 17.6% |
| Hawaiian / Pacific | 175 | 1.1% |
| Hispanic or Latino | 3,733 | 23.9% |
| Native / Alaskan | 201 | 1.3% |
| White / Caucasian | 8,853 | 56.7% |
| Two or more Races | 2,740 | 17.5% |
| Some other Race | 296 | 1.9% |
| Total | 15,615 | 100.0% |
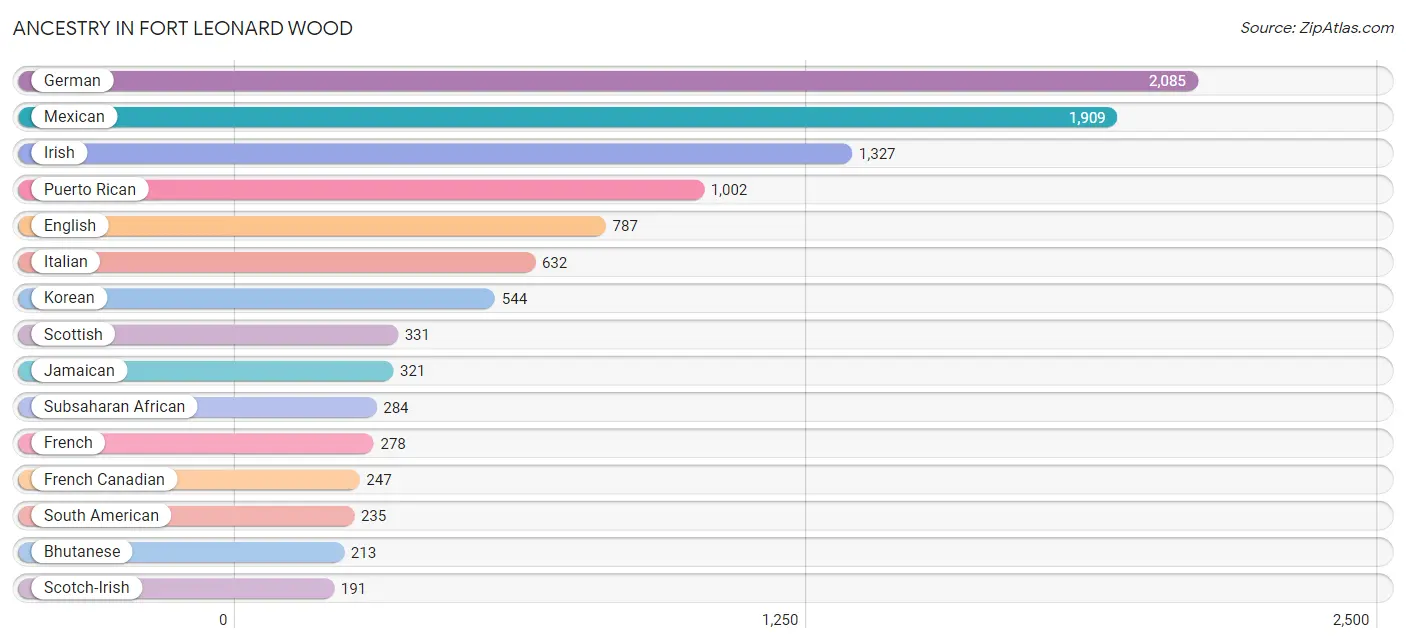
Ancestry in Fort Leonard Wood
The most populous ancestries reported in Fort Leonard Wood are German (2,085 | 13.4%), Mexican (1,909 | 12.2%), Irish (1,327 | 8.5%), Puerto Rican (1,002 | 6.4%), and English (787 | 5.0%), together accounting for 45.5% of all Fort Leonard Wood residents.
| Ancestry | # Population | % Population |
| African | 56 | 0.4% |
| American | 126 | 0.8% |
| Arab | 4 | 0.0% |
| Bhutanese | 213 | 1.4% |
| British | 127 | 0.8% |
| British West Indian | 27 | 0.2% |
| Burmese | 161 | 1.0% |
| Central American | 157 | 1.0% |
| Cherokee | 102 | 0.6% |
| Choctaw | 10 | 0.1% |
| Colombian | 114 | 0.7% |
| Cuban | 74 | 0.5% |
| Czech | 68 | 0.4% |
| Dominican | 188 | 1.2% |
| Ecuadorian | 107 | 0.7% |
| English | 787 | 5.0% |
| European | 76 | 0.5% |
| French | 278 | 1.8% |
| French Canadian | 247 | 1.6% |
| German | 2,085 | 13.4% |
| Ghanaian | 90 | 0.6% |
| Guamanian / Chamorro | 82 | 0.5% |
| Haitian | 27 | 0.2% |
| Honduran | 10 | 0.1% |
| Hungarian | 33 | 0.2% |
| Indian (Asian) | 87 | 0.6% |
| Irish | 1,327 | 8.5% |
| Iroquois | 52 | 0.3% |
| Italian | 632 | 4.1% |
| Jamaican | 321 | 2.1% |
| Korean | 544 | 3.5% |
| Mexican | 1,909 | 12.2% |
| Native Hawaiian | 125 | 0.8% |
| Navajo | 33 | 0.2% |
| Nicaraguan | 94 | 0.6% |
| Norwegian | 130 | 0.8% |
| Pakistani | 148 | 0.9% |
| Panamanian | 7 | 0.0% |
| Peruvian | 14 | 0.1% |
| Polish | 67 | 0.4% |
| Portuguese | 94 | 0.6% |
| Puerto Rican | 1,002 | 6.4% |
| Russian | 58 | 0.4% |
| Salvadoran | 46 | 0.3% |
| Samoan | 47 | 0.3% |
| Scandinavian | 6 | 0.0% |
| Scotch-Irish | 191 | 1.2% |
| Scottish | 331 | 2.1% |
| Sioux | 22 | 0.1% |
| Slovak | 14 | 0.1% |
| South American | 235 | 1.5% |
| Spaniard | 19 | 0.1% |
| Spanish | 69 | 0.4% |
| Sri Lankan | 5 | 0.0% |
| Subsaharan African | 284 | 1.8% |
| Swedish | 119 | 0.8% |
| Swiss | 32 | 0.2% |
| Thai | 18 | 0.1% |
| Tlingit-Haida | 17 | 0.1% |
| Welsh | 8 | 0.1% | View All 60 Rows |
Immigrants in Fort Leonard Wood
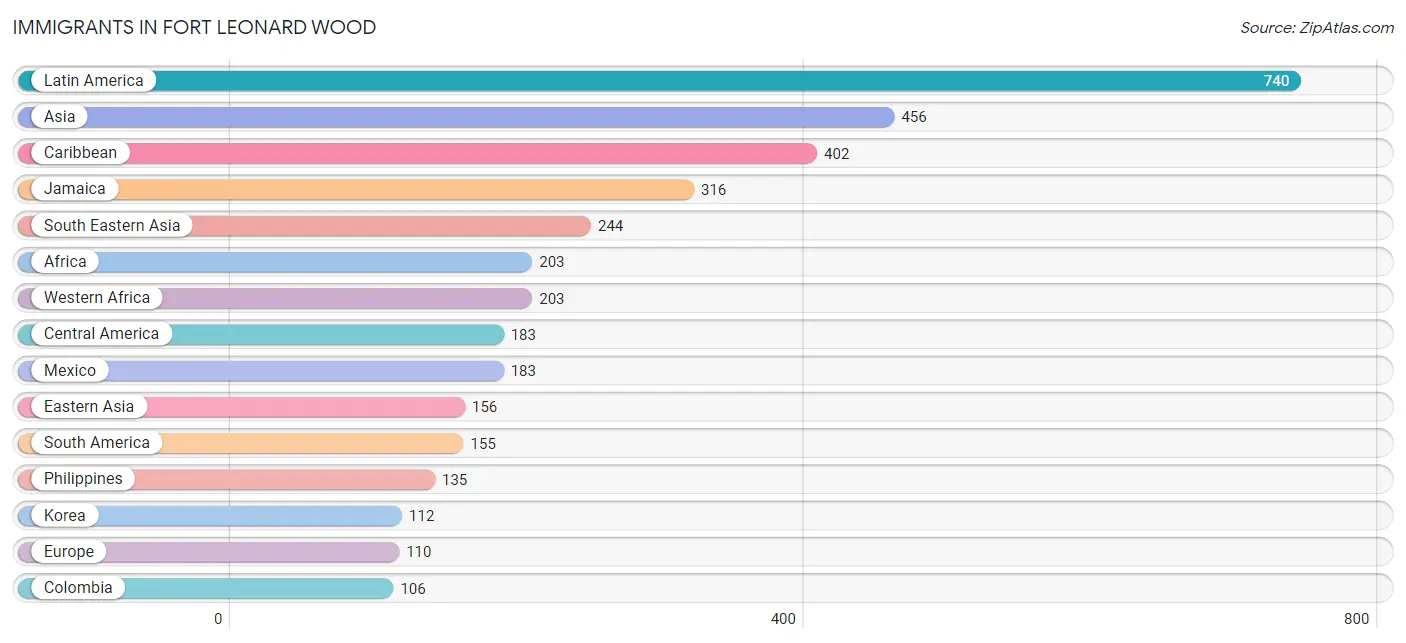
The most numerous immigrant groups reported in Fort Leonard Wood came from Latin America (740 | 4.7%), Asia (456 | 2.9%), Caribbean (402 | 2.6%), Jamaica (316 | 2.0%), and South Eastern Asia (244 | 1.6%), together accounting for 13.8% of all Fort Leonard Wood residents.
| Immigration Origin | # Population | % Population |
| Africa | 203 | 1.3% |
| Asia | 456 | 2.9% |
| Brazil | 28 | 0.2% |
| Caribbean | 402 | 2.6% |
| Central America | 183 | 1.2% |
| China | 24 | 0.2% |
| Colombia | 106 | 0.7% |
| Cuba | 20 | 0.1% |
| Dominica | 27 | 0.2% |
| Dominican Republic | 21 | 0.1% |
| Eastern Asia | 156 | 1.0% |
| Eastern Europe | 4 | 0.0% |
| Ecuador | 21 | 0.1% |
| Europe | 110 | 0.7% |
| Germany | 18 | 0.1% |
| Ghana | 90 | 0.6% |
| Haiti | 18 | 0.1% |
| India | 46 | 0.3% |
| Jamaica | 316 | 2.0% |
| Japan | 20 | 0.1% |
| Korea | 112 | 0.7% |
| Latin America | 740 | 4.7% |
| Mexico | 183 | 1.2% |
| Micronesia | 10 | 0.1% |
| Northern Europe | 88 | 0.6% |
| Oceania | 31 | 0.2% |
| Philippines | 135 | 0.9% |
| Russia | 4 | 0.0% |
| Singapore | 82 | 0.5% |
| South America | 155 | 1.0% |
| South Central Asia | 56 | 0.4% |
| South Eastern Asia | 244 | 1.6% |
| Thailand | 27 | 0.2% |
| Uzbekistan | 10 | 0.1% |
| Western Africa | 203 | 1.3% |
| Western Europe | 18 | 0.1% | View All 36 Rows |
Sex and Age in Fort Leonard Wood
Sex and Age in Fort Leonard Wood
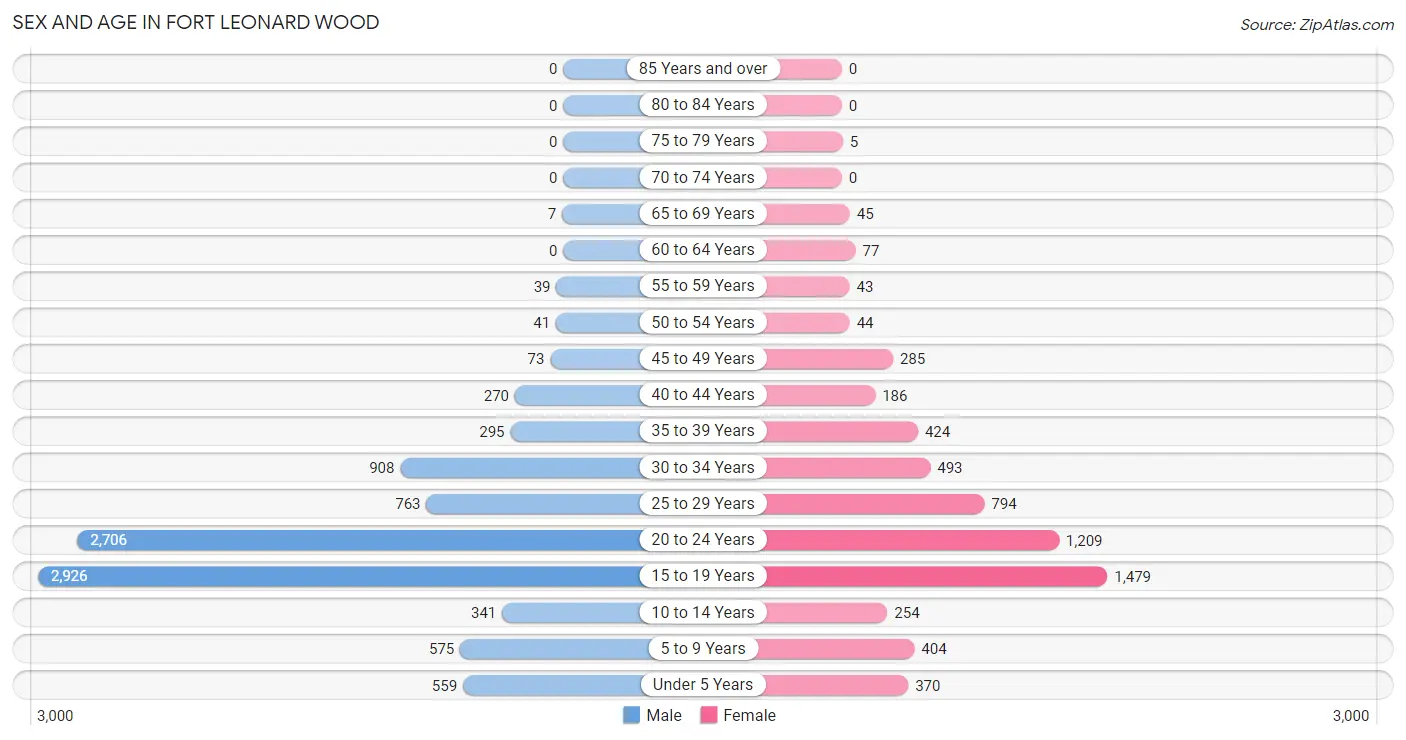
The most populous age groups in Fort Leonard Wood are 15 to 19 Years (2,926 | 30.8%) for men and 15 to 19 Years (1,479 | 24.2%) for women.
| Age Bracket | Male | Female |
| Under 5 Years | 559 (5.9%) | 370 (6.0%) |
| 5 to 9 Years | 575 (6.0%) | 404 (6.6%) |
| 10 to 14 Years | 341 (3.6%) | 254 (4.2%) |
| 15 to 19 Years | 2,926 (30.8%) | 1,479 (24.2%) |
| 20 to 24 Years | 2,706 (28.5%) | 1,209 (19.8%) |
| 25 to 29 Years | 763 (8.0%) | 794 (13.0%) |
| 30 to 34 Years | 908 (9.6%) | 493 (8.1%) |
| 35 to 39 Years | 295 (3.1%) | 424 (6.9%) |
| 40 to 44 Years | 270 (2.8%) | 186 (3.0%) |
| 45 to 49 Years | 73 (0.8%) | 285 (4.7%) |
| 50 to 54 Years | 41 (0.4%) | 44 (0.7%) |
| 55 to 59 Years | 39 (0.4%) | 43 (0.7%) |
| 60 to 64 Years | 0 (0.0%) | 77 (1.3%) |
| 65 to 69 Years | 7 (0.1%) | 45 (0.7%) |
| 70 to 74 Years | 0 (0.0%) | 0 (0.0%) |
| 75 to 79 Years | 0 (0.0%) | 5 (0.1%) |
| 80 to 84 Years | 0 (0.0%) | 0 (0.0%) |
| 85 Years and over | 0 (0.0%) | 0 (0.0%) |
| Total | 9,503 (100.0%) | 6,112 (100.0%) |
Families and Households in Fort Leonard Wood
Median Family Size in Fort Leonard Wood
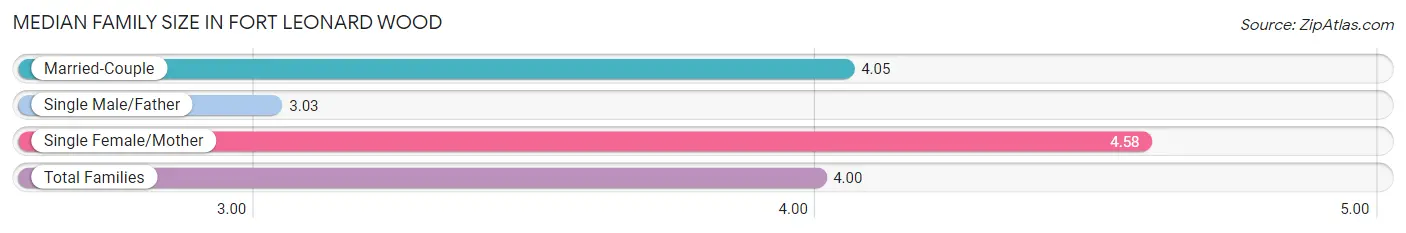
The median family size in Fort Leonard Wood is 4.00 persons per family, with single female/mother families (79 | 5.6%) accounting for the largest median family size of 4.58 persons per family. On the other hand, single male/father families (102 | 7.2%) represent the smallest median family size with 3.03 persons per family.
| Family Type | # Families | Family Size |
| Married-Couple | 1,243 (87.3%) | 4.05 |
| Single Male/Father | 102 (7.2%) | 3.03 |
| Single Female/Mother | 79 (5.6%) | 4.58 |
| Total Families | 1,424 (100.0%) | 4.00 |
Median Household Size in Fort Leonard Wood
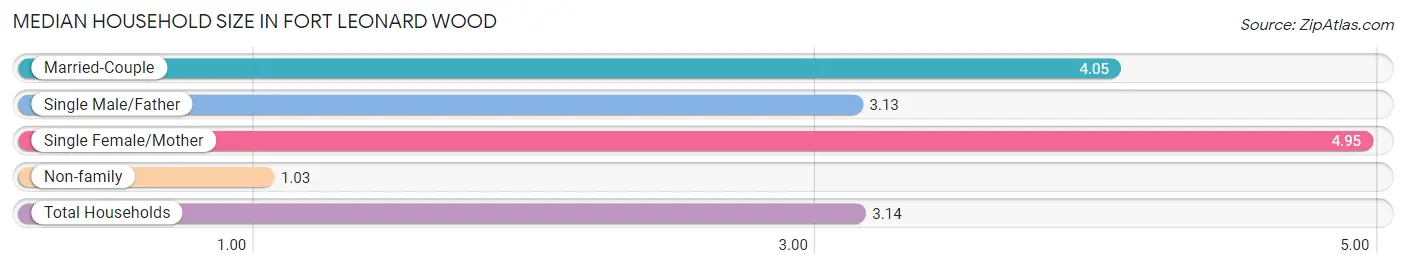
The median household size in Fort Leonard Wood is 3.14 persons per household, with single female/mother households (79 | 3.9%) accounting for the largest median household size of 4.95 persons per household. non-family households (604 | 29.8%) represent the smallest median household size with 1.03 persons per household.
| Household Type | # Households | Household Size |
| Married-Couple | 1,243 (61.3%) | 4.05 |
| Single Male/Father | 102 (5.0%) | 3.13 |
| Single Female/Mother | 79 (3.9%) | 4.95 |
| Non-family | 604 (29.8%) | 1.03 |
| Total Households | 2,028 (100.0%) | 3.14 |
Household Size by Marriage Status in Fort Leonard Wood
Out of a total of 2,028 households in Fort Leonard Wood, 1,424 (70.2%) are family households, while 604 (29.8%) are nonfamily households. The most numerous type of family households are 3-person households, comprising 349, and the most common type of nonfamily households are 1-person households, comprising 556.
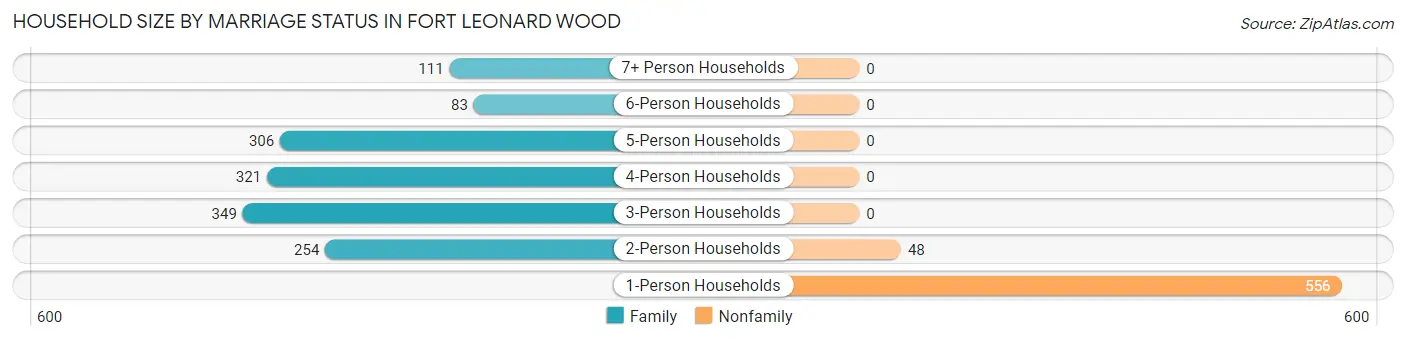
| Household Size | Family Households | Nonfamily Households |
| 1-Person Households | - | 556 (27.4%) |
| 2-Person Households | 254 (12.5%) | 48 (2.4%) |
| 3-Person Households | 349 (17.2%) | 0 (0.0%) |
| 4-Person Households | 321 (15.8%) | 0 (0.0%) |
| 5-Person Households | 306 (15.1%) | 0 (0.0%) |
| 6-Person Households | 83 (4.1%) | 0 (0.0%) |
| 7+ Person Households | 111 (5.5%) | 0 (0.0%) |
| Total | 1,424 (70.2%) | 604 (29.8%) |
Female Fertility in Fort Leonard Wood
Fertility by Age in Fort Leonard Wood
Average fertility rate in Fort Leonard Wood is 27.0 births per 1,000 women. Women in the age bracket of 20 to 34 years have the highest fertility rate with 48.0 births per 1,000 women. Women in the age bracket of 20 to 34 years acount for 93.1% of all women with births.
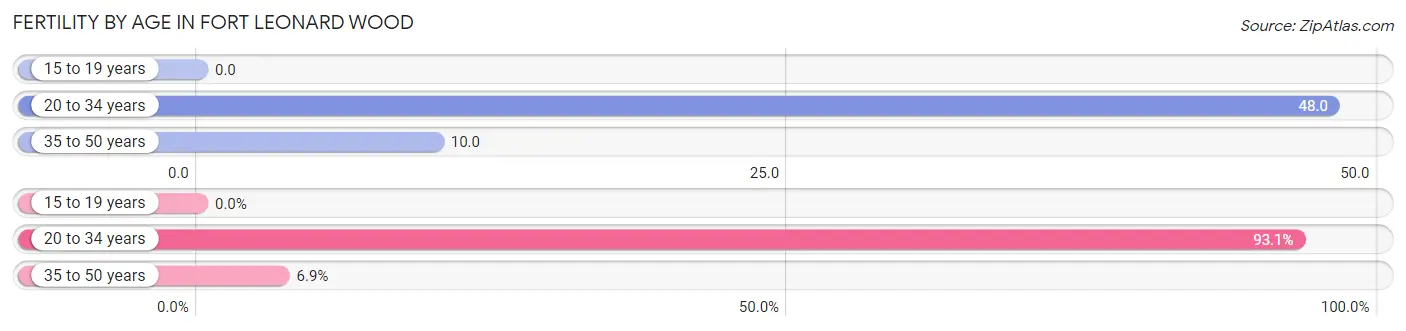
| Age Bracket | Women with Births | Births / 1,000 Women |
| 15 to 19 years | 0 (0.0%) | 0.0 |
| 20 to 34 years | 121 (93.1%) | 48.0 |
| 35 to 50 years | 9 (6.9%) | 10.0 |
| Total | 130 (100.0%) | 27.0 |
Fertility by Age by Marriage Status in Fort Leonard Wood
85.4% of women with births (130) in Fort Leonard Wood are married. The highest percentage of unmarried women with births falls into 20 to 34 years age bracket with 15.7% of them unmarried at the time of birth, while the lowest percentage of unmarried women with births belong to 35 to 50 years age bracket with 0.0% of them unmarried.
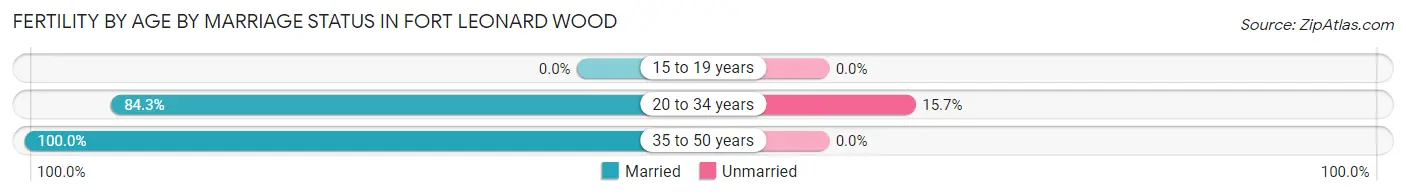
| Age Bracket | Married | Unmarried |
| 15 to 19 years | 0 (0.0%) | 0 (0.0%) |
| 20 to 34 years | 102 (84.3%) | 19 (15.7%) |
| 35 to 50 years | 9 (100.0%) | 0 (0.0%) |
| Total | 111 (85.4%) | 19 (14.6%) |
Fertility by Education in Fort Leonard Wood
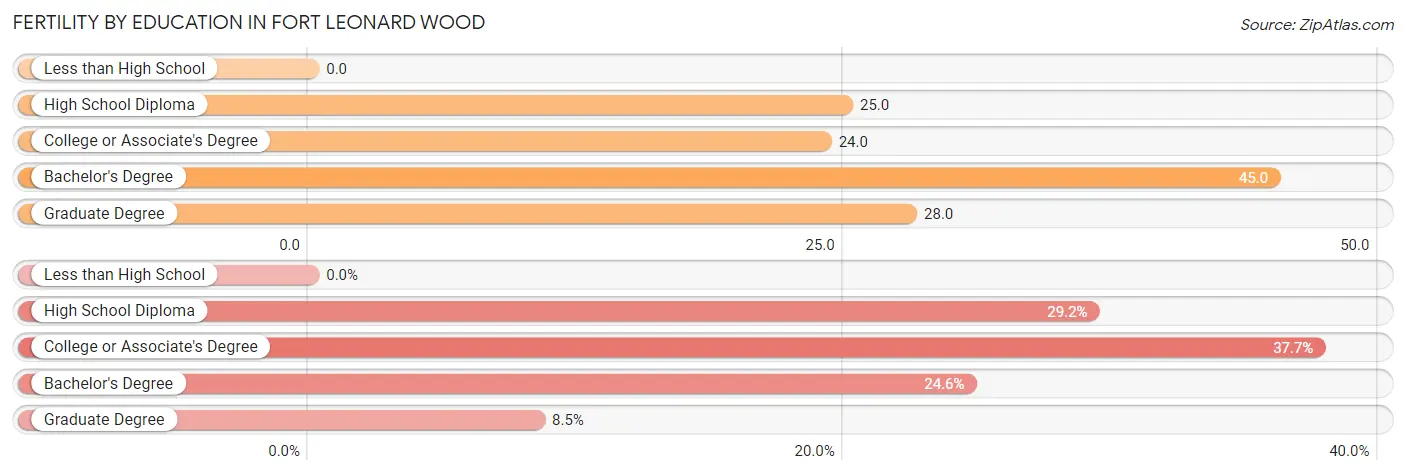
| Educational Attainment | Women with Births | Births / 1,000 Women |
| Less than High School | 0 (0.0%) | 0.0 |
| High School Diploma | 38 (29.2%) | 25.0 |
| College or Associate's Degree | 49 (37.7%) | 24.0 |
| Bachelor's Degree | 32 (24.6%) | 45.0 |
| Graduate Degree | 11 (8.5%) | 28.0 |
| Total | 130 (100.0%) | 27.0 |
Fertility by Education by Marriage Status in Fort Leonard Wood
14.6% of women with births in Fort Leonard Wood are unmarried. Women with the educational attainment of college or associate's degree are most likely to be married with 100.0% of them married at childbirth, while women with the educational attainment of bachelor's degree are least likely to be married with 34.4% of them unmarried at childbirth.
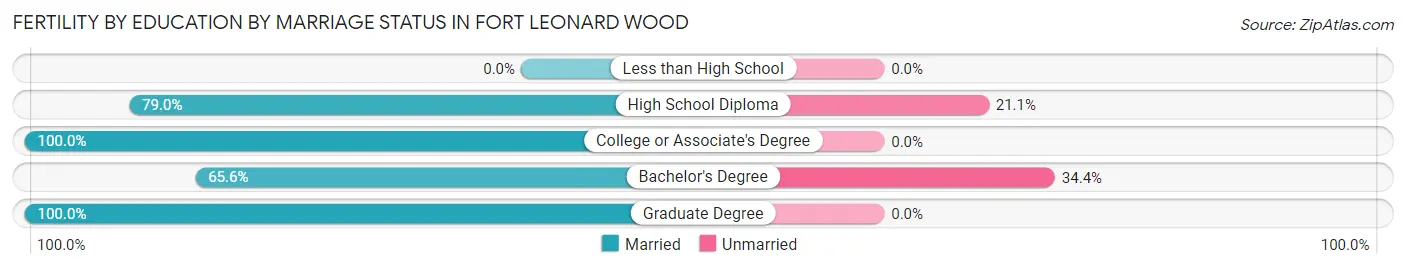
| Educational Attainment | Married | Unmarried |
| Less than High School | 0 (0.0%) | 0 (0.0%) |
| High School Diploma | 30 (78.9%) | 8 (21.0%) |
| College or Associate's Degree | 49 (100.0%) | 0 (0.0%) |
| Bachelor's Degree | 21 (65.6%) | 11 (34.4%) |
| Graduate Degree | 11 (100.0%) | 0 (0.0%) |
| Total | 111 (85.4%) | 19 (14.6%) |
Employment Characteristics in Fort Leonard Wood
Employment by Class of Employer in Fort Leonard Wood
Among the 9,377 employed individuals in Fort Leonard Wood, federal government employees (7,163 | 76.4%), private company employees (1,674 | 17.8%), and state government employees (238 | 2.5%) make up the most common classes of employment.
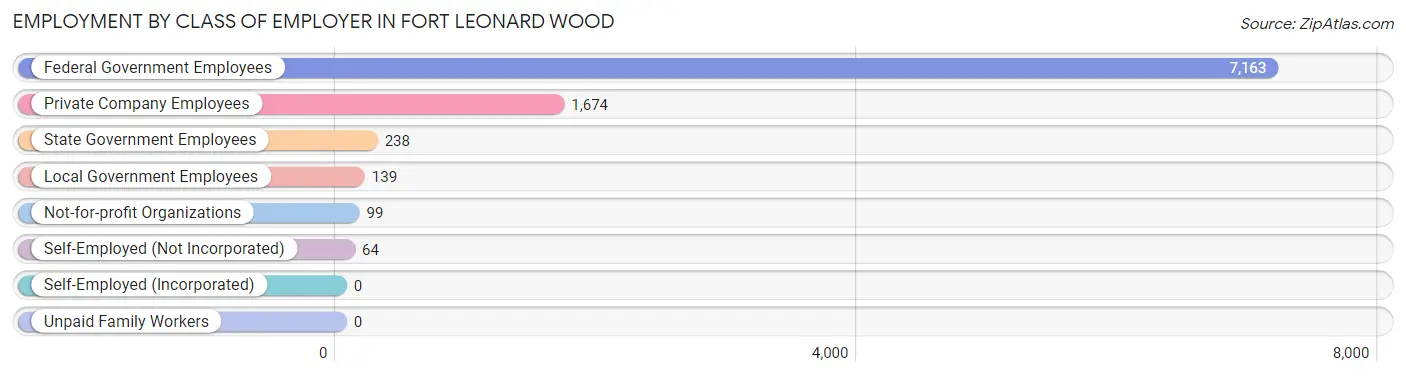
| Employer Class | # Employees | % Employees |
| Private Company Employees | 1,674 | 17.8% |
| Self-Employed (Incorporated) | 0 | 0.0% |
| Self-Employed (Not Incorporated) | 64 | 0.7% |
| Not-for-profit Organizations | 99 | 1.1% |
| Local Government Employees | 139 | 1.5% |
| State Government Employees | 238 | 2.5% |
| Federal Government Employees | 7,163 | 76.4% |
| Unpaid Family Workers | 0 | 0.0% |
| Total | 9,377 | 100.0% |
Employment Status by Age in Fort Leonard Wood
According to the labor force statistics for Fort Leonard Wood, out of the total population over 16 years of age (13,067), 83.8% or 10,950 individuals are in the labor force, with 4.3% or 471 of them unemployed. The age group with the highest labor force participation rate is 20 to 24 years, with 93.9% or 3,676 individuals in the labor force. Within the labor force, the 35 to 44 years age range has the highest percentage of unemployed individuals, with 17.1% or 152 of them being unemployed.
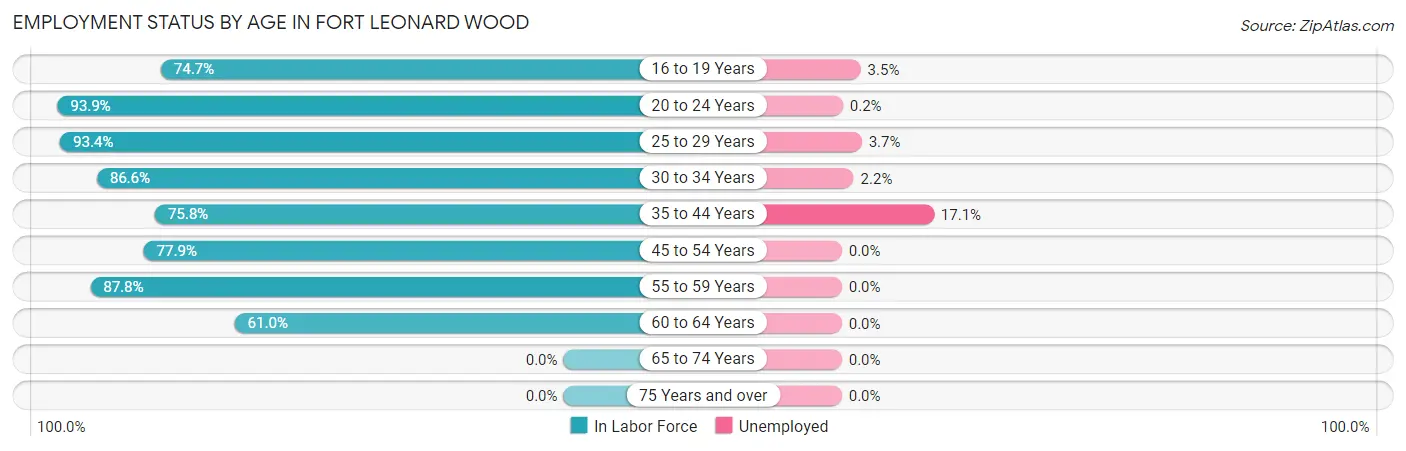
| Age Bracket | In Labor Force | Unemployed |
| 16 to 19 Years | 3,257 (74.7%) | 114 (3.5%) |
| 20 to 24 Years | 3,676 (93.9%) | 7 (0.2%) |
| 25 to 29 Years | 1,454 (93.4%) | 54 (3.7%) |
| 30 to 34 Years | 1,213 (86.6%) | 27 (2.2%) |
| 35 to 44 Years | 891 (75.8%) | 152 (17.1%) |
| 45 to 54 Years | 345 (77.9%) | 0 (0.0%) |
| 55 to 59 Years | 72 (87.8%) | 0 (0.0%) |
| 60 to 64 Years | 47 (61.0%) | 0 (0.0%) |
| 65 to 74 Years | 0 (0.0%) | 0 (0.0%) |
| 75 Years and over | 0 (0.0%) | 0 (0.0%) |
| Total | 10,950 (83.8%) | 471 (4.3%) |
Employment Status by Educational Attainment in Fort Leonard Wood
According to labor force statistics for Fort Leonard Wood, 84.9% of individuals (4,020) out of the total population between 25 and 64 years of age (4,735) are in the labor force, with 7.2% or 289 of them being unemployed. The group with the highest labor force participation rate are those with the educational attainment of bachelor's degree or higher, with 92.2% or 1,328 individuals in the labor force. Within the labor force, individuals with college / associate degree education have the highest percentage of unemployment, with 15.6% or 315 of them being unemployed.
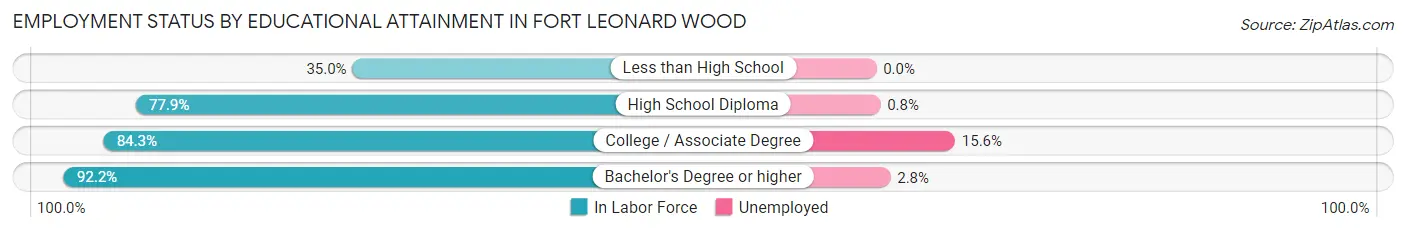
| Educational Attainment | In Labor Force | Unemployed |
| Less than High School | 21 (35.0%) | 0 (0.0%) |
| High School Diploma | 653 (77.9%) | 7 (0.8%) |
| College / Associate Degree | 2,021 (84.3%) | 374 (15.6%) |
| Bachelor's Degree or higher | 1,328 (92.2%) | 40 (2.8%) |
| Total | 4,020 (84.9%) | 341 (7.2%) |
Employment Occupations by Sex in Fort Leonard Wood
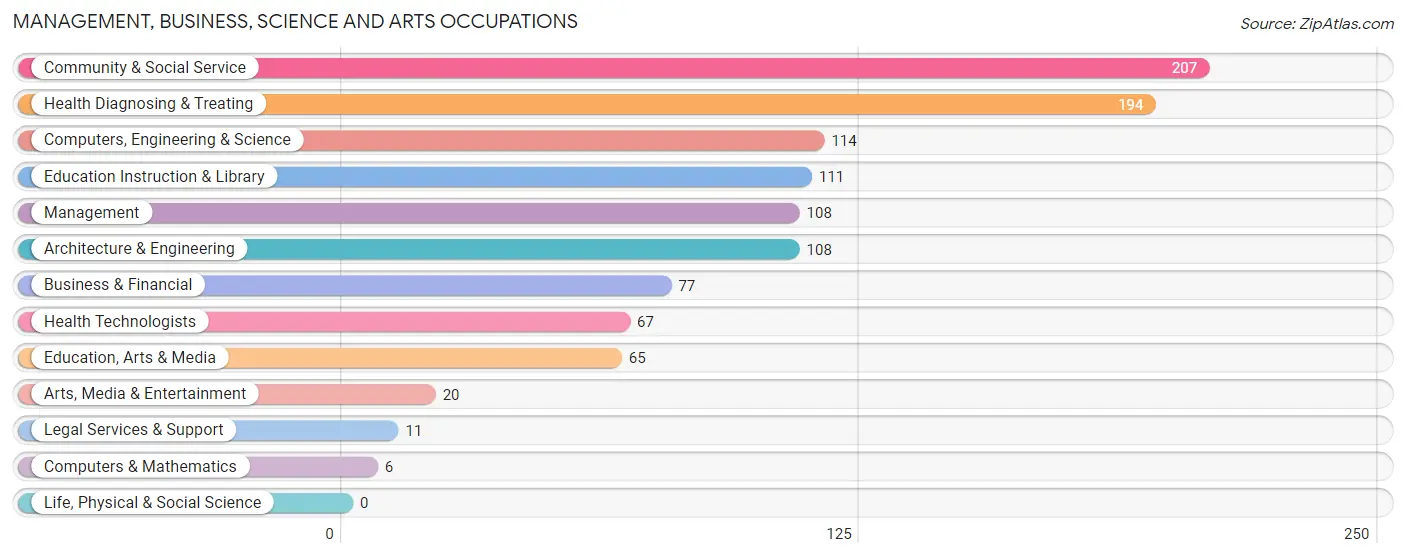
Management, Business, Science and Arts Occupations
The most common Management, Business, Science and Arts occupations in Fort Leonard Wood are Community & Social Service (207 | 7.3%), Health Diagnosing & Treating (194 | 6.8%), Computers, Engineering & Science (114 | 4.0%), Education Instruction & Library (111 | 3.9%), and Management (108 | 3.8%).
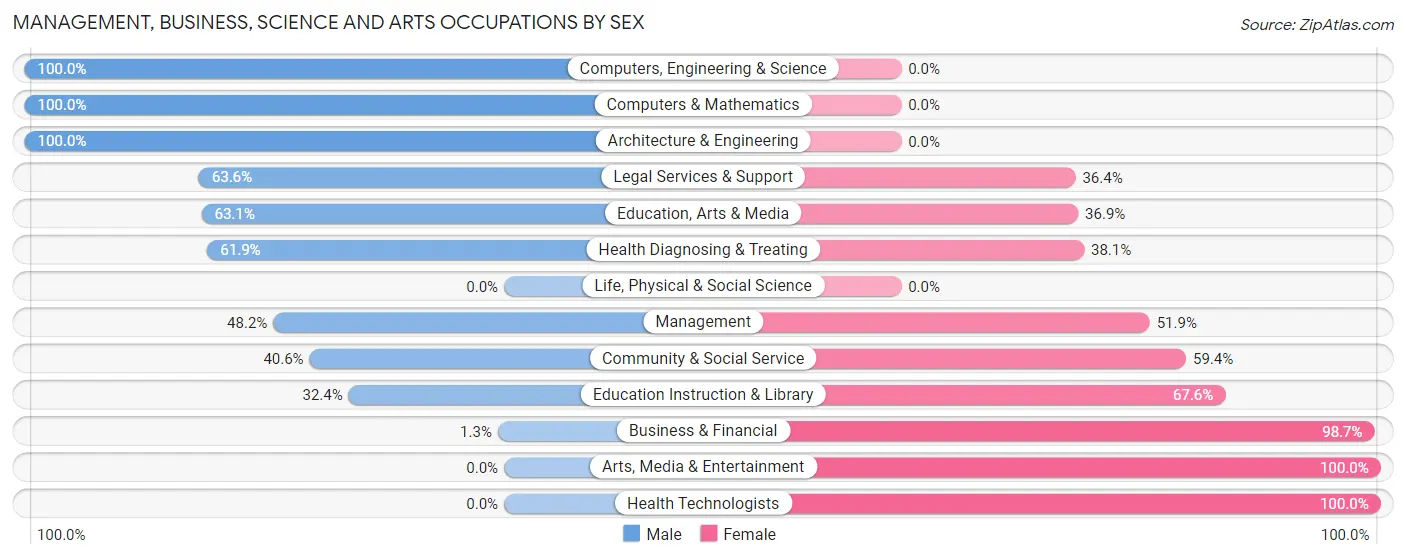
Management, Business, Science and Arts Occupations by Sex
Within the Management, Business, Science and Arts occupations in Fort Leonard Wood, the most male-oriented occupations are Computers, Engineering & Science (100.0%), Computers & Mathematics (100.0%), and Architecture & Engineering (100.0%), while the most female-oriented occupations are Arts, Media & Entertainment (100.0%), Health Technologists (100.0%), and Business & Financial (98.7%).
| Occupation | Male | Female |
| Management | 52 (48.1%) | 56 (51.8%) |
| Business & Financial | 1 (1.3%) | 76 (98.7%) |
| Computers, Engineering & Science | 114 (100.0%) | 0 (0.0%) |
| Computers & Mathematics | 6 (100.0%) | 0 (0.0%) |
| Architecture & Engineering | 108 (100.0%) | 0 (0.0%) |
| Life, Physical & Social Science | 0 (0.0%) | 0 (0.0%) |
| Community & Social Service | 84 (40.6%) | 123 (59.4%) |
| Education, Arts & Media | 41 (63.1%) | 24 (36.9%) |
| Legal Services & Support | 7 (63.6%) | 4 (36.4%) |
| Education Instruction & Library | 36 (32.4%) | 75 (67.6%) |
| Arts, Media & Entertainment | 0 (0.0%) | 20 (100.0%) |
| Health Diagnosing & Treating | 120 (61.9%) | 74 (38.1%) |
| Health Technologists | 0 (0.0%) | 67 (100.0%) |
| Total (Category) | 371 (53.0%) | 329 (47.0%) |
| Total (Overall) | 1,587 (55.9%) | 1,254 (44.1%) |
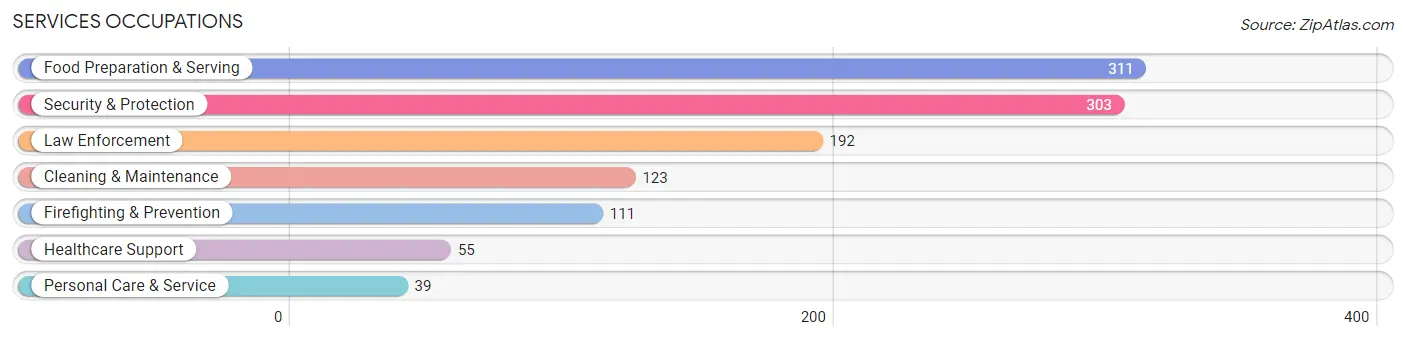
Services Occupations
The most common Services occupations in Fort Leonard Wood are Food Preparation & Serving (311 | 11.0%), Security & Protection (303 | 10.7%), Law Enforcement (192 | 6.8%), Cleaning & Maintenance (123 | 4.3%), and Firefighting & Prevention (111 | 3.9%).
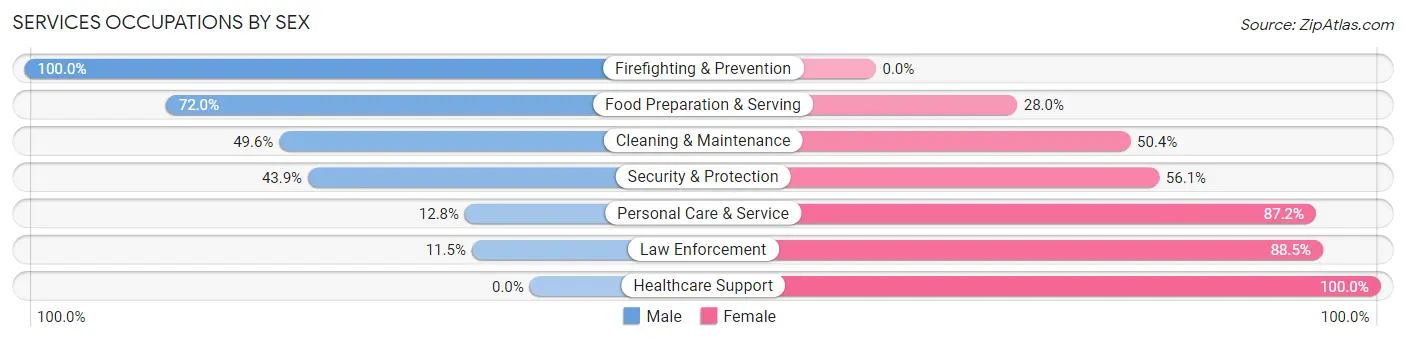
Services Occupations by Sex
Within the Services occupations in Fort Leonard Wood, the most male-oriented occupations are Firefighting & Prevention (100.0%), Food Preparation & Serving (72.0%), and Cleaning & Maintenance (49.6%), while the most female-oriented occupations are Healthcare Support (100.0%), Law Enforcement (88.5%), and Personal Care & Service (87.2%).
| Occupation | Male | Female |
| Healthcare Support | 0 (0.0%) | 55 (100.0%) |
| Security & Protection | 133 (43.9%) | 170 (56.1%) |
| Firefighting & Prevention | 111 (100.0%) | 0 (0.0%) |
| Law Enforcement | 22 (11.5%) | 170 (88.5%) |
| Food Preparation & Serving | 224 (72.0%) | 87 (28.0%) |
| Cleaning & Maintenance | 61 (49.6%) | 62 (50.4%) |
| Personal Care & Service | 5 (12.8%) | 34 (87.2%) |
| Total (Category) | 423 (50.9%) | 408 (49.1%) |
| Total (Overall) | 1,587 (55.9%) | 1,254 (44.1%) |
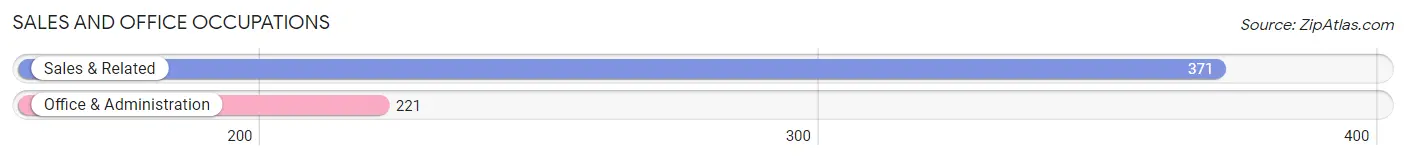
Sales and Office Occupations
The most common Sales and Office occupations in Fort Leonard Wood are Sales & Related (371 | 13.1%), and Office & Administration (221 | 7.8%).
Sales and Office Occupations by Sex
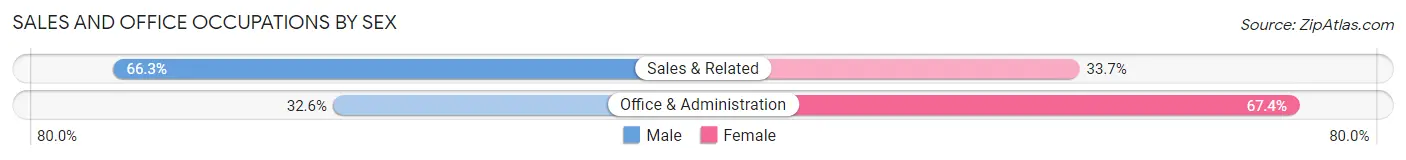
| Occupation | Male | Female |
| Sales & Related | 246 (66.3%) | 125 (33.7%) |
| Office & Administration | 72 (32.6%) | 149 (67.4%) |
| Total (Category) | 318 (53.7%) | 274 (46.3%) |
| Total (Overall) | 1,587 (55.9%) | 1,254 (44.1%) |
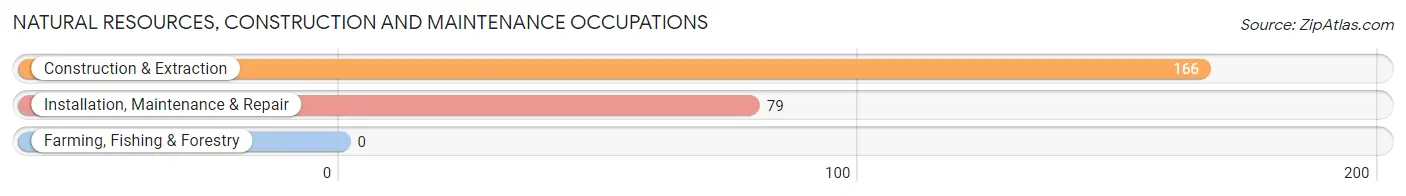
Natural Resources, Construction and Maintenance Occupations
The most common Natural Resources, Construction and Maintenance occupations in Fort Leonard Wood are Construction & Extraction (166 | 5.8%), and Installation, Maintenance & Repair (79 | 2.8%).
Natural Resources, Construction and Maintenance Occupations by Sex
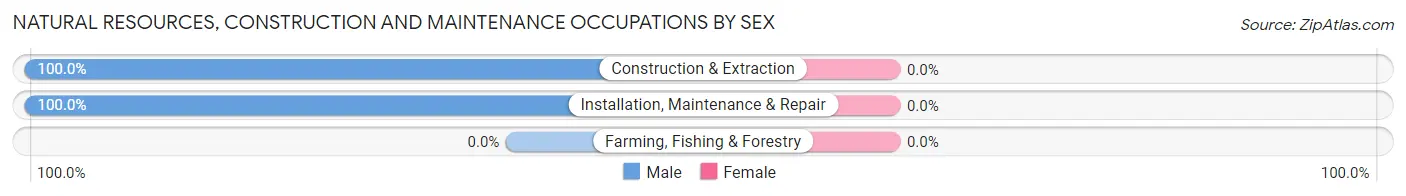
| Occupation | Male | Female |
| Farming, Fishing & Forestry | 0 (0.0%) | 0 (0.0%) |
| Construction & Extraction | 166 (100.0%) | 0 (0.0%) |
| Installation, Maintenance & Repair | 79 (100.0%) | 0 (0.0%) |
| Total (Category) | 245 (100.0%) | 0 (0.0%) |
| Total (Overall) | 1,587 (55.9%) | 1,254 (44.1%) |
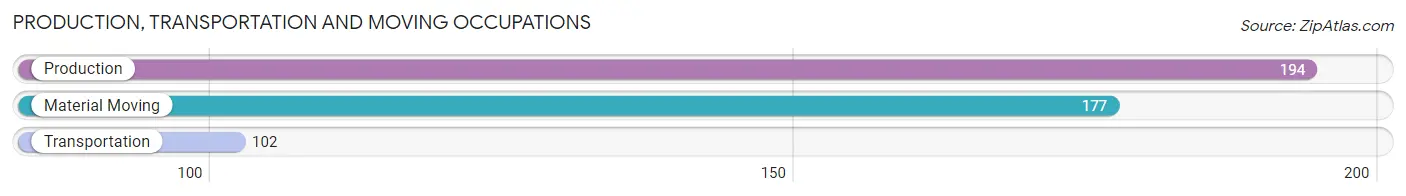
Production, Transportation and Moving Occupations
The most common Production, Transportation and Moving occupations in Fort Leonard Wood are Production (194 | 6.8%), Material Moving (177 | 6.2%), and Transportation (102 | 3.6%).
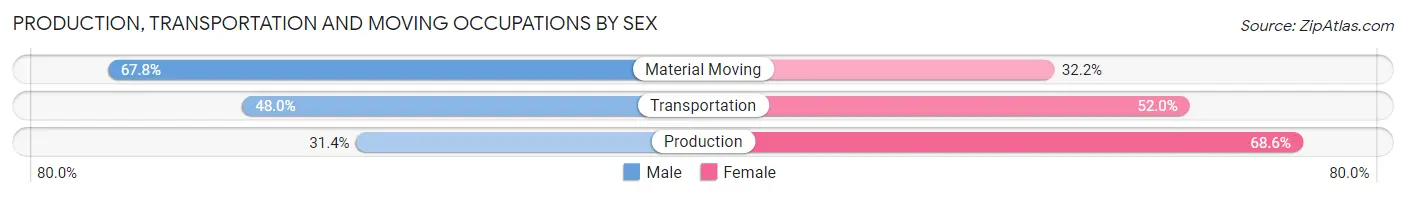
Production, Transportation and Moving Occupations by Sex
| Occupation | Male | Female |
| Production | 61 (31.4%) | 133 (68.6%) |
| Transportation | 49 (48.0%) | 53 (52.0%) |
| Material Moving | 120 (67.8%) | 57 (32.2%) |
| Total (Category) | 230 (48.6%) | 243 (51.4%) |
| Total (Overall) | 1,587 (55.9%) | 1,254 (44.1%) |
Employment Industries by Sex in Fort Leonard Wood
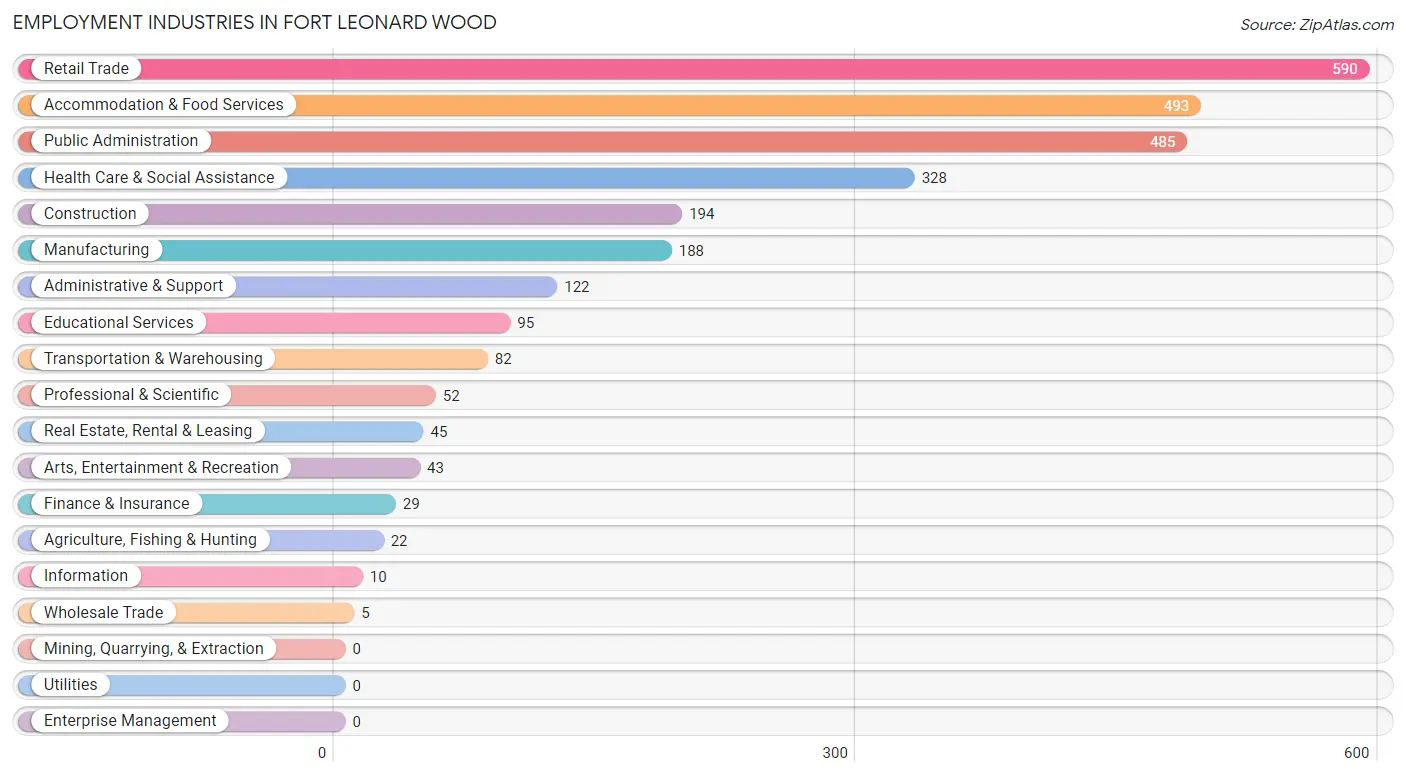
Employment Industries in Fort Leonard Wood
The major employment industries in Fort Leonard Wood include Retail Trade (590 | 20.8%), Accommodation & Food Services (493 | 17.3%), Public Administration (485 | 17.1%), Health Care & Social Assistance (328 | 11.6%), and Construction (194 | 6.8%).
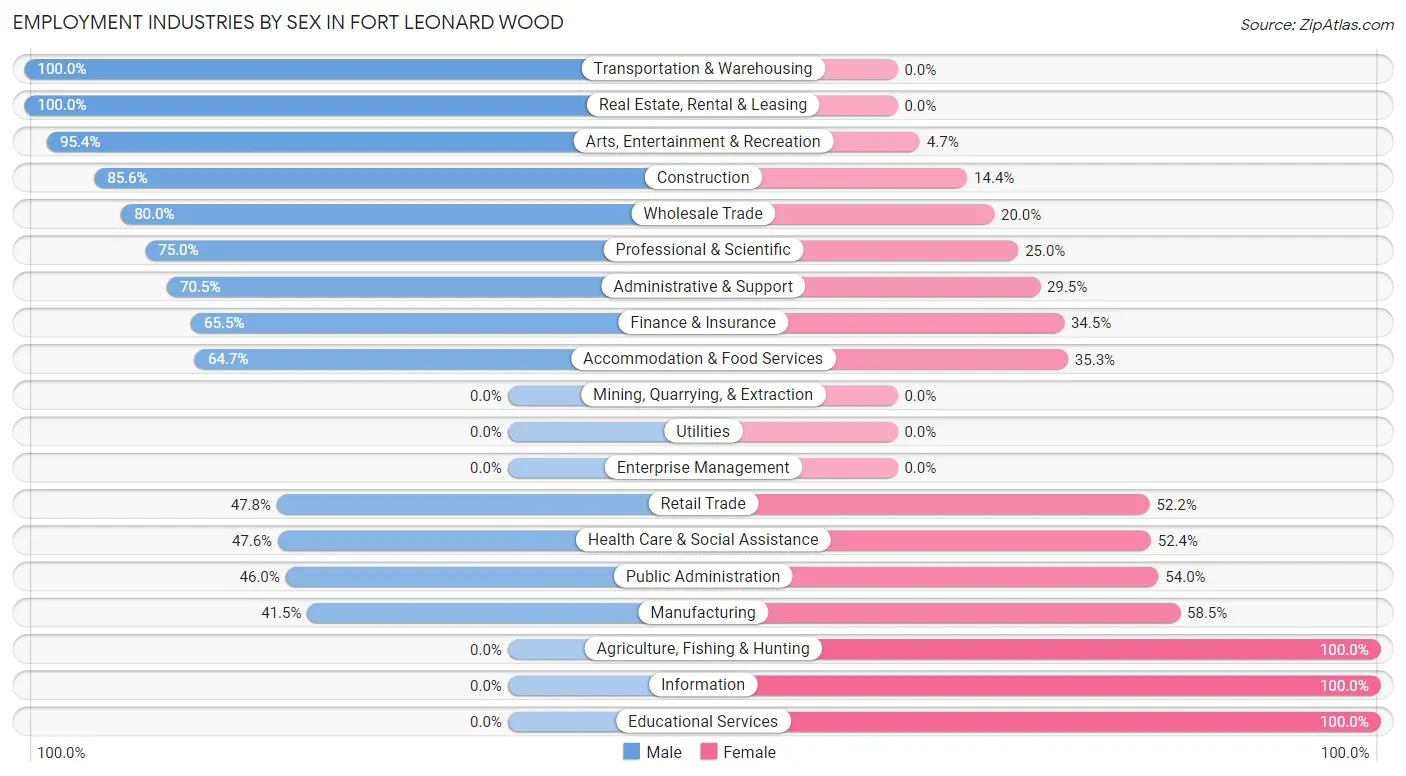
Employment Industries by Sex in Fort Leonard Wood
The Fort Leonard Wood industries that see more men than women are Transportation & Warehousing (100.0%), Real Estate, Rental & Leasing (100.0%), and Arts, Entertainment & Recreation (95.4%), whereas the industries that tend to have a higher number of women are Agriculture, Fishing & Hunting (100.0%), Information (100.0%), and Educational Services (100.0%).
| Industry | Male | Female |
| Agriculture, Fishing & Hunting | 0 (0.0%) | 22 (100.0%) |
| Mining, Quarrying, & Extraction | 0 (0.0%) | 0 (0.0%) |
| Construction | 166 (85.6%) | 28 (14.4%) |
| Manufacturing | 78 (41.5%) | 110 (58.5%) |
| Wholesale Trade | 4 (80.0%) | 1 (20.0%) |
| Retail Trade | 282 (47.8%) | 308 (52.2%) |
| Transportation & Warehousing | 82 (100.0%) | 0 (0.0%) |
| Utilities | 0 (0.0%) | 0 (0.0%) |
| Information | 0 (0.0%) | 10 (100.0%) |
| Finance & Insurance | 19 (65.5%) | 10 (34.5%) |
| Real Estate, Rental & Leasing | 45 (100.0%) | 0 (0.0%) |
| Professional & Scientific | 39 (75.0%) | 13 (25.0%) |
| Enterprise Management | 0 (0.0%) | 0 (0.0%) |
| Administrative & Support | 86 (70.5%) | 36 (29.5%) |
| Educational Services | 0 (0.0%) | 95 (100.0%) |
| Health Care & Social Assistance | 156 (47.6%) | 172 (52.4%) |
| Arts, Entertainment & Recreation | 41 (95.4%) | 2 (4.6%) |
| Accommodation & Food Services | 319 (64.7%) | 174 (35.3%) |
| Public Administration | 223 (46.0%) | 262 (54.0%) |
| Total | 1,587 (55.9%) | 1,254 (44.1%) |
Education in Fort Leonard Wood
School Enrollment in Fort Leonard Wood
The most common levels of schooling among the 5,333 students in Fort Leonard Wood are college / undergraduate (2,102 | 39.4%), high school (1,469 | 27.6%), and elementary school (719 | 13.5%).
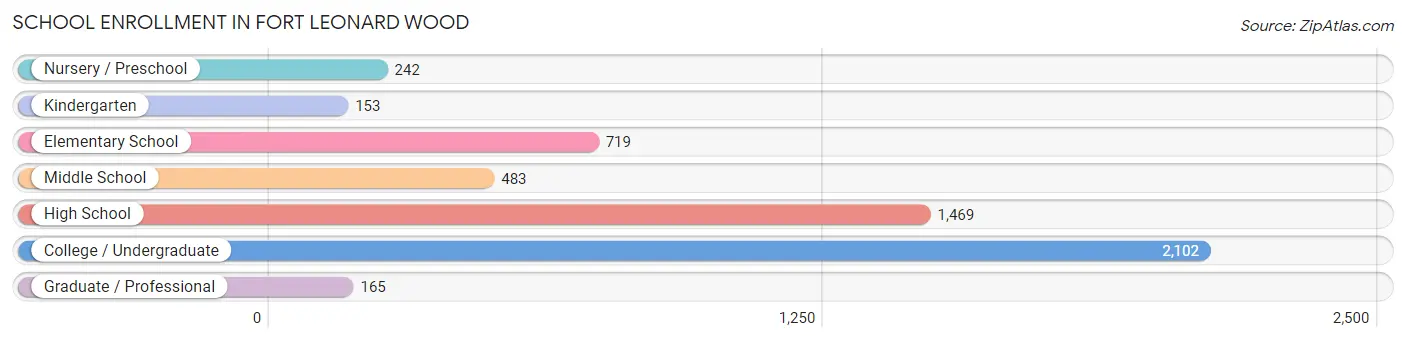
| School Level | # Students | % Students |
| Nursery / Preschool | 242 | 4.5% |
| Kindergarten | 153 | 2.9% |
| Elementary School | 719 | 13.5% |
| Middle School | 483 | 9.1% |
| High School | 1,469 | 27.6% |
| College / Undergraduate | 2,102 | 39.4% |
| Graduate / Professional | 165 | 3.1% |
| Total | 5,333 | 100.0% |
School Enrollment by Age by Funding Source in Fort Leonard Wood
Out of a total of 5,333 students who are enrolled in schools in Fort Leonard Wood, 1,104 (20.7%) attend a private institution, while the remaining 4,229 (79.3%) are enrolled in public schools. The age group of 25 to 34 year olds has the highest likelihood of being enrolled in private schools, with 247 (53.1% in the age bracket) enrolled. Conversely, the age group of 15 to 17 year olds has the lowest likelihood of being enrolled in a private school, with 365 (100.0% in the age bracket) attending a public institution.
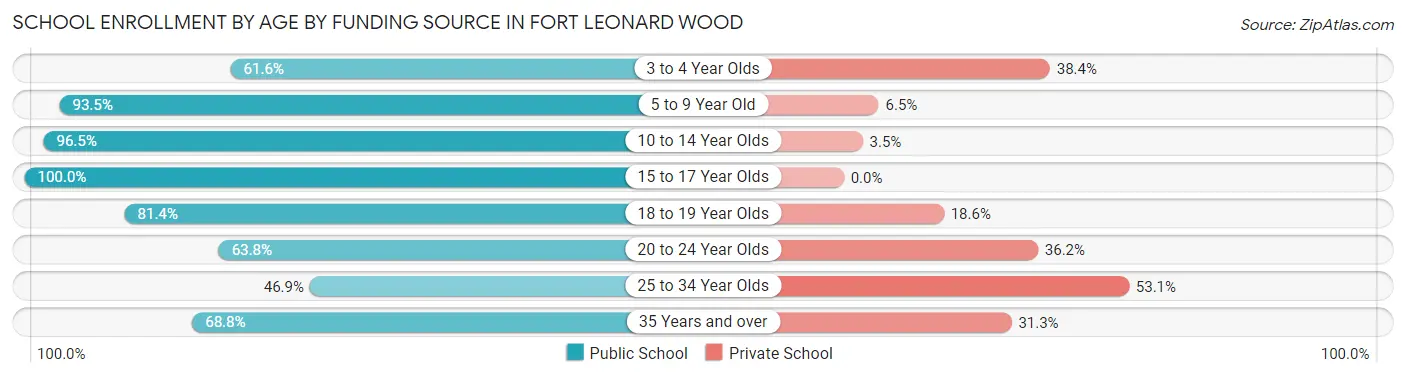
| Age Bracket | Public School | Private School |
| 3 to 4 Year Olds | 130 (61.6%) | 81 (38.4%) |
| 5 to 9 Year Old | 790 (93.5%) | 55 (6.5%) |
| 10 to 14 Year Olds | 574 (96.5%) | 21 (3.5%) |
| 15 to 17 Year Olds | 365 (100.0%) | 0 (0.0%) |
| 18 to 19 Year Olds | 1,506 (81.4%) | 345 (18.6%) |
| 20 to 24 Year Olds | 547 (63.8%) | 310 (36.2%) |
| 25 to 34 Year Olds | 218 (46.9%) | 247 (53.1%) |
| 35 Years and over | 99 (68.8%) | 45 (31.2%) |
| Total | 4,229 (79.3%) | 1,104 (20.7%) |
Educational Attainment by Field of Study in Fort Leonard Wood
Science & technology (322 | 19.9%), business (294 | 18.2%), computers & mathematics (193 | 11.9%), social sciences (178 | 11.0%), and arts & humanities (99 | 6.1%) are the most common fields of study among 1,616 individuals in Fort Leonard Wood who have obtained a bachelor's degree or higher.
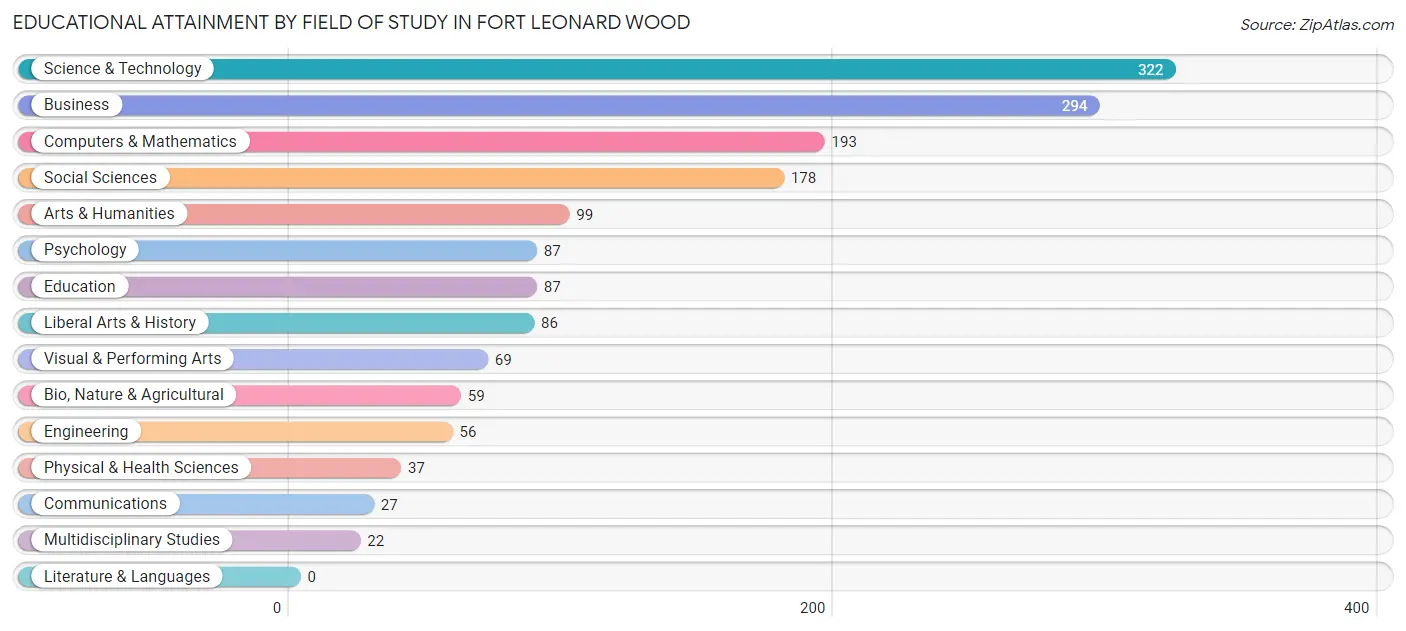
| Field of Study | # Graduates | % Graduates |
| Computers & Mathematics | 193 | 11.9% |
| Bio, Nature & Agricultural | 59 | 3.6% |
| Physical & Health Sciences | 37 | 2.3% |
| Psychology | 87 | 5.4% |
| Social Sciences | 178 | 11.0% |
| Engineering | 56 | 3.5% |
| Multidisciplinary Studies | 22 | 1.4% |
| Science & Technology | 322 | 19.9% |
| Business | 294 | 18.2% |
| Education | 87 | 5.4% |
| Literature & Languages | 0 | 0.0% |
| Liberal Arts & History | 86 | 5.3% |
| Visual & Performing Arts | 69 | 4.3% |
| Communications | 27 | 1.7% |
| Arts & Humanities | 99 | 6.1% |
| Total | 1,616 | 100.0% |
Transportation & Commute in Fort Leonard Wood
Vehicle Availability by Sex in Fort Leonard Wood
The most prevalent vehicle ownership categories in Fort Leonard Wood are males with 2 vehicles (967, accounting for 59.8%) and females with 2 vehicles (581, making up 90.1%).
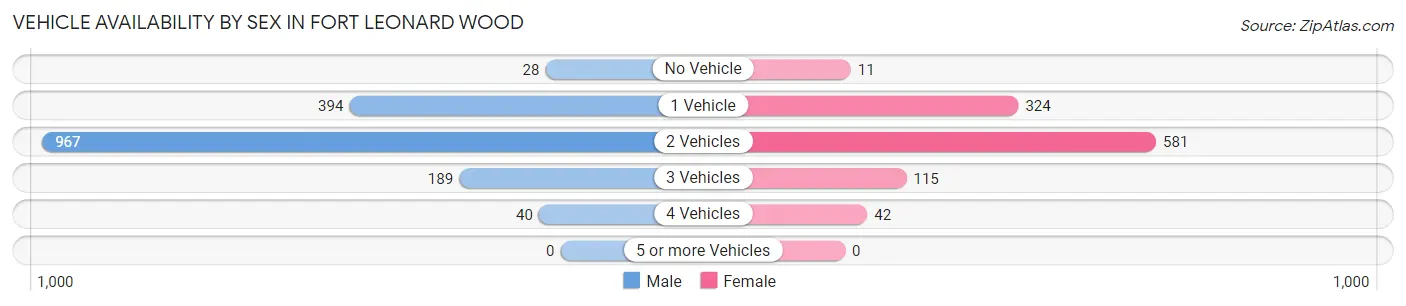
| Vehicles Available | Male | Female |
| No Vehicle | 28 (1.7%) | 11 (1.0%) |
| 1 Vehicle | 394 (24.3%) | 324 (30.2%) |
| 2 Vehicles | 967 (59.8%) | 581 (54.1%) |
| 3 Vehicles | 189 (11.7%) | 115 (10.7%) |
| 4 Vehicles | 40 (2.5%) | 42 (3.9%) |
| 5 or more Vehicles | 0 (0.0%) | 0 (0.0%) |
| Total | 1,618 (100.0%) | 1,073 (100.0%) |
Commute Time in Fort Leonard Wood
The most frequently occuring commute durations in Fort Leonard Wood are 5 to 9 minutes (3,552 commuters, 40.1%), less than 5 minutes (1,732 commuters, 19.6%), and 10 to 14 minutes (1,601 commuters, 18.1%).
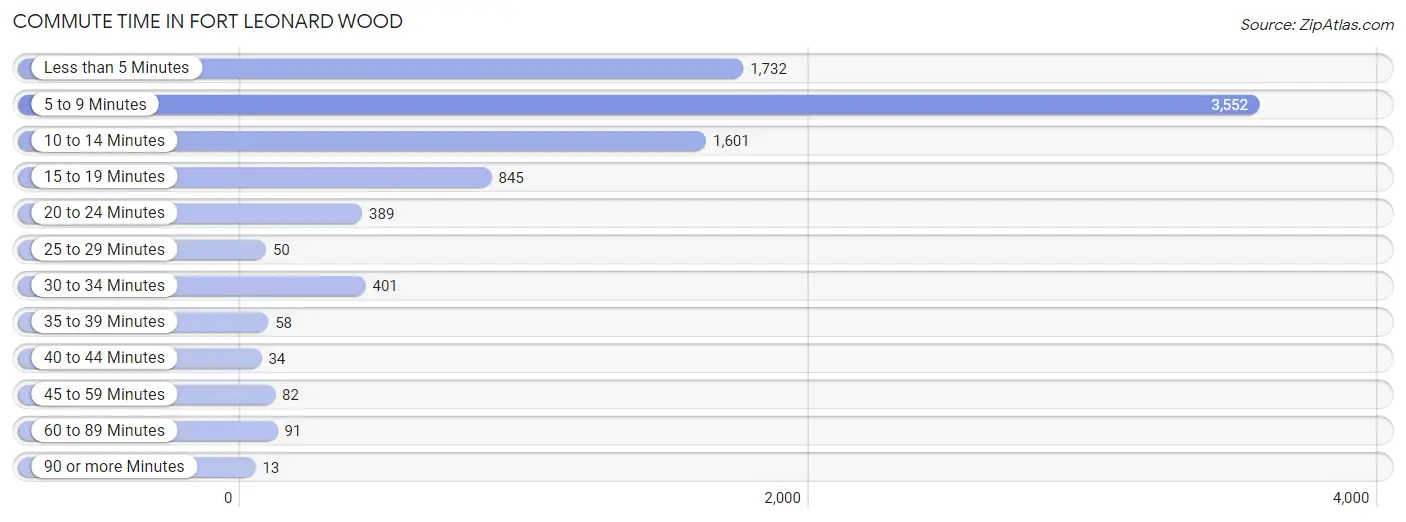
| Commute Time | # Commuters | % Commuters |
| Less than 5 Minutes | 1,732 | 19.6% |
| 5 to 9 Minutes | 3,552 | 40.1% |
| 10 to 14 Minutes | 1,601 | 18.1% |
| 15 to 19 Minutes | 845 | 9.6% |
| 20 to 24 Minutes | 389 | 4.4% |
| 25 to 29 Minutes | 50 | 0.6% |
| 30 to 34 Minutes | 401 | 4.5% |
| 35 to 39 Minutes | 58 | 0.7% |
| 40 to 44 Minutes | 34 | 0.4% |
| 45 to 59 Minutes | 82 | 0.9% |
| 60 to 89 Minutes | 91 | 1.0% |
| 90 or more Minutes | 13 | 0.2% |
Commute Time by Sex in Fort Leonard Wood
The most common commute times in Fort Leonard Wood are 5 to 9 minutes (1,889 commuters, 37.5%) for males and 5 to 9 minutes (1,663 commuters, 43.7%) for females.
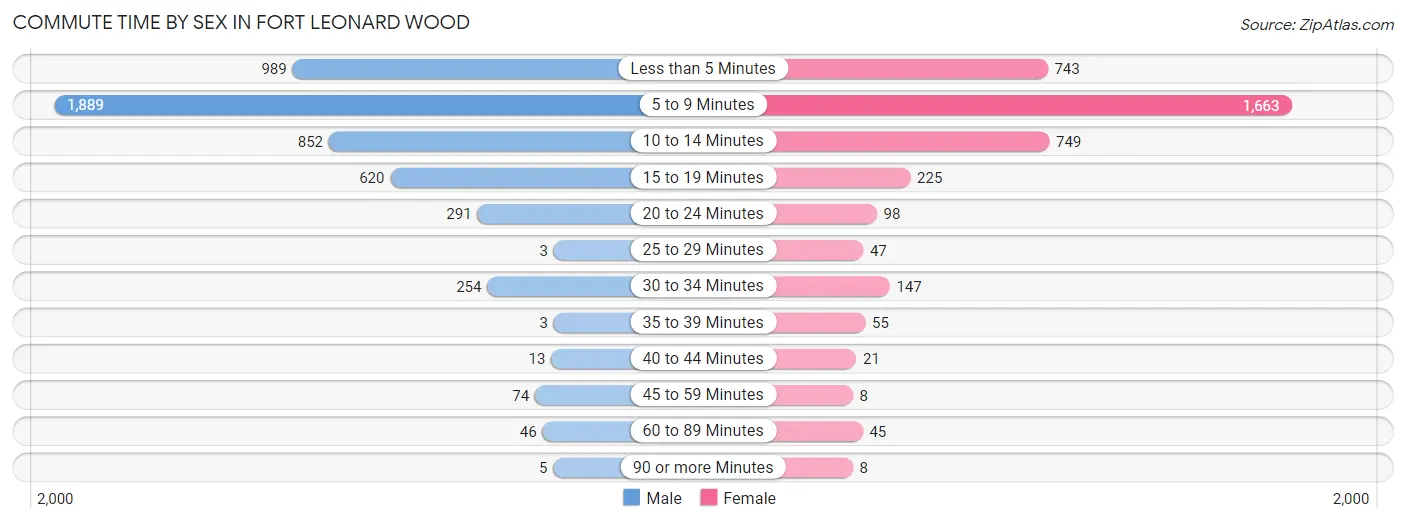
| Commute Time | Male | Female |
| Less than 5 Minutes | 989 (19.6%) | 743 (19.5%) |
| 5 to 9 Minutes | 1,889 (37.5%) | 1,663 (43.7%) |
| 10 to 14 Minutes | 852 (16.9%) | 749 (19.7%) |
| 15 to 19 Minutes | 620 (12.3%) | 225 (5.9%) |
| 20 to 24 Minutes | 291 (5.8%) | 98 (2.6%) |
| 25 to 29 Minutes | 3 (0.1%) | 47 (1.2%) |
| 30 to 34 Minutes | 254 (5.0%) | 147 (3.9%) |
| 35 to 39 Minutes | 3 (0.1%) | 55 (1.4%) |
| 40 to 44 Minutes | 13 (0.3%) | 21 (0.5%) |
| 45 to 59 Minutes | 74 (1.5%) | 8 (0.2%) |
| 60 to 89 Minutes | 46 (0.9%) | 45 (1.2%) |
| 90 or more Minutes | 5 (0.1%) | 8 (0.2%) |
Time of Departure to Work by Sex in Fort Leonard Wood
The most frequent times of departure to work in Fort Leonard Wood are 12:00 AM to 4:59 AM (1,549, 30.7%) for males and 12:00 AM to 4:59 AM (1,725, 45.3%) for females.
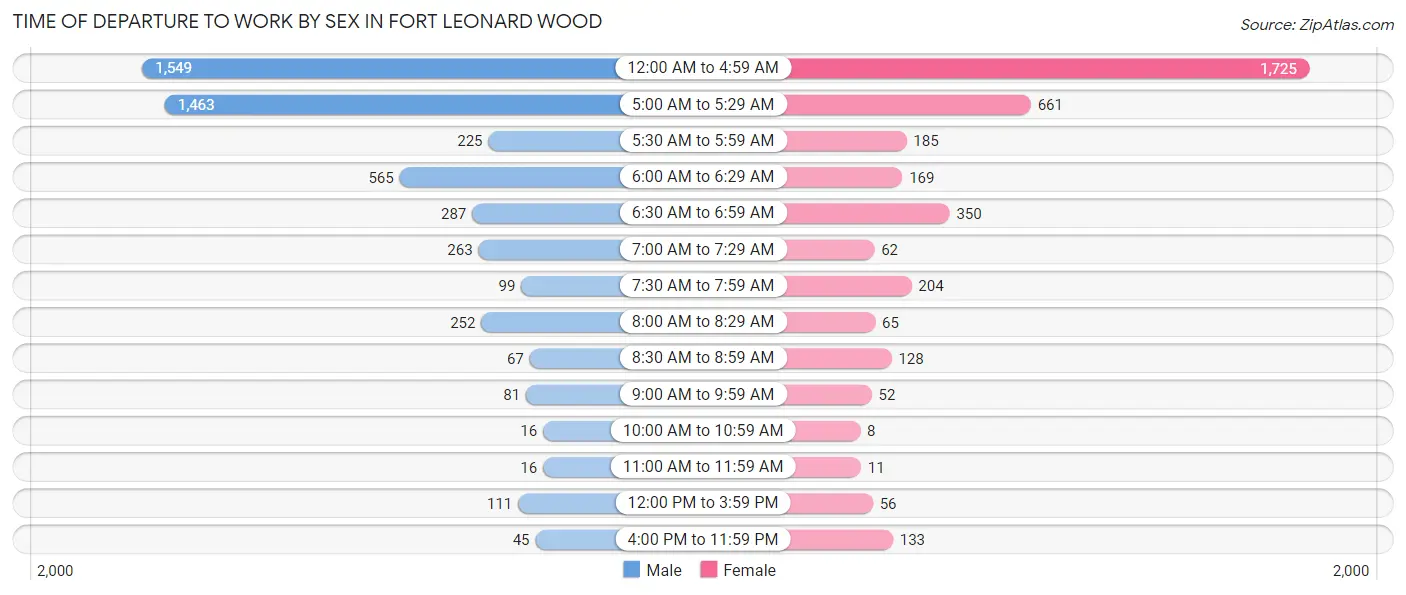
| Time of Departure | Male | Female |
| 12:00 AM to 4:59 AM | 1,549 (30.7%) | 1,725 (45.3%) |
| 5:00 AM to 5:29 AM | 1,463 (29.0%) | 661 (17.3%) |
| 5:30 AM to 5:59 AM | 225 (4.5%) | 185 (4.9%) |
| 6:00 AM to 6:29 AM | 565 (11.2%) | 169 (4.4%) |
| 6:30 AM to 6:59 AM | 287 (5.7%) | 350 (9.2%) |
| 7:00 AM to 7:29 AM | 263 (5.2%) | 62 (1.6%) |
| 7:30 AM to 7:59 AM | 99 (2.0%) | 204 (5.4%) |
| 8:00 AM to 8:29 AM | 252 (5.0%) | 65 (1.7%) |
| 8:30 AM to 8:59 AM | 67 (1.3%) | 128 (3.4%) |
| 9:00 AM to 9:59 AM | 81 (1.6%) | 52 (1.4%) |
| 10:00 AM to 10:59 AM | 16 (0.3%) | 8 (0.2%) |
| 11:00 AM to 11:59 AM | 16 (0.3%) | 11 (0.3%) |
| 12:00 PM to 3:59 PM | 111 (2.2%) | 56 (1.5%) |
| 4:00 PM to 11:59 PM | 45 (0.9%) | 133 (3.5%) |
| Total | 5,039 (100.0%) | 3,809 (100.0%) |
Housing Occupancy in Fort Leonard Wood
Occupancy by Ownership in Fort Leonard Wood
Of the total 2,028 dwellings in Fort Leonard Wood, owner-occupied units account for 25 (1.2%), while renter-occupied units make up 2,003 (98.8%).
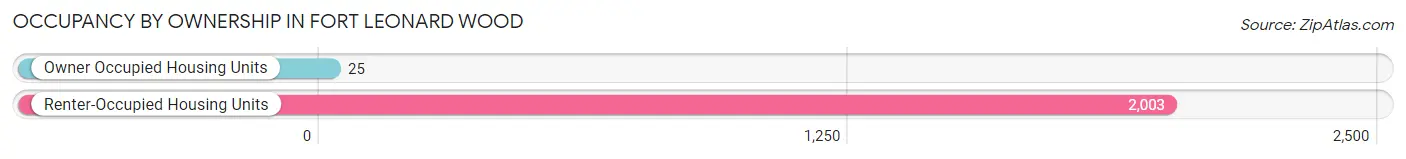
| Occupancy | # Housing Units | % Housing Units |
| Owner Occupied Housing Units | 25 | 1.2% |
| Renter-Occupied Housing Units | 2,003 | 98.8% |
| Total Occupied Housing Units | 2,028 | 100.0% |
Occupancy by Household Size in Fort Leonard Wood
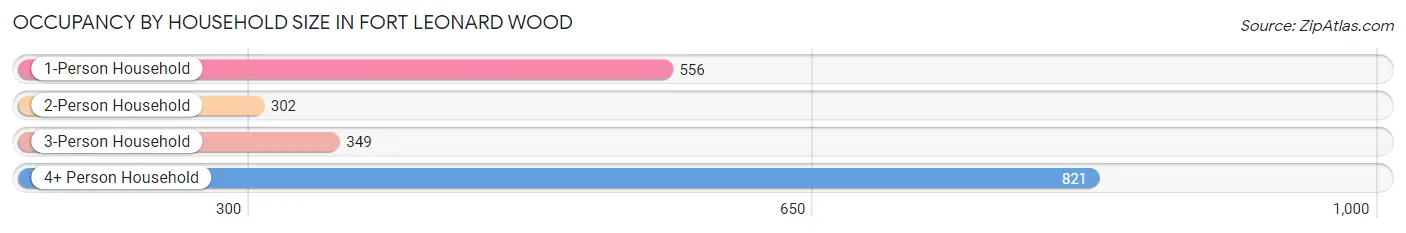
| Household Size | # Housing Units | % Housing Units |
| 1-Person Household | 556 | 27.4% |
| 2-Person Household | 302 | 14.9% |
| 3-Person Household | 349 | 17.2% |
| 4+ Person Household | 821 | 40.5% |
| Total Housing Units | 2,028 | 100.0% |
Occupancy by Ownership by Household Size in Fort Leonard Wood
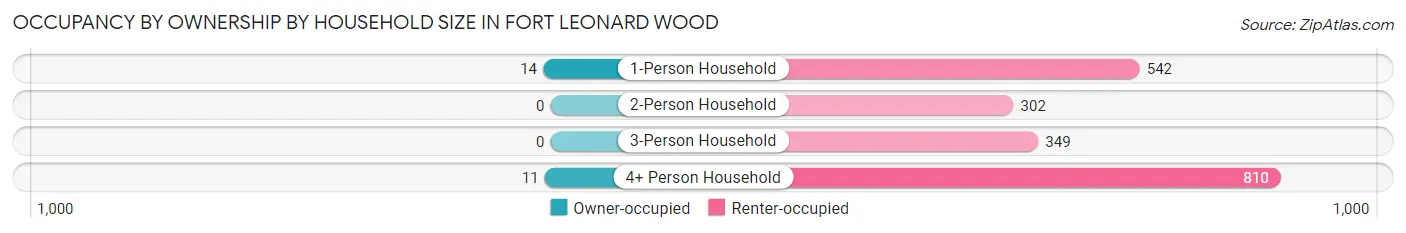
| Household Size | Owner-occupied | Renter-occupied |
| 1-Person Household | 14 (2.5%) | 542 (97.5%) |
| 2-Person Household | 0 (0.0%) | 302 (100.0%) |
| 3-Person Household | 0 (0.0%) | 349 (100.0%) |
| 4+ Person Household | 11 (1.3%) | 810 (98.7%) |
| Total Housing Units | 25 (1.2%) | 2,003 (98.8%) |
Occupancy by Educational Attainment in Fort Leonard Wood
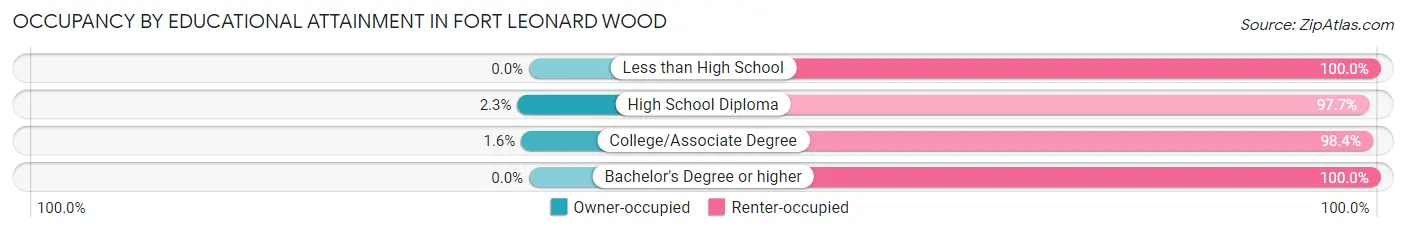
| Household Size | Owner-occupied | Renter-occupied |
| Less than High School | 0 (0.0%) | 17 (100.0%) |
| High School Diploma | 11 (2.3%) | 465 (97.7%) |
| College/Associate Degree | 14 (1.6%) | 884 (98.4%) |
| Bachelor's Degree or higher | 0 (0.0%) | 637 (100.0%) |
Occupancy by Age of Householder in Fort Leonard Wood
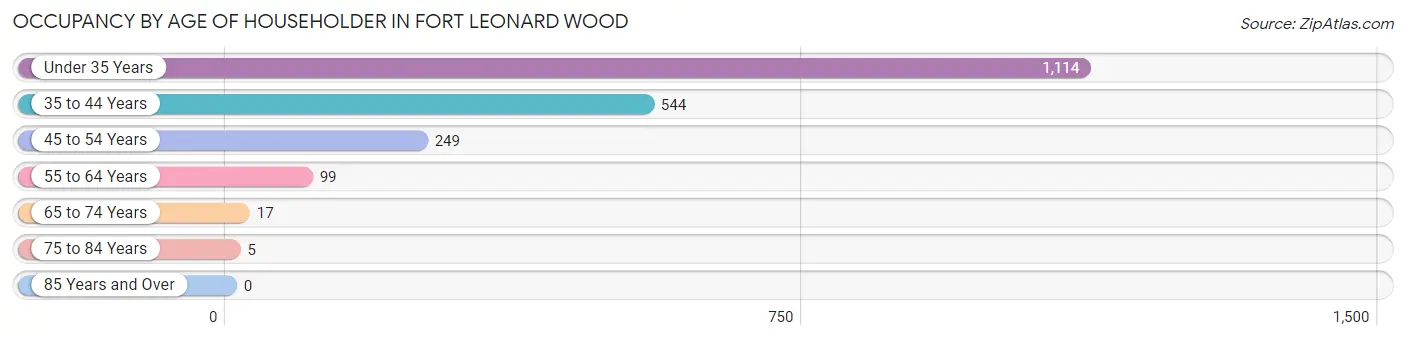
| Age Bracket | # Households | % Households |
| Under 35 Years | 1,114 | 54.9% |
| 35 to 44 Years | 544 | 26.8% |
| 45 to 54 Years | 249 | 12.3% |
| 55 to 64 Years | 99 | 4.9% |
| 65 to 74 Years | 17 | 0.8% |
| 75 to 84 Years | 5 | 0.3% |
| 85 Years and Over | 0 | 0.0% |
| Total | 2,028 | 100.0% |
Housing Finances in Fort Leonard Wood
Median Income by Occupancy in Fort Leonard Wood
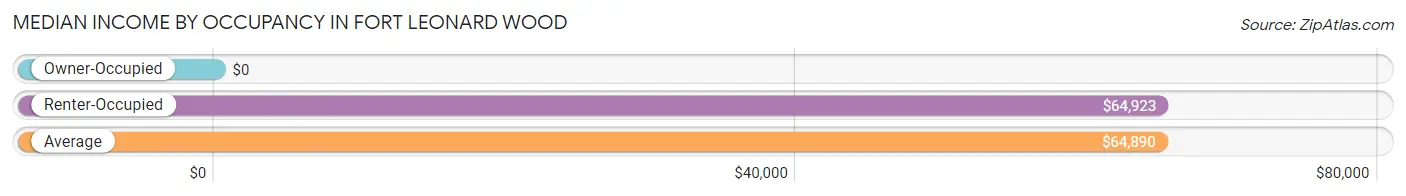
| Occupancy Type | # Households | Median Income |
| Owner-Occupied | 25 (1.2%) | $0 |
| Renter-Occupied | 2,003 (98.8%) | $64,923 |
| Average | 2,028 (100.0%) | $64,890 |
Occupancy by Householder Income Bracket in Fort Leonard Wood
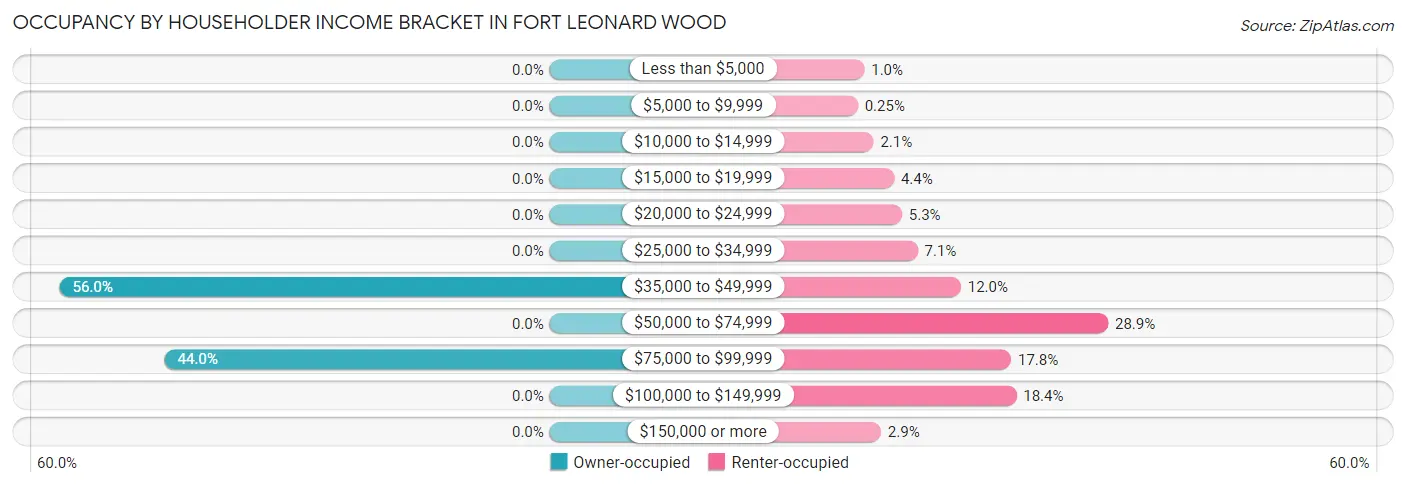
| Income Bracket | Owner-occupied | Renter-occupied |
| Less than $5,000 | 0 (0.0%) | 20 (1.0%) |
| $5,000 to $9,999 | 0 (0.0%) | 5 (0.3%) |
| $10,000 to $14,999 | 0 (0.0%) | 41 (2.1%) |
| $15,000 to $19,999 | 0 (0.0%) | 88 (4.4%) |
| $20,000 to $24,999 | 0 (0.0%) | 106 (5.3%) |
| $25,000 to $34,999 | 0 (0.0%) | 142 (7.1%) |
| $35,000 to $49,999 | 14 (56.0%) | 241 (12.0%) |
| $50,000 to $74,999 | 0 (0.0%) | 578 (28.9%) |
| $75,000 to $99,999 | 11 (44.0%) | 356 (17.8%) |
| $100,000 to $149,999 | 0 (0.0%) | 368 (18.4%) |
| $150,000 or more | 0 (0.0%) | 58 (2.9%) |
| Total | 25 (100.0%) | 2,003 (100.0%) |
Monthly Housing Cost Tiers in Fort Leonard Wood
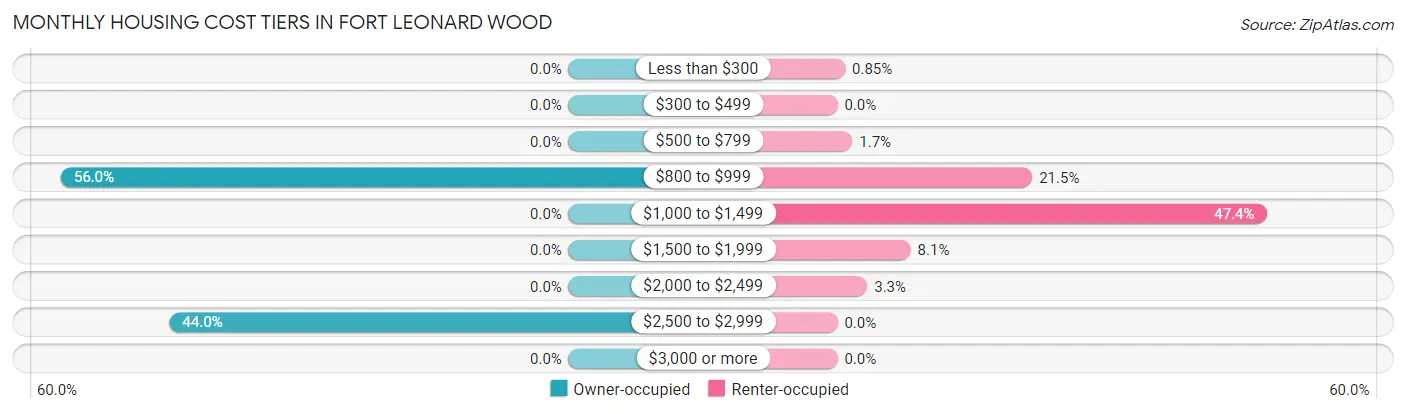
| Monthly Cost | Owner-occupied | Renter-occupied |
| Less than $300 | 0 (0.0%) | 17 (0.9%) |
| $300 to $499 | 0 (0.0%) | 0 (0.0%) |
| $500 to $799 | 0 (0.0%) | 33 (1.7%) |
| $800 to $999 | 14 (56.0%) | 431 (21.5%) |
| $1,000 to $1,499 | 0 (0.0%) | 949 (47.4%) |
| $1,500 to $1,999 | 0 (0.0%) | 162 (8.1%) |
| $2,000 to $2,499 | 0 (0.0%) | 66 (3.3%) |
| $2,500 to $2,999 | 11 (44.0%) | 0 (0.0%) |
| $3,000 or more | 0 (0.0%) | 0 (0.0%) |
| Total | 25 (100.0%) | 2,003 (100.0%) |
Physical Housing Characteristics in Fort Leonard Wood
Housing Structures in Fort Leonard Wood
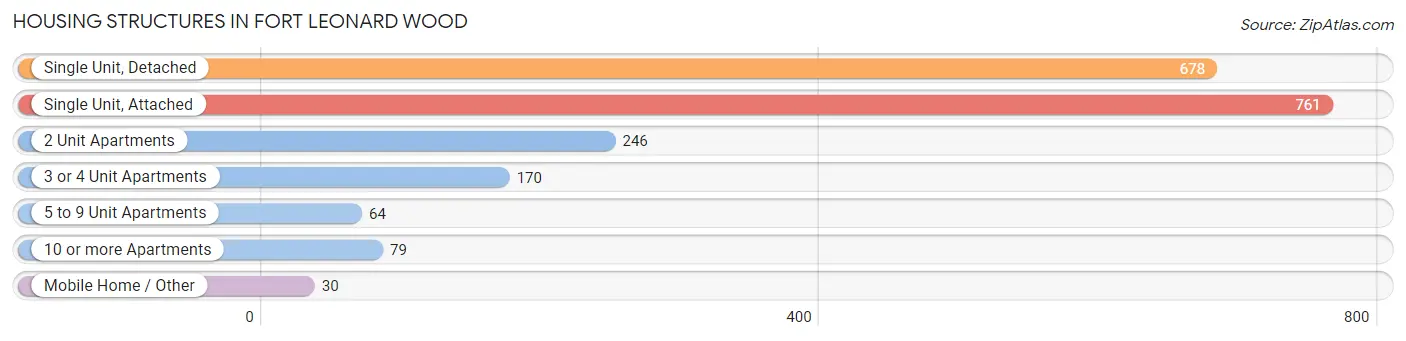
| Structure Type | # Housing Units | % Housing Units |
| Single Unit, Detached | 678 | 33.4% |
| Single Unit, Attached | 761 | 37.5% |
| 2 Unit Apartments | 246 | 12.1% |
| 3 or 4 Unit Apartments | 170 | 8.4% |
| 5 to 9 Unit Apartments | 64 | 3.2% |
| 10 or more Apartments | 79 | 3.9% |
| Mobile Home / Other | 30 | 1.5% |
| Total | 2,028 | 100.0% |
Housing Structures by Occupancy in Fort Leonard Wood
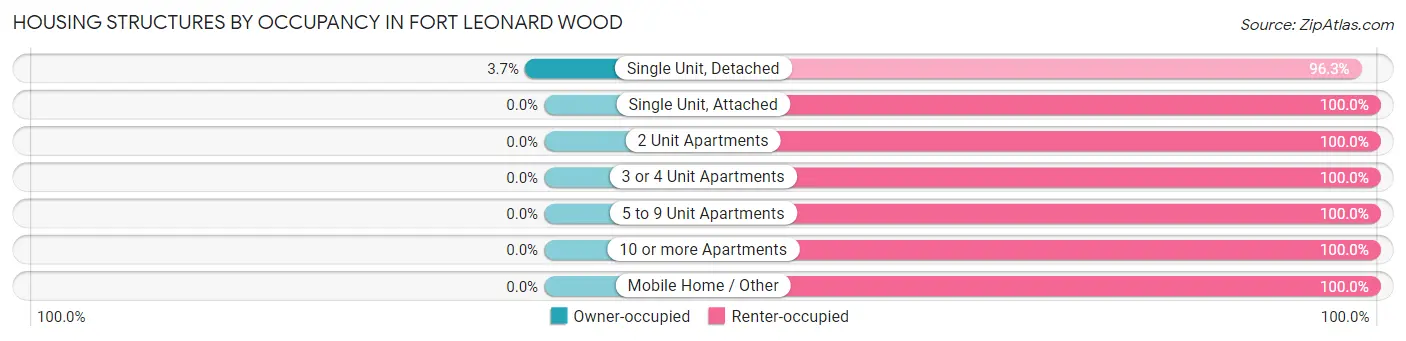
| Structure Type | Owner-occupied | Renter-occupied |
| Single Unit, Detached | 25 (3.7%) | 653 (96.3%) |
| Single Unit, Attached | 0 (0.0%) | 761 (100.0%) |
| 2 Unit Apartments | 0 (0.0%) | 246 (100.0%) |
| 3 or 4 Unit Apartments | 0 (0.0%) | 170 (100.0%) |
| 5 to 9 Unit Apartments | 0 (0.0%) | 64 (100.0%) |
| 10 or more Apartments | 0 (0.0%) | 79 (100.0%) |
| Mobile Home / Other | 0 (0.0%) | 30 (100.0%) |
| Total | 25 (1.2%) | 2,003 (98.8%) |
Housing Structures by Number of Rooms in Fort Leonard Wood
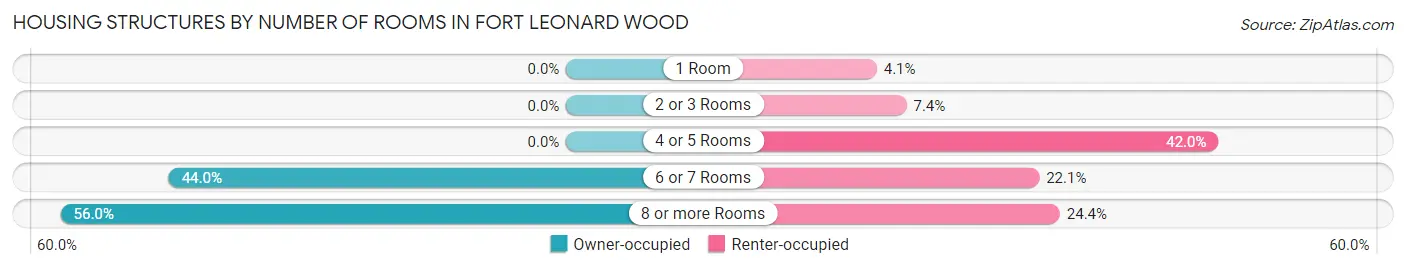
| Number of Rooms | Owner-occupied | Renter-occupied |
| 1 Room | 0 (0.0%) | 82 (4.1%) |
| 2 or 3 Rooms | 0 (0.0%) | 148 (7.4%) |
| 4 or 5 Rooms | 0 (0.0%) | 841 (42.0%) |
| 6 or 7 Rooms | 11 (44.0%) | 443 (22.1%) |
| 8 or more Rooms | 14 (56.0%) | 489 (24.4%) |
| Total | 25 (100.0%) | 2,003 (100.0%) |
Housing Structure by Heating Type in Fort Leonard Wood
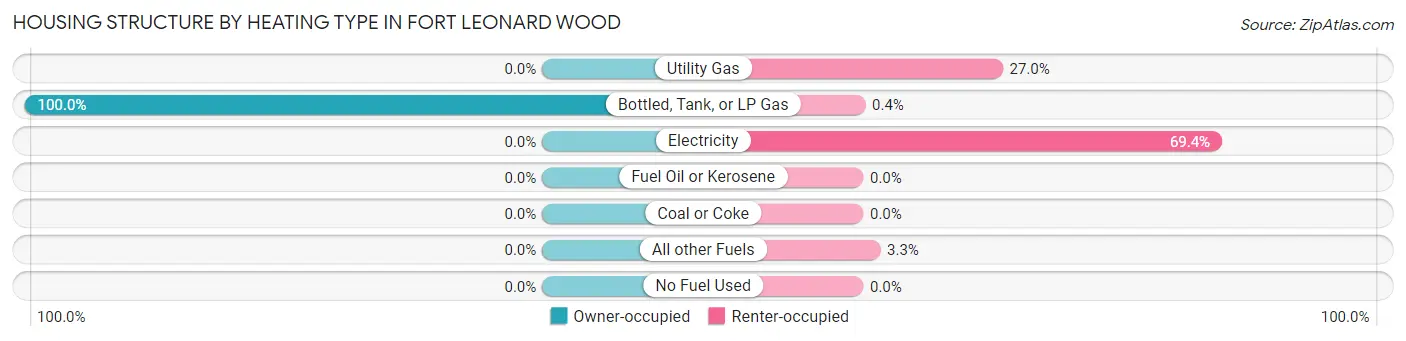
| Heating Type | Owner-occupied | Renter-occupied |
| Utility Gas | 0 (0.0%) | 540 (27.0%) |
| Bottled, Tank, or LP Gas | 25 (100.0%) | 8 (0.4%) |
| Electricity | 0 (0.0%) | 1,389 (69.4%) |
| Fuel Oil or Kerosene | 0 (0.0%) | 0 (0.0%) |
| Coal or Coke | 0 (0.0%) | 0 (0.0%) |
| All other Fuels | 0 (0.0%) | 66 (3.3%) |
| No Fuel Used | 0 (0.0%) | 0 (0.0%) |
| Total | 25 (100.0%) | 2,003 (100.0%) |
Household Vehicle Usage in Fort Leonard Wood
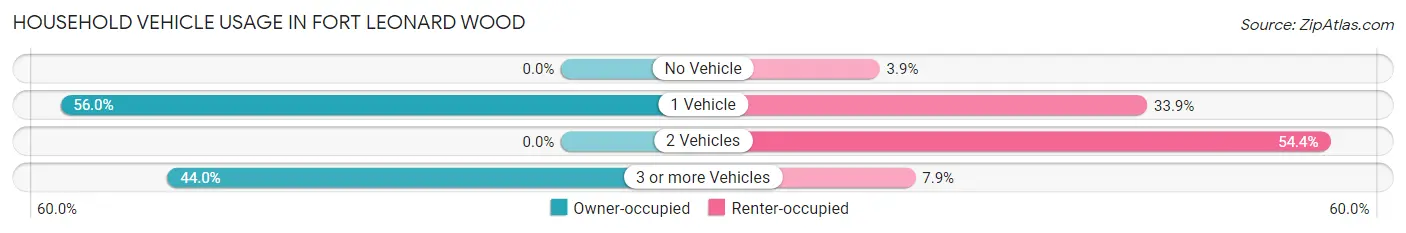
| Vehicles per Household | Owner-occupied | Renter-occupied |
| No Vehicle | 0 (0.0%) | 78 (3.9%) |
| 1 Vehicle | 14 (56.0%) | 678 (33.9%) |
| 2 Vehicles | 0 (0.0%) | 1,089 (54.4%) |
| 3 or more Vehicles | 11 (44.0%) | 158 (7.9%) |
| Total | 25 (100.0%) | 2,003 (100.0%) |
Real Estate & Mortgages in Fort Leonard Wood
Real Estate and Mortgage Overview in Fort Leonard Wood
| Characteristic | Without Mortgage | With Mortgage |
| Housing Units | 0 | 25 |
| Median Property Value | - | - |
| Median Household Income | - | - |
| Monthly Housing Costs | - | - |
| Real Estate Taxes | - | - |
Property Value by Mortgage Status in Fort Leonard Wood
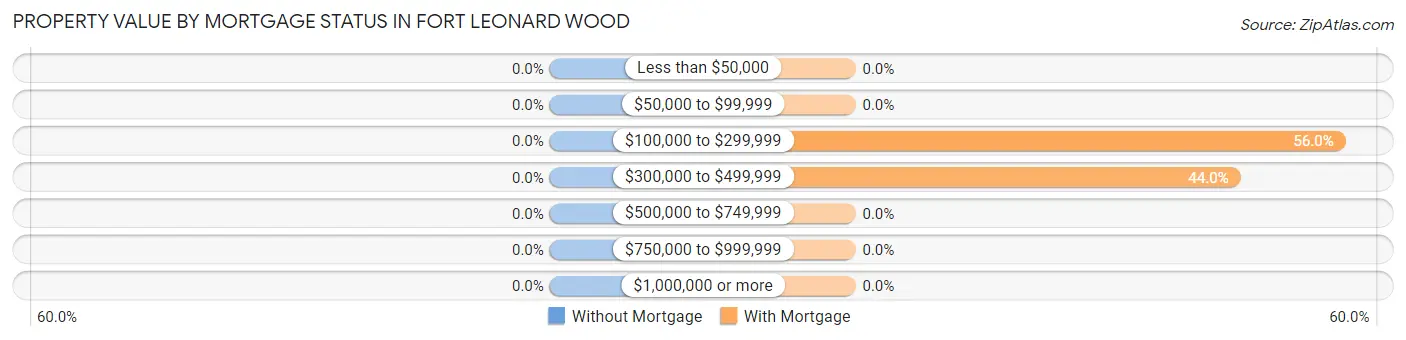
| Property Value | Without Mortgage | With Mortgage |
| Less than $50,000 | 0 (0.0%) | 0 (0.0%) |
| $50,000 to $99,999 | 0 (0.0%) | 0 (0.0%) |
| $100,000 to $299,999 | 0 (0.0%) | 14 (56.0%) |
| $300,000 to $499,999 | 0 (0.0%) | 11 (44.0%) |
| $500,000 to $749,999 | 0 (0.0%) | 0 (0.0%) |
| $750,000 to $999,999 | 0 (0.0%) | 0 (0.0%) |
| $1,000,000 or more | 0 (0.0%) | 0 (0.0%) |
| Total | 0 (0.0%) | 25 (100.0%) |
Household Income by Mortgage Status in Fort Leonard Wood
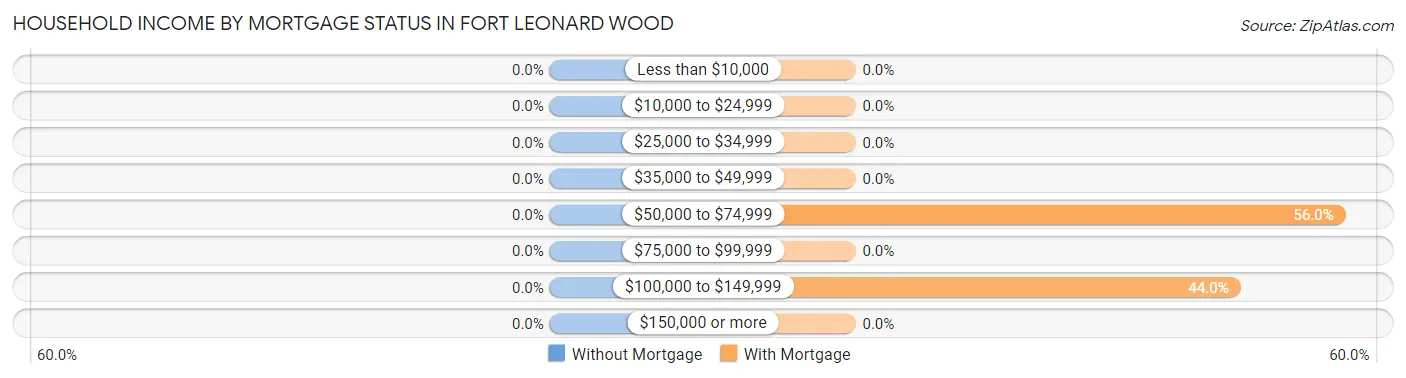
| Household Income | Without Mortgage | With Mortgage |
| Less than $10,000 | 0 (0.0%) | 0 (0.0%) |
| $10,000 to $24,999 | 0 (0.0%) | 0 (0.0%) |
| $25,000 to $34,999 | 0 (0.0%) | 0 (0.0%) |
| $35,000 to $49,999 | 0 (0.0%) | 0 (0.0%) |
| $50,000 to $74,999 | 0 (0.0%) | 14 (56.0%) |
| $75,000 to $99,999 | 0 (0.0%) | 0 (0.0%) |
| $100,000 to $149,999 | 0 (0.0%) | 11 (44.0%) |
| $150,000 or more | 0 (0.0%) | 0 (0.0%) |
| Total | 0 (0.0%) | 25 (100.0%) |
Property Value to Household Income Ratio in Fort Leonard Wood
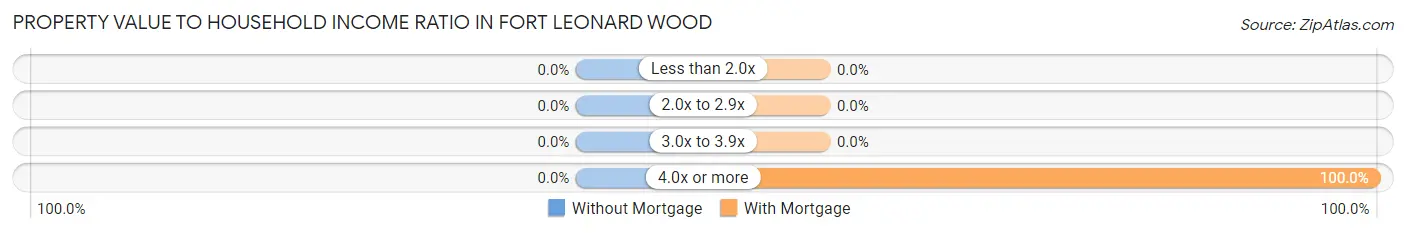
| Value-to-Income Ratio | Without Mortgage | With Mortgage |
| Less than 2.0x | 0 (0.0%) | 0 (0.0%) |
| 2.0x to 2.9x | 0 (0.0%) | 0 (0.0%) |
| 3.0x to 3.9x | 0 (0.0%) | 0 (0.0%) |
| 4.0x or more | 0 (0.0%) | 25 (100.0%) |
| Total | 0 (0.0%) | 25 (100.0%) |
Real Estate Taxes by Mortgage Status in Fort Leonard Wood
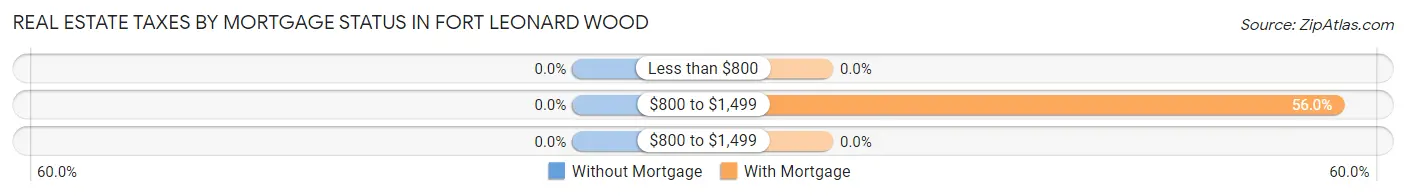
| Property Taxes | Without Mortgage | With Mortgage |
| Less than $800 | 0 (0.0%) | 0 (0.0%) |
| $800 to $1,499 | 0 (0.0%) | 14 (56.0%) |
| $800 to $1,499 | 0 (0.0%) | 0 (0.0%) |
| Total | 0 (0.0%) | 25 (100.0%) |
Health & Disability in Fort Leonard Wood
Health Insurance Coverage by Age in Fort Leonard Wood
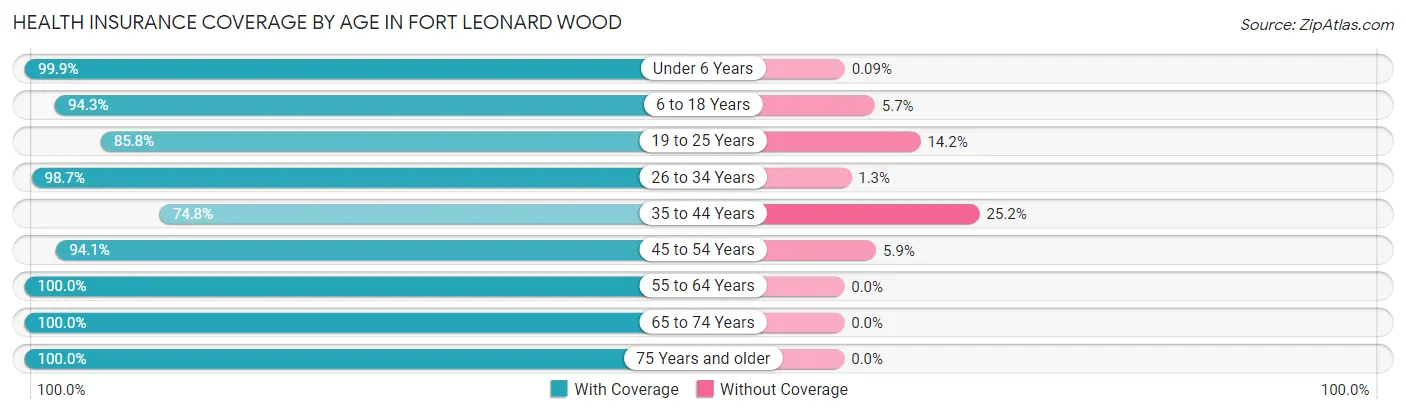
| Age Bracket | With Coverage | Without Coverage |
| Under 6 Years | 1,107 (99.9%) | 1 (0.1%) |
| 6 to 18 Years | 1,542 (94.3%) | 93 (5.7%) |
| 19 to 25 Years | 344 (85.8%) | 57 (14.2%) |
| 26 to 34 Years | 609 (98.7%) | 8 (1.3%) |
| 35 to 44 Years | 563 (74.8%) | 190 (25.2%) |
| 45 to 54 Years | 269 (94.1%) | 17 (5.9%) |
| 55 to 64 Years | 159 (100.0%) | 0 (0.0%) |
| 65 to 74 Years | 52 (100.0%) | 0 (0.0%) |
| 75 Years and older | 5 (100.0%) | 0 (0.0%) |
| Total | 4,650 (92.7%) | 366 (7.3%) |
Health Insurance Coverage by Citizenship Status in Fort Leonard Wood
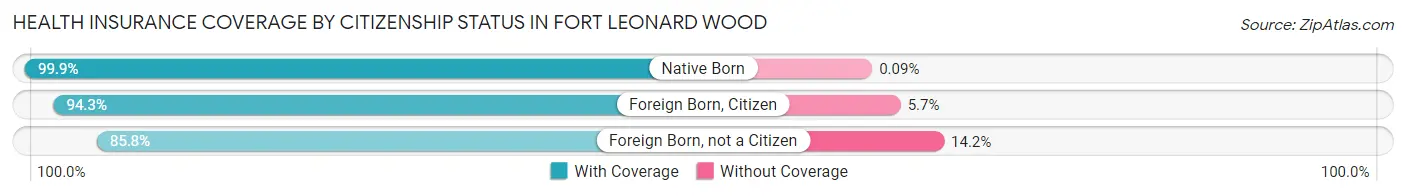
| Citizenship Status | With Coverage | Without Coverage |
| Native Born | 1,107 (99.9%) | 1 (0.1%) |
| Foreign Born, Citizen | 1,542 (94.3%) | 93 (5.7%) |
| Foreign Born, not a Citizen | 344 (85.8%) | 57 (14.2%) |
Health Insurance Coverage by Household Income in Fort Leonard Wood
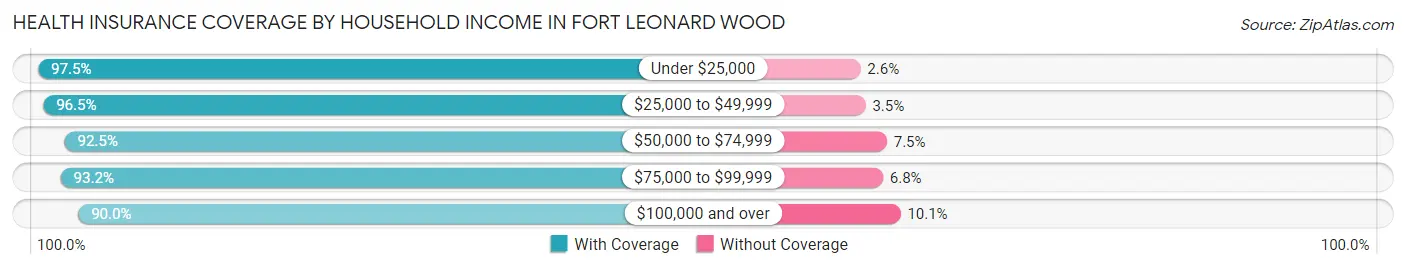
| Household Income | With Coverage | Without Coverage |
| Under $25,000 | 306 (97.5%) | 8 (2.5%) |
| $25,000 to $49,999 | 551 (96.5%) | 20 (3.5%) |
| $50,000 to $74,999 | 1,606 (92.5%) | 130 (7.5%) |
| $75,000 to $99,999 | 993 (93.2%) | 72 (6.8%) |
| $100,000 and over | 1,182 (89.9%) | 132 (10.1%) |
Public vs Private Health Insurance Coverage by Age in Fort Leonard Wood
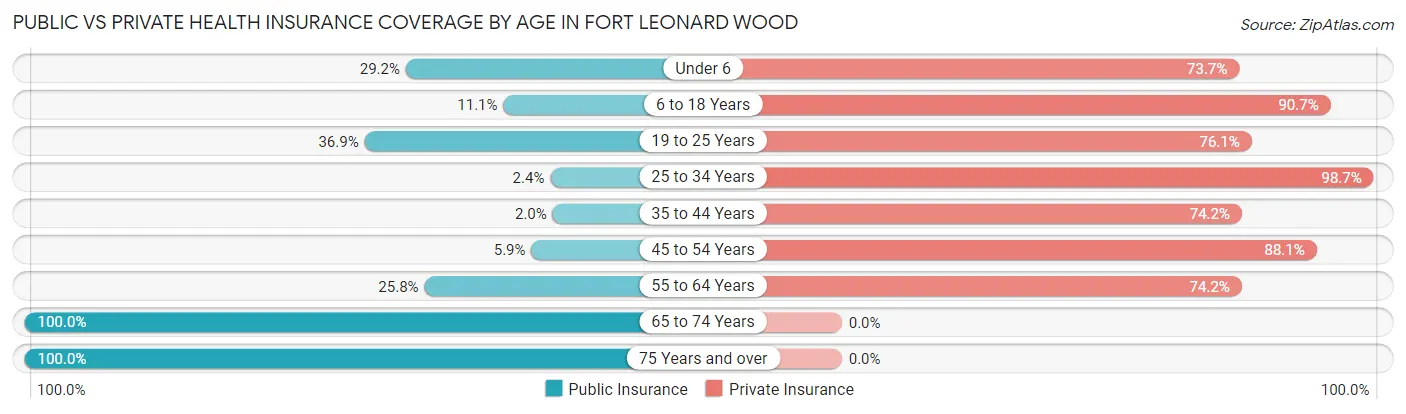
| Age Bracket | Public Insurance | Private Insurance |
| Under 6 | 324 (29.2%) | 817 (73.7%) |
| 6 to 18 Years | 182 (11.1%) | 1,483 (90.7%) |
| 19 to 25 Years | 148 (36.9%) | 305 (76.1%) |
| 25 to 34 Years | 15 (2.4%) | 609 (98.7%) |
| 35 to 44 Years | 15 (2.0%) | 559 (74.2%) |
| 45 to 54 Years | 17 (5.9%) | 252 (88.1%) |
| 55 to 64 Years | 41 (25.8%) | 118 (74.2%) |
| 65 to 74 Years | 52 (100.0%) | 0 (0.0%) |
| 75 Years and over | 5 (100.0%) | 0 (0.0%) |
| Total | 799 (15.9%) | 4,143 (82.6%) |
Disability Status by Sex by Age in Fort Leonard Wood
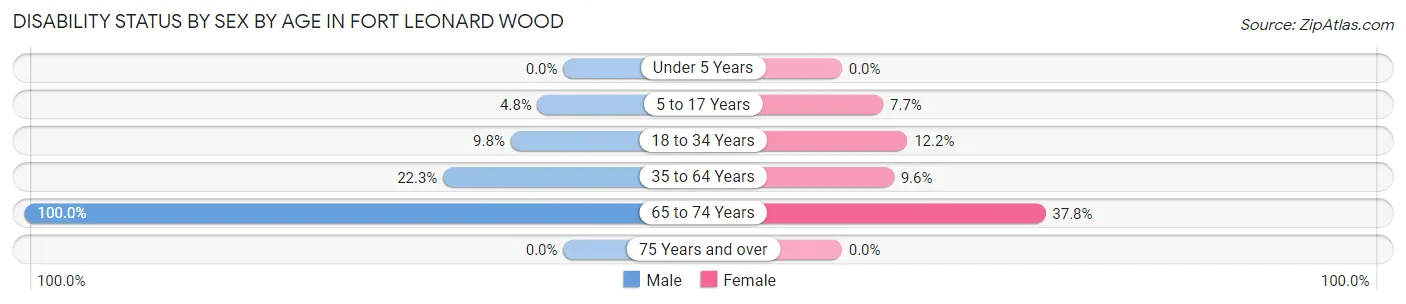
| Age Bracket | Male | Female |
| Under 5 Years | 0 (0.0%) | 0 (0.0%) |
| 5 to 17 Years | 48 (4.8%) | 59 (7.7%) |
| 18 to 34 Years | 47 (9.8%) | 70 (12.1%) |
| 35 to 64 Years | 68 (22.3%) | 86 (9.6%) |
| 65 to 74 Years | 7 (100.0%) | 17 (37.8%) |
| 75 Years and over | 0 (0.0%) | 0 (0.0%) |
Disability Class by Sex by Age in Fort Leonard Wood
Disability Class: Hearing Difficulty
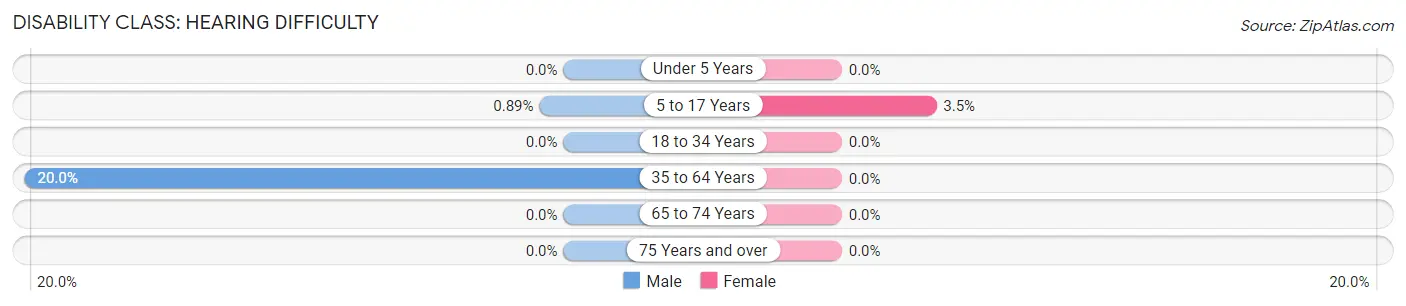
| Age Bracket | Male | Female |
| Under 5 Years | 0 (0.0%) | 0 (0.0%) |
| 5 to 17 Years | 9 (0.9%) | 27 (3.5%) |
| 18 to 34 Years | 0 (0.0%) | 0 (0.0%) |
| 35 to 64 Years | 61 (20.0%) | 0 (0.0%) |
| 65 to 74 Years | 0 (0.0%) | 0 (0.0%) |
| 75 Years and over | 0 (0.0%) | 0 (0.0%) |
Disability Class: Vision Difficulty
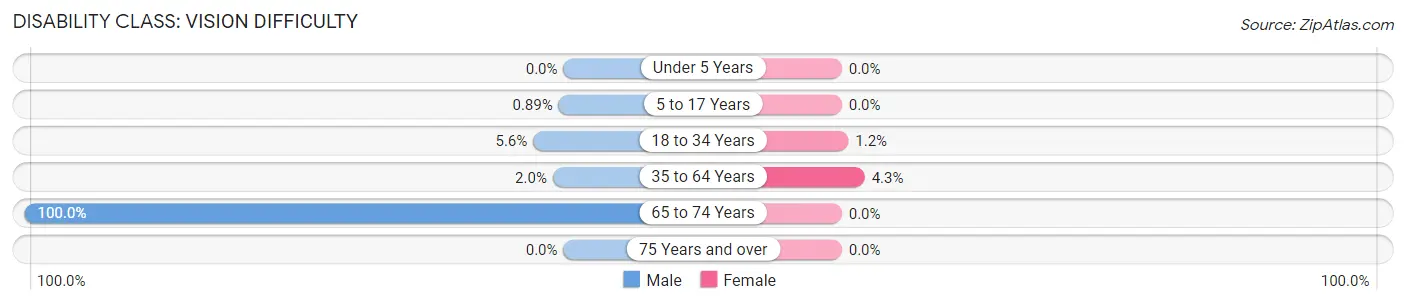
| Age Bracket | Male | Female |
| Under 5 Years | 0 (0.0%) | 0 (0.0%) |
| 5 to 17 Years | 9 (0.9%) | 0 (0.0%) |
| 18 to 34 Years | 27 (5.6%) | 7 (1.2%) |
| 35 to 64 Years | 6 (2.0%) | 38 (4.3%) |
| 65 to 74 Years | 7 (100.0%) | 0 (0.0%) |
| 75 Years and over | 0 (0.0%) | 0 (0.0%) |
Disability Class: Cognitive Difficulty
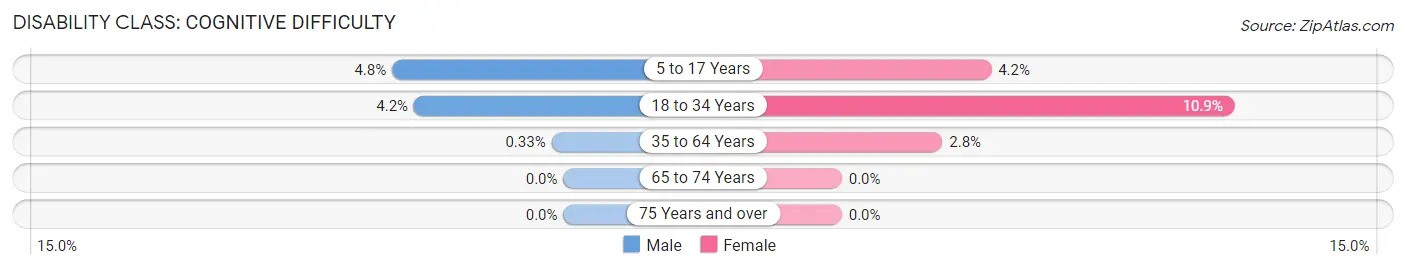
| Age Bracket | Male | Female |
| 5 to 17 Years | 48 (4.8%) | 32 (4.2%) |
| 18 to 34 Years | 20 (4.2%) | 63 (10.9%) |
| 35 to 64 Years | 1 (0.3%) | 25 (2.8%) |
| 65 to 74 Years | 0 (0.0%) | 0 (0.0%) |
| 75 Years and over | 0 (0.0%) | 0 (0.0%) |
Disability Class: Ambulatory Difficulty
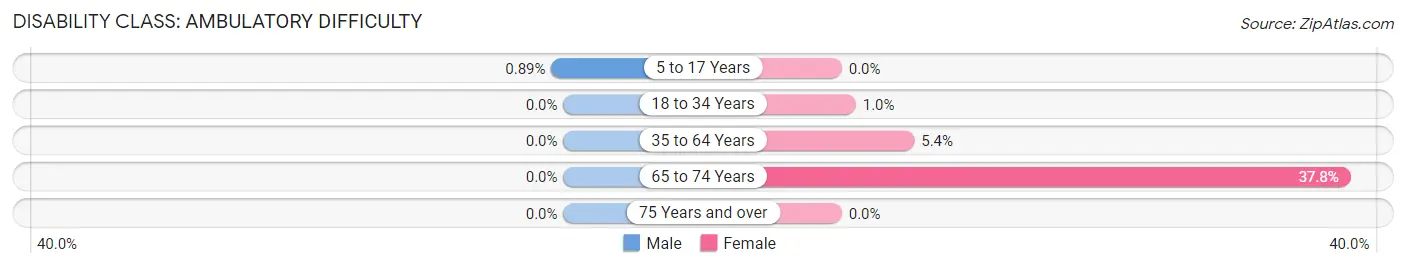
| Age Bracket | Male | Female |
| 5 to 17 Years | 9 (0.9%) | 0 (0.0%) |
| 18 to 34 Years | 0 (0.0%) | 6 (1.0%) |
| 35 to 64 Years | 0 (0.0%) | 48 (5.4%) |
| 65 to 74 Years | 0 (0.0%) | 17 (37.8%) |
| 75 Years and over | 0 (0.0%) | 0 (0.0%) |
Disability Class: Self-Care Difficulty
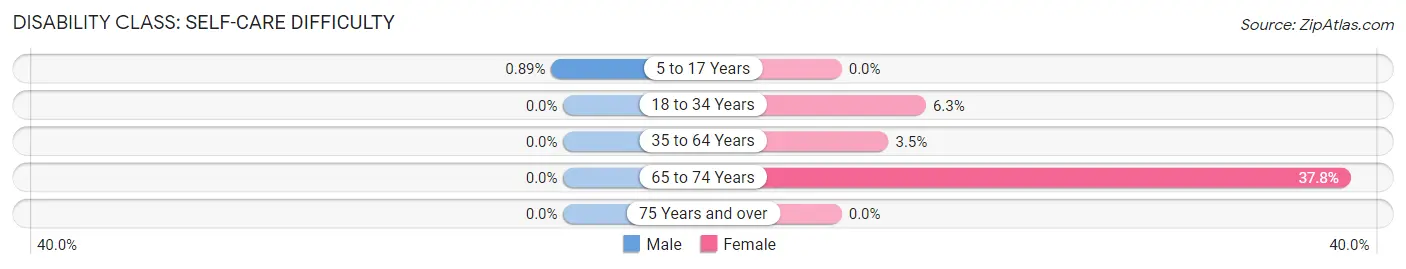
| Age Bracket | Male | Female |
| 5 to 17 Years | 9 (0.9%) | 0 (0.0%) |
| 18 to 34 Years | 0 (0.0%) | 36 (6.2%) |
| 35 to 64 Years | 0 (0.0%) | 31 (3.5%) |
| 65 to 74 Years | 0 (0.0%) | 17 (37.8%) |
| 75 Years and over | 0 (0.0%) | 0 (0.0%) |
Technology Access in Fort Leonard Wood
Computing Device Access in Fort Leonard Wood
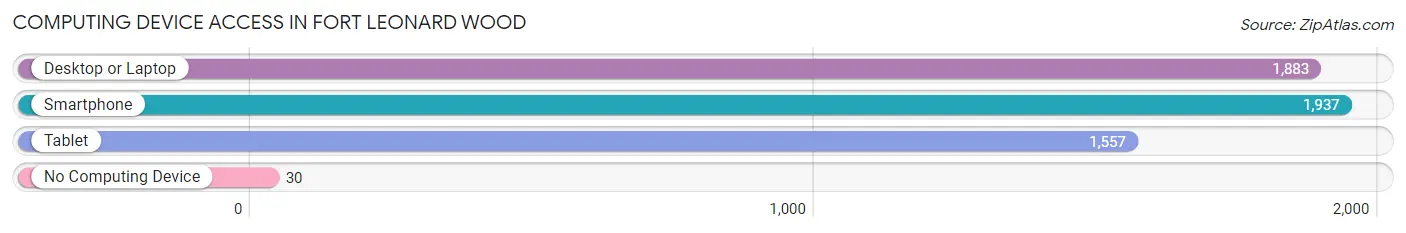
| Device Type | # Households | % Households |
| Desktop or Laptop | 1,883 | 92.8% |
| Smartphone | 1,937 | 95.5% |
| Tablet | 1,557 | 76.8% |
| No Computing Device | 30 | 1.5% |
| Total | 2,028 | 100.0% |
Internet Access in Fort Leonard Wood
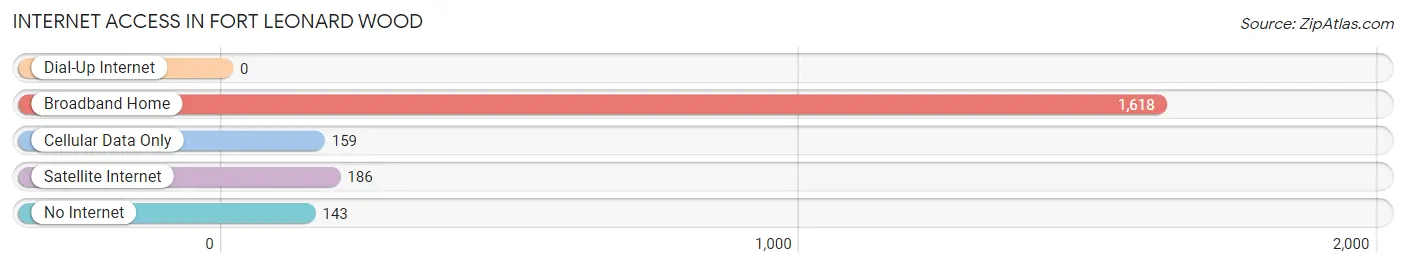
| Internet Type | # Households | % Households |
| Dial-Up Internet | 0 | 0.0% |
| Broadband Home | 1,618 | 79.8% |
| Cellular Data Only | 159 | 7.8% |
| Satellite Internet | 186 | 9.2% |
| No Internet | 143 | 7.0% |
| Total | 2,028 | 100.0% |
Fort Leonard Wood Summary
Leonard Wood is a United States Army installation located in the Ozark Mountains of south-central Missouri. It is the largest Army installation in the state and is home to the Maneuver Support Center of Excellence, the U.S. Army Engineer School, the U.S. Army Chemical, Biological, Radiological, and Nuclear School, and the U.S. Army Military Police School. The installation is named after General Leonard Wood, a former Chief of Staff of the United States Army.
History
Fort Leonard Wood was established in 1940 as a training center for the U.S. Army. The installation was originally named Camp Leonard Wood, and was located in the Ozark Mountains of south-central Missouri. The camp was established to provide training for the Army’s new mechanized forces, and was the first of its kind in the United States.
During World War II, the camp was used to train soldiers for combat in Europe and the Pacific. In addition to training soldiers, the camp also served as a prisoner of war camp, housing German and Italian prisoners of war. After the war, the camp was used as a demobilization center for returning soldiers.
In 1950, the camp was renamed Fort Leonard Wood and became a permanent Army installation. The installation was used to train soldiers for the Korean War, and later for the Vietnam War. During the Cold War, the fort was used to train soldiers for combat in Europe and the Middle East.
In the late 1980s, the fort was used to train soldiers for the Gulf War. In the 1990s, the fort was used to train soldiers for the wars in Iraq and Afghanistan.
Geography
Fort Leonard Wood is located in the Ozark Mountains of south-central Missouri. The installation is situated in Pulaski County, and is approximately 90 miles south of St. Louis. The installation covers approximately 87,000 acres of land, and is bordered by the Mark Twain National Forest to the east and the Gasconade River to the west.
The installation is located in a rural area, and is surrounded by small towns and villages. The nearest city is Waynesville, which is approximately 10 miles from the installation.
Economy
Fort Leonard Wood is a major economic driver in the region. The installation has an annual economic impact of approximately $1.2 billion, and is the largest employer in Pulaski County. The installation employs approximately 10,000 military personnel, civilian employees, and contractors.
In addition to the military personnel and civilian employees, the installation also supports a large number of businesses and organizations. These include restaurants, hotels, retail stores, and other businesses that provide goods and services to the installation and its personnel.
Demographics
As of 2019, the population of Fort Leonard Wood was approximately 10,000. The population is primarily composed of military personnel and civilian employees. The racial makeup of the installation is approximately 75% White, 15% African American, 5% Hispanic, and 5% other.
The median household income at the installation is approximately $50,000. The median age of the population is approximately 28 years old.
Conclusion
Fort Leonard Wood is a United States Army installation located in the Ozark Mountains of south-central Missouri. The installation was established in 1940 and is the largest Army installation in the state. The installation is home to the Maneuver Support Center of Excellence, the U.S. Army Engineer School, the U.S. Army Chemical, Biological, Radiological, and Nuclear School, and the U.S. Army Military Police School. The installation has an annual economic impact of approximately $1.2 billion, and is the largest employer in Pulaski County. The population of the installation is primarily composed of military personnel and civilian employees, and the median household income is approximately $50,000.
Common Questions
What is Per Capita Income in Fort Leonard Wood?
Per Capita income in Fort Leonard Wood is $20,304.
What is the Median Family Income in Fort Leonard Wood?
Median Family Income in Fort Leonard Wood is $72,782.
What is the Median Household income in Fort Leonard Wood?
Median Household Income in Fort Leonard Wood is $64,890.
What is Income or Wage Gap in Fort Leonard Wood?
Income or Wage Gap in Fort Leonard Wood is 8.2%.
Women in Fort Leonard Wood earn 91.8 cents for every dollar earned by a man.
What is Inequality or Gini Index in Fort Leonard Wood?
Inequality or Gini Index in Fort Leonard Wood is 0.32.
What is the Total Population of Fort Leonard Wood?
Total Population of Fort Leonard Wood is 15,615.
What is the Total Male Population of Fort Leonard Wood?
Total Male Population of Fort Leonard Wood is 9,503.
What is the Total Female Population of Fort Leonard Wood?
Total Female Population of Fort Leonard Wood is 6,112.
What is the Ratio of Males per 100 Females in Fort Leonard Wood?
There are 155.48 Males per 100 Females in Fort Leonard Wood.
What is the Ratio of Females per 100 Males in Fort Leonard Wood?
There are 64.32 Females per 100 Males in Fort Leonard Wood.
What is the Median Population Age in Fort Leonard Wood?
Median Population Age in Fort Leonard Wood is 20.6 Years.
What is the Average Family Size in Fort Leonard Wood
Average Family Size in Fort Leonard Wood is 4.0 People.
What is the Average Household Size in Fort Leonard Wood
Average Household Size in Fort Leonard Wood is 3.1 People.
How Large is the Labor Force in Fort Leonard Wood?
There are 10,950 People in the Labor Forcein in Fort Leonard Wood.
What is the Percentage of People in the Labor Force in Fort Leonard Wood?
83.8% of People are in the Labor Force in Fort Leonard Wood.
What is the Unemployment Rate in Fort Leonard Wood?
Unemployment Rate in Fort Leonard Wood is 4.3%.