Stacey Street, FL Map & Demographics
Stacey Street Map
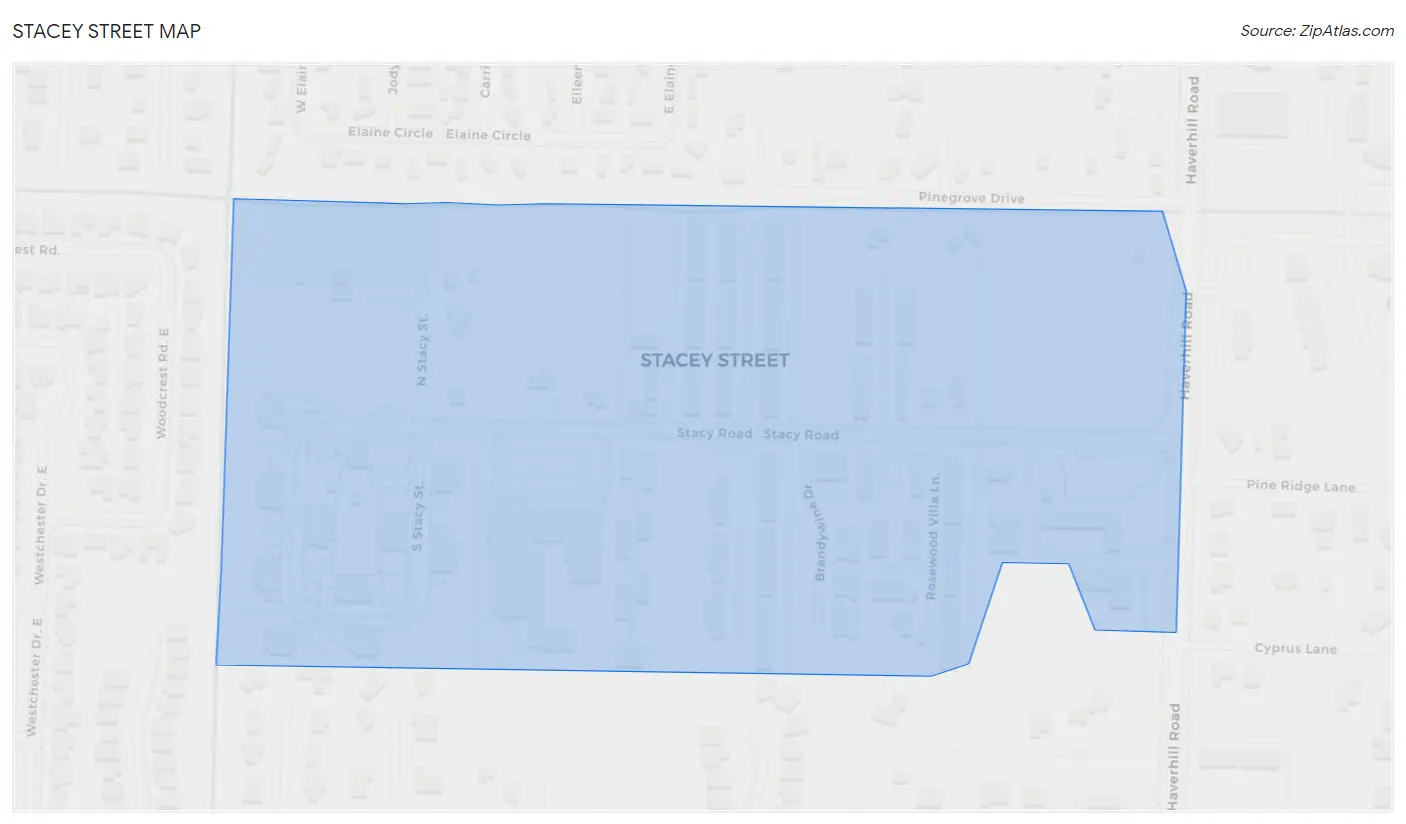
Stacey Street Overview
$17,858
PER CAPITA INCOME
$57,335
AVG FAMILY INCOME
$56,675
AVG HOUSEHOLD INCOME
0.29
INEQUALITY / GINI INDEX
531
TOTAL POPULATION
230
MALE POPULATION
301
FEMALE POPULATION
76.41
MALES / 100 FEMALES
130.87
FEMALES / 100 MALES
33.0
MEDIAN AGE
4.2
AVG FAMILY SIZE
4.1
AVG HOUSEHOLD SIZE
405
LABOR FORCE [ PEOPLE ]
80.7%
PERCENT IN LABOR FORCE
26.7%
UNEMPLOYMENT RATE
Income in Stacey Street
Income Overview in Stacey Street
Per Capita Income in Stacey Street is $17,858, while median incomes of families and households are $57,335 and $56,675 respectively.
| Characteristic | Number | Measure |
| Per Capita Income | 531 | $17,858 |
| Median Family Income | 99 | $57,335 |
| Mean Family Income | 99 | $73,391 |
| Median Household Income | 127 | $56,675 |
| Mean Household Income | 127 | $63,055 |
| Income Deficit | 99 | $0 |
| Wage / Income Gap (%) | 531 | 0.00% |
| Wage / Income Gap ($) | 531 | 100.00¢ per $1 |
| Gini / Inequality Index | 531 | 0.29 |
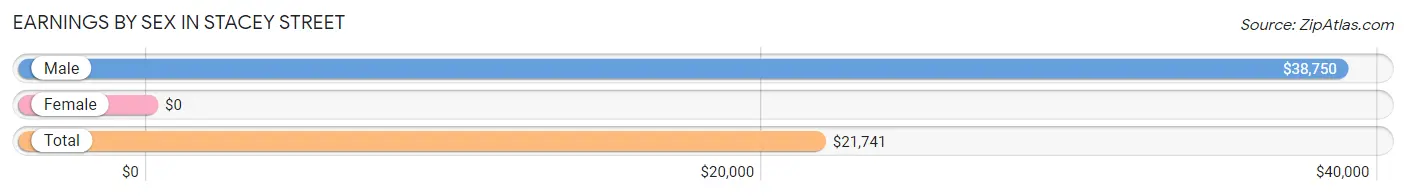
Earnings by Sex in Stacey Street
| Sex | Number | Average Earnings |
| Male | 178 (56.1%) | $38,750 |
| Female | 139 (43.9%) | $0 |
| Total | 317 (100.0%) | $21,741 |
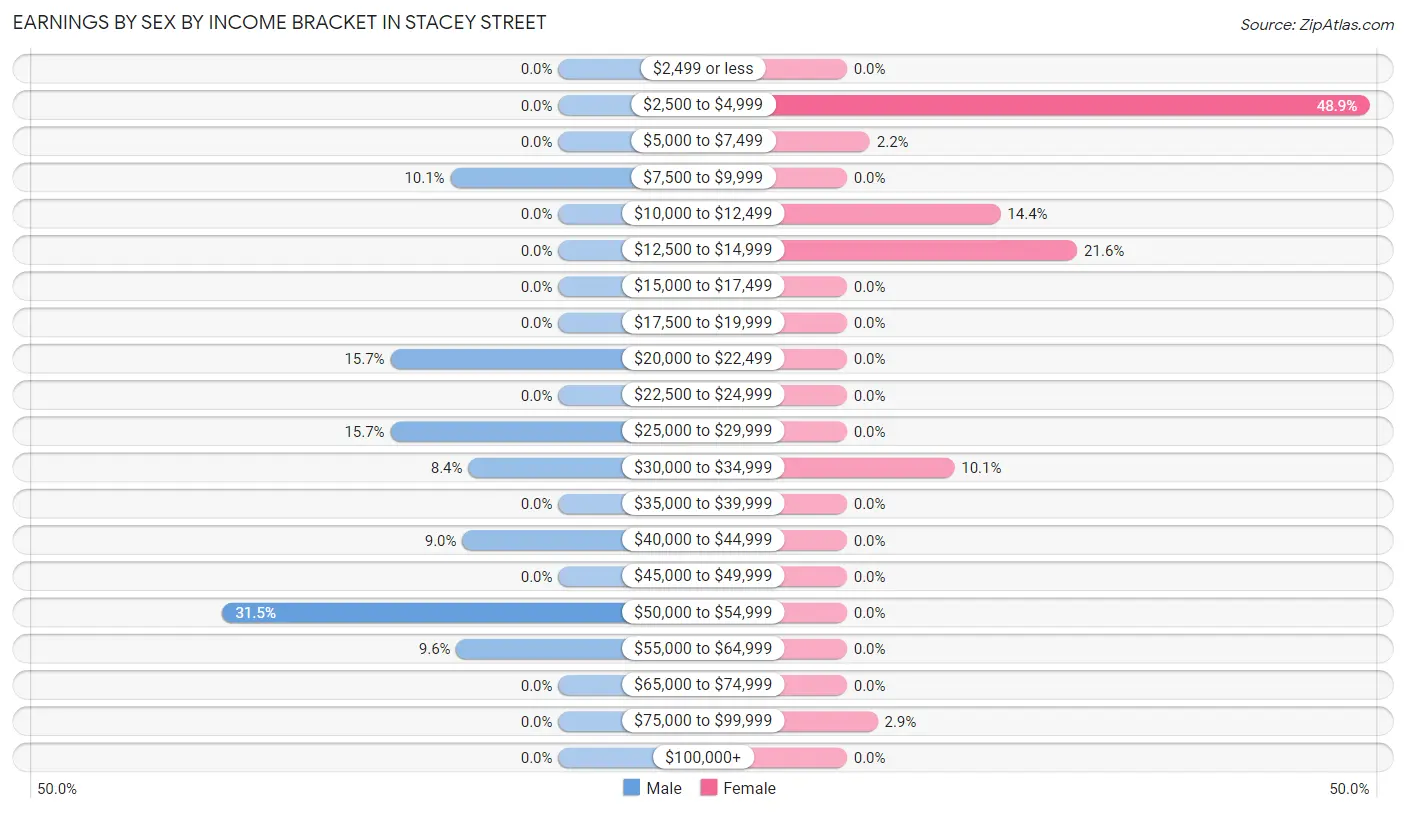
Earnings by Sex by Income Bracket in Stacey Street
The most common earnings brackets in Stacey Street are $50,000 to $54,999 for men (56 | 31.5%) and $2,500 to $4,999 for women (68 | 48.9%).
| Income | Male | Female |
| $2,499 or less | 0 (0.0%) | 0 (0.0%) |
| $2,500 to $4,999 | 0 (0.0%) | 68 (48.9%) |
| $5,000 to $7,499 | 0 (0.0%) | 3 (2.2%) |
| $7,500 to $9,999 | 18 (10.1%) | 0 (0.0%) |
| $10,000 to $12,499 | 0 (0.0%) | 20 (14.4%) |
| $12,500 to $14,999 | 0 (0.0%) | 30 (21.6%) |
| $15,000 to $17,499 | 0 (0.0%) | 0 (0.0%) |
| $17,500 to $19,999 | 0 (0.0%) | 0 (0.0%) |
| $20,000 to $22,499 | 28 (15.7%) | 0 (0.0%) |
| $22,500 to $24,999 | 0 (0.0%) | 0 (0.0%) |
| $25,000 to $29,999 | 28 (15.7%) | 0 (0.0%) |
| $30,000 to $34,999 | 15 (8.4%) | 14 (10.1%) |
| $35,000 to $39,999 | 0 (0.0%) | 0 (0.0%) |
| $40,000 to $44,999 | 16 (9.0%) | 0 (0.0%) |
| $45,000 to $49,999 | 0 (0.0%) | 0 (0.0%) |
| $50,000 to $54,999 | 56 (31.5%) | 0 (0.0%) |
| $55,000 to $64,999 | 17 (9.6%) | 0 (0.0%) |
| $65,000 to $74,999 | 0 (0.0%) | 0 (0.0%) |
| $75,000 to $99,999 | 0 (0.0%) | 4 (2.9%) |
| $100,000+ | 0 (0.0%) | 0 (0.0%) |
| Total | 178 (100.0%) | 139 (100.0%) |
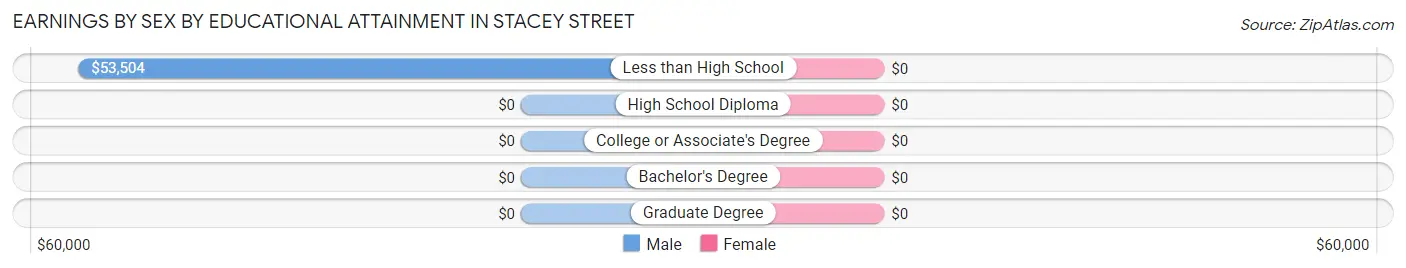
Earnings by Sex by Educational Attainment in Stacey Street
| Educational Attainment | Male Income | Female Income |
| Less than High School | $53,504 | $0 |
| High School Diploma | - | - |
| College or Associate's Degree | - | - |
| Bachelor's Degree | - | - |
| Graduate Degree | - | - |
| Total | $44,688 | $13,542 |
Family Income in Stacey Street
Family Income Brackets in Stacey Street
According to the Stacey Street family income data, there are 78 families falling into the $50,000 to $74,999 income range, which is the most common income bracket and makes up 78.8% of all families.
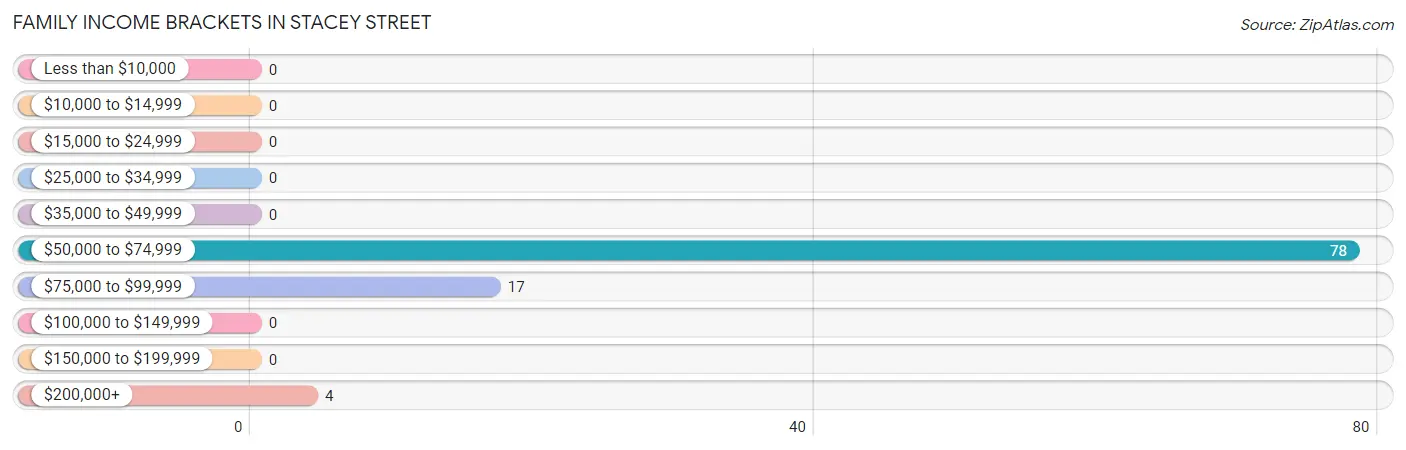
| Income Bracket | # Families | % Families |
| Less than $10,000 | 0 | 0.0% |
| $10,000 to $14,999 | 0 | 0.0% |
| $15,000 to $24,999 | 0 | 0.0% |
| $25,000 to $34,999 | 0 | 0.0% |
| $35,000 to $49,999 | 0 | 0.0% |
| $50,000 to $74,999 | 78 | 78.8% |
| $75,000 to $99,999 | 17 | 17.2% |
| $100,000 to $149,999 | 0 | 0.0% |
| $150,000 to $199,999 | 0 | 0.0% |
| $200,000+ | 4 | 4.0% |
Family Income by Famaliy Size in Stacey Street
3-person families (71 | 71.7%) account for the highest median family income in Stacey Street with $56,675 per family, while 3-person families (71 | 71.7%) have the highest median income of $18,892 per family member.
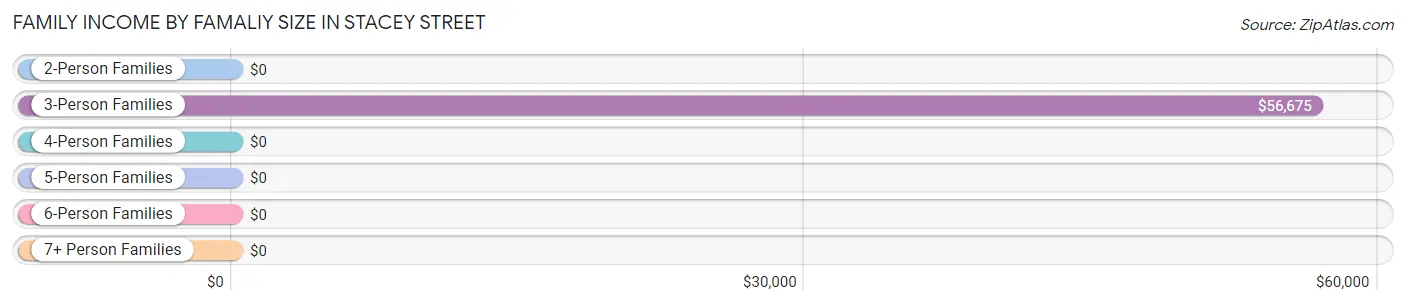
| Income Bracket | # Families | Median Income |
| 2-Person Families | 0 (0.0%) | $0 |
| 3-Person Families | 71 (71.7%) | $56,675 |
| 4-Person Families | 11 (11.1%) | $0 |
| 5-Person Families | 17 (17.2%) | $0 |
| 6-Person Families | 0 (0.0%) | $0 |
| 7+ Person Families | 0 (0.0%) | $0 |
| Total | 99 (100.0%) | $57,335 |
Family Income by Number of Earners in Stacey Street
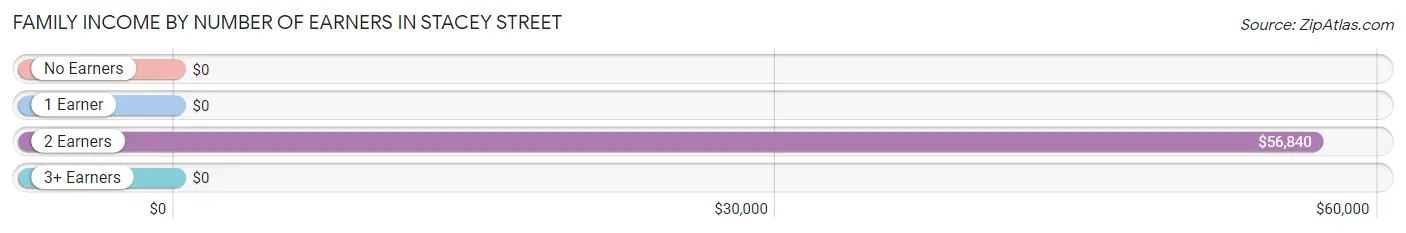
| Number of Earners | # Families | Median Income |
| No Earners | 0 (0.0%) | $0 |
| 1 Earner | 4 (4.0%) | $0 |
| 2 Earners | 78 (78.8%) | $56,840 |
| 3+ Earners | 17 (17.2%) | $0 |
| Total | 99 (100.0%) | $57,335 |
Household Income in Stacey Street
Household Income Brackets in Stacey Street
With 64 households falling in the category, the $50,000 to $74,999 income range is the most frequent in Stacey Street, accounting for 50.4% of all households.
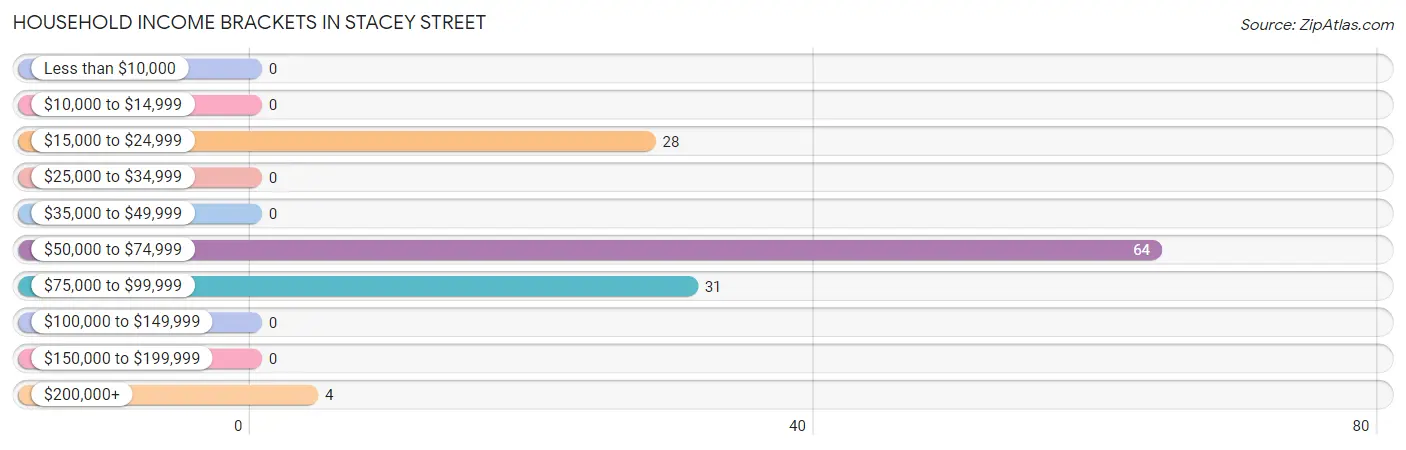
| Income Bracket | # Households | % Households |
| Less than $10,000 | 0 | 0.0% |
| $10,000 to $14,999 | 0 | 0.0% |
| $15,000 to $24,999 | 28 | 22.0% |
| $25,000 to $34,999 | 0 | 0.0% |
| $35,000 to $49,999 | 0 | 0.0% |
| $50,000 to $74,999 | 64 | 50.4% |
| $75,000 to $99,999 | 31 | 24.4% |
| $100,000 to $149,999 | 0 | 0.0% |
| $150,000 to $199,999 | 0 | 0.0% |
| $200,000+ | 4 | 3.1% |
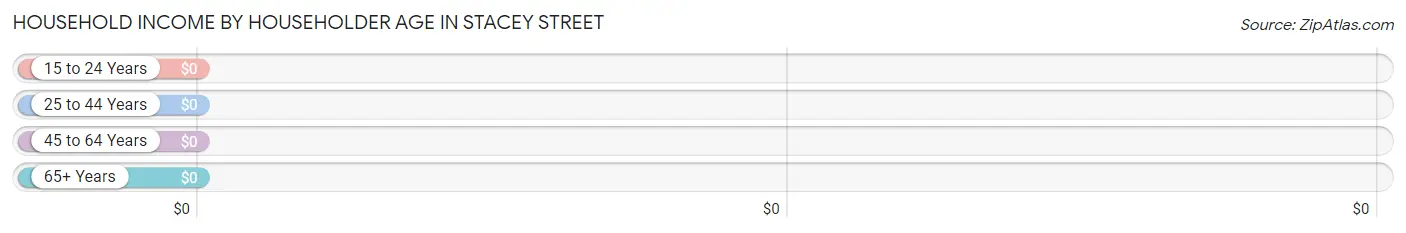
Household Income by Householder Age in Stacey Street
| Income Bracket | # Households | Median Income |
| 15 to 24 Years | 0 (0.0%) | $0 |
| 25 to 44 Years | 42 (33.1%) | $0 |
| 45 to 64 Years | 70 (55.1%) | $0 |
| 65+ Years | 15 (11.8%) | $0 |
| Total | 127 (100.0%) | $56,675 |
Poverty in Stacey Street
Income Below Poverty by Sex and Age in Stacey Street
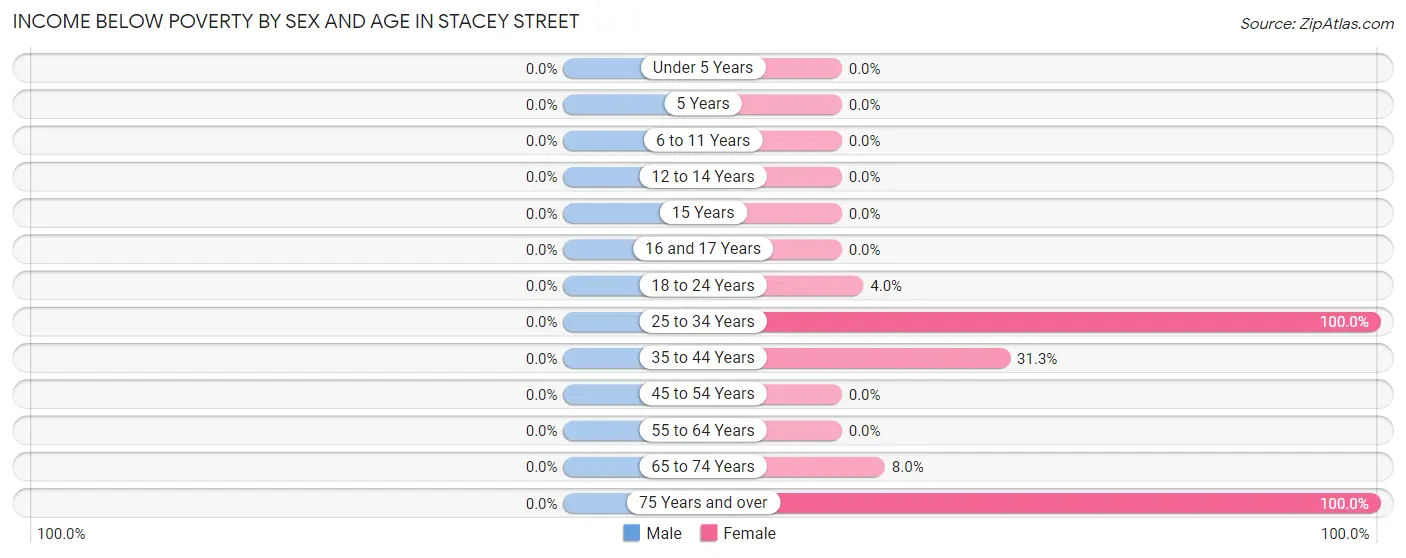
| Age Bracket | Male | Female |
| Under 5 Years | 0 (0.0%) | 0 (0.0%) |
| 5 Years | 0 (0.0%) | 0 (0.0%) |
| 6 to 11 Years | 0 (0.0%) | 0 (0.0%) |
| 12 to 14 Years | 0 (0.0%) | 0 (0.0%) |
| 15 Years | 0 (0.0%) | 0 (0.0%) |
| 16 and 17 Years | 0 (0.0%) | 0 (0.0%) |
| 18 to 24 Years | 0 (0.0%) | 3 (4.0%) |
| 25 to 34 Years | 0 (0.0%) | 53 (100.0%) |
| 35 to 44 Years | 0 (0.0%) | 20 (31.2%) |
| 45 to 54 Years | 0 (0.0%) | 0 (0.0%) |
| 55 to 64 Years | 0 (0.0%) | 0 (0.0%) |
| 65 to 74 Years | 0 (0.0%) | 2 (8.0%) |
| 75 Years and over | 0 (0.0%) | 2 (100.0%) |
| Total | 0 (0.0%) | 80 (26.6%) |
Income Above Poverty by Sex and Age in Stacey Street
According to the poverty statistics in Stacey Street, males aged 16 and 17 years and females aged 5 years are the age groups that are most secure financially, with 100.0% of males and 100.0% of females in these age groups living above the poverty line.
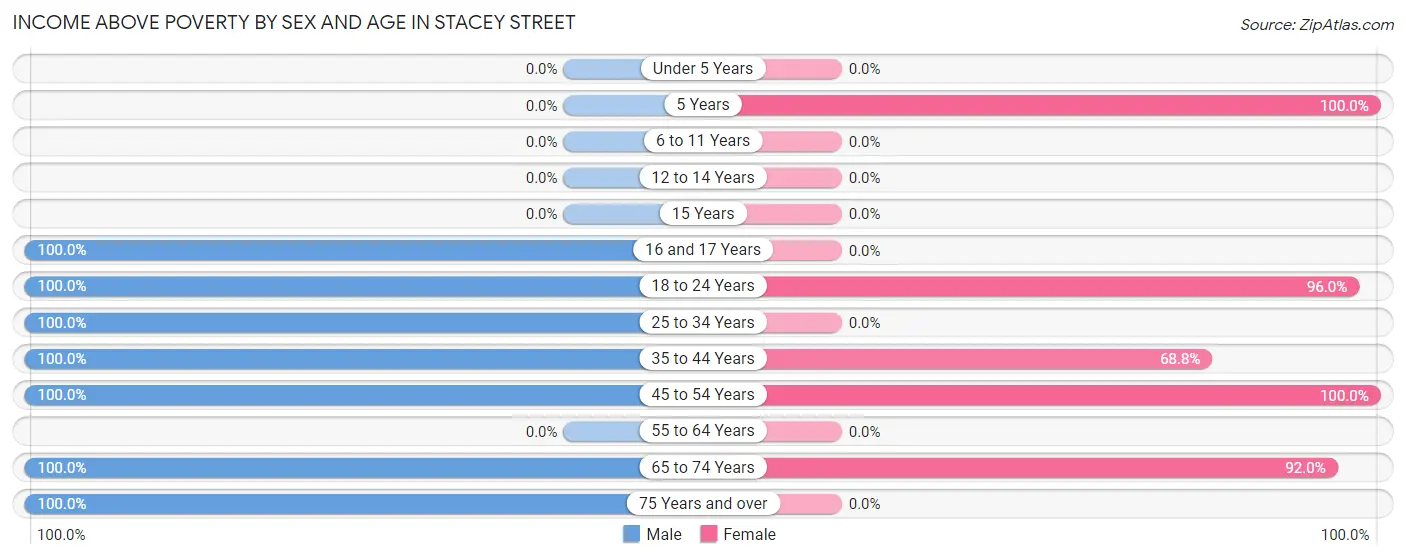
| Age Bracket | Male | Female |
| Under 5 Years | 0 (0.0%) | 0 (0.0%) |
| 5 Years | 0 (0.0%) | 29 (100.0%) |
| 6 to 11 Years | 0 (0.0%) | 0 (0.0%) |
| 12 to 14 Years | 0 (0.0%) | 0 (0.0%) |
| 15 Years | 0 (0.0%) | 0 (0.0%) |
| 16 and 17 Years | 17 (100.0%) | 0 (0.0%) |
| 18 to 24 Years | 46 (100.0%) | 72 (96.0%) |
| 25 to 34 Years | 46 (100.0%) | 0 (0.0%) |
| 35 to 44 Years | 87 (100.0%) | 44 (68.8%) |
| 45 to 54 Years | 17 (100.0%) | 53 (100.0%) |
| 55 to 64 Years | 0 (0.0%) | 0 (0.0%) |
| 65 to 74 Years | 11 (100.0%) | 23 (92.0%) |
| 75 Years and over | 6 (100.0%) | 0 (0.0%) |
| Total | 230 (100.0%) | 221 (73.4%) |
Income Below Poverty Among Married-Couple Families in Stacey Street
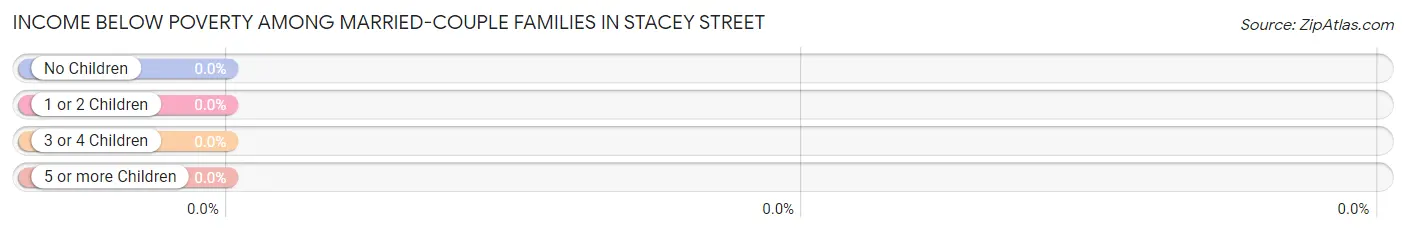
| Children | Above Poverty | Below Poverty |
| No Children | 78 (100.0%) | 0 (0.0%) |
| 1 or 2 Children | 17 (100.0%) | 0 (0.0%) |
| 3 or 4 Children | 0 (0.0%) | 0 (0.0%) |
| 5 or more Children | 0 (0.0%) | 0 (0.0%) |
| Total | 95 (100.0%) | 0 (0.0%) |
Income Below Poverty Among Single-Parent Households in Stacey Street
| Children | Single Father | Single Mother |
| No Children | 0 (0.0%) | 0 (0.0%) |
| 1 or 2 Children | 0 (0.0%) | 0 (0.0%) |
| 3 or 4 Children | 0 (0.0%) | 0 (0.0%) |
| 5 or more Children | 0 (0.0%) | 0 (0.0%) |
| Total | 0 (0.0%) | 0 (0.0%) |
Income Below Poverty Among Married-Couple vs Single-Parent Households in Stacey Street
| Children | Married-Couple Families | Single-Parent Households |
| No Children | 0 (0.0%) | 0 (0.0%) |
| 1 or 2 Children | 0 (0.0%) | 0 (0.0%) |
| 3 or 4 Children | 0 (0.0%) | 0 (0.0%) |
| 5 or more Children | 0 (0.0%) | 0 (0.0%) |
| Total | 0 (0.0%) | 0 (0.0%) |
Race in Stacey Street
The most populous races in Stacey Street are Black / African American (424 | 79.8%), Hispanic or Latino (81 | 15.2%), and Some other Race (81 | 15.2%).
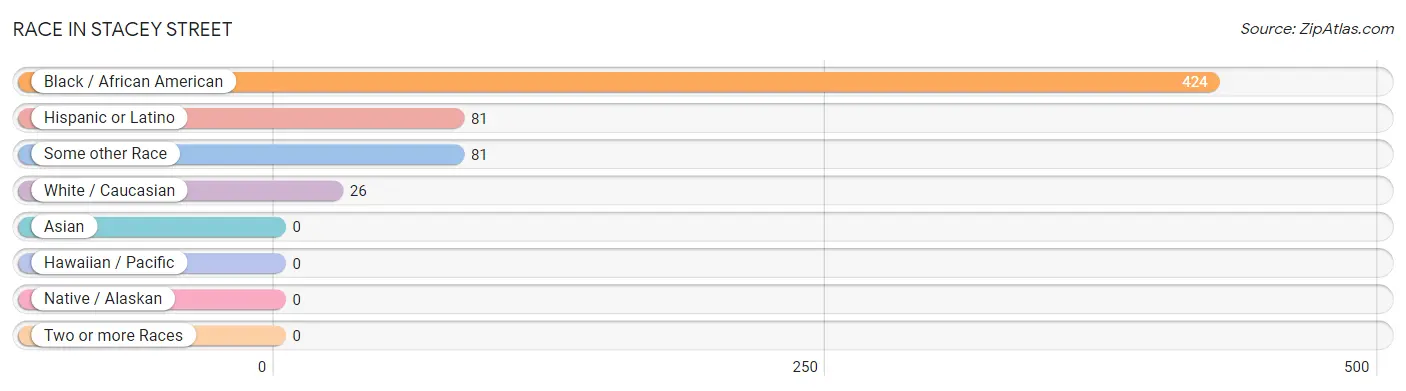
| Race | # Population | % Population |
| Asian | 0 | 0.0% |
| Black / African American | 424 | 79.8% |
| Hawaiian / Pacific | 0 | 0.0% |
| Hispanic or Latino | 81 | 15.2% |
| Native / Alaskan | 0 | 0.0% |
| White / Caucasian | 26 | 4.9% |
| Two or more Races | 0 | 0.0% |
| Some other Race | 81 | 15.2% |
| Total | 531 | 100.0% |
Ancestry in Stacey Street
The most populous ancestries reported in Stacey Street are Haitian (355 | 66.8%), Central American (81 | 15.2%), Guatemalan (81 | 15.2%), Jamaican (52 | 9.8%), and English (16 | 3.0%), together accounting for 110.1% of all Stacey Street residents.
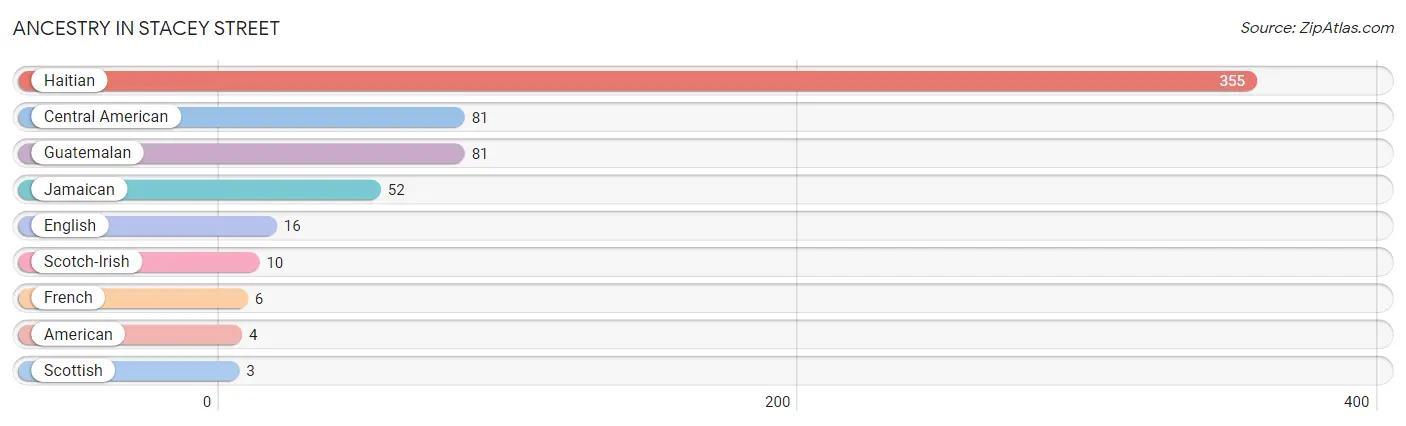
| Ancestry | # Population | % Population |
| American | 4 | 0.7% |
| Central American | 81 | 15.2% |
| English | 16 | 3.0% |
| French | 6 | 1.1% |
| Guatemalan | 81 | 15.2% |
| Haitian | 355 | 66.8% |
| Jamaican | 52 | 9.8% |
| Scotch-Irish | 10 | 1.9% |
| Scottish | 3 | 0.6% | View All 9 Rows |
Immigrants in Stacey Street
The most numerous immigrant groups reported in Stacey Street came from Latin America (320 | 60.3%), Caribbean (239 | 45.0%), Haiti (187 | 35.2%), Central America (81 | 15.2%), and Guatemala (81 | 15.2%), together accounting for 171.0% of all Stacey Street residents.
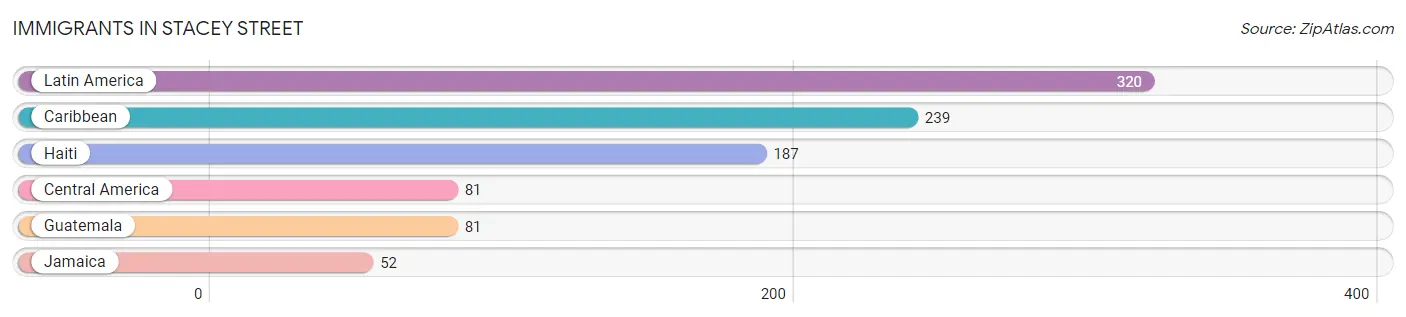
| Immigration Origin | # Population | % Population |
| Caribbean | 239 | 45.0% |
| Central America | 81 | 15.2% |
| Guatemala | 81 | 15.2% |
| Haiti | 187 | 35.2% |
| Jamaica | 52 | 9.8% |
| Latin America | 320 | 60.3% | View All 6 Rows |
Sex and Age in Stacey Street
Sex and Age in Stacey Street
The most populous age groups in Stacey Street are 35 to 39 Years (72 | 31.3%) for men and 15 to 19 Years (68 | 22.6%) for women.
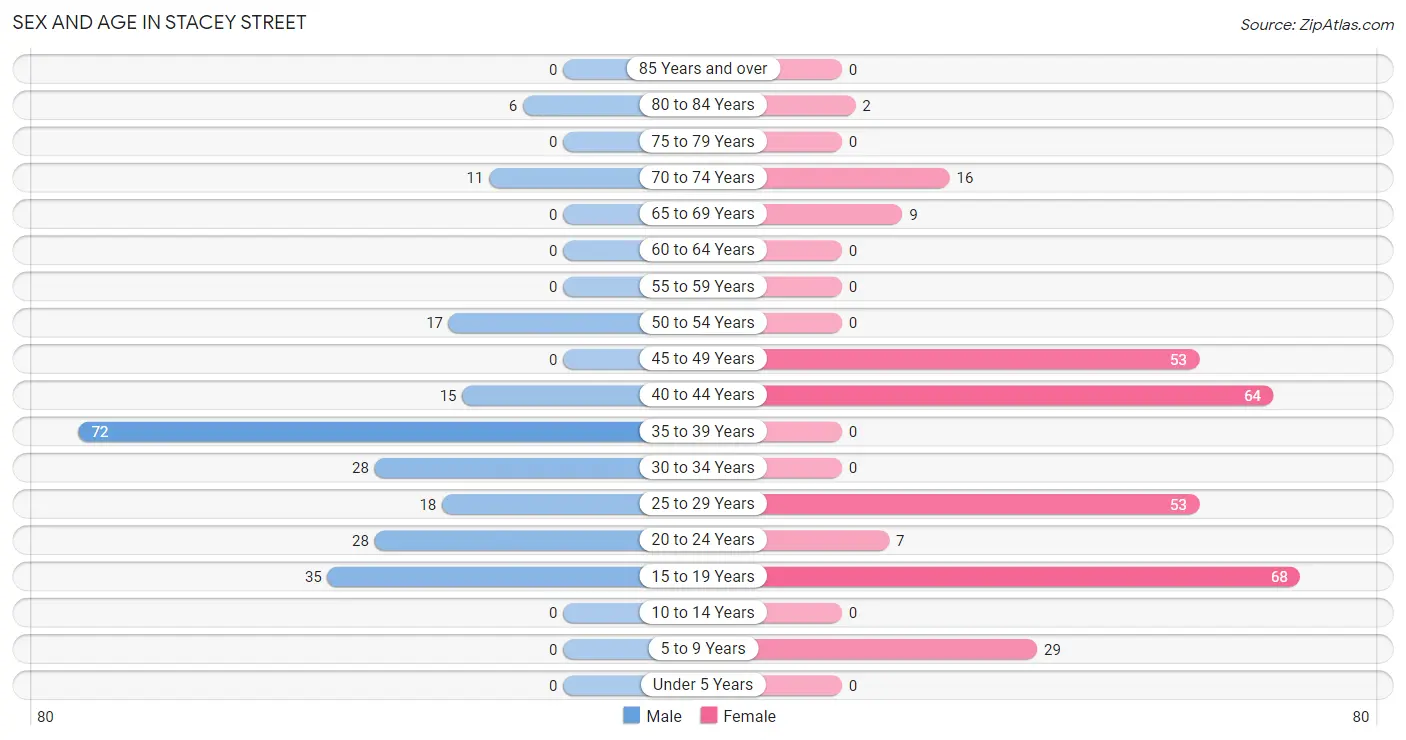
| Age Bracket | Male | Female |
| Under 5 Years | 0 (0.0%) | 0 (0.0%) |
| 5 to 9 Years | 0 (0.0%) | 29 (9.6%) |
| 10 to 14 Years | 0 (0.0%) | 0 (0.0%) |
| 15 to 19 Years | 35 (15.2%) | 68 (22.6%) |
| 20 to 24 Years | 28 (12.2%) | 7 (2.3%) |
| 25 to 29 Years | 18 (7.8%) | 53 (17.6%) |
| 30 to 34 Years | 28 (12.2%) | 0 (0.0%) |
| 35 to 39 Years | 72 (31.3%) | 0 (0.0%) |
| 40 to 44 Years | 15 (6.5%) | 64 (21.3%) |
| 45 to 49 Years | 0 (0.0%) | 53 (17.6%) |
| 50 to 54 Years | 17 (7.4%) | 0 (0.0%) |
| 55 to 59 Years | 0 (0.0%) | 0 (0.0%) |
| 60 to 64 Years | 0 (0.0%) | 0 (0.0%) |
| 65 to 69 Years | 0 (0.0%) | 9 (3.0%) |
| 70 to 74 Years | 11 (4.8%) | 16 (5.3%) |
| 75 to 79 Years | 0 (0.0%) | 0 (0.0%) |
| 80 to 84 Years | 6 (2.6%) | 2 (0.7%) |
| 85 Years and over | 0 (0.0%) | 0 (0.0%) |
| Total | 230 (100.0%) | 301 (100.0%) |
Families and Households in Stacey Street
Median Family Size in Stacey Street
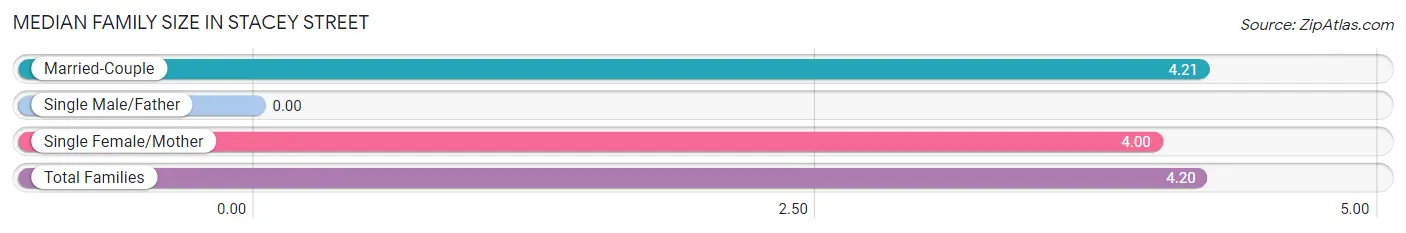
| Family Type | # Families | Family Size |
| Married-Couple | 95 (96.0%) | 4.21 |
| Single Male/Father | 0 (0.0%) | - |
| Single Female/Mother | 4 (4.0%) | 4.00 |
| Total Families | 99 (100.0%) | 4.20 |
Median Household Size in Stacey Street
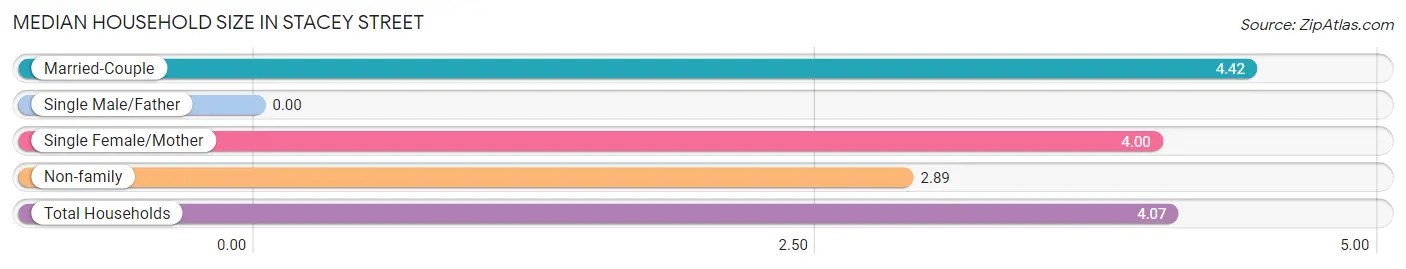
| Household Type | # Households | Household Size |
| Married-Couple | 95 (74.8%) | 4.42 |
| Single Male/Father | 0 (0.0%) | - |
| Single Female/Mother | 4 (3.2%) | 4.00 |
| Non-family | 28 (22.1%) | 2.89 |
| Total Households | 127 (100.0%) | 4.07 |
Household Size by Marriage Status in Stacey Street
Out of a total of 127 households in Stacey Street, 99 (77.9%) are family households, while 28 (22.1%) are nonfamily households. The most numerous type of family households are 3-person households, comprising 57, and the most common type of nonfamily households are 2-person households, comprising 28.
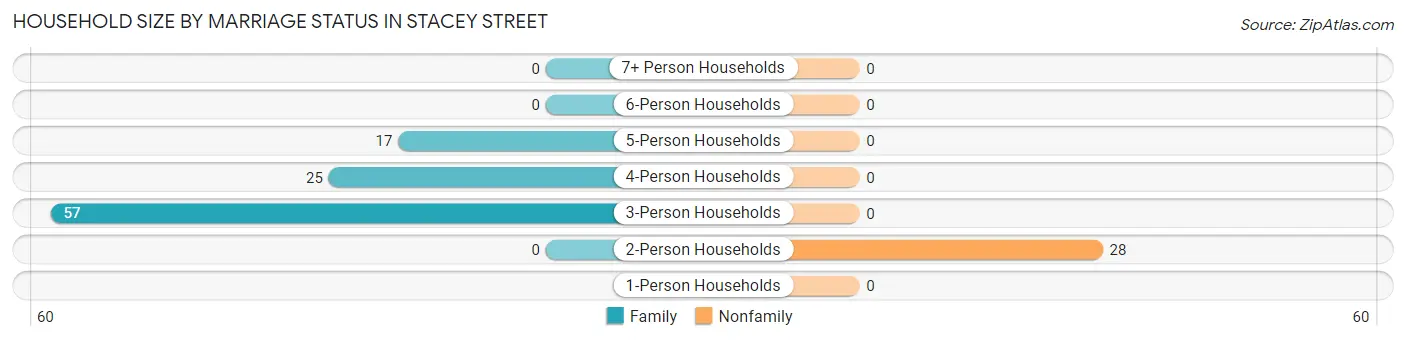
| Household Size | Family Households | Nonfamily Households |
| 1-Person Households | - | 0 (0.0%) |
| 2-Person Households | 0 (0.0%) | 28 (22.1%) |
| 3-Person Households | 57 (44.9%) | 0 (0.0%) |
| 4-Person Households | 25 (19.7%) | 0 (0.0%) |
| 5-Person Households | 17 (13.4%) | 0 (0.0%) |
| 6-Person Households | 0 (0.0%) | 0 (0.0%) |
| 7+ Person Households | 0 (0.0%) | 0 (0.0%) |
| Total | 99 (77.9%) | 28 (22.1%) |
Female Fertility in Stacey Street
Fertility by Age in Stacey Street
| Age Bracket | Women with Births | Births / 1,000 Women |
| 15 to 19 years | 0 (0.0%) | 0.0 |
| 20 to 34 years | 0 (0.0%) | 0.0 |
| 35 to 50 years | 0 (0.0%) | 0.0 |
| Total | 0 (0.0%) | 0.0 |
Fertility by Age by Marriage Status in Stacey Street
| Age Bracket | Married | Unmarried |
| 15 to 19 years | 0 (0.0%) | 0 (0.0%) |
| 20 to 34 years | 0 (0.0%) | 0 (0.0%) |
| 35 to 50 years | 0 (0.0%) | 0 (0.0%) |
| Total | 0 (0.0%) | 0 (0.0%) |
Fertility by Education in Stacey Street
| Educational Attainment | Women with Births | Births / 1,000 Women |
| Less than High School | 0 (0.0%) | 0.0 |
| High School Diploma | 0 (0.0%) | 0.0 |
| College or Associate's Degree | 0 (0.0%) | 0.0 |
| Bachelor's Degree | 0 (0.0%) | 0.0 |
| Graduate Degree | 0 (0.0%) | 0.0 |
| Total | 0 (0.0%) | 0.0 |
Fertility by Education by Marriage Status in Stacey Street
| Educational Attainment | Married | Unmarried |
| Less than High School | 0 (0.0%) | 0 (0.0%) |
| High School Diploma | 0 (0.0%) | 0 (0.0%) |
| College or Associate's Degree | 0 (0.0%) | 0 (0.0%) |
| Bachelor's Degree | 0 (0.0%) | 0 (0.0%) |
| Graduate Degree | 0 (0.0%) | 0 (0.0%) |
| Total | 0 (0.0%) | 0 (0.0%) |
Employment Characteristics in Stacey Street
Employment by Class of Employer in Stacey Street
Among the 283 employed individuals in Stacey Street, private company employees (223 | 78.8%), self-employed (not incorporated) (56 | 19.8%), and local government employees (4 | 1.4%) make up the most common classes of employment.
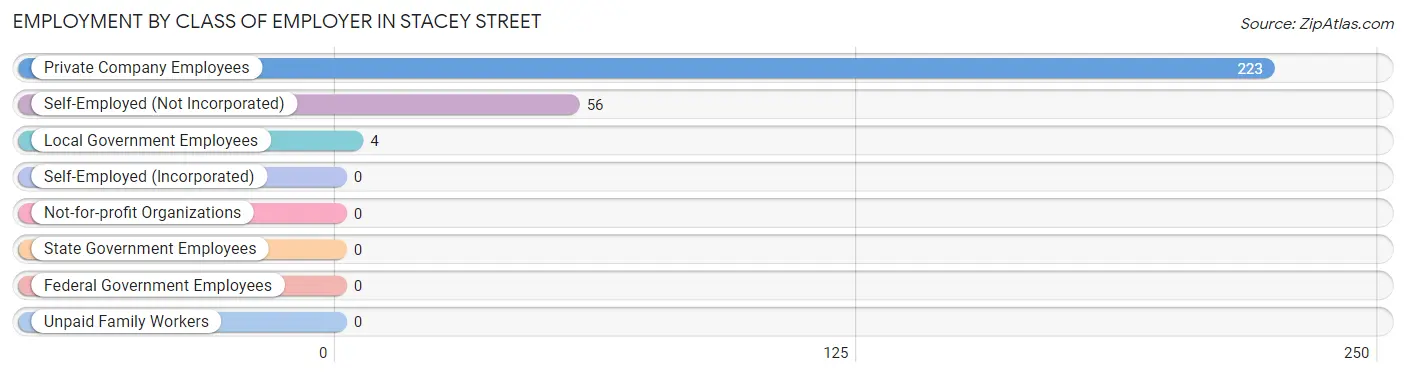
| Employer Class | # Employees | % Employees |
| Private Company Employees | 223 | 78.8% |
| Self-Employed (Incorporated) | 0 | 0.0% |
| Self-Employed (Not Incorporated) | 56 | 19.8% |
| Not-for-profit Organizations | 0 | 0.0% |
| Local Government Employees | 4 | 1.4% |
| State Government Employees | 0 | 0.0% |
| Federal Government Employees | 0 | 0.0% |
| Unpaid Family Workers | 0 | 0.0% |
| Total | 283 | 100.0% |
Employment Status by Age in Stacey Street
According to the labor force statistics for Stacey Street, out of the total population over 16 years of age (502), 80.7% or 405 individuals are in the labor force, with 26.7% or 108 of them unemployed. The age group with the highest labor force participation rate is 16 to 19 years, with 100.0% or 103 individuals in the labor force. Within the labor force, the 45 to 54 years age range has the highest percentage of unemployed individuals, with 75.7% or 53 of them being unemployed.
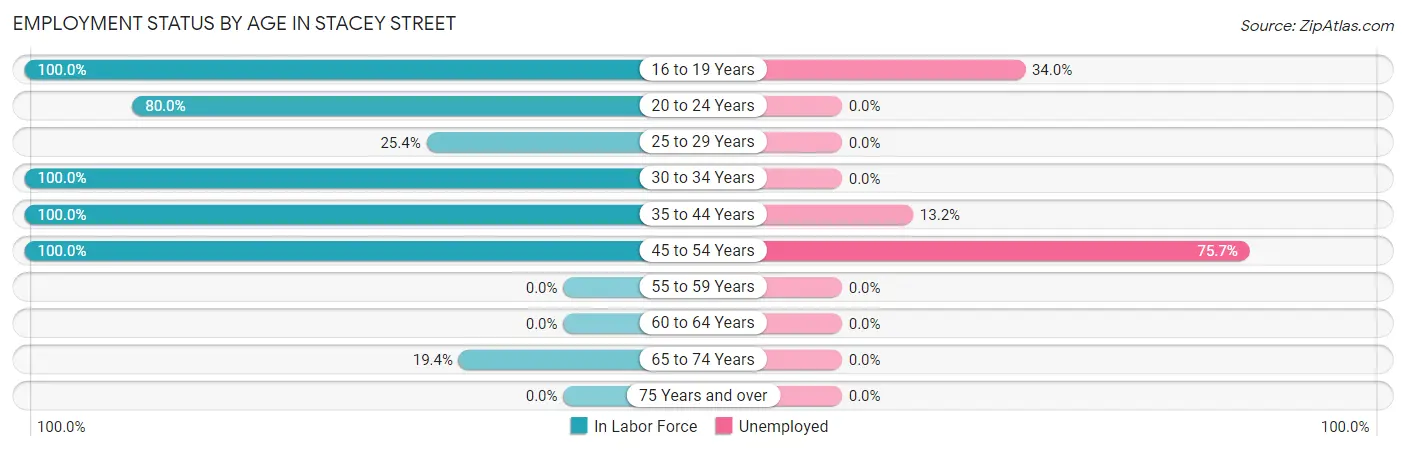
| Age Bracket | In Labor Force | Unemployed |
| 16 to 19 Years | 103 (100.0%) | 35 (34.0%) |
| 20 to 24 Years | 28 (80.0%) | 0 (0.0%) |
| 25 to 29 Years | 18 (25.4%) | 0 (0.0%) |
| 30 to 34 Years | 28 (100.0%) | 0 (0.0%) |
| 35 to 44 Years | 151 (100.0%) | 20 (13.2%) |
| 45 to 54 Years | 70 (100.0%) | 53 (75.7%) |
| 55 to 59 Years | 0 (0.0%) | 0 (0.0%) |
| 60 to 64 Years | 0 (0.0%) | 0 (0.0%) |
| 65 to 74 Years | 7 (19.4%) | 0 (0.0%) |
| 75 Years and over | 0 (0.0%) | 0 (0.0%) |
| Total | 405 (80.7%) | 108 (26.7%) |
Employment Status by Educational Attainment in Stacey Street
According to labor force statistics for Stacey Street, 83.4% of individuals (267) out of the total population between 25 and 64 years of age (320) are in the labor force, with 27.3% or 73 of them being unemployed. The group with the highest labor force participation rate are those with the educational attainment of high school diploma, with 100.0% or 86 individuals in the labor force. Within the labor force, individuals with high school diploma education have the highest percentage of unemployment, with 61.6% or 53 of them being unemployed.
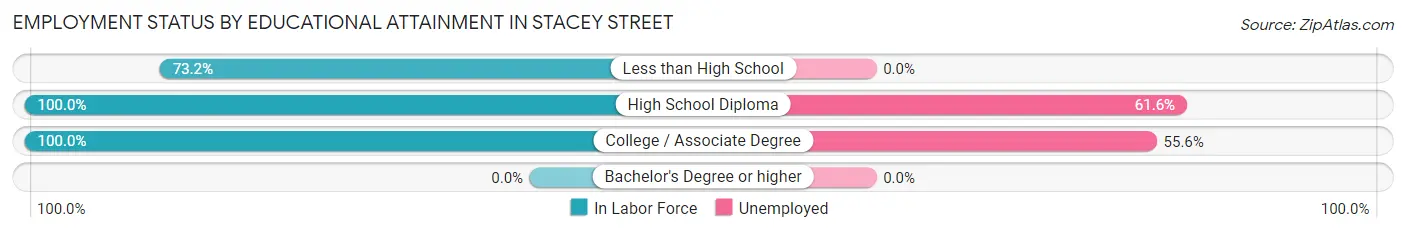
| Educational Attainment | In Labor Force | Unemployed |
| Less than High School | 145 (73.2%) | 0 (0.0%) |
| High School Diploma | 86 (100.0%) | 53 (61.6%) |
| College / Associate Degree | 36 (100.0%) | 20 (55.6%) |
| Bachelor's Degree or higher | 0 (0.0%) | 0 (0.0%) |
| Total | 267 (83.4%) | 87 (27.3%) |
Employment Occupations by Sex in Stacey Street
Management, Business, Science and Arts Occupations
The most common Management, Business, Science and Arts occupations in Stacey Street are Community & Social Service (4 | 1.3%), and Education Instruction & Library (4 | 1.3%).
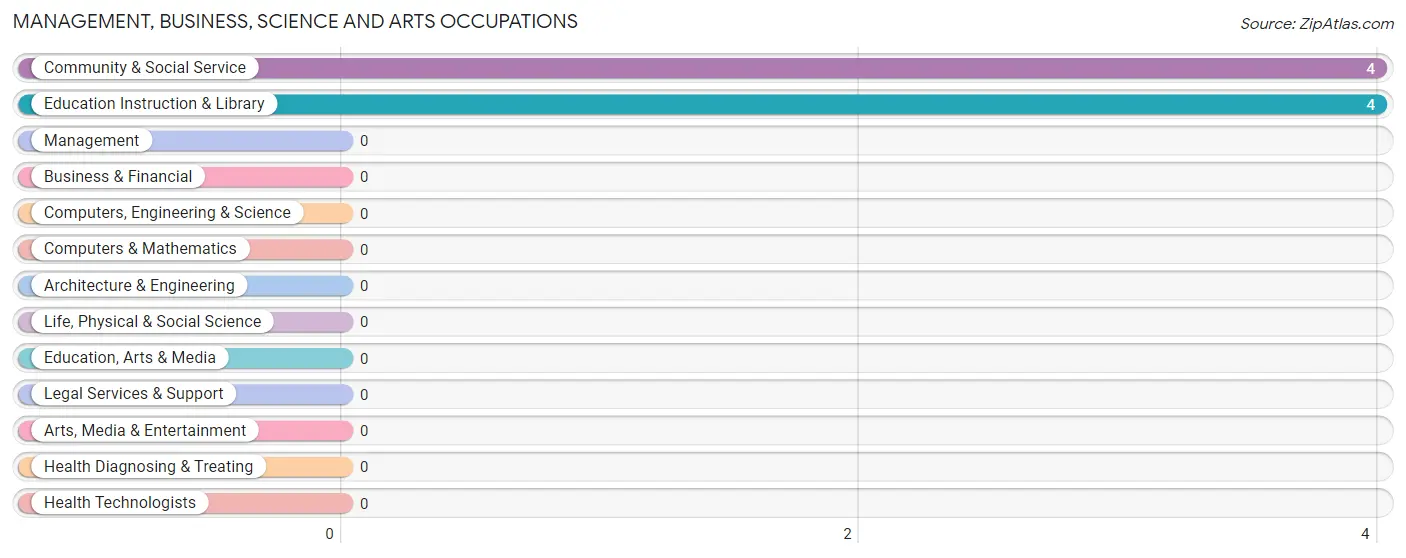
Management, Business, Science and Arts Occupations by Sex
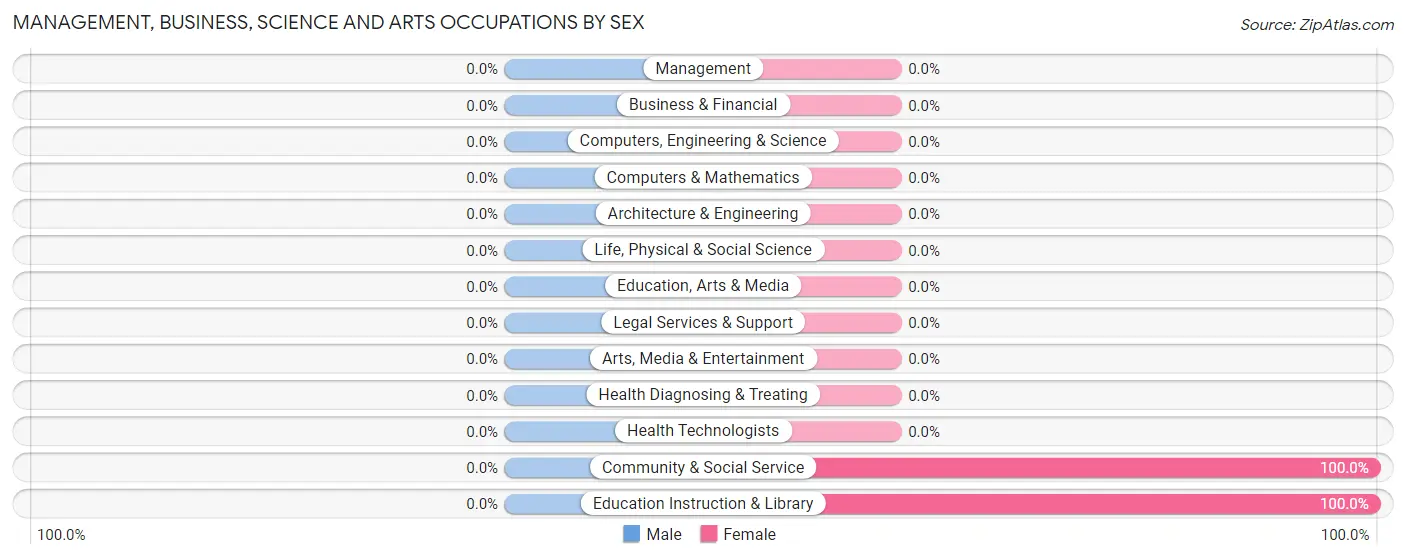
| Occupation | Male | Female |
| Management | 0 (0.0%) | 0 (0.0%) |
| Business & Financial | 0 (0.0%) | 0 (0.0%) |
| Computers, Engineering & Science | 0 (0.0%) | 0 (0.0%) |
| Computers & Mathematics | 0 (0.0%) | 0 (0.0%) |
| Architecture & Engineering | 0 (0.0%) | 0 (0.0%) |
| Life, Physical & Social Science | 0 (0.0%) | 0 (0.0%) |
| Community & Social Service | 0 (0.0%) | 4 (100.0%) |
| Education, Arts & Media | 0 (0.0%) | 0 (0.0%) |
| Legal Services & Support | 0 (0.0%) | 0 (0.0%) |
| Education Instruction & Library | 0 (0.0%) | 4 (100.0%) |
| Arts, Media & Entertainment | 0 (0.0%) | 0 (0.0%) |
| Health Diagnosing & Treating | 0 (0.0%) | 0 (0.0%) |
| Health Technologists | 0 (0.0%) | 0 (0.0%) |
| Total (Category) | 0 (0.0%) | 4 (100.0%) |
| Total (Overall) | 178 (59.9%) | 119 (40.1%) |
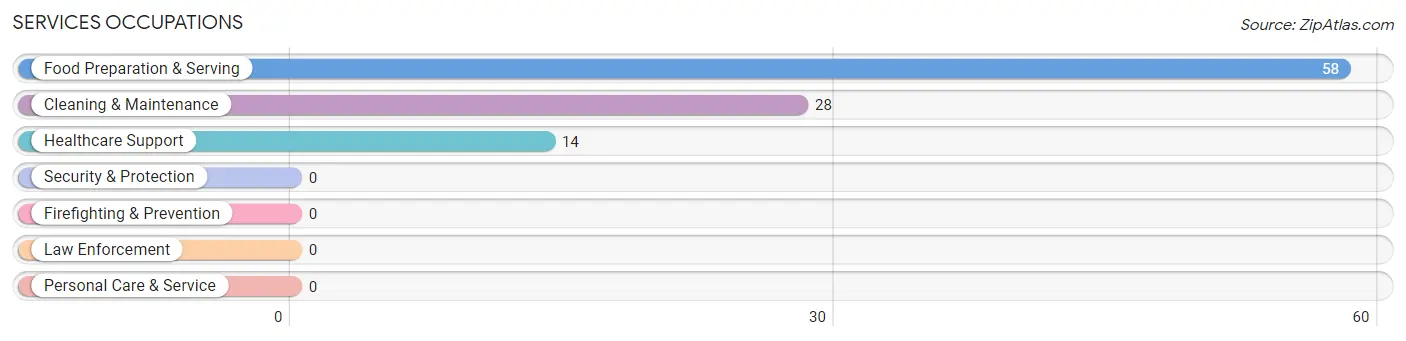
Services Occupations
The most common Services occupations in Stacey Street are Food Preparation & Serving (58 | 19.5%), Cleaning & Maintenance (28 | 9.4%), and Healthcare Support (14 | 4.7%).
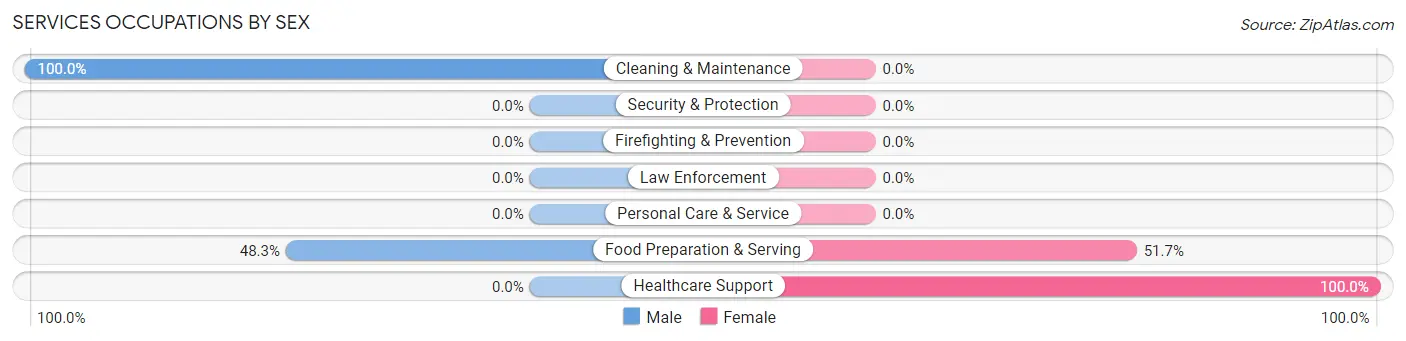
Services Occupations by Sex
Within the Services occupations in Stacey Street, the most male-oriented occupations are Cleaning & Maintenance (100.0%), and Food Preparation & Serving (48.3%), while the most female-oriented occupations are Healthcare Support (100.0%), and Food Preparation & Serving (51.7%).
| Occupation | Male | Female |
| Healthcare Support | 0 (0.0%) | 14 (100.0%) |
| Security & Protection | 0 (0.0%) | 0 (0.0%) |
| Firefighting & Prevention | 0 (0.0%) | 0 (0.0%) |
| Law Enforcement | 0 (0.0%) | 0 (0.0%) |
| Food Preparation & Serving | 28 (48.3%) | 30 (51.7%) |
| Cleaning & Maintenance | 28 (100.0%) | 0 (0.0%) |
| Personal Care & Service | 0 (0.0%) | 0 (0.0%) |
| Total (Category) | 56 (56.0%) | 44 (44.0%) |
| Total (Overall) | 178 (59.9%) | 119 (40.1%) |
Sales and Office Occupations
The most common Sales and Office occupations in Stacey Street are Sales & Related (84 | 28.3%), and Office & Administration (15 | 5.1%).
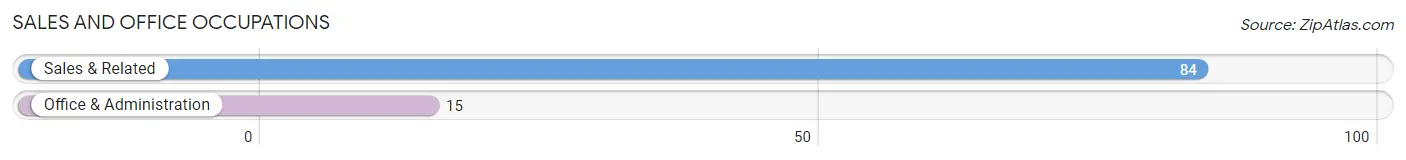
Sales and Office Occupations by Sex

| Occupation | Male | Female |
| Sales & Related | 16 (19.1%) | 68 (80.9%) |
| Office & Administration | 15 (100.0%) | 0 (0.0%) |
| Total (Category) | 31 (31.3%) | 68 (68.7%) |
| Total (Overall) | 178 (59.9%) | 119 (40.1%) |
Natural Resources, Construction and Maintenance Occupations
The most common Natural Resources, Construction and Maintenance occupations in Stacey Street are , and Installation, Maintenance & Repair (56 | 18.9%).
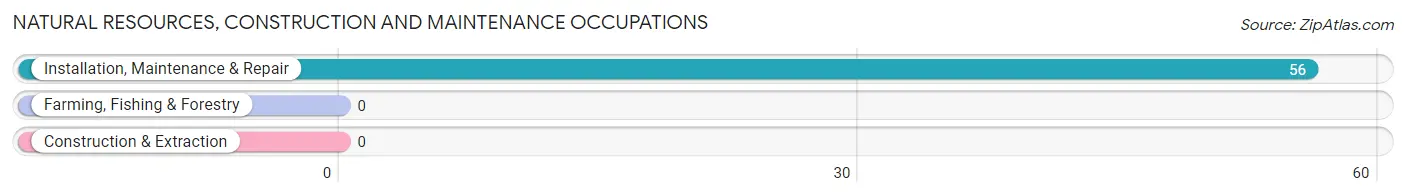
Natural Resources, Construction and Maintenance Occupations by Sex

| Occupation | Male | Female |
| Farming, Fishing & Forestry | 0 (0.0%) | 0 (0.0%) |
| Construction & Extraction | 0 (0.0%) | 0 (0.0%) |
| Installation, Maintenance & Repair | 56 (100.0%) | 0 (0.0%) |
| Total (Category) | 56 (100.0%) | 0 (0.0%) |
| Total (Overall) | 178 (59.9%) | 119 (40.1%) |
Production, Transportation and Moving Occupations
The most common Production, Transportation and Moving occupations in Stacey Street are Material Moving (18 | 6.1%), Transportation (17 | 5.7%), and Production (3 | 1.0%).
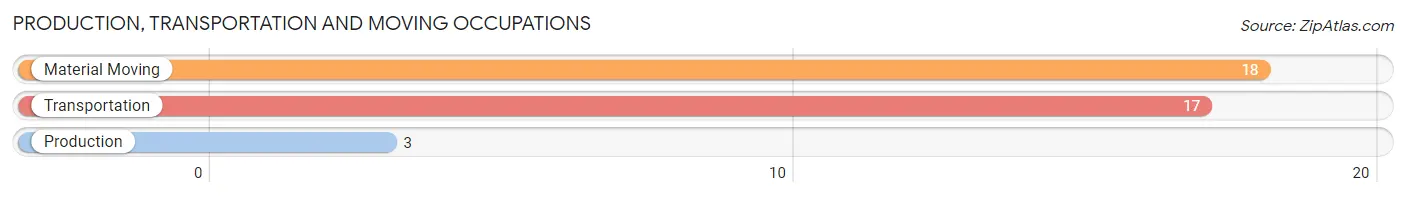
Production, Transportation and Moving Occupations by Sex
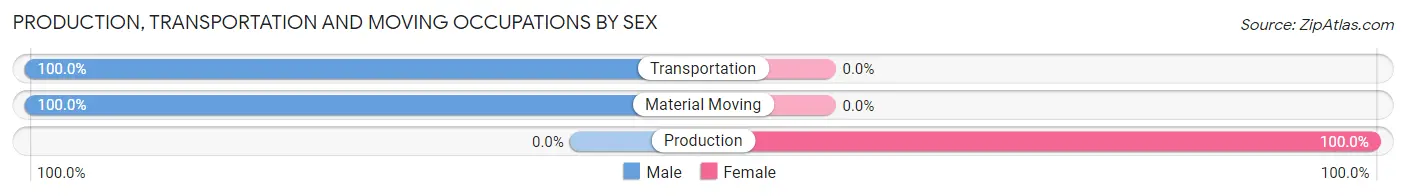
| Occupation | Male | Female |
| Production | 0 (0.0%) | 3 (100.0%) |
| Transportation | 17 (100.0%) | 0 (0.0%) |
| Material Moving | 18 (100.0%) | 0 (0.0%) |
| Total (Category) | 35 (92.1%) | 3 (7.9%) |
| Total (Overall) | 178 (59.9%) | 119 (40.1%) |
Employment Industries by Sex in Stacey Street
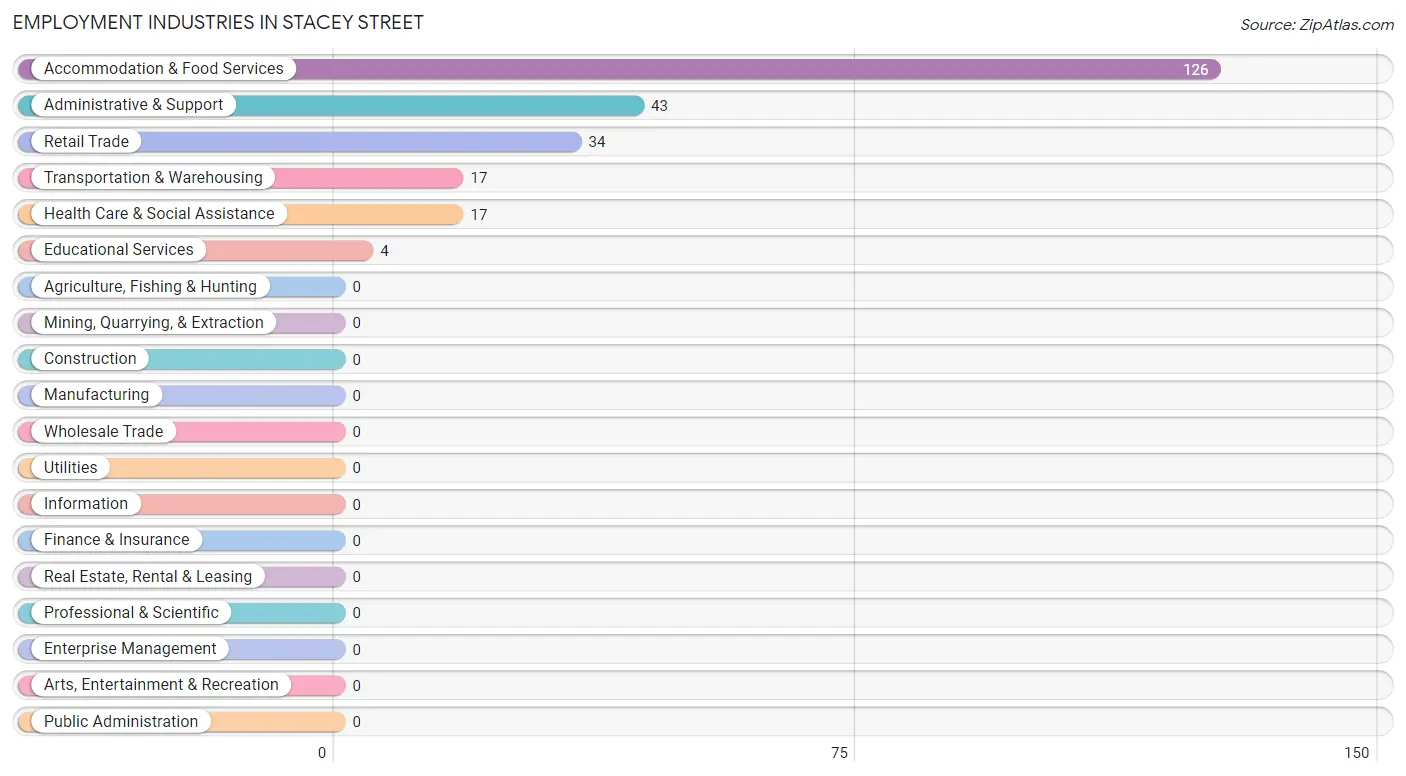
Employment Industries in Stacey Street
The major employment industries in Stacey Street include Accommodation & Food Services (126 | 42.4%), Administrative & Support (43 | 14.5%), Retail Trade (34 | 11.5%), Transportation & Warehousing (17 | 5.7%), and Health Care & Social Assistance (17 | 5.7%).
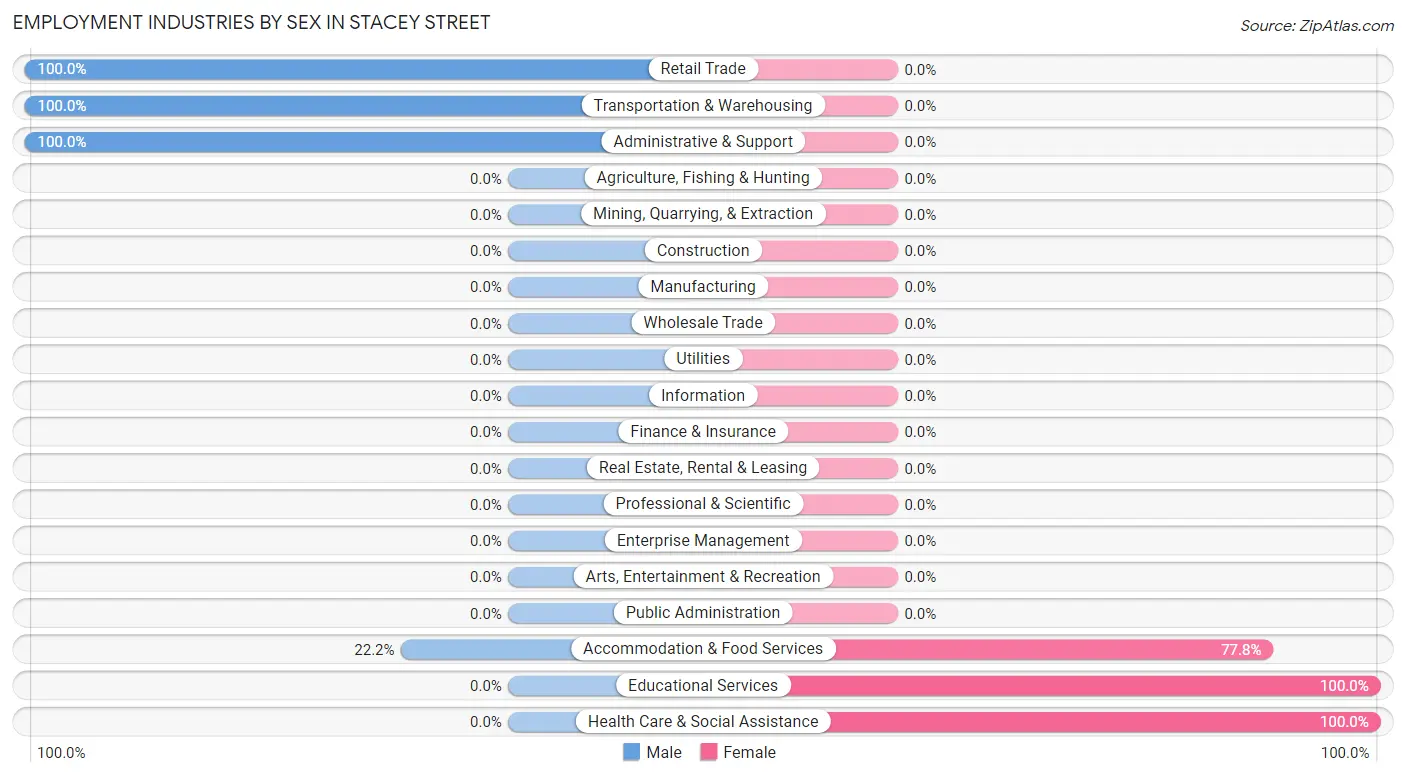
Employment Industries by Sex in Stacey Street
The Stacey Street industries that see more men than women are Retail Trade (100.0%), Transportation & Warehousing (100.0%), and Administrative & Support (100.0%), whereas the industries that tend to have a higher number of women are Educational Services (100.0%), Health Care & Social Assistance (100.0%), and Accommodation & Food Services (77.8%).
| Industry | Male | Female |
| Agriculture, Fishing & Hunting | 0 (0.0%) | 0 (0.0%) |
| Mining, Quarrying, & Extraction | 0 (0.0%) | 0 (0.0%) |
| Construction | 0 (0.0%) | 0 (0.0%) |
| Manufacturing | 0 (0.0%) | 0 (0.0%) |
| Wholesale Trade | 0 (0.0%) | 0 (0.0%) |
| Retail Trade | 34 (100.0%) | 0 (0.0%) |
| Transportation & Warehousing | 17 (100.0%) | 0 (0.0%) |
| Utilities | 0 (0.0%) | 0 (0.0%) |
| Information | 0 (0.0%) | 0 (0.0%) |
| Finance & Insurance | 0 (0.0%) | 0 (0.0%) |
| Real Estate, Rental & Leasing | 0 (0.0%) | 0 (0.0%) |
| Professional & Scientific | 0 (0.0%) | 0 (0.0%) |
| Enterprise Management | 0 (0.0%) | 0 (0.0%) |
| Administrative & Support | 43 (100.0%) | 0 (0.0%) |
| Educational Services | 0 (0.0%) | 4 (100.0%) |
| Health Care & Social Assistance | 0 (0.0%) | 17 (100.0%) |
| Arts, Entertainment & Recreation | 0 (0.0%) | 0 (0.0%) |
| Accommodation & Food Services | 28 (22.2%) | 98 (77.8%) |
| Public Administration | 0 (0.0%) | 0 (0.0%) |
| Total | 178 (59.9%) | 119 (40.1%) |
Education in Stacey Street
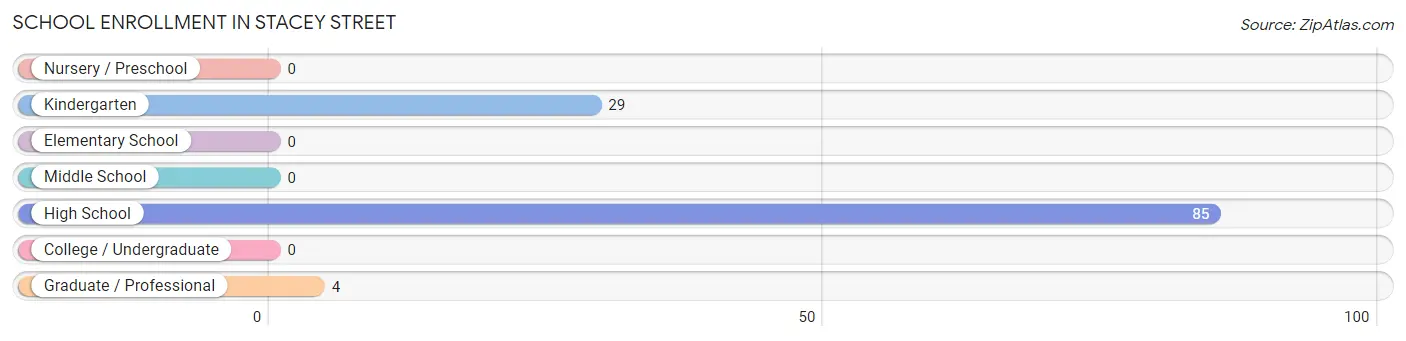
School Enrollment in Stacey Street
The most common levels of schooling among the 118 students in Stacey Street are high school (85 | 72.0%), kindergarten (29 | 24.6%), and graduate / professional (4 | 3.4%).
| School Level | # Students | % Students |
| Nursery / Preschool | 0 | 0.0% |
| Kindergarten | 29 | 24.6% |
| Elementary School | 0 | 0.0% |
| Middle School | 0 | 0.0% |
| High School | 85 | 72.0% |
| College / Undergraduate | 0 | 0.0% |
| Graduate / Professional | 4 | 3.4% |
| Total | 118 | 100.0% |
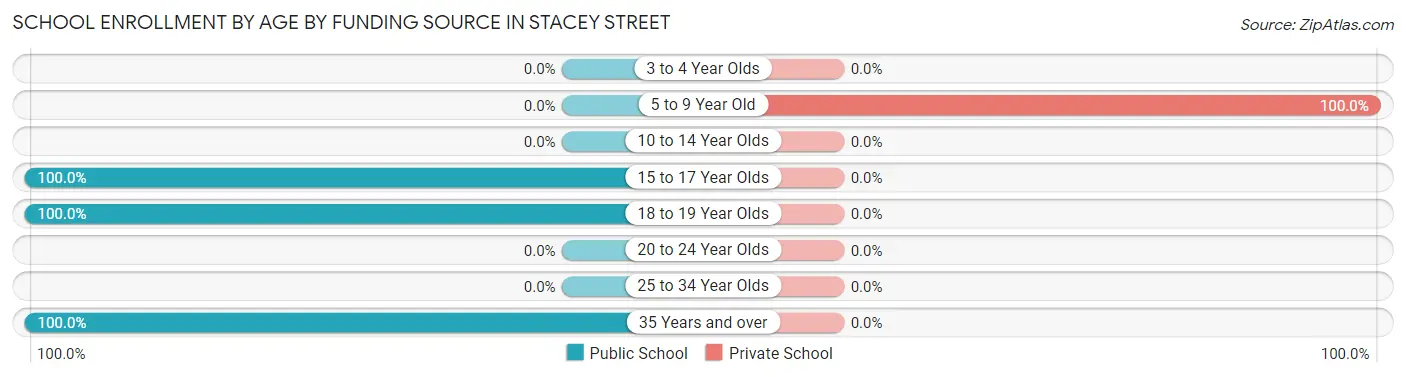
School Enrollment by Age by Funding Source in Stacey Street
Out of a total of 118 students who are enrolled in schools in Stacey Street, 29 (24.6%) attend a private institution, while the remaining 89 (75.4%) are enrolled in public schools. The age group of 5 to 9 year old has the highest likelihood of being enrolled in private schools, with 29 (100.0% in the age bracket) enrolled. Conversely, the age group of 15 to 17 year olds has the lowest likelihood of being enrolled in a private school, with 17 (100.0% in the age bracket) attending a public institution.
| Age Bracket | Public School | Private School |
| 3 to 4 Year Olds | 0 (0.0%) | 0 (0.0%) |
| 5 to 9 Year Old | 0 (0.0%) | 29 (100.0%) |
| 10 to 14 Year Olds | 0 (0.0%) | 0 (0.0%) |
| 15 to 17 Year Olds | 17 (100.0%) | 0 (0.0%) |
| 18 to 19 Year Olds | 68 (100.0%) | 0 (0.0%) |
| 20 to 24 Year Olds | 0 (0.0%) | 0 (0.0%) |
| 25 to 34 Year Olds | 0 (0.0%) | 0 (0.0%) |
| 35 Years and over | 4 (100.0%) | 0 (0.0%) |
| Total | 89 (75.4%) | 29 (24.6%) |
Educational Attainment by Field of Study in Stacey Street
Education (12 | 66.7%), and business (6 | 33.3%) are the most common fields of study among 18 individuals in Stacey Street who have obtained a bachelor's degree or higher.
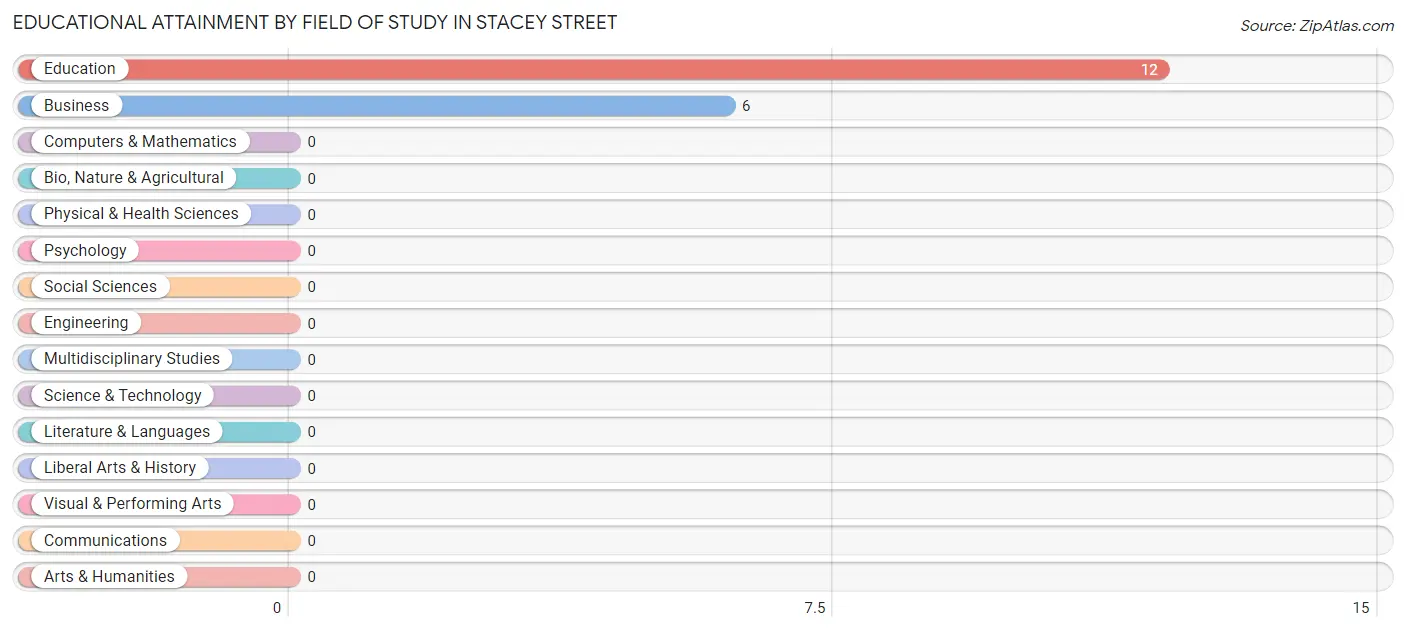
| Field of Study | # Graduates | % Graduates |
| Computers & Mathematics | 0 | 0.0% |
| Bio, Nature & Agricultural | 0 | 0.0% |
| Physical & Health Sciences | 0 | 0.0% |
| Psychology | 0 | 0.0% |
| Social Sciences | 0 | 0.0% |
| Engineering | 0 | 0.0% |
| Multidisciplinary Studies | 0 | 0.0% |
| Science & Technology | 0 | 0.0% |
| Business | 6 | 33.3% |
| Education | 12 | 66.7% |
| Literature & Languages | 0 | 0.0% |
| Liberal Arts & History | 0 | 0.0% |
| Visual & Performing Arts | 0 | 0.0% |
| Communications | 0 | 0.0% |
| Arts & Humanities | 0 | 0.0% |
| Total | 18 | 100.0% |
Transportation & Commute in Stacey Street
Vehicle Availability by Sex in Stacey Street
The most prevalent vehicle ownership categories in Stacey Street are males with 1 vehicle (133, accounting for 74.7%) and females with 1 vehicle (68, making up 130.4%).
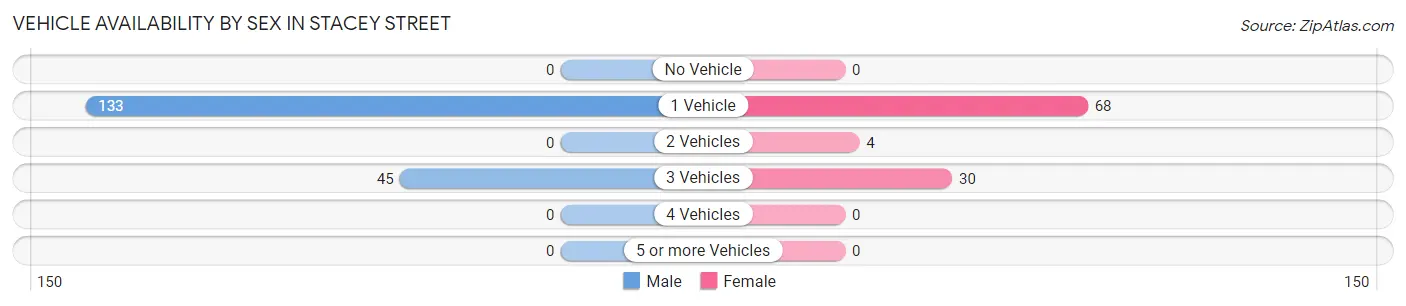
| Vehicles Available | Male | Female |
| No Vehicle | 0 (0.0%) | 0 (0.0%) |
| 1 Vehicle | 133 (74.7%) | 68 (66.7%) |
| 2 Vehicles | 0 (0.0%) | 4 (3.9%) |
| 3 Vehicles | 45 (25.3%) | 30 (29.4%) |
| 4 Vehicles | 0 (0.0%) | 0 (0.0%) |
| 5 or more Vehicles | 0 (0.0%) | 0 (0.0%) |
| Total | 178 (100.0%) | 102 (100.0%) |
Commute Time in Stacey Street
The most frequently occuring commute durations in Stacey Street are 10 to 14 minutes (113 commuters, 39.9%), 60 to 89 minutes (56 commuters, 19.8%), and 45 to 59 minutes (34 commuters, 12.0%).
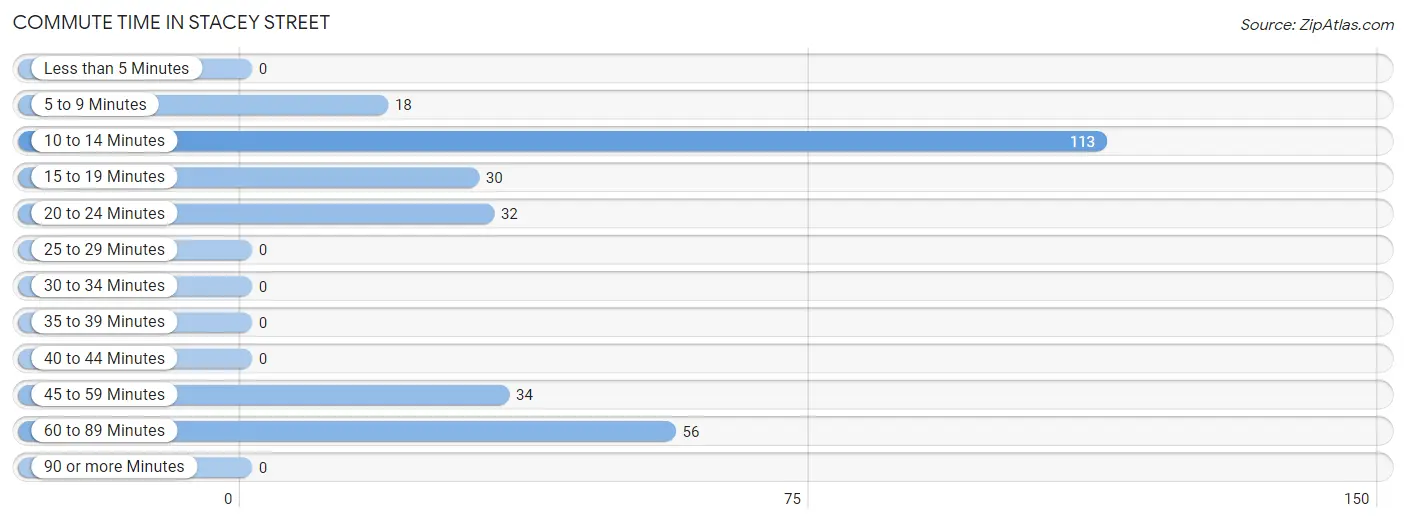
| Commute Time | # Commuters | % Commuters |
| Less than 5 Minutes | 0 | 0.0% |
| 5 to 9 Minutes | 18 | 6.4% |
| 10 to 14 Minutes | 113 | 39.9% |
| 15 to 19 Minutes | 30 | 10.6% |
| 20 to 24 Minutes | 32 | 11.3% |
| 25 to 29 Minutes | 0 | 0.0% |
| 30 to 34 Minutes | 0 | 0.0% |
| 35 to 39 Minutes | 0 | 0.0% |
| 40 to 44 Minutes | 0 | 0.0% |
| 45 to 59 Minutes | 34 | 12.0% |
| 60 to 89 Minutes | 56 | 19.8% |
| 90 or more Minutes | 0 | 0.0% |
Commute Time by Sex in Stacey Street
The most common commute times in Stacey Street are 60 to 89 minutes (56 commuters, 31.5%) for males and 10 to 14 minutes (68 commuters, 64.8%) for females.
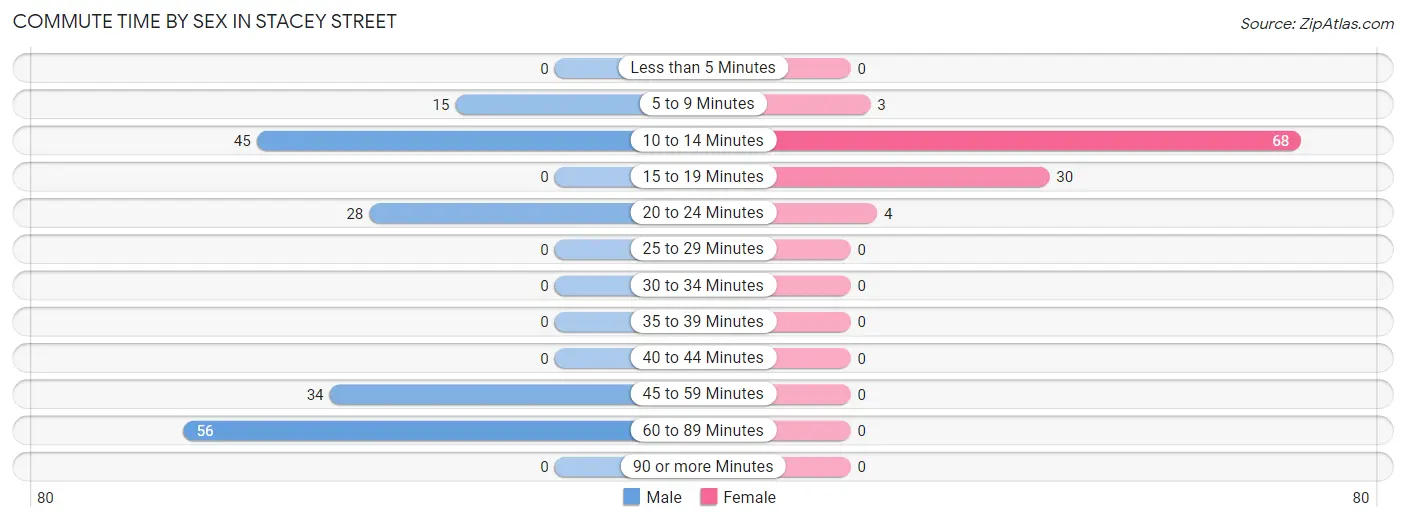
| Commute Time | Male | Female |
| Less than 5 Minutes | 0 (0.0%) | 0 (0.0%) |
| 5 to 9 Minutes | 15 (8.4%) | 3 (2.9%) |
| 10 to 14 Minutes | 45 (25.3%) | 68 (64.8%) |
| 15 to 19 Minutes | 0 (0.0%) | 30 (28.6%) |
| 20 to 24 Minutes | 28 (15.7%) | 4 (3.8%) |
| 25 to 29 Minutes | 0 (0.0%) | 0 (0.0%) |
| 30 to 34 Minutes | 0 (0.0%) | 0 (0.0%) |
| 35 to 39 Minutes | 0 (0.0%) | 0 (0.0%) |
| 40 to 44 Minutes | 0 (0.0%) | 0 (0.0%) |
| 45 to 59 Minutes | 34 (19.1%) | 0 (0.0%) |
| 60 to 89 Minutes | 56 (31.5%) | 0 (0.0%) |
| 90 or more Minutes | 0 (0.0%) | 0 (0.0%) |
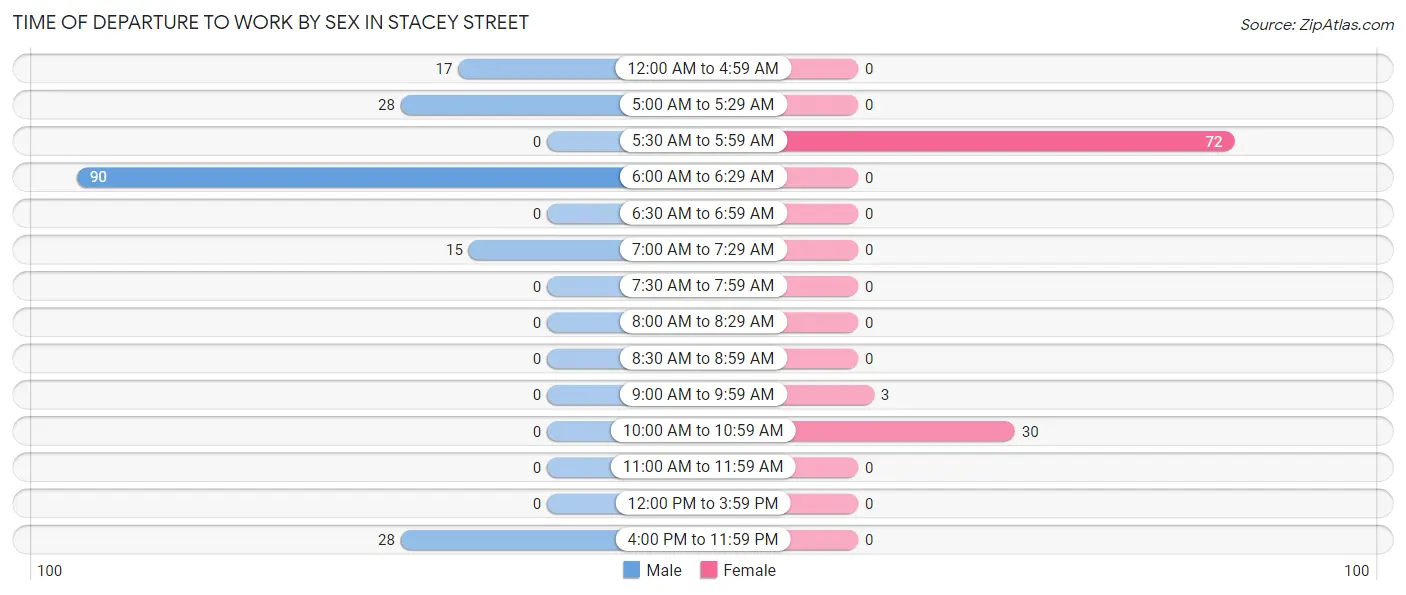
Time of Departure to Work by Sex in Stacey Street
The most frequent times of departure to work in Stacey Street are 6:00 AM to 6:29 AM (90, 50.6%) for males and 5:30 AM to 5:59 AM (72, 68.6%) for females.
| Time of Departure | Male | Female |
| 12:00 AM to 4:59 AM | 17 (9.6%) | 0 (0.0%) |
| 5:00 AM to 5:29 AM | 28 (15.7%) | 0 (0.0%) |
| 5:30 AM to 5:59 AM | 0 (0.0%) | 72 (68.6%) |
| 6:00 AM to 6:29 AM | 90 (50.6%) | 0 (0.0%) |
| 6:30 AM to 6:59 AM | 0 (0.0%) | 0 (0.0%) |
| 7:00 AM to 7:29 AM | 15 (8.4%) | 0 (0.0%) |
| 7:30 AM to 7:59 AM | 0 (0.0%) | 0 (0.0%) |
| 8:00 AM to 8:29 AM | 0 (0.0%) | 0 (0.0%) |
| 8:30 AM to 8:59 AM | 0 (0.0%) | 0 (0.0%) |
| 9:00 AM to 9:59 AM | 0 (0.0%) | 3 (2.9%) |
| 10:00 AM to 10:59 AM | 0 (0.0%) | 30 (28.6%) |
| 11:00 AM to 11:59 AM | 0 (0.0%) | 0 (0.0%) |
| 12:00 PM to 3:59 PM | 0 (0.0%) | 0 (0.0%) |
| 4:00 PM to 11:59 PM | 28 (15.7%) | 0 (0.0%) |
| Total | 178 (100.0%) | 105 (100.0%) |
Housing Occupancy in Stacey Street
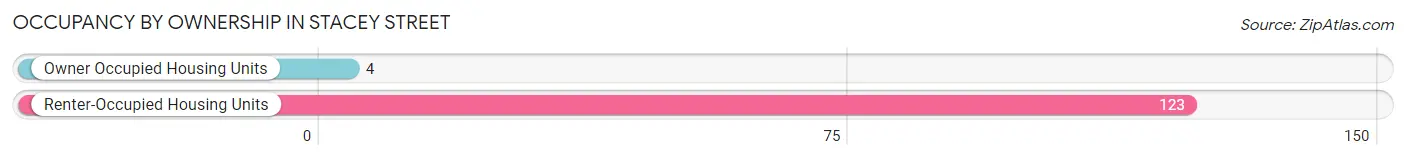
Occupancy by Ownership in Stacey Street
Of the total 127 dwellings in Stacey Street, owner-occupied units account for 4 (3.2%), while renter-occupied units make up 123 (96.9%).
| Occupancy | # Housing Units | % Housing Units |
| Owner Occupied Housing Units | 4 | 3.2% |
| Renter-Occupied Housing Units | 123 | 96.9% |
| Total Occupied Housing Units | 127 | 100.0% |
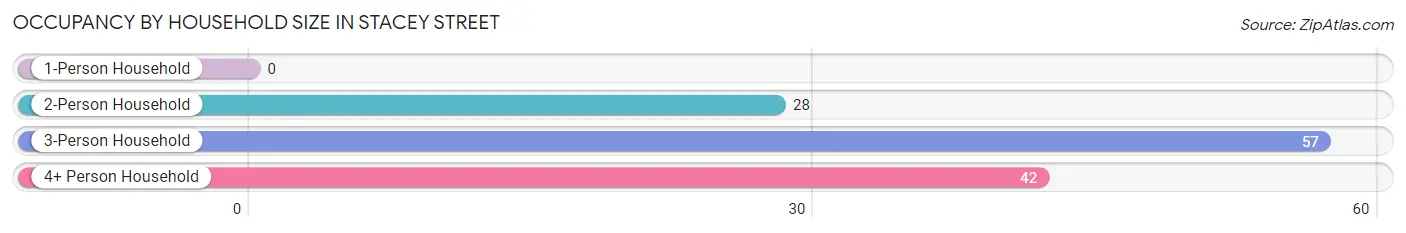
Occupancy by Household Size in Stacey Street
| Household Size | # Housing Units | % Housing Units |
| 1-Person Household | 0 | 0.0% |
| 2-Person Household | 28 | 22.1% |
| 3-Person Household | 57 | 44.9% |
| 4+ Person Household | 42 | 33.1% |
| Total Housing Units | 127 | 100.0% |
Occupancy by Ownership by Household Size in Stacey Street
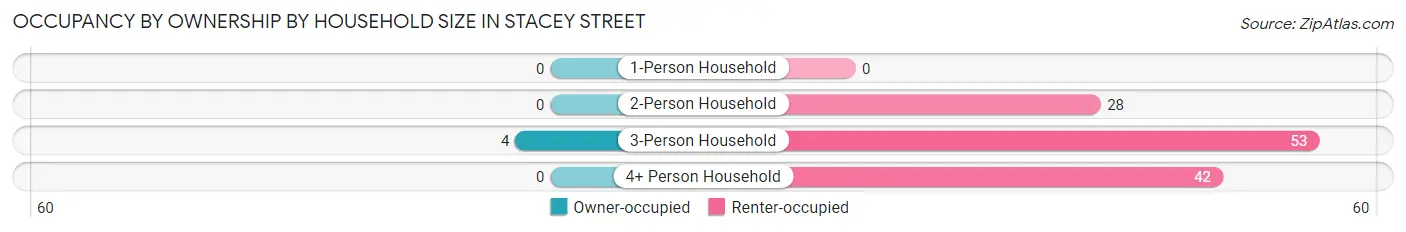
| Household Size | Owner-occupied | Renter-occupied |
| 1-Person Household | 0 (0.0%) | 0 (0.0%) |
| 2-Person Household | 0 (0.0%) | 28 (100.0%) |
| 3-Person Household | 4 (7.0%) | 53 (93.0%) |
| 4+ Person Household | 0 (0.0%) | 42 (100.0%) |
| Total Housing Units | 4 (3.2%) | 123 (96.9%) |
Occupancy by Educational Attainment in Stacey Street
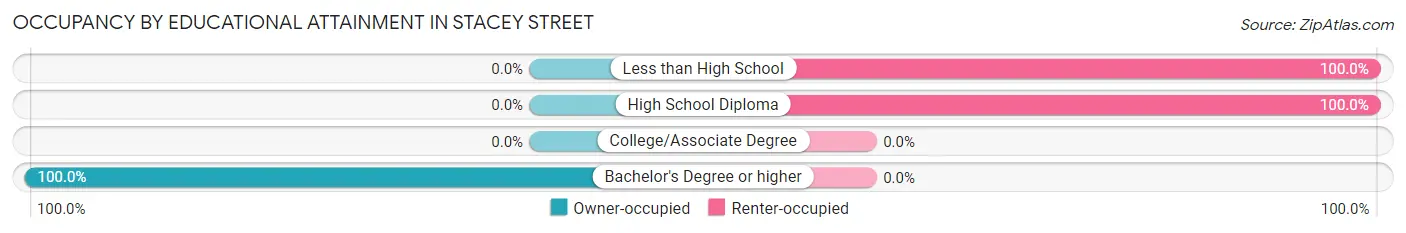
| Household Size | Owner-occupied | Renter-occupied |
| Less than High School | 0 (0.0%) | 70 (100.0%) |
| High School Diploma | 0 (0.0%) | 53 (100.0%) |
| College/Associate Degree | 0 (0.0%) | 0 (0.0%) |
| Bachelor's Degree or higher | 4 (100.0%) | 0 (0.0%) |
Occupancy by Age of Householder in Stacey Street
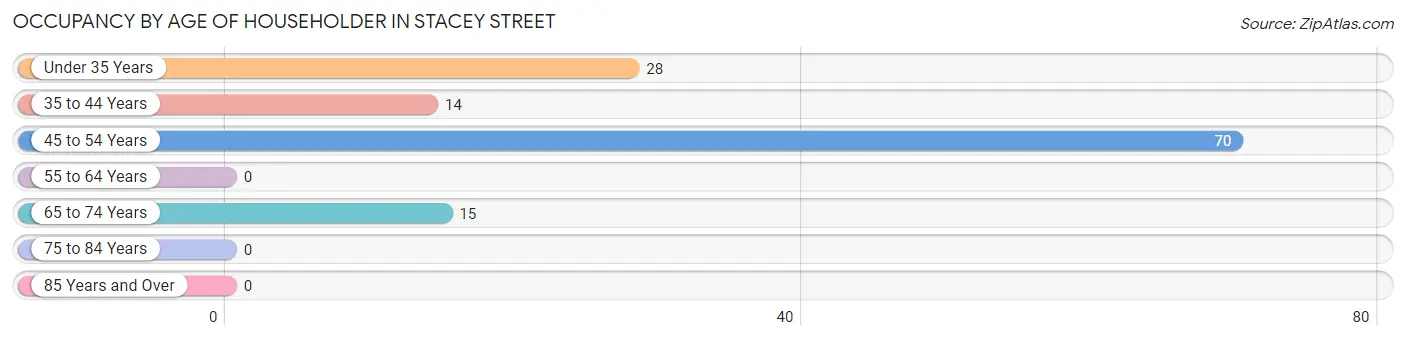
| Age Bracket | # Households | % Households |
| Under 35 Years | 28 | 22.1% |
| 35 to 44 Years | 14 | 11.0% |
| 45 to 54 Years | 70 | 55.1% |
| 55 to 64 Years | 0 | 0.0% |
| 65 to 74 Years | 15 | 11.8% |
| 75 to 84 Years | 0 | 0.0% |
| 85 Years and Over | 0 | 0.0% |
| Total | 127 | 100.0% |
Housing Finances in Stacey Street
Median Income by Occupancy in Stacey Street
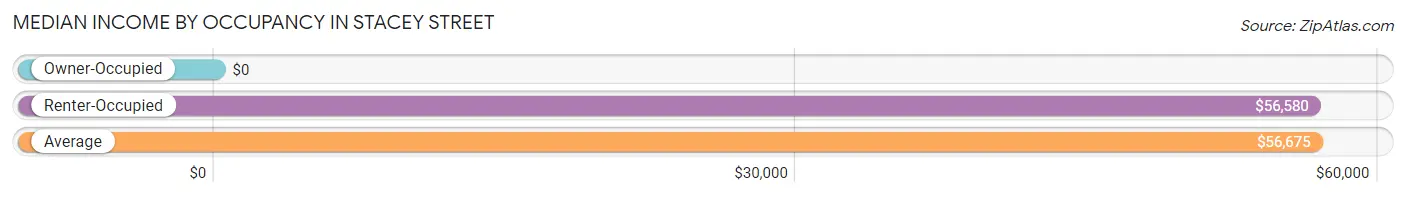
| Occupancy Type | # Households | Median Income |
| Owner-Occupied | 4 (3.2%) | $0 |
| Renter-Occupied | 123 (96.9%) | $56,580 |
| Average | 127 (100.0%) | $56,675 |
Occupancy by Householder Income Bracket in Stacey Street
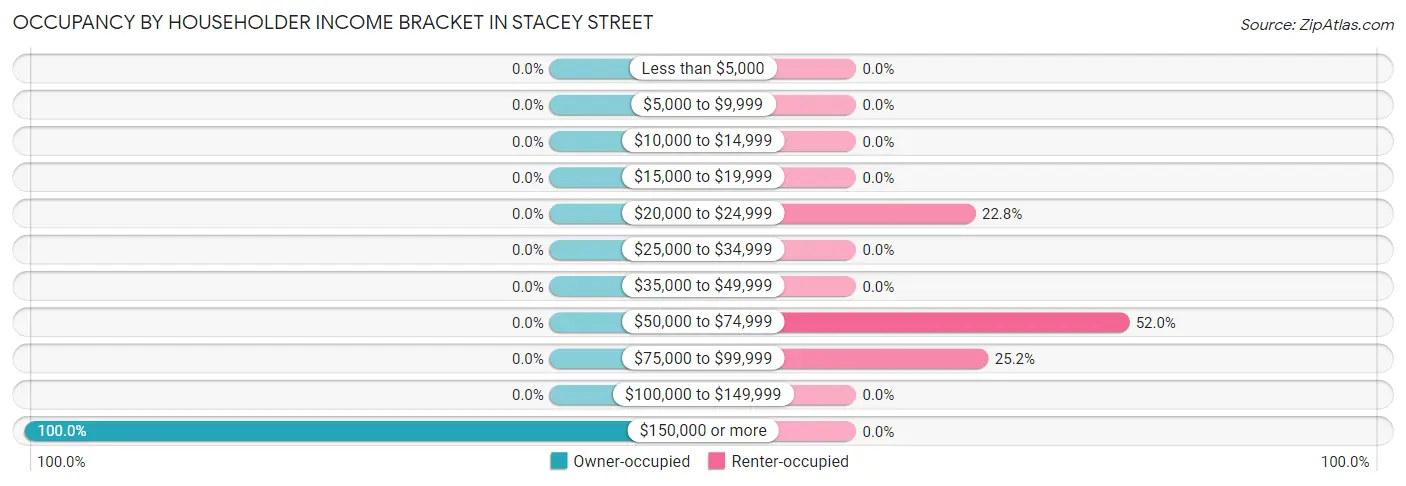
| Income Bracket | Owner-occupied | Renter-occupied |
| Less than $5,000 | 0 (0.0%) | 0 (0.0%) |
| $5,000 to $9,999 | 0 (0.0%) | 0 (0.0%) |
| $10,000 to $14,999 | 0 (0.0%) | 0 (0.0%) |
| $15,000 to $19,999 | 0 (0.0%) | 0 (0.0%) |
| $20,000 to $24,999 | 0 (0.0%) | 28 (22.8%) |
| $25,000 to $34,999 | 0 (0.0%) | 0 (0.0%) |
| $35,000 to $49,999 | 0 (0.0%) | 0 (0.0%) |
| $50,000 to $74,999 | 0 (0.0%) | 64 (52.0%) |
| $75,000 to $99,999 | 0 (0.0%) | 31 (25.2%) |
| $100,000 to $149,999 | 0 (0.0%) | 0 (0.0%) |
| $150,000 or more | 4 (100.0%) | 0 (0.0%) |
| Total | 4 (100.0%) | 123 (100.0%) |
Monthly Housing Cost Tiers in Stacey Street
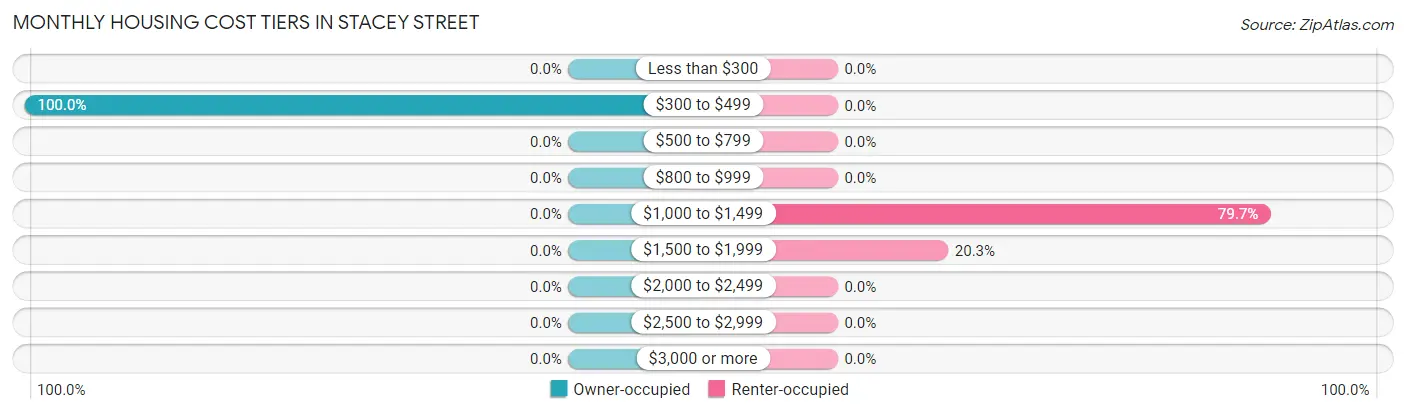
| Monthly Cost | Owner-occupied | Renter-occupied |
| Less than $300 | 0 (0.0%) | 0 (0.0%) |
| $300 to $499 | 4 (100.0%) | 0 (0.0%) |
| $500 to $799 | 0 (0.0%) | 0 (0.0%) |
| $800 to $999 | 0 (0.0%) | 0 (0.0%) |
| $1,000 to $1,499 | 0 (0.0%) | 98 (79.7%) |
| $1,500 to $1,999 | 0 (0.0%) | 25 (20.3%) |
| $2,000 to $2,499 | 0 (0.0%) | 0 (0.0%) |
| $2,500 to $2,999 | 0 (0.0%) | 0 (0.0%) |
| $3,000 or more | 0 (0.0%) | 0 (0.0%) |
| Total | 4 (100.0%) | 123 (100.0%) |
Physical Housing Characteristics in Stacey Street
Housing Structures in Stacey Street
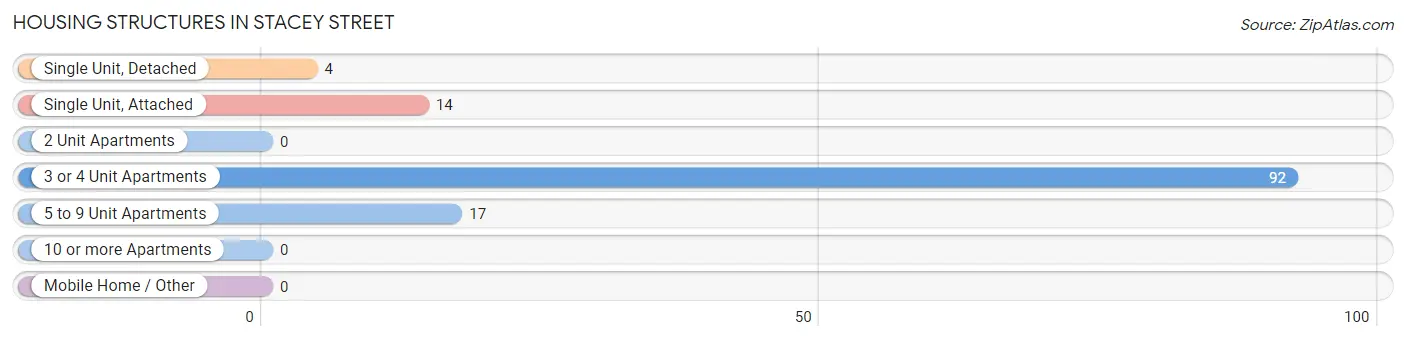
| Structure Type | # Housing Units | % Housing Units |
| Single Unit, Detached | 4 | 3.2% |
| Single Unit, Attached | 14 | 11.0% |
| 2 Unit Apartments | 0 | 0.0% |
| 3 or 4 Unit Apartments | 92 | 72.4% |
| 5 to 9 Unit Apartments | 17 | 13.4% |
| 10 or more Apartments | 0 | 0.0% |
| Mobile Home / Other | 0 | 0.0% |
| Total | 127 | 100.0% |
Housing Structures by Occupancy in Stacey Street
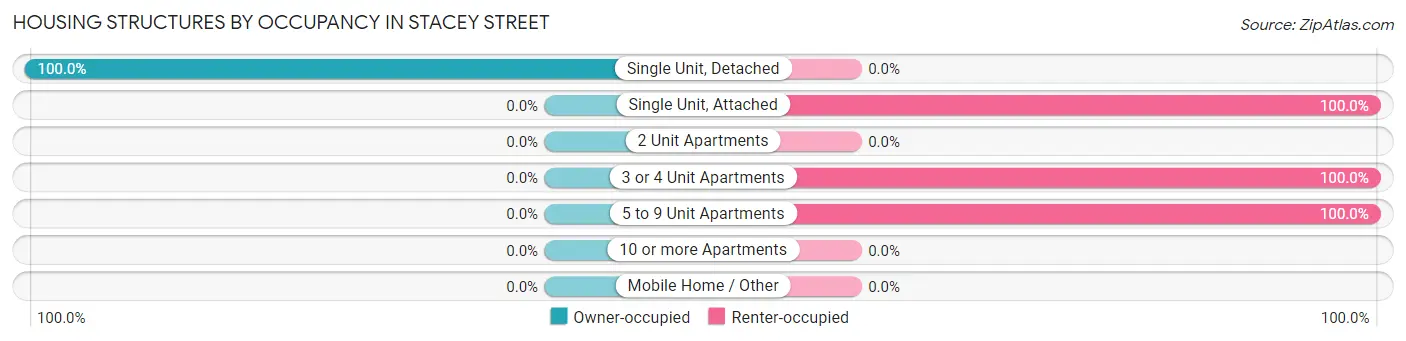
| Structure Type | Owner-occupied | Renter-occupied |
| Single Unit, Detached | 4 (100.0%) | 0 (0.0%) |
| Single Unit, Attached | 0 (0.0%) | 14 (100.0%) |
| 2 Unit Apartments | 0 (0.0%) | 0 (0.0%) |
| 3 or 4 Unit Apartments | 0 (0.0%) | 92 (100.0%) |
| 5 to 9 Unit Apartments | 0 (0.0%) | 17 (100.0%) |
| 10 or more Apartments | 0 (0.0%) | 0 (0.0%) |
| Mobile Home / Other | 0 (0.0%) | 0 (0.0%) |
| Total | 4 (3.2%) | 123 (96.9%) |
Housing Structures by Number of Rooms in Stacey Street
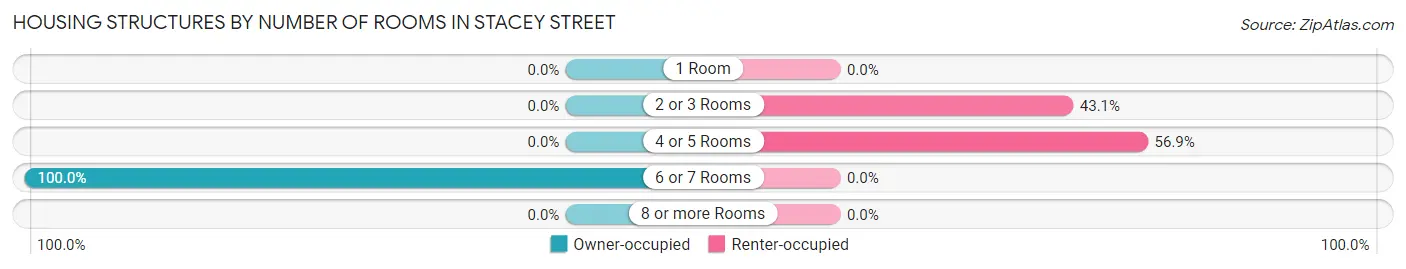
| Number of Rooms | Owner-occupied | Renter-occupied |
| 1 Room | 0 (0.0%) | 0 (0.0%) |
| 2 or 3 Rooms | 0 (0.0%) | 53 (43.1%) |
| 4 or 5 Rooms | 0 (0.0%) | 70 (56.9%) |
| 6 or 7 Rooms | 4 (100.0%) | 0 (0.0%) |
| 8 or more Rooms | 0 (0.0%) | 0 (0.0%) |
| Total | 4 (100.0%) | 123 (100.0%) |
Housing Structure by Heating Type in Stacey Street
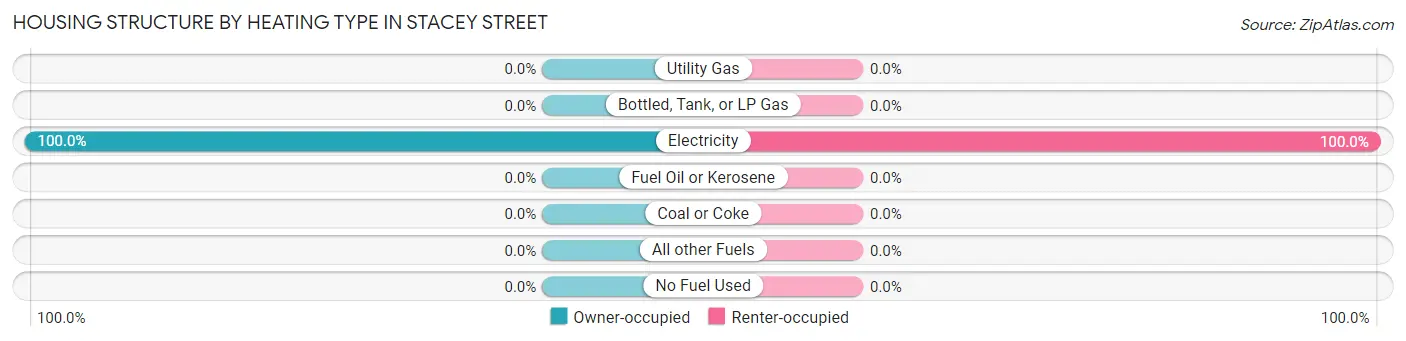
| Heating Type | Owner-occupied | Renter-occupied |
| Utility Gas | 0 (0.0%) | 0 (0.0%) |
| Bottled, Tank, or LP Gas | 0 (0.0%) | 0 (0.0%) |
| Electricity | 4 (100.0%) | 123 (100.0%) |
| Fuel Oil or Kerosene | 0 (0.0%) | 0 (0.0%) |
| Coal or Coke | 0 (0.0%) | 0 (0.0%) |
| All other Fuels | 0 (0.0%) | 0 (0.0%) |
| No Fuel Used | 0 (0.0%) | 0 (0.0%) |
| Total | 4 (100.0%) | 123 (100.0%) |
Household Vehicle Usage in Stacey Street
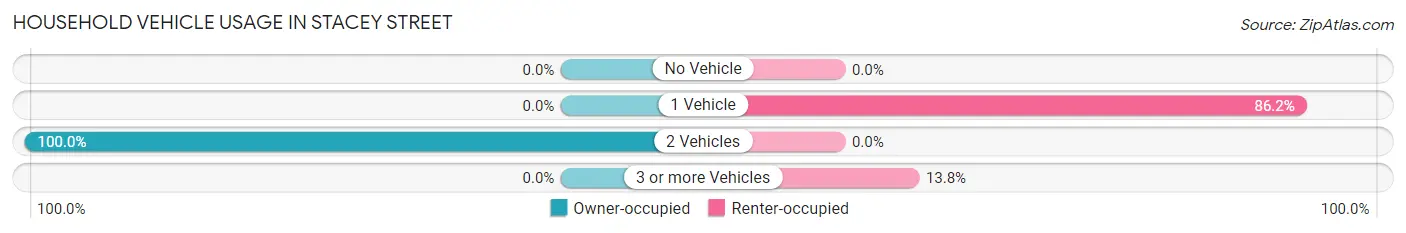
| Vehicles per Household | Owner-occupied | Renter-occupied |
| No Vehicle | 0 (0.0%) | 0 (0.0%) |
| 1 Vehicle | 0 (0.0%) | 106 (86.2%) |
| 2 Vehicles | 4 (100.0%) | 0 (0.0%) |
| 3 or more Vehicles | 0 (0.0%) | 17 (13.8%) |
| Total | 4 (100.0%) | 123 (100.0%) |
Real Estate & Mortgages in Stacey Street
Real Estate and Mortgage Overview in Stacey Street
| Characteristic | Without Mortgage | With Mortgage |
| Housing Units | 4 | 0 |
| Median Property Value | - | - |
| Median Household Income | - | - |
| Monthly Housing Costs | - | - |
| Real Estate Taxes | - | - |
Property Value by Mortgage Status in Stacey Street
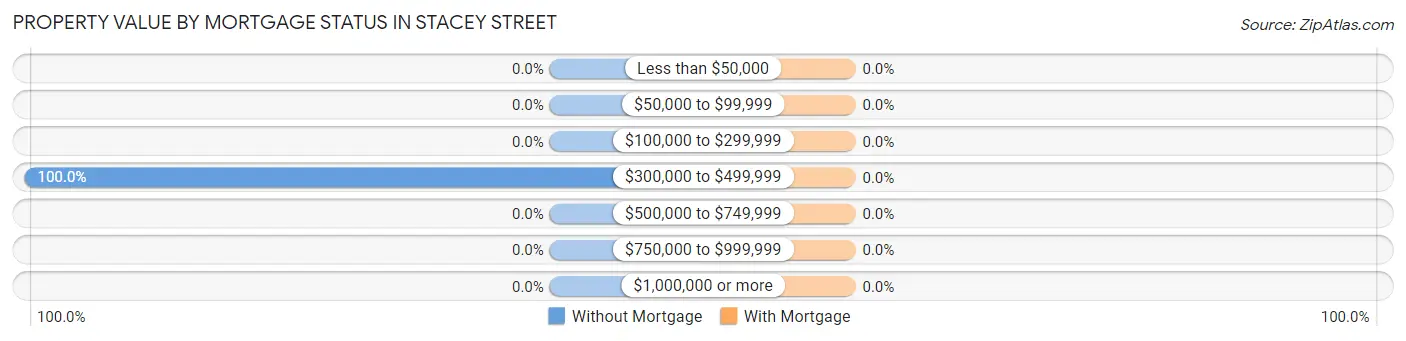
| Property Value | Without Mortgage | With Mortgage |
| Less than $50,000 | 0 (0.0%) | 0 (0.0%) |
| $50,000 to $99,999 | 0 (0.0%) | 0 (0.0%) |
| $100,000 to $299,999 | 0 (0.0%) | 0 (0.0%) |
| $300,000 to $499,999 | 4 (100.0%) | 0 (0.0%) |
| $500,000 to $749,999 | 0 (0.0%) | 0 (0.0%) |
| $750,000 to $999,999 | 0 (0.0%) | 0 (0.0%) |
| $1,000,000 or more | 0 (0.0%) | 0 (0.0%) |
| Total | 4 (100.0%) | 0 (0.0%) |
Household Income by Mortgage Status in Stacey Street
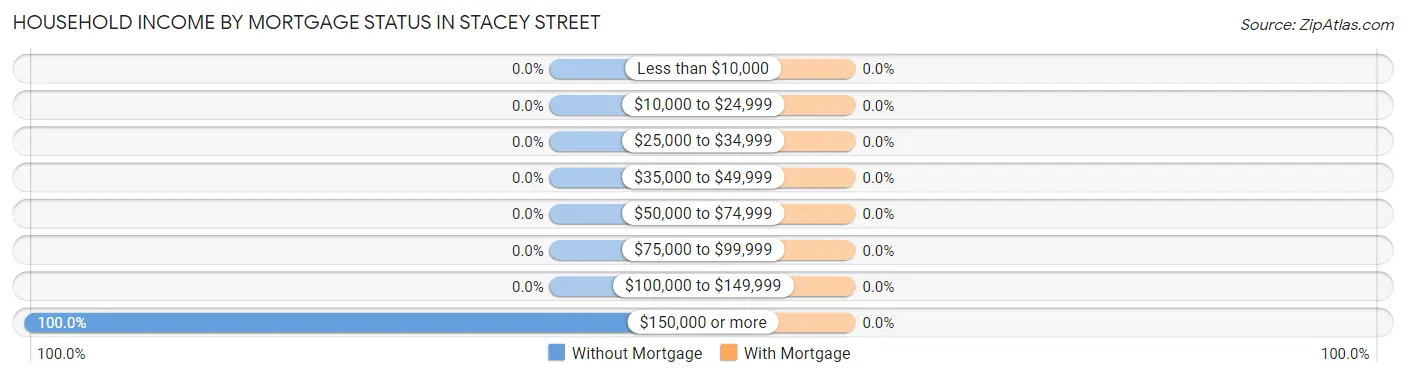
| Household Income | Without Mortgage | With Mortgage |
| Less than $10,000 | 0 (0.0%) | 0 (0.0%) |
| $10,000 to $24,999 | 0 (0.0%) | 0 (0.0%) |
| $25,000 to $34,999 | 0 (0.0%) | 0 (0.0%) |
| $35,000 to $49,999 | 0 (0.0%) | 0 (0.0%) |
| $50,000 to $74,999 | 0 (0.0%) | 0 (0.0%) |
| $75,000 to $99,999 | 0 (0.0%) | 0 (0.0%) |
| $100,000 to $149,999 | 0 (0.0%) | 0 (0.0%) |
| $150,000 or more | 4 (100.0%) | 0 (0.0%) |
| Total | 4 (100.0%) | 0 (0.0%) |
Property Value to Household Income Ratio in Stacey Street
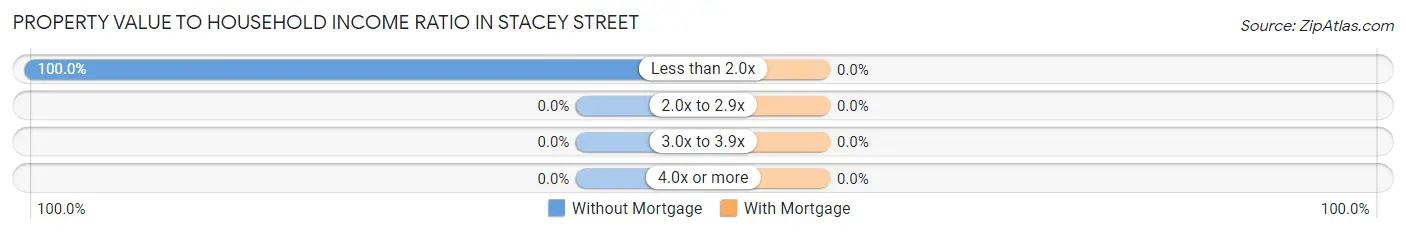
| Value-to-Income Ratio | Without Mortgage | With Mortgage |
| Less than 2.0x | 4 (100.0%) | 0 (0.0%) |
| 2.0x to 2.9x | 0 (0.0%) | 0 (0.0%) |
| 3.0x to 3.9x | 0 (0.0%) | 0 (0.0%) |
| 4.0x or more | 0 (0.0%) | 0 (0.0%) |
| Total | 4 (100.0%) | 0 (0.0%) |
Real Estate Taxes by Mortgage Status in Stacey Street
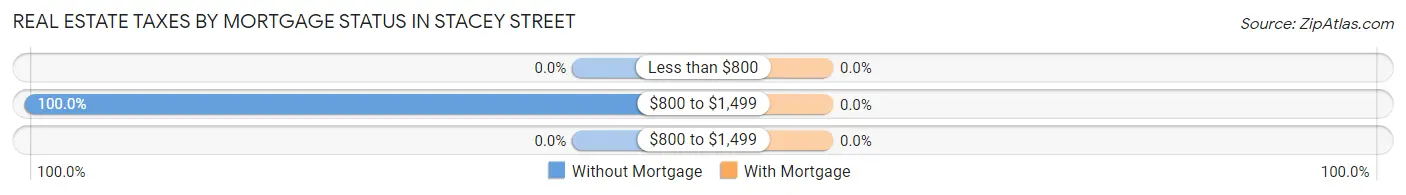
| Property Taxes | Without Mortgage | With Mortgage |
| Less than $800 | 0 (0.0%) | 0 (0.0%) |
| $800 to $1,499 | 4 (100.0%) | 0 (0.0%) |
| $800 to $1,499 | 0 (0.0%) | 0 (0.0%) |
| Total | 4 (100.0%) | 0 (0.0%) |
Health & Disability in Stacey Street
Health Insurance Coverage by Age in Stacey Street
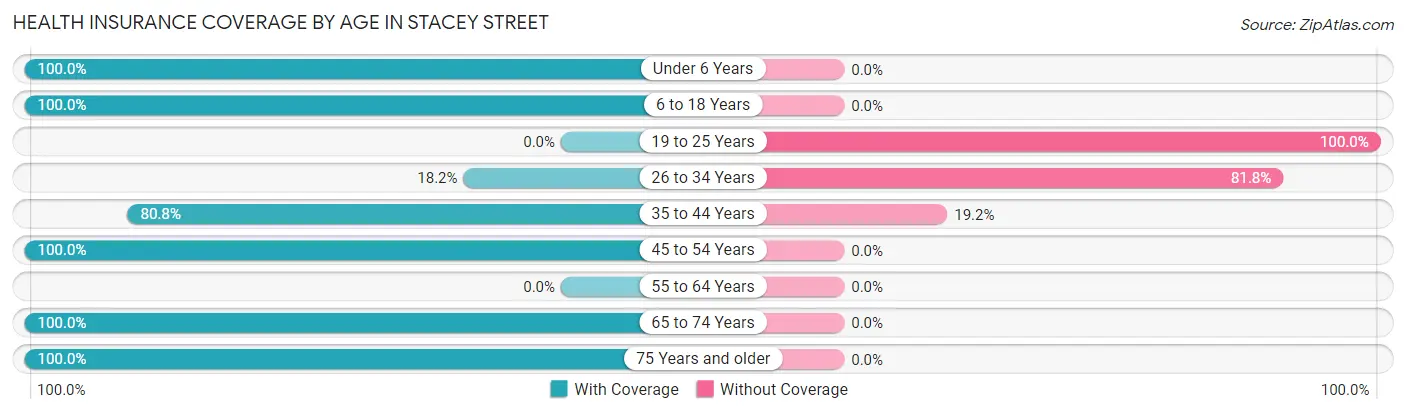
| Age Bracket | With Coverage | Without Coverage |
| Under 6 Years | 29 (100.0%) | 0 (0.0%) |
| 6 to 18 Years | 17 (100.0%) | 0 (0.0%) |
| 19 to 25 Years | 0 (0.0%) | 121 (100.0%) |
| 26 to 34 Years | 18 (18.2%) | 81 (81.8%) |
| 35 to 44 Years | 122 (80.8%) | 29 (19.2%) |
| 45 to 54 Years | 70 (100.0%) | 0 (0.0%) |
| 55 to 64 Years | 0 (0.0%) | 0 (0.0%) |
| 65 to 74 Years | 36 (100.0%) | 0 (0.0%) |
| 75 Years and older | 8 (100.0%) | 0 (0.0%) |
| Total | 300 (56.5%) | 231 (43.5%) |
Health Insurance Coverage by Citizenship Status in Stacey Street

| Citizenship Status | With Coverage | Without Coverage |
| Native Born | 29 (100.0%) | 0 (0.0%) |
| Foreign Born, Citizen | 17 (100.0%) | 0 (0.0%) |
| Foreign Born, not a Citizen | 0 (0.0%) | 121 (100.0%) |
Health Insurance Coverage by Household Income in Stacey Street
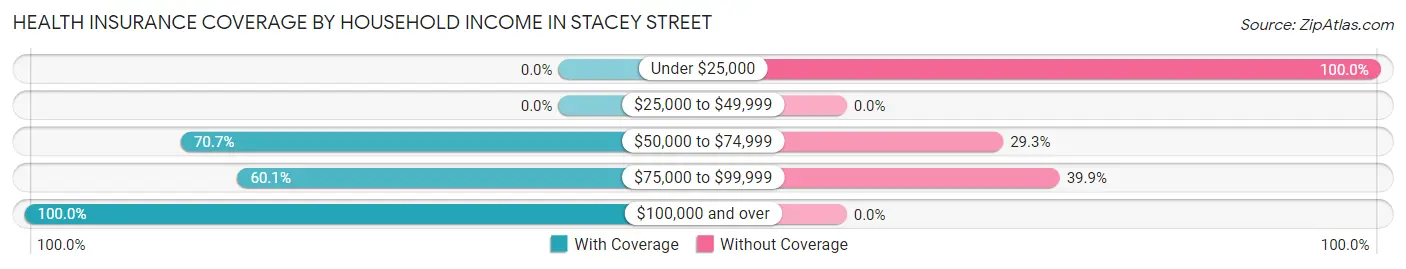
| Household Income | With Coverage | Without Coverage |
| Under $25,000 | 0 (0.0%) | 81 (100.0%) |
| $25,000 to $49,999 | 0 (0.0%) | 0 (0.0%) |
| $50,000 to $74,999 | 164 (70.7%) | 68 (29.3%) |
| $75,000 to $99,999 | 113 (60.1%) | 75 (39.9%) |
| $100,000 and over | 16 (100.0%) | 0 (0.0%) |
Public vs Private Health Insurance Coverage by Age in Stacey Street
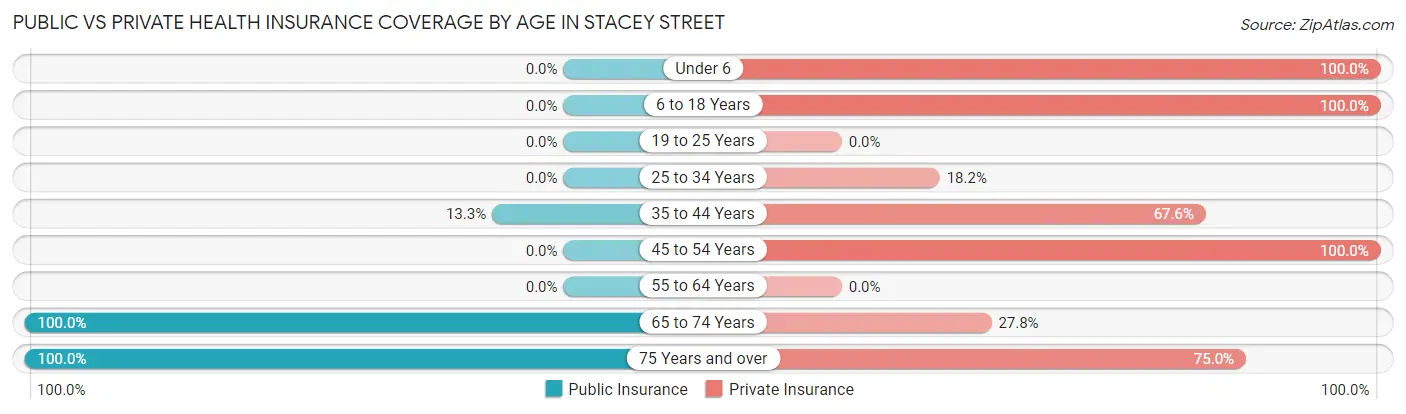
| Age Bracket | Public Insurance | Private Insurance |
| Under 6 | 0 (0.0%) | 29 (100.0%) |
| 6 to 18 Years | 0 (0.0%) | 17 (100.0%) |
| 19 to 25 Years | 0 (0.0%) | 0 (0.0%) |
| 25 to 34 Years | 0 (0.0%) | 18 (18.2%) |
| 35 to 44 Years | 20 (13.3%) | 102 (67.5%) |
| 45 to 54 Years | 0 (0.0%) | 70 (100.0%) |
| 55 to 64 Years | 0 (0.0%) | 0 (0.0%) |
| 65 to 74 Years | 36 (100.0%) | 10 (27.8%) |
| 75 Years and over | 8 (100.0%) | 6 (75.0%) |
| Total | 64 (12.0%) | 252 (47.5%) |
Disability Status by Sex by Age in Stacey Street
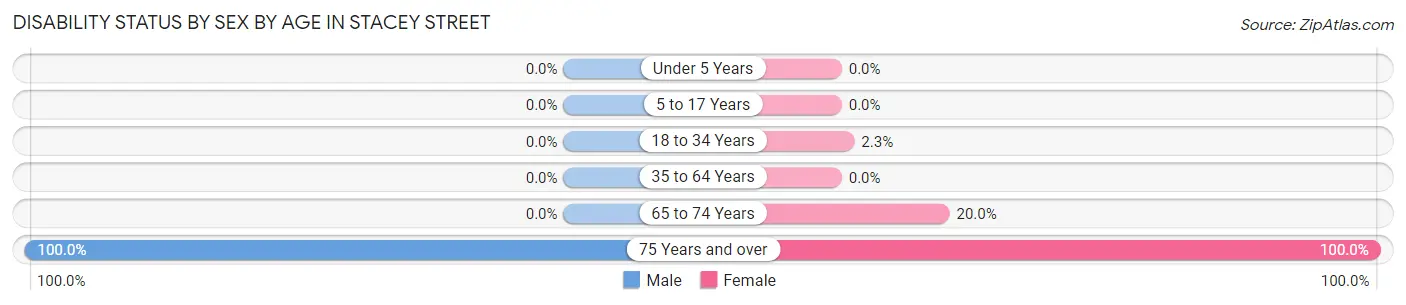
| Age Bracket | Male | Female |
| Under 5 Years | 0 (0.0%) | 0 (0.0%) |
| 5 to 17 Years | 0 (0.0%) | 0 (0.0%) |
| 18 to 34 Years | 0 (0.0%) | 3 (2.3%) |
| 35 to 64 Years | 0 (0.0%) | 0 (0.0%) |
| 65 to 74 Years | 0 (0.0%) | 5 (20.0%) |
| 75 Years and over | 6 (100.0%) | 2 (100.0%) |
Disability Class by Sex by Age in Stacey Street
Disability Class: Hearing Difficulty
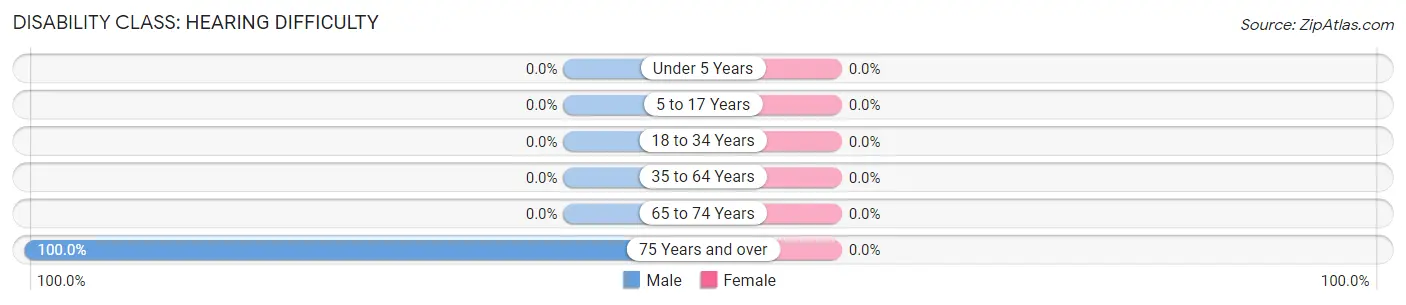
| Age Bracket | Male | Female |
| Under 5 Years | 0 (0.0%) | 0 (0.0%) |
| 5 to 17 Years | 0 (0.0%) | 0 (0.0%) |
| 18 to 34 Years | 0 (0.0%) | 0 (0.0%) |
| 35 to 64 Years | 0 (0.0%) | 0 (0.0%) |
| 65 to 74 Years | 0 (0.0%) | 0 (0.0%) |
| 75 Years and over | 6 (100.0%) | 0 (0.0%) |
Disability Class: Vision Difficulty
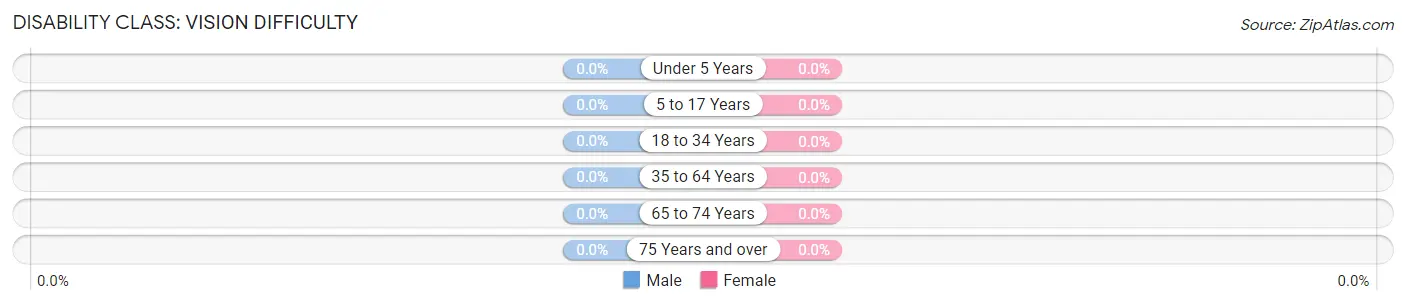
| Age Bracket | Male | Female |
| Under 5 Years | 0 (0.0%) | 0 (0.0%) |
| 5 to 17 Years | 0 (0.0%) | 0 (0.0%) |
| 18 to 34 Years | 0 (0.0%) | 0 (0.0%) |
| 35 to 64 Years | 0 (0.0%) | 0 (0.0%) |
| 65 to 74 Years | 0 (0.0%) | 0 (0.0%) |
| 75 Years and over | 0 (0.0%) | 0 (0.0%) |
Disability Class: Cognitive Difficulty
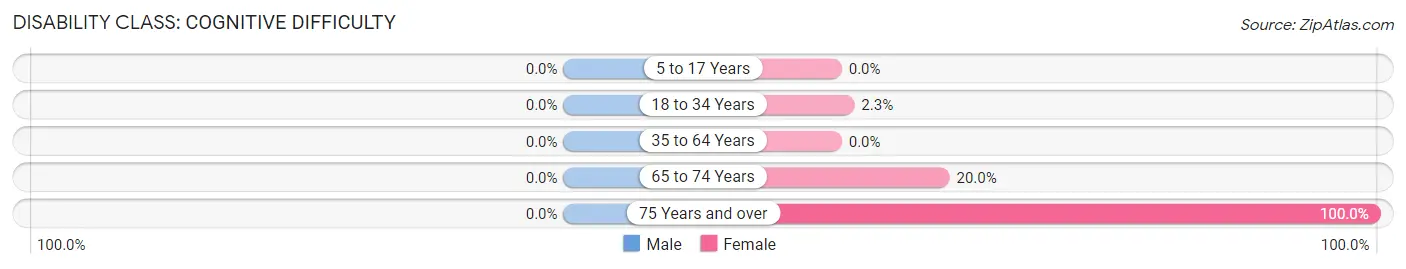
| Age Bracket | Male | Female |
| 5 to 17 Years | 0 (0.0%) | 0 (0.0%) |
| 18 to 34 Years | 0 (0.0%) | 3 (2.3%) |
| 35 to 64 Years | 0 (0.0%) | 0 (0.0%) |
| 65 to 74 Years | 0 (0.0%) | 5 (20.0%) |
| 75 Years and over | 0 (0.0%) | 2 (100.0%) |
Disability Class: Ambulatory Difficulty
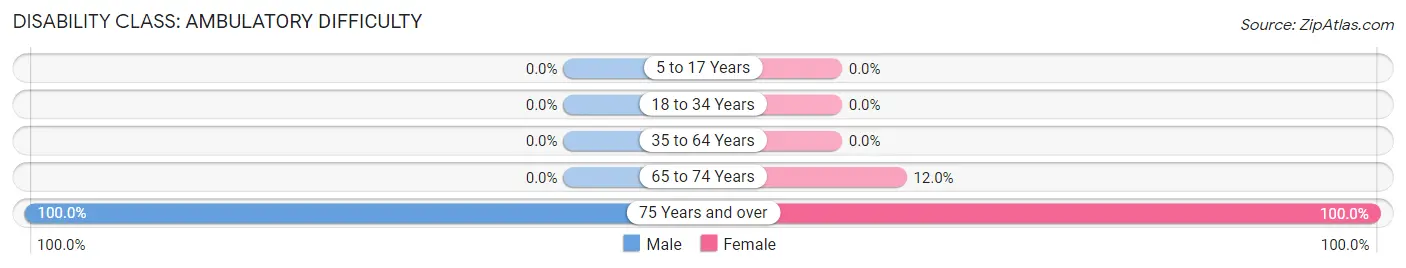
| Age Bracket | Male | Female |
| 5 to 17 Years | 0 (0.0%) | 0 (0.0%) |
| 18 to 34 Years | 0 (0.0%) | 0 (0.0%) |
| 35 to 64 Years | 0 (0.0%) | 0 (0.0%) |
| 65 to 74 Years | 0 (0.0%) | 3 (12.0%) |
| 75 Years and over | 6 (100.0%) | 2 (100.0%) |
Disability Class: Self-Care Difficulty

| Age Bracket | Male | Female |
| 5 to 17 Years | 0 (0.0%) | 0 (0.0%) |
| 18 to 34 Years | 0 (0.0%) | 0 (0.0%) |
| 35 to 64 Years | 0 (0.0%) | 0 (0.0%) |
| 65 to 74 Years | 0 (0.0%) | 3 (12.0%) |
| 75 Years and over | 0 (0.0%) | 2 (100.0%) |
Technology Access in Stacey Street
Computing Device Access in Stacey Street
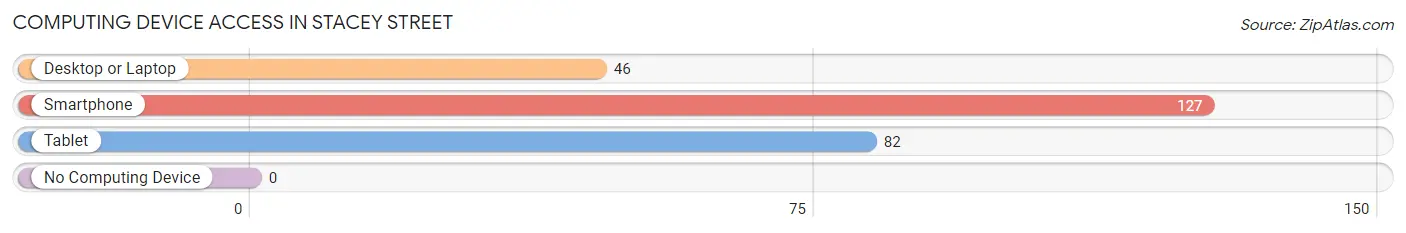
| Device Type | # Households | % Households |
| Desktop or Laptop | 46 | 36.2% |
| Smartphone | 127 | 100.0% |
| Tablet | 82 | 64.6% |
| No Computing Device | 0 | 0.0% |
| Total | 127 | 100.0% |
Internet Access in Stacey Street
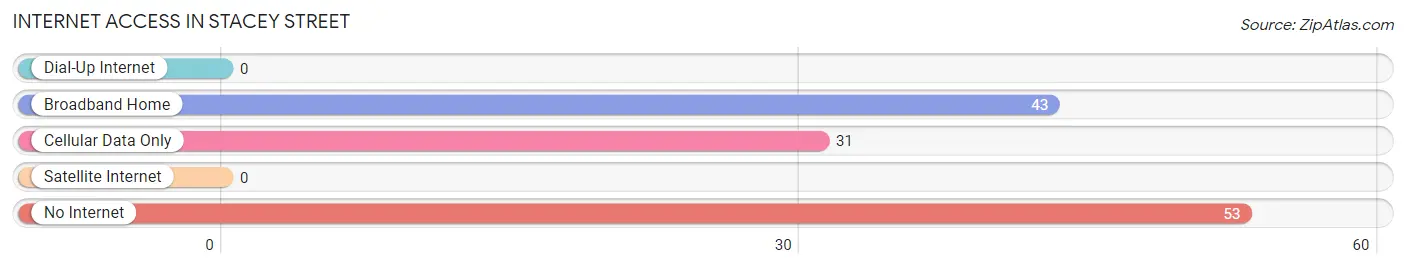
| Internet Type | # Households | % Households |
| Dial-Up Internet | 0 | 0.0% |
| Broadband Home | 43 | 33.9% |
| Cellular Data Only | 31 | 24.4% |
| Satellite Internet | 0 | 0.0% |
| No Internet | 53 | 41.7% |
| Total | 127 | 100.0% |
Stacey Street Summary
Stacey Street is a small unincorporated community located in Palm Beach County, Florida. It is located in the southeastern part of the county, just north of the city of Boynton Beach. The population of Stacey Street is estimated to be around 1,000 people.
History
Stacey Street was originally part of the Seminole Indian Reservation, which was established in 1823. The area was later sold to settlers in 1842, and the first settlers arrived in the area in 1845. The area was named after the Stacey family, who were among the first settlers.
The area was primarily used for farming and ranching until the early 1900s, when the Florida East Coast Railway was built through the area. This allowed for the development of the area, and the population began to grow.
Geography
Stacey Street is located in southeastern Palm Beach County, just north of the city of Boynton Beach. It is bordered by the cities of Delray Beach and Boynton Beach to the south, and the unincorporated communities of Lantana and Hypoluxo to the north. The area is mostly flat, with an elevation of around 10 feet above sea level.
Economy
The economy of Stacey Street is primarily based on agriculture and tourism. The area is home to several farms, which produce a variety of crops, including citrus, vegetables, and sugar cane. The area is also home to several tourist attractions, such as the Lion Country Safari and the Morikami Museum and Japanese Gardens.
Demographics
As of the 2010 census, the population of Stacey Street was estimated to be around 1,000 people. The racial makeup of the area was 79.3% White, 11.2% African American, 0.7% Native American, 0.7% Asian, and 8.1% from other races. The median household income was $45,000, and the median home value was $150,000.
Conclusion
Stacey Street is a small unincorporated community located in Palm Beach County, Florida. It has a population of around 1,000 people and is primarily known for its agriculture and tourism. The area is home to several farms, tourist attractions, and other businesses. The area has a diverse population, with a median household income of $45,000 and a median home value of $150,000.
Common Questions
What is Per Capita Income in Stacey Street?
Per Capita income in Stacey Street is $17,858.
What is the Median Family Income in Stacey Street?
Median Family Income in Stacey Street is $57,335.
What is the Median Household income in Stacey Street?
Median Household Income in Stacey Street is $56,675.
What is Inequality or Gini Index in Stacey Street?
Inequality or Gini Index in Stacey Street is 0.29.
What is the Total Population of Stacey Street?
Total Population of Stacey Street is 531.
What is the Total Male Population of Stacey Street?
Total Male Population of Stacey Street is 230.
What is the Total Female Population of Stacey Street?
Total Female Population of Stacey Street is 301.
What is the Ratio of Males per 100 Females in Stacey Street?
There are 76.41 Males per 100 Females in Stacey Street.
What is the Ratio of Females per 100 Males in Stacey Street?
There are 130.87 Females per 100 Males in Stacey Street.
What is the Median Population Age in Stacey Street?
Median Population Age in Stacey Street is 33.0 Years.
What is the Average Family Size in Stacey Street
Average Family Size in Stacey Street is 4.2 People.
What is the Average Household Size in Stacey Street
Average Household Size in Stacey Street is 4.1 People.
How Large is the Labor Force in Stacey Street?
There are 405 People in the Labor Forcein in Stacey Street.
What is the Percentage of People in the Labor Force in Stacey Street?
80.7% of People are in the Labor Force in Stacey Street.
What is the Unemployment Rate in Stacey Street?
Unemployment Rate in Stacey Street is 26.7%.