Kodiak Station, AK Map & Demographics
Kodiak Station Map
Kodiak Station Overview
$30,089
PER CAPITA INCOME
$101,071
AVG FAMILY INCOME
$94,205
AVG HOUSEHOLD INCOME
40.7%
WAGE / INCOME GAP [ % ]
59.3¢/ $1
WAGE / INCOME GAP [ $ ]
0.32
INEQUALITY / GINI INDEX
2,113
TOTAL POPULATION
1,170
MALE POPULATION
943
FEMALE POPULATION
124.07
MALES / 100 FEMALES
80.60
FEMALES / 100 MALES
25.4
MEDIAN AGE
3.3
AVG FAMILY SIZE
3.1
AVG HOUSEHOLD SIZE
1,171
LABOR FORCE [ PEOPLE ]
80.3%
PERCENT IN LABOR FORCE
Income in Kodiak Station
Income Overview in Kodiak Station
Per Capita Income in Kodiak Station is $30,089, while median incomes of families and households are $101,071 and $94,205 respectively.
| Characteristic | Number | Measure |
| Per Capita Income | 2,113 | $30,089 |
| Median Family Income | 548 | $101,071 |
| Mean Family Income | 548 | $94,716 |
| Median Household Income | 617 | $94,205 |
| Mean Household Income | 617 | $85,771 |
| Income Deficit | 548 | $0 |
| Wage / Income Gap (%) | 2,113 | 40.70% |
| Wage / Income Gap ($) | 2,113 | 59.30¢ per $1 |
| Gini / Inequality Index | 2,113 | 0.32 |
Earnings by Sex in Kodiak Station
Average Earnings in Kodiak Station are $45,604, $48,375 for men and $28,688 for women, a difference of 40.7%.
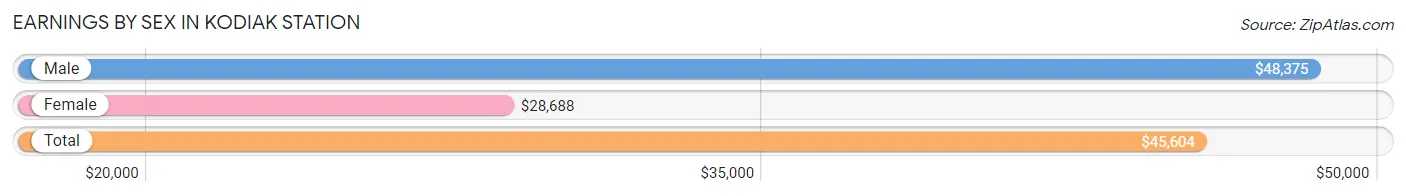
| Sex | Number | Average Earnings |
| Male | 773 (64.6%) | $48,375 |
| Female | 423 (35.4%) | $28,688 |
| Total | 1,196 (100.0%) | $45,604 |
Earnings by Sex by Income Bracket in Kodiak Station
The most common earnings brackets in Kodiak Station are $75,000 to $99,999 for men (171 | 22.1%) and $22,500 to $24,999 for women (55 | 13.0%).
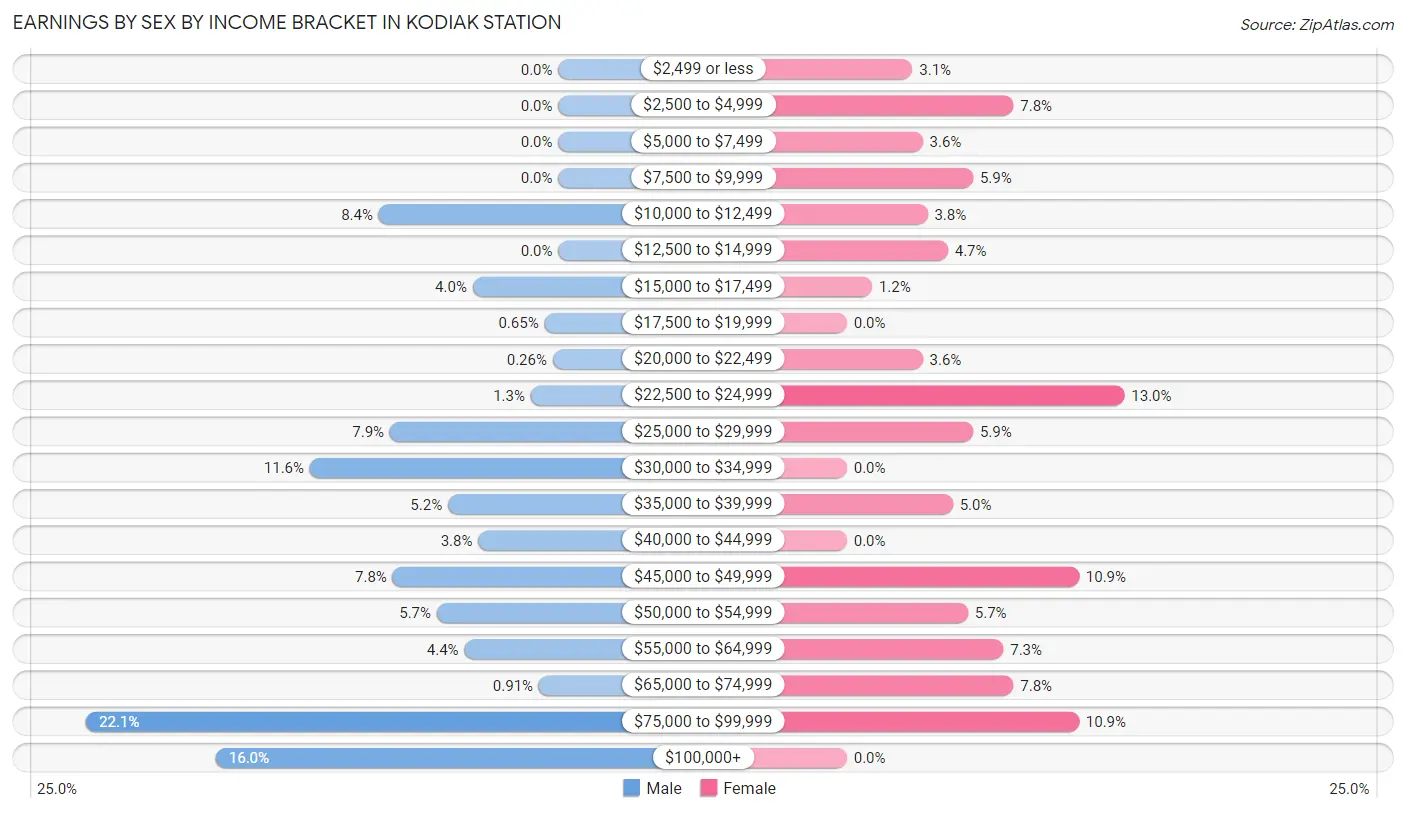
| Income | Male | Female |
| $2,499 or less | 0 (0.0%) | 13 (3.1%) |
| $2,500 to $4,999 | 0 (0.0%) | 33 (7.8%) |
| $5,000 to $7,499 | 0 (0.0%) | 15 (3.5%) |
| $7,500 to $9,999 | 0 (0.0%) | 25 (5.9%) |
| $10,000 to $12,499 | 65 (8.4%) | 16 (3.8%) |
| $12,500 to $14,999 | 0 (0.0%) | 20 (4.7%) |
| $15,000 to $17,499 | 31 (4.0%) | 5 (1.2%) |
| $17,500 to $19,999 | 5 (0.6%) | 0 (0.0%) |
| $20,000 to $22,499 | 2 (0.3%) | 15 (3.5%) |
| $22,500 to $24,999 | 10 (1.3%) | 55 (13.0%) |
| $25,000 to $29,999 | 61 (7.9%) | 25 (5.9%) |
| $30,000 to $34,999 | 90 (11.6%) | 0 (0.0%) |
| $35,000 to $39,999 | 40 (5.2%) | 21 (5.0%) |
| $40,000 to $44,999 | 29 (3.7%) | 0 (0.0%) |
| $45,000 to $49,999 | 60 (7.8%) | 46 (10.9%) |
| $50,000 to $54,999 | 44 (5.7%) | 24 (5.7%) |
| $55,000 to $64,999 | 34 (4.4%) | 31 (7.3%) |
| $65,000 to $74,999 | 7 (0.9%) | 33 (7.8%) |
| $75,000 to $99,999 | 171 (22.1%) | 46 (10.9%) |
| $100,000+ | 124 (16.0%) | 0 (0.0%) |
| Total | 773 (100.0%) | 423 (100.0%) |
Earnings by Sex by Educational Attainment in Kodiak Station
Average earnings in Kodiak Station are $75,771 for men and $45,518 for women, a difference of 39.9%. Men with an educational attainment of graduate degree enjoy the highest average annual earnings of $102,083, while those with college or associate's degree education earn the least with $55,903. Women with an educational attainment of graduate degree earn the most with the average annual earnings of $57,708, while those with bachelor's degree education have the smallest earnings of $45,602.
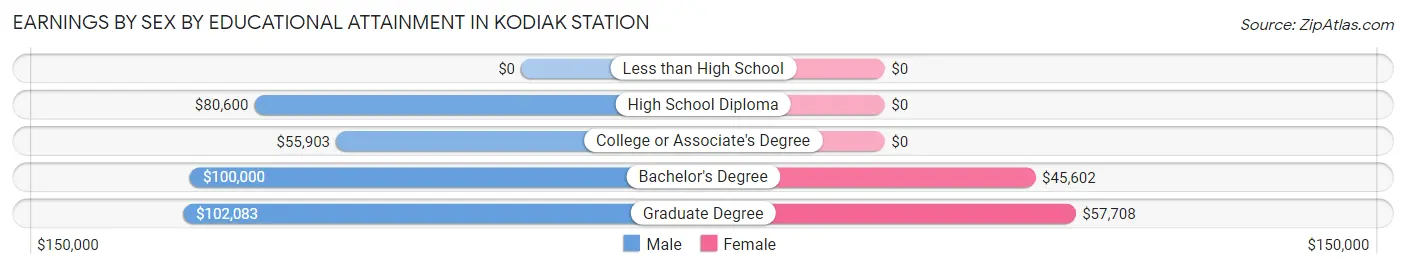
| Educational Attainment | Male Income | Female Income |
| Less than High School | - | - |
| High School Diploma | $80,600 | $0 |
| College or Associate's Degree | $55,903 | $0 |
| Bachelor's Degree | $100,000 | $45,602 |
| Graduate Degree | $102,083 | $57,708 |
| Total | $75,771 | $45,518 |
Family Income in Kodiak Station
Family Income Brackets in Kodiak Station
According to the Kodiak Station family income data, there are 199 families falling into the $100,000 to $149,999 income range, which is the most common income bracket and makes up 36.3% of all families.
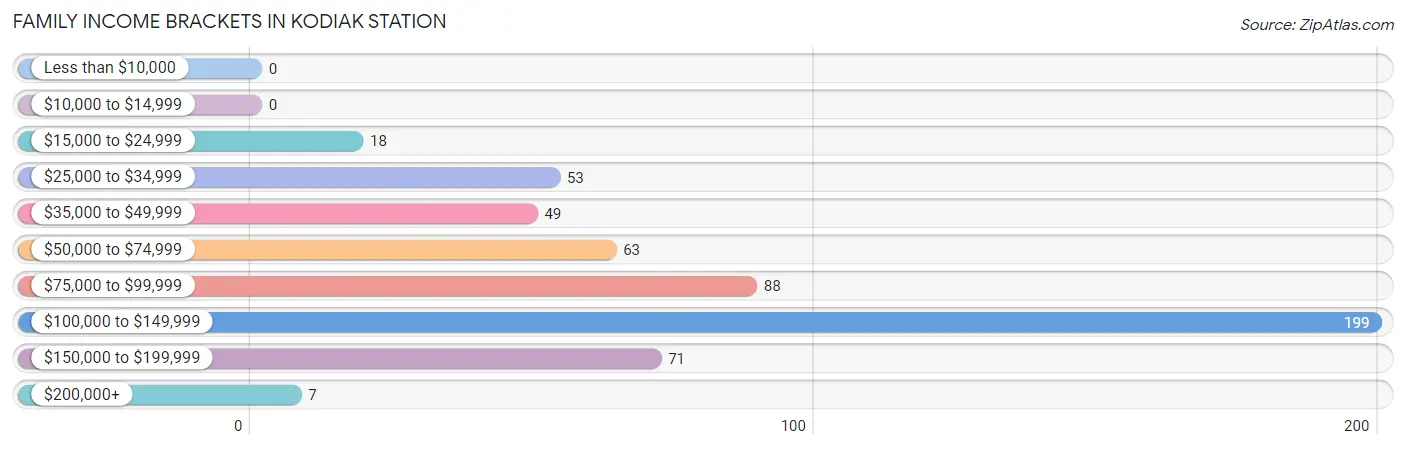
| Income Bracket | # Families | % Families |
| Less than $10,000 | 0 | 0.0% |
| $10,000 to $14,999 | 0 | 0.0% |
| $15,000 to $24,999 | 18 | 3.3% |
| $25,000 to $34,999 | 53 | 9.7% |
| $35,000 to $49,999 | 49 | 8.9% |
| $50,000 to $74,999 | 63 | 11.5% |
| $75,000 to $99,999 | 88 | 16.1% |
| $100,000 to $149,999 | 199 | 36.3% |
| $150,000 to $199,999 | 71 | 13.0% |
| $200,000+ | 7 | 1.3% |
Family Income by Famaliy Size in Kodiak Station
4-person families (170 | 31.0%) account for the highest median family income in Kodiak Station with $109,821 per family, while 2-person families (215 | 39.2%) have the highest median income of $44,140 per family member.
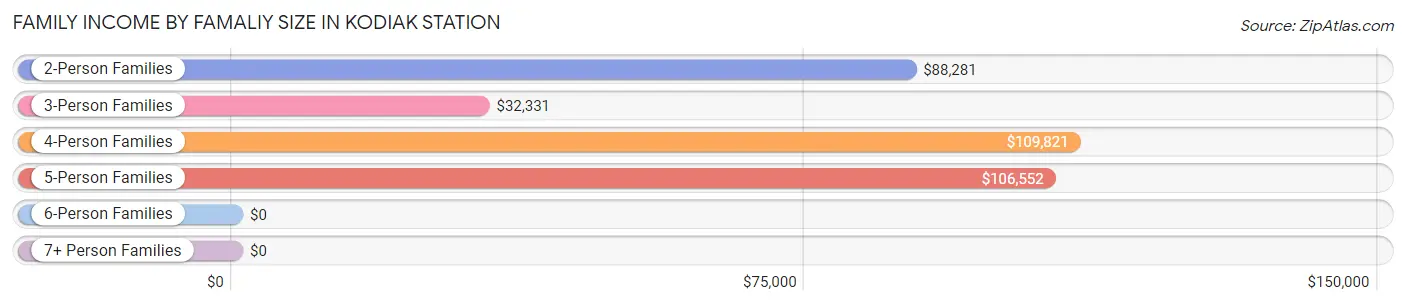
| Income Bracket | # Families | Median Income |
| 2-Person Families | 215 (39.2%) | $88,281 |
| 3-Person Families | 83 (15.1%) | $32,331 |
| 4-Person Families | 170 (31.0%) | $109,821 |
| 5-Person Families | 64 (11.7%) | $106,552 |
| 6-Person Families | 16 (2.9%) | $0 |
| 7+ Person Families | 0 (0.0%) | $0 |
| Total | 548 (100.0%) | $101,071 |
Family Income by Number of Earners in Kodiak Station
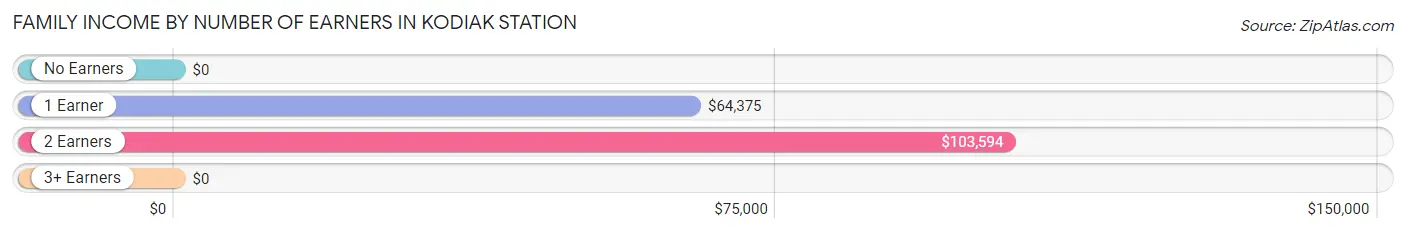
| Number of Earners | # Families | Median Income |
| No Earners | 9 (1.6%) | $0 |
| 1 Earner | 196 (35.8%) | $64,375 |
| 2 Earners | 337 (61.5%) | $103,594 |
| 3+ Earners | 6 (1.1%) | $0 |
| Total | 548 (100.0%) | $101,071 |
Household Income in Kodiak Station
Household Income Brackets in Kodiak Station
With 199 households falling in the category, the $100,000 to $149,999 income range is the most frequent in Kodiak Station, accounting for 32.3% of all households.
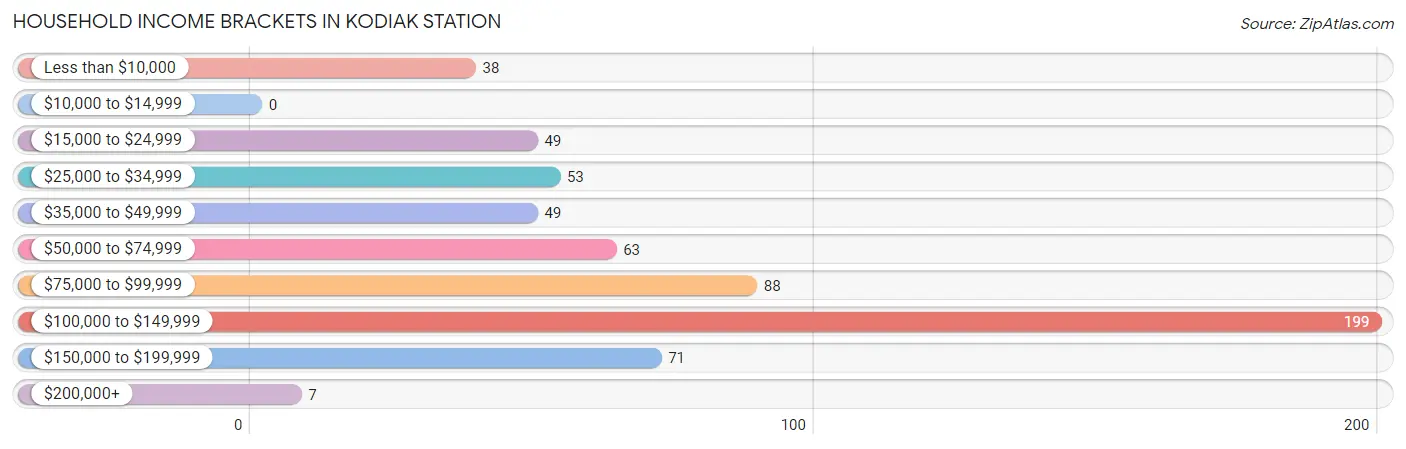
| Income Bracket | # Households | % Households |
| Less than $10,000 | 38 | 6.2% |
| $10,000 to $14,999 | 0 | 0.0% |
| $15,000 to $24,999 | 49 | 7.9% |
| $25,000 to $34,999 | 53 | 8.6% |
| $35,000 to $49,999 | 49 | 7.9% |
| $50,000 to $74,999 | 63 | 10.2% |
| $75,000 to $99,999 | 88 | 14.3% |
| $100,000 to $149,999 | 199 | 32.3% |
| $150,000 to $199,999 | 71 | 11.5% |
| $200,000+ | 7 | 1.1% |
Household Income by Householder Age in Kodiak Station
The median household income in Kodiak Station is $94,205, with the highest median household income of $108,125 found in the 45 to 64 years age bracket for the primary householder. A total of 23 households (3.7%) fall into this category. Meanwhile, the 65+ years age bracket for the primary householder has the lowest median household income of $0, with 38 households (6.2%) in this group.
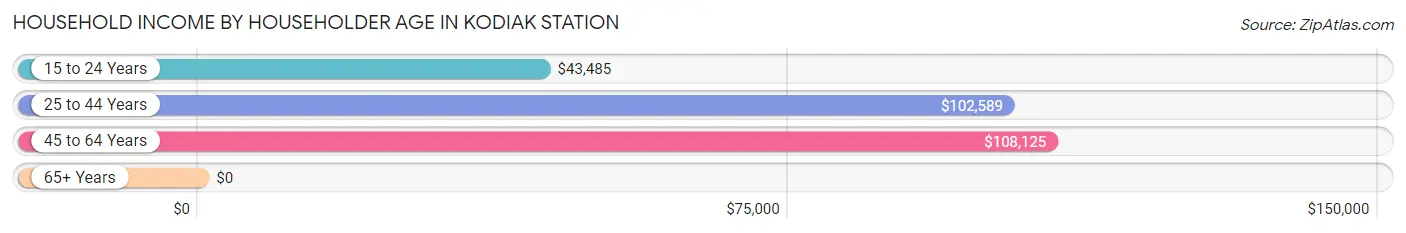
| Income Bracket | # Households | Median Income |
| 15 to 24 Years | 88 (14.3%) | $43,485 |
| 25 to 44 Years | 468 (75.8%) | $102,589 |
| 45 to 64 Years | 23 (3.7%) | $108,125 |
| 65+ Years | 38 (6.2%) | $0 |
| Total | 617 (100.0%) | $94,205 |
Poverty in Kodiak Station
Income Below Poverty by Sex and Age in Kodiak Station
With 8.0% poverty level for males and 5.0% for females among the residents of Kodiak Station, 18 to 24 year old males and 65 to 74 year old females are the most vulnerable to poverty, with 64 males (58.2%) and 38 females (100.0%) in their respective age groups living below the poverty level.
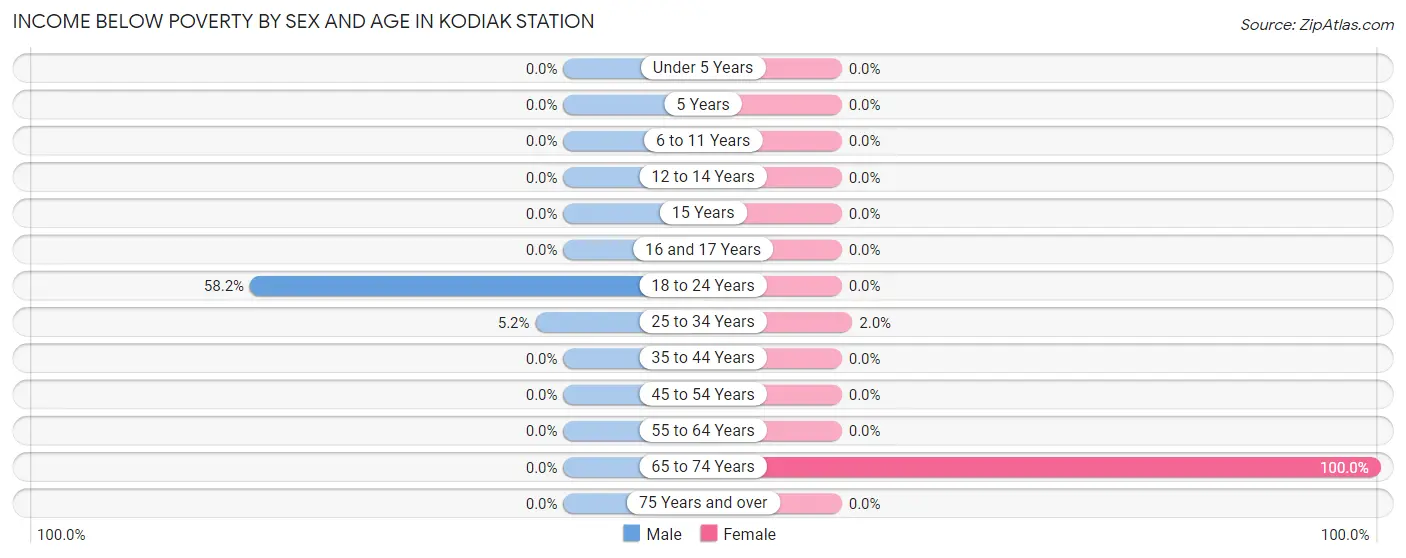
| Age Bracket | Male | Female |
| Under 5 Years | 0 (0.0%) | 0 (0.0%) |
| 5 Years | 0 (0.0%) | 0 (0.0%) |
| 6 to 11 Years | 0 (0.0%) | 0 (0.0%) |
| 12 to 14 Years | 0 (0.0%) | 0 (0.0%) |
| 15 Years | 0 (0.0%) | 0 (0.0%) |
| 16 and 17 Years | 0 (0.0%) | 0 (0.0%) |
| 18 to 24 Years | 64 (58.2%) | 0 (0.0%) |
| 25 to 34 Years | 18 (5.2%) | 7 (2.0%) |
| 35 to 44 Years | 0 (0.0%) | 0 (0.0%) |
| 45 to 54 Years | 0 (0.0%) | 0 (0.0%) |
| 55 to 64 Years | 0 (0.0%) | 0 (0.0%) |
| 65 to 74 Years | 0 (0.0%) | 38 (100.0%) |
| 75 Years and over | 0 (0.0%) | 0 (0.0%) |
| Total | 82 (8.0%) | 45 (5.0%) |
Income Above Poverty by Sex and Age in Kodiak Station
According to the poverty statistics in Kodiak Station, males aged under 5 years and females aged under 5 years are the age groups that are most secure financially, with 100.0% of males and 100.0% of females in these age groups living above the poverty line.
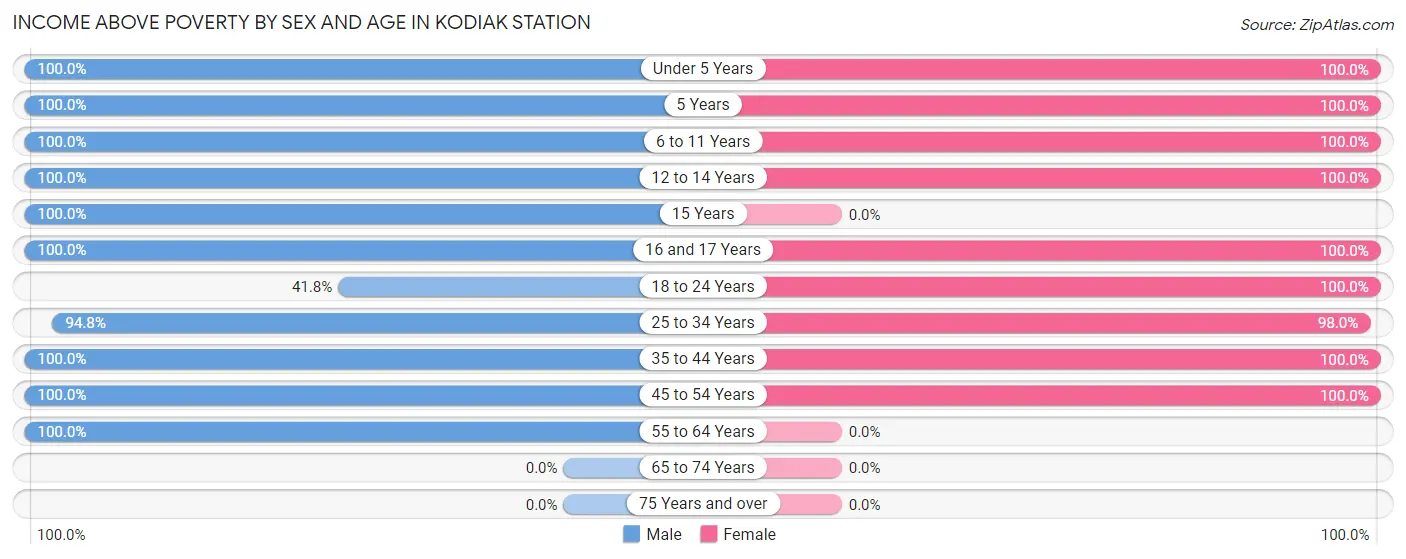
| Age Bracket | Male | Female |
| Under 5 Years | 107 (100.0%) | 79 (100.0%) |
| 5 Years | 38 (100.0%) | 6 (100.0%) |
| 6 to 11 Years | 178 (100.0%) | 141 (100.0%) |
| 12 to 14 Years | 23 (100.0%) | 65 (100.0%) |
| 15 Years | 18 (100.0%) | 0 (0.0%) |
| 16 and 17 Years | 15 (100.0%) | 24 (100.0%) |
| 18 to 24 Years | 46 (41.8%) | 35 (100.0%) |
| 25 to 34 Years | 329 (94.8%) | 351 (98.0%) |
| 35 to 44 Years | 161 (100.0%) | 121 (100.0%) |
| 45 to 54 Years | 24 (100.0%) | 28 (100.0%) |
| 55 to 64 Years | 6 (100.0%) | 0 (0.0%) |
| 65 to 74 Years | 0 (0.0%) | 0 (0.0%) |
| 75 Years and over | 0 (0.0%) | 0 (0.0%) |
| Total | 945 (92.0%) | 850 (95.0%) |
Income Below Poverty Among Married-Couple Families in Kodiak Station
The poverty statistics for married-couple families in Kodiak Station show that 3.4% or 18 of the total 537 families live below the poverty line. Families with no children have the highest poverty rate of 8.7%, comprising of 18 families. On the other hand, families with 1 or 2 children have the lowest poverty rate of 0.0%, which includes 0 families.
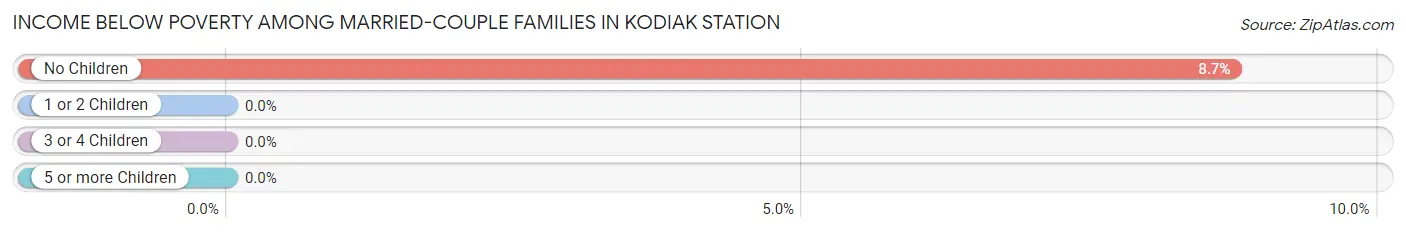
| Children | Above Poverty | Below Poverty |
| No Children | 188 (91.3%) | 18 (8.7%) |
| 1 or 2 Children | 251 (100.0%) | 0 (0.0%) |
| 3 or 4 Children | 80 (100.0%) | 0 (0.0%) |
| 5 or more Children | 0 (0.0%) | 0 (0.0%) |
| Total | 519 (96.7%) | 18 (3.4%) |
Income Below Poverty Among Single-Parent Households in Kodiak Station
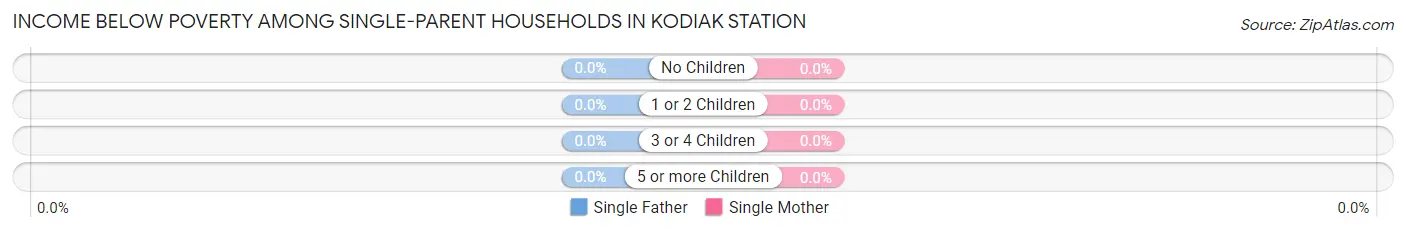
| Children | Single Father | Single Mother |
| No Children | 0 (0.0%) | 0 (0.0%) |
| 1 or 2 Children | 0 (0.0%) | 0 (0.0%) |
| 3 or 4 Children | 0 (0.0%) | 0 (0.0%) |
| 5 or more Children | 0 (0.0%) | 0 (0.0%) |
| Total | 0 (0.0%) | 0 (0.0%) |
Income Below Poverty Among Married-Couple vs Single-Parent Households in Kodiak Station
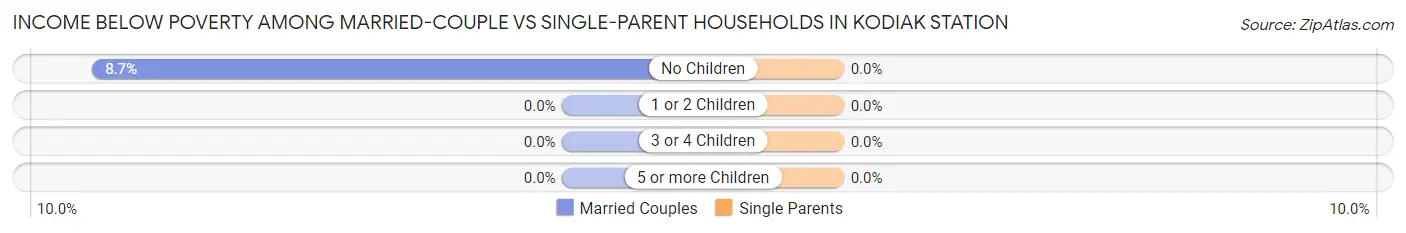
| Children | Married-Couple Families | Single-Parent Households |
| No Children | 18 (8.7%) | 0 (0.0%) |
| 1 or 2 Children | 0 (0.0%) | 0 (0.0%) |
| 3 or 4 Children | 0 (0.0%) | 0 (0.0%) |
| 5 or more Children | 0 (0.0%) | 0 (0.0%) |
| Total | 18 (3.4%) | 0 (0.0%) |
Race in Kodiak Station
The most populous races in Kodiak Station are White / Caucasian (1,564 | 74.0%), Two or more Races (388 | 18.4%), and Hispanic or Latino (283 | 13.4%).
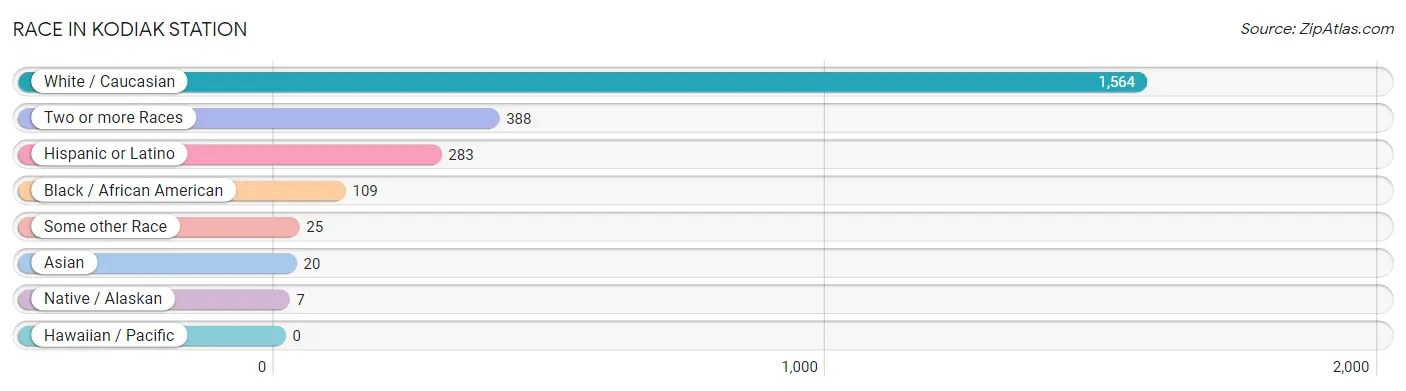
| Race | # Population | % Population |
| Asian | 20 | 0.9% |
| Black / African American | 109 | 5.2% |
| Hawaiian / Pacific | 0 | 0.0% |
| Hispanic or Latino | 283 | 13.4% |
| Native / Alaskan | 7 | 0.3% |
| White / Caucasian | 1,564 | 74.0% |
| Two or more Races | 388 | 18.4% |
| Some other Race | 25 | 1.2% |
| Total | 2,113 | 100.0% |
Ancestry in Kodiak Station
The most populous ancestries reported in Kodiak Station are German (292 | 13.8%), English (290 | 13.7%), Mexican (209 | 9.9%), Italian (126 | 6.0%), and Dutch (120 | 5.7%), together accounting for 49.1% of all Kodiak Station residents.
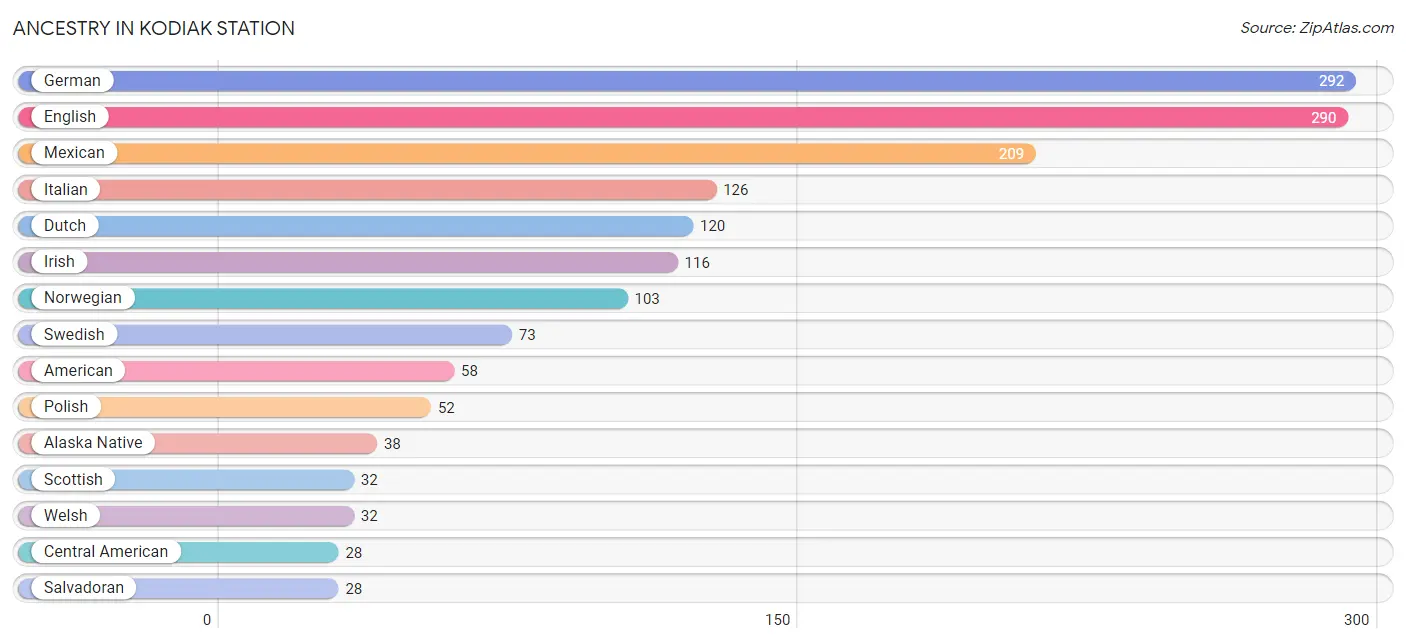
| Ancestry | # Population | % Population |
| Alaska Native | 38 | 1.8% |
| American | 58 | 2.7% |
| Belizean | 7 | 0.3% |
| Central American | 28 | 1.3% |
| Cherokee | 1 | 0.1% |
| Colombian | 1 | 0.1% |
| Dominican | 18 | 0.9% |
| Dutch | 120 | 5.7% |
| English | 290 | 13.7% |
| European | 22 | 1.0% |
| French | 9 | 0.4% |
| French Canadian | 16 | 0.8% |
| German | 292 | 13.8% |
| Greek | 15 | 0.7% |
| Irish | 116 | 5.5% |
| Italian | 126 | 6.0% |
| Jamaican | 1 | 0.1% |
| Korean | 25 | 1.2% |
| Mexican | 209 | 9.9% |
| Mexican American Indian | 1 | 0.1% |
| Navajo | 12 | 0.6% |
| Norwegian | 103 | 4.9% |
| Polish | 52 | 2.5% |
| Portuguese | 22 | 1.0% |
| Puerto Rican | 27 | 1.3% |
| Russian | 27 | 1.3% |
| Salvadoran | 28 | 1.3% |
| Scottish | 32 | 1.5% |
| South American | 1 | 0.1% |
| Swedish | 73 | 3.5% |
| Swiss | 6 | 0.3% |
| Welsh | 32 | 1.5% |
| Yugoslavian | 17 | 0.8% | View All 33 Rows |
Immigrants in Kodiak Station
The most numerous immigrant groups reported in Kodiak Station came from Asia (20 | 0.9%), Philippines (20 | 0.9%), South Eastern Asia (20 | 0.9%), Latin America (19 | 0.9%), and Central America (17 | 0.8%), together accounting for 4.5% of all Kodiak Station residents.
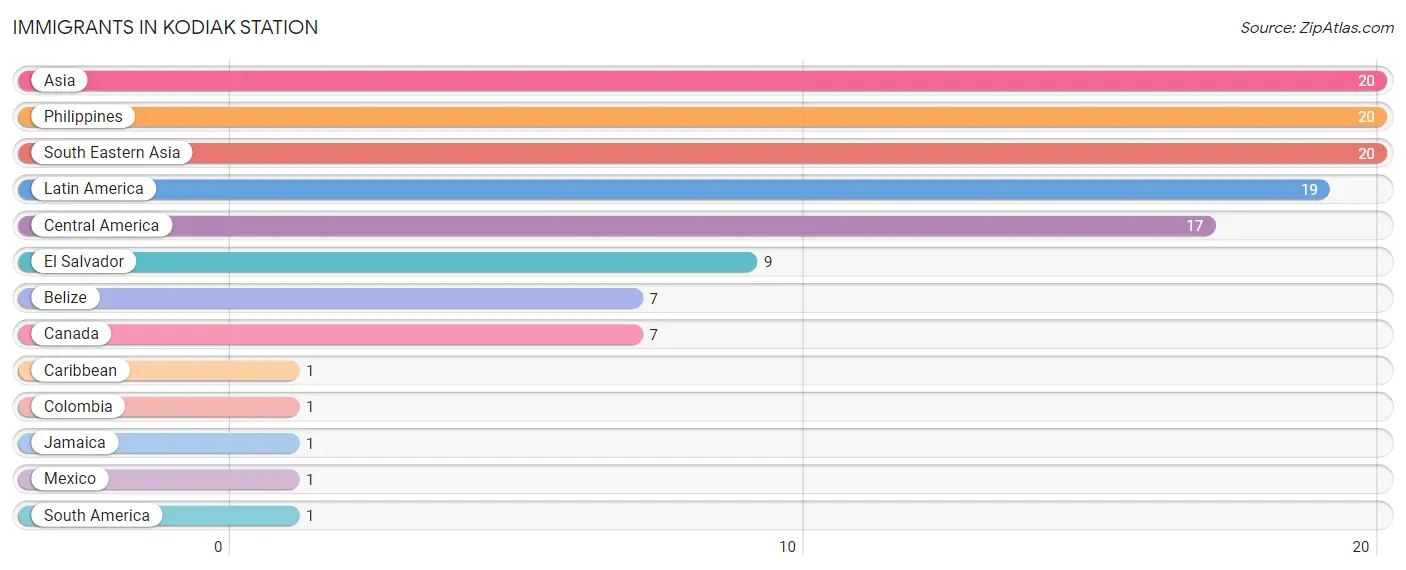
| Immigration Origin | # Population | % Population |
| Asia | 20 | 0.9% |
| Belize | 7 | 0.3% |
| Canada | 7 | 0.3% |
| Caribbean | 1 | 0.1% |
| Central America | 17 | 0.8% |
| Colombia | 1 | 0.1% |
| El Salvador | 9 | 0.4% |
| Jamaica | 1 | 0.1% |
| Latin America | 19 | 0.9% |
| Mexico | 1 | 0.1% |
| Philippines | 20 | 0.9% |
| South America | 1 | 0.1% |
| South Eastern Asia | 20 | 0.9% | View All 13 Rows |
Sex and Age in Kodiak Station
Sex and Age in Kodiak Station
The most populous age groups in Kodiak Station are 20 to 24 Years (229 | 19.6%) for men and 25 to 29 Years (243 | 25.8%) for women.
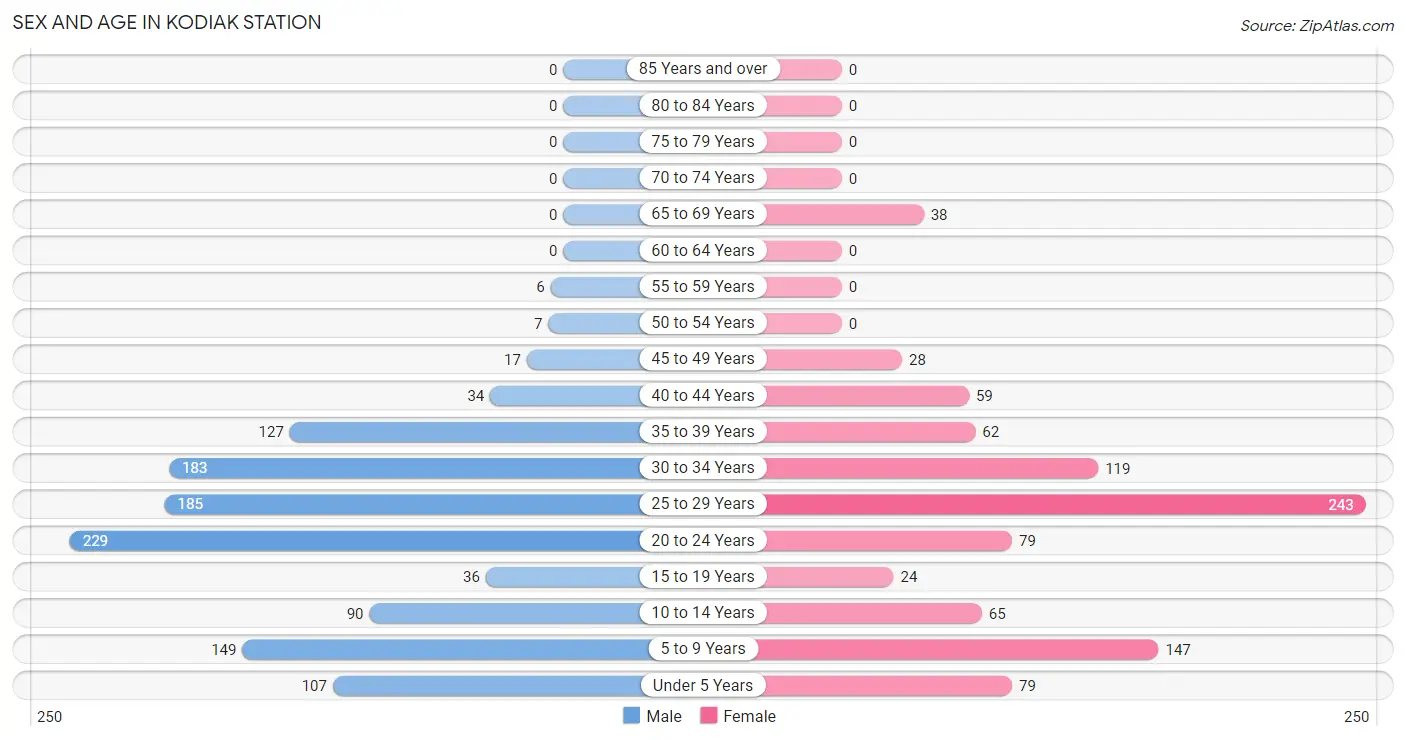
| Age Bracket | Male | Female |
| Under 5 Years | 107 (9.1%) | 79 (8.4%) |
| 5 to 9 Years | 149 (12.7%) | 147 (15.6%) |
| 10 to 14 Years | 90 (7.7%) | 65 (6.9%) |
| 15 to 19 Years | 36 (3.1%) | 24 (2.5%) |
| 20 to 24 Years | 229 (19.6%) | 79 (8.4%) |
| 25 to 29 Years | 185 (15.8%) | 243 (25.8%) |
| 30 to 34 Years | 183 (15.6%) | 119 (12.6%) |
| 35 to 39 Years | 127 (10.8%) | 62 (6.6%) |
| 40 to 44 Years | 34 (2.9%) | 59 (6.3%) |
| 45 to 49 Years | 17 (1.5%) | 28 (3.0%) |
| 50 to 54 Years | 7 (0.6%) | 0 (0.0%) |
| 55 to 59 Years | 6 (0.5%) | 0 (0.0%) |
| 60 to 64 Years | 0 (0.0%) | 0 (0.0%) |
| 65 to 69 Years | 0 (0.0%) | 38 (4.0%) |
| 70 to 74 Years | 0 (0.0%) | 0 (0.0%) |
| 75 to 79 Years | 0 (0.0%) | 0 (0.0%) |
| 80 to 84 Years | 0 (0.0%) | 0 (0.0%) |
| 85 Years and over | 0 (0.0%) | 0 (0.0%) |
| Total | 1,170 (100.0%) | 943 (100.0%) |
Families and Households in Kodiak Station
Median Family Size in Kodiak Station
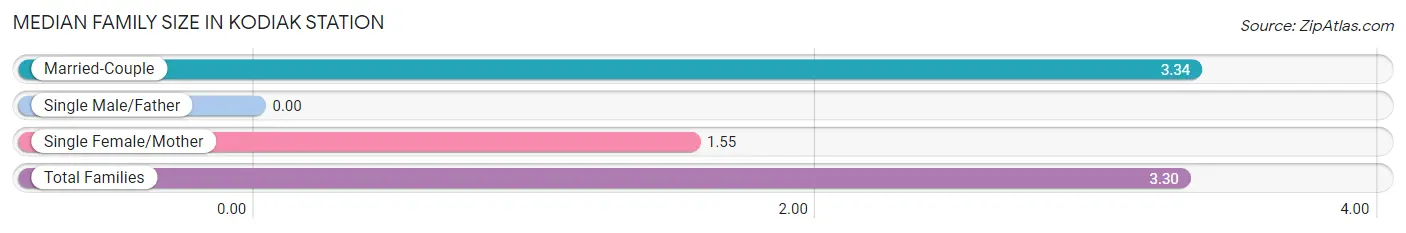
| Family Type | # Families | Family Size |
| Married-Couple | 537 (98.0%) | 3.34 |
| Single Male/Father | 0 (0.0%) | - |
| Single Female/Mother | 11 (2.0%) | 1.55 |
| Total Families | 548 (100.0%) | 3.30 |
Median Household Size in Kodiak Station
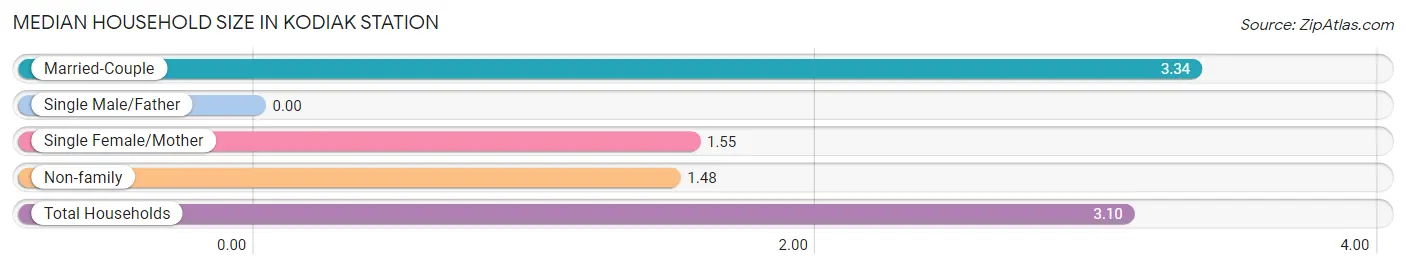
| Household Type | # Households | Household Size |
| Married-Couple | 537 (87.0%) | 3.34 |
| Single Male/Father | 0 (0.0%) | - |
| Single Female/Mother | 11 (1.8%) | 1.55 |
| Non-family | 69 (11.2%) | 1.48 |
| Total Households | 617 (100.0%) | 3.10 |
Household Size by Marriage Status in Kodiak Station
Out of a total of 617 households in Kodiak Station, 548 (88.8%) are family households, while 69 (11.2%) are nonfamily households. The most numerous type of family households are 2-person households, comprising 215, and the most common type of nonfamily households are 1-person households, comprising 38.
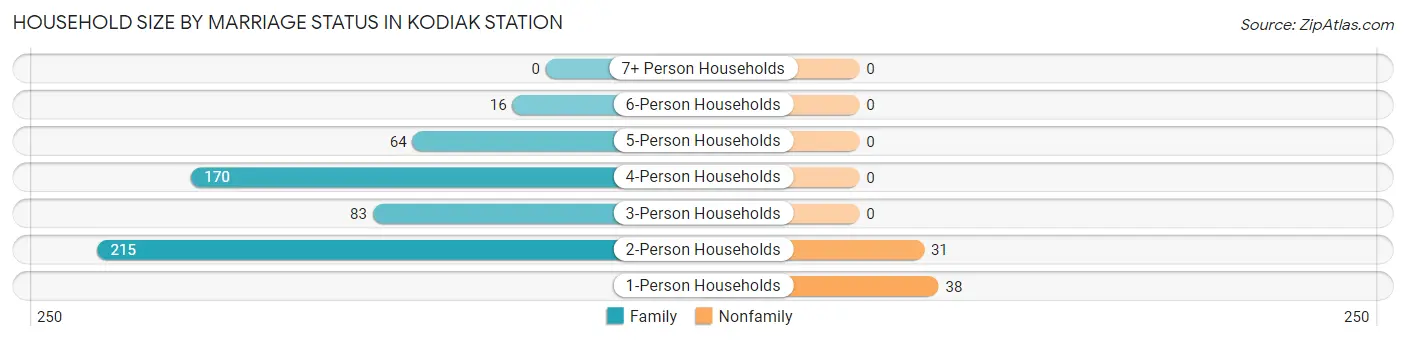
| Household Size | Family Households | Nonfamily Households |
| 1-Person Households | - | 38 (6.2%) |
| 2-Person Households | 215 (34.8%) | 31 (5.0%) |
| 3-Person Households | 83 (13.5%) | 0 (0.0%) |
| 4-Person Households | 170 (27.6%) | 0 (0.0%) |
| 5-Person Households | 64 (10.4%) | 0 (0.0%) |
| 6-Person Households | 16 (2.6%) | 0 (0.0%) |
| 7+ Person Households | 0 (0.0%) | 0 (0.0%) |
| Total | 548 (88.8%) | 69 (11.2%) |
Female Fertility in Kodiak Station
Fertility by Age in Kodiak Station
Average fertility rate in Kodiak Station is 107.0 births per 1,000 women. Women in the age bracket of 20 to 34 years have the highest fertility rate with 136.0 births per 1,000 women. Women in the age bracket of 20 to 34 years acount for 90.9% of all women with births.
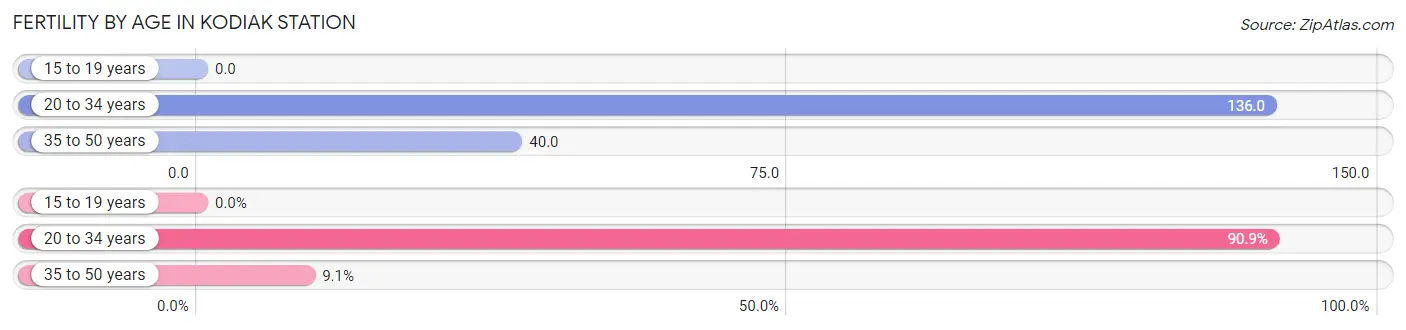
| Age Bracket | Women with Births | Births / 1,000 Women |
| 15 to 19 years | 0 (0.0%) | 0.0 |
| 20 to 34 years | 60 (90.9%) | 136.0 |
| 35 to 50 years | 6 (9.1%) | 40.0 |
| Total | 66 (100.0%) | 107.0 |
Fertility by Age by Marriage Status in Kodiak Station
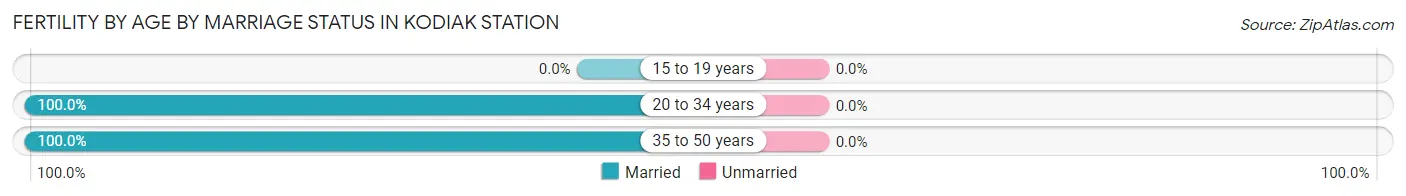
| Age Bracket | Married | Unmarried |
| 15 to 19 years | 0 (0.0%) | 0 (0.0%) |
| 20 to 34 years | 60 (100.0%) | 0 (0.0%) |
| 35 to 50 years | 6 (100.0%) | 0 (0.0%) |
| Total | 66 (100.0%) | 0 (0.0%) |
Fertility by Education in Kodiak Station
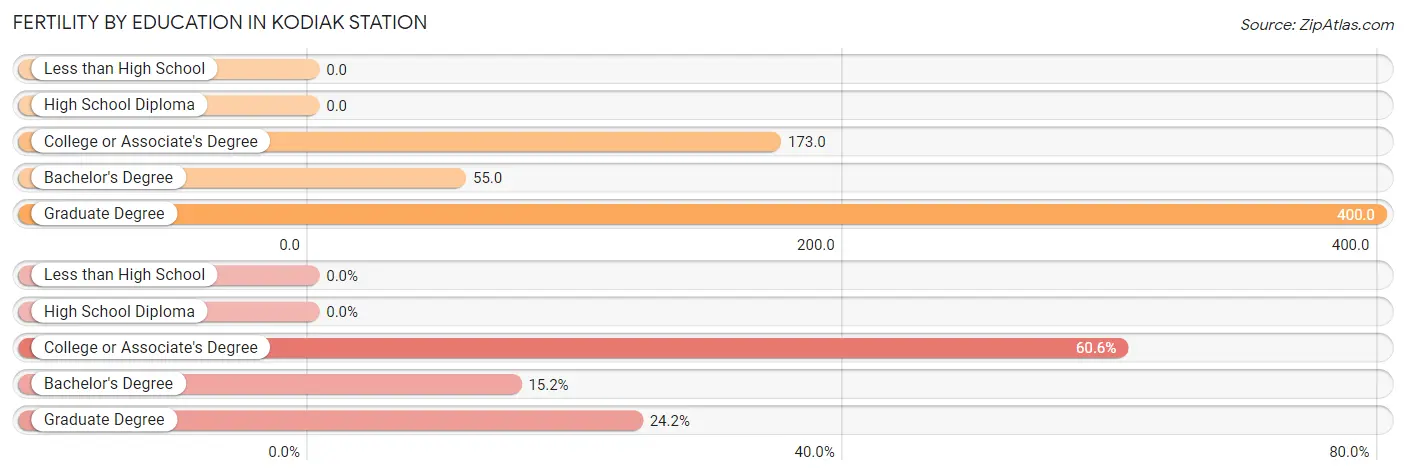
| Educational Attainment | Women with Births | Births / 1,000 Women |
| Less than High School | 0 (0.0%) | 0.0 |
| High School Diploma | 0 (0.0%) | 0.0 |
| College or Associate's Degree | 40 (60.6%) | 173.0 |
| Bachelor's Degree | 10 (15.1%) | 55.0 |
| Graduate Degree | 16 (24.2%) | 400.0 |
| Total | 66 (100.0%) | 107.0 |
Fertility by Education by Marriage Status in Kodiak Station
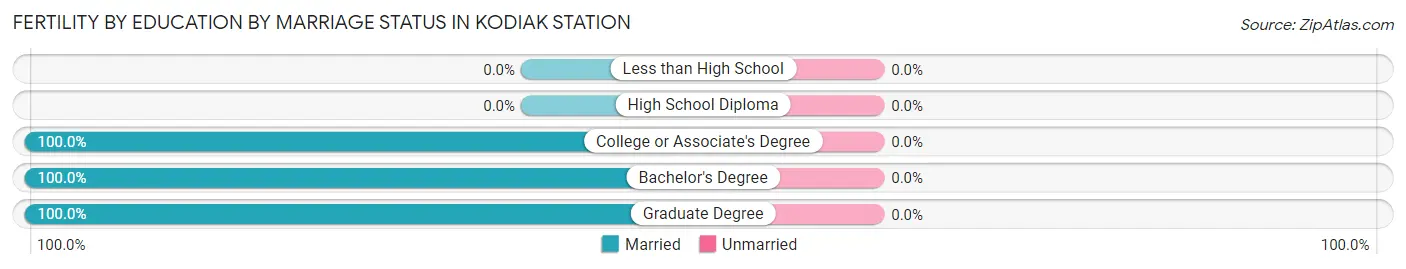
| Educational Attainment | Married | Unmarried |
| Less than High School | 0 (0.0%) | 0 (0.0%) |
| High School Diploma | 0 (0.0%) | 0 (0.0%) |
| College or Associate's Degree | 40 (100.0%) | 0 (0.0%) |
| Bachelor's Degree | 10 (100.0%) | 0 (0.0%) |
| Graduate Degree | 16 (100.0%) | 0 (0.0%) |
| Total | 66 (100.0%) | 0 (0.0%) |
Employment Characteristics in Kodiak Station
Employment by Class of Employer in Kodiak Station
Among the 1,155 employed individuals in Kodiak Station, federal government employees (859 | 74.4%), private company employees (166 | 14.4%), and not-for-profit organizations (45 | 3.9%) make up the most common classes of employment.
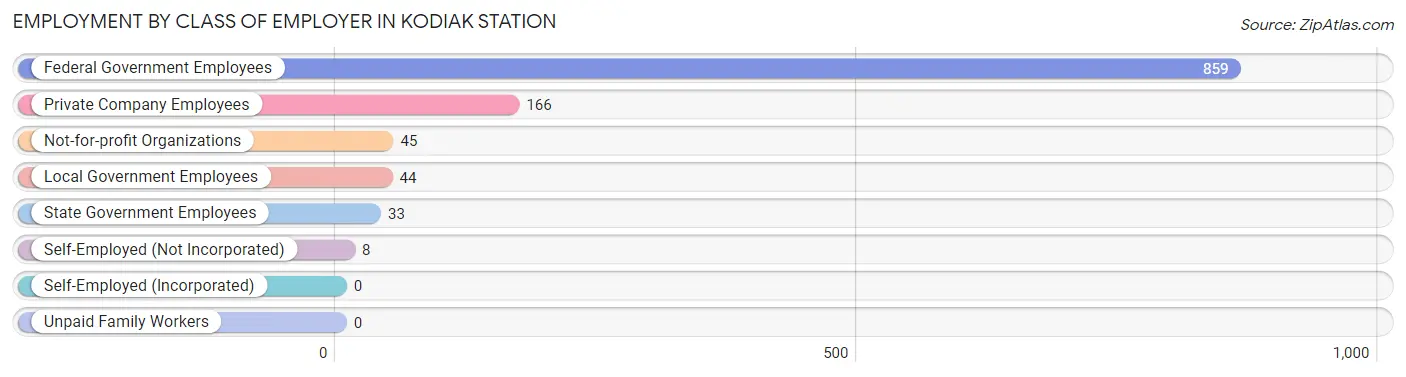
| Employer Class | # Employees | % Employees |
| Private Company Employees | 166 | 14.4% |
| Self-Employed (Incorporated) | 0 | 0.0% |
| Self-Employed (Not Incorporated) | 8 | 0.7% |
| Not-for-profit Organizations | 45 | 3.9% |
| Local Government Employees | 44 | 3.8% |
| State Government Employees | 33 | 2.9% |
| Federal Government Employees | 859 | 74.4% |
| Unpaid Family Workers | 0 | 0.0% |
| Total | 1,155 | 100.0% |
Employment Status by Age in Kodiak Station
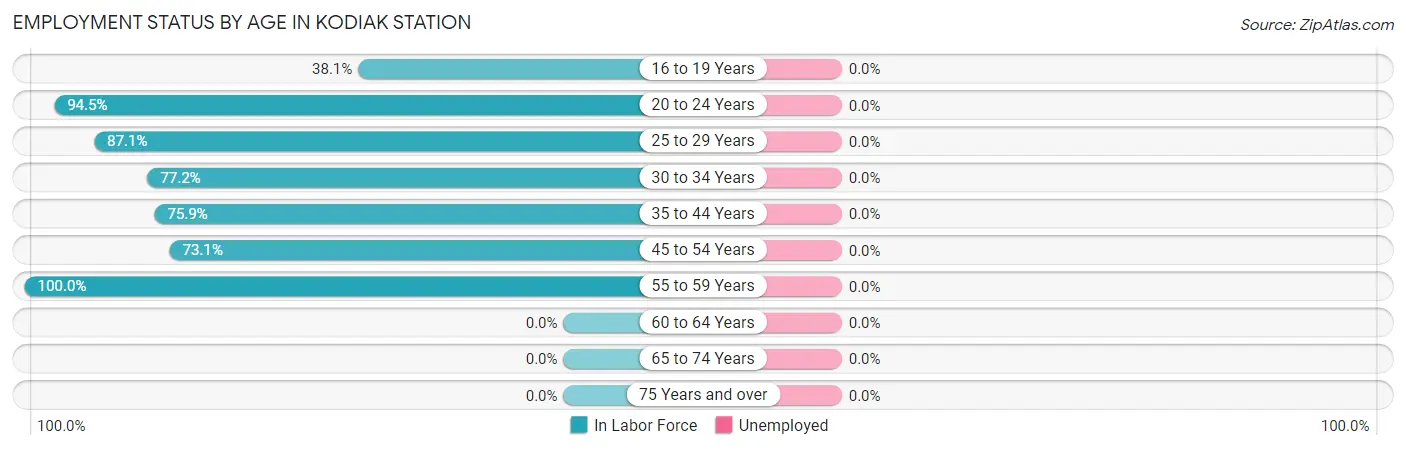
| Age Bracket | In Labor Force | Unemployed |
| 16 to 19 Years | 16 (38.1%) | 0 (0.0%) |
| 20 to 24 Years | 291 (94.5%) | 0 (0.0%) |
| 25 to 29 Years | 373 (87.1%) | 0 (0.0%) |
| 30 to 34 Years | 233 (77.2%) | 0 (0.0%) |
| 35 to 44 Years | 214 (75.9%) | 0 (0.0%) |
| 45 to 54 Years | 38 (73.1%) | 0 (0.0%) |
| 55 to 59 Years | 6 (100.0%) | 0 (0.0%) |
| 60 to 64 Years | 0 (0.0%) | 0 (0.0%) |
| 65 to 74 Years | 0 (0.0%) | 0 (0.0%) |
| 75 Years and over | 0 (0.0%) | 0 (0.0%) |
| Total | 1,171 (80.3%) | 0 (0.0%) |
Employment Status by Educational Attainment in Kodiak Station
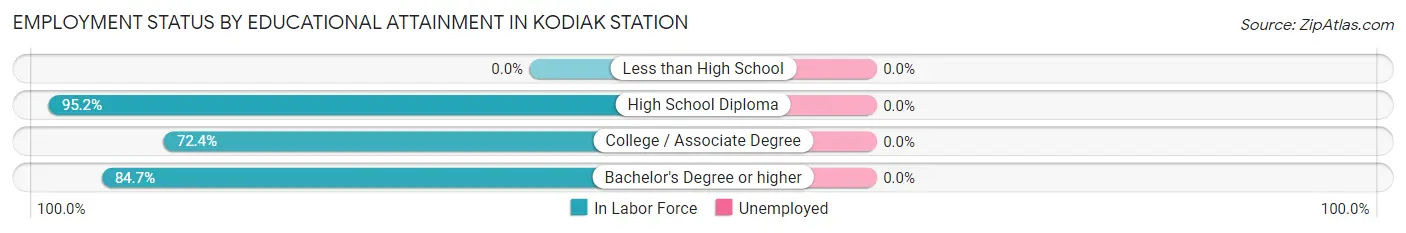
| Educational Attainment | In Labor Force | Unemployed |
| Less than High School | 0 (0.0%) | 0 (0.0%) |
| High School Diploma | 217 (95.2%) | 0 (0.0%) |
| College / Associate Degree | 349 (72.4%) | 0 (0.0%) |
| Bachelor's Degree or higher | 298 (84.7%) | 0 (0.0%) |
| Total | 863 (80.7%) | 0 (0.0%) |
Employment Occupations by Sex in Kodiak Station
Management, Business, Science and Arts Occupations
The most common Management, Business, Science and Arts occupations in Kodiak Station are Community & Social Service (125 | 24.9%), Education Instruction & Library (107 | 21.4%), Business & Financial (35 | 7.0%), Health Diagnosing & Treating (24 | 4.8%), and Health Technologists (24 | 4.8%).
Management, Business, Science and Arts Occupations by Sex
Within the Management, Business, Science and Arts occupations in Kodiak Station, the most male-oriented occupations are Life, Physical & Social Science (100.0%), Arts, Media & Entertainment (100.0%), and Computers, Engineering & Science (54.5%), while the most female-oriented occupations are Computers & Mathematics (100.0%), Education, Arts & Media (100.0%), and Legal Services & Support (100.0%).
| Occupation | Male | Female |
| Management | 6 (33.3%) | 12 (66.7%) |
| Business & Financial | 17 (48.6%) | 18 (51.4%) |
| Computers, Engineering & Science | 6 (54.5%) | 5 (45.5%) |
| Computers & Mathematics | 0 (0.0%) | 5 (100.0%) |
| Architecture & Engineering | 0 (0.0%) | 0 (0.0%) |
| Life, Physical & Social Science | 6 (100.0%) | 0 (0.0%) |
| Community & Social Service | 7 (5.6%) | 118 (94.4%) |
| Education, Arts & Media | 0 (0.0%) | 5 (100.0%) |
| Legal Services & Support | 0 (0.0%) | 6 (100.0%) |
| Education Instruction & Library | 0 (0.0%) | 107 (100.0%) |
| Arts, Media & Entertainment | 7 (100.0%) | 0 (0.0%) |
| Health Diagnosing & Treating | 7 (29.2%) | 17 (70.8%) |
| Health Technologists | 7 (29.2%) | 17 (70.8%) |
| Total (Category) | 43 (20.2%) | 170 (79.8%) |
| Total (Overall) | 177 (35.3%) | 324 (64.7%) |
Services Occupations
The most common Services occupations in Kodiak Station are Food Preparation & Serving (16 | 3.2%), Personal Care & Service (5 | 1.0%), Security & Protection (2 | 0.4%), and Law Enforcement (2 | 0.4%).
Services Occupations by Sex
| Occupation | Male | Female |
| Healthcare Support | 0 (0.0%) | 0 (0.0%) |
| Security & Protection | 0 (0.0%) | 2 (100.0%) |
| Firefighting & Prevention | 0 (0.0%) | 0 (0.0%) |
| Law Enforcement | 0 (0.0%) | 2 (100.0%) |
| Food Preparation & Serving | 1 (6.2%) | 15 (93.8%) |
| Cleaning & Maintenance | 0 (0.0%) | 0 (0.0%) |
| Personal Care & Service | 0 (0.0%) | 5 (100.0%) |
| Total (Category) | 1 (4.3%) | 22 (95.7%) |
| Total (Overall) | 177 (35.3%) | 324 (64.7%) |
Sales and Office Occupations
The most common Sales and Office occupations in Kodiak Station are Sales & Related (62 | 12.4%), and Office & Administration (46 | 9.2%).
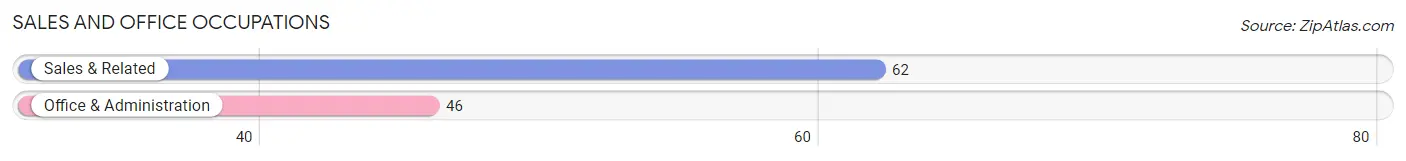
Sales and Office Occupations by Sex
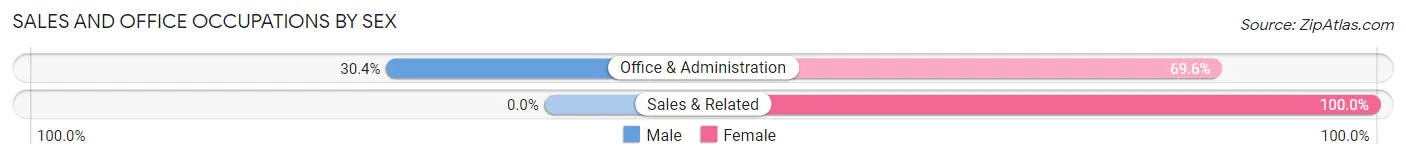
| Occupation | Male | Female |
| Sales & Related | 0 (0.0%) | 62 (100.0%) |
| Office & Administration | 14 (30.4%) | 32 (69.6%) |
| Total (Category) | 14 (13.0%) | 94 (87.0%) |
| Total (Overall) | 177 (35.3%) | 324 (64.7%) |
Natural Resources, Construction and Maintenance Occupations
The most common Natural Resources, Construction and Maintenance occupations in Kodiak Station are Construction & Extraction (63 | 12.6%), and Installation, Maintenance & Repair (35 | 7.0%).
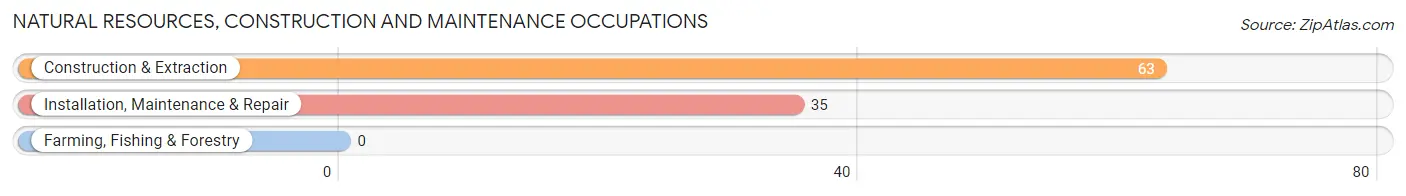
Natural Resources, Construction and Maintenance Occupations by Sex
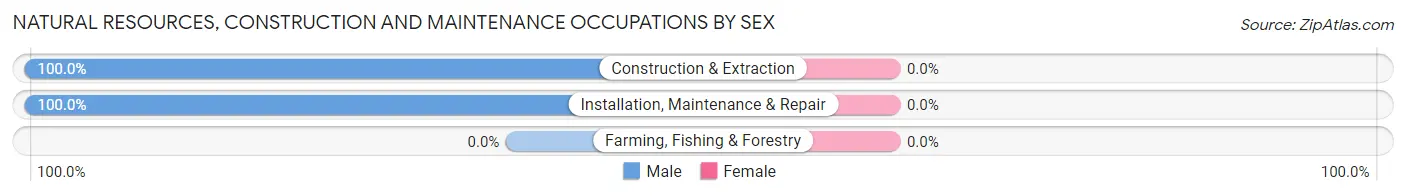
| Occupation | Male | Female |
| Farming, Fishing & Forestry | 0 (0.0%) | 0 (0.0%) |
| Construction & Extraction | 63 (100.0%) | 0 (0.0%) |
| Installation, Maintenance & Repair | 35 (100.0%) | 0 (0.0%) |
| Total (Category) | 98 (100.0%) | 0 (0.0%) |
| Total (Overall) | 177 (35.3%) | 324 (64.7%) |
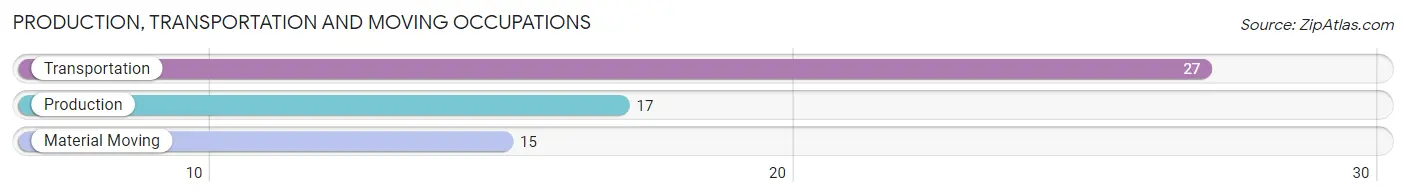
Production, Transportation and Moving Occupations
The most common Production, Transportation and Moving occupations in Kodiak Station are Transportation (27 | 5.4%), Production (17 | 3.4%), and Material Moving (15 | 3.0%).
Production, Transportation and Moving Occupations by Sex
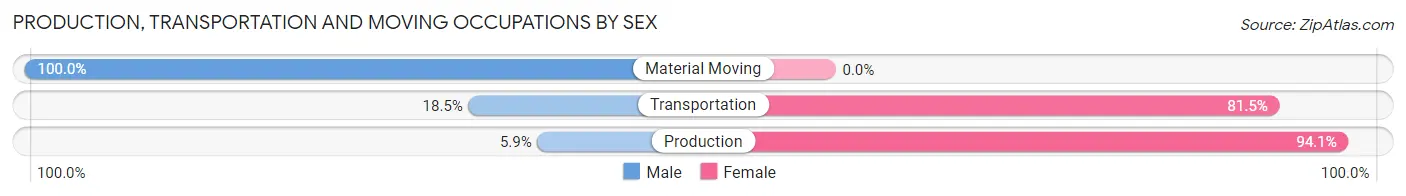
| Occupation | Male | Female |
| Production | 1 (5.9%) | 16 (94.1%) |
| Transportation | 5 (18.5%) | 22 (81.5%) |
| Material Moving | 15 (100.0%) | 0 (0.0%) |
| Total (Category) | 21 (35.6%) | 38 (64.4%) |
| Total (Overall) | 177 (35.3%) | 324 (64.7%) |
Employment Industries by Sex in Kodiak Station
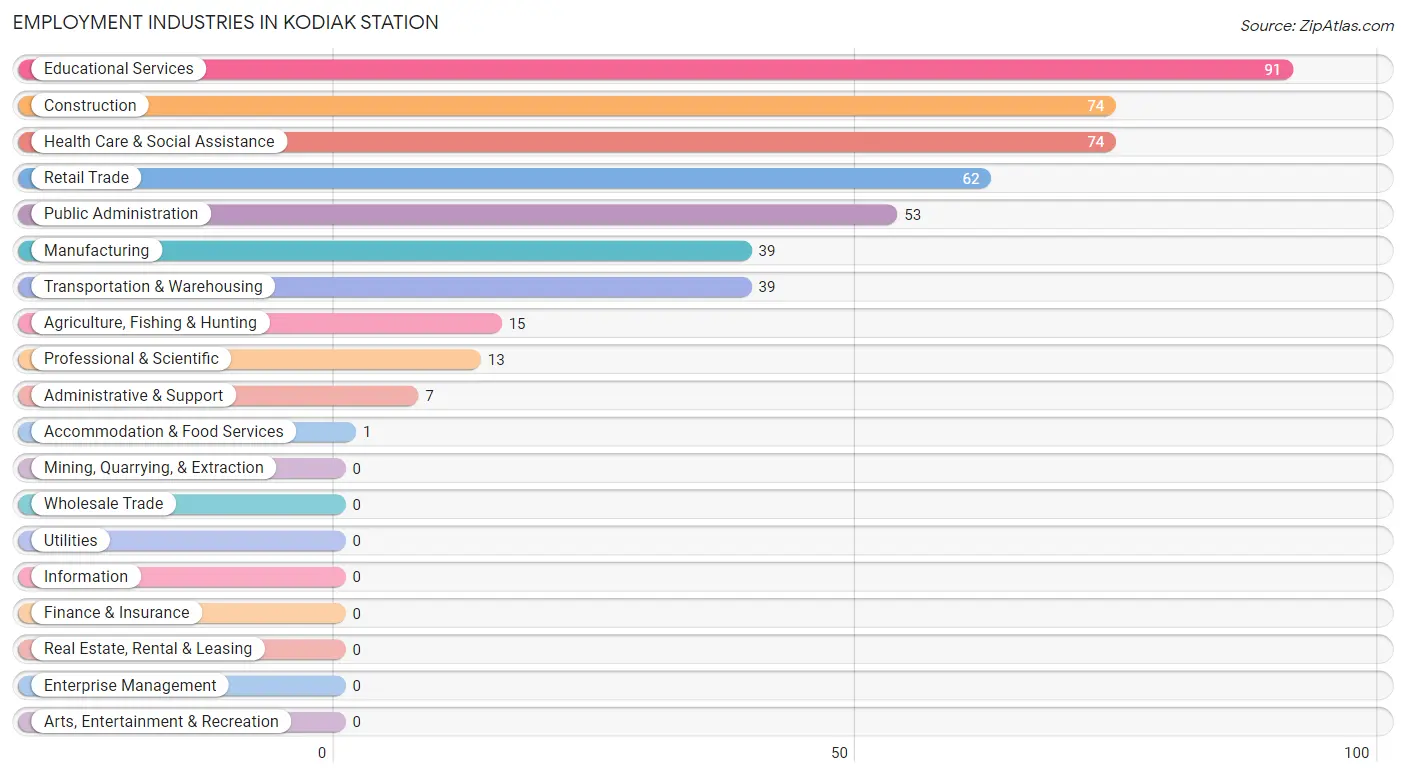
Employment Industries in Kodiak Station
The major employment industries in Kodiak Station include Educational Services (91 | 18.2%), Construction (74 | 14.8%), Health Care & Social Assistance (74 | 14.8%), Retail Trade (62 | 12.4%), and Public Administration (53 | 10.6%).
Employment Industries by Sex in Kodiak Station
The Kodiak Station industries that see more men than women are Accommodation & Food Services (100.0%), Public Administration (96.2%), and Construction (82.4%), whereas the industries that tend to have a higher number of women are Agriculture, Fishing & Hunting (100.0%), Retail Trade (100.0%), and Administrative & Support (100.0%).
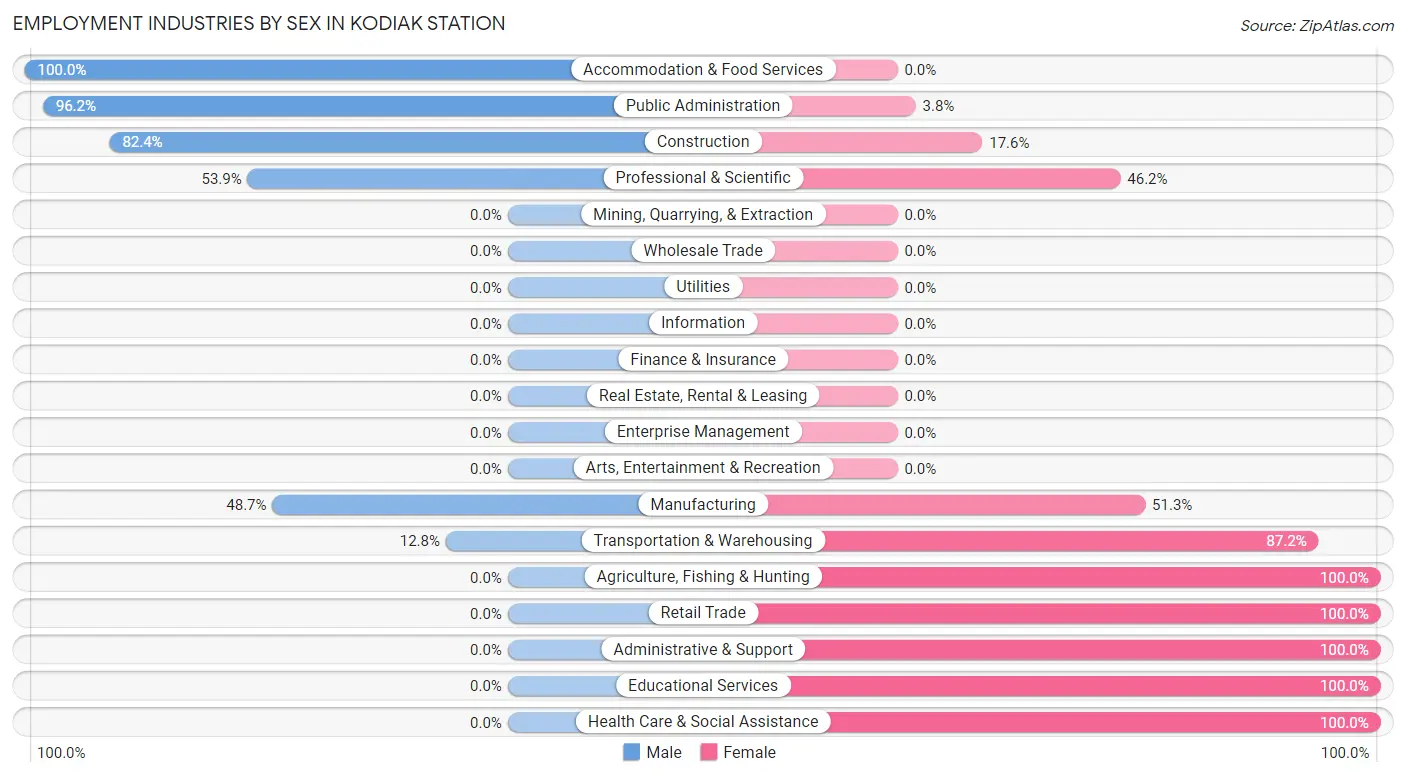
| Industry | Male | Female |
| Agriculture, Fishing & Hunting | 0 (0.0%) | 15 (100.0%) |
| Mining, Quarrying, & Extraction | 0 (0.0%) | 0 (0.0%) |
| Construction | 61 (82.4%) | 13 (17.6%) |
| Manufacturing | 19 (48.7%) | 20 (51.3%) |
| Wholesale Trade | 0 (0.0%) | 0 (0.0%) |
| Retail Trade | 0 (0.0%) | 62 (100.0%) |
| Transportation & Warehousing | 5 (12.8%) | 34 (87.2%) |
| Utilities | 0 (0.0%) | 0 (0.0%) |
| Information | 0 (0.0%) | 0 (0.0%) |
| Finance & Insurance | 0 (0.0%) | 0 (0.0%) |
| Real Estate, Rental & Leasing | 0 (0.0%) | 0 (0.0%) |
| Professional & Scientific | 7 (53.8%) | 6 (46.2%) |
| Enterprise Management | 0 (0.0%) | 0 (0.0%) |
| Administrative & Support | 0 (0.0%) | 7 (100.0%) |
| Educational Services | 0 (0.0%) | 91 (100.0%) |
| Health Care & Social Assistance | 0 (0.0%) | 74 (100.0%) |
| Arts, Entertainment & Recreation | 0 (0.0%) | 0 (0.0%) |
| Accommodation & Food Services | 1 (100.0%) | 0 (0.0%) |
| Public Administration | 51 (96.2%) | 2 (3.8%) |
| Total | 177 (35.3%) | 324 (64.7%) |
Education in Kodiak Station
School Enrollment in Kodiak Station
The most common levels of schooling among the 619 students in Kodiak Station are elementary school (191 | 30.9%), middle school (125 | 20.2%), and college / undergraduate (107 | 17.3%).
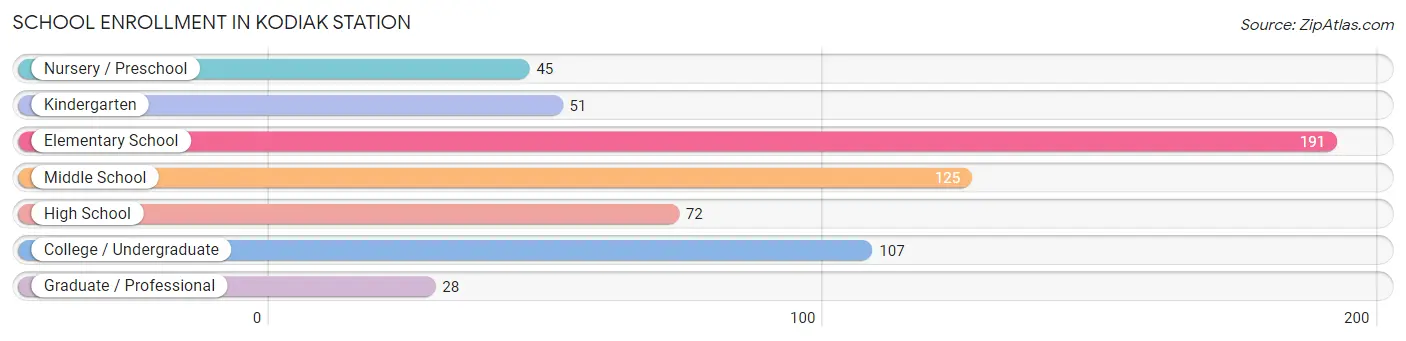
| School Level | # Students | % Students |
| Nursery / Preschool | 45 | 7.3% |
| Kindergarten | 51 | 8.2% |
| Elementary School | 191 | 30.9% |
| Middle School | 125 | 20.2% |
| High School | 72 | 11.6% |
| College / Undergraduate | 107 | 17.3% |
| Graduate / Professional | 28 | 4.5% |
| Total | 619 | 100.0% |
School Enrollment by Age by Funding Source in Kodiak Station
Out of a total of 619 students who are enrolled in schools in Kodiak Station, 147 (23.7%) attend a private institution, while the remaining 472 (76.3%) are enrolled in public schools. The age group of 3 to 4 year olds has the highest likelihood of being enrolled in private schools, with 11 (73.3% in the age bracket) enrolled. Conversely, the age group of 35 years and over has the lowest likelihood of being enrolled in a private school, with 8 (100.0% in the age bracket) attending a public institution.
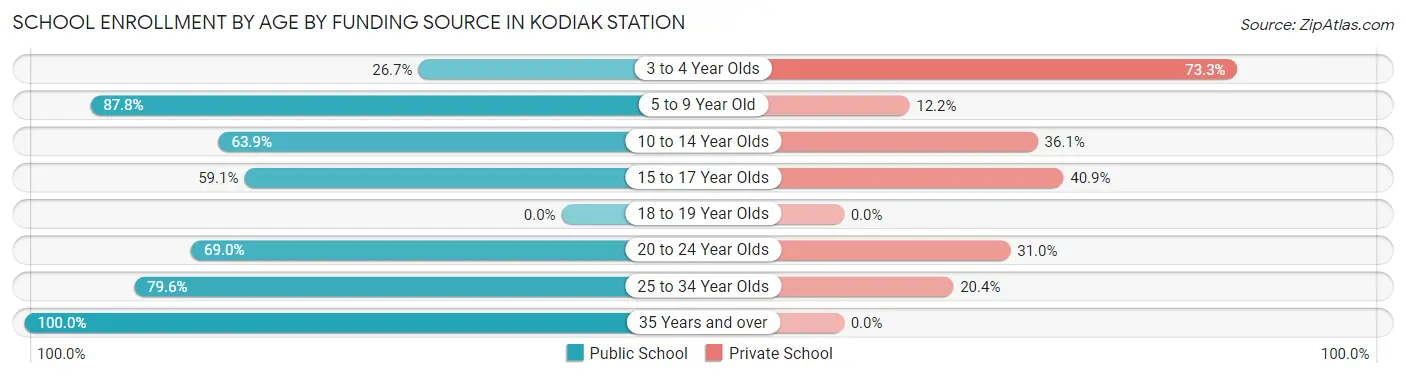
| Age Bracket | Public School | Private School |
| 3 to 4 Year Olds | 4 (26.7%) | 11 (73.3%) |
| 5 to 9 Year Old | 237 (87.8%) | 33 (12.2%) |
| 10 to 14 Year Olds | 99 (63.9%) | 56 (36.1%) |
| 15 to 17 Year Olds | 26 (59.1%) | 18 (40.9%) |
| 18 to 19 Year Olds | 0 (0.0%) | 0 (0.0%) |
| 20 to 24 Year Olds | 20 (69.0%) | 9 (31.0%) |
| 25 to 34 Year Olds | 78 (79.6%) | 20 (20.4%) |
| 35 Years and over | 8 (100.0%) | 0 (0.0%) |
| Total | 472 (76.3%) | 147 (23.7%) |
Educational Attainment by Field of Study in Kodiak Station
Education (113 | 27.2%), arts & humanities (77 | 18.5%), science & technology (40 | 9.6%), business (39 | 9.4%), and computers & mathematics (27 | 6.5%) are the most common fields of study among 416 individuals in Kodiak Station who have obtained a bachelor's degree or higher.
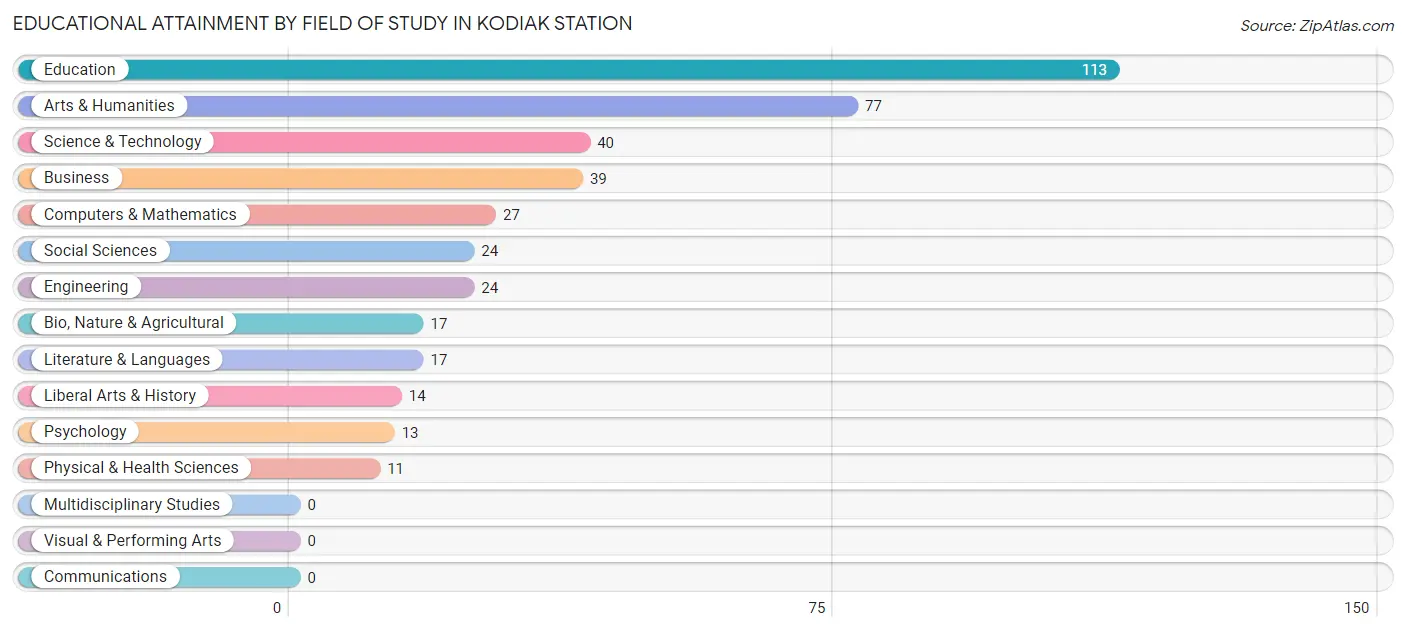
| Field of Study | # Graduates | % Graduates |
| Computers & Mathematics | 27 | 6.5% |
| Bio, Nature & Agricultural | 17 | 4.1% |
| Physical & Health Sciences | 11 | 2.6% |
| Psychology | 13 | 3.1% |
| Social Sciences | 24 | 5.8% |
| Engineering | 24 | 5.8% |
| Multidisciplinary Studies | 0 | 0.0% |
| Science & Technology | 40 | 9.6% |
| Business | 39 | 9.4% |
| Education | 113 | 27.2% |
| Literature & Languages | 17 | 4.1% |
| Liberal Arts & History | 14 | 3.4% |
| Visual & Performing Arts | 0 | 0.0% |
| Communications | 0 | 0.0% |
| Arts & Humanities | 77 | 18.5% |
| Total | 416 | 100.0% |
Transportation & Commute in Kodiak Station
Vehicle Availability by Sex in Kodiak Station
The most prevalent vehicle ownership categories in Kodiak Station are males with 2 vehicles (284, accounting for 45.5%) and females with 2 vehicles (215, making up 86.6%).
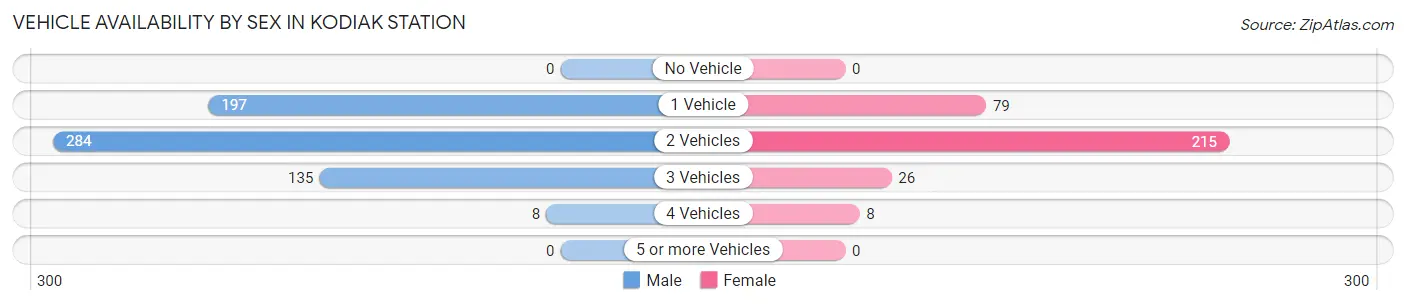
| Vehicles Available | Male | Female |
| No Vehicle | 0 (0.0%) | 0 (0.0%) |
| 1 Vehicle | 197 (31.6%) | 79 (24.1%) |
| 2 Vehicles | 284 (45.5%) | 215 (65.5%) |
| 3 Vehicles | 135 (21.6%) | 26 (7.9%) |
| 4 Vehicles | 8 (1.3%) | 8 (2.4%) |
| 5 or more Vehicles | 0 (0.0%) | 0 (0.0%) |
| Total | 624 (100.0%) | 328 (100.0%) |
Commute Time in Kodiak Station
The most frequently occuring commute durations in Kodiak Station are 5 to 9 minutes (381 commuters, 33.6%), 10 to 14 minutes (341 commuters, 30.0%), and less than 5 minutes (215 commuters, 18.9%).

| Commute Time | # Commuters | % Commuters |
| Less than 5 Minutes | 215 | 18.9% |
| 5 to 9 Minutes | 381 | 33.6% |
| 10 to 14 Minutes | 341 | 30.0% |
| 15 to 19 Minutes | 185 | 16.3% |
| 20 to 24 Minutes | 5 | 0.4% |
| 25 to 29 Minutes | 0 | 0.0% |
| 30 to 34 Minutes | 8 | 0.7% |
| 35 to 39 Minutes | 0 | 0.0% |
| 40 to 44 Minutes | 0 | 0.0% |
| 45 to 59 Minutes | 0 | 0.0% |
| 60 to 89 Minutes | 0 | 0.0% |
| 90 or more Minutes | 0 | 0.0% |
Commute Time by Sex in Kodiak Station
The most common commute times in Kodiak Station are 5 to 9 minutes (300 commuters, 39.1%) for males and 15 to 19 minutes (133 commuters, 36.2%) for females.
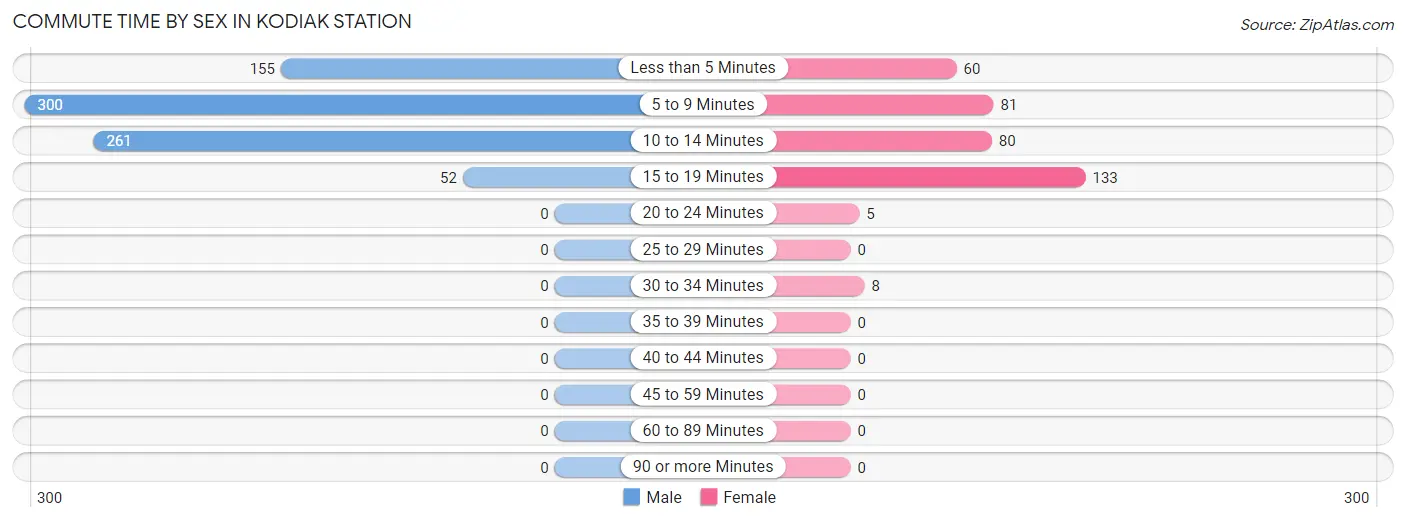
| Commute Time | Male | Female |
| Less than 5 Minutes | 155 (20.2%) | 60 (16.4%) |
| 5 to 9 Minutes | 300 (39.1%) | 81 (22.1%) |
| 10 to 14 Minutes | 261 (34.0%) | 80 (21.8%) |
| 15 to 19 Minutes | 52 (6.8%) | 133 (36.2%) |
| 20 to 24 Minutes | 0 (0.0%) | 5 (1.4%) |
| 25 to 29 Minutes | 0 (0.0%) | 0 (0.0%) |
| 30 to 34 Minutes | 0 (0.0%) | 8 (2.2%) |
| 35 to 39 Minutes | 0 (0.0%) | 0 (0.0%) |
| 40 to 44 Minutes | 0 (0.0%) | 0 (0.0%) |
| 45 to 59 Minutes | 0 (0.0%) | 0 (0.0%) |
| 60 to 89 Minutes | 0 (0.0%) | 0 (0.0%) |
| 90 or more Minutes | 0 (0.0%) | 0 (0.0%) |
Time of Departure to Work by Sex in Kodiak Station
The most frequent times of departure to work in Kodiak Station are 7:30 AM to 7:59 AM (231, 30.1%) for males and 7:00 AM to 7:29 AM (92, 25.1%) for females.
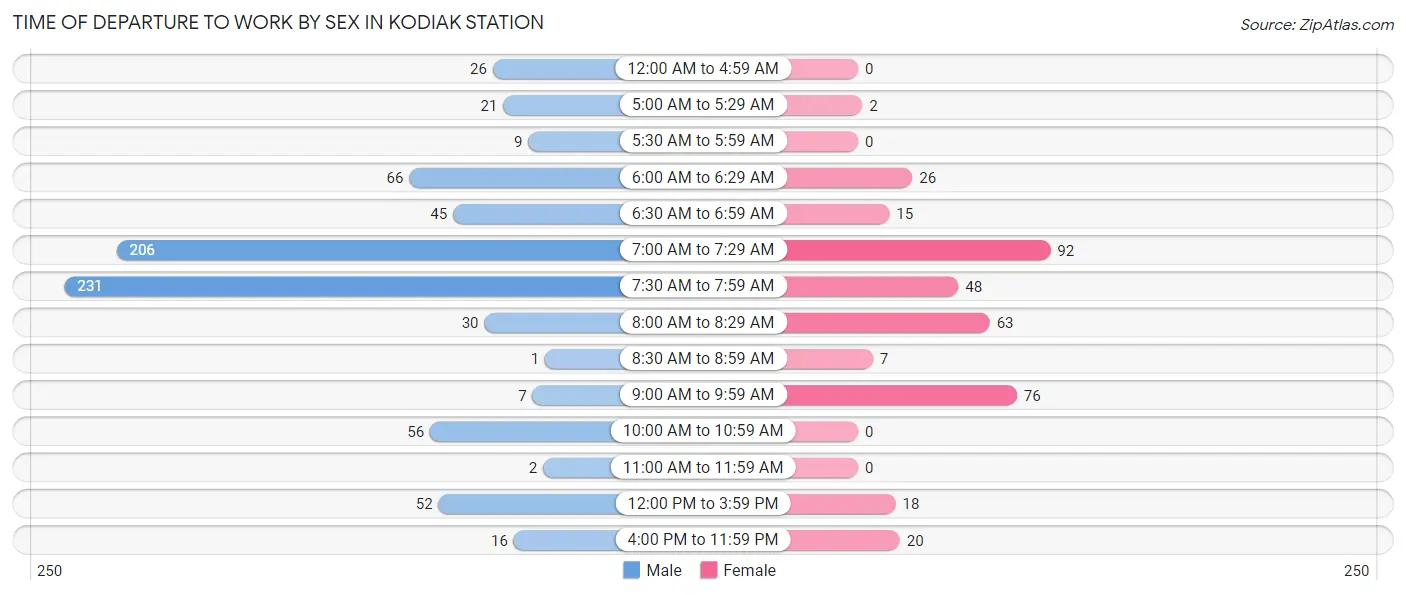
| Time of Departure | Male | Female |
| 12:00 AM to 4:59 AM | 26 (3.4%) | 0 (0.0%) |
| 5:00 AM to 5:29 AM | 21 (2.7%) | 2 (0.5%) |
| 5:30 AM to 5:59 AM | 9 (1.2%) | 0 (0.0%) |
| 6:00 AM to 6:29 AM | 66 (8.6%) | 26 (7.1%) |
| 6:30 AM to 6:59 AM | 45 (5.9%) | 15 (4.1%) |
| 7:00 AM to 7:29 AM | 206 (26.8%) | 92 (25.1%) |
| 7:30 AM to 7:59 AM | 231 (30.1%) | 48 (13.1%) |
| 8:00 AM to 8:29 AM | 30 (3.9%) | 63 (17.2%) |
| 8:30 AM to 8:59 AM | 1 (0.1%) | 7 (1.9%) |
| 9:00 AM to 9:59 AM | 7 (0.9%) | 76 (20.7%) |
| 10:00 AM to 10:59 AM | 56 (7.3%) | 0 (0.0%) |
| 11:00 AM to 11:59 AM | 2 (0.3%) | 0 (0.0%) |
| 12:00 PM to 3:59 PM | 52 (6.8%) | 18 (4.9%) |
| 4:00 PM to 11:59 PM | 16 (2.1%) | 20 (5.4%) |
| Total | 768 (100.0%) | 367 (100.0%) |
Housing Occupancy in Kodiak Station
Occupancy by Ownership in Kodiak Station
Of the total 617 dwellings in Kodiak Station, owner-occupied units account for 7 (1.1%), while renter-occupied units make up 610 (98.9%).
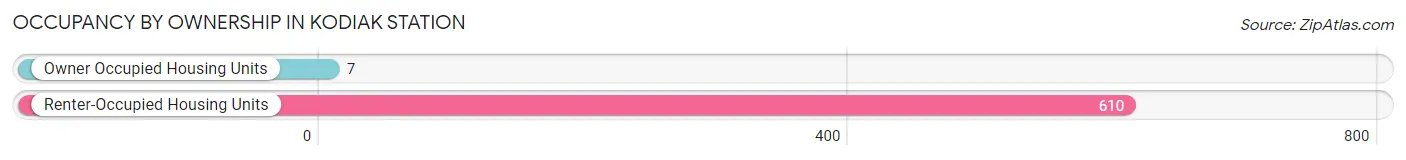
| Occupancy | # Housing Units | % Housing Units |
| Owner Occupied Housing Units | 7 | 1.1% |
| Renter-Occupied Housing Units | 610 | 98.9% |
| Total Occupied Housing Units | 617 | 100.0% |
Occupancy by Household Size in Kodiak Station
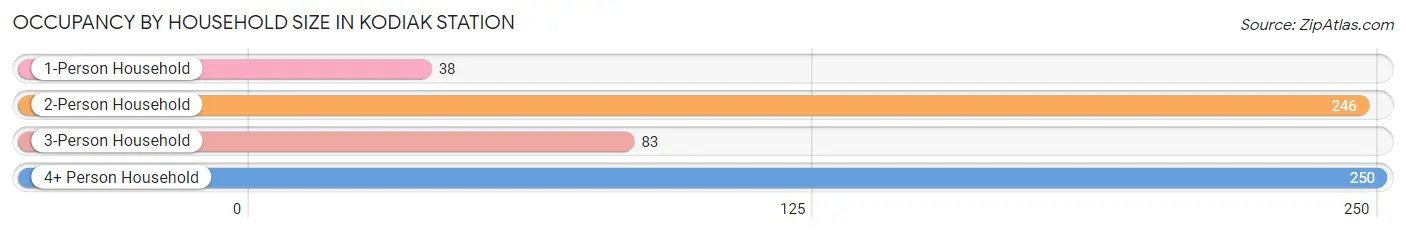
| Household Size | # Housing Units | % Housing Units |
| 1-Person Household | 38 | 6.2% |
| 2-Person Household | 246 | 39.9% |
| 3-Person Household | 83 | 13.5% |
| 4+ Person Household | 250 | 40.5% |
| Total Housing Units | 617 | 100.0% |
Occupancy by Ownership by Household Size in Kodiak Station
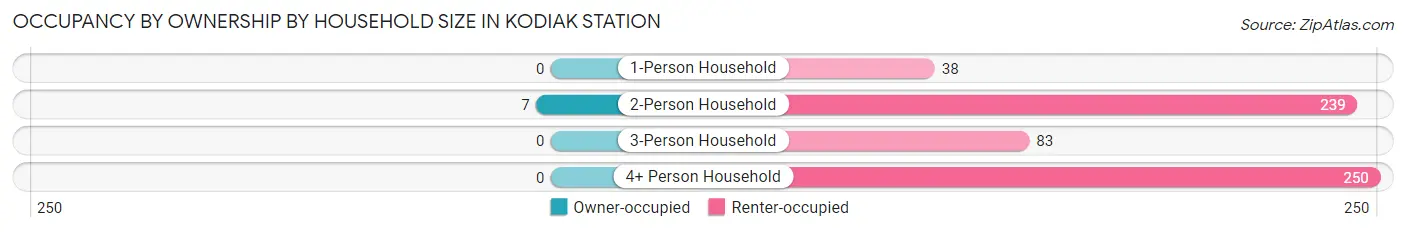
| Household Size | Owner-occupied | Renter-occupied |
| 1-Person Household | 0 (0.0%) | 38 (100.0%) |
| 2-Person Household | 7 (2.9%) | 239 (97.2%) |
| 3-Person Household | 0 (0.0%) | 83 (100.0%) |
| 4+ Person Household | 0 (0.0%) | 250 (100.0%) |
| Total Housing Units | 7 (1.1%) | 610 (98.9%) |
Occupancy by Educational Attainment in Kodiak Station
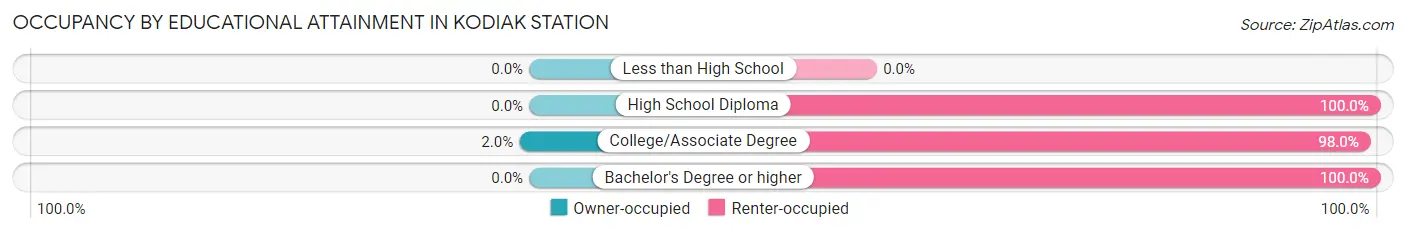
| Household Size | Owner-occupied | Renter-occupied |
| Less than High School | 0 (0.0%) | 0 (0.0%) |
| High School Diploma | 0 (0.0%) | 146 (100.0%) |
| College/Associate Degree | 7 (2.0%) | 346 (98.0%) |
| Bachelor's Degree or higher | 0 (0.0%) | 118 (100.0%) |
Occupancy by Age of Householder in Kodiak Station
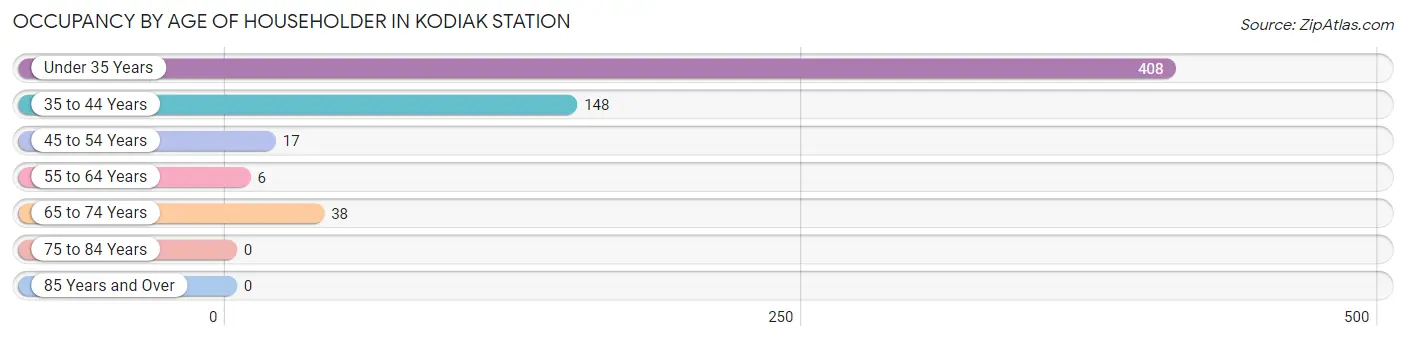
| Age Bracket | # Households | % Households |
| Under 35 Years | 408 | 66.1% |
| 35 to 44 Years | 148 | 24.0% |
| 45 to 54 Years | 17 | 2.8% |
| 55 to 64 Years | 6 | 1.0% |
| 65 to 74 Years | 38 | 6.2% |
| 75 to 84 Years | 0 | 0.0% |
| 85 Years and Over | 0 | 0.0% |
| Total | 617 | 100.0% |
Housing Finances in Kodiak Station
Median Income by Occupancy in Kodiak Station
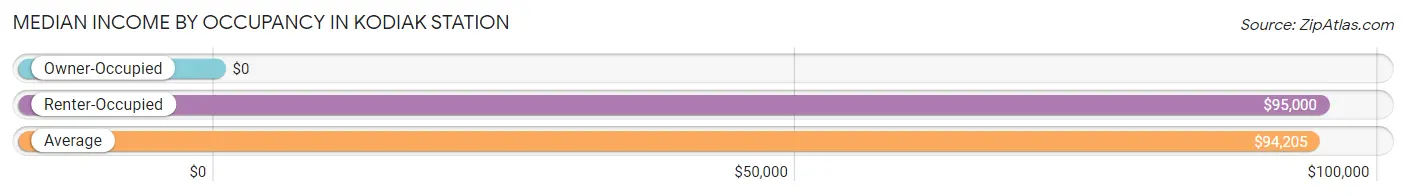
| Occupancy Type | # Households | Median Income |
| Owner-Occupied | 7 (1.1%) | $0 |
| Renter-Occupied | 610 (98.9%) | $95,000 |
| Average | 617 (100.0%) | $94,205 |
Occupancy by Householder Income Bracket in Kodiak Station

| Income Bracket | Owner-occupied | Renter-occupied |
| Less than $5,000 | 0 (0.0%) | 0 (0.0%) |
| $5,000 to $9,999 | 0 (0.0%) | 38 (6.2%) |
| $10,000 to $14,999 | 0 (0.0%) | 0 (0.0%) |
| $15,000 to $19,999 | 0 (0.0%) | 18 (2.9%) |
| $20,000 to $24,999 | 0 (0.0%) | 31 (5.1%) |
| $25,000 to $34,999 | 0 (0.0%) | 53 (8.7%) |
| $35,000 to $49,999 | 0 (0.0%) | 49 (8.0%) |
| $50,000 to $74,999 | 0 (0.0%) | 63 (10.3%) |
| $75,000 to $99,999 | 7 (100.0%) | 81 (13.3%) |
| $100,000 to $149,999 | 0 (0.0%) | 199 (32.6%) |
| $150,000 or more | 0 (0.0%) | 78 (12.8%) |
| Total | 7 (100.0%) | 610 (100.0%) |
Monthly Housing Cost Tiers in Kodiak Station
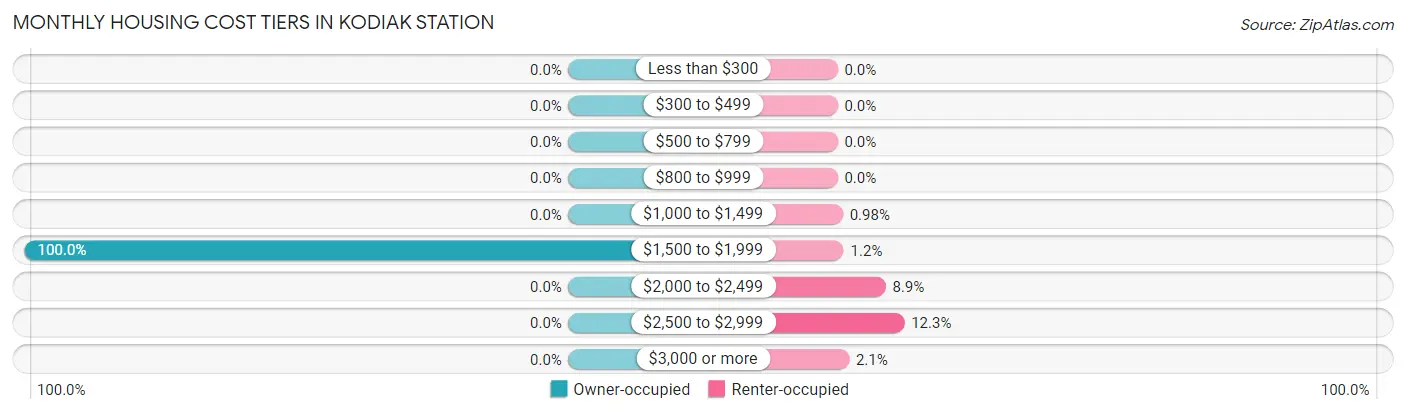
| Monthly Cost | Owner-occupied | Renter-occupied |
| Less than $300 | 0 (0.0%) | 0 (0.0%) |
| $300 to $499 | 0 (0.0%) | 0 (0.0%) |
| $500 to $799 | 0 (0.0%) | 0 (0.0%) |
| $800 to $999 | 0 (0.0%) | 0 (0.0%) |
| $1,000 to $1,499 | 0 (0.0%) | 6 (1.0%) |
| $1,500 to $1,999 | 7 (100.0%) | 7 (1.1%) |
| $2,000 to $2,499 | 0 (0.0%) | 54 (8.8%) |
| $2,500 to $2,999 | 0 (0.0%) | 75 (12.3%) |
| $3,000 or more | 0 (0.0%) | 13 (2.1%) |
| Total | 7 (100.0%) | 610 (100.0%) |
Physical Housing Characteristics in Kodiak Station
Housing Structures in Kodiak Station
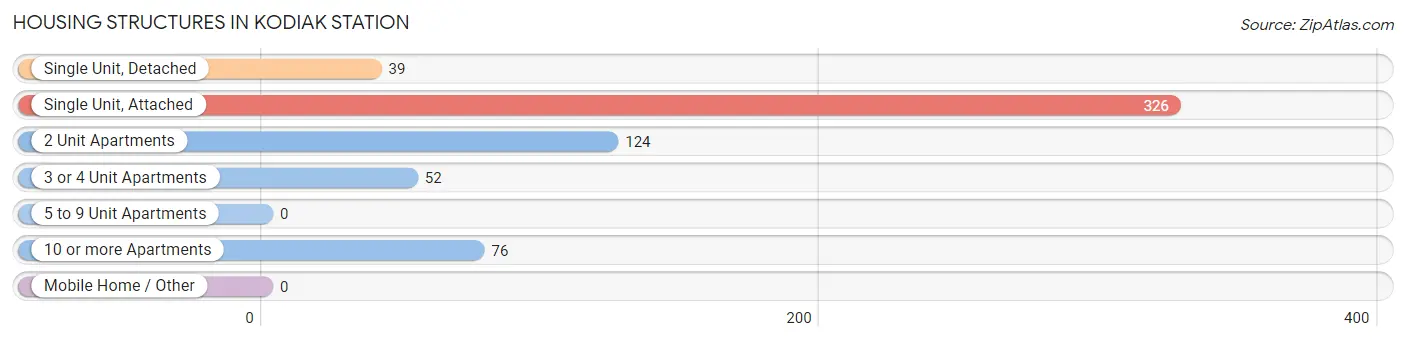
| Structure Type | # Housing Units | % Housing Units |
| Single Unit, Detached | 39 | 6.3% |
| Single Unit, Attached | 326 | 52.8% |
| 2 Unit Apartments | 124 | 20.1% |
| 3 or 4 Unit Apartments | 52 | 8.4% |
| 5 to 9 Unit Apartments | 0 | 0.0% |
| 10 or more Apartments | 76 | 12.3% |
| Mobile Home / Other | 0 | 0.0% |
| Total | 617 | 100.0% |
Housing Structures by Occupancy in Kodiak Station
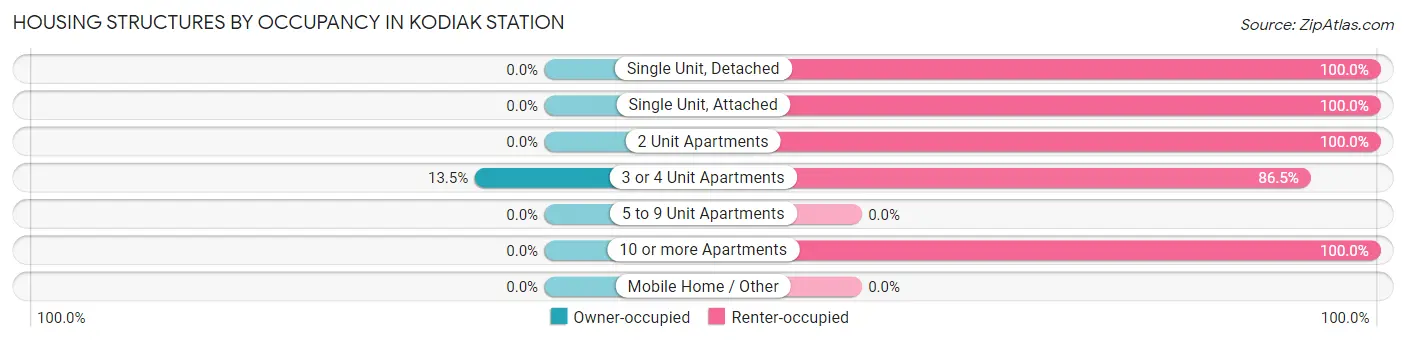
| Structure Type | Owner-occupied | Renter-occupied |
| Single Unit, Detached | 0 (0.0%) | 39 (100.0%) |
| Single Unit, Attached | 0 (0.0%) | 326 (100.0%) |
| 2 Unit Apartments | 0 (0.0%) | 124 (100.0%) |
| 3 or 4 Unit Apartments | 7 (13.5%) | 45 (86.5%) |
| 5 to 9 Unit Apartments | 0 (0.0%) | 0 (0.0%) |
| 10 or more Apartments | 0 (0.0%) | 76 (100.0%) |
| Mobile Home / Other | 0 (0.0%) | 0 (0.0%) |
| Total | 7 (1.1%) | 610 (98.9%) |
Housing Structures by Number of Rooms in Kodiak Station
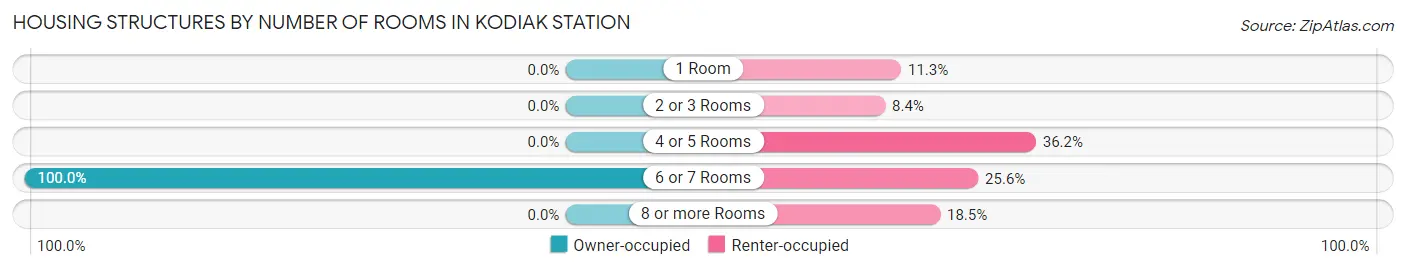
| Number of Rooms | Owner-occupied | Renter-occupied |
| 1 Room | 0 (0.0%) | 69 (11.3%) |
| 2 or 3 Rooms | 0 (0.0%) | 51 (8.4%) |
| 4 or 5 Rooms | 0 (0.0%) | 221 (36.2%) |
| 6 or 7 Rooms | 7 (100.0%) | 156 (25.6%) |
| 8 or more Rooms | 0 (0.0%) | 113 (18.5%) |
| Total | 7 (100.0%) | 610 (100.0%) |
Housing Structure by Heating Type in Kodiak Station
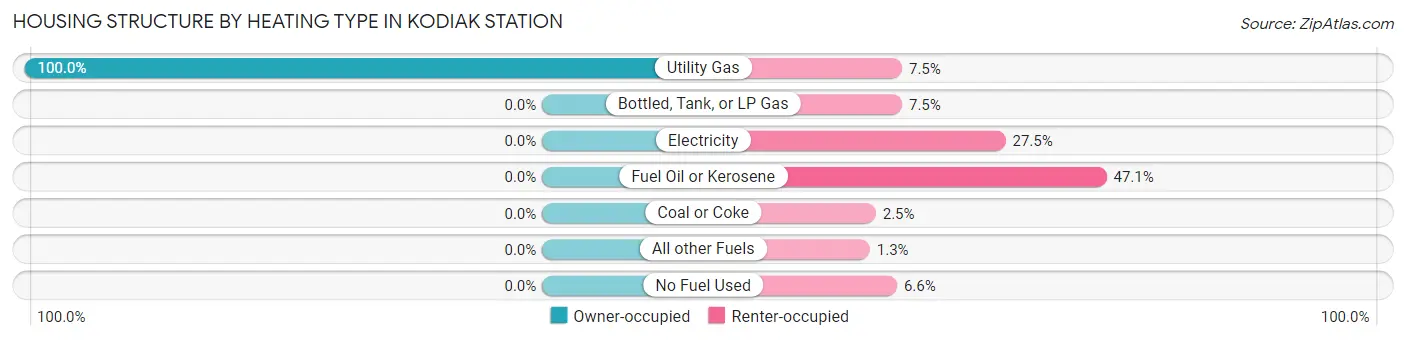
| Heating Type | Owner-occupied | Renter-occupied |
| Utility Gas | 7 (100.0%) | 46 (7.5%) |
| Bottled, Tank, or LP Gas | 0 (0.0%) | 46 (7.5%) |
| Electricity | 0 (0.0%) | 168 (27.5%) |
| Fuel Oil or Kerosene | 0 (0.0%) | 287 (47.0%) |
| Coal or Coke | 0 (0.0%) | 15 (2.5%) |
| All other Fuels | 0 (0.0%) | 8 (1.3%) |
| No Fuel Used | 0 (0.0%) | 40 (6.6%) |
| Total | 7 (100.0%) | 610 (100.0%) |
Household Vehicle Usage in Kodiak Station
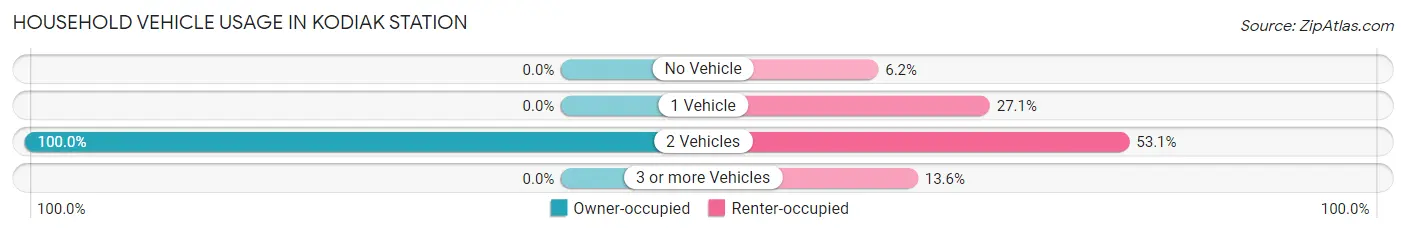
| Vehicles per Household | Owner-occupied | Renter-occupied |
| No Vehicle | 0 (0.0%) | 38 (6.2%) |
| 1 Vehicle | 0 (0.0%) | 165 (27.1%) |
| 2 Vehicles | 7 (100.0%) | 324 (53.1%) |
| 3 or more Vehicles | 0 (0.0%) | 83 (13.6%) |
| Total | 7 (100.0%) | 610 (100.0%) |
Real Estate & Mortgages in Kodiak Station
Real Estate and Mortgage Overview in Kodiak Station
| Characteristic | Without Mortgage | With Mortgage |
| Housing Units | 0 | 7 |
| Median Property Value | - | - |
| Median Household Income | - | - |
| Monthly Housing Costs | - | - |
| Real Estate Taxes | - | - |
Property Value by Mortgage Status in Kodiak Station
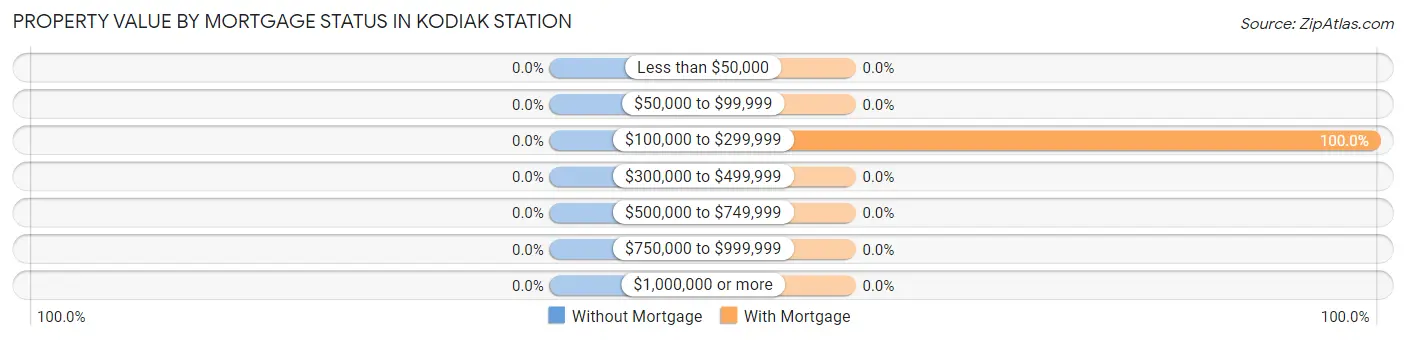
| Property Value | Without Mortgage | With Mortgage |
| Less than $50,000 | 0 (0.0%) | 0 (0.0%) |
| $50,000 to $99,999 | 0 (0.0%) | 0 (0.0%) |
| $100,000 to $299,999 | 0 (0.0%) | 7 (100.0%) |
| $300,000 to $499,999 | 0 (0.0%) | 0 (0.0%) |
| $500,000 to $749,999 | 0 (0.0%) | 0 (0.0%) |
| $750,000 to $999,999 | 0 (0.0%) | 0 (0.0%) |
| $1,000,000 or more | 0 (0.0%) | 0 (0.0%) |
| Total | 0 (0.0%) | 7 (100.0%) |
Household Income by Mortgage Status in Kodiak Station
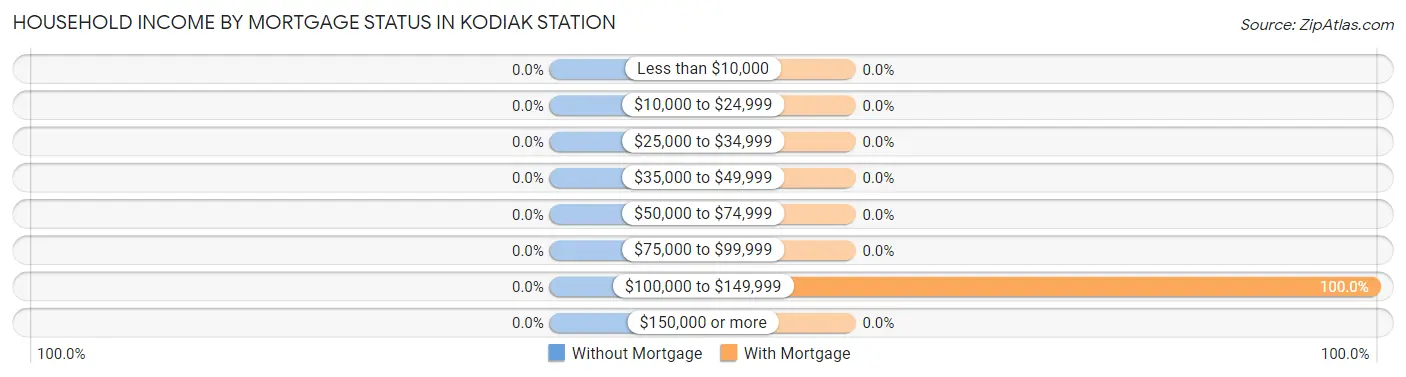
| Household Income | Without Mortgage | With Mortgage |
| Less than $10,000 | 0 (0.0%) | 0 (0.0%) |
| $10,000 to $24,999 | 0 (0.0%) | 0 (0.0%) |
| $25,000 to $34,999 | 0 (0.0%) | 0 (0.0%) |
| $35,000 to $49,999 | 0 (0.0%) | 0 (0.0%) |
| $50,000 to $74,999 | 0 (0.0%) | 0 (0.0%) |
| $75,000 to $99,999 | 0 (0.0%) | 0 (0.0%) |
| $100,000 to $149,999 | 0 (0.0%) | 7 (100.0%) |
| $150,000 or more | 0 (0.0%) | 0 (0.0%) |
| Total | 0 (0.0%) | 7 (100.0%) |
Property Value to Household Income Ratio in Kodiak Station
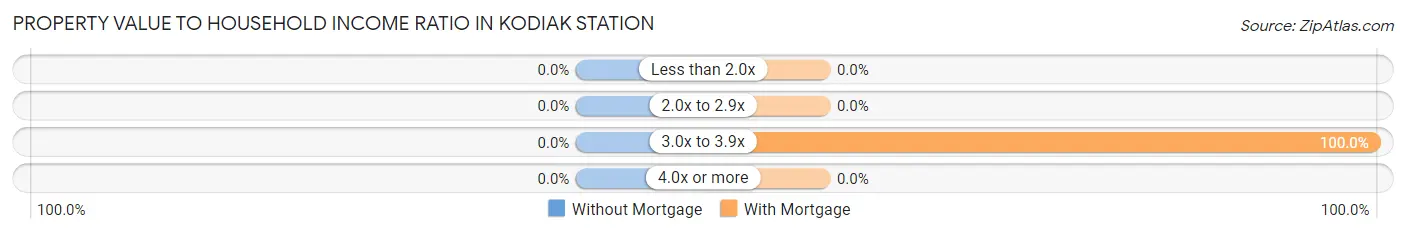
| Value-to-Income Ratio | Without Mortgage | With Mortgage |
| Less than 2.0x | 0 (0.0%) | 0 (0.0%) |
| 2.0x to 2.9x | 0 (0.0%) | 0 (0.0%) |
| 3.0x to 3.9x | 0 (0.0%) | 7 (100.0%) |
| 4.0x or more | 0 (0.0%) | 0 (0.0%) |
| Total | 0 (0.0%) | 7 (100.0%) |
Real Estate Taxes by Mortgage Status in Kodiak Station
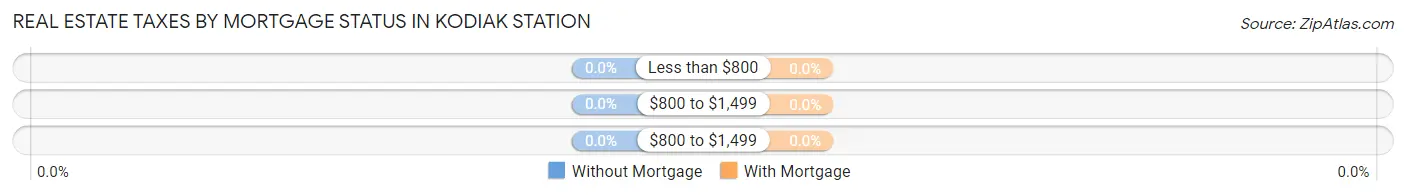
| Property Taxes | Without Mortgage | With Mortgage |
| Less than $800 | 0 (0.0%) | 0 (0.0%) |
| $800 to $1,499 | 0 (0.0%) | 0 (0.0%) |
| $800 to $1,499 | 0 (0.0%) | 0 (0.0%) |
| Total | 0 (0.0%) | 7 (100.0%) |
Health & Disability in Kodiak Station
Health Insurance Coverage by Age in Kodiak Station
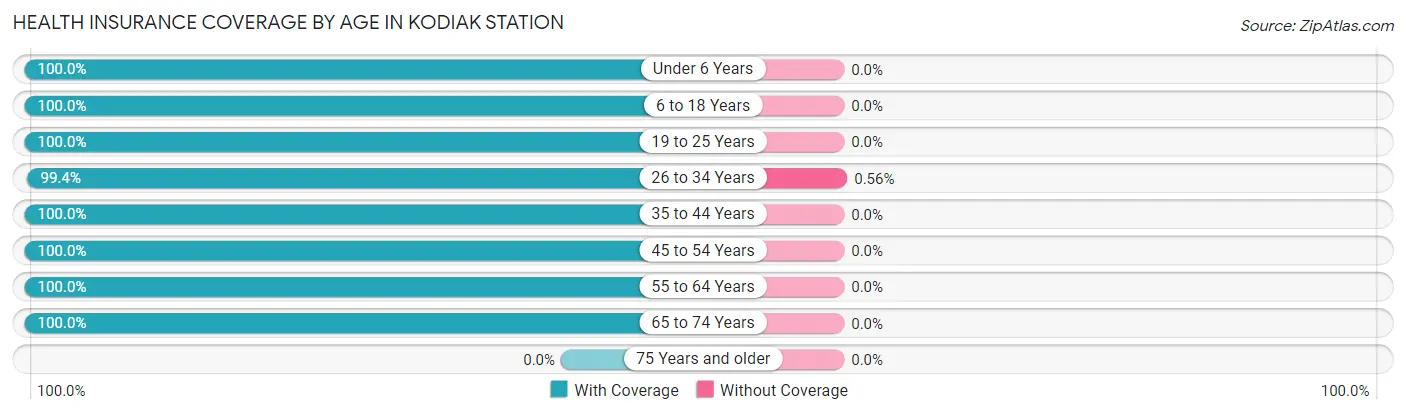
| Age Bracket | With Coverage | Without Coverage |
| Under 6 Years | 230 (100.0%) | 0 (0.0%) |
| 6 to 18 Years | 464 (100.0%) | 0 (0.0%) |
| 19 to 25 Years | 163 (100.0%) | 0 (0.0%) |
| 26 to 34 Years | 356 (99.4%) | 2 (0.6%) |
| 35 to 44 Years | 142 (100.0%) | 0 (0.0%) |
| 45 to 54 Years | 42 (100.0%) | 0 (0.0%) |
| 55 to 64 Years | 6 (100.0%) | 0 (0.0%) |
| 65 to 74 Years | 38 (100.0%) | 0 (0.0%) |
| 75 Years and older | 0 (0.0%) | 0 (0.0%) |
| Total | 1,441 (99.9%) | 2 (0.1%) |
Health Insurance Coverage by Citizenship Status in Kodiak Station
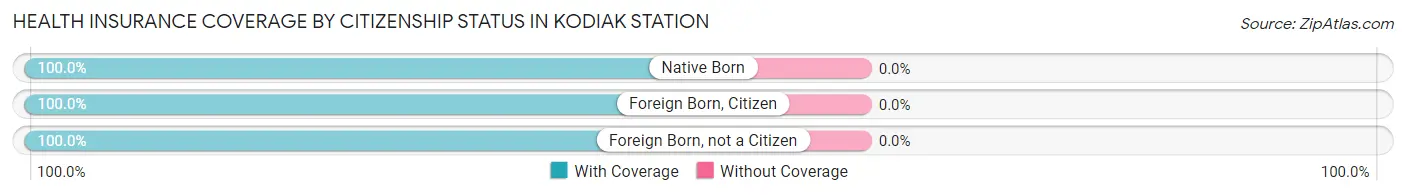
| Citizenship Status | With Coverage | Without Coverage |
| Native Born | 230 (100.0%) | 0 (0.0%) |
| Foreign Born, Citizen | 464 (100.0%) | 0 (0.0%) |
| Foreign Born, not a Citizen | 163 (100.0%) | 0 (0.0%) |
Health Insurance Coverage by Household Income in Kodiak Station
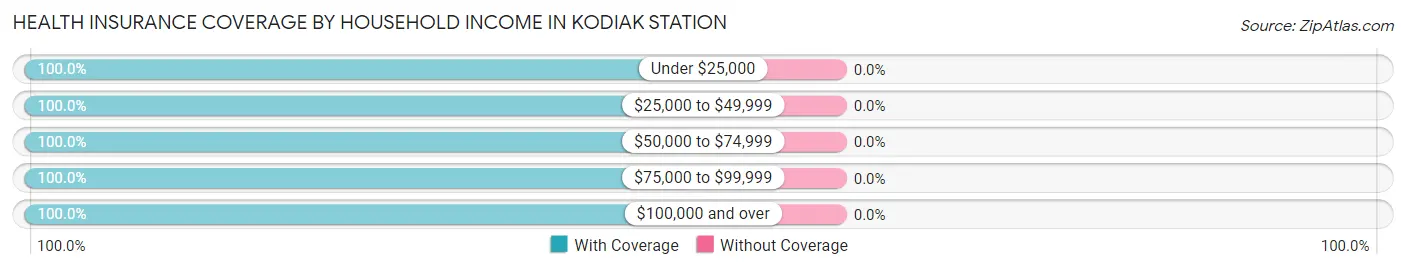
| Household Income | With Coverage | Without Coverage |
| Under $25,000 | 63 (100.0%) | 0 (0.0%) |
| $25,000 to $49,999 | 165 (100.0%) | 0 (0.0%) |
| $50,000 to $74,999 | 167 (100.0%) | 0 (0.0%) |
| $75,000 to $99,999 | 207 (100.0%) | 0 (0.0%) |
| $100,000 and over | 829 (100.0%) | 0 (0.0%) |
Public vs Private Health Insurance Coverage by Age in Kodiak Station
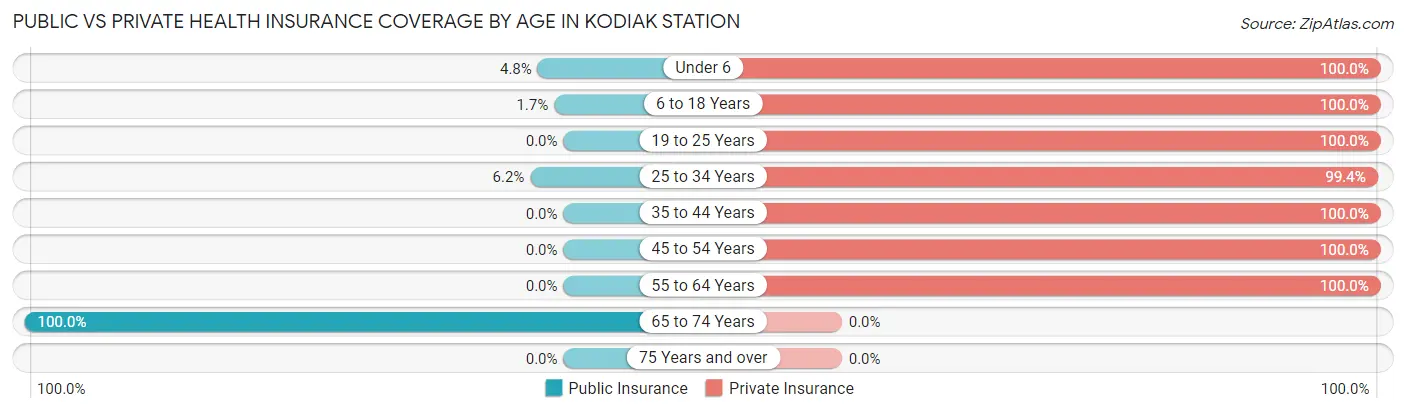
| Age Bracket | Public Insurance | Private Insurance |
| Under 6 | 11 (4.8%) | 230 (100.0%) |
| 6 to 18 Years | 8 (1.7%) | 464 (100.0%) |
| 19 to 25 Years | 0 (0.0%) | 163 (100.0%) |
| 25 to 34 Years | 22 (6.1%) | 356 (99.4%) |
| 35 to 44 Years | 0 (0.0%) | 142 (100.0%) |
| 45 to 54 Years | 0 (0.0%) | 42 (100.0%) |
| 55 to 64 Years | 0 (0.0%) | 6 (100.0%) |
| 65 to 74 Years | 38 (100.0%) | 0 (0.0%) |
| 75 Years and over | 0 (0.0%) | 0 (0.0%) |
| Total | 79 (5.5%) | 1,403 (97.2%) |
Disability Status by Sex by Age in Kodiak Station
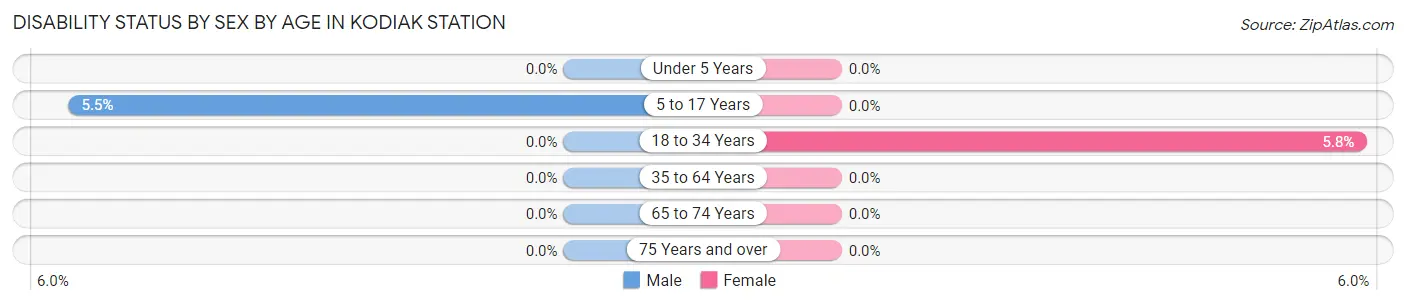
| Age Bracket | Male | Female |
| Under 5 Years | 0 (0.0%) | 0 (0.0%) |
| 5 to 17 Years | 15 (5.5%) | 0 (0.0%) |
| 18 to 34 Years | 0 (0.0%) | 22 (5.8%) |
| 35 to 64 Years | 0 (0.0%) | 0 (0.0%) |
| 65 to 74 Years | 0 (0.0%) | 0 (0.0%) |
| 75 Years and over | 0 (0.0%) | 0 (0.0%) |
Disability Class by Sex by Age in Kodiak Station
Disability Class: Hearing Difficulty
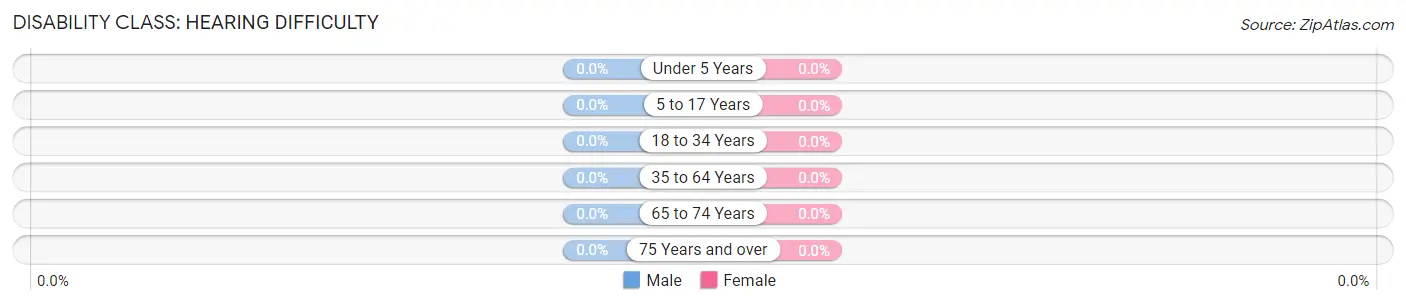
| Age Bracket | Male | Female |
| Under 5 Years | 0 (0.0%) | 0 (0.0%) |
| 5 to 17 Years | 0 (0.0%) | 0 (0.0%) |
| 18 to 34 Years | 0 (0.0%) | 0 (0.0%) |
| 35 to 64 Years | 0 (0.0%) | 0 (0.0%) |
| 65 to 74 Years | 0 (0.0%) | 0 (0.0%) |
| 75 Years and over | 0 (0.0%) | 0 (0.0%) |
Disability Class: Vision Difficulty
| Age Bracket | Male | Female |
| Under 5 Years | 0 (0.0%) | 0 (0.0%) |
| 5 to 17 Years | 0 (0.0%) | 0 (0.0%) |
| 18 to 34 Years | 0 (0.0%) | 0 (0.0%) |
| 35 to 64 Years | 0 (0.0%) | 0 (0.0%) |
| 65 to 74 Years | 0 (0.0%) | 0 (0.0%) |
| 75 Years and over | 0 (0.0%) | 0 (0.0%) |
Disability Class: Cognitive Difficulty
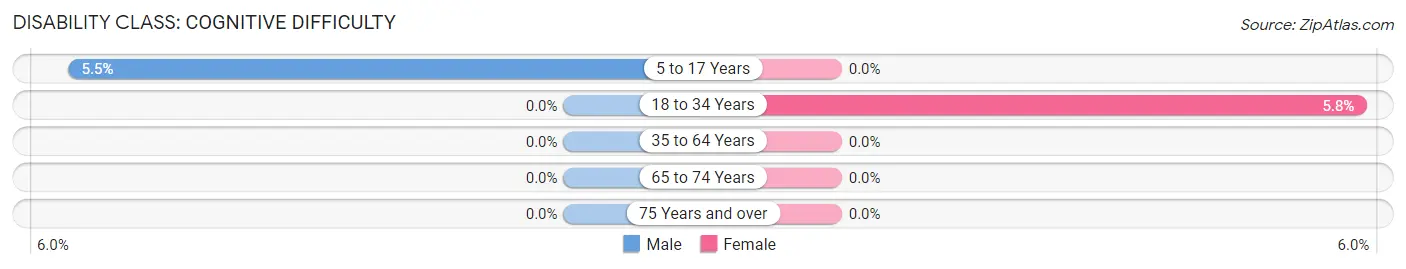
| Age Bracket | Male | Female |
| 5 to 17 Years | 15 (5.5%) | 0 (0.0%) |
| 18 to 34 Years | 0 (0.0%) | 22 (5.8%) |
| 35 to 64 Years | 0 (0.0%) | 0 (0.0%) |
| 65 to 74 Years | 0 (0.0%) | 0 (0.0%) |
| 75 Years and over | 0 (0.0%) | 0 (0.0%) |
Disability Class: Ambulatory Difficulty
| Age Bracket | Male | Female |
| 5 to 17 Years | 0 (0.0%) | 0 (0.0%) |
| 18 to 34 Years | 0 (0.0%) | 0 (0.0%) |
| 35 to 64 Years | 0 (0.0%) | 0 (0.0%) |
| 65 to 74 Years | 0 (0.0%) | 0 (0.0%) |
| 75 Years and over | 0 (0.0%) | 0 (0.0%) |
Disability Class: Self-Care Difficulty
| Age Bracket | Male | Female |
| 5 to 17 Years | 0 (0.0%) | 0 (0.0%) |
| 18 to 34 Years | 0 (0.0%) | 0 (0.0%) |
| 35 to 64 Years | 0 (0.0%) | 0 (0.0%) |
| 65 to 74 Years | 0 (0.0%) | 0 (0.0%) |
| 75 Years and over | 0 (0.0%) | 0 (0.0%) |
Technology Access in Kodiak Station
Computing Device Access in Kodiak Station
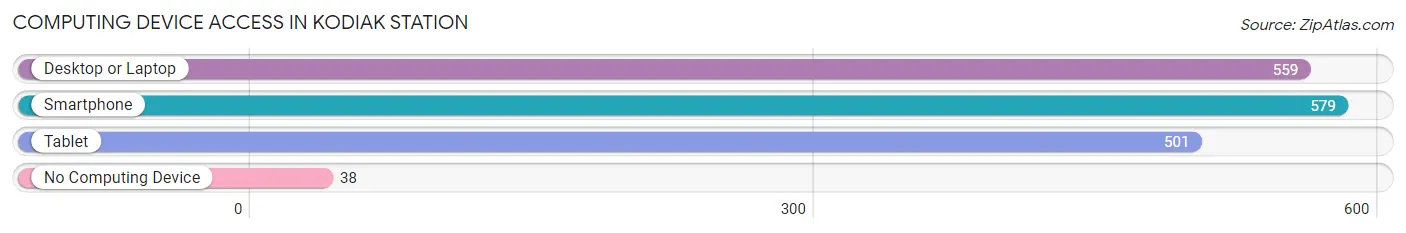
| Device Type | # Households | % Households |
| Desktop or Laptop | 559 | 90.6% |
| Smartphone | 579 | 93.8% |
| Tablet | 501 | 81.2% |
| No Computing Device | 38 | 6.2% |
| Total | 617 | 100.0% |
Internet Access in Kodiak Station
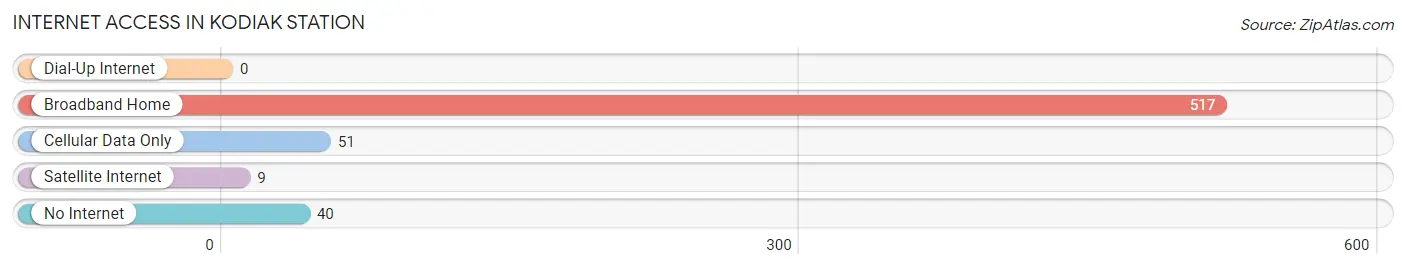
| Internet Type | # Households | % Households |
| Dial-Up Internet | 0 | 0.0% |
| Broadband Home | 517 | 83.8% |
| Cellular Data Only | 51 | 8.3% |
| Satellite Internet | 9 | 1.5% |
| No Internet | 40 | 6.5% |
| Total | 617 | 100.0% |
Kodiak Station Summary
Kodiak Station, Alaska is a small unincorporated community located on the eastern side of Kodiak Island in the Kodiak Island Borough of Alaska. It is located on the north side of the island, about 25 miles from the city of Kodiak. The community is home to about 200 people, and is a popular destination for fishing, hunting, and other outdoor activities.
History
Kodiak Station was first established in the late 1800s as a trading post for the Russian-American Company. The company was a fur trading business that operated in Alaska from 1799 to 1867. The trading post was located on the north side of the island, near the present-day community of Kodiak Station. The trading post was used to trade goods with the local Native Alaskan population, and was a major source of income for the Russian-American Company.
In the early 1900s, the United States purchased Alaska from the Russian Empire, and the trading post was abandoned. In the late 1940s, the United States Navy established a base on the island, and the community of Kodiak Station was established. The base was used to support the Navy's operations in the Pacific Ocean during World War II.
Geography
Kodiak Station is located on the north side of Kodiak Island, about 25 miles from the city of Kodiak. The community is situated on a small bay, and is surrounded by mountains and forests. The climate in Kodiak Station is mild, with temperatures ranging from the mid-30s in the winter to the mid-60s in the summer. The area receives an average of about 40 inches of precipitation per year.
Economy
Kodiak Station is a small, rural community, and the economy is largely based on fishing and tourism. The community is home to several fishing lodges, and is a popular destination for sport fishing. The area is also home to several hunting lodges, and is a popular destination for hunting. Tourism is also an important part of the local economy, and the community is home to several bed and breakfasts, restaurants, and other tourist attractions.
Demographics
As of the 2010 census, the population of Kodiak Station was estimated to be about 200 people. The population is largely composed of Native Alaskans, and the majority of the population is of Alaska Native or American Indian descent. The median household income in Kodiak Station is about $50,000, and the median home value is about $200,000. The unemployment rate in Kodiak Station is about 8%, which is slightly higher than the national average.
Common Questions
What is Per Capita Income in Kodiak Station?
Per Capita income in Kodiak Station is $30,089.
What is the Median Family Income in Kodiak Station?
Median Family Income in Kodiak Station is $101,071.
What is the Median Household income in Kodiak Station?
Median Household Income in Kodiak Station is $94,205.
What is Income or Wage Gap in Kodiak Station?
Income or Wage Gap in Kodiak Station is 40.7%.
Women in Kodiak Station earn 59.3 cents for every dollar earned by a man.
What is Inequality or Gini Index in Kodiak Station?
Inequality or Gini Index in Kodiak Station is 0.32.
What is the Total Population of Kodiak Station?
Total Population of Kodiak Station is 2,113.
What is the Total Male Population of Kodiak Station?
Total Male Population of Kodiak Station is 1,170.
What is the Total Female Population of Kodiak Station?
Total Female Population of Kodiak Station is 943.
What is the Ratio of Males per 100 Females in Kodiak Station?
There are 124.07 Males per 100 Females in Kodiak Station.
What is the Ratio of Females per 100 Males in Kodiak Station?
There are 80.60 Females per 100 Males in Kodiak Station.
What is the Median Population Age in Kodiak Station?
Median Population Age in Kodiak Station is 25.4 Years.
What is the Average Family Size in Kodiak Station
Average Family Size in Kodiak Station is 3.3 People.
What is the Average Household Size in Kodiak Station
Average Household Size in Kodiak Station is 3.1 People.
How Large is the Labor Force in Kodiak Station?
There are 1,171 People in the Labor Forcein in Kodiak Station.
What is the Percentage of People in the Labor Force in Kodiak Station?
80.3% of People are in the Labor Force in Kodiak Station.