Lebanon, TN Map & Demographics
Lebanon Map
Lebanon Overview
$35,177
PER CAPITA INCOME
$85,152
AVG FAMILY INCOME
$63,698
AVG HOUSEHOLD INCOME
25.3%
WAGE / INCOME GAP [ % ]
74.7¢/ $1
WAGE / INCOME GAP [ $ ]
0.46
INEQUALITY / GINI INDEX
39,562
TOTAL POPULATION
18,742
MALE POPULATION
20,820
FEMALE POPULATION
90.02
MALES / 100 FEMALES
111.09
FEMALES / 100 MALES
35.6
MEDIAN AGE
3.1
AVG FAMILY SIZE
2.5
AVG HOUSEHOLD SIZE
19,911
LABOR FORCE [ PEOPLE ]
63.4%
PERCENT IN LABOR FORCE
3.0%
UNEMPLOYMENT RATE
Lebanon Area Codes
Income in Lebanon
Income Overview in Lebanon
Per Capita Income in Lebanon is $35,177, while median incomes of families and households are $85,152 and $63,698 respectively.
| Characteristic | Number | Measure |
| Per Capita Income | 39,562 | $35,177 |
| Median Family Income | 9,569 | $85,152 |
| Mean Family Income | 9,569 | $104,785 |
| Median Household Income | 15,014 | $63,698 |
| Mean Household Income | 15,014 | $89,214 |
| Income Deficit | 9,569 | $0 |
| Wage / Income Gap (%) | 39,562 | 25.33% |
| Wage / Income Gap ($) | 39,562 | 74.67¢ per $1 |
| Gini / Inequality Index | 39,562 | 0.46 |
Earnings by Sex in Lebanon
Average Earnings in Lebanon are $39,278, $45,448 for men and $33,938 for women, a difference of 25.3%.
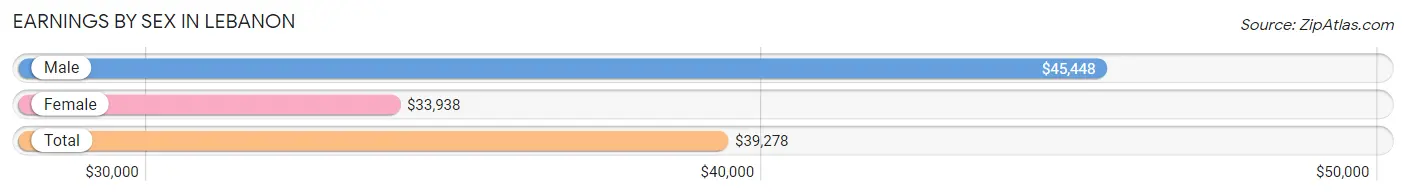
| Sex | Number | Average Earnings |
| Male | 10,970 (51.6%) | $45,448 |
| Female | 10,268 (48.3%) | $33,938 |
| Total | 21,238 (100.0%) | $39,278 |
Earnings by Sex by Income Bracket in Lebanon
The most common earnings brackets in Lebanon are $100,000+ for men (1,673 | 15.2%) and $30,000 to $34,999 for women (917 | 8.9%).
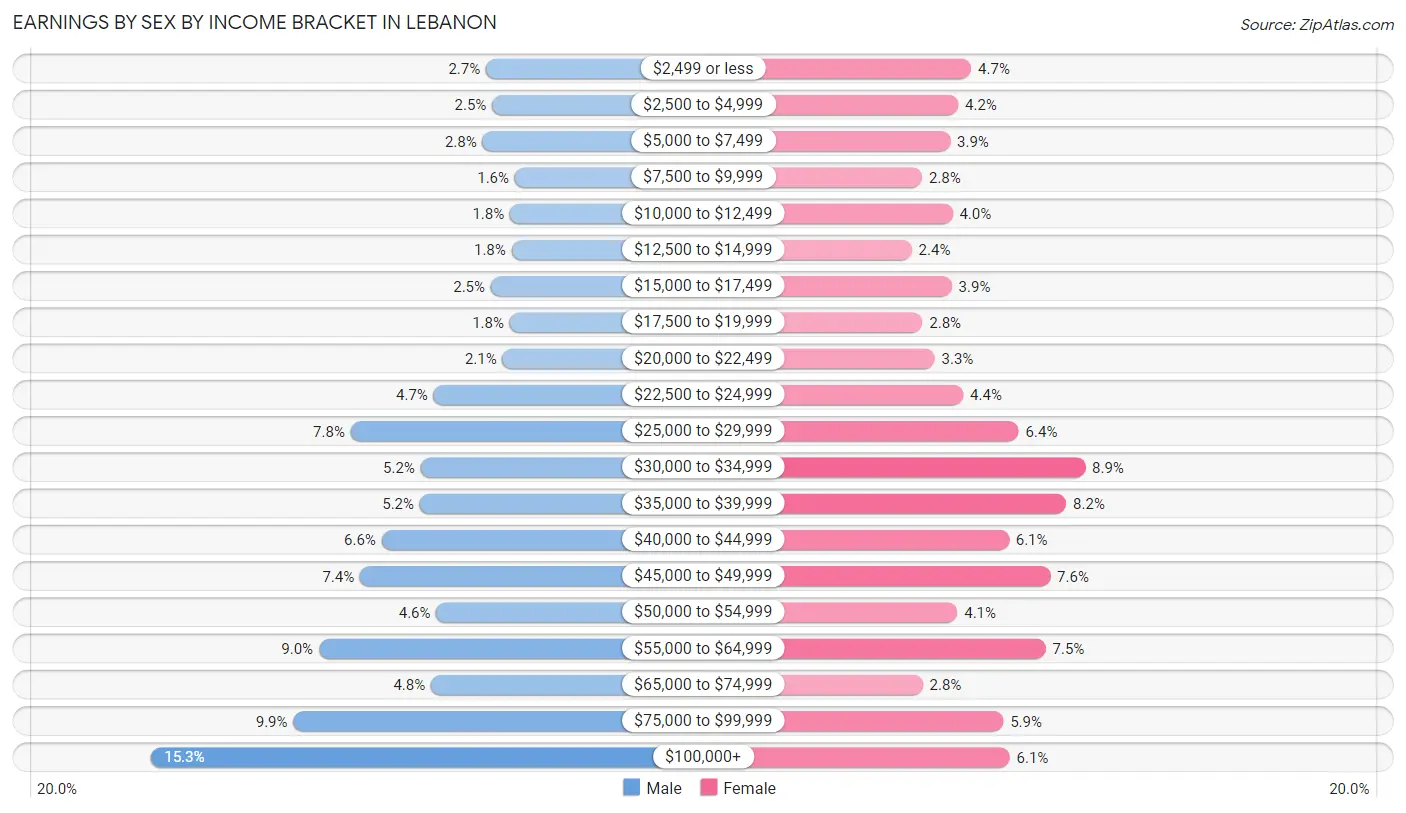
| Income | Male | Female |
| $2,499 or less | 297 (2.7%) | 479 (4.7%) |
| $2,500 to $4,999 | 272 (2.5%) | 428 (4.2%) |
| $5,000 to $7,499 | 312 (2.8%) | 397 (3.9%) |
| $7,500 to $9,999 | 179 (1.6%) | 290 (2.8%) |
| $10,000 to $12,499 | 199 (1.8%) | 407 (4.0%) |
| $12,500 to $14,999 | 192 (1.8%) | 249 (2.4%) |
| $15,000 to $17,499 | 278 (2.5%) | 404 (3.9%) |
| $17,500 to $19,999 | 200 (1.8%) | 291 (2.8%) |
| $20,000 to $22,499 | 229 (2.1%) | 338 (3.3%) |
| $22,500 to $24,999 | 512 (4.7%) | 448 (4.4%) |
| $25,000 to $29,999 | 854 (7.8%) | 661 (6.4%) |
| $30,000 to $34,999 | 566 (5.2%) | 917 (8.9%) |
| $35,000 to $39,999 | 569 (5.2%) | 844 (8.2%) |
| $40,000 to $44,999 | 726 (6.6%) | 623 (6.1%) |
| $45,000 to $49,999 | 815 (7.4%) | 782 (7.6%) |
| $50,000 to $54,999 | 501 (4.6%) | 425 (4.1%) |
| $55,000 to $64,999 | 984 (9.0%) | 765 (7.4%) |
| $65,000 to $74,999 | 523 (4.8%) | 292 (2.8%) |
| $75,000 to $99,999 | 1,089 (9.9%) | 602 (5.9%) |
| $100,000+ | 1,673 (15.2%) | 626 (6.1%) |
| Total | 10,970 (100.0%) | 10,268 (100.0%) |
Earnings by Sex by Educational Attainment in Lebanon
Average earnings in Lebanon are $48,993 for men and $37,361 for women, a difference of 23.7%. Men with an educational attainment of graduate degree enjoy the highest average annual earnings of $116,042, while those with less than high school education earn the least with $35,637. Women with an educational attainment of graduate degree earn the most with the average annual earnings of $55,398, while those with less than high school education have the smallest earnings of $24,118.
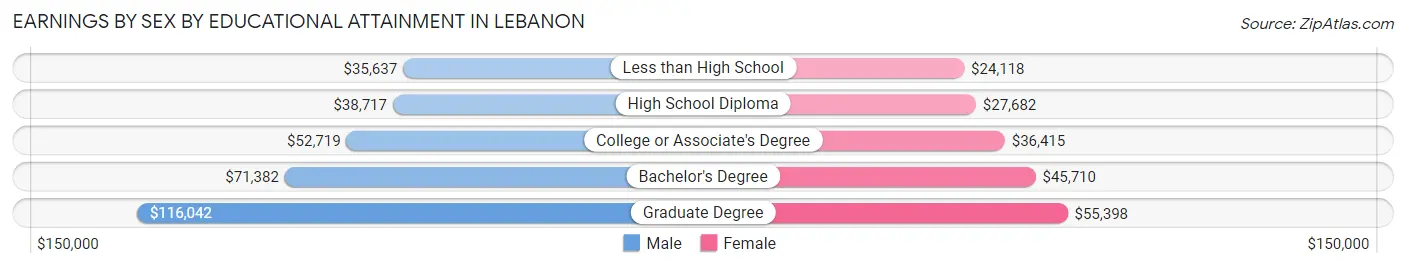
| Educational Attainment | Male Income | Female Income |
| Less than High School | $35,637 | $24,118 |
| High School Diploma | $38,717 | $27,682 |
| College or Associate's Degree | $52,719 | $36,415 |
| Bachelor's Degree | $71,382 | $45,710 |
| Graduate Degree | $116,042 | $55,398 |
| Total | $48,993 | $37,361 |
Family Income in Lebanon
Family Income Brackets in Lebanon
According to the Lebanon family income data, there are 2,287 families falling into the $100,000 to $149,999 income range, which is the most common income bracket and makes up 23.9% of all families. Conversely, the $10,000 to $14,999 income bracket is the least frequent group with only 57 families (0.6%) belonging to this category.
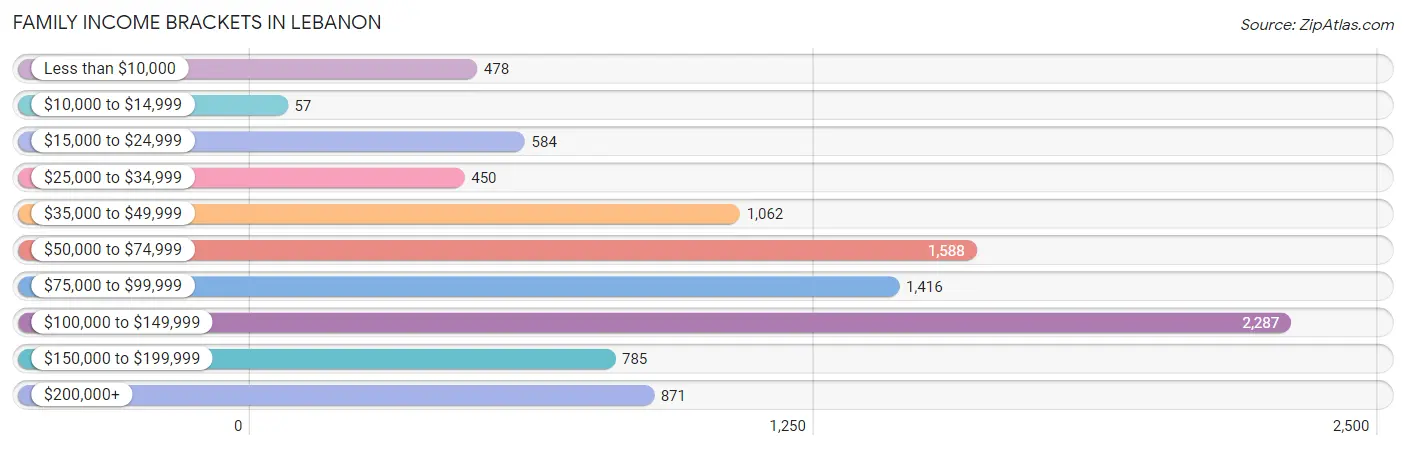
| Income Bracket | # Families | % Families |
| Less than $10,000 | 478 | 5.0% |
| $10,000 to $14,999 | 57 | 0.6% |
| $15,000 to $24,999 | 584 | 6.1% |
| $25,000 to $34,999 | 450 | 4.7% |
| $35,000 to $49,999 | 1,062 | 11.1% |
| $50,000 to $74,999 | 1,588 | 16.6% |
| $75,000 to $99,999 | 1,416 | 14.8% |
| $100,000 to $149,999 | 2,287 | 23.9% |
| $150,000 to $199,999 | 785 | 8.2% |
| $200,000+ | 871 | 9.1% |
Family Income by Famaliy Size in Lebanon
7+ person families (79 | 0.8%) account for the highest median family income in Lebanon with $172,756 per family, while 2-person families (4,462 | 46.6%) have the highest median income of $39,840 per family member.
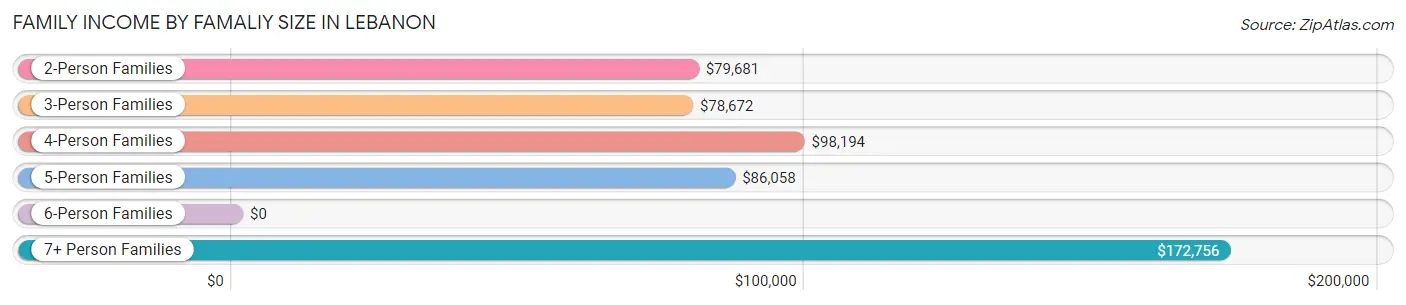
| Income Bracket | # Families | Median Income |
| 2-Person Families | 4,462 (46.6%) | $79,681 |
| 3-Person Families | 2,192 (22.9%) | $78,672 |
| 4-Person Families | 1,765 (18.4%) | $98,194 |
| 5-Person Families | 740 (7.7%) | $86,058 |
| 6-Person Families | 331 (3.5%) | $0 |
| 7+ Person Families | 79 (0.8%) | $172,756 |
| Total | 9,569 (100.0%) | $85,152 |
Family Income by Number of Earners in Lebanon
The median family income in Lebanon is $85,152, with families comprising 3+ earners (952) having the highest median family income of $144,167, while families with 1 earner (3,046) have the lowest median family income of $47,101, accounting for 10.0% and 31.8% of families, respectively.
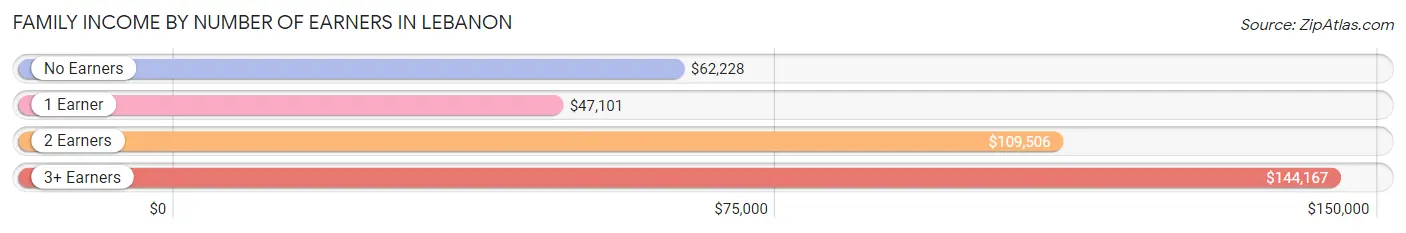
| Number of Earners | # Families | Median Income |
| No Earners | 1,439 (15.0%) | $62,228 |
| 1 Earner | 3,046 (31.8%) | $47,101 |
| 2 Earners | 4,132 (43.2%) | $109,506 |
| 3+ Earners | 952 (10.0%) | $144,167 |
| Total | 9,569 (100.0%) | $85,152 |
Household Income in Lebanon
Household Income Brackets in Lebanon
With 2,793 households falling in the category, the $50,000 to $74,999 income range is the most frequent in Lebanon, accounting for 18.6% of all households. In contrast, only 435 households (2.9%) fall into the $10,000 to $14,999 income bracket, making it the least populous group.
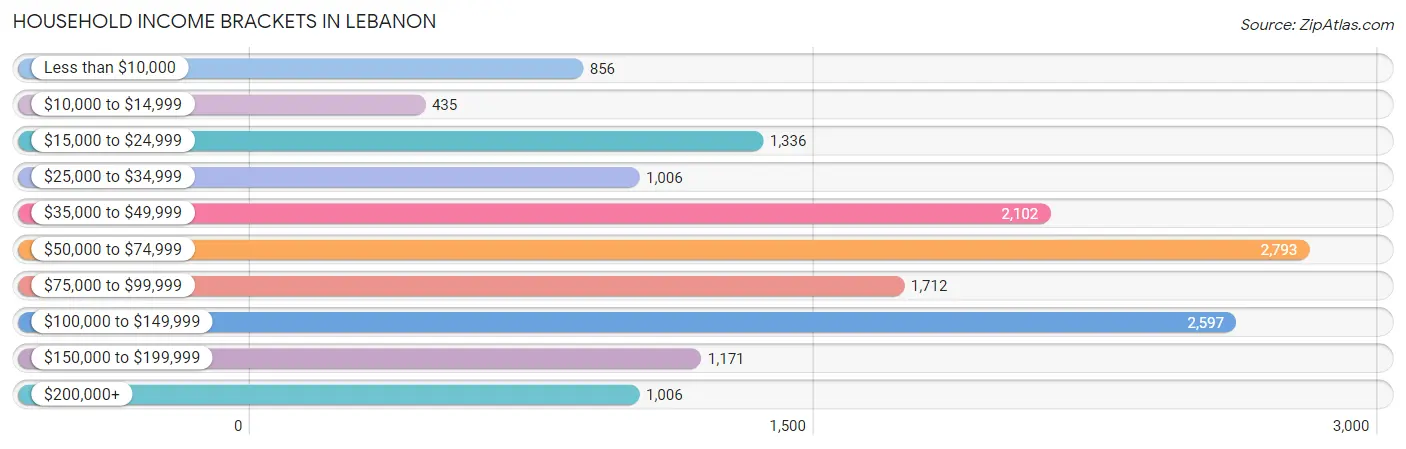
| Income Bracket | # Households | % Households |
| Less than $10,000 | 856 | 5.7% |
| $10,000 to $14,999 | 435 | 2.9% |
| $15,000 to $24,999 | 1,336 | 8.9% |
| $25,000 to $34,999 | 1,006 | 6.7% |
| $35,000 to $49,999 | 2,102 | 14.0% |
| $50,000 to $74,999 | 2,793 | 18.6% |
| $75,000 to $99,999 | 1,712 | 11.4% |
| $100,000 to $149,999 | 2,597 | 17.3% |
| $150,000 to $199,999 | 1,171 | 7.8% |
| $200,000+ | 1,006 | 6.7% |
Household Income by Householder Age in Lebanon
The median household income in Lebanon is $63,698, with the highest median household income of $83,037 found in the 45 to 64 years age bracket for the primary householder. A total of 4,612 households (30.7%) fall into this category. Meanwhile, the 65+ years age bracket for the primary householder has the lowest median household income of $49,541, with 3,825 households (25.5%) in this group.
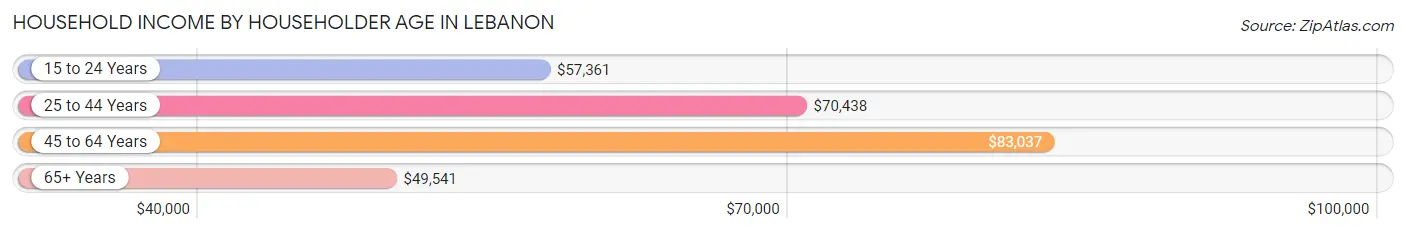
| Income Bracket | # Households | Median Income |
| 15 to 24 Years | 695 (4.6%) | $57,361 |
| 25 to 44 Years | 5,882 (39.2%) | $70,438 |
| 45 to 64 Years | 4,612 (30.7%) | $83,037 |
| 65+ Years | 3,825 (25.5%) | $49,541 |
| Total | 15,014 (100.0%) | $63,698 |
Poverty in Lebanon
Income Below Poverty by Sex and Age in Lebanon
With 11.6% poverty level for males and 17.3% for females among the residents of Lebanon, 12 to 14 year old males and 16 and 17 year old females are the most vulnerable to poverty, with 232 males (32.7%) and 89 females (28.8%) in their respective age groups living below the poverty level.
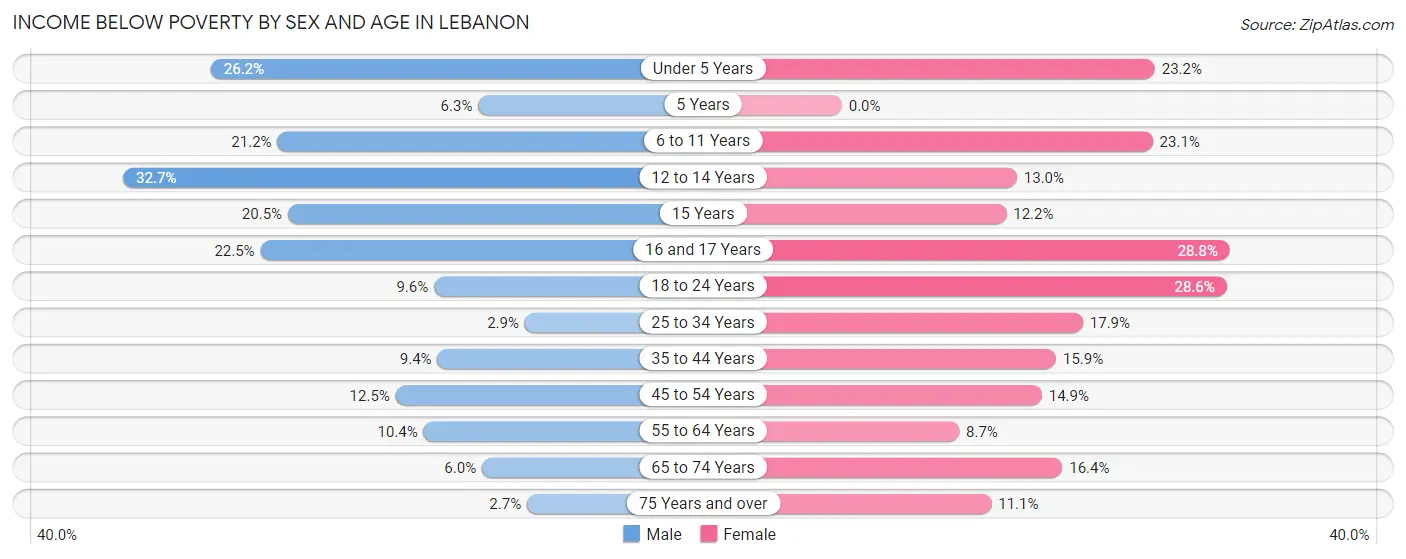
| Age Bracket | Male | Female |
| Under 5 Years | 376 (26.2%) | 341 (23.2%) |
| 5 Years | 18 (6.3%) | 0 (0.0%) |
| 6 to 11 Years | 317 (21.2%) | 364 (23.1%) |
| 12 to 14 Years | 232 (32.7%) | 75 (13.0%) |
| 15 Years | 18 (20.4%) | 16 (12.2%) |
| 16 and 17 Years | 92 (22.5%) | 89 (28.8%) |
| 18 to 24 Years | 134 (9.6%) | 564 (28.6%) |
| 25 to 34 Years | 92 (2.9%) | 574 (17.9%) |
| 35 to 44 Years | 227 (9.3%) | 423 (15.9%) |
| 45 to 54 Years | 246 (12.4%) | 327 (14.8%) |
| 55 to 64 Years | 215 (10.4%) | 186 (8.7%) |
| 65 to 74 Years | 81 (6.0%) | 322 (16.4%) |
| 75 Years and over | 27 (2.7%) | 197 (11.1%) |
| Total | 2,075 (11.6%) | 3,478 (17.3%) |
Income Above Poverty by Sex and Age in Lebanon
According to the poverty statistics in Lebanon, males aged 75 years and over and females aged 5 years are the age groups that are most secure financially, with 97.3% of males and 100.0% of females in these age groups living above the poverty line.
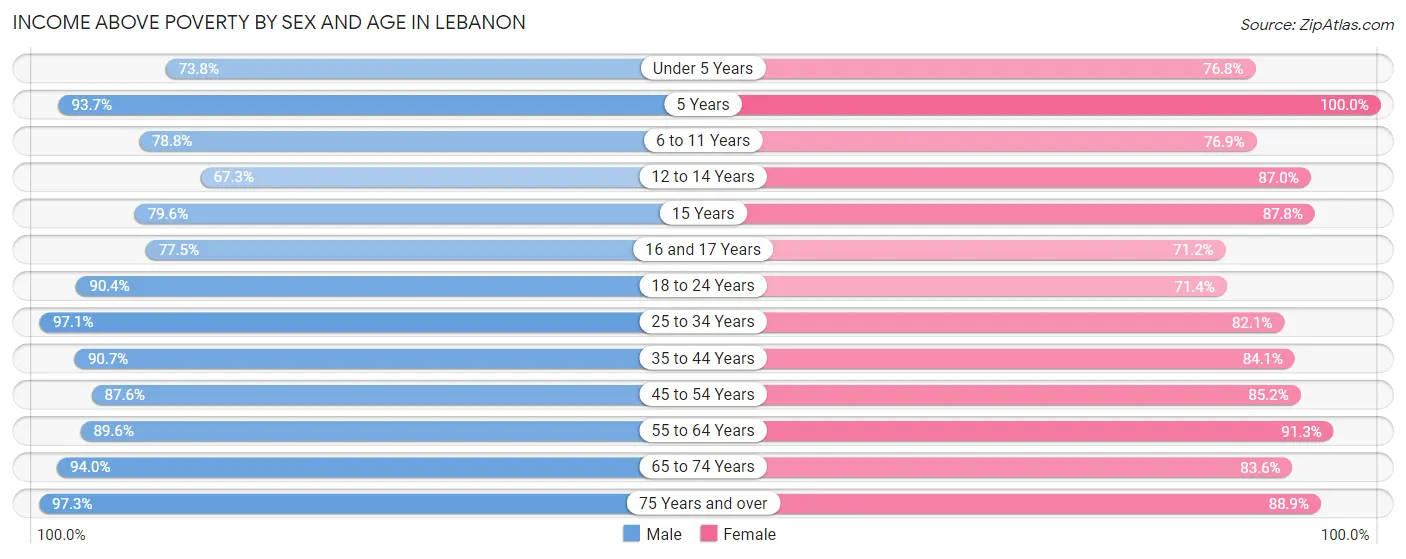
| Age Bracket | Male | Female |
| Under 5 Years | 1,061 (73.8%) | 1,126 (76.8%) |
| 5 Years | 267 (93.7%) | 74 (100.0%) |
| 6 to 11 Years | 1,176 (78.8%) | 1,213 (76.9%) |
| 12 to 14 Years | 478 (67.3%) | 502 (87.0%) |
| 15 Years | 70 (79.5%) | 115 (87.8%) |
| 16 and 17 Years | 317 (77.5%) | 220 (71.2%) |
| 18 to 24 Years | 1,262 (90.4%) | 1,410 (71.4%) |
| 25 to 34 Years | 3,129 (97.1%) | 2,633 (82.1%) |
| 35 to 44 Years | 2,200 (90.6%) | 2,236 (84.1%) |
| 45 to 54 Years | 1,730 (87.5%) | 1,875 (85.2%) |
| 55 to 64 Years | 1,857 (89.6%) | 1,950 (91.3%) |
| 65 to 74 Years | 1,261 (94.0%) | 1,645 (83.6%) |
| 75 Years and over | 972 (97.3%) | 1,578 (88.9%) |
| Total | 15,780 (88.4%) | 16,577 (82.7%) |
Income Below Poverty Among Married-Couple Families in Lebanon
The poverty statistics for married-couple families in Lebanon show that 3.9% or 268 of the total 6,858 families live below the poverty line. Families with 3 or 4 children have the highest poverty rate of 12.1%, comprising of 77 families. On the other hand, families with 5 or more children have the lowest poverty rate of 0.0%, which includes 0 families.
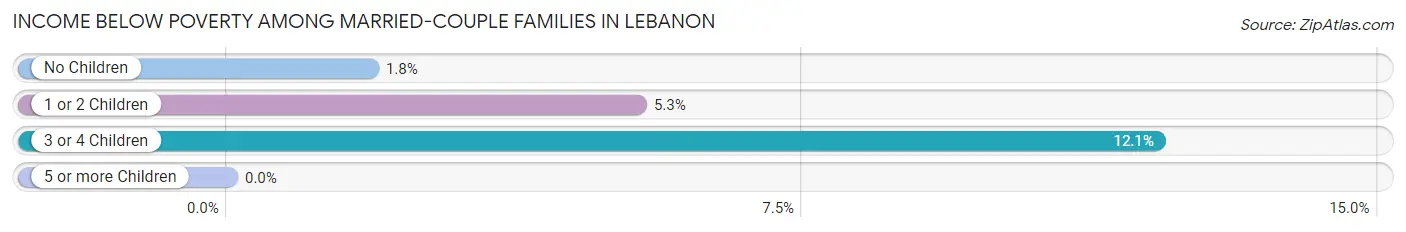
| Children | Above Poverty | Below Poverty |
| No Children | 3,894 (98.2%) | 73 (1.8%) |
| 1 or 2 Children | 2,093 (94.7%) | 118 (5.3%) |
| 3 or 4 Children | 559 (87.9%) | 77 (12.1%) |
| 5 or more Children | 44 (100.0%) | 0 (0.0%) |
| Total | 6,590 (96.1%) | 268 (3.9%) |
Income Below Poverty Among Single-Parent Households in Lebanon
According to the poverty data in Lebanon, 3.1% or 21 single-father households and 36.0% or 731 single-mother households are living below the poverty line. Among single-father households, those with 1 or 2 children have the highest poverty rate, with 21 households (5.7%) experiencing poverty. Likewise, among single-mother households, those with 5 or more children have the highest poverty rate, with 36 households (100.0%) falling below the poverty line.
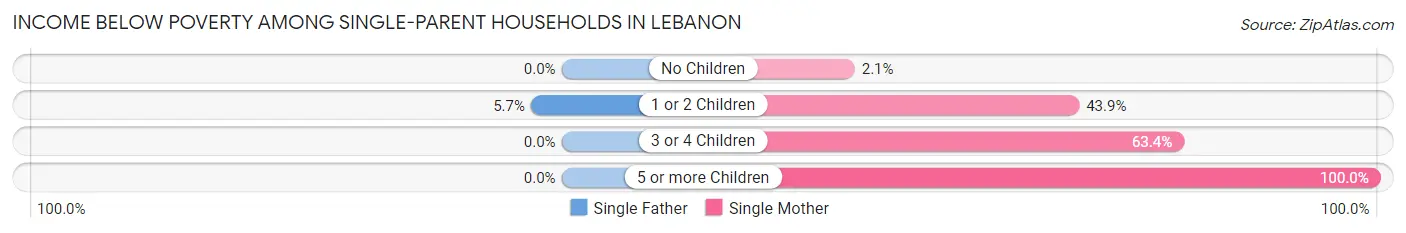
| Children | Single Father | Single Mother |
| No Children | 0 (0.0%) | 12 (2.1%) |
| 1 or 2 Children | 21 (5.7%) | 484 (43.9%) |
| 3 or 4 Children | 0 (0.0%) | 199 (63.4%) |
| 5 or more Children | 0 (0.0%) | 36 (100.0%) |
| Total | 21 (3.1%) | 731 (36.0%) |
Income Below Poverty Among Married-Couple vs Single-Parent Households in Lebanon
The poverty data for Lebanon shows that 268 of the married-couple family households (3.9%) and 752 of the single-parent households (27.7%) are living below the poverty level. Within the married-couple family households, those with 3 or 4 children have the highest poverty rate, with 77 households (12.1%) falling below the poverty line. Among the single-parent households, those with 5 or more children have the highest poverty rate, with 36 household (66.7%) living below poverty.
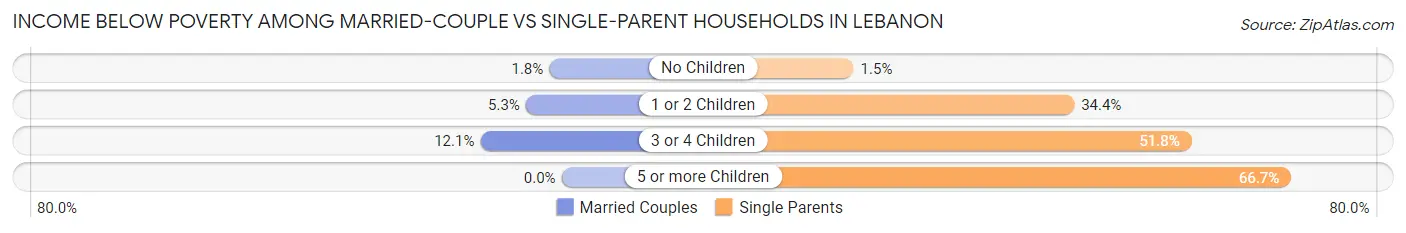
| Children | Married-Couple Families | Single-Parent Households |
| No Children | 73 (1.8%) | 12 (1.5%) |
| 1 or 2 Children | 118 (5.3%) | 505 (34.4%) |
| 3 or 4 Children | 77 (12.1%) | 199 (51.8%) |
| 5 or more Children | 0 (0.0%) | 36 (66.7%) |
| Total | 268 (3.9%) | 752 (27.7%) |
Race in Lebanon
The most populous races in Lebanon are White / Caucasian (30,728 | 77.7%), Black / African American (4,260 | 10.8%), and Two or more Races (3,003 | 7.6%).
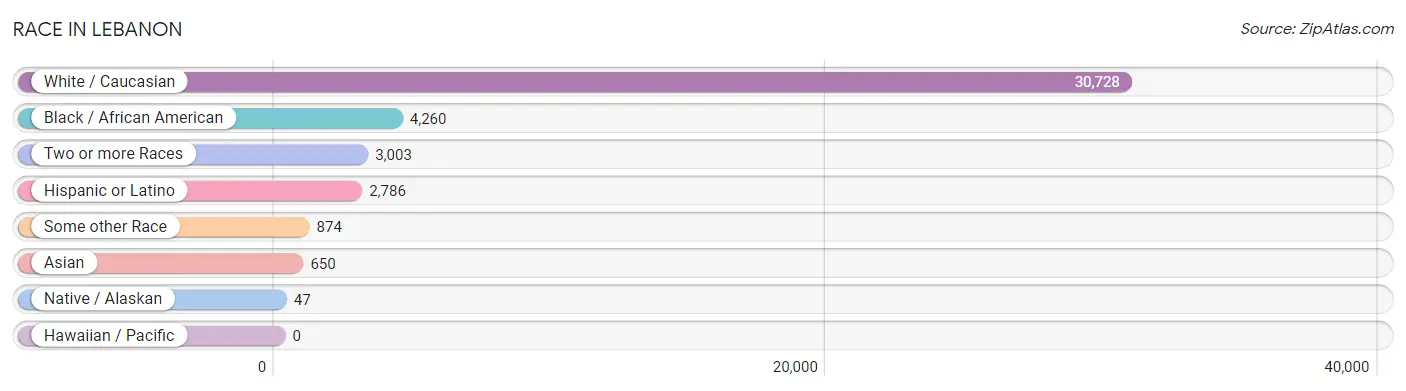
| Race | # Population | % Population |
| Asian | 650 | 1.6% |
| Black / African American | 4,260 | 10.8% |
| Hawaiian / Pacific | 0 | 0.0% |
| Hispanic or Latino | 2,786 | 7.0% |
| Native / Alaskan | 47 | 0.1% |
| White / Caucasian | 30,728 | 77.7% |
| Two or more Races | 3,003 | 7.6% |
| Some other Race | 874 | 2.2% |
| Total | 39,562 | 100.0% |
Ancestry in Lebanon
The most populous ancestries reported in Lebanon are American (5,672 | 14.3%), English (4,643 | 11.7%), Irish (4,323 | 10.9%), German (3,090 | 7.8%), and Mexican (1,432 | 3.6%), together accounting for 48.4% of all Lebanon residents.
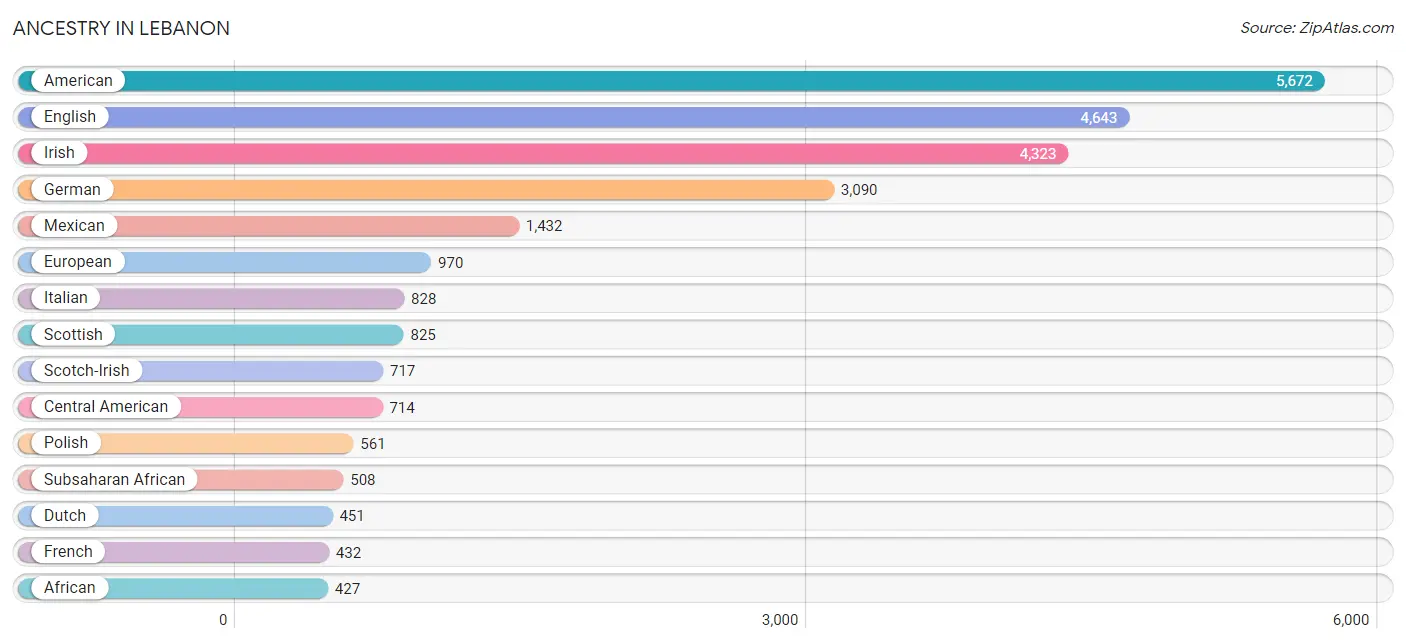
| Ancestry | # Population | % Population |
| African | 427 | 1.1% |
| Alsatian | 11 | 0.0% |
| American | 5,672 | 14.3% |
| Arab | 60 | 0.2% |
| Argentinean | 19 | 0.1% |
| Bahamian | 20 | 0.1% |
| Bhutanese | 65 | 0.2% |
| Brazilian | 44 | 0.1% |
| British | 350 | 0.9% |
| Bulgarian | 280 | 0.7% |
| Burmese | 114 | 0.3% |
| Canadian | 40 | 0.1% |
| Central American | 714 | 1.8% |
| Cherokee | 118 | 0.3% |
| Chippewa | 7 | 0.0% |
| Choctaw | 7 | 0.0% |
| Croatian | 22 | 0.1% |
| Czech | 6 | 0.0% |
| Dominican | 131 | 0.3% |
| Dutch | 451 | 1.1% |
| Eastern European | 58 | 0.2% |
| Egyptian | 16 | 0.0% |
| English | 4,643 | 11.7% |
| European | 970 | 2.5% |
| Finnish | 51 | 0.1% |
| French | 432 | 1.1% |
| French Canadian | 88 | 0.2% |
| German | 3,090 | 7.8% |
| Ghanaian | 35 | 0.1% |
| Greek | 182 | 0.5% |
| Guatemalan | 254 | 0.6% |
| Guyanese | 2 | 0.0% |
| Haitian | 20 | 0.1% |
| Honduran | 193 | 0.5% |
| Hungarian | 101 | 0.3% |
| Indian (Asian) | 35 | 0.1% |
| Irish | 4,323 | 10.9% |
| Israeli | 11 | 0.0% |
| Italian | 828 | 2.1% |
| Jamaican | 23 | 0.1% |
| Korean | 258 | 0.6% |
| Lebanese | 12 | 0.0% |
| Lithuanian | 14 | 0.0% |
| Malaysian | 29 | 0.1% |
| Mexican | 1,432 | 3.6% |
| Mexican American Indian | 11 | 0.0% |
| Nigerian | 3 | 0.0% |
| Northern European | 60 | 0.2% |
| Pakistani | 93 | 0.2% |
| Polish | 561 | 1.4% |
| Portuguese | 27 | 0.1% |
| Puerto Rican | 57 | 0.1% |
| Romanian | 17 | 0.0% |
| Russian | 33 | 0.1% |
| Salvadoran | 267 | 0.7% |
| Scandinavian | 57 | 0.1% |
| Scotch-Irish | 717 | 1.8% |
| Scottish | 825 | 2.1% |
| Seminole | 30 | 0.1% |
| Serbian | 9 | 0.0% |
| Slovak | 15 | 0.0% |
| Somali | 10 | 0.0% |
| South African | 33 | 0.1% |
| South American | 169 | 0.4% |
| Spaniard | 24 | 0.1% |
| Spanish | 77 | 0.2% |
| Sri Lankan | 33 | 0.1% |
| Subsaharan African | 508 | 1.3% |
| Swedish | 175 | 0.4% |
| Thai | 196 | 0.5% |
| Trinidadian and Tobagonian | 9 | 0.0% |
| Venezuelan | 150 | 0.4% |
| Welsh | 164 | 0.4% |
| West Indian | 2 | 0.0% | View All 74 Rows |
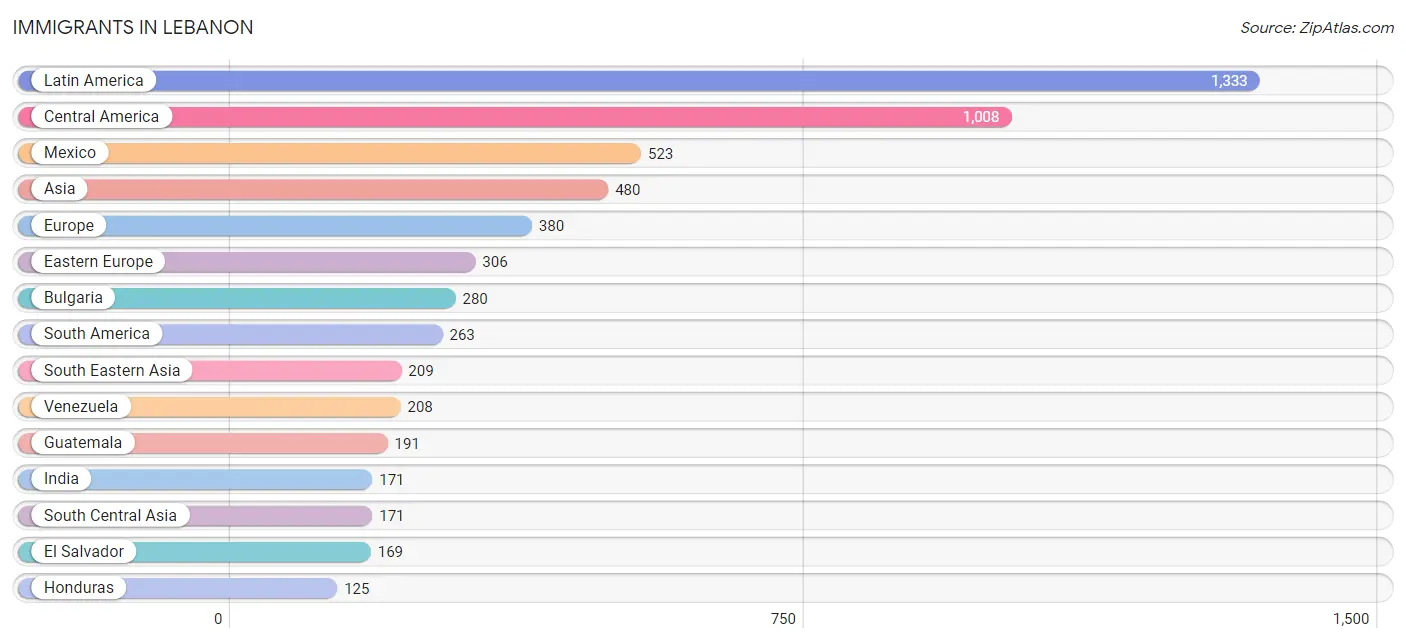
Immigrants in Lebanon
The most numerous immigrant groups reported in Lebanon came from Latin America (1,333 | 3.4%), Central America (1,008 | 2.5%), Mexico (523 | 1.3%), Asia (480 | 1.2%), and Europe (380 | 1.0%), together accounting for 9.4% of all Lebanon residents.
| Immigration Origin | # Population | % Population |
| Africa | 99 | 0.3% |
| Argentina | 2 | 0.0% |
| Asia | 480 | 1.2% |
| Brazil | 44 | 0.1% |
| Bulgaria | 280 | 0.7% |
| Canada | 100 | 0.3% |
| Caribbean | 62 | 0.2% |
| Central America | 1,008 | 2.5% |
| China | 48 | 0.1% |
| Colombia | 9 | 0.0% |
| Dominican Republic | 44 | 0.1% |
| Eastern Africa | 2 | 0.0% |
| Eastern Asia | 97 | 0.3% |
| Eastern Europe | 306 | 0.8% |
| Egypt | 61 | 0.2% |
| El Salvador | 169 | 0.4% |
| England | 2 | 0.0% |
| Europe | 380 | 1.0% |
| Germany | 68 | 0.2% |
| Ghana | 3 | 0.0% |
| Guatemala | 191 | 0.5% |
| Honduras | 125 | 0.3% |
| India | 171 | 0.4% |
| Jamaica | 16 | 0.0% |
| Kenya | 2 | 0.0% |
| Korea | 49 | 0.1% |
| Latin America | 1,333 | 3.4% |
| Mexico | 523 | 1.3% |
| Northern Africa | 61 | 0.2% |
| Northern Europe | 2 | 0.0% |
| Philippines | 83 | 0.2% |
| Romania | 17 | 0.0% |
| Serbia | 9 | 0.0% |
| South Africa | 33 | 0.1% |
| South America | 263 | 0.7% |
| South Central Asia | 171 | 0.4% |
| South Eastern Asia | 209 | 0.5% |
| Southern Europe | 4 | 0.0% |
| Spain | 4 | 0.0% |
| Thailand | 93 | 0.2% |
| Turkey | 3 | 0.0% |
| Venezuela | 208 | 0.5% |
| Vietnam | 33 | 0.1% |
| Western Africa | 3 | 0.0% |
| Western Asia | 3 | 0.0% |
| Western Europe | 68 | 0.2% | View All 46 Rows |
Sex and Age in Lebanon
Sex and Age in Lebanon
The most populous age groups in Lebanon are 30 to 34 Years (1,847 | 9.9%) for men and 20 to 24 Years (1,792 | 8.6%) for women.
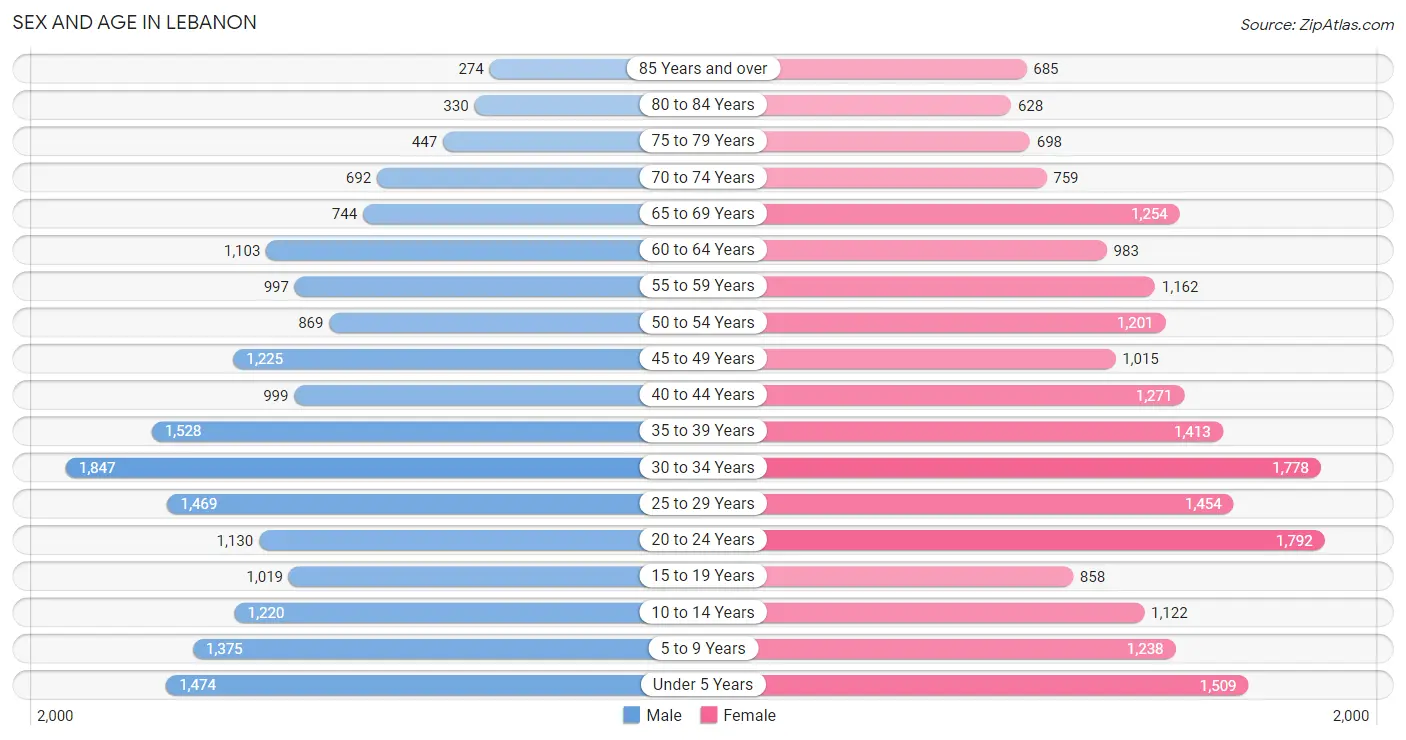
| Age Bracket | Male | Female |
| Under 5 Years | 1,474 (7.9%) | 1,509 (7.2%) |
| 5 to 9 Years | 1,375 (7.3%) | 1,238 (5.9%) |
| 10 to 14 Years | 1,220 (6.5%) | 1,122 (5.4%) |
| 15 to 19 Years | 1,019 (5.4%) | 858 (4.1%) |
| 20 to 24 Years | 1,130 (6.0%) | 1,792 (8.6%) |
| 25 to 29 Years | 1,469 (7.8%) | 1,454 (7.0%) |
| 30 to 34 Years | 1,847 (9.9%) | 1,778 (8.5%) |
| 35 to 39 Years | 1,528 (8.2%) | 1,413 (6.8%) |
| 40 to 44 Years | 999 (5.3%) | 1,271 (6.1%) |
| 45 to 49 Years | 1,225 (6.5%) | 1,015 (4.9%) |
| 50 to 54 Years | 869 (4.6%) | 1,201 (5.8%) |
| 55 to 59 Years | 997 (5.3%) | 1,162 (5.6%) |
| 60 to 64 Years | 1,103 (5.9%) | 983 (4.7%) |
| 65 to 69 Years | 744 (4.0%) | 1,254 (6.0%) |
| 70 to 74 Years | 692 (3.7%) | 759 (3.6%) |
| 75 to 79 Years | 447 (2.4%) | 698 (3.4%) |
| 80 to 84 Years | 330 (1.8%) | 628 (3.0%) |
| 85 Years and over | 274 (1.5%) | 685 (3.3%) |
| Total | 18,742 (100.0%) | 20,820 (100.0%) |
Families and Households in Lebanon
Median Family Size in Lebanon
The median family size in Lebanon is 3.06 persons per family, with married-couple families (6,858 | 71.7%) accounting for the largest median family size of 3.09 persons per family. On the other hand, single female/mother families (2,032 | 21.2%) represent the smallest median family size with 2.97 persons per family.
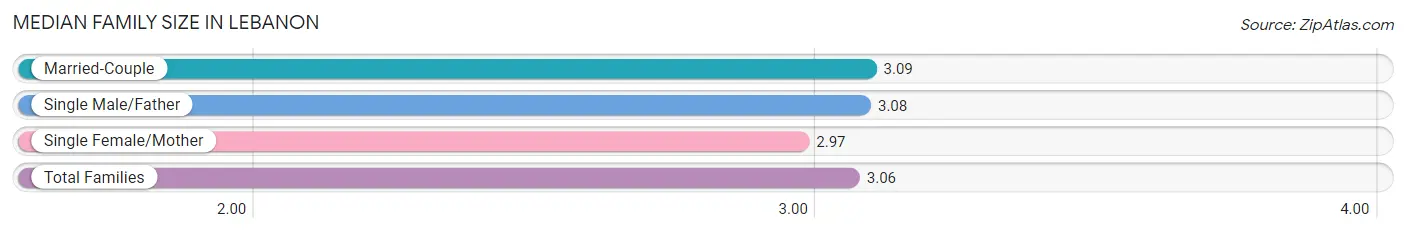
| Family Type | # Families | Family Size |
| Married-Couple | 6,858 (71.7%) | 3.09 |
| Single Male/Father | 679 (7.1%) | 3.08 |
| Single Female/Mother | 2,032 (21.2%) | 2.97 |
| Total Families | 9,569 (100.0%) | 3.06 |
Median Household Size in Lebanon
The median household size in Lebanon is 2.53 persons per household, with single male/father households (679 | 4.5%) accounting for the largest median household size of 3.86 persons per household. non-family households (5,445 | 36.3%) represent the smallest median household size with 1.34 persons per household.
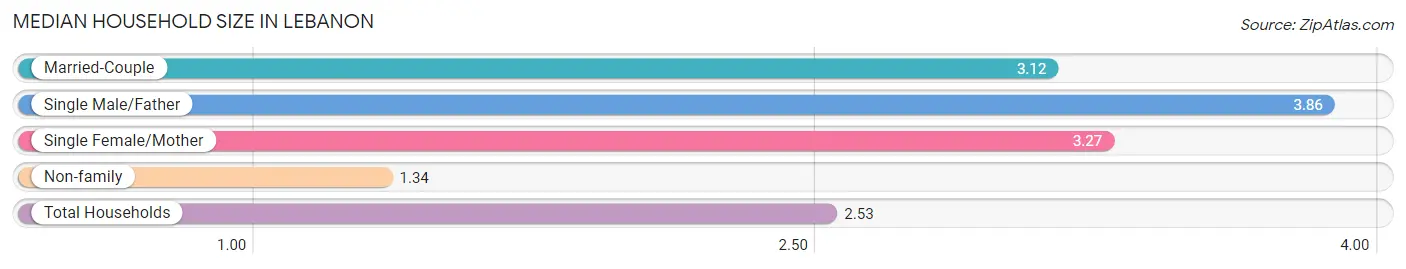
| Household Type | # Households | Household Size |
| Married-Couple | 6,858 (45.7%) | 3.12 |
| Single Male/Father | 679 (4.5%) | 3.86 |
| Single Female/Mother | 2,032 (13.5%) | 3.27 |
| Non-family | 5,445 (36.3%) | 1.34 |
| Total Households | 15,014 (100.0%) | 2.53 |
Household Size by Marriage Status in Lebanon
Out of a total of 15,014 households in Lebanon, 9,569 (63.7%) are family households, while 5,445 (36.3%) are nonfamily households. The most numerous type of family households are 2-person households, comprising 3,950, and the most common type of nonfamily households are 1-person households, comprising 4,333.
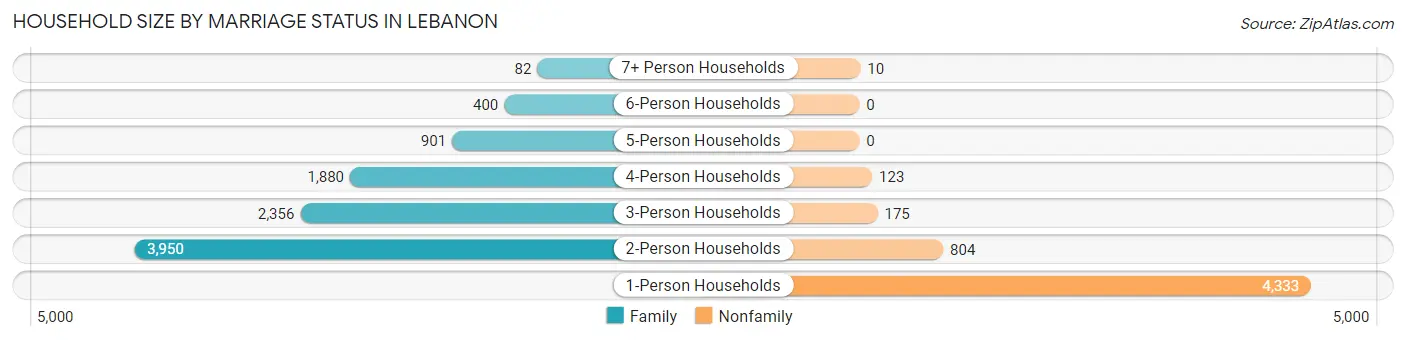
| Household Size | Family Households | Nonfamily Households |
| 1-Person Households | - | 4,333 (28.9%) |
| 2-Person Households | 3,950 (26.3%) | 804 (5.4%) |
| 3-Person Households | 2,356 (15.7%) | 175 (1.2%) |
| 4-Person Households | 1,880 (12.5%) | 123 (0.8%) |
| 5-Person Households | 901 (6.0%) | 0 (0.0%) |
| 6-Person Households | 400 (2.7%) | 0 (0.0%) |
| 7+ Person Households | 82 (0.5%) | 10 (0.1%) |
| Total | 9,569 (63.7%) | 5,445 (36.3%) |
Female Fertility in Lebanon
Fertility by Age in Lebanon
Average fertility rate in Lebanon is 58.0 births per 1,000 women. Women in the age bracket of 20 to 34 years have the highest fertility rate with 80.0 births per 1,000 women. Women in the age bracket of 20 to 34 years acount for 69.9% of all women with births.
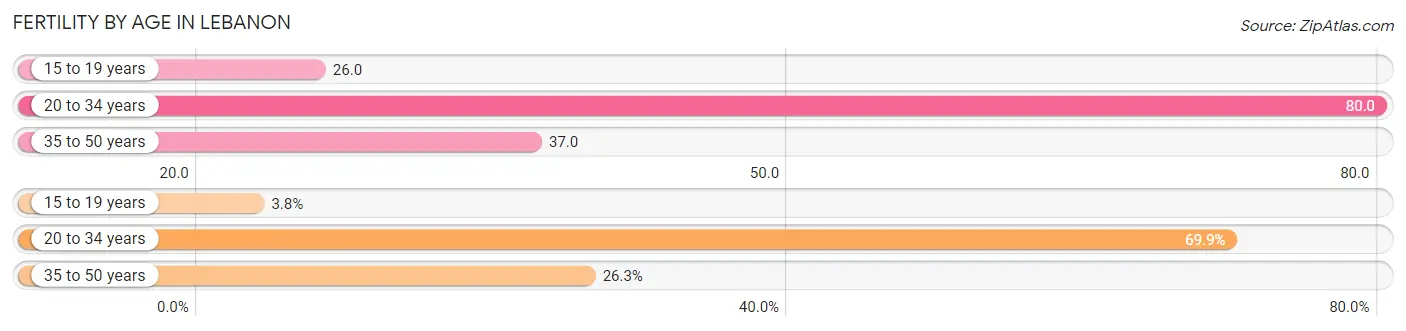
| Age Bracket | Women with Births | Births / 1,000 Women |
| 15 to 19 years | 22 (3.8%) | 26.0 |
| 20 to 34 years | 401 (69.9%) | 80.0 |
| 35 to 50 years | 151 (26.3%) | 37.0 |
| Total | 574 (100.0%) | 58.0 |
Fertility by Age by Marriage Status in Lebanon
63.1% of women with births (574) in Lebanon are married. The highest percentage of unmarried women with births falls into 15 to 19 years age bracket with 100.0% of them unmarried at the time of birth, while the lowest percentage of unmarried women with births belong to 20 to 34 years age bracket with 29.7% of them unmarried.
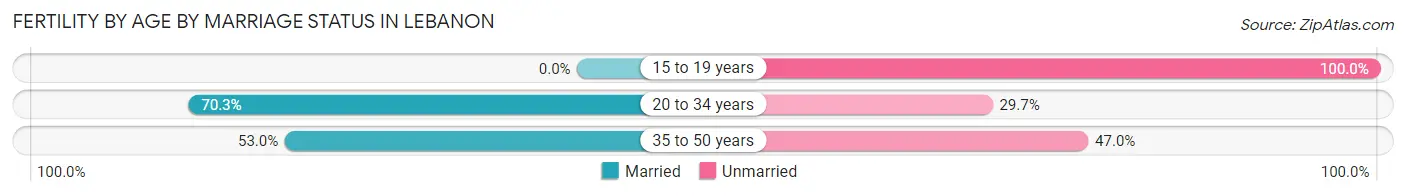
| Age Bracket | Married | Unmarried |
| 15 to 19 years | 0 (0.0%) | 22 (100.0%) |
| 20 to 34 years | 282 (70.3%) | 119 (29.7%) |
| 35 to 50 years | 80 (53.0%) | 71 (47.0%) |
| Total | 362 (63.1%) | 212 (36.9%) |
Fertility by Education in Lebanon
Average fertility rate in Lebanon is 58.0 births per 1,000 women. Women with the education attainment of bachelor's degree have the highest fertility rate of 96.0 births per 1,000 women, while women with the education attainment of high school diploma have the lowest fertility at 38.0 births per 1,000 women. Women with the education attainment of bachelor's degree represent 34.0% of all women with births.
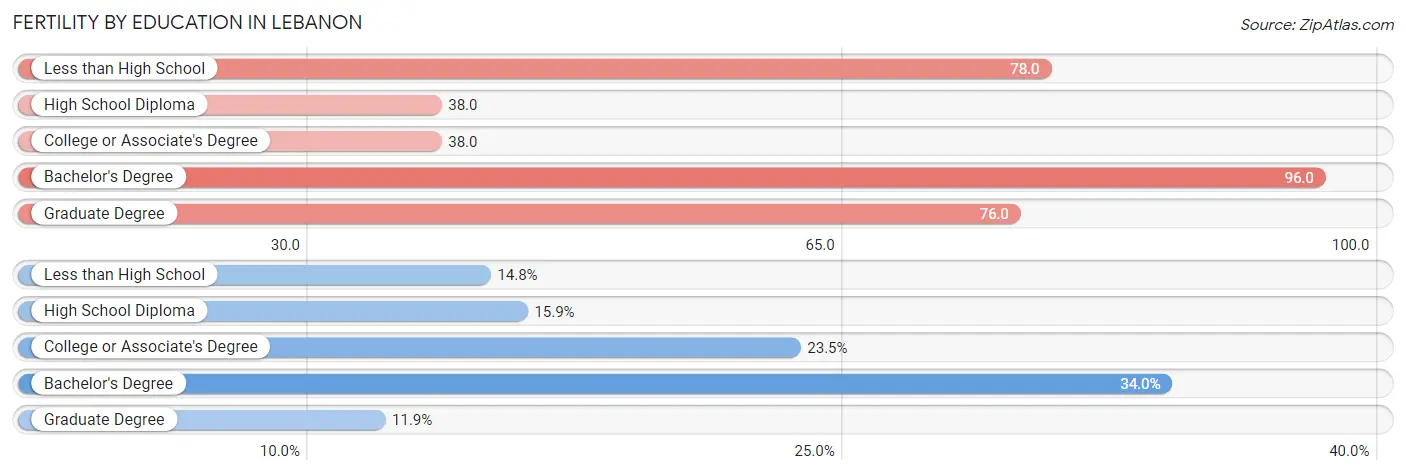
| Educational Attainment | Women with Births | Births / 1,000 Women |
| Less than High School | 85 (14.8%) | 78.0 |
| High School Diploma | 91 (15.9%) | 38.0 |
| College or Associate's Degree | 135 (23.5%) | 38.0 |
| Bachelor's Degree | 195 (34.0%) | 96.0 |
| Graduate Degree | 68 (11.8%) | 76.0 |
| Total | 574 (100.0%) | 58.0 |
Fertility by Education by Marriage Status in Lebanon
36.9% of women with births in Lebanon are unmarried. Women with the educational attainment of graduate degree are most likely to be married with 100.0% of them married at childbirth, while women with the educational attainment of less than high school are least likely to be married with 100.0% of them unmarried at childbirth.
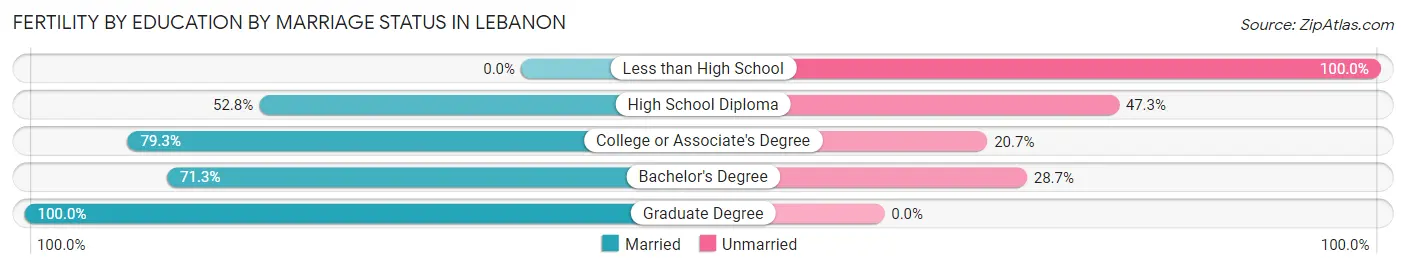
| Educational Attainment | Married | Unmarried |
| Less than High School | 0 (0.0%) | 85 (100.0%) |
| High School Diploma | 48 (52.7%) | 43 (47.2%) |
| College or Associate's Degree | 107 (79.3%) | 28 (20.7%) |
| Bachelor's Degree | 139 (71.3%) | 56 (28.7%) |
| Graduate Degree | 68 (100.0%) | 0 (0.0%) |
| Total | 362 (63.1%) | 212 (36.9%) |
Employment Characteristics in Lebanon
Employment by Class of Employer in Lebanon
Among the 18,869 employed individuals in Lebanon, private company employees (13,838 | 73.3%), local government employees (1,436 | 7.6%), and not-for-profit organizations (1,002 | 5.3%) make up the most common classes of employment.
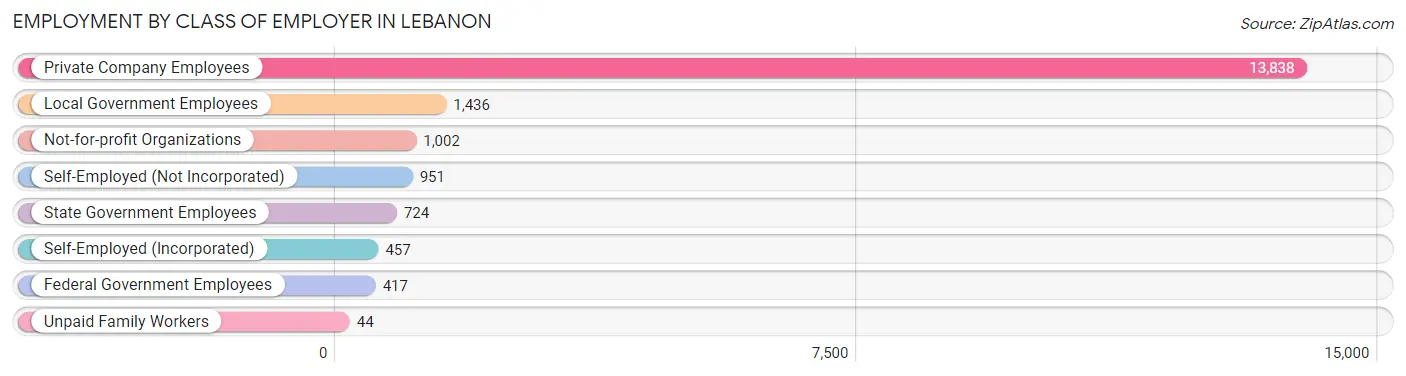
| Employer Class | # Employees | % Employees |
| Private Company Employees | 13,838 | 73.3% |
| Self-Employed (Incorporated) | 457 | 2.4% |
| Self-Employed (Not Incorporated) | 951 | 5.0% |
| Not-for-profit Organizations | 1,002 | 5.3% |
| Local Government Employees | 1,436 | 7.6% |
| State Government Employees | 724 | 3.8% |
| Federal Government Employees | 417 | 2.2% |
| Unpaid Family Workers | 44 | 0.2% |
| Total | 18,869 | 100.0% |
Employment Status by Age in Lebanon
According to the labor force statistics for Lebanon, out of the total population over 16 years of age (31,405), 63.4% or 19,911 individuals are in the labor force, with 3.0% or 597 of them unemployed. The age group with the highest labor force participation rate is 25 to 29 years, with 89.6% or 2,619 individuals in the labor force. Within the labor force, the 16 to 19 years age range has the highest percentage of unemployed individuals, with 19.0% or 126 of them being unemployed.
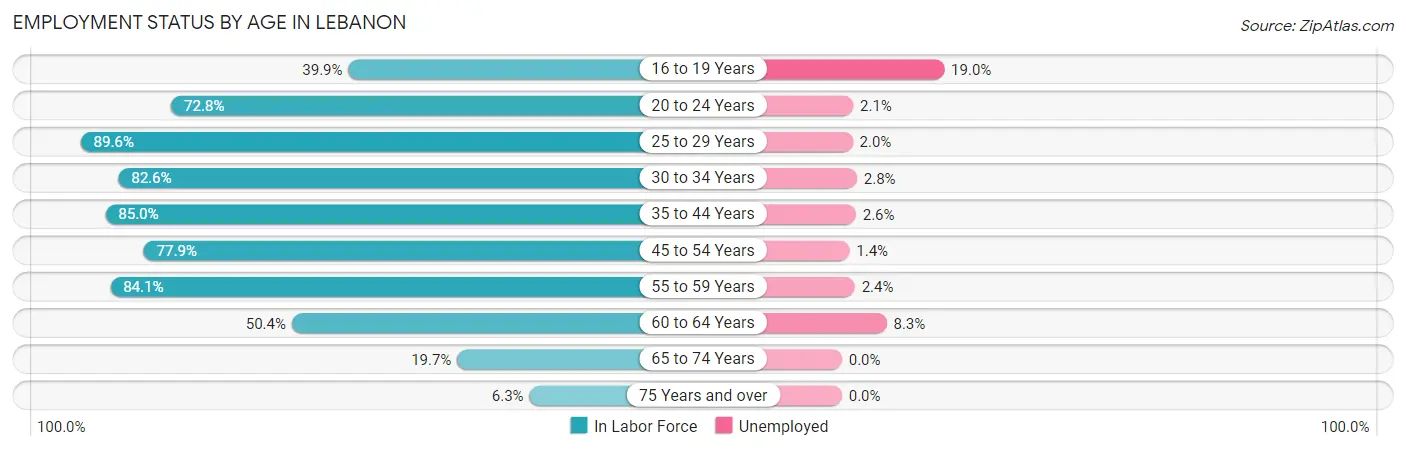
| Age Bracket | In Labor Force | Unemployed |
| 16 to 19 Years | 662 (39.9%) | 126 (19.0%) |
| 20 to 24 Years | 2,127 (72.8%) | 45 (2.1%) |
| 25 to 29 Years | 2,619 (89.6%) | 52 (2.0%) |
| 30 to 34 Years | 2,994 (82.6%) | 84 (2.8%) |
| 35 to 44 Years | 4,429 (85.0%) | 115 (2.6%) |
| 45 to 54 Years | 3,357 (77.9%) | 47 (1.4%) |
| 55 to 59 Years | 1,816 (84.1%) | 44 (2.4%) |
| 60 to 64 Years | 1,051 (50.4%) | 87 (8.3%) |
| 65 to 74 Years | 679 (19.7%) | 0 (0.0%) |
| 75 Years and over | 193 (6.3%) | 0 (0.0%) |
| Total | 19,911 (63.4%) | 597 (3.0%) |
Employment Status by Educational Attainment in Lebanon
According to labor force statistics for Lebanon, 80.1% of individuals (16,272) out of the total population between 25 and 64 years of age (20,314) are in the labor force, with 2.7% or 439 of them being unemployed. The group with the highest labor force participation rate are those with the educational attainment of bachelor's degree or higher, with 92.4% or 5,937 individuals in the labor force. Within the labor force, individuals with less than high school education have the highest percentage of unemployment, with 18.4% or 172 of them being unemployed.
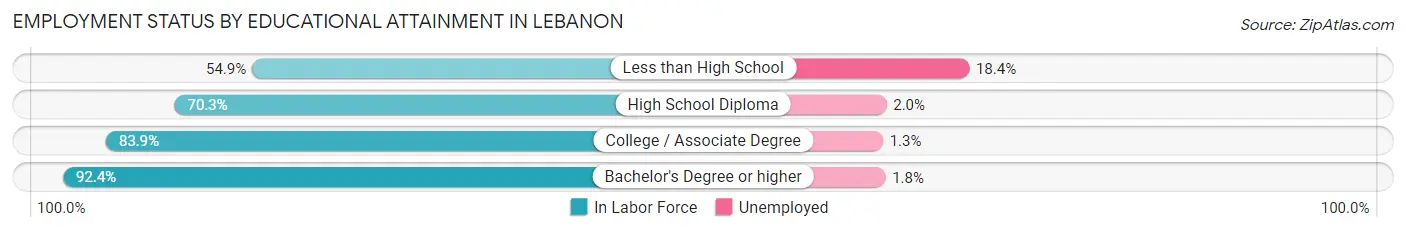
| Educational Attainment | In Labor Force | Unemployed |
| Less than High School | 937 (54.9%) | 314 (18.4%) |
| High School Diploma | 4,314 (70.3%) | 123 (2.0%) |
| College / Associate Degree | 5,073 (83.9%) | 79 (1.3%) |
| Bachelor's Degree or higher | 5,937 (92.4%) | 116 (1.8%) |
| Total | 16,272 (80.1%) | 548 (2.7%) |
Employment Occupations by Sex in Lebanon
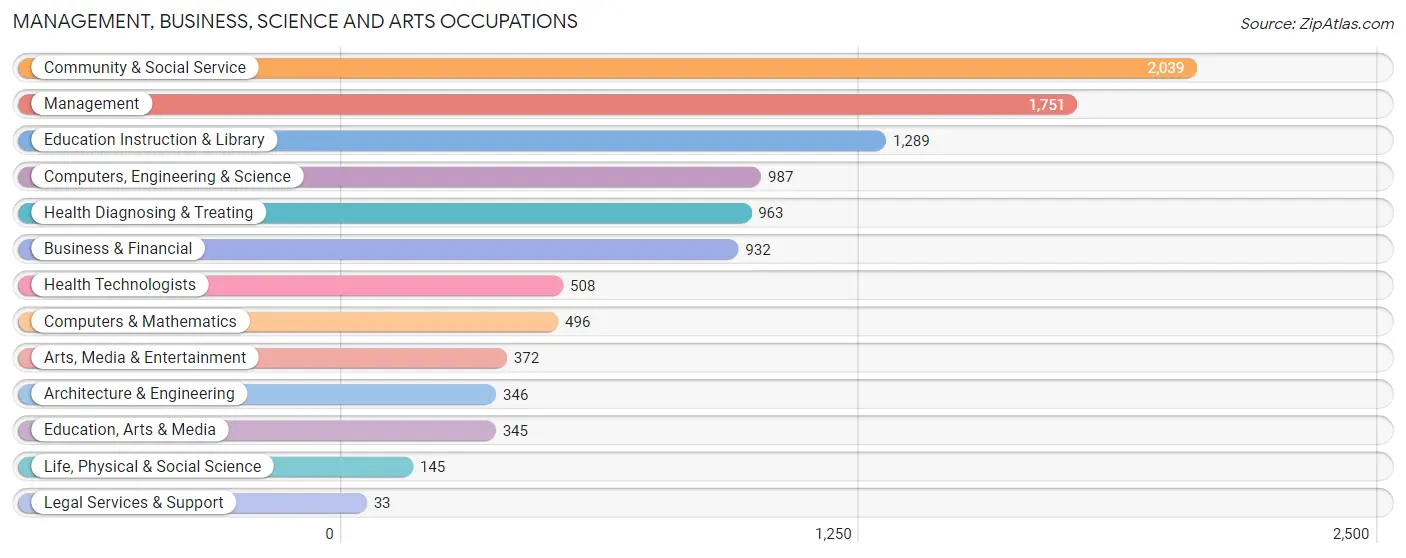
Management, Business, Science and Arts Occupations
The most common Management, Business, Science and Arts occupations in Lebanon are Community & Social Service (2,039 | 10.6%), Management (1,751 | 9.1%), Education Instruction & Library (1,289 | 6.7%), Computers, Engineering & Science (987 | 5.1%), and Health Diagnosing & Treating (963 | 5.0%).
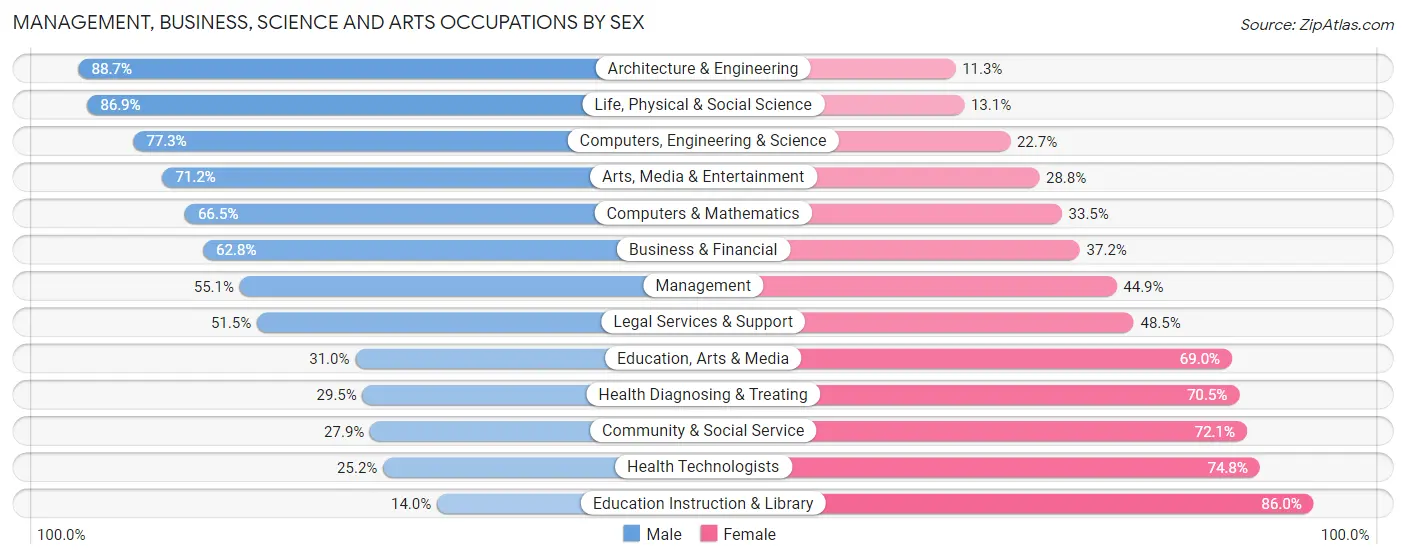
Management, Business, Science and Arts Occupations by Sex
Within the Management, Business, Science and Arts occupations in Lebanon, the most male-oriented occupations are Architecture & Engineering (88.7%), Life, Physical & Social Science (86.9%), and Computers, Engineering & Science (77.3%), while the most female-oriented occupations are Education Instruction & Library (86.0%), Health Technologists (74.8%), and Community & Social Service (72.1%).
| Occupation | Male | Female |
| Management | 965 (55.1%) | 786 (44.9%) |
| Business & Financial | 585 (62.8%) | 347 (37.2%) |
| Computers, Engineering & Science | 763 (77.3%) | 224 (22.7%) |
| Computers & Mathematics | 330 (66.5%) | 166 (33.5%) |
| Architecture & Engineering | 307 (88.7%) | 39 (11.3%) |
| Life, Physical & Social Science | 126 (86.9%) | 19 (13.1%) |
| Community & Social Service | 569 (27.9%) | 1,470 (72.1%) |
| Education, Arts & Media | 107 (31.0%) | 238 (69.0%) |
| Legal Services & Support | 17 (51.5%) | 16 (48.5%) |
| Education Instruction & Library | 180 (14.0%) | 1,109 (86.0%) |
| Arts, Media & Entertainment | 265 (71.2%) | 107 (28.8%) |
| Health Diagnosing & Treating | 284 (29.5%) | 679 (70.5%) |
| Health Technologists | 128 (25.2%) | 380 (74.8%) |
| Total (Category) | 3,166 (47.4%) | 3,506 (52.5%) |
| Total (Overall) | 10,020 (51.9%) | 9,280 (48.1%) |
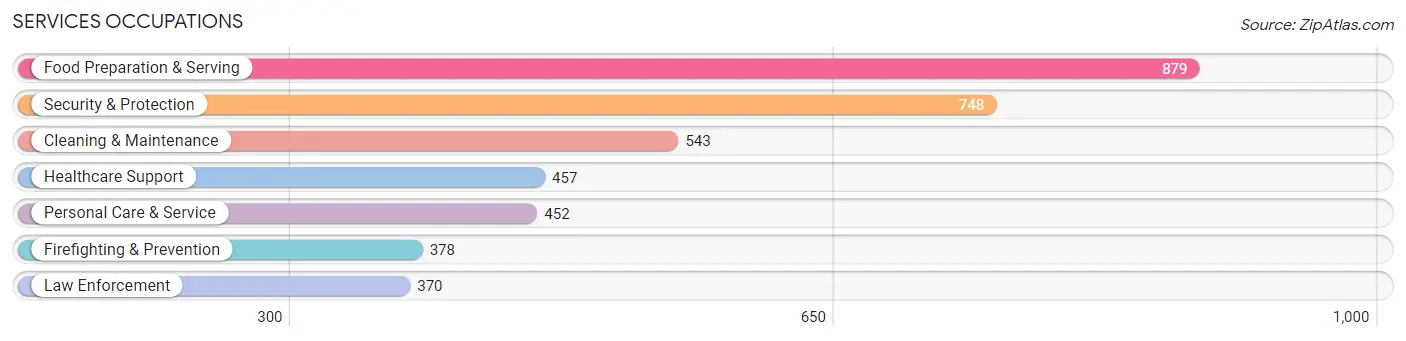
Services Occupations
The most common Services occupations in Lebanon are Food Preparation & Serving (879 | 4.5%), Security & Protection (748 | 3.9%), Cleaning & Maintenance (543 | 2.8%), Healthcare Support (457 | 2.4%), and Personal Care & Service (452 | 2.3%).
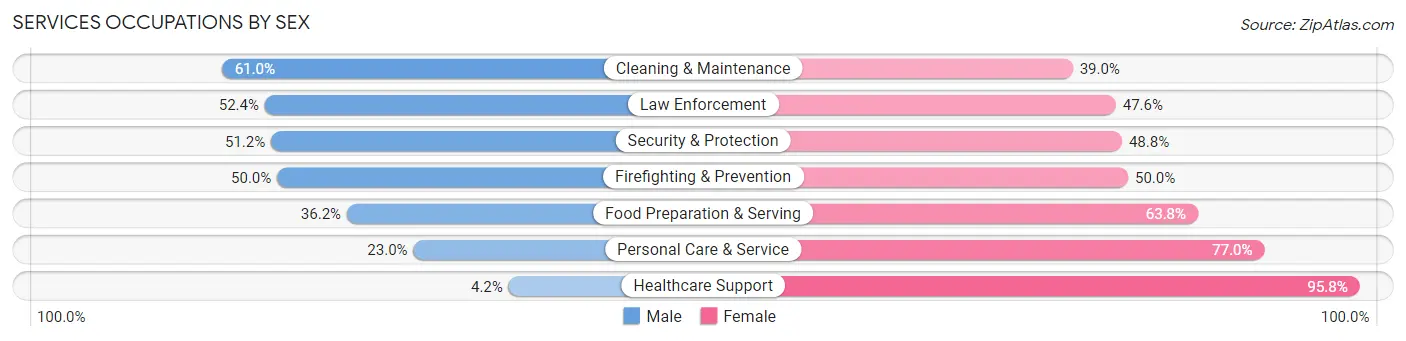
Services Occupations by Sex
Within the Services occupations in Lebanon, the most male-oriented occupations are Cleaning & Maintenance (61.0%), Law Enforcement (52.4%), and Security & Protection (51.2%), while the most female-oriented occupations are Healthcare Support (95.8%), Personal Care & Service (77.0%), and Food Preparation & Serving (63.8%).
| Occupation | Male | Female |
| Healthcare Support | 19 (4.2%) | 438 (95.8%) |
| Security & Protection | 383 (51.2%) | 365 (48.8%) |
| Firefighting & Prevention | 189 (50.0%) | 189 (50.0%) |
| Law Enforcement | 194 (52.4%) | 176 (47.6%) |
| Food Preparation & Serving | 318 (36.2%) | 561 (63.8%) |
| Cleaning & Maintenance | 331 (61.0%) | 212 (39.0%) |
| Personal Care & Service | 104 (23.0%) | 348 (77.0%) |
| Total (Category) | 1,155 (37.5%) | 1,924 (62.5%) |
| Total (Overall) | 10,020 (51.9%) | 9,280 (48.1%) |
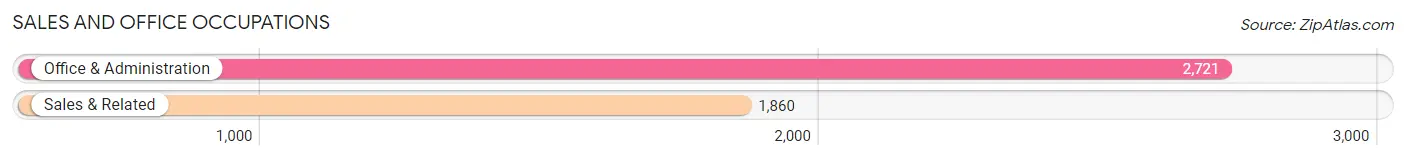
Sales and Office Occupations
The most common Sales and Office occupations in Lebanon are Office & Administration (2,721 | 14.1%), and Sales & Related (1,860 | 9.6%).
Sales and Office Occupations by Sex
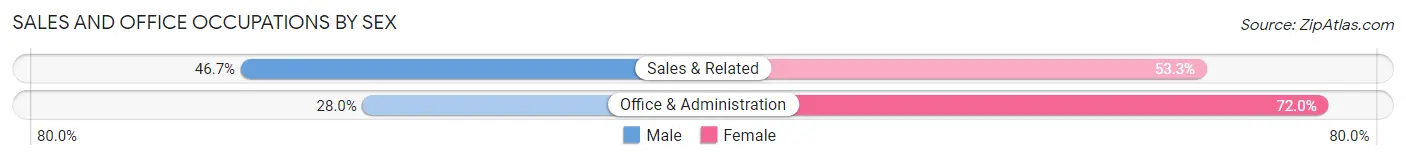
| Occupation | Male | Female |
| Sales & Related | 869 (46.7%) | 991 (53.3%) |
| Office & Administration | 762 (28.0%) | 1,959 (72.0%) |
| Total (Category) | 1,631 (35.6%) | 2,950 (64.4%) |
| Total (Overall) | 10,020 (51.9%) | 9,280 (48.1%) |
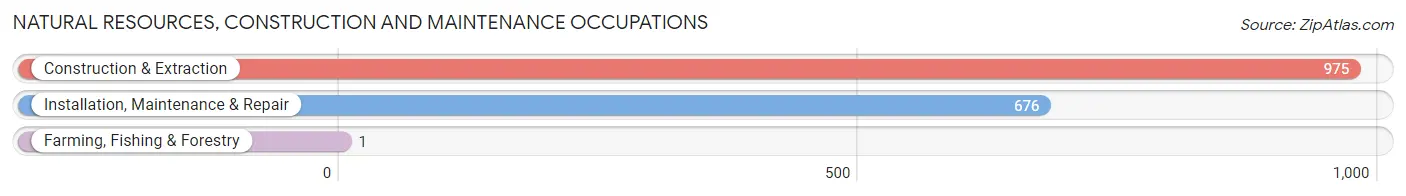
Natural Resources, Construction and Maintenance Occupations
The most common Natural Resources, Construction and Maintenance occupations in Lebanon are Construction & Extraction (975 | 5.1%), Installation, Maintenance & Repair (676 | 3.5%), and Farming, Fishing & Forestry (1 | 0.0%).
Natural Resources, Construction and Maintenance Occupations by Sex
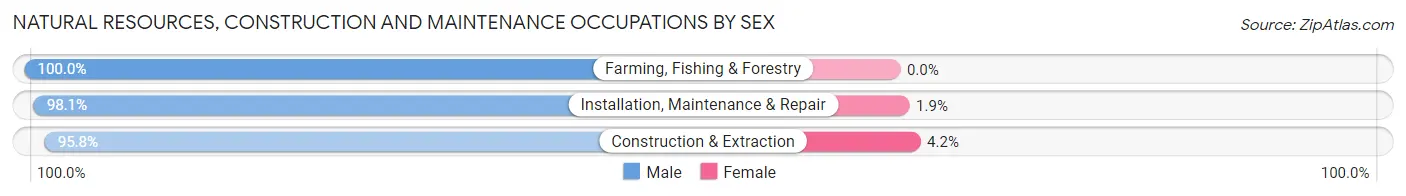
| Occupation | Male | Female |
| Farming, Fishing & Forestry | 1 (100.0%) | 0 (0.0%) |
| Construction & Extraction | 934 (95.8%) | 41 (4.2%) |
| Installation, Maintenance & Repair | 663 (98.1%) | 13 (1.9%) |
| Total (Category) | 1,598 (96.7%) | 54 (3.3%) |
| Total (Overall) | 10,020 (51.9%) | 9,280 (48.1%) |
Production, Transportation and Moving Occupations
The most common Production, Transportation and Moving occupations in Lebanon are Production (1,670 | 8.6%), Transportation (870 | 4.5%), and Material Moving (776 | 4.0%).
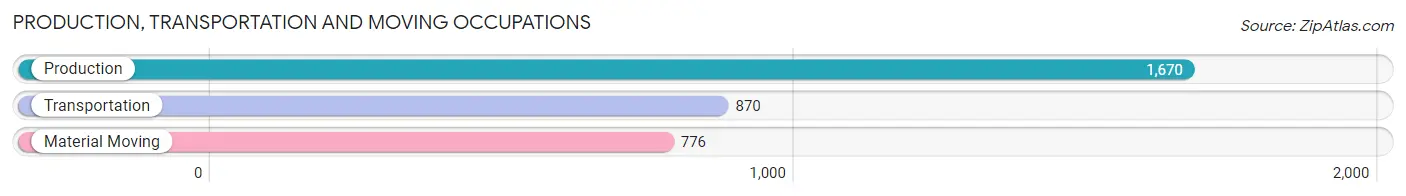
Production, Transportation and Moving Occupations by Sex
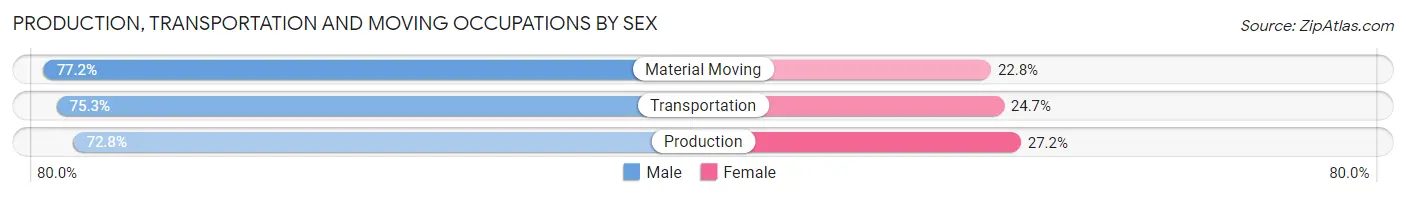
| Occupation | Male | Female |
| Production | 1,216 (72.8%) | 454 (27.2%) |
| Transportation | 655 (75.3%) | 215 (24.7%) |
| Material Moving | 599 (77.2%) | 177 (22.8%) |
| Total (Category) | 2,470 (74.5%) | 846 (25.5%) |
| Total (Overall) | 10,020 (51.9%) | 9,280 (48.1%) |
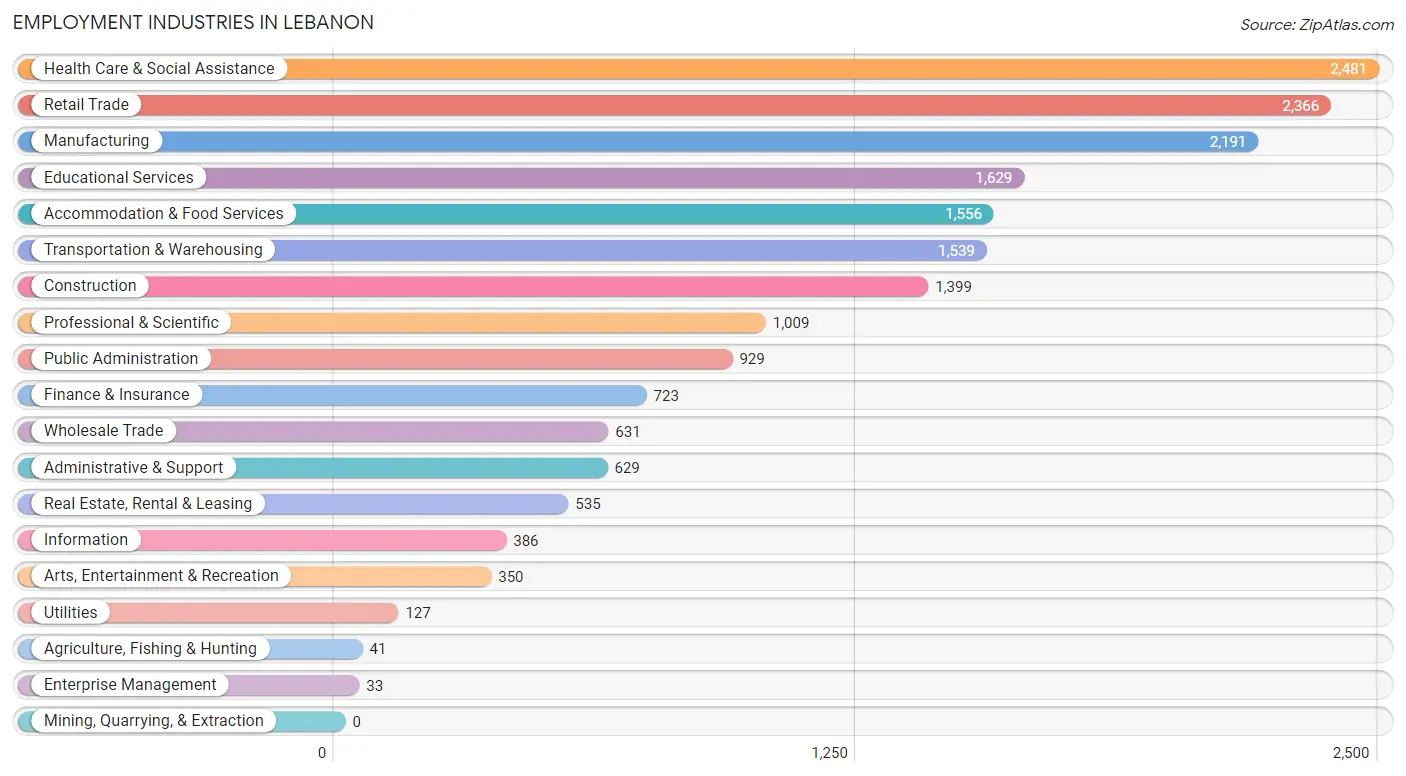
Employment Industries by Sex in Lebanon
Employment Industries in Lebanon
The major employment industries in Lebanon include Health Care & Social Assistance (2,481 | 12.9%), Retail Trade (2,366 | 12.3%), Manufacturing (2,191 | 11.4%), Educational Services (1,629 | 8.4%), and Accommodation & Food Services (1,556 | 8.1%).
Employment Industries by Sex in Lebanon
The Lebanon industries that see more men than women are Enterprise Management (100.0%), Construction (88.7%), and Manufacturing (77.4%), whereas the industries that tend to have a higher number of women are Agriculture, Fishing & Hunting (87.8%), Educational Services (77.3%), and Health Care & Social Assistance (74.0%).
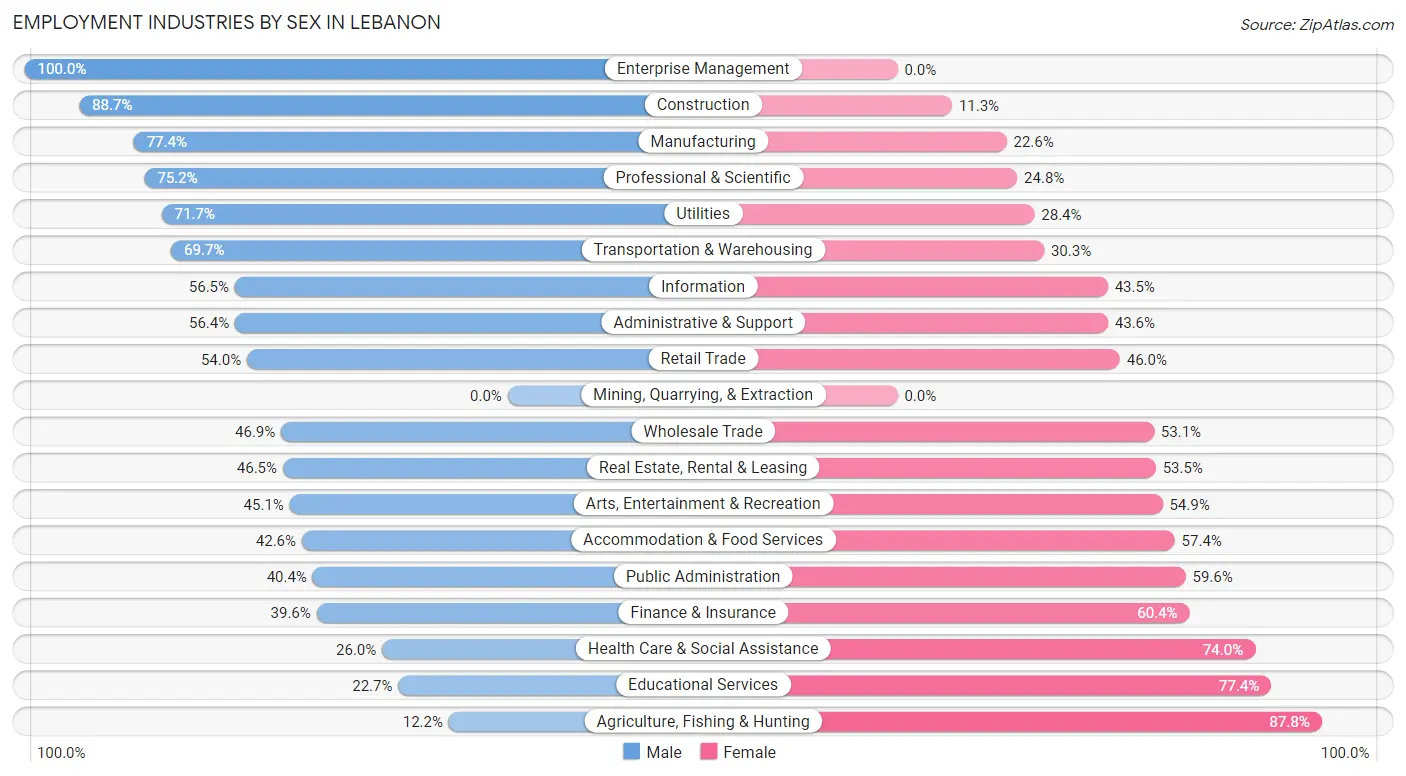
| Industry | Male | Female |
| Agriculture, Fishing & Hunting | 5 (12.2%) | 36 (87.8%) |
| Mining, Quarrying, & Extraction | 0 (0.0%) | 0 (0.0%) |
| Construction | 1,241 (88.7%) | 158 (11.3%) |
| Manufacturing | 1,696 (77.4%) | 495 (22.6%) |
| Wholesale Trade | 296 (46.9%) | 335 (53.1%) |
| Retail Trade | 1,277 (54.0%) | 1,089 (46.0%) |
| Transportation & Warehousing | 1,072 (69.7%) | 467 (30.3%) |
| Utilities | 91 (71.7%) | 36 (28.3%) |
| Information | 218 (56.5%) | 168 (43.5%) |
| Finance & Insurance | 286 (39.6%) | 437 (60.4%) |
| Real Estate, Rental & Leasing | 249 (46.5%) | 286 (53.5%) |
| Professional & Scientific | 759 (75.2%) | 250 (24.8%) |
| Enterprise Management | 33 (100.0%) | 0 (0.0%) |
| Administrative & Support | 355 (56.4%) | 274 (43.6%) |
| Educational Services | 369 (22.7%) | 1,260 (77.3%) |
| Health Care & Social Assistance | 645 (26.0%) | 1,836 (74.0%) |
| Arts, Entertainment & Recreation | 158 (45.1%) | 192 (54.9%) |
| Accommodation & Food Services | 663 (42.6%) | 893 (57.4%) |
| Public Administration | 375 (40.4%) | 554 (59.6%) |
| Total | 10,020 (51.9%) | 9,280 (48.1%) |
Education in Lebanon
School Enrollment in Lebanon
The most common levels of schooling among the 8,231 students in Lebanon are elementary school (2,343 | 28.5%), middle school (1,624 | 19.7%), and high school (1,524 | 18.5%).
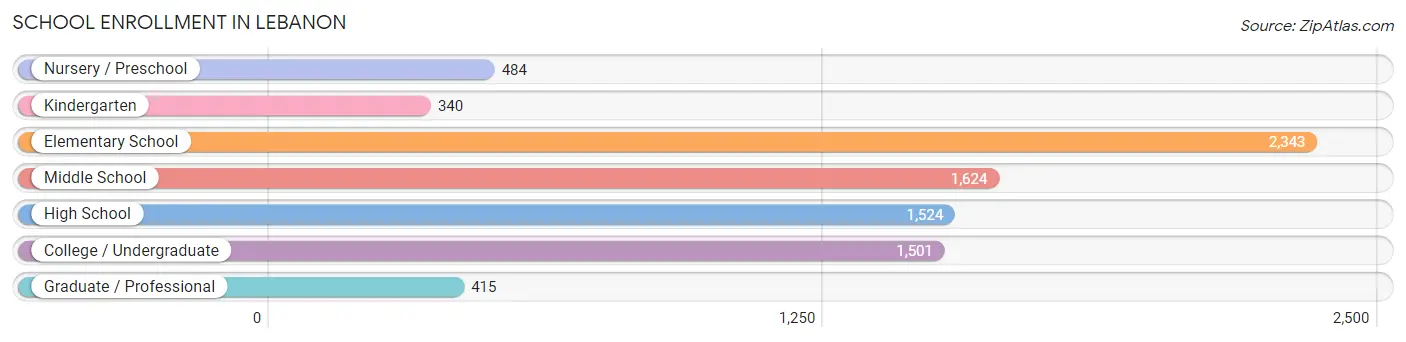
| School Level | # Students | % Students |
| Nursery / Preschool | 484 | 5.9% |
| Kindergarten | 340 | 4.1% |
| Elementary School | 2,343 | 28.5% |
| Middle School | 1,624 | 19.7% |
| High School | 1,524 | 18.5% |
| College / Undergraduate | 1,501 | 18.2% |
| Graduate / Professional | 415 | 5.0% |
| Total | 8,231 | 100.0% |
School Enrollment by Age by Funding Source in Lebanon
Out of a total of 8,231 students who are enrolled in schools in Lebanon, 1,671 (20.3%) attend a private institution, while the remaining 6,560 (79.7%) are enrolled in public schools. The age group of 35 years and over has the highest likelihood of being enrolled in private schools, with 258 (62.9% in the age bracket) enrolled. Conversely, the age group of 10 to 14 year olds has the lowest likelihood of being enrolled in a private school, with 2,022 (95.5% in the age bracket) attending a public institution.
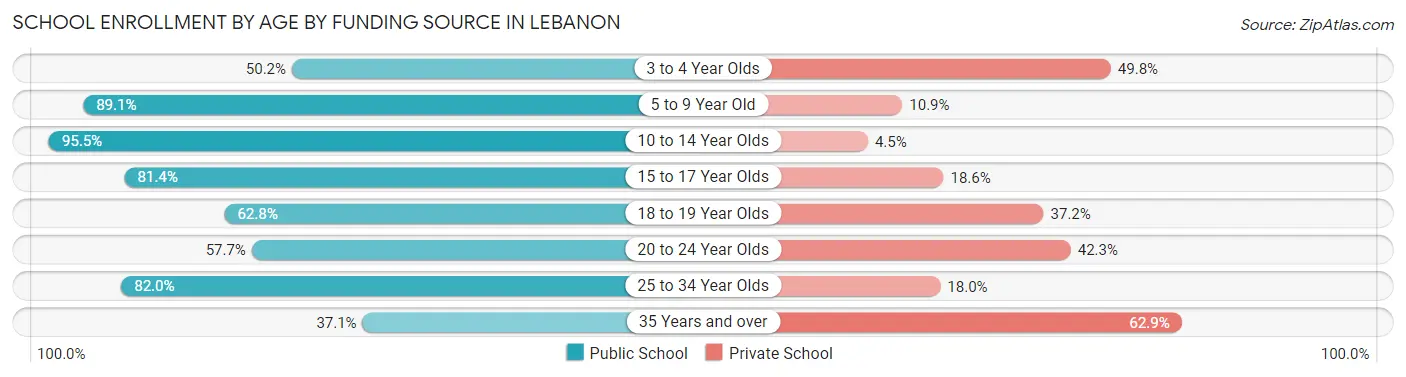
| Age Bracket | Public School | Private School |
| 3 to 4 Year Olds | 225 (50.2%) | 223 (49.8%) |
| 5 to 9 Year Old | 2,217 (89.1%) | 272 (10.9%) |
| 10 to 14 Year Olds | 2,022 (95.5%) | 96 (4.5%) |
| 15 to 17 Year Olds | 774 (81.4%) | 177 (18.6%) |
| 18 to 19 Year Olds | 369 (62.8%) | 219 (37.2%) |
| 20 to 24 Year Olds | 487 (57.7%) | 357 (42.3%) |
| 25 to 34 Year Olds | 314 (82.0%) | 69 (18.0%) |
| 35 Years and over | 152 (37.1%) | 258 (62.9%) |
| Total | 6,560 (79.7%) | 1,671 (20.3%) |
Educational Attainment by Field of Study in Lebanon
Business (1,928 | 22.7%), education (983 | 11.6%), arts & humanities (942 | 11.1%), science & technology (724 | 8.5%), and literature & languages (672 | 7.9%) are the most common fields of study among 8,489 individuals in Lebanon who have obtained a bachelor's degree or higher.
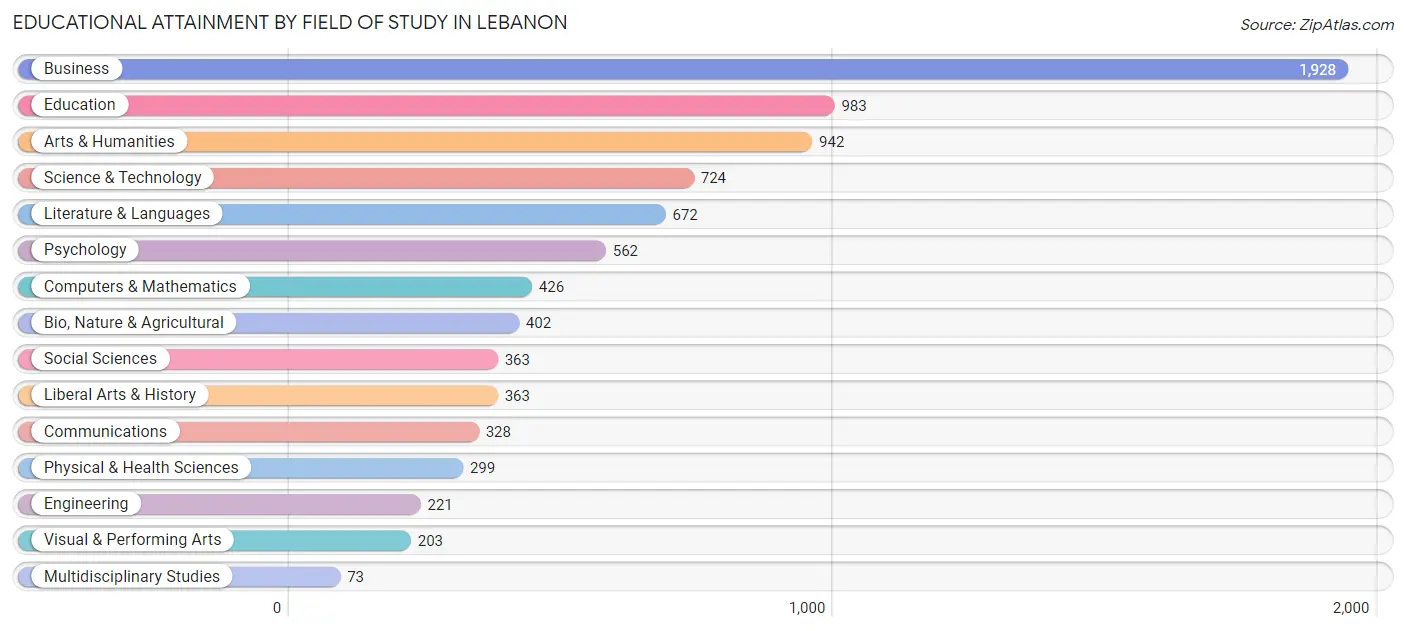
| Field of Study | # Graduates | % Graduates |
| Computers & Mathematics | 426 | 5.0% |
| Bio, Nature & Agricultural | 402 | 4.7% |
| Physical & Health Sciences | 299 | 3.5% |
| Psychology | 562 | 6.6% |
| Social Sciences | 363 | 4.3% |
| Engineering | 221 | 2.6% |
| Multidisciplinary Studies | 73 | 0.9% |
| Science & Technology | 724 | 8.5% |
| Business | 1,928 | 22.7% |
| Education | 983 | 11.6% |
| Literature & Languages | 672 | 7.9% |
| Liberal Arts & History | 363 | 4.3% |
| Visual & Performing Arts | 203 | 2.4% |
| Communications | 328 | 3.9% |
| Arts & Humanities | 942 | 11.1% |
| Total | 8,489 | 100.0% |
Transportation & Commute in Lebanon
Vehicle Availability by Sex in Lebanon
The most prevalent vehicle ownership categories in Lebanon are males with 2 vehicles (4,264, accounting for 43.8%) and females with 2 vehicles (3,602, making up 48.0%).
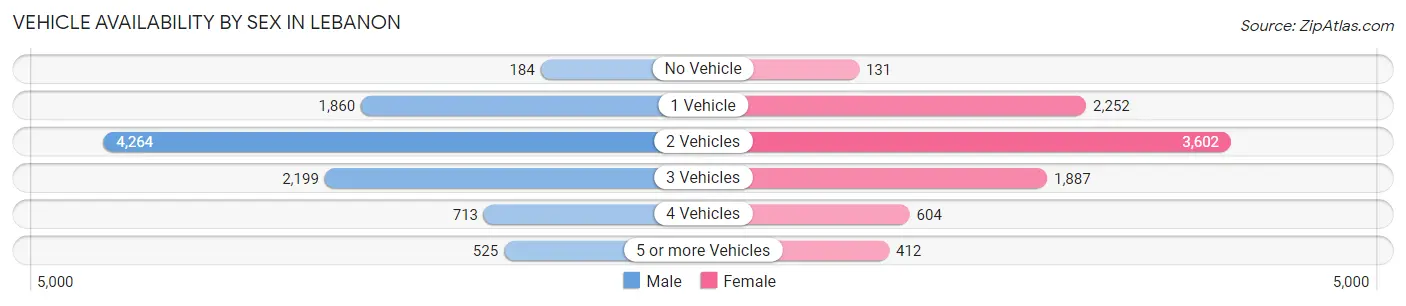
| Vehicles Available | Male | Female |
| No Vehicle | 184 (1.9%) | 131 (1.5%) |
| 1 Vehicle | 1,860 (19.1%) | 2,252 (25.3%) |
| 2 Vehicles | 4,264 (43.8%) | 3,602 (40.5%) |
| 3 Vehicles | 2,199 (22.6%) | 1,887 (21.2%) |
| 4 Vehicles | 713 (7.3%) | 604 (6.8%) |
| 5 or more Vehicles | 525 (5.4%) | 412 (4.6%) |
| Total | 9,745 (100.0%) | 8,888 (100.0%) |
Commute Time in Lebanon
The most frequently occuring commute durations in Lebanon are 15 to 19 minutes (2,696 commuters, 15.9%), 30 to 34 minutes (2,176 commuters, 12.8%), and 5 to 9 minutes (2,159 commuters, 12.7%).
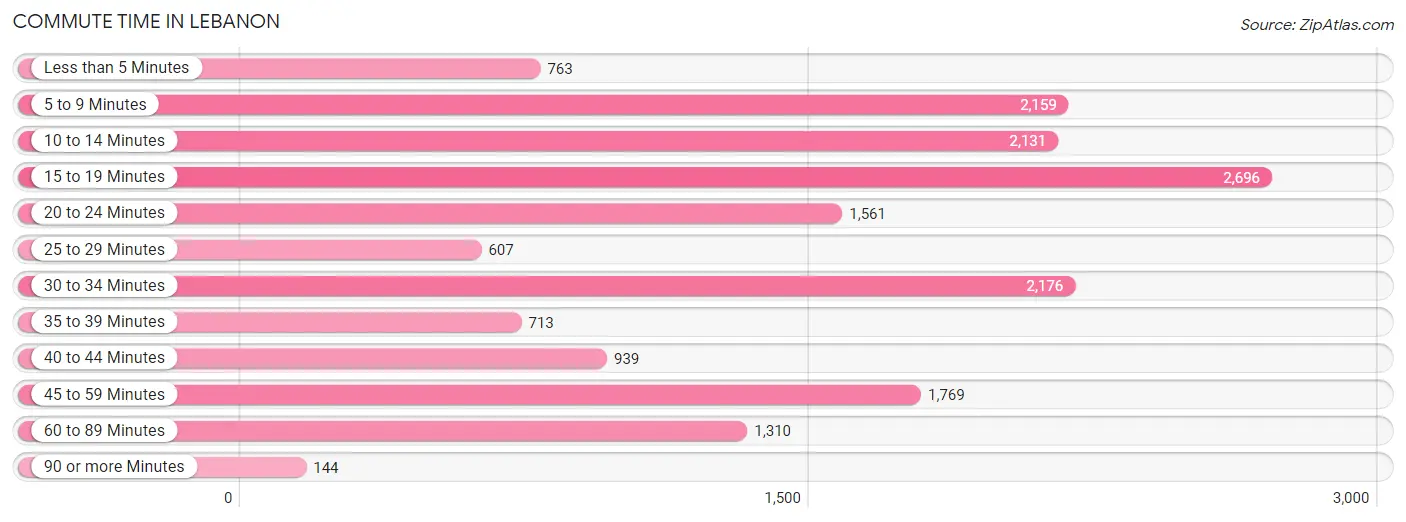
| Commute Time | # Commuters | % Commuters |
| Less than 5 Minutes | 763 | 4.5% |
| 5 to 9 Minutes | 2,159 | 12.7% |
| 10 to 14 Minutes | 2,131 | 12.6% |
| 15 to 19 Minutes | 2,696 | 15.9% |
| 20 to 24 Minutes | 1,561 | 9.2% |
| 25 to 29 Minutes | 607 | 3.6% |
| 30 to 34 Minutes | 2,176 | 12.8% |
| 35 to 39 Minutes | 713 | 4.2% |
| 40 to 44 Minutes | 939 | 5.5% |
| 45 to 59 Minutes | 1,769 | 10.4% |
| 60 to 89 Minutes | 1,310 | 7.7% |
| 90 or more Minutes | 144 | 0.9% |
Commute Time by Sex in Lebanon
The most common commute times in Lebanon are 15 to 19 minutes (1,298 commuters, 14.5%) for males and 15 to 19 minutes (1,398 commuters, 17.4%) for females.
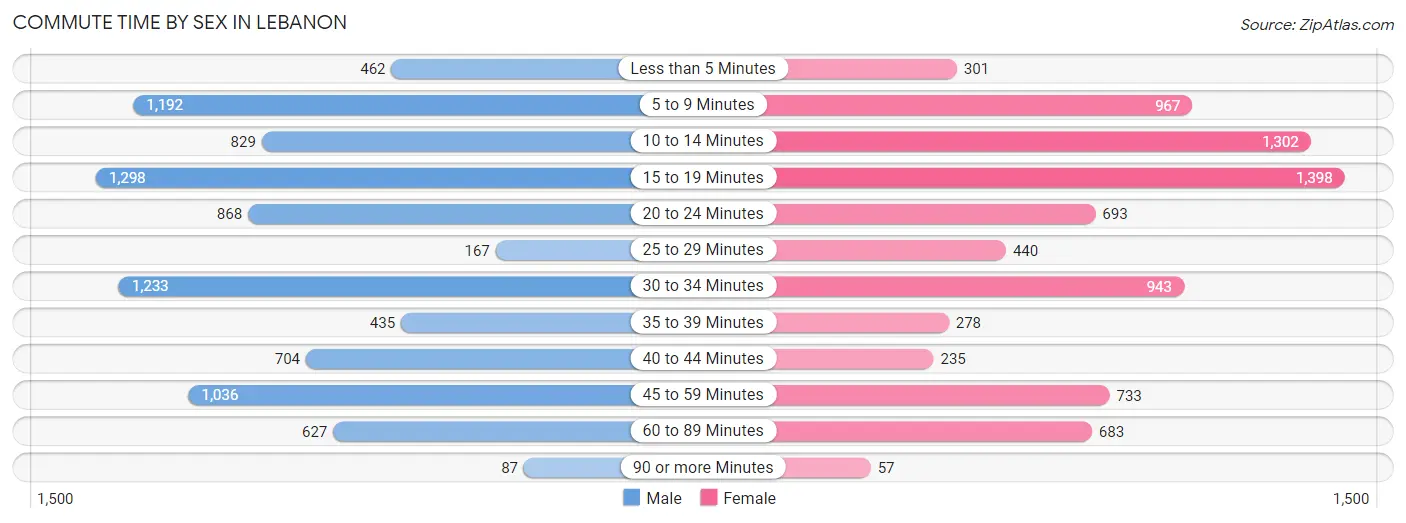
| Commute Time | Male | Female |
| Less than 5 Minutes | 462 (5.2%) | 301 (3.7%) |
| 5 to 9 Minutes | 1,192 (13.3%) | 967 (12.0%) |
| 10 to 14 Minutes | 829 (9.3%) | 1,302 (16.2%) |
| 15 to 19 Minutes | 1,298 (14.5%) | 1,398 (17.4%) |
| 20 to 24 Minutes | 868 (9.7%) | 693 (8.6%) |
| 25 to 29 Minutes | 167 (1.9%) | 440 (5.5%) |
| 30 to 34 Minutes | 1,233 (13.8%) | 943 (11.7%) |
| 35 to 39 Minutes | 435 (4.9%) | 278 (3.5%) |
| 40 to 44 Minutes | 704 (7.9%) | 235 (2.9%) |
| 45 to 59 Minutes | 1,036 (11.6%) | 733 (9.1%) |
| 60 to 89 Minutes | 627 (7.0%) | 683 (8.5%) |
| 90 or more Minutes | 87 (1.0%) | 57 (0.7%) |
Time of Departure to Work by Sex in Lebanon
The most frequent times of departure to work in Lebanon are 6:30 AM to 6:59 AM (1,409, 15.8%) for males and 7:30 AM to 7:59 AM (1,376, 17.1%) for females.
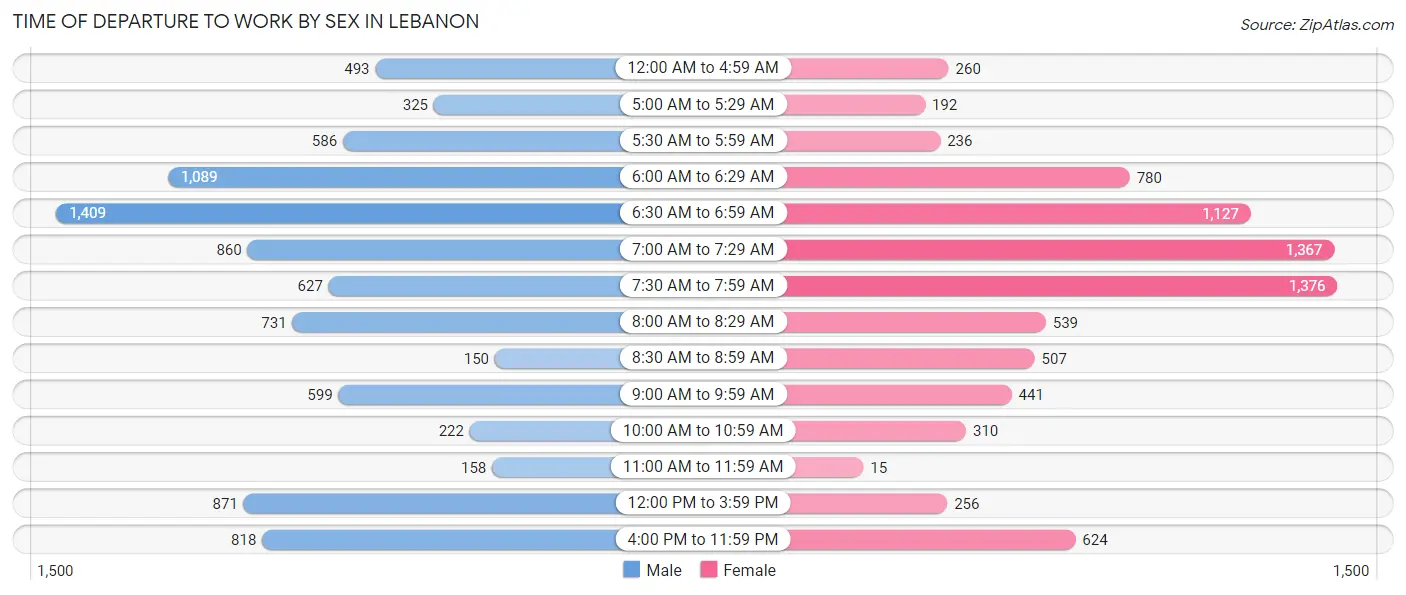
| Time of Departure | Male | Female |
| 12:00 AM to 4:59 AM | 493 (5.5%) | 260 (3.2%) |
| 5:00 AM to 5:29 AM | 325 (3.6%) | 192 (2.4%) |
| 5:30 AM to 5:59 AM | 586 (6.6%) | 236 (2.9%) |
| 6:00 AM to 6:29 AM | 1,089 (12.2%) | 780 (9.7%) |
| 6:30 AM to 6:59 AM | 1,409 (15.8%) | 1,127 (14.0%) |
| 7:00 AM to 7:29 AM | 860 (9.6%) | 1,367 (17.0%) |
| 7:30 AM to 7:59 AM | 627 (7.0%) | 1,376 (17.1%) |
| 8:00 AM to 8:29 AM | 731 (8.2%) | 539 (6.7%) |
| 8:30 AM to 8:59 AM | 150 (1.7%) | 507 (6.3%) |
| 9:00 AM to 9:59 AM | 599 (6.7%) | 441 (5.5%) |
| 10:00 AM to 10:59 AM | 222 (2.5%) | 310 (3.9%) |
| 11:00 AM to 11:59 AM | 158 (1.8%) | 15 (0.2%) |
| 12:00 PM to 3:59 PM | 871 (9.7%) | 256 (3.2%) |
| 4:00 PM to 11:59 PM | 818 (9.1%) | 624 (7.8%) |
| Total | 8,938 (100.0%) | 8,030 (100.0%) |
Housing Occupancy in Lebanon
Occupancy by Ownership in Lebanon
Of the total 15,014 dwellings in Lebanon, owner-occupied units account for 8,904 (59.3%), while renter-occupied units make up 6,110 (40.7%).
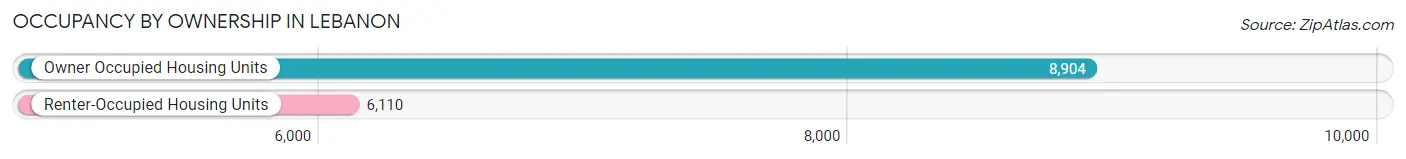
| Occupancy | # Housing Units | % Housing Units |
| Owner Occupied Housing Units | 8,904 | 59.3% |
| Renter-Occupied Housing Units | 6,110 | 40.7% |
| Total Occupied Housing Units | 15,014 | 100.0% |
Occupancy by Household Size in Lebanon
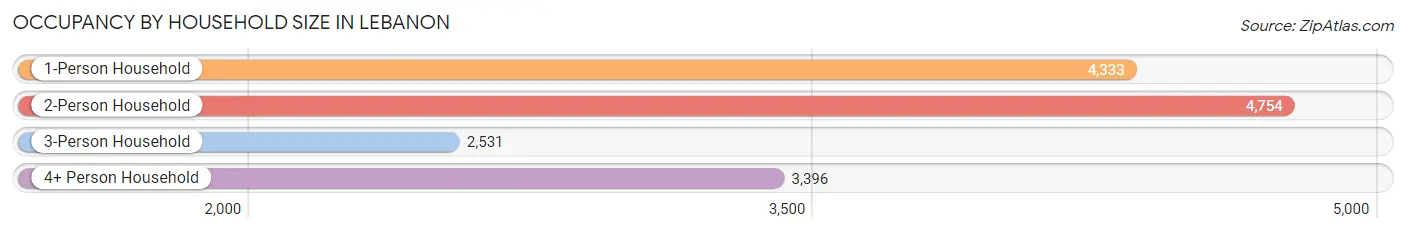
| Household Size | # Housing Units | % Housing Units |
| 1-Person Household | 4,333 | 28.9% |
| 2-Person Household | 4,754 | 31.7% |
| 3-Person Household | 2,531 | 16.9% |
| 4+ Person Household | 3,396 | 22.6% |
| Total Housing Units | 15,014 | 100.0% |
Occupancy by Ownership by Household Size in Lebanon
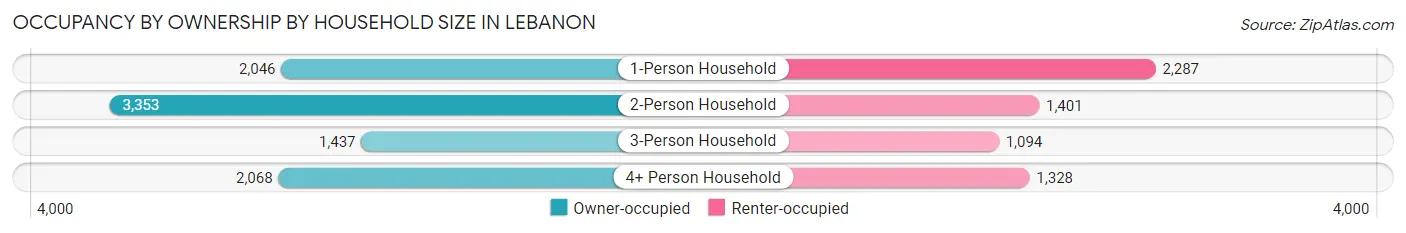
| Household Size | Owner-occupied | Renter-occupied |
| 1-Person Household | 2,046 (47.2%) | 2,287 (52.8%) |
| 2-Person Household | 3,353 (70.5%) | 1,401 (29.5%) |
| 3-Person Household | 1,437 (56.8%) | 1,094 (43.2%) |
| 4+ Person Household | 2,068 (60.9%) | 1,328 (39.1%) |
| Total Housing Units | 8,904 (59.3%) | 6,110 (40.7%) |
Occupancy by Educational Attainment in Lebanon
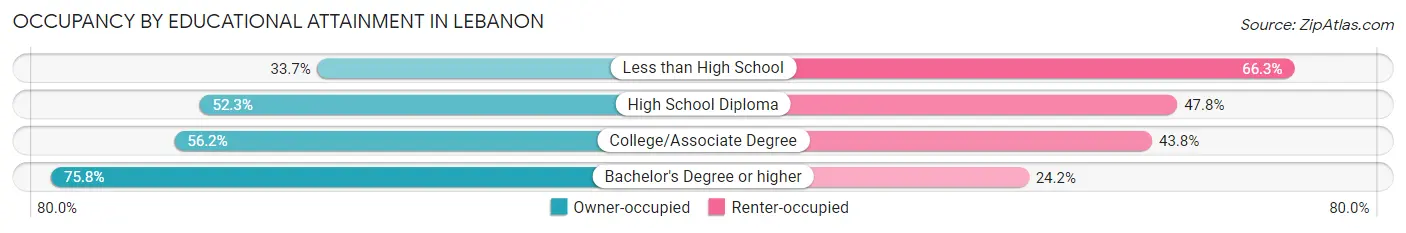
| Household Size | Owner-occupied | Renter-occupied |
| Less than High School | 311 (33.7%) | 612 (66.3%) |
| High School Diploma | 2,482 (52.2%) | 2,268 (47.7%) |
| College/Associate Degree | 2,788 (56.2%) | 2,169 (43.8%) |
| Bachelor's Degree or higher | 3,323 (75.8%) | 1,061 (24.2%) |
Occupancy by Age of Householder in Lebanon
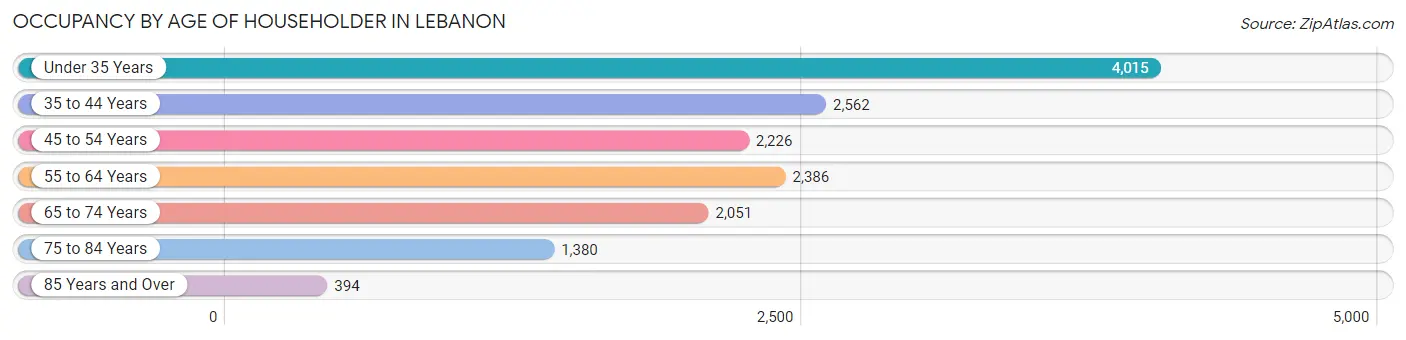
| Age Bracket | # Households | % Households |
| Under 35 Years | 4,015 | 26.7% |
| 35 to 44 Years | 2,562 | 17.1% |
| 45 to 54 Years | 2,226 | 14.8% |
| 55 to 64 Years | 2,386 | 15.9% |
| 65 to 74 Years | 2,051 | 13.7% |
| 75 to 84 Years | 1,380 | 9.2% |
| 85 Years and Over | 394 | 2.6% |
| Total | 15,014 | 100.0% |
Housing Finances in Lebanon
Median Income by Occupancy in Lebanon
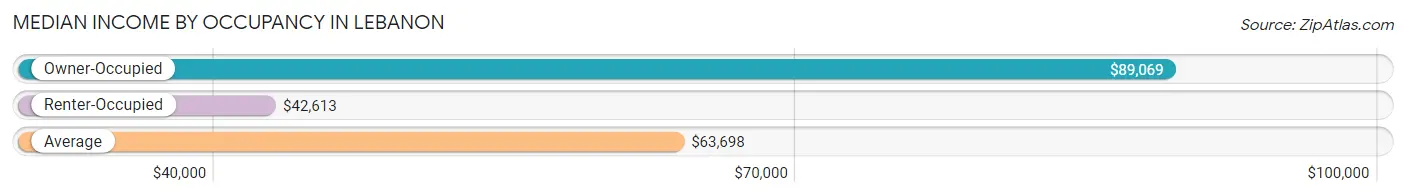
| Occupancy Type | # Households | Median Income |
| Owner-Occupied | 8,904 (59.3%) | $89,069 |
| Renter-Occupied | 6,110 (40.7%) | $42,613 |
| Average | 15,014 (100.0%) | $63,698 |
Occupancy by Householder Income Bracket in Lebanon
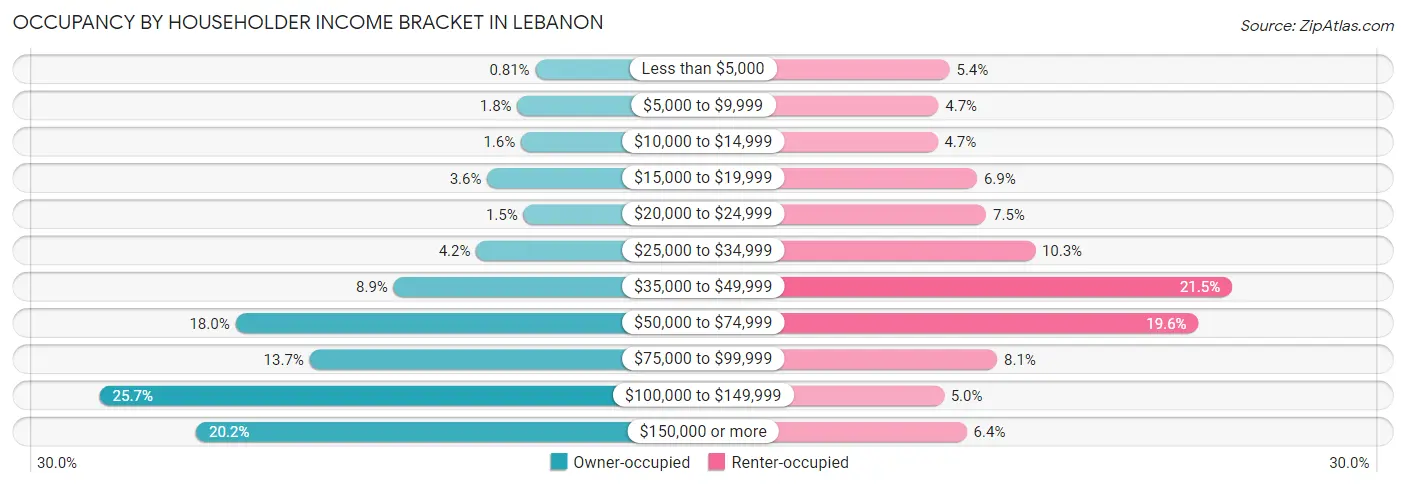
| Income Bracket | Owner-occupied | Renter-occupied |
| Less than $5,000 | 72 (0.8%) | 328 (5.4%) |
| $5,000 to $9,999 | 164 (1.8%) | 289 (4.7%) |
| $10,000 to $14,999 | 145 (1.6%) | 286 (4.7%) |
| $15,000 to $19,999 | 317 (3.6%) | 424 (6.9%) |
| $20,000 to $24,999 | 133 (1.5%) | 456 (7.5%) |
| $25,000 to $34,999 | 373 (4.2%) | 626 (10.2%) |
| $35,000 to $49,999 | 793 (8.9%) | 1,314 (21.5%) |
| $50,000 to $74,999 | 1,598 (17.9%) | 1,197 (19.6%) |
| $75,000 to $99,999 | 1,221 (13.7%) | 494 (8.1%) |
| $100,000 to $149,999 | 2,289 (25.7%) | 308 (5.0%) |
| $150,000 or more | 1,799 (20.2%) | 388 (6.4%) |
| Total | 8,904 (100.0%) | 6,110 (100.0%) |
Monthly Housing Cost Tiers in Lebanon
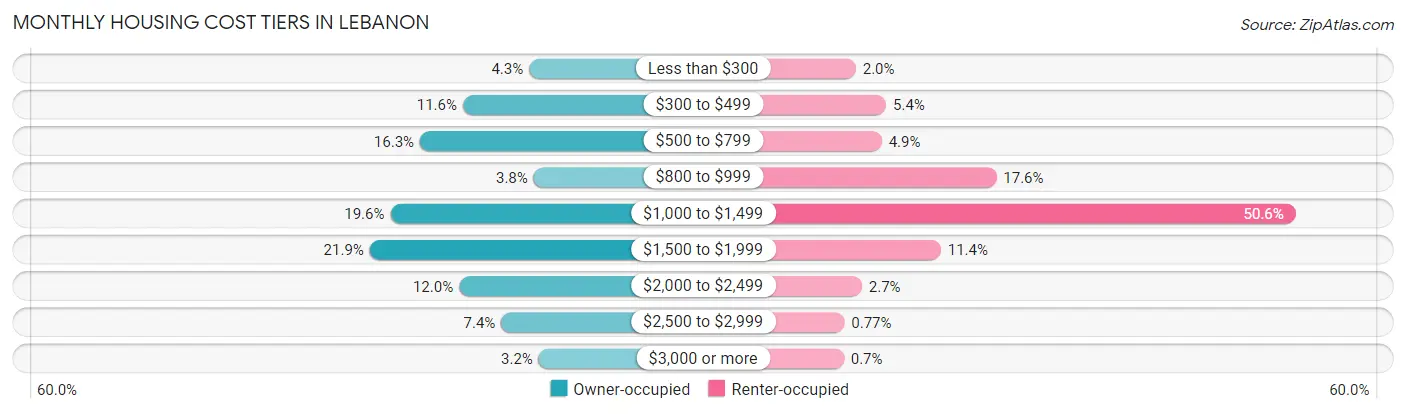
| Monthly Cost | Owner-occupied | Renter-occupied |
| Less than $300 | 380 (4.3%) | 124 (2.0%) |
| $300 to $499 | 1,032 (11.6%) | 329 (5.4%) |
| $500 to $799 | 1,454 (16.3%) | 299 (4.9%) |
| $800 to $999 | 336 (3.8%) | 1,073 (17.6%) |
| $1,000 to $1,499 | 1,745 (19.6%) | 3,092 (50.6%) |
| $1,500 to $1,999 | 1,948 (21.9%) | 698 (11.4%) |
| $2,000 to $2,499 | 1,069 (12.0%) | 165 (2.7%) |
| $2,500 to $2,999 | 654 (7.3%) | 47 (0.8%) |
| $3,000 or more | 286 (3.2%) | 43 (0.7%) |
| Total | 8,904 (100.0%) | 6,110 (100.0%) |
Physical Housing Characteristics in Lebanon
Housing Structures in Lebanon
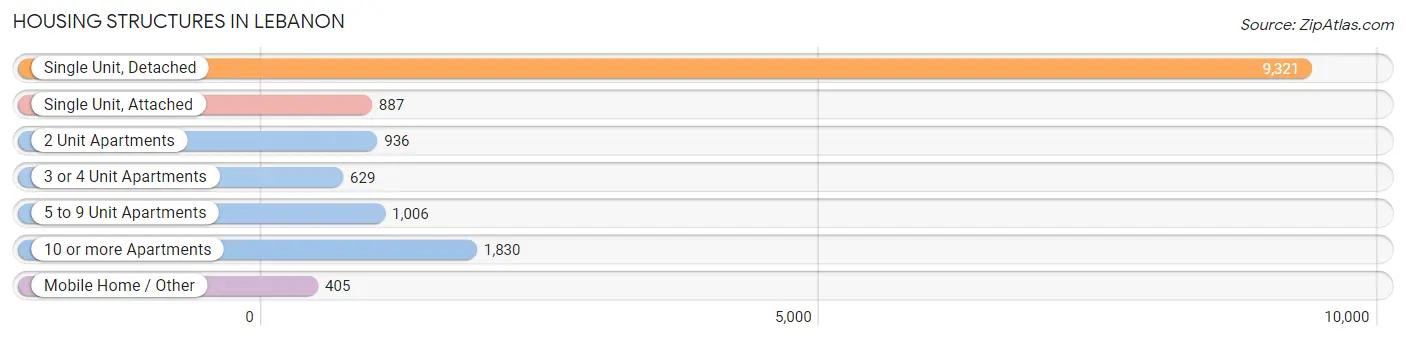
| Structure Type | # Housing Units | % Housing Units |
| Single Unit, Detached | 9,321 | 62.1% |
| Single Unit, Attached | 887 | 5.9% |
| 2 Unit Apartments | 936 | 6.2% |
| 3 or 4 Unit Apartments | 629 | 4.2% |
| 5 to 9 Unit Apartments | 1,006 | 6.7% |
| 10 or more Apartments | 1,830 | 12.2% |
| Mobile Home / Other | 405 | 2.7% |
| Total | 15,014 | 100.0% |
Housing Structures by Occupancy in Lebanon
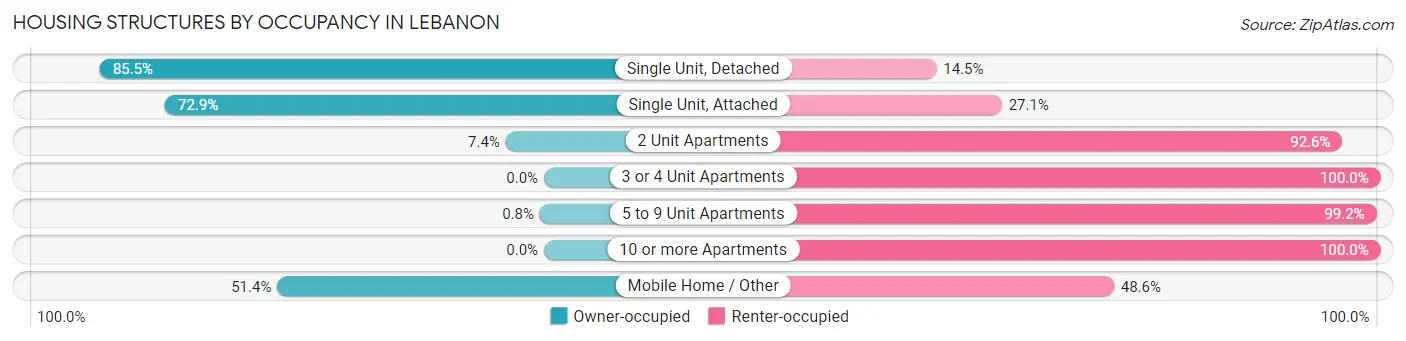
| Structure Type | Owner-occupied | Renter-occupied |
| Single Unit, Detached | 7,972 (85.5%) | 1,349 (14.5%) |
| Single Unit, Attached | 647 (72.9%) | 240 (27.1%) |
| 2 Unit Apartments | 69 (7.4%) | 867 (92.6%) |
| 3 or 4 Unit Apartments | 0 (0.0%) | 629 (100.0%) |
| 5 to 9 Unit Apartments | 8 (0.8%) | 998 (99.2%) |
| 10 or more Apartments | 0 (0.0%) | 1,830 (100.0%) |
| Mobile Home / Other | 208 (51.4%) | 197 (48.6%) |
| Total | 8,904 (59.3%) | 6,110 (40.7%) |
Housing Structures by Number of Rooms in Lebanon
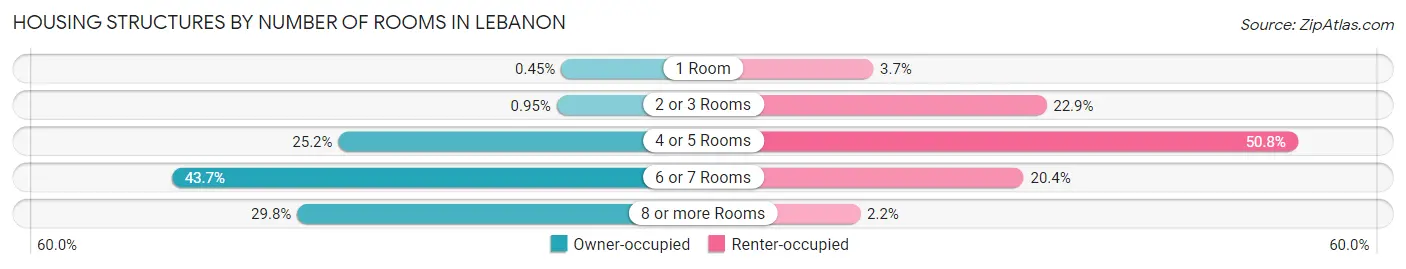
| Number of Rooms | Owner-occupied | Renter-occupied |
| 1 Room | 40 (0.4%) | 225 (3.7%) |
| 2 or 3 Rooms | 85 (0.9%) | 1,399 (22.9%) |
| 4 or 5 Rooms | 2,242 (25.2%) | 3,104 (50.8%) |
| 6 or 7 Rooms | 3,888 (43.7%) | 1,245 (20.4%) |
| 8 or more Rooms | 2,649 (29.7%) | 137 (2.2%) |
| Total | 8,904 (100.0%) | 6,110 (100.0%) |
Housing Structure by Heating Type in Lebanon
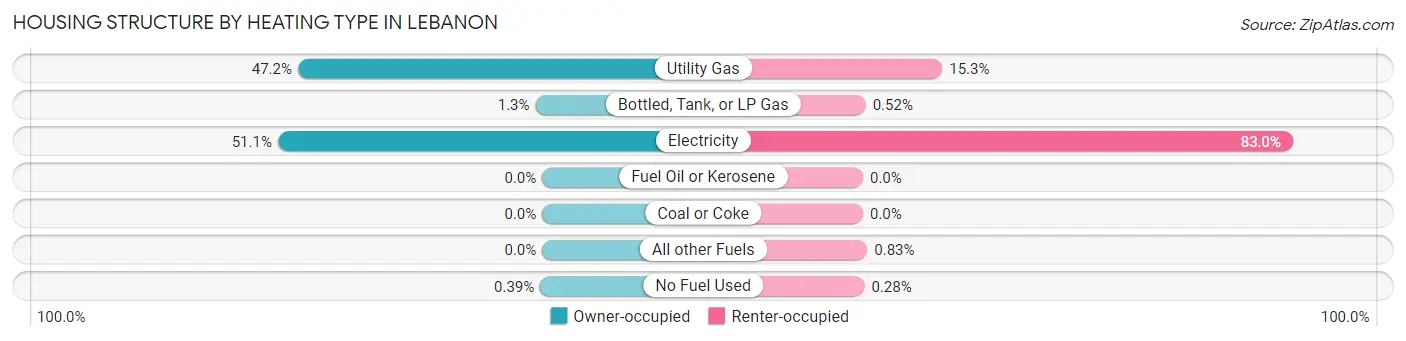
| Heating Type | Owner-occupied | Renter-occupied |
| Utility Gas | 4,204 (47.2%) | 936 (15.3%) |
| Bottled, Tank, or LP Gas | 116 (1.3%) | 32 (0.5%) |
| Electricity | 4,549 (51.1%) | 5,074 (83.0%) |
| Fuel Oil or Kerosene | 0 (0.0%) | 0 (0.0%) |
| Coal or Coke | 0 (0.0%) | 0 (0.0%) |
| All other Fuels | 0 (0.0%) | 51 (0.8%) |
| No Fuel Used | 35 (0.4%) | 17 (0.3%) |
| Total | 8,904 (100.0%) | 6,110 (100.0%) |
Household Vehicle Usage in Lebanon
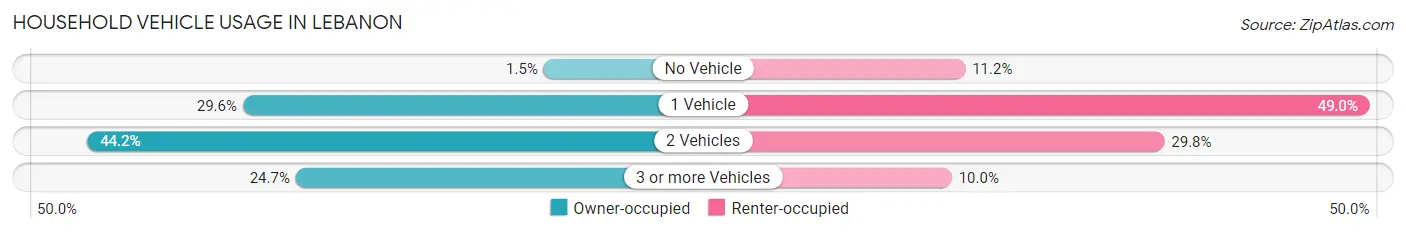
| Vehicles per Household | Owner-occupied | Renter-occupied |
| No Vehicle | 137 (1.5%) | 686 (11.2%) |
| 1 Vehicle | 2,638 (29.6%) | 2,993 (49.0%) |
| 2 Vehicles | 3,931 (44.2%) | 1,822 (29.8%) |
| 3 or more Vehicles | 2,198 (24.7%) | 609 (10.0%) |
| Total | 8,904 (100.0%) | 6,110 (100.0%) |
Real Estate & Mortgages in Lebanon
Real Estate and Mortgage Overview in Lebanon
| Characteristic | Without Mortgage | With Mortgage |
| Housing Units | 2,978 | 5,926 |
| Median Property Value | $300,200 | $340,400 |
| Median Household Income | $67,250 | $1,333 |
| Monthly Housing Costs | $513 | $286 |
| Real Estate Taxes | $1,726 | $238 |
Property Value by Mortgage Status in Lebanon
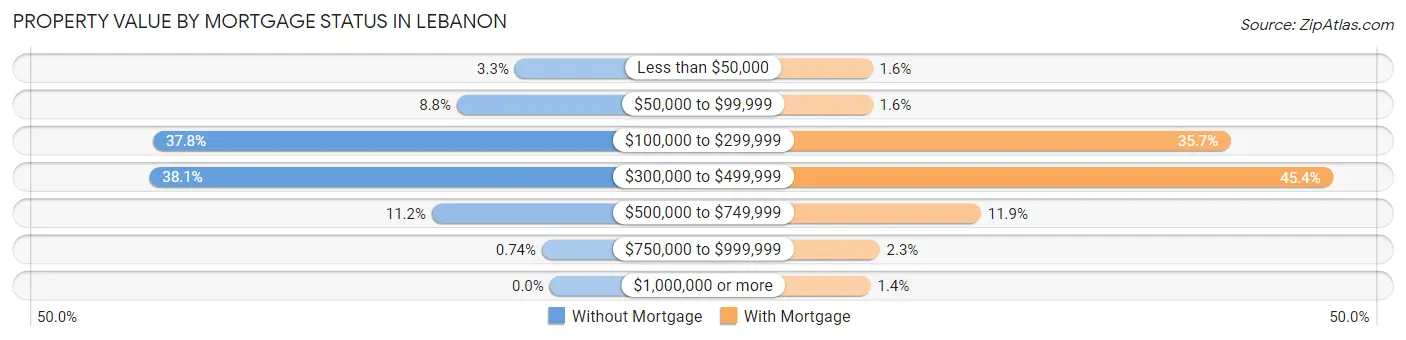
| Property Value | Without Mortgage | With Mortgage |
| Less than $50,000 | 99 (3.3%) | 96 (1.6%) |
| $50,000 to $99,999 | 263 (8.8%) | 96 (1.6%) |
| $100,000 to $299,999 | 1,125 (37.8%) | 2,114 (35.7%) |
| $300,000 to $499,999 | 1,135 (38.1%) | 2,692 (45.4%) |
| $500,000 to $749,999 | 334 (11.2%) | 707 (11.9%) |
| $750,000 to $999,999 | 22 (0.7%) | 136 (2.3%) |
| $1,000,000 or more | 0 (0.0%) | 85 (1.4%) |
| Total | 2,978 (100.0%) | 5,926 (100.0%) |
Household Income by Mortgage Status in Lebanon
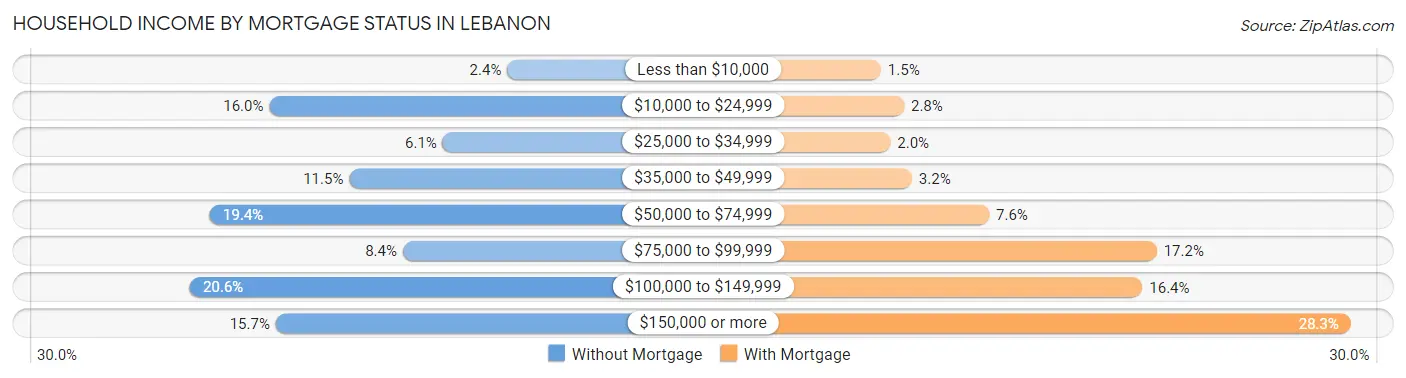
| Household Income | Without Mortgage | With Mortgage |
| Less than $10,000 | 72 (2.4%) | 86 (1.5%) |
| $10,000 to $24,999 | 477 (16.0%) | 164 (2.8%) |
| $25,000 to $34,999 | 182 (6.1%) | 118 (2.0%) |
| $35,000 to $49,999 | 341 (11.5%) | 191 (3.2%) |
| $50,000 to $74,999 | 578 (19.4%) | 452 (7.6%) |
| $75,000 to $99,999 | 250 (8.4%) | 1,020 (17.2%) |
| $100,000 to $149,999 | 612 (20.5%) | 971 (16.4%) |
| $150,000 or more | 466 (15.7%) | 1,677 (28.3%) |
| Total | 2,978 (100.0%) | 5,926 (100.0%) |
Property Value to Household Income Ratio in Lebanon
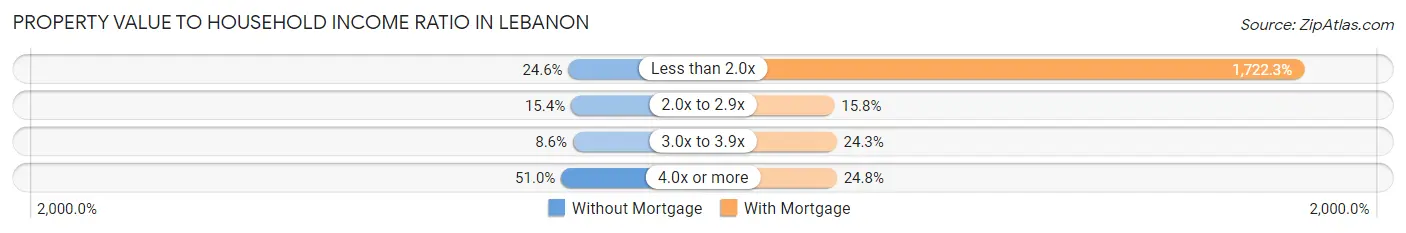
| Value-to-Income Ratio | Without Mortgage | With Mortgage |
| Less than 2.0x | 732 (24.6%) | 102,061 (1,722.3%) |
| 2.0x to 2.9x | 458 (15.4%) | 936 (15.8%) |
| 3.0x to 3.9x | 255 (8.6%) | 1,442 (24.3%) |
| 4.0x or more | 1,519 (51.0%) | 1,467 (24.8%) |
| Total | 2,978 (100.0%) | 5,926 (100.0%) |
Real Estate Taxes by Mortgage Status in Lebanon
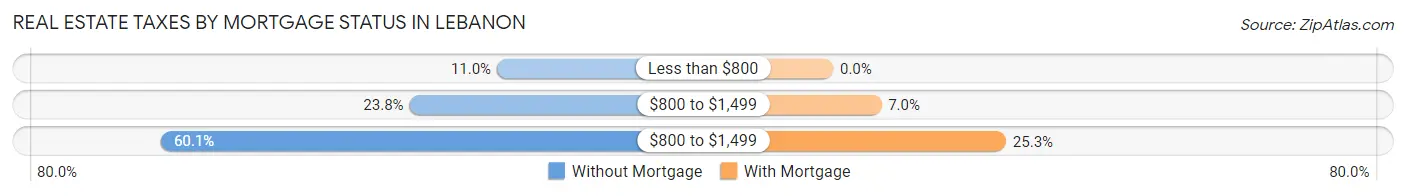
| Property Taxes | Without Mortgage | With Mortgage |
| Less than $800 | 327 (11.0%) | 0 (0.0%) |
| $800 to $1,499 | 708 (23.8%) | 417 (7.0%) |
| $800 to $1,499 | 1,789 (60.1%) | 1,497 (25.3%) |
| Total | 2,978 (100.0%) | 5,926 (100.0%) |
Health & Disability in Lebanon
Health Insurance Coverage by Age in Lebanon
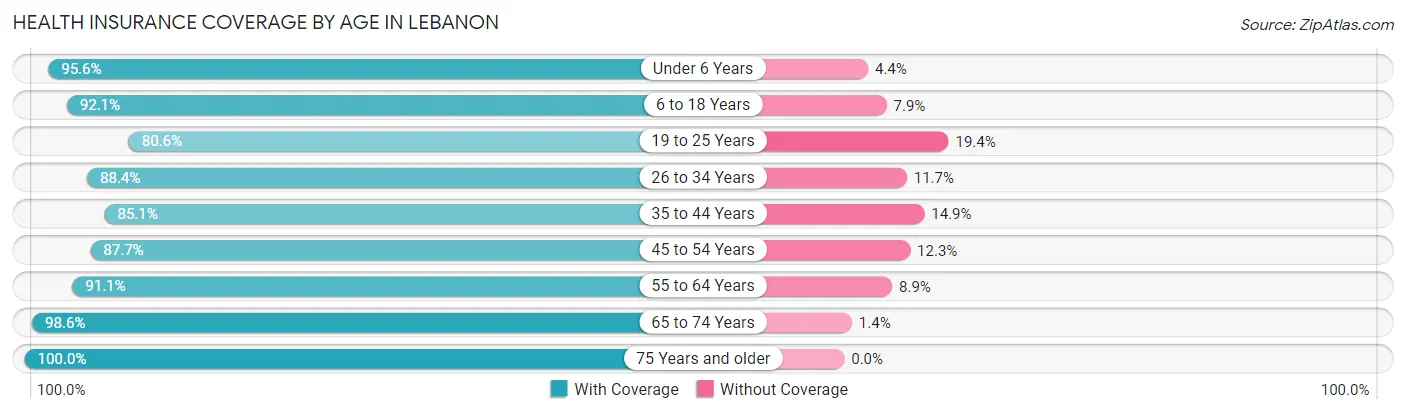
| Age Bracket | With Coverage | Without Coverage |
| Under 6 Years | 3,196 (95.6%) | 148 (4.4%) |
| 6 to 18 Years | 5,431 (92.1%) | 465 (7.9%) |
| 19 to 25 Years | 3,146 (80.6%) | 759 (19.4%) |
| 26 to 34 Years | 5,238 (88.3%) | 691 (11.7%) |
| 35 to 44 Years | 4,327 (85.1%) | 759 (14.9%) |
| 45 to 54 Years | 3,665 (87.7%) | 513 (12.3%) |
| 55 to 64 Years | 3,833 (91.1%) | 375 (8.9%) |
| 65 to 74 Years | 3,262 (98.6%) | 47 (1.4%) |
| 75 Years and older | 2,774 (100.0%) | 0 (0.0%) |
| Total | 34,872 (90.3%) | 3,757 (9.7%) |
Health Insurance Coverage by Citizenship Status in Lebanon
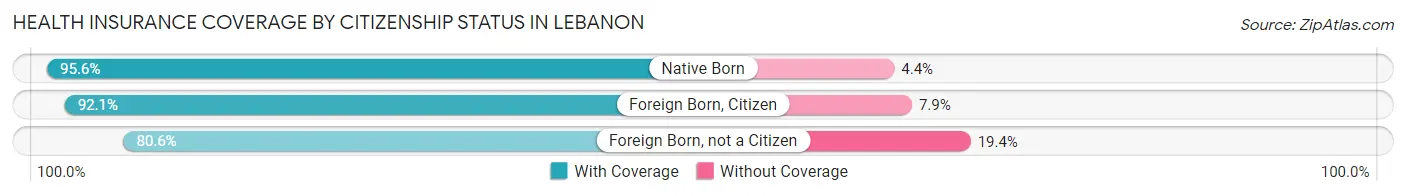
| Citizenship Status | With Coverage | Without Coverage |
| Native Born | 3,196 (95.6%) | 148 (4.4%) |
| Foreign Born, Citizen | 5,431 (92.1%) | 465 (7.9%) |
| Foreign Born, not a Citizen | 3,146 (80.6%) | 759 (19.4%) |
Health Insurance Coverage by Household Income in Lebanon
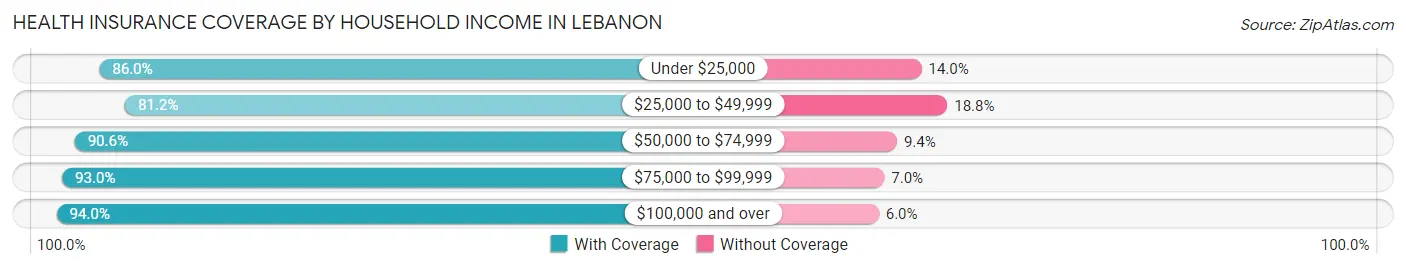
| Household Income | With Coverage | Without Coverage |
| Under $25,000 | 3,976 (86.0%) | 648 (14.0%) |
| $25,000 to $49,999 | 4,999 (81.2%) | 1,160 (18.8%) |
| $50,000 to $74,999 | 6,416 (90.6%) | 666 (9.4%) |
| $75,000 to $99,999 | 4,545 (93.0%) | 344 (7.0%) |
| $100,000 and over | 14,282 (94.0%) | 910 (6.0%) |
Public vs Private Health Insurance Coverage by Age in Lebanon
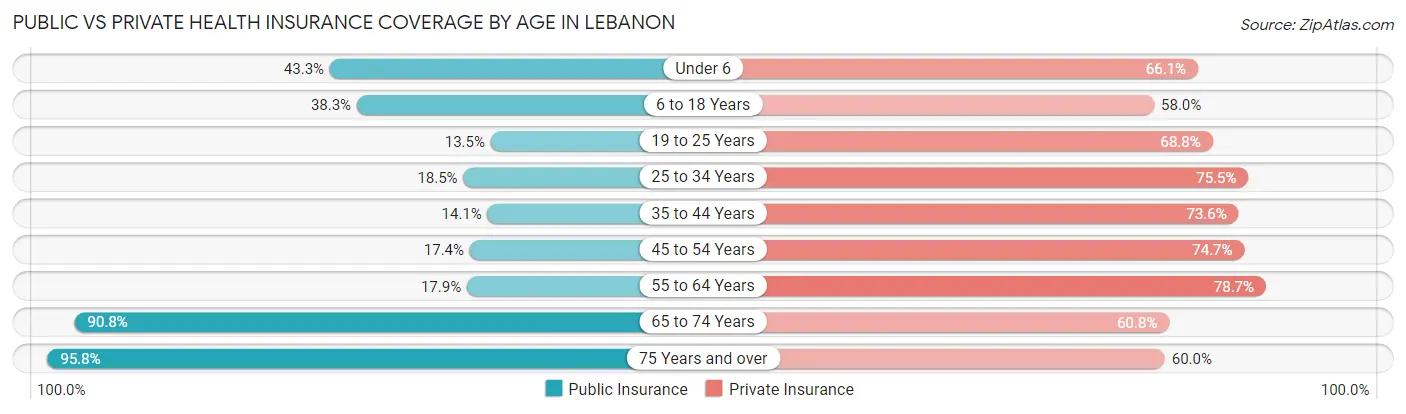
| Age Bracket | Public Insurance | Private Insurance |
| Under 6 | 1,449 (43.3%) | 2,210 (66.1%) |
| 6 to 18 Years | 2,259 (38.3%) | 3,418 (58.0%) |
| 19 to 25 Years | 526 (13.5%) | 2,687 (68.8%) |
| 25 to 34 Years | 1,099 (18.5%) | 4,474 (75.5%) |
| 35 to 44 Years | 715 (14.1%) | 3,745 (73.6%) |
| 45 to 54 Years | 725 (17.3%) | 3,122 (74.7%) |
| 55 to 64 Years | 753 (17.9%) | 3,312 (78.7%) |
| 65 to 74 Years | 3,003 (90.7%) | 2,011 (60.8%) |
| 75 Years and over | 2,657 (95.8%) | 1,663 (60.0%) |
| Total | 13,186 (34.1%) | 26,642 (69.0%) |
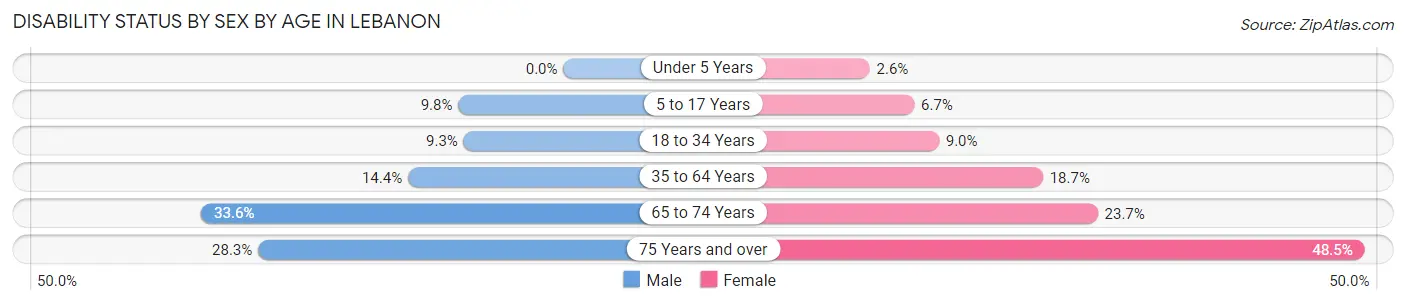
Disability Status by Sex by Age in Lebanon
| Age Bracket | Male | Female |
| Under 5 Years | 0 (0.0%) | 39 (2.6%) |
| 5 to 17 Years | 302 (9.8%) | 188 (6.7%) |
| 18 to 34 Years | 442 (9.2%) | 487 (9.0%) |
| 35 to 64 Years | 934 (14.4%) | 1,305 (18.6%) |
| 65 to 74 Years | 451 (33.6%) | 467 (23.7%) |
| 75 Years and over | 283 (28.3%) | 861 (48.5%) |
Disability Class by Sex by Age in Lebanon
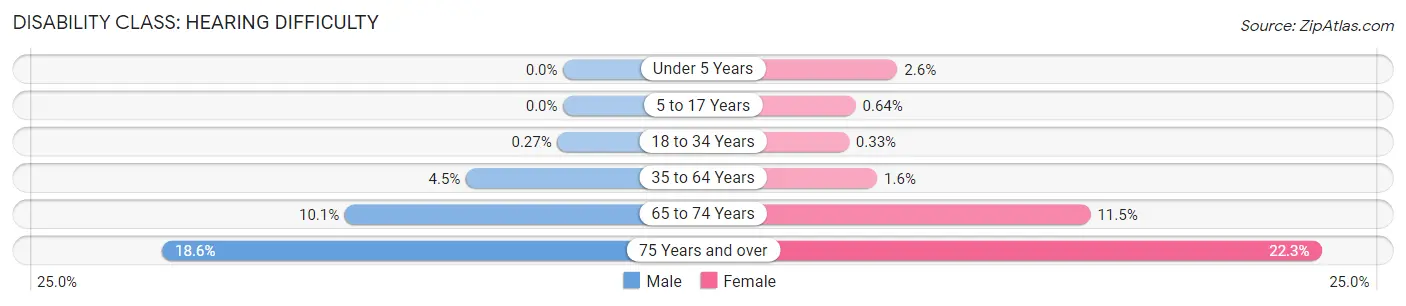
Disability Class: Hearing Difficulty
| Age Bracket | Male | Female |
| Under 5 Years | 0 (0.0%) | 39 (2.6%) |
| 5 to 17 Years | 0 (0.0%) | 18 (0.6%) |
| 18 to 34 Years | 13 (0.3%) | 18 (0.3%) |
| 35 to 64 Years | 292 (4.5%) | 115 (1.6%) |
| 65 to 74 Years | 136 (10.1%) | 227 (11.5%) |
| 75 Years and over | 186 (18.6%) | 395 (22.3%) |
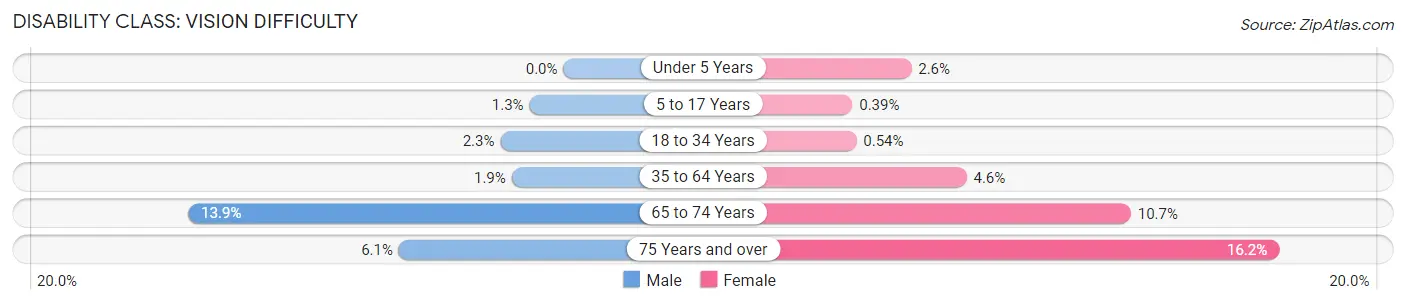
Disability Class: Vision Difficulty
| Age Bracket | Male | Female |
| Under 5 Years | 0 (0.0%) | 39 (2.6%) |
| 5 to 17 Years | 39 (1.3%) | 11 (0.4%) |
| 18 to 34 Years | 112 (2.3%) | 29 (0.5%) |
| 35 to 64 Years | 124 (1.9%) | 324 (4.6%) |
| 65 to 74 Years | 187 (13.9%) | 211 (10.7%) |
| 75 Years and over | 61 (6.1%) | 288 (16.2%) |
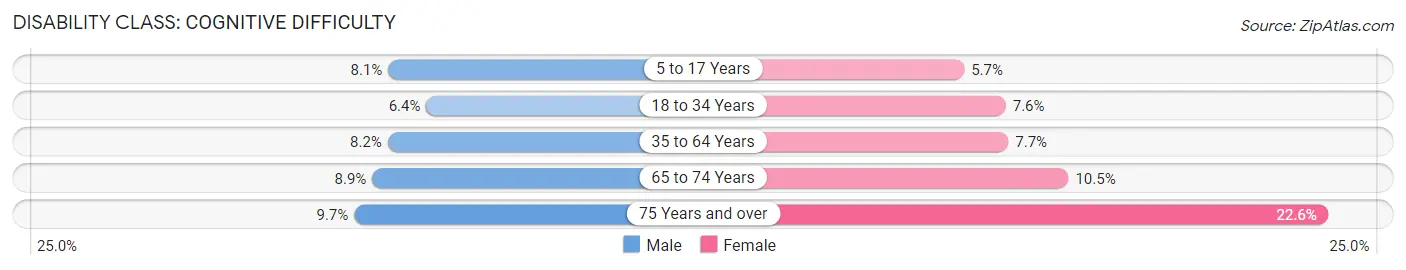
Disability Class: Cognitive Difficulty
| Age Bracket | Male | Female |
| 5 to 17 Years | 252 (8.1%) | 159 (5.7%) |
| 18 to 34 Years | 304 (6.4%) | 412 (7.6%) |
| 35 to 64 Years | 528 (8.2%) | 541 (7.7%) |
| 65 to 74 Years | 119 (8.9%) | 207 (10.5%) |
| 75 Years and over | 97 (9.7%) | 401 (22.6%) |
Disability Class: Ambulatory Difficulty
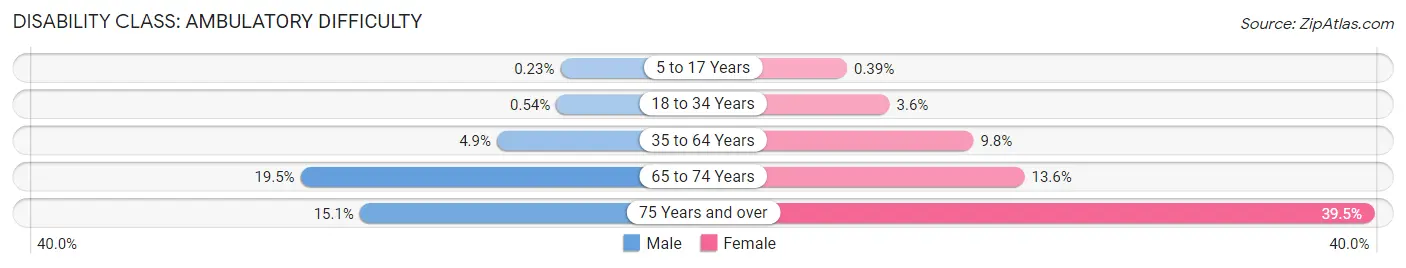
| Age Bracket | Male | Female |
| 5 to 17 Years | 7 (0.2%) | 11 (0.4%) |
| 18 to 34 Years | 26 (0.5%) | 192 (3.5%) |
| 35 to 64 Years | 320 (4.9%) | 684 (9.8%) |
| 65 to 74 Years | 262 (19.5%) | 267 (13.6%) |
| 75 Years and over | 151 (15.1%) | 701 (39.5%) |
Disability Class: Self-Care Difficulty
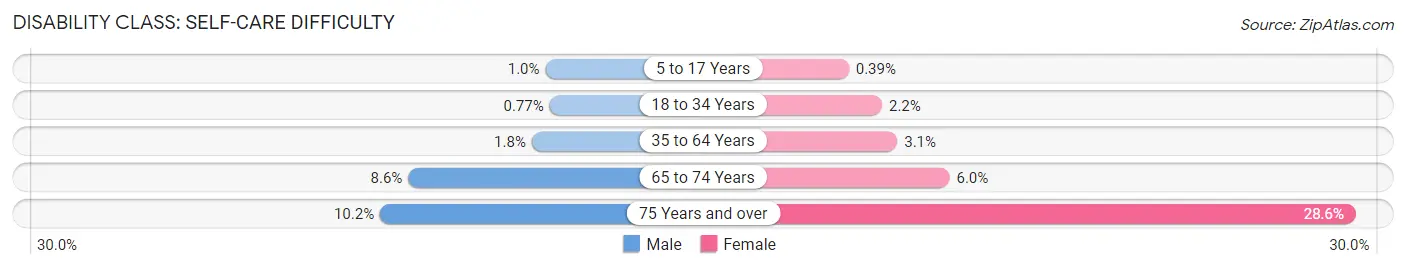
| Age Bracket | Male | Female |
| 5 to 17 Years | 31 (1.0%) | 11 (0.4%) |
| 18 to 34 Years | 37 (0.8%) | 121 (2.2%) |
| 35 to 64 Years | 114 (1.8%) | 216 (3.1%) |
| 65 to 74 Years | 116 (8.6%) | 118 (6.0%) |
| 75 Years and over | 102 (10.2%) | 508 (28.6%) |
Technology Access in Lebanon
Computing Device Access in Lebanon
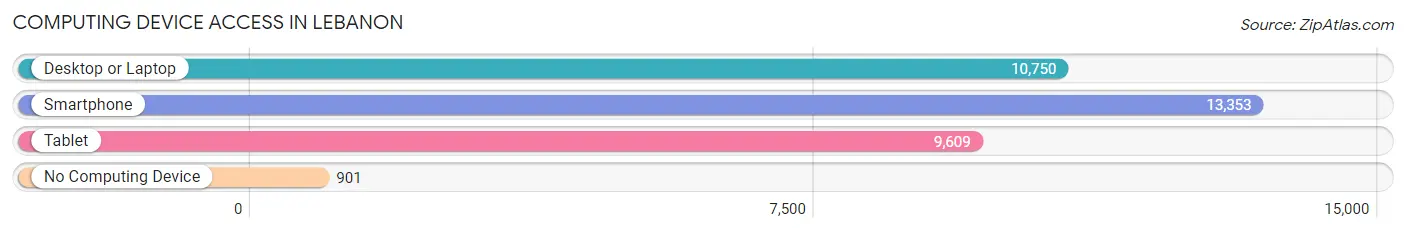
| Device Type | # Households | % Households |
| Desktop or Laptop | 10,750 | 71.6% |
| Smartphone | 13,353 | 88.9% |
| Tablet | 9,609 | 64.0% |
| No Computing Device | 901 | 6.0% |
| Total | 15,014 | 100.0% |
Internet Access in Lebanon
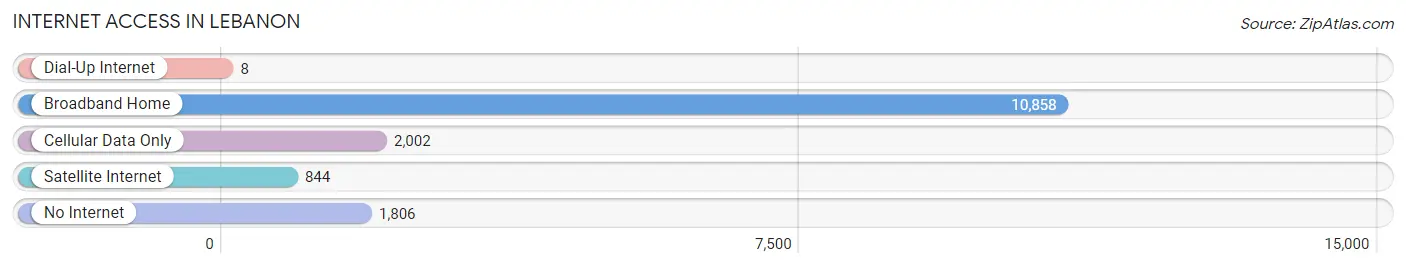
| Internet Type | # Households | % Households |
| Dial-Up Internet | 8 | 0.1% |
| Broadband Home | 10,858 | 72.3% |
| Cellular Data Only | 2,002 | 13.3% |
| Satellite Internet | 844 | 5.6% |
| No Internet | 1,806 | 12.0% |
| Total | 15,014 | 100.0% |
Lebanon Summary
Lebanon, Tennessee is a city located in Wilson County, Tennessee, United States. The city is located in the heart of Middle Tennessee, approximately 25 miles east of Nashville. Lebanon is the county seat of Wilson County and is part of the Nashville metropolitan area. As of the 2010 census, the city had a population of 26,190.
History
Lebanon was founded in 1802 by James Robertson, an early settler of Middle Tennessee. Robertson named the city after the Biblical city of Lebanon, which was located in the ancient land of Canaan. The city was incorporated in 1819 and became the county seat of Wilson County in 1836.
During the Civil War, Lebanon was the site of a major battle between Union and Confederate forces in 1862. The Battle of Lebanon was a decisive victory for the Union, and it helped to secure the region for the Union.
In the late 19th century, Lebanon became a major center for the production of tobacco. The city was home to several tobacco warehouses and factories, and it was the largest producer of tobacco in the state.
Geography
Lebanon is located in Middle Tennessee, approximately 25 miles east of Nashville. The city is situated in the Nashville Basin, a low-lying area between the Highland Rim and the Central Basin. The city is located at the confluence of the Stones and Cumberland Rivers.
The city has a total area of 16.2 square miles, of which 16.1 square miles is land and 0.1 square miles is water.
Economy
Lebanon is a major center for manufacturing and industry in Middle Tennessee. The city is home to several major employers, including Wilson County Schools, Cracker Barrel Old Country Store, and the Tennessee Army National Guard.
The city is also home to several major retail outlets including Walmart Lowe s and Target
Demographics
As of the 2010 census, the city had a population of 26,190. The racial makeup of the city was 79.2% White, 15.3% African American, 0.4% Native American, 1.2% Asian, 0.1% Pacific Islander, 1.7% from other races, and 2.1% from two or more races. Hispanic or Latino of any race were 4.2% of the population.
The median income for a household in the city was $41,945, and the median income for a family was $50,945. The per capita income for the city was $21,845. About 11.2% of families and 14.2% of the population were below the poverty line, including 19.2% of those under age 18 and 10.2% of those age 65 or over.
Common Questions
What is Per Capita Income in Lebanon?
Per Capita income in Lebanon is $35,177.
What is the Median Family Income in Lebanon?
Median Family Income in Lebanon is $85,152.
What is the Median Household income in Lebanon?
Median Household Income in Lebanon is $63,698.
What is Income or Wage Gap in Lebanon?
Income or Wage Gap in Lebanon is 25.3%.
Women in Lebanon earn 74.7 cents for every dollar earned by a man.
What is Inequality or Gini Index in Lebanon?
Inequality or Gini Index in Lebanon is 0.46.
What is the Total Population of Lebanon?
Total Population of Lebanon is 39,562.
What is the Total Male Population of Lebanon?
Total Male Population of Lebanon is 18,742.
What is the Total Female Population of Lebanon?
Total Female Population of Lebanon is 20,820.
What is the Ratio of Males per 100 Females in Lebanon?
There are 90.02 Males per 100 Females in Lebanon.
What is the Ratio of Females per 100 Males in Lebanon?
There are 111.09 Females per 100 Males in Lebanon.
What is the Median Population Age in Lebanon?
Median Population Age in Lebanon is 35.6 Years.
What is the Average Family Size in Lebanon
Average Family Size in Lebanon is 3.1 People.
What is the Average Household Size in Lebanon
Average Household Size in Lebanon is 2.5 People.
How Large is the Labor Force in Lebanon?
There are 19,911 People in the Labor Forcein in Lebanon.
What is the Percentage of People in the Labor Force in Lebanon?
63.4% of People are in the Labor Force in Lebanon.
What is the Unemployment Rate in Lebanon?
Unemployment Rate in Lebanon is 3.0%.