St Cloud, FL Map & Demographics
St Cloud Map
St Cloud Overview
$26,677
PER CAPITA INCOME
$80,285
AVG FAMILY INCOME
$69,366
AVG HOUSEHOLD INCOME
12.8%
WAGE / INCOME GAP [ % ]
87.2¢/ $1
WAGE / INCOME GAP [ $ ]
$9,634
FAMILY INCOME DEFICIT
0.39
INEQUALITY / GINI INDEX
59,851
TOTAL POPULATION
29,409
MALE POPULATION
30,442
FEMALE POPULATION
96.61
MALES / 100 FEMALES
103.51
FEMALES / 100 MALES
36.6
MEDIAN AGE
3.9
AVG FAMILY SIZE
3.3
AVG HOUSEHOLD SIZE
27,781
LABOR FORCE [ PEOPLE ]
60.7%
PERCENT IN LABOR FORCE
6.4%
UNEMPLOYMENT RATE
Income in St Cloud
Income Overview in St Cloud
Per Capita Income in St Cloud is $26,677, while median incomes of families and households are $80,285 and $69,366 respectively.
| Characteristic | Number | Measure |
| Per Capita Income | 59,851 | $26,677 |
| Median Family Income | 13,130 | $80,285 |
| Mean Family Income | 13,130 | $88,124 |
| Median Household Income | 17,843 | $69,366 |
| Mean Household Income | 17,843 | $83,101 |
| Income Deficit | 13,130 | $9,634 |
| Wage / Income Gap (%) | 59,851 | 12.75% |
| Wage / Income Gap ($) | 59,851 | 87.25¢ per $1 |
| Gini / Inequality Index | 59,851 | 0.39 |
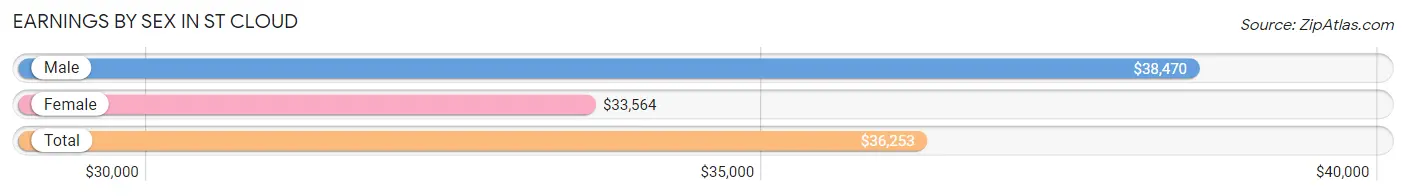
Earnings by Sex in St Cloud
Average Earnings in St Cloud are $36,253, $38,470 for men and $33,564 for women, a difference of 12.8%.
| Sex | Number | Average Earnings |
| Male | 15,227 (52.7%) | $38,470 |
| Female | 13,650 (47.3%) | $33,564 |
| Total | 28,877 (100.0%) | $36,253 |
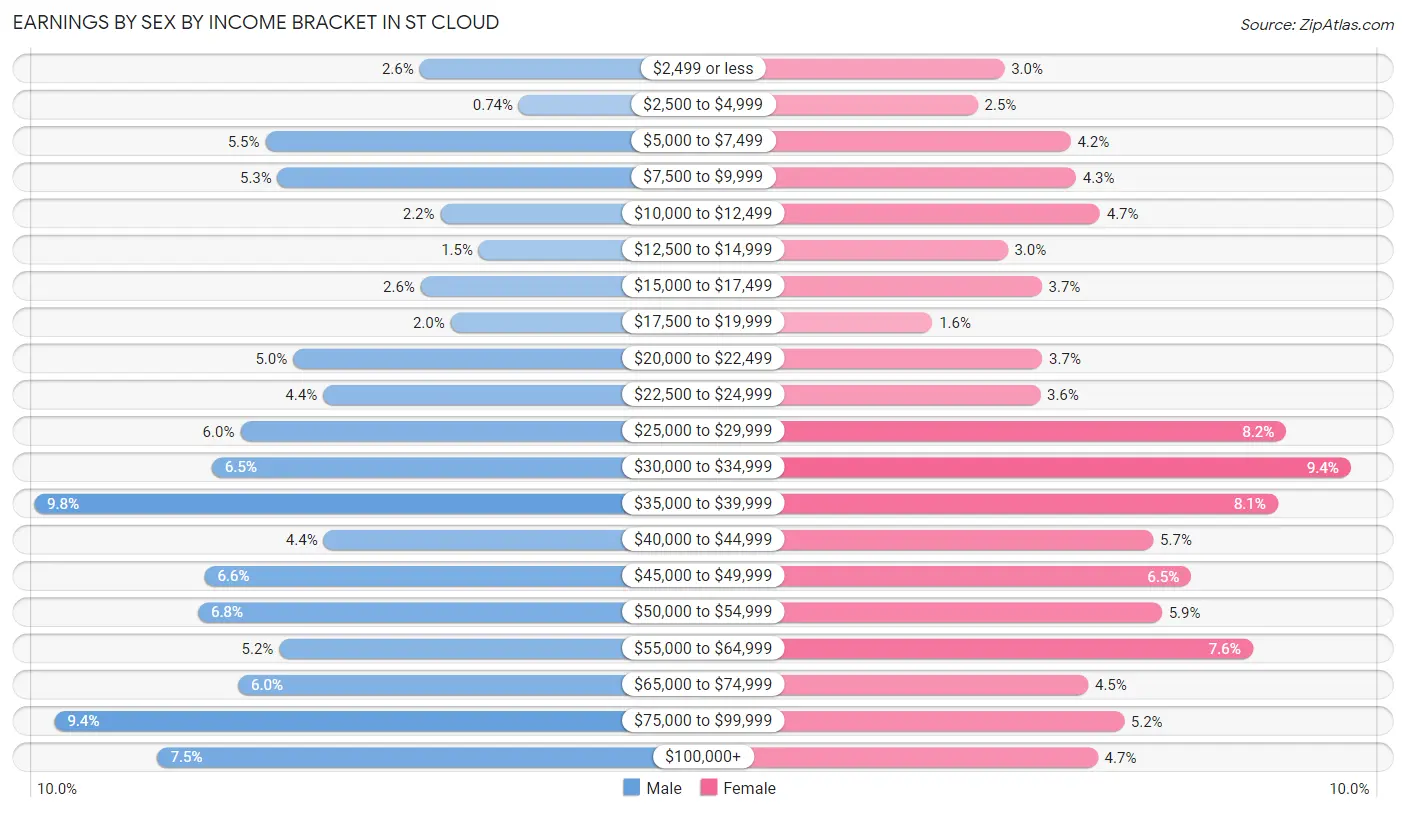
Earnings by Sex by Income Bracket in St Cloud
The most common earnings brackets in St Cloud are $35,000 to $39,999 for men (1,495 | 9.8%) and $30,000 to $34,999 for women (1,289 | 9.4%).
| Income | Male | Female |
| $2,499 or less | 396 (2.6%) | 403 (2.9%) |
| $2,500 to $4,999 | 113 (0.7%) | 334 (2.5%) |
| $5,000 to $7,499 | 836 (5.5%) | 572 (4.2%) |
| $7,500 to $9,999 | 801 (5.3%) | 586 (4.3%) |
| $10,000 to $12,499 | 336 (2.2%) | 647 (4.7%) |
| $12,500 to $14,999 | 227 (1.5%) | 411 (3.0%) |
| $15,000 to $17,499 | 393 (2.6%) | 498 (3.6%) |
| $17,500 to $19,999 | 308 (2.0%) | 218 (1.6%) |
| $20,000 to $22,499 | 757 (5.0%) | 500 (3.7%) |
| $22,500 to $24,999 | 672 (4.4%) | 494 (3.6%) |
| $25,000 to $29,999 | 907 (6.0%) | 1,124 (8.2%) |
| $30,000 to $34,999 | 988 (6.5%) | 1,289 (9.4%) |
| $35,000 to $39,999 | 1,495 (9.8%) | 1,101 (8.1%) |
| $40,000 to $44,999 | 670 (4.4%) | 783 (5.7%) |
| $45,000 to $49,999 | 1,009 (6.6%) | 881 (6.5%) |
| $50,000 to $54,999 | 1,028 (6.8%) | 805 (5.9%) |
| $55,000 to $64,999 | 796 (5.2%) | 1,037 (7.6%) |
| $65,000 to $74,999 | 914 (6.0%) | 617 (4.5%) |
| $75,000 to $99,999 | 1,437 (9.4%) | 708 (5.2%) |
| $100,000+ | 1,144 (7.5%) | 642 (4.7%) |
| Total | 15,227 (100.0%) | 13,650 (100.0%) |
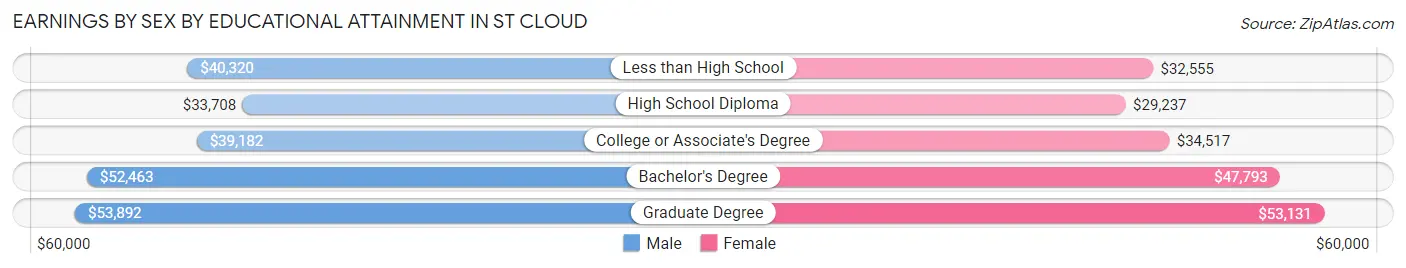
Earnings by Sex by Educational Attainment in St Cloud
Average earnings in St Cloud are $39,919 for men and $36,507 for women, a difference of 8.6%. Men with an educational attainment of graduate degree enjoy the highest average annual earnings of $53,892, while those with high school diploma education earn the least with $33,708. Women with an educational attainment of graduate degree earn the most with the average annual earnings of $53,131, while those with high school diploma education have the smallest earnings of $29,237.
| Educational Attainment | Male Income | Female Income |
| Less than High School | $40,320 | $32,555 |
| High School Diploma | $33,708 | $29,237 |
| College or Associate's Degree | $39,182 | $34,517 |
| Bachelor's Degree | $52,463 | $47,793 |
| Graduate Degree | $53,892 | $53,131 |
| Total | $39,919 | $36,507 |
Family Income in St Cloud
Family Income Brackets in St Cloud
According to the St Cloud family income data, there are 2,849 families falling into the $100,000 to $149,999 income range, which is the most common income bracket and makes up 21.7% of all families. Conversely, the $10,000 to $14,999 income bracket is the least frequent group with only 171 families (1.3%) belonging to this category.
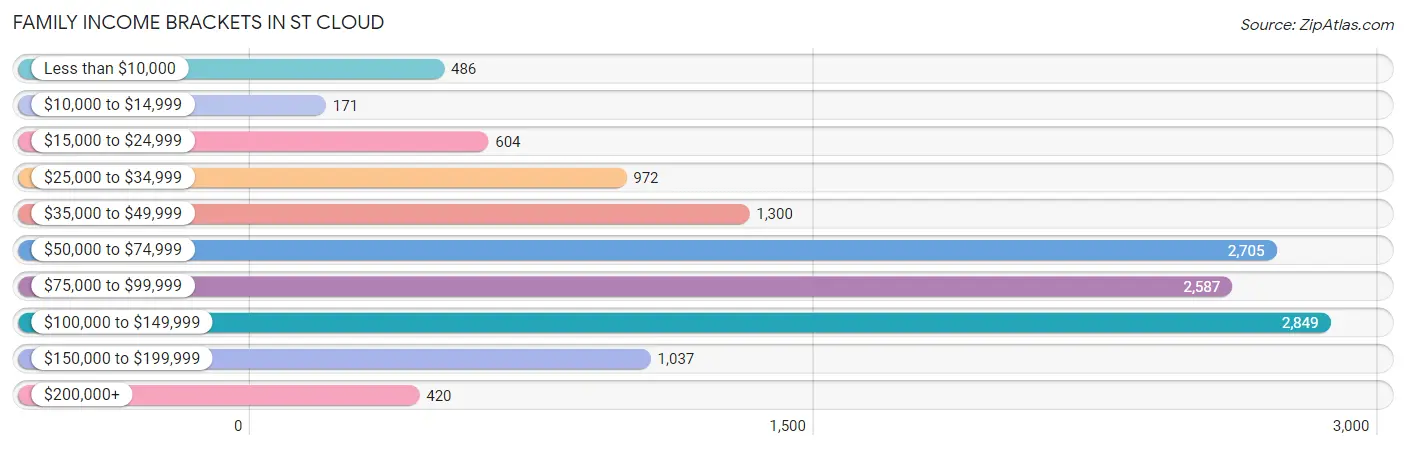
| Income Bracket | # Families | % Families |
| Less than $10,000 | 486 | 3.7% |
| $10,000 to $14,999 | 171 | 1.3% |
| $15,000 to $24,999 | 604 | 4.6% |
| $25,000 to $34,999 | 972 | 7.4% |
| $35,000 to $49,999 | 1,300 | 9.9% |
| $50,000 to $74,999 | 2,705 | 20.6% |
| $75,000 to $99,999 | 2,587 | 19.7% |
| $100,000 to $149,999 | 2,849 | 21.7% |
| $150,000 to $199,999 | 1,037 | 7.9% |
| $200,000+ | 420 | 3.2% |
Family Income by Famaliy Size in St Cloud
7+ person families (212 | 1.6%) account for the highest median family income in St Cloud with $123,852 per family, while 2-person families (4,704 | 35.8%) have the highest median income of $32,110 per family member.
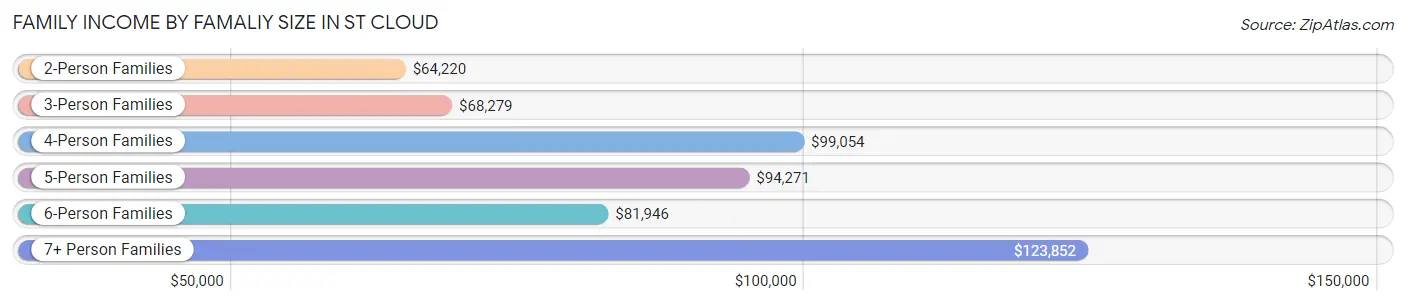
| Income Bracket | # Families | Median Income |
| 2-Person Families | 4,704 (35.8%) | $64,220 |
| 3-Person Families | 3,973 (30.3%) | $68,279 |
| 4-Person Families | 2,561 (19.5%) | $99,054 |
| 5-Person Families | 957 (7.3%) | $94,271 |
| 6-Person Families | 723 (5.5%) | $81,946 |
| 7+ Person Families | 212 (1.6%) | $123,852 |
| Total | 13,130 (100.0%) | $80,285 |
Family Income by Number of Earners in St Cloud
The median family income in St Cloud is $80,285, with families comprising 3+ earners (1,980) having the highest median family income of $99,151, while families with no earners (1,669) have the lowest median family income of $38,646, accounting for 15.1% and 12.7% of families, respectively.
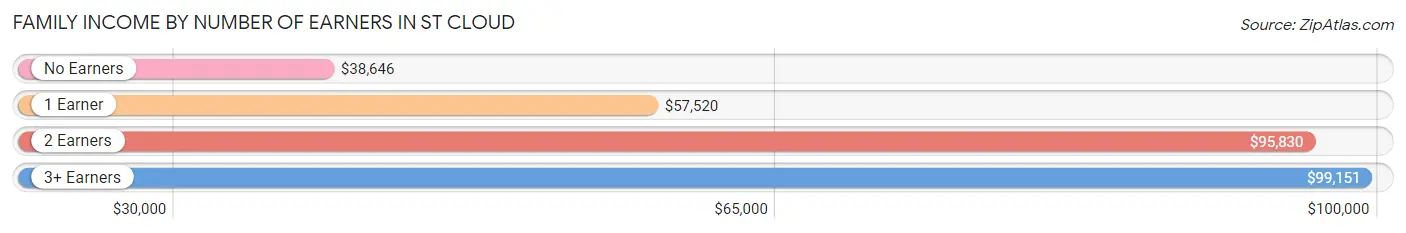
| Number of Earners | # Families | Median Income |
| No Earners | 1,669 (12.7%) | $38,646 |
| 1 Earner | 4,352 (33.2%) | $57,520 |
| 2 Earners | 5,129 (39.1%) | $95,830 |
| 3+ Earners | 1,980 (15.1%) | $99,151 |
| Total | 13,130 (100.0%) | $80,285 |
Household Income in St Cloud
Household Income Brackets in St Cloud
With 3,676 households falling in the category, the $50,000 to $74,999 income range is the most frequent in St Cloud, accounting for 20.6% of all households. In contrast, only 517 households (2.9%) fall into the $10,000 to $14,999 income bracket, making it the least populous group.
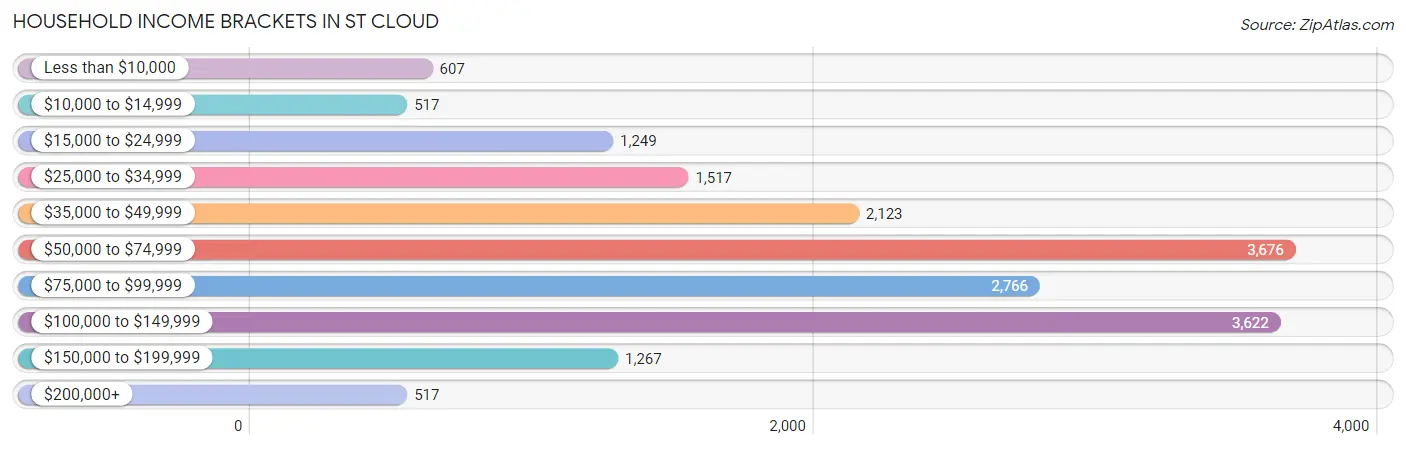
| Income Bracket | # Households | % Households |
| Less than $10,000 | 607 | 3.4% |
| $10,000 to $14,999 | 517 | 2.9% |
| $15,000 to $24,999 | 1,249 | 7.0% |
| $25,000 to $34,999 | 1,517 | 8.5% |
| $35,000 to $49,999 | 2,123 | 11.9% |
| $50,000 to $74,999 | 3,676 | 20.6% |
| $75,000 to $99,999 | 2,766 | 15.5% |
| $100,000 to $149,999 | 3,622 | 20.3% |
| $150,000 to $199,999 | 1,267 | 7.1% |
| $200,000+ | 517 | 2.9% |
Household Income by Householder Age in St Cloud
The median household income in St Cloud is $69,366, with the highest median household income of $80,465 found in the 45 to 64 years age bracket for the primary householder. A total of 7,180 households (40.2%) fall into this category. Meanwhile, the 15 to 24 years age bracket for the primary householder has the lowest median household income of $26,679, with 315 households (1.8%) in this group.
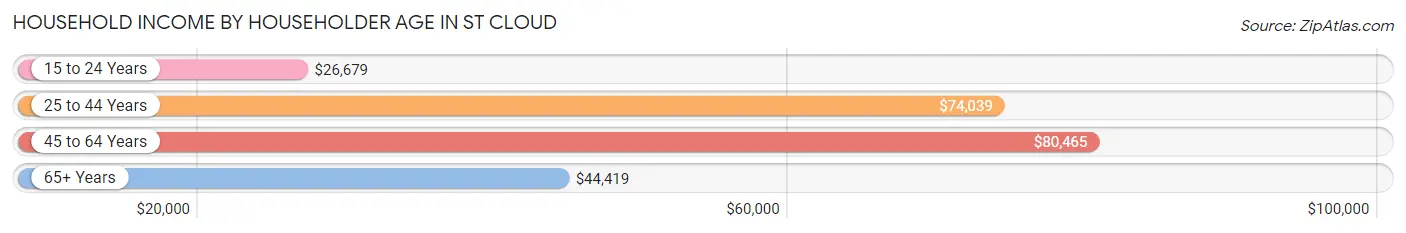
| Income Bracket | # Households | Median Income |
| 15 to 24 Years | 315 (1.8%) | $26,679 |
| 25 to 44 Years | 7,000 (39.2%) | $74,039 |
| 45 to 64 Years | 7,180 (40.2%) | $80,465 |
| 65+ Years | 3,348 (18.8%) | $44,419 |
| Total | 17,843 (100.0%) | $69,366 |
Poverty in St Cloud
Income Below Poverty by Sex and Age in St Cloud
With 11.4% poverty level for males and 11.4% for females among the residents of St Cloud, 65 to 74 year old males and 12 to 14 year old females are the most vulnerable to poverty, with 360 males (21.5%) and 282 females (22.4%) in their respective age groups living below the poverty level.
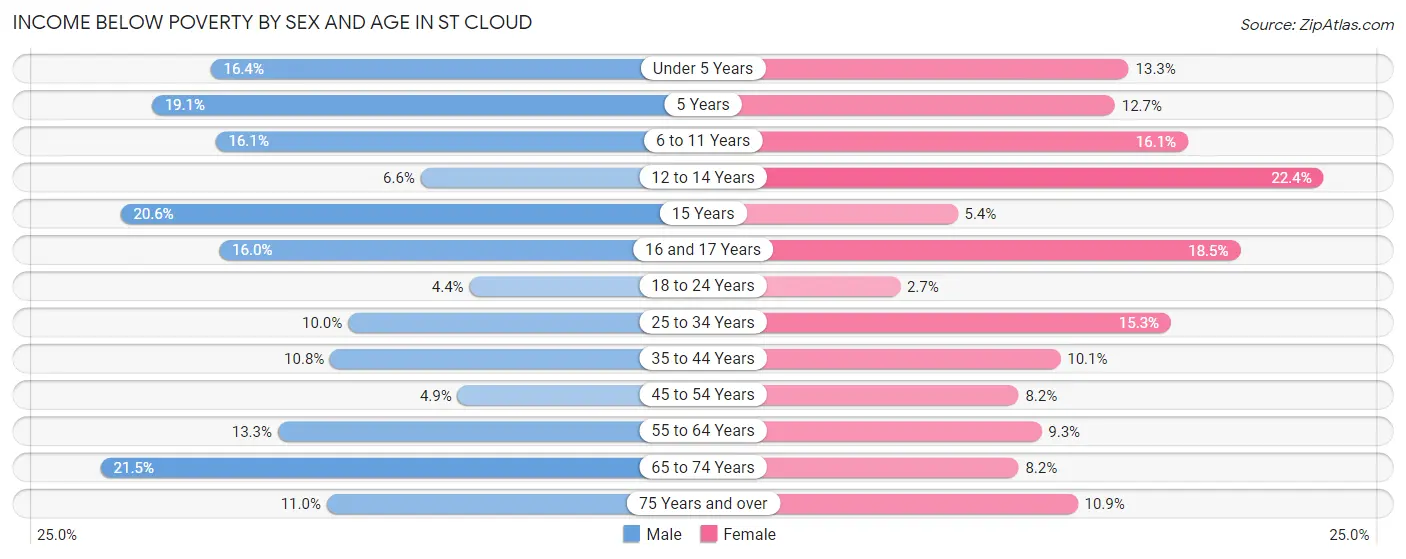
| Age Bracket | Male | Female |
| Under 5 Years | 282 (16.4%) | 356 (13.3%) |
| 5 Years | 51 (19.1%) | 65 (12.7%) |
| 6 to 11 Years | 407 (16.1%) | 420 (16.1%) |
| 12 to 14 Years | 92 (6.6%) | 282 (22.4%) |
| 15 Years | 156 (20.5%) | 13 (5.4%) |
| 16 and 17 Years | 149 (16.0%) | 215 (18.5%) |
| 18 to 24 Years | 103 (4.4%) | 64 (2.7%) |
| 25 to 34 Years | 408 (10.0%) | 568 (15.3%) |
| 35 to 44 Years | 527 (10.8%) | 433 (10.1%) |
| 45 to 54 Years | 185 (4.9%) | 329 (8.2%) |
| 55 to 64 Years | 440 (13.3%) | 312 (9.3%) |
| 65 to 74 Years | 360 (21.5%) | 181 (8.2%) |
| 75 Years and over | 154 (11.0%) | 180 (10.9%) |
| Total | 3,314 (11.4%) | 3,418 (11.4%) |
Income Above Poverty by Sex and Age in St Cloud
According to the poverty statistics in St Cloud, males aged 18 to 24 years and females aged 18 to 24 years are the age groups that are most secure financially, with 95.6% of males and 97.3% of females in these age groups living above the poverty line.
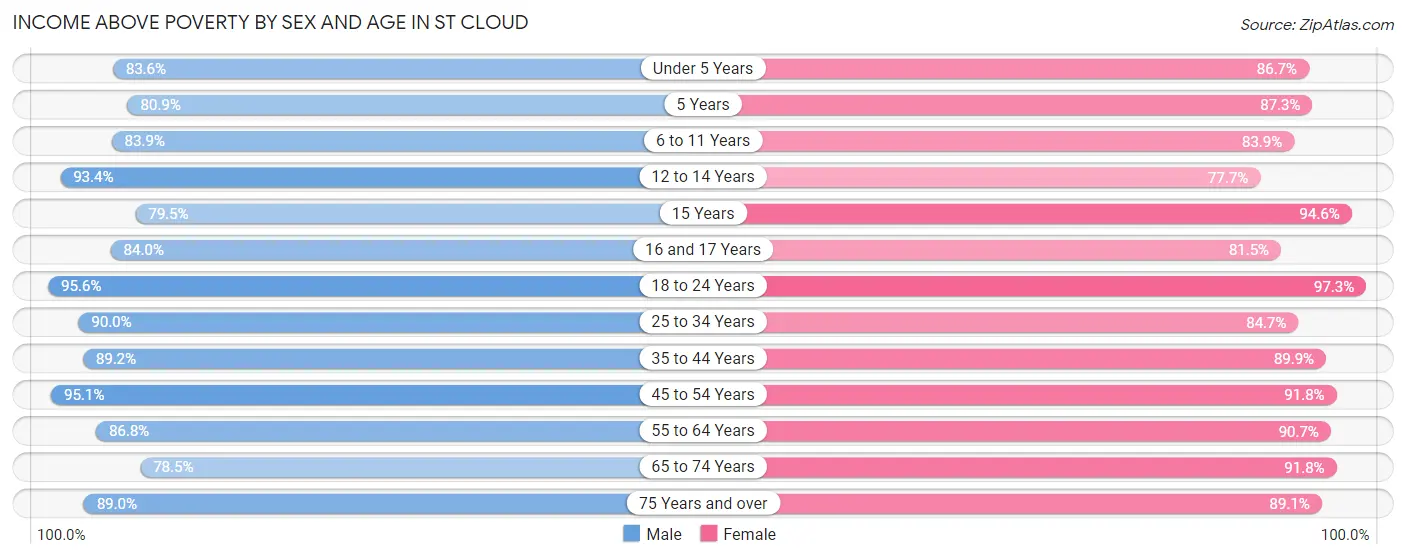
| Age Bracket | Male | Female |
| Under 5 Years | 1,441 (83.6%) | 2,318 (86.7%) |
| 5 Years | 216 (80.9%) | 448 (87.3%) |
| 6 to 11 Years | 2,115 (83.9%) | 2,195 (83.9%) |
| 12 to 14 Years | 1,298 (93.4%) | 980 (77.6%) |
| 15 Years | 603 (79.4%) | 229 (94.6%) |
| 16 and 17 Years | 784 (84.0%) | 948 (81.5%) |
| 18 to 24 Years | 2,259 (95.6%) | 2,302 (97.3%) |
| 25 to 34 Years | 3,676 (90.0%) | 3,151 (84.7%) |
| 35 to 44 Years | 4,342 (89.2%) | 3,838 (89.9%) |
| 45 to 54 Years | 3,586 (95.1%) | 3,685 (91.8%) |
| 55 to 64 Years | 2,881 (86.8%) | 3,056 (90.7%) |
| 65 to 74 Years | 1,317 (78.5%) | 2,027 (91.8%) |
| 75 Years and over | 1,249 (89.0%) | 1,465 (89.1%) |
| Total | 25,767 (88.6%) | 26,642 (88.6%) |
Income Below Poverty Among Married-Couple Families in St Cloud
The poverty statistics for married-couple families in St Cloud show that 5.9% or 534 of the total 9,128 families live below the poverty line. Families with 5 or more children have the highest poverty rate of 100.0%, comprising of 14 families. On the other hand, families with no children have the lowest poverty rate of 5.4%, which includes 245 families.
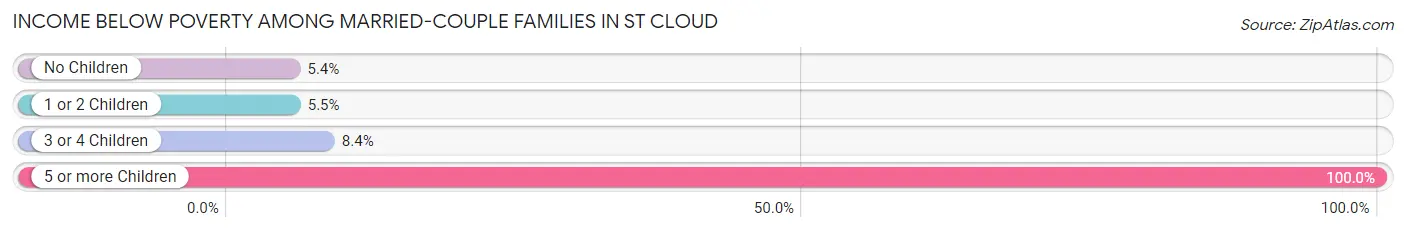
| Children | Above Poverty | Below Poverty |
| No Children | 4,262 (94.6%) | 245 (5.4%) |
| 1 or 2 Children | 3,604 (94.5%) | 208 (5.5%) |
| 3 or 4 Children | 728 (91.6%) | 67 (8.4%) |
| 5 or more Children | 0 (0.0%) | 14 (100.0%) |
| Total | 8,594 (94.2%) | 534 (5.9%) |
Income Below Poverty Among Single-Parent Households in St Cloud
According to the poverty data in St Cloud, 18.4% or 253 single-father households and 18.6% or 487 single-mother households are living below the poverty line. Among single-father households, those with no children have the highest poverty rate, with 125 households (20.8%) experiencing poverty. Likewise, among single-mother households, those with 3 or 4 children have the highest poverty rate, with 157 households (69.8%) falling below the poverty line.
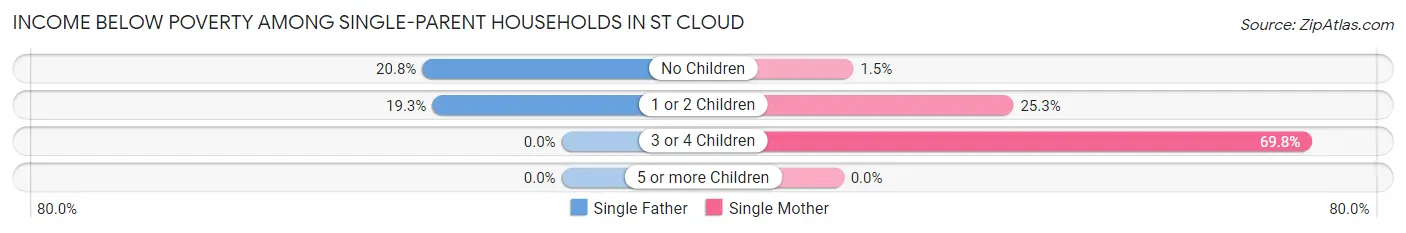
| Children | Single Father | Single Mother |
| No Children | 125 (20.8%) | 17 (1.5%) |
| 1 or 2 Children | 128 (19.3%) | 313 (25.3%) |
| 3 or 4 Children | 0 (0.0%) | 157 (69.8%) |
| 5 or more Children | 0 (0.0%) | 0 (0.0%) |
| Total | 253 (18.4%) | 487 (18.6%) |
Income Below Poverty Among Married-Couple vs Single-Parent Households in St Cloud
The poverty data for St Cloud shows that 534 of the married-couple family households (5.9%) and 740 of the single-parent households (18.5%) are living below the poverty level. Within the married-couple family households, those with 5 or more children have the highest poverty rate, with 14 households (100.0%) falling below the poverty line. Among the single-parent households, those with 3 or 4 children have the highest poverty rate, with 157 household (46.6%) living below poverty.
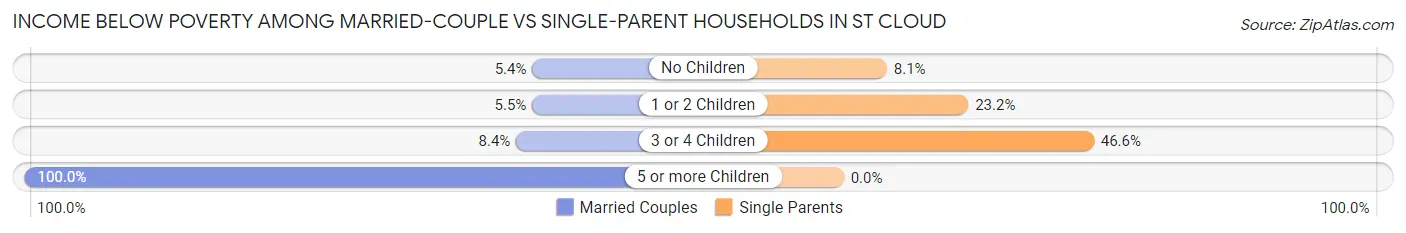
| Children | Married-Couple Families | Single-Parent Households |
| No Children | 245 (5.4%) | 142 (8.1%) |
| 1 or 2 Children | 208 (5.5%) | 441 (23.2%) |
| 3 or 4 Children | 67 (8.4%) | 157 (46.6%) |
| 5 or more Children | 14 (100.0%) | 0 (0.0%) |
| Total | 534 (5.9%) | 740 (18.5%) |
Race in St Cloud
The most populous races in St Cloud are White / Caucasian (32,829 | 54.8%), Hispanic or Latino (27,676 | 46.2%), and Two or more Races (10,723 | 17.9%).
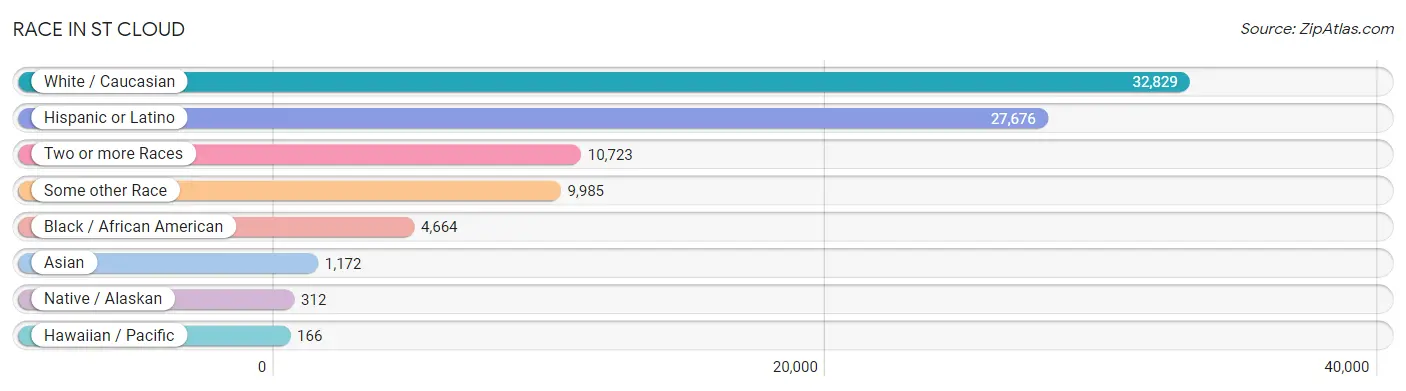
| Race | # Population | % Population |
| Asian | 1,172 | 2.0% |
| Black / African American | 4,664 | 7.8% |
| Hawaiian / Pacific | 166 | 0.3% |
| Hispanic or Latino | 27,676 | 46.2% |
| Native / Alaskan | 312 | 0.5% |
| White / Caucasian | 32,829 | 54.8% |
| Two or more Races | 10,723 | 17.9% |
| Some other Race | 9,985 | 16.7% |
| Total | 59,851 | 100.0% |
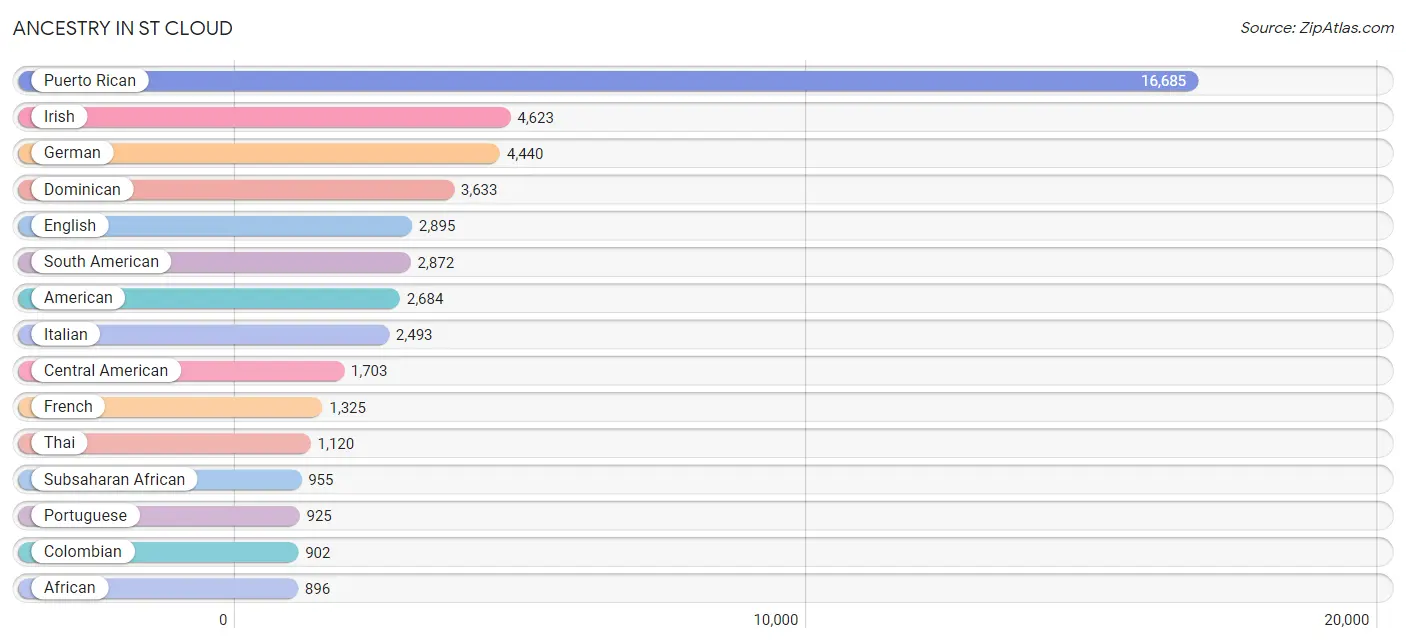
Ancestry in St Cloud
The most populous ancestries reported in St Cloud are Puerto Rican (16,685 | 27.9%), Irish (4,623 | 7.7%), German (4,440 | 7.4%), Dominican (3,633 | 6.1%), and English (2,895 | 4.8%), together accounting for 53.9% of all St Cloud residents.
| Ancestry | # Population | % Population |
| African | 896 | 1.5% |
| American | 2,684 | 4.5% |
| Arab | 69 | 0.1% |
| Argentinean | 11 | 0.0% |
| Armenian | 20 | 0.0% |
| Austrian | 14 | 0.0% |
| Belgian | 101 | 0.2% |
| Bolivian | 63 | 0.1% |
| Brazilian | 88 | 0.2% |
| British | 356 | 0.6% |
| Bulgarian | 175 | 0.3% |
| Burmese | 72 | 0.1% |
| Canadian | 46 | 0.1% |
| Central American | 1,703 | 2.9% |
| Central American Indian | 396 | 0.7% |
| Cherokee | 377 | 0.6% |
| Chilean | 473 | 0.8% |
| Chippewa | 22 | 0.0% |
| Choctaw | 22 | 0.0% |
| Colombian | 902 | 1.5% |
| Croatian | 18 | 0.0% |
| Cuban | 757 | 1.3% |
| Czech | 23 | 0.0% |
| Danish | 63 | 0.1% |
| Dominican | 3,633 | 6.1% |
| Dutch | 579 | 1.0% |
| Eastern European | 30 | 0.1% |
| Ecuadorian | 445 | 0.7% |
| English | 2,895 | 4.8% |
| European | 157 | 0.3% |
| Finnish | 25 | 0.0% |
| French | 1,325 | 2.2% |
| French American Indian | 9 | 0.0% |
| French Canadian | 48 | 0.1% |
| German | 4,440 | 7.4% |
| Greek | 140 | 0.2% |
| Guatemalan | 392 | 0.6% |
| Guyanese | 84 | 0.1% |
| Haitian | 124 | 0.2% |
| Honduran | 350 | 0.6% |
| Hungarian | 239 | 0.4% |
| Indian (Asian) | 154 | 0.3% |
| Iranian | 10 | 0.0% |
| Irish | 4,623 | 7.7% |
| Italian | 2,493 | 4.2% |
| Jamaican | 346 | 0.6% |
| Japanese | 41 | 0.1% |
| Jordanian | 10 | 0.0% |
| Kenyan | 59 | 0.1% |
| Korean | 515 | 0.9% |
| Lithuanian | 38 | 0.1% |
| Menominee | 52 | 0.1% |
| Mexican | 630 | 1.1% |
| Mexican American Indian | 27 | 0.1% |
| Moroccan | 24 | 0.0% |
| Nicaraguan | 99 | 0.2% |
| Northern European | 11 | 0.0% |
| Norwegian | 190 | 0.3% |
| Pakistani | 62 | 0.1% |
| Palestinian | 35 | 0.1% |
| Panamanian | 822 | 1.4% |
| Peruvian | 339 | 0.6% |
| Polish | 857 | 1.4% |
| Portuguese | 925 | 1.5% |
| Puerto Rican | 16,685 | 27.9% |
| Romanian | 132 | 0.2% |
| Russian | 236 | 0.4% |
| Salvadoran | 40 | 0.1% |
| Scandinavian | 37 | 0.1% |
| Scotch-Irish | 152 | 0.3% |
| Scottish | 672 | 1.1% |
| Seminole | 27 | 0.1% |
| Slovak | 20 | 0.0% |
| South American | 2,872 | 4.8% |
| South American Indian | 104 | 0.2% |
| Spaniard | 174 | 0.3% |
| Spanish | 361 | 0.6% |
| Sri Lankan | 77 | 0.1% |
| Subsaharan African | 955 | 1.6% |
| Swedish | 190 | 0.3% |
| Thai | 1,120 | 1.9% |
| Trinidadian and Tobagonian | 286 | 0.5% |
| Turkish | 13 | 0.0% |
| Ukrainian | 103 | 0.2% |
| Venezuelan | 639 | 1.1% |
| Welsh | 518 | 0.9% |
| West Indian | 188 | 0.3% | View All 87 Rows |
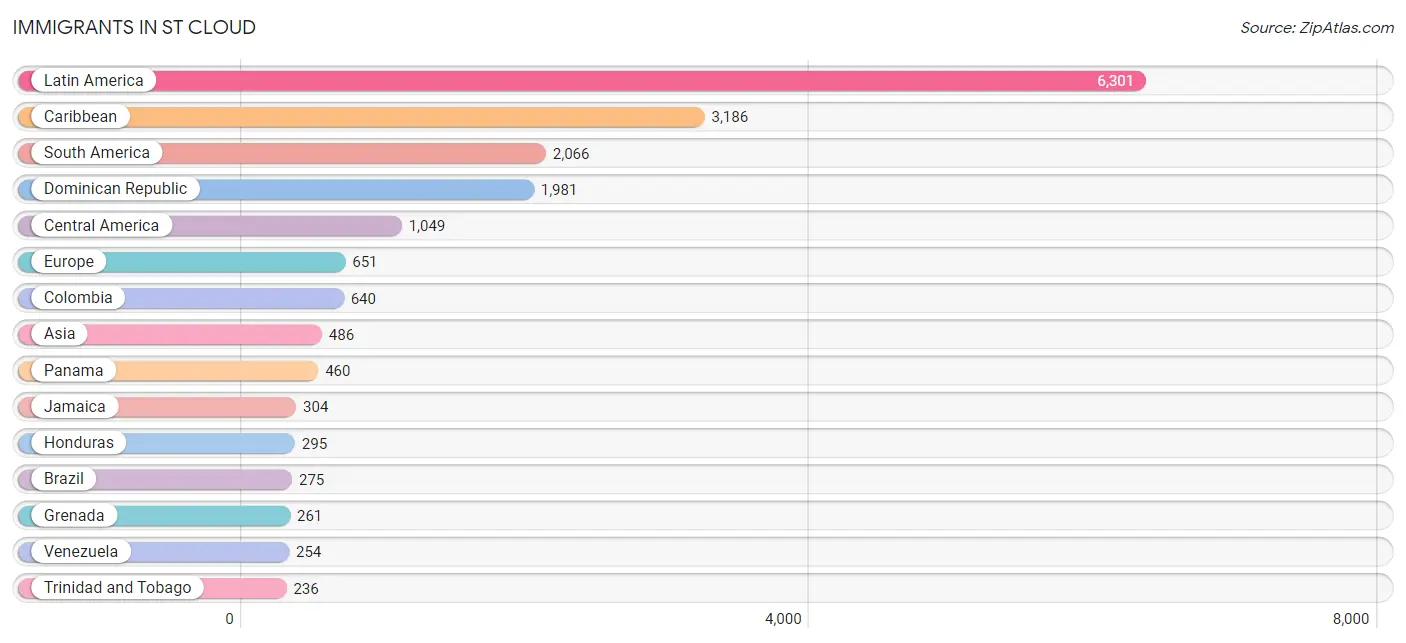
Immigrants in St Cloud
The most numerous immigrant groups reported in St Cloud came from Latin America (6,301 | 10.5%), Caribbean (3,186 | 5.3%), South America (2,066 | 3.5%), Dominican Republic (1,981 | 3.3%), and Central America (1,049 | 1.8%), together accounting for 24.4% of all St Cloud residents.
| Immigration Origin | # Population | % Population |
| Africa | 103 | 0.2% |
| Argentina | 79 | 0.1% |
| Asia | 486 | 0.8% |
| Belgium | 90 | 0.2% |
| Bolivia | 151 | 0.3% |
| Brazil | 275 | 0.5% |
| Cambodia | 26 | 0.0% |
| Canada | 53 | 0.1% |
| Caribbean | 3,186 | 5.3% |
| Central America | 1,049 | 1.8% |
| Chile | 125 | 0.2% |
| China | 48 | 0.1% |
| Colombia | 640 | 1.1% |
| Cuba | 203 | 0.3% |
| Dominican Republic | 1,981 | 3.3% |
| Eastern Asia | 48 | 0.1% |
| Eastern Europe | 220 | 0.4% |
| Ecuador | 121 | 0.2% |
| El Salvador | 23 | 0.0% |
| England | 120 | 0.2% |
| Europe | 651 | 1.1% |
| Grenada | 261 | 0.4% |
| Guatemala | 65 | 0.1% |
| Guyana | 194 | 0.3% |
| Haiti | 118 | 0.2% |
| Honduras | 295 | 0.5% |
| India | 105 | 0.2% |
| Iran | 10 | 0.0% |
| Italy | 50 | 0.1% |
| Jamaica | 304 | 0.5% |
| Latin America | 6,301 | 10.5% |
| Lebanon | 20 | 0.0% |
| Mexico | 162 | 0.3% |
| Moldova | 59 | 0.1% |
| Morocco | 24 | 0.0% |
| Netherlands | 13 | 0.0% |
| Nicaragua | 44 | 0.1% |
| Nigeria | 79 | 0.1% |
| Northern Africa | 24 | 0.0% |
| Northern Europe | 173 | 0.3% |
| Norway | 21 | 0.0% |
| Pakistan | 68 | 0.1% |
| Panama | 460 | 0.8% |
| Peru | 227 | 0.4% |
| Philippines | 148 | 0.3% |
| Poland | 22 | 0.0% |
| Portugal | 99 | 0.2% |
| Russia | 42 | 0.1% |
| Singapore | 11 | 0.0% |
| South America | 2,066 | 3.5% |
| South Central Asia | 183 | 0.3% |
| South Eastern Asia | 222 | 0.4% |
| Southern Europe | 155 | 0.3% |
| Spain | 6 | 0.0% |
| Trinidad and Tobago | 236 | 0.4% |
| Turkey | 13 | 0.0% |
| Ukraine | 97 | 0.2% |
| Venezuela | 254 | 0.4% |
| Vietnam | 37 | 0.1% |
| Western Africa | 79 | 0.1% |
| Western Asia | 33 | 0.1% |
| Western Europe | 103 | 0.2% | View All 62 Rows |
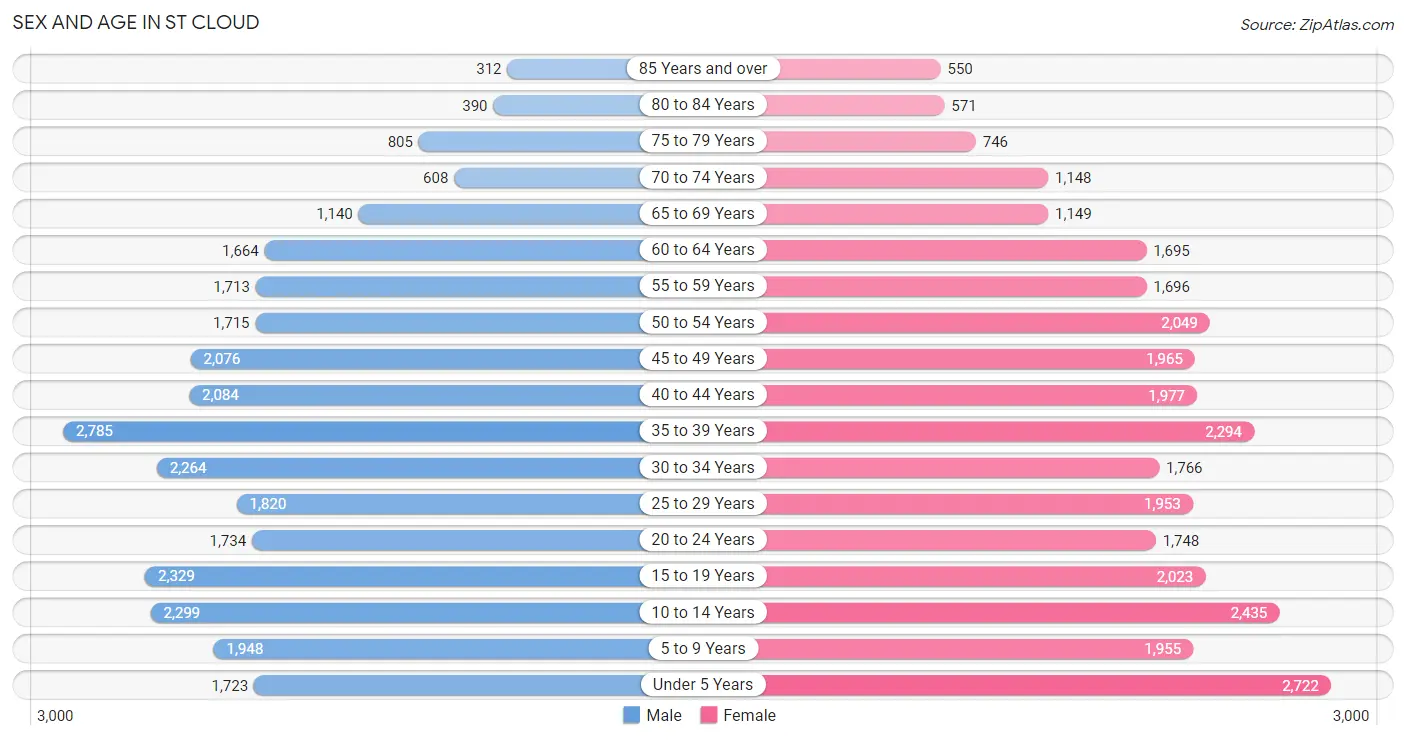
Sex and Age in St Cloud
Sex and Age in St Cloud
The most populous age groups in St Cloud are 35 to 39 Years (2,785 | 9.5%) for men and Under 5 Years (2,722 | 8.9%) for women.
| Age Bracket | Male | Female |
| Under 5 Years | 1,723 (5.9%) | 2,722 (8.9%) |
| 5 to 9 Years | 1,948 (6.6%) | 1,955 (6.4%) |
| 10 to 14 Years | 2,299 (7.8%) | 2,435 (8.0%) |
| 15 to 19 Years | 2,329 (7.9%) | 2,023 (6.7%) |
| 20 to 24 Years | 1,734 (5.9%) | 1,748 (5.7%) |
| 25 to 29 Years | 1,820 (6.2%) | 1,953 (6.4%) |
| 30 to 34 Years | 2,264 (7.7%) | 1,766 (5.8%) |
| 35 to 39 Years | 2,785 (9.5%) | 2,294 (7.5%) |
| 40 to 44 Years | 2,084 (7.1%) | 1,977 (6.5%) |
| 45 to 49 Years | 2,076 (7.1%) | 1,965 (6.5%) |
| 50 to 54 Years | 1,715 (5.8%) | 2,049 (6.7%) |
| 55 to 59 Years | 1,713 (5.8%) | 1,696 (5.6%) |
| 60 to 64 Years | 1,664 (5.7%) | 1,695 (5.6%) |
| 65 to 69 Years | 1,140 (3.9%) | 1,149 (3.8%) |
| 70 to 74 Years | 608 (2.1%) | 1,148 (3.8%) |
| 75 to 79 Years | 805 (2.7%) | 746 (2.5%) |
| 80 to 84 Years | 390 (1.3%) | 571 (1.9%) |
| 85 Years and over | 312 (1.1%) | 550 (1.8%) |
| Total | 29,409 (100.0%) | 30,442 (100.0%) |
Families and Households in St Cloud
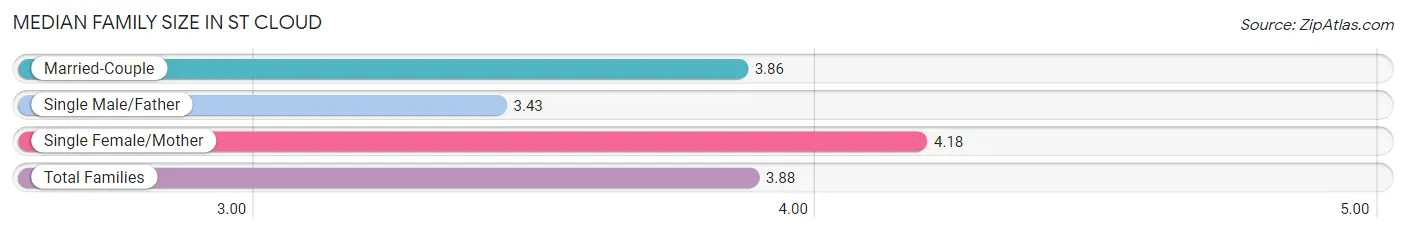
Median Family Size in St Cloud
The median family size in St Cloud is 3.88 persons per family, with single female/mother families (2,624 | 20.0%) accounting for the largest median family size of 4.18 persons per family. On the other hand, single male/father families (1,378 | 10.5%) represent the smallest median family size with 3.43 persons per family.
| Family Type | # Families | Family Size |
| Married-Couple | 9,128 (69.5%) | 3.86 |
| Single Male/Father | 1,378 (10.5%) | 3.43 |
| Single Female/Mother | 2,624 (20.0%) | 4.18 |
| Total Families | 13,130 (100.0%) | 3.88 |
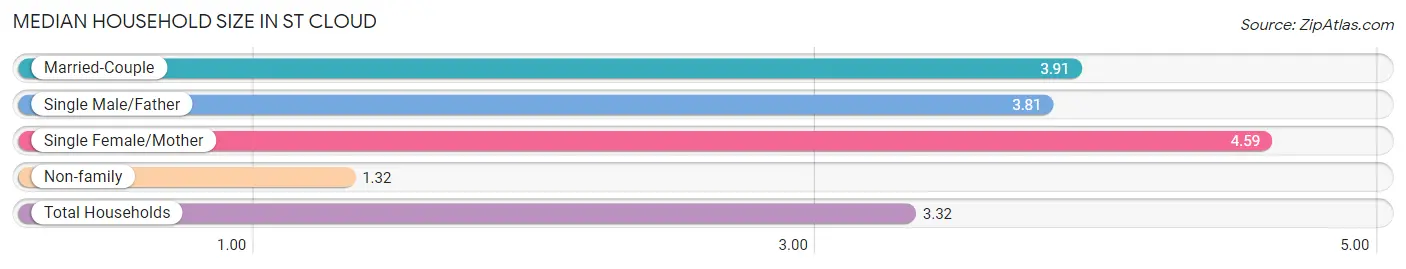
Median Household Size in St Cloud
The median household size in St Cloud is 3.32 persons per household, with single female/mother households (2,624 | 14.7%) accounting for the largest median household size of 4.59 persons per household. non-family households (4,713 | 26.4%) represent the smallest median household size with 1.32 persons per household.
| Household Type | # Households | Household Size |
| Married-Couple | 9,128 (51.2%) | 3.91 |
| Single Male/Father | 1,378 (7.7%) | 3.81 |
| Single Female/Mother | 2,624 (14.7%) | 4.59 |
| Non-family | 4,713 (26.4%) | 1.32 |
| Total Households | 17,843 (100.0%) | 3.32 |
Household Size by Marriage Status in St Cloud
Out of a total of 17,843 households in St Cloud, 13,130 (73.6%) are family households, while 4,713 (26.4%) are nonfamily households. The most numerous type of family households are 2-person households, comprising 4,166, and the most common type of nonfamily households are 1-person households, comprising 3,778.
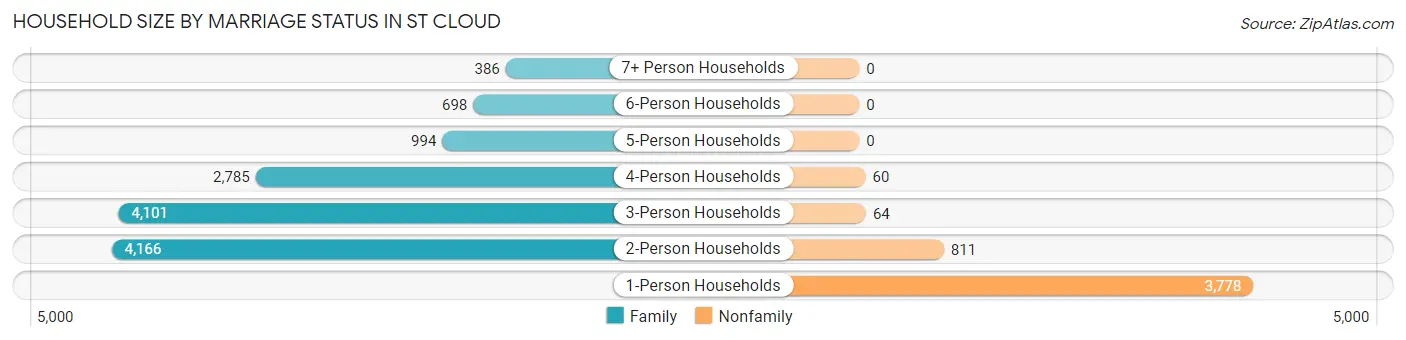
| Household Size | Family Households | Nonfamily Households |
| 1-Person Households | - | 3,778 (21.2%) |
| 2-Person Households | 4,166 (23.4%) | 811 (4.5%) |
| 3-Person Households | 4,101 (23.0%) | 64 (0.4%) |
| 4-Person Households | 2,785 (15.6%) | 60 (0.3%) |
| 5-Person Households | 994 (5.6%) | 0 (0.0%) |
| 6-Person Households | 698 (3.9%) | 0 (0.0%) |
| 7+ Person Households | 386 (2.2%) | 0 (0.0%) |
| Total | 13,130 (73.6%) | 4,713 (26.4%) |
Female Fertility in St Cloud
Fertility by Age in St Cloud
Average fertility rate in St Cloud is 57.0 births per 1,000 women. Women in the age bracket of 20 to 34 years have the highest fertility rate with 139.0 births per 1,000 women. Women in the age bracket of 20 to 34 years acount for 95.1% of all women with births.
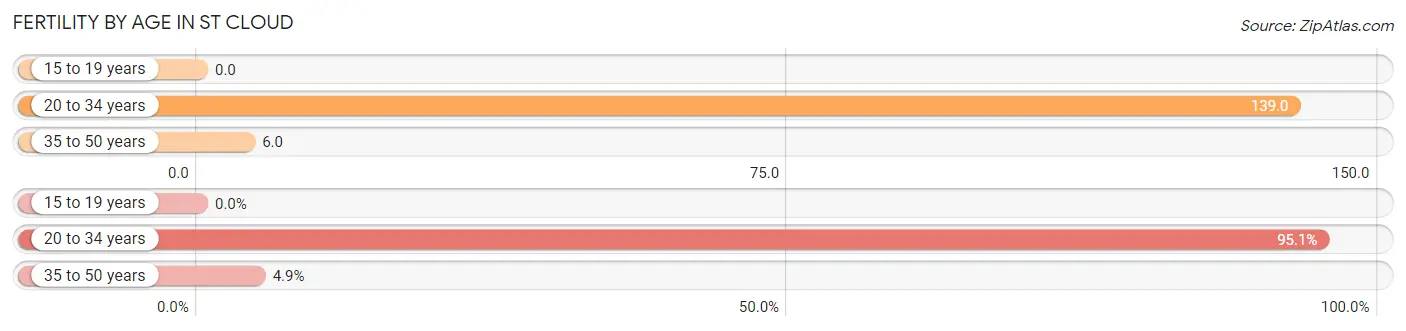
| Age Bracket | Women with Births | Births / 1,000 Women |
| 15 to 19 years | 0 (0.0%) | 0.0 |
| 20 to 34 years | 759 (95.1%) | 139.0 |
| 35 to 50 years | 39 (4.9%) | 6.0 |
| Total | 798 (100.0%) | 57.0 |
Fertility by Age by Marriage Status in St Cloud
47.2% of women with births (798) in St Cloud are married. The highest percentage of unmarried women with births falls into 20 to 34 years age bracket with 53.5% of them unmarried at the time of birth, while the lowest percentage of unmarried women with births belong to 35 to 50 years age bracket with 38.5% of them unmarried.
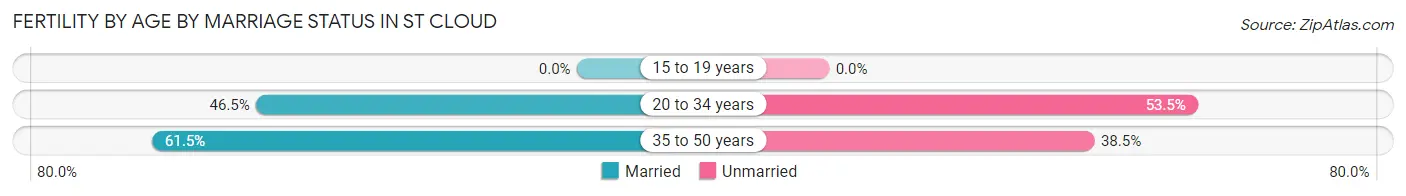
| Age Bracket | Married | Unmarried |
| 15 to 19 years | 0 (0.0%) | 0 (0.0%) |
| 20 to 34 years | 353 (46.5%) | 406 (53.5%) |
| 35 to 50 years | 24 (61.5%) | 15 (38.5%) |
| Total | 377 (47.2%) | 421 (52.8%) |
Fertility by Education in St Cloud
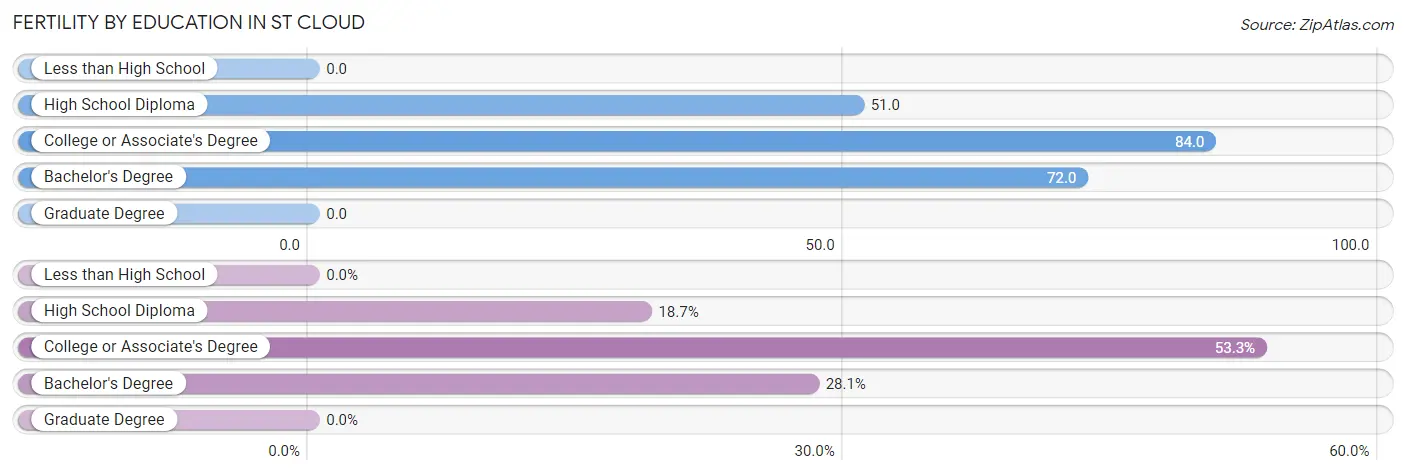
| Educational Attainment | Women with Births | Births / 1,000 Women |
| Less than High School | 0 (0.0%) | 0.0 |
| High School Diploma | 149 (18.7%) | 51.0 |
| College or Associate's Degree | 425 (53.3%) | 84.0 |
| Bachelor's Degree | 224 (28.1%) | 72.0 |
| Graduate Degree | 0 (0.0%) | 0.0 |
| Total | 798 (100.0%) | 57.0 |
Fertility by Education by Marriage Status in St Cloud
52.8% of women with births in St Cloud are unmarried. Women with the educational attainment of bachelor's degree are most likely to be married with 100.0% of them married at childbirth, while women with the educational attainment of high school diploma are least likely to be married with 87.3% of them unmarried at childbirth.
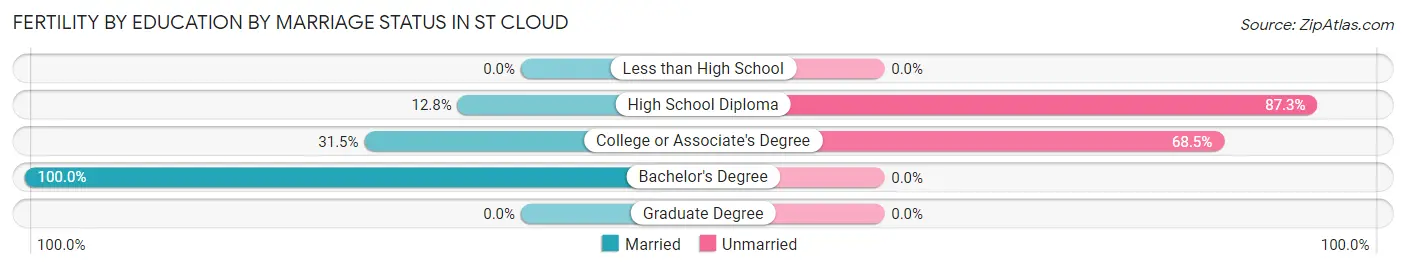
| Educational Attainment | Married | Unmarried |
| Less than High School | 0 (0.0%) | 0 (0.0%) |
| High School Diploma | 19 (12.8%) | 130 (87.3%) |
| College or Associate's Degree | 134 (31.5%) | 291 (68.5%) |
| Bachelor's Degree | 224 (100.0%) | 0 (0.0%) |
| Graduate Degree | 0 (0.0%) | 0 (0.0%) |
| Total | 377 (47.2%) | 421 (52.8%) |
Employment Characteristics in St Cloud
Employment by Class of Employer in St Cloud
Among the 25,280 employed individuals in St Cloud, private company employees (17,738 | 70.2%), local government employees (2,771 | 11.0%), and not-for-profit organizations (1,431 | 5.7%) make up the most common classes of employment.
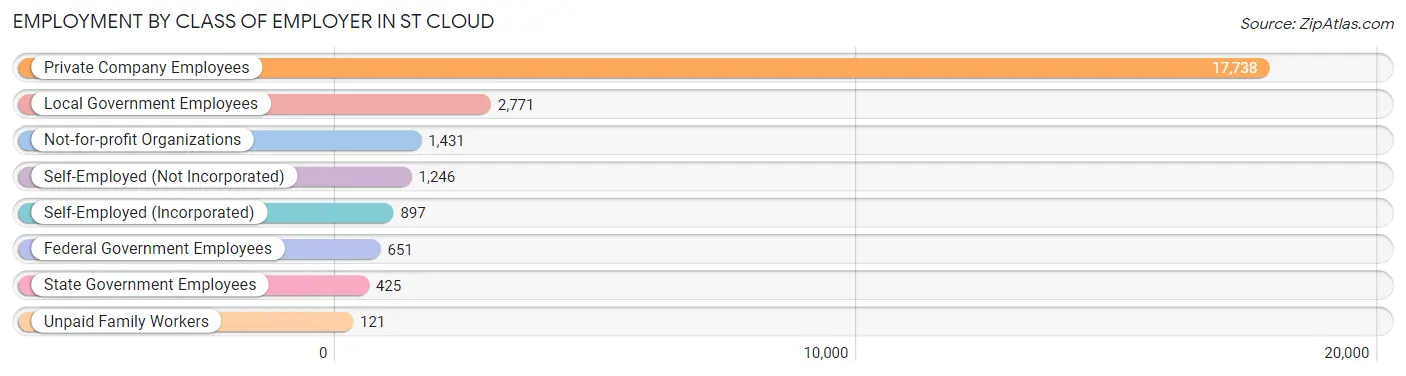
| Employer Class | # Employees | % Employees |
| Private Company Employees | 17,738 | 70.2% |
| Self-Employed (Incorporated) | 897 | 3.5% |
| Self-Employed (Not Incorporated) | 1,246 | 4.9% |
| Not-for-profit Organizations | 1,431 | 5.7% |
| Local Government Employees | 2,771 | 11.0% |
| State Government Employees | 425 | 1.7% |
| Federal Government Employees | 651 | 2.6% |
| Unpaid Family Workers | 121 | 0.5% |
| Total | 25,280 | 100.0% |
Employment Status by Age in St Cloud
According to the labor force statistics for St Cloud, out of the total population over 16 years of age (45,768), 60.7% or 27,781 individuals are in the labor force, with 6.4% or 1,778 of them unemployed. The age group with the highest labor force participation rate is 45 to 54 years, with 83.9% or 6,548 individuals in the labor force. Within the labor force, the 35 to 44 years age range has the highest percentage of unemployed individuals, with 11.8% or 887 of them being unemployed.
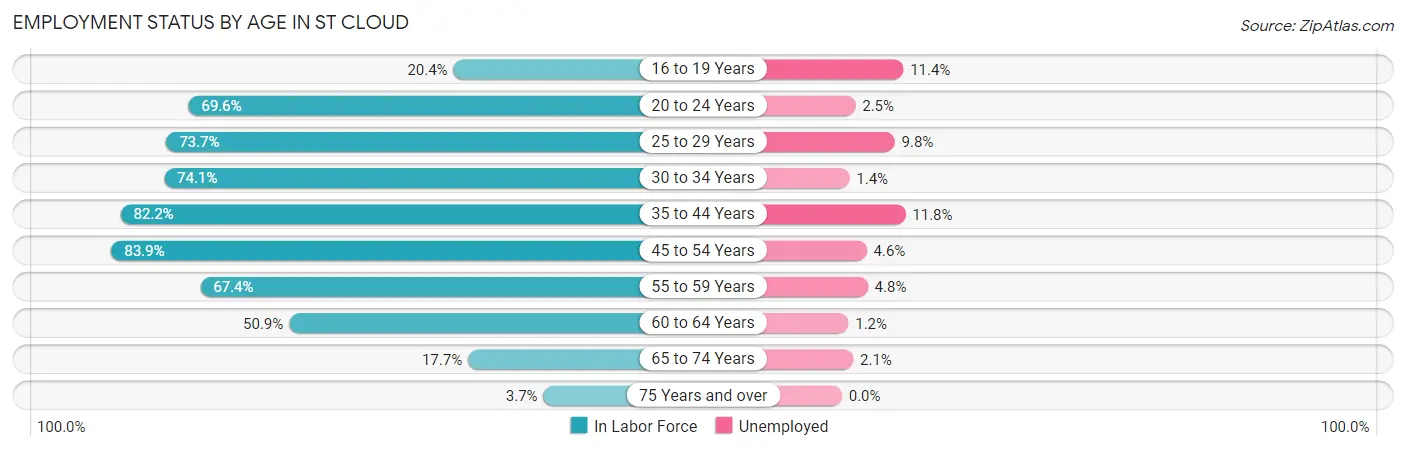
| Age Bracket | In Labor Force | Unemployed |
| 16 to 19 Years | 684 (20.4%) | 78 (11.4%) |
| 20 to 24 Years | 2,423 (69.6%) | 61 (2.5%) |
| 25 to 29 Years | 2,781 (73.7%) | 273 (9.8%) |
| 30 to 34 Years | 2,986 (74.1%) | 42 (1.4%) |
| 35 to 44 Years | 7,513 (82.2%) | 887 (11.8%) |
| 45 to 54 Years | 6,548 (83.9%) | 301 (4.6%) |
| 55 to 59 Years | 2,298 (67.4%) | 110 (4.8%) |
| 60 to 64 Years | 1,710 (50.9%) | 21 (1.2%) |
| 65 to 74 Years | 716 (17.7%) | 15 (2.1%) |
| 75 Years and over | 125 (3.7%) | 0 (0.0%) |
| Total | 27,781 (60.7%) | 1,778 (6.4%) |
Employment Status by Educational Attainment in St Cloud
According to labor force statistics for St Cloud, 75.6% of individuals (23,826) out of the total population between 25 and 64 years of age (31,516) are in the labor force, with 6.9% or 1,644 of them being unemployed. The group with the highest labor force participation rate are those with the educational attainment of bachelor's degree or higher, with 83.1% or 7,143 individuals in the labor force. Within the labor force, individuals with high school diploma education have the highest percentage of unemployment, with 13.1% or 898 of them being unemployed.
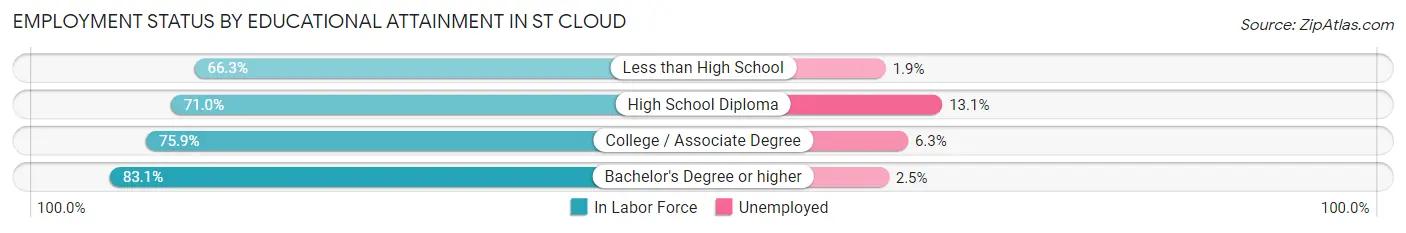
| Educational Attainment | In Labor Force | Unemployed |
| Less than High School | 1,544 (66.3%) | 44 (1.9%) |
| High School Diploma | 6,854 (71.0%) | 1,265 (13.1%) |
| College / Associate Degree | 8,302 (75.9%) | 689 (6.3%) |
| Bachelor's Degree or higher | 7,143 (83.1%) | 215 (2.5%) |
| Total | 23,826 (75.6%) | 2,175 (6.9%) |
Employment Occupations by Sex in St Cloud
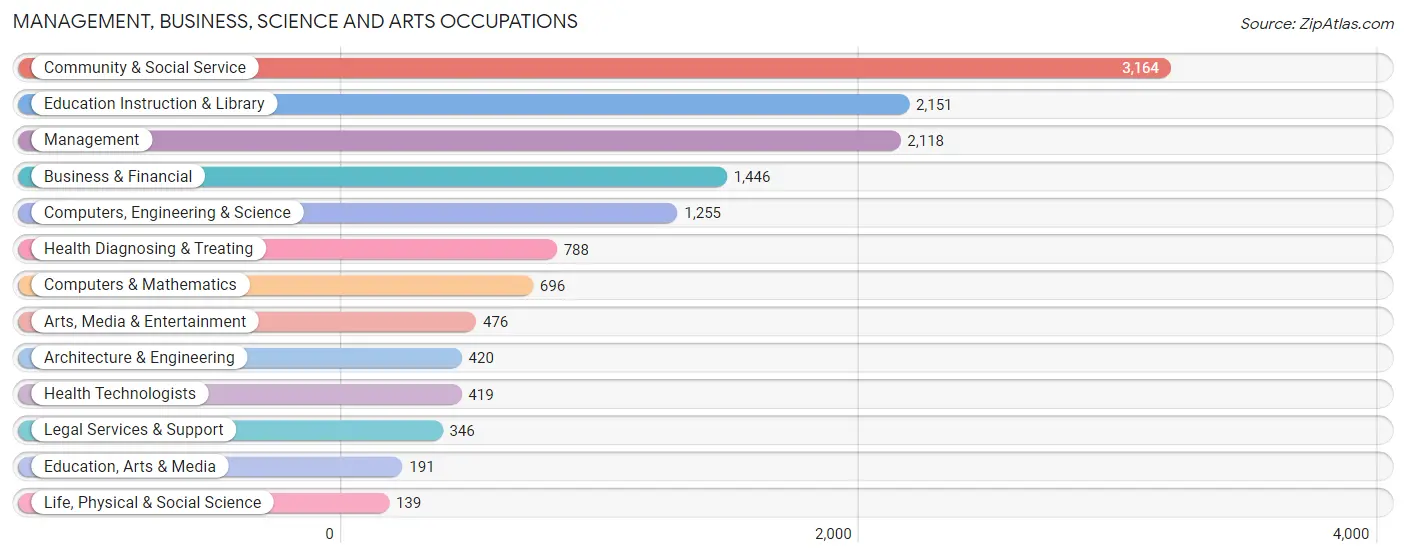
Management, Business, Science and Arts Occupations
The most common Management, Business, Science and Arts occupations in St Cloud are Community & Social Service (3,164 | 12.2%), Education Instruction & Library (2,151 | 8.3%), Management (2,118 | 8.2%), Business & Financial (1,446 | 5.6%), and Computers, Engineering & Science (1,255 | 4.8%).
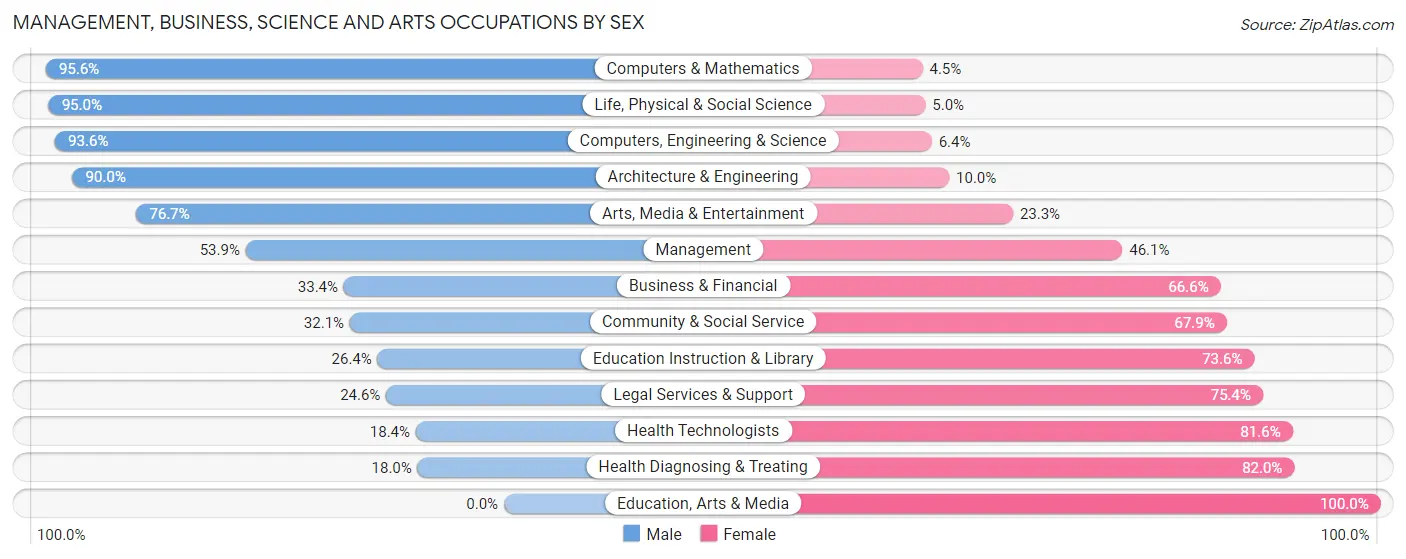
Management, Business, Science and Arts Occupations by Sex
Within the Management, Business, Science and Arts occupations in St Cloud, the most male-oriented occupations are Computers & Mathematics (95.6%), Life, Physical & Social Science (95.0%), and Computers, Engineering & Science (93.6%), while the most female-oriented occupations are Education, Arts & Media (100.0%), Health Diagnosing & Treating (82.0%), and Health Technologists (81.6%).
| Occupation | Male | Female |
| Management | 1,141 (53.9%) | 977 (46.1%) |
| Business & Financial | 483 (33.4%) | 963 (66.6%) |
| Computers, Engineering & Science | 1,175 (93.6%) | 80 (6.4%) |
| Computers & Mathematics | 665 (95.6%) | 31 (4.4%) |
| Architecture & Engineering | 378 (90.0%) | 42 (10.0%) |
| Life, Physical & Social Science | 132 (95.0%) | 7 (5.0%) |
| Community & Social Service | 1,017 (32.1%) | 2,147 (67.9%) |
| Education, Arts & Media | 0 (0.0%) | 191 (100.0%) |
| Legal Services & Support | 85 (24.6%) | 261 (75.4%) |
| Education Instruction & Library | 567 (26.4%) | 1,584 (73.6%) |
| Arts, Media & Entertainment | 365 (76.7%) | 111 (23.3%) |
| Health Diagnosing & Treating | 142 (18.0%) | 646 (82.0%) |
| Health Technologists | 77 (18.4%) | 342 (81.6%) |
| Total (Category) | 3,958 (45.1%) | 4,813 (54.9%) |
| Total (Overall) | 13,390 (51.5%) | 12,601 (48.5%) |
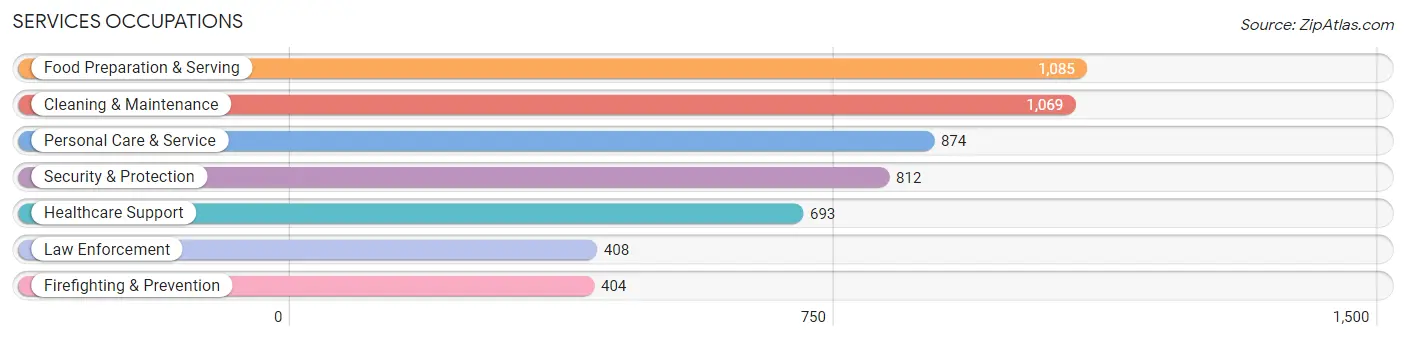
Services Occupations
The most common Services occupations in St Cloud are Food Preparation & Serving (1,085 | 4.2%), Cleaning & Maintenance (1,069 | 4.1%), Personal Care & Service (874 | 3.4%), Security & Protection (812 | 3.1%), and Healthcare Support (693 | 2.7%).
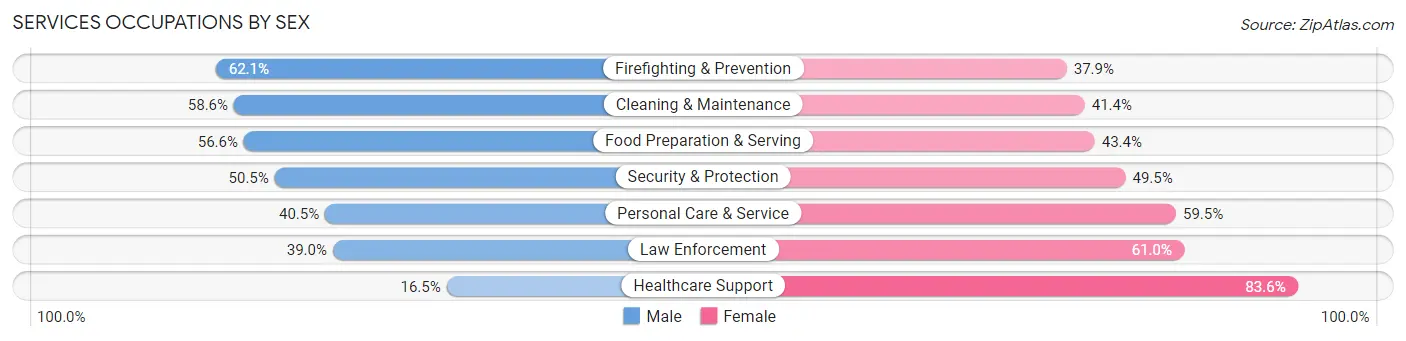
Services Occupations by Sex
Within the Services occupations in St Cloud, the most male-oriented occupations are Firefighting & Prevention (62.1%), Cleaning & Maintenance (58.6%), and Food Preparation & Serving (56.6%), while the most female-oriented occupations are Healthcare Support (83.6%), Law Enforcement (61.0%), and Personal Care & Service (59.5%).
| Occupation | Male | Female |
| Healthcare Support | 114 (16.5%) | 579 (83.6%) |
| Security & Protection | 410 (50.5%) | 402 (49.5%) |
| Firefighting & Prevention | 251 (62.1%) | 153 (37.9%) |
| Law Enforcement | 159 (39.0%) | 249 (61.0%) |
| Food Preparation & Serving | 614 (56.6%) | 471 (43.4%) |
| Cleaning & Maintenance | 626 (58.6%) | 443 (41.4%) |
| Personal Care & Service | 354 (40.5%) | 520 (59.5%) |
| Total (Category) | 2,118 (46.7%) | 2,415 (53.3%) |
| Total (Overall) | 13,390 (51.5%) | 12,601 (48.5%) |
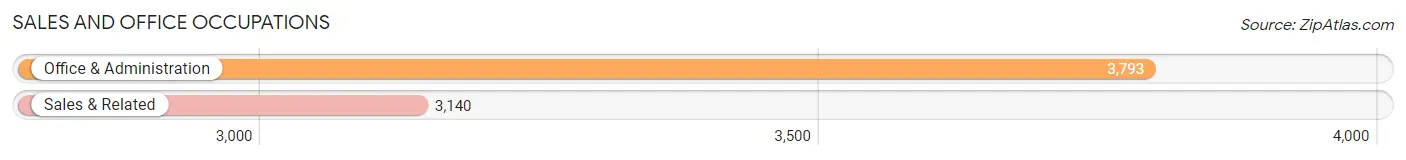
Sales and Office Occupations
The most common Sales and Office occupations in St Cloud are Office & Administration (3,793 | 14.6%), and Sales & Related (3,140 | 12.1%).
Sales and Office Occupations by Sex
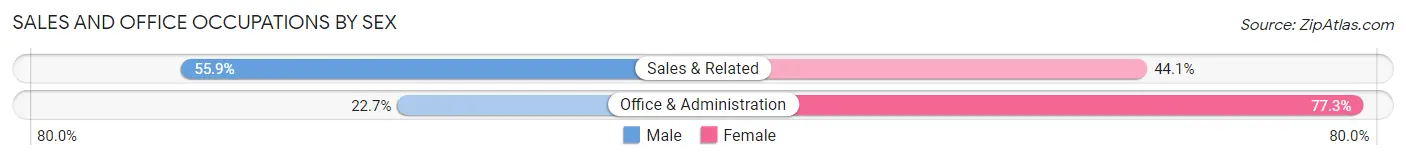
| Occupation | Male | Female |
| Sales & Related | 1,755 (55.9%) | 1,385 (44.1%) |
| Office & Administration | 860 (22.7%) | 2,933 (77.3%) |
| Total (Category) | 2,615 (37.7%) | 4,318 (62.3%) |
| Total (Overall) | 13,390 (51.5%) | 12,601 (48.5%) |
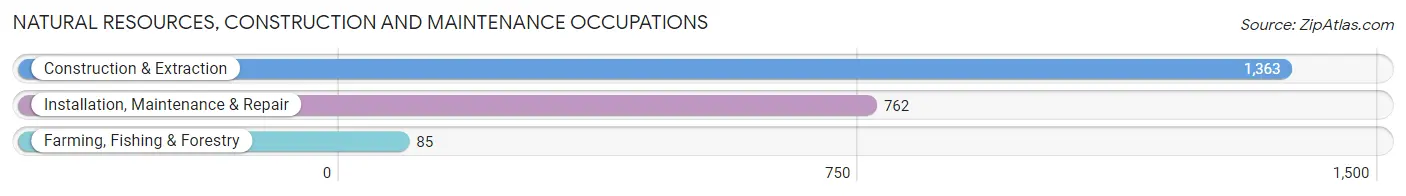
Natural Resources, Construction and Maintenance Occupations
The most common Natural Resources, Construction and Maintenance occupations in St Cloud are Construction & Extraction (1,363 | 5.2%), Installation, Maintenance & Repair (762 | 2.9%), and Farming, Fishing & Forestry (85 | 0.3%).
Natural Resources, Construction and Maintenance Occupations by Sex
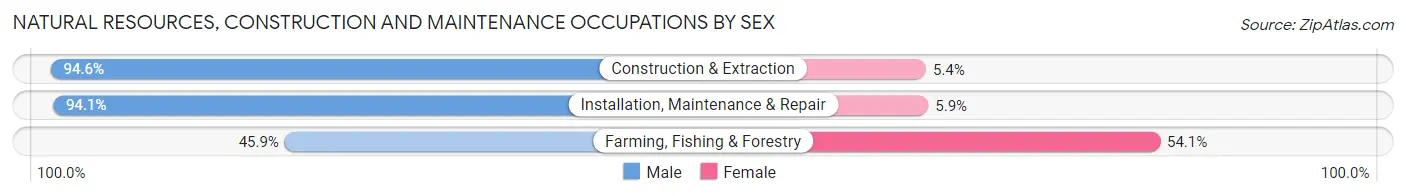
| Occupation | Male | Female |
| Farming, Fishing & Forestry | 39 (45.9%) | 46 (54.1%) |
| Construction & Extraction | 1,289 (94.6%) | 74 (5.4%) |
| Installation, Maintenance & Repair | 717 (94.1%) | 45 (5.9%) |
| Total (Category) | 2,045 (92.5%) | 165 (7.5%) |
| Total (Overall) | 13,390 (51.5%) | 12,601 (48.5%) |
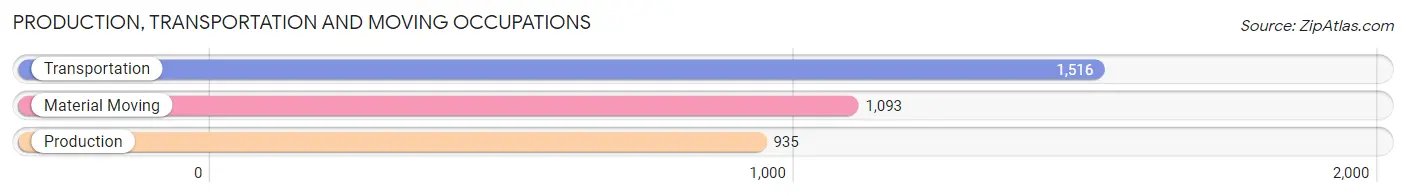
Production, Transportation and Moving Occupations
The most common Production, Transportation and Moving occupations in St Cloud are Transportation (1,516 | 5.8%), Material Moving (1,093 | 4.2%), and Production (935 | 3.6%).
Production, Transportation and Moving Occupations by Sex
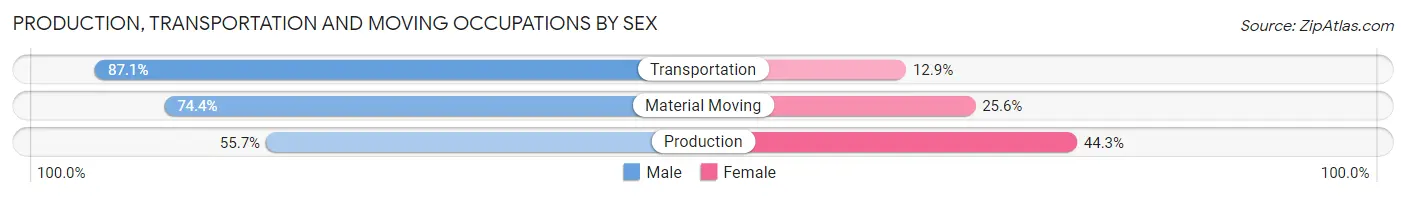
| Occupation | Male | Female |
| Production | 521 (55.7%) | 414 (44.3%) |
| Transportation | 1,320 (87.1%) | 196 (12.9%) |
| Material Moving | 813 (74.4%) | 280 (25.6%) |
| Total (Category) | 2,654 (74.9%) | 890 (25.1%) |
| Total (Overall) | 13,390 (51.5%) | 12,601 (48.5%) |
Employment Industries by Sex in St Cloud
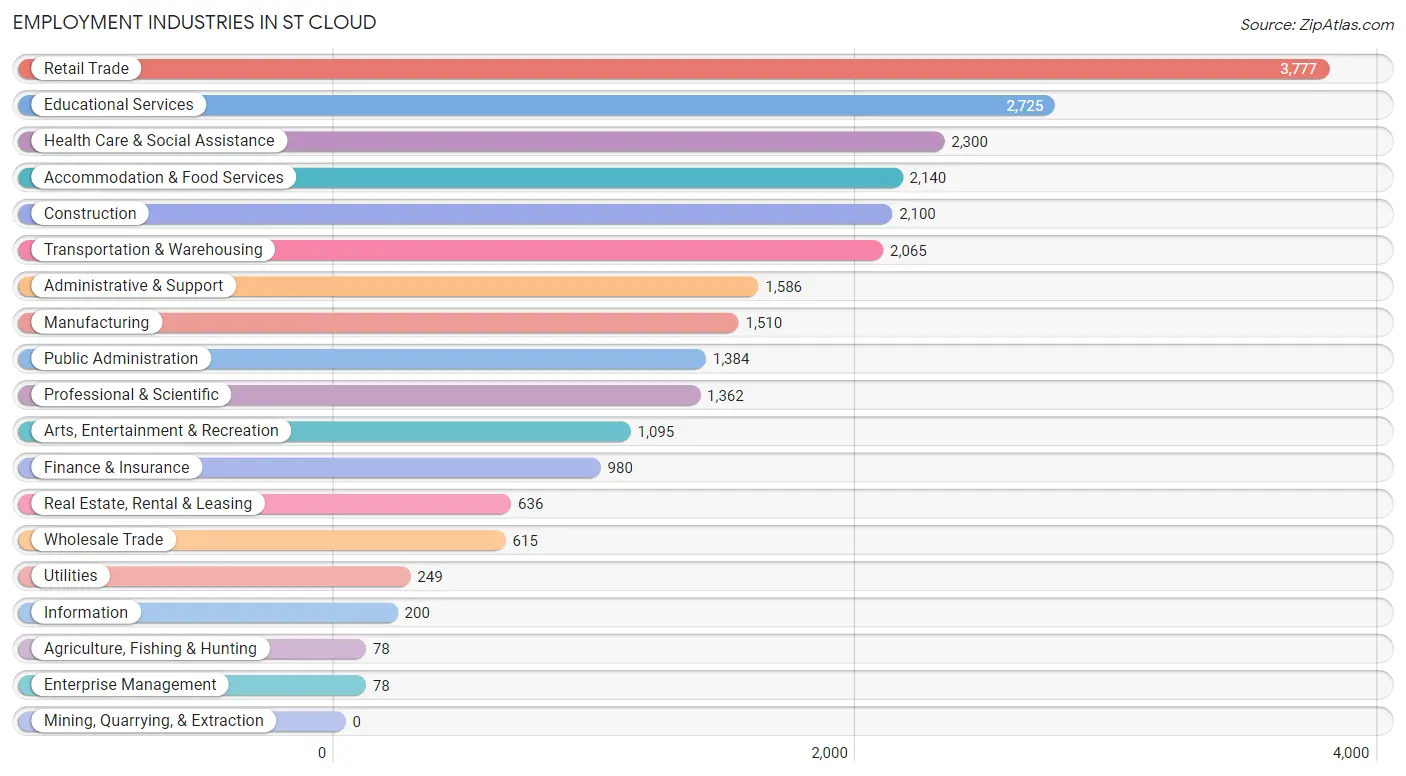
Employment Industries in St Cloud
The major employment industries in St Cloud include Retail Trade (3,777 | 14.5%), Educational Services (2,725 | 10.5%), Health Care & Social Assistance (2,300 | 8.8%), Accommodation & Food Services (2,140 | 8.2%), and Construction (2,100 | 8.1%).
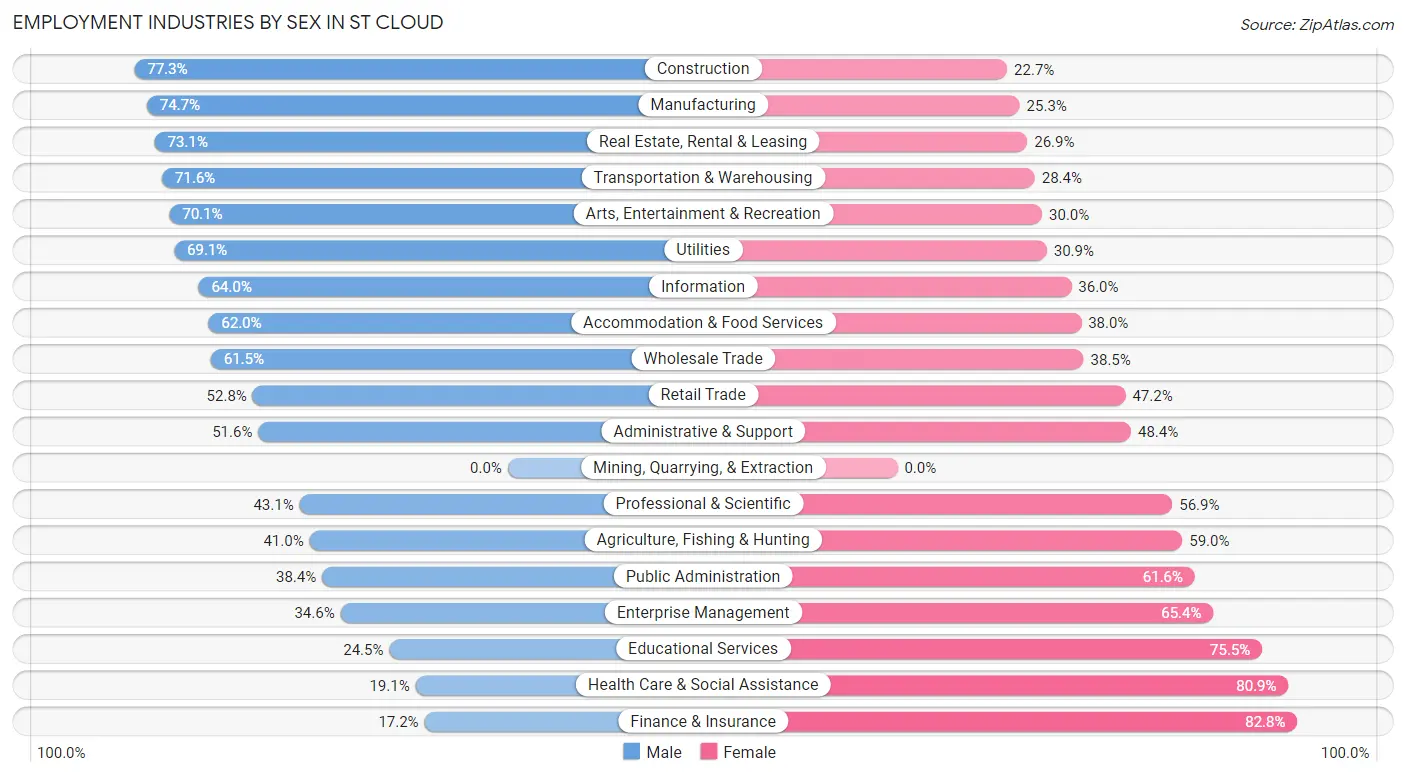
Employment Industries by Sex in St Cloud
The St Cloud industries that see more men than women are Construction (77.3%), Manufacturing (74.7%), and Real Estate, Rental & Leasing (73.1%), whereas the industries that tend to have a higher number of women are Finance & Insurance (82.8%), Health Care & Social Assistance (80.9%), and Educational Services (75.5%).
| Industry | Male | Female |
| Agriculture, Fishing & Hunting | 32 (41.0%) | 46 (59.0%) |
| Mining, Quarrying, & Extraction | 0 (0.0%) | 0 (0.0%) |
| Construction | 1,623 (77.3%) | 477 (22.7%) |
| Manufacturing | 1,128 (74.7%) | 382 (25.3%) |
| Wholesale Trade | 378 (61.5%) | 237 (38.5%) |
| Retail Trade | 1,994 (52.8%) | 1,783 (47.2%) |
| Transportation & Warehousing | 1,478 (71.6%) | 587 (28.4%) |
| Utilities | 172 (69.1%) | 77 (30.9%) |
| Information | 128 (64.0%) | 72 (36.0%) |
| Finance & Insurance | 169 (17.2%) | 811 (82.8%) |
| Real Estate, Rental & Leasing | 465 (73.1%) | 171 (26.9%) |
| Professional & Scientific | 587 (43.1%) | 775 (56.9%) |
| Enterprise Management | 27 (34.6%) | 51 (65.4%) |
| Administrative & Support | 819 (51.6%) | 767 (48.4%) |
| Educational Services | 668 (24.5%) | 2,057 (75.5%) |
| Health Care & Social Assistance | 439 (19.1%) | 1,861 (80.9%) |
| Arts, Entertainment & Recreation | 767 (70.1%) | 328 (29.9%) |
| Accommodation & Food Services | 1,326 (62.0%) | 814 (38.0%) |
| Public Administration | 532 (38.4%) | 852 (61.6%) |
| Total | 13,390 (51.5%) | 12,601 (48.5%) |
Education in St Cloud
School Enrollment in St Cloud
The most common levels of schooling among the 16,657 students in St Cloud are high school (3,817 | 22.9%), middle school (3,758 | 22.6%), and elementary school (3,376 | 20.3%).
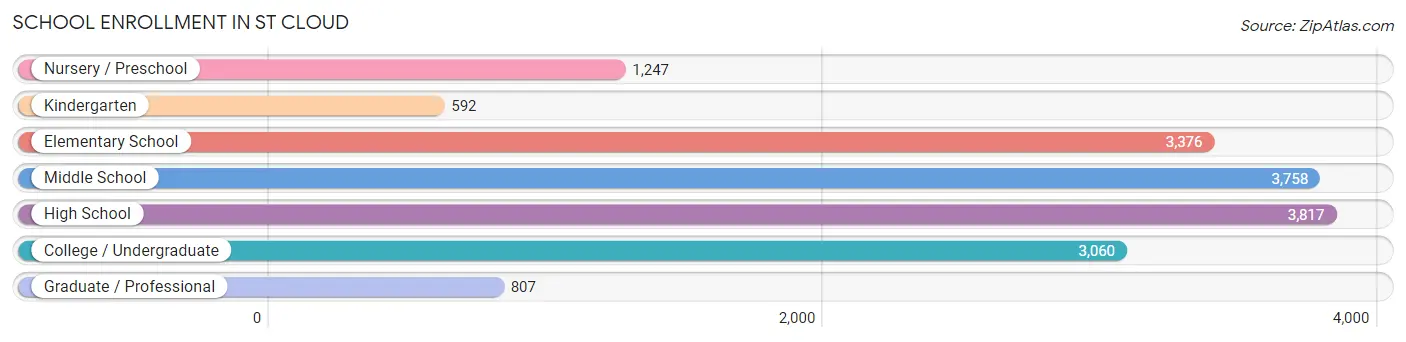
| School Level | # Students | % Students |
| Nursery / Preschool | 1,247 | 7.5% |
| Kindergarten | 592 | 3.5% |
| Elementary School | 3,376 | 20.3% |
| Middle School | 3,758 | 22.6% |
| High School | 3,817 | 22.9% |
| College / Undergraduate | 3,060 | 18.4% |
| Graduate / Professional | 807 | 4.8% |
| Total | 16,657 | 100.0% |
School Enrollment by Age by Funding Source in St Cloud
Out of a total of 16,657 students who are enrolled in schools in St Cloud, 2,282 (13.7%) attend a private institution, while the remaining 14,375 (86.3%) are enrolled in public schools. The age group of 3 to 4 year olds has the highest likelihood of being enrolled in private schools, with 172 (22.3% in the age bracket) enrolled. Conversely, the age group of 18 to 19 year olds has the lowest likelihood of being enrolled in a private school, with 1,059 (97.4% in the age bracket) attending a public institution.
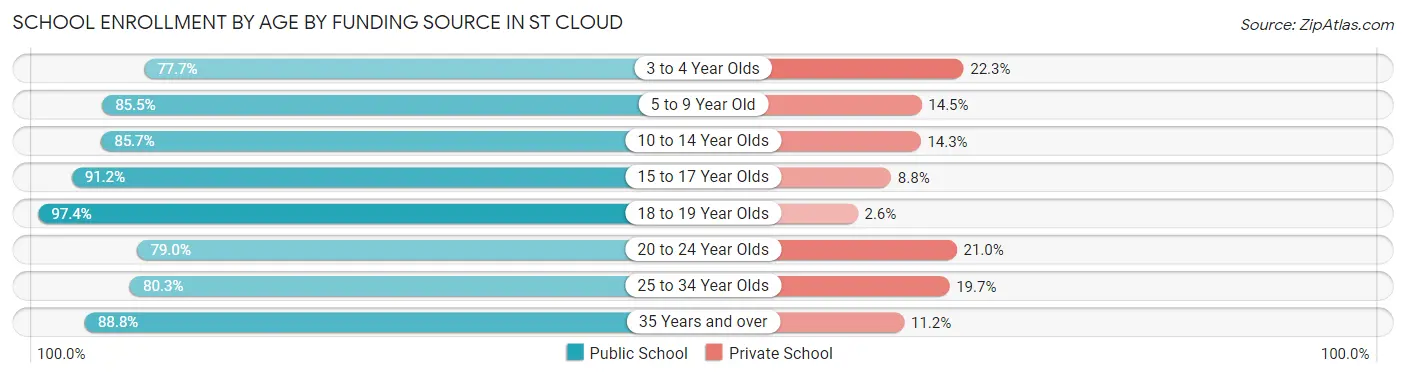
| Age Bracket | Public School | Private School |
| 3 to 4 Year Olds | 600 (77.7%) | 172 (22.3%) |
| 5 to 9 Year Old | 3,317 (85.5%) | 561 (14.5%) |
| 10 to 14 Year Olds | 3,992 (85.7%) | 666 (14.3%) |
| 15 to 17 Year Olds | 2,797 (91.2%) | 270 (8.8%) |
| 18 to 19 Year Olds | 1,059 (97.4%) | 28 (2.6%) |
| 20 to 24 Year Olds | 1,025 (79.0%) | 273 (21.0%) |
| 25 to 34 Year Olds | 952 (80.3%) | 233 (19.7%) |
| 35 Years and over | 632 (88.8%) | 80 (11.2%) |
| Total | 14,375 (86.3%) | 2,282 (13.7%) |
Educational Attainment by Field of Study in St Cloud
Business (2,504 | 22.9%), education (1,722 | 15.8%), arts & humanities (1,190 | 10.9%), science & technology (908 | 8.3%), and engineering (708 | 6.5%) are the most common fields of study among 10,931 individuals in St Cloud who have obtained a bachelor's degree or higher.
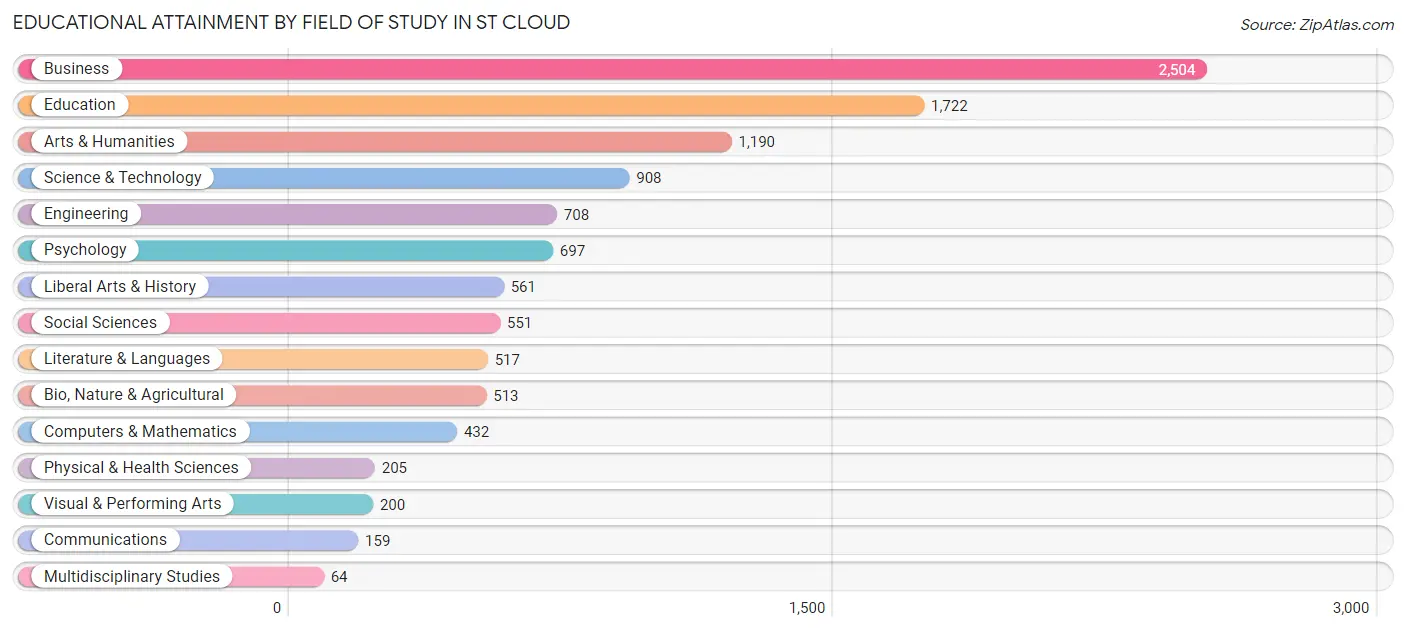
| Field of Study | # Graduates | % Graduates |
| Computers & Mathematics | 432 | 4.0% |
| Bio, Nature & Agricultural | 513 | 4.7% |
| Physical & Health Sciences | 205 | 1.9% |
| Psychology | 697 | 6.4% |
| Social Sciences | 551 | 5.0% |
| Engineering | 708 | 6.5% |
| Multidisciplinary Studies | 64 | 0.6% |
| Science & Technology | 908 | 8.3% |
| Business | 2,504 | 22.9% |
| Education | 1,722 | 15.8% |
| Literature & Languages | 517 | 4.7% |
| Liberal Arts & History | 561 | 5.1% |
| Visual & Performing Arts | 200 | 1.8% |
| Communications | 159 | 1.5% |
| Arts & Humanities | 1,190 | 10.9% |
| Total | 10,931 | 100.0% |
Transportation & Commute in St Cloud
Vehicle Availability by Sex in St Cloud
The most prevalent vehicle ownership categories in St Cloud are males with 2 vehicles (6,038, accounting for 46.2%) and females with 2 vehicles (5,367, making up 49.4%).
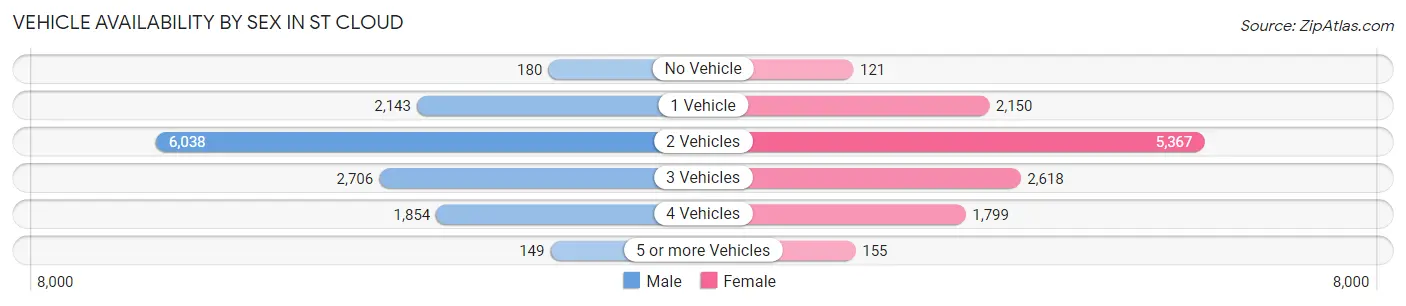
| Vehicles Available | Male | Female |
| No Vehicle | 180 (1.4%) | 121 (1.0%) |
| 1 Vehicle | 2,143 (16.4%) | 2,150 (17.6%) |
| 2 Vehicles | 6,038 (46.2%) | 5,367 (44.0%) |
| 3 Vehicles | 2,706 (20.7%) | 2,618 (21.4%) |
| 4 Vehicles | 1,854 (14.2%) | 1,799 (14.7%) |
| 5 or more Vehicles | 149 (1.1%) | 155 (1.3%) |
| Total | 13,070 (100.0%) | 12,210 (100.0%) |
Commute Time in St Cloud
The most frequently occuring commute durations in St Cloud are 45 to 59 minutes (5,129 commuters, 22.2%), 30 to 34 minutes (3,688 commuters, 15.9%), and 60 to 89 minutes (2,403 commuters, 10.4%).
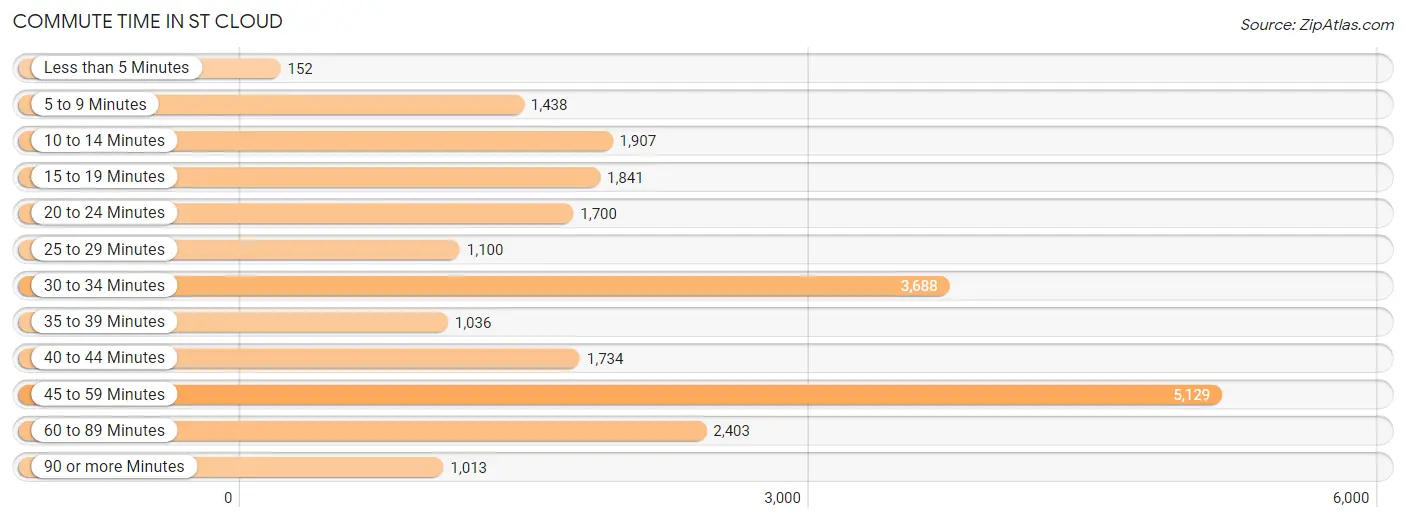
| Commute Time | # Commuters | % Commuters |
| Less than 5 Minutes | 152 | 0.7% |
| 5 to 9 Minutes | 1,438 | 6.2% |
| 10 to 14 Minutes | 1,907 | 8.2% |
| 15 to 19 Minutes | 1,841 | 8.0% |
| 20 to 24 Minutes | 1,700 | 7.3% |
| 25 to 29 Minutes | 1,100 | 4.8% |
| 30 to 34 Minutes | 3,688 | 15.9% |
| 35 to 39 Minutes | 1,036 | 4.5% |
| 40 to 44 Minutes | 1,734 | 7.5% |
| 45 to 59 Minutes | 5,129 | 22.2% |
| 60 to 89 Minutes | 2,403 | 10.4% |
| 90 or more Minutes | 1,013 | 4.4% |
Commute Time by Sex in St Cloud
The most common commute times in St Cloud are 45 to 59 minutes (2,480 commuters, 20.6%) for males and 45 to 59 minutes (2,649 commuters, 23.9%) for females.
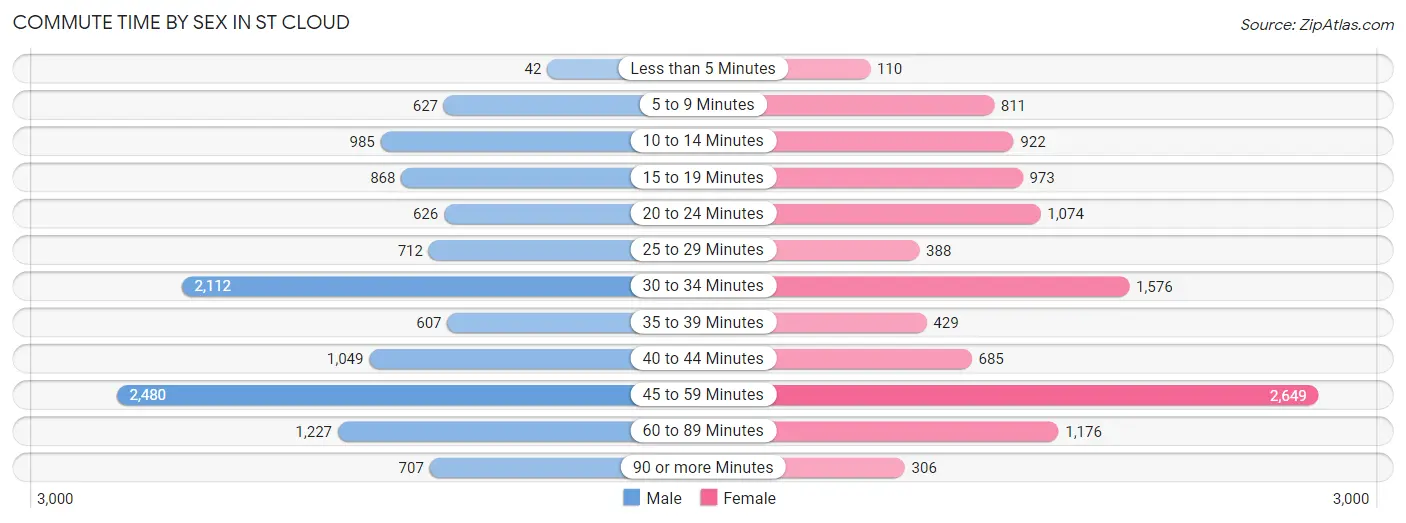
| Commute Time | Male | Female |
| Less than 5 Minutes | 42 (0.4%) | 110 (1.0%) |
| 5 to 9 Minutes | 627 (5.2%) | 811 (7.3%) |
| 10 to 14 Minutes | 985 (8.2%) | 922 (8.3%) |
| 15 to 19 Minutes | 868 (7.2%) | 973 (8.8%) |
| 20 to 24 Minutes | 626 (5.2%) | 1,074 (9.7%) |
| 25 to 29 Minutes | 712 (5.9%) | 388 (3.5%) |
| 30 to 34 Minutes | 2,112 (17.5%) | 1,576 (14.2%) |
| 35 to 39 Minutes | 607 (5.0%) | 429 (3.9%) |
| 40 to 44 Minutes | 1,049 (8.7%) | 685 (6.2%) |
| 45 to 59 Minutes | 2,480 (20.6%) | 2,649 (23.9%) |
| 60 to 89 Minutes | 1,227 (10.2%) | 1,176 (10.6%) |
| 90 or more Minutes | 707 (5.9%) | 306 (2.8%) |
Time of Departure to Work by Sex in St Cloud
The most frequent times of departure to work in St Cloud are 7:00 AM to 7:29 AM (1,716, 14.2%) for males and 7:00 AM to 7:29 AM (2,691, 24.2%) for females.
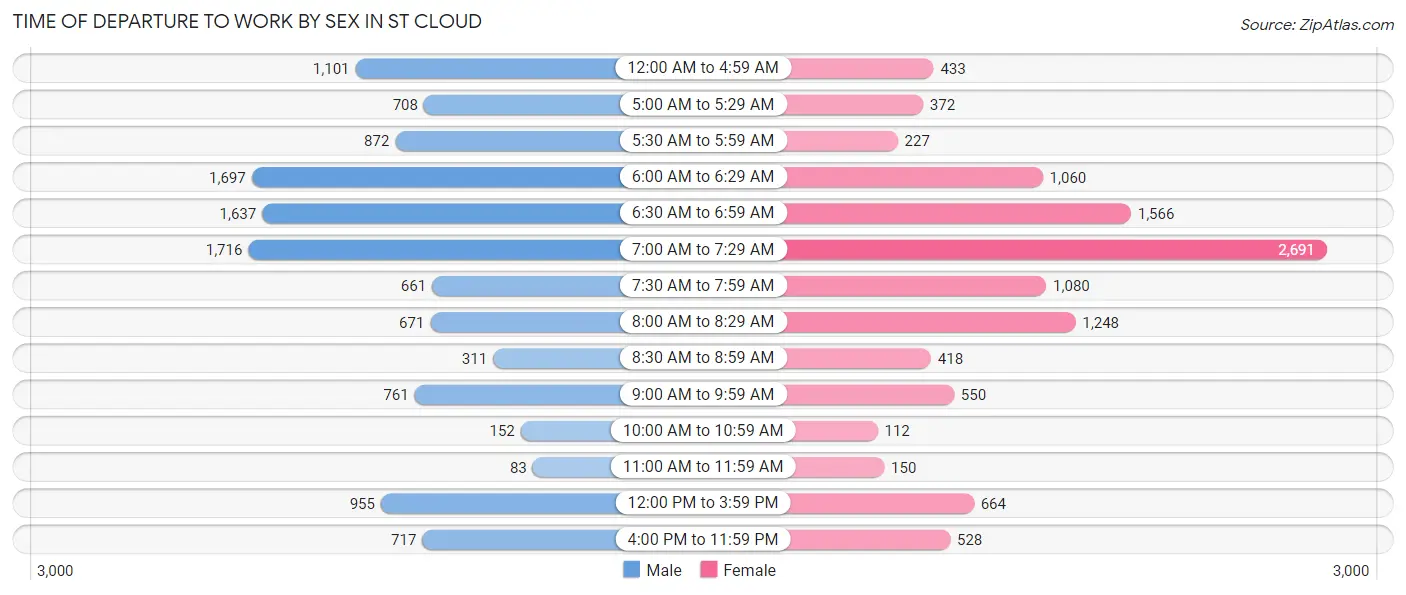
| Time of Departure | Male | Female |
| 12:00 AM to 4:59 AM | 1,101 (9.1%) | 433 (3.9%) |
| 5:00 AM to 5:29 AM | 708 (5.9%) | 372 (3.4%) |
| 5:30 AM to 5:59 AM | 872 (7.2%) | 227 (2.1%) |
| 6:00 AM to 6:29 AM | 1,697 (14.1%) | 1,060 (9.6%) |
| 6:30 AM to 6:59 AM | 1,637 (13.6%) | 1,566 (14.1%) |
| 7:00 AM to 7:29 AM | 1,716 (14.2%) | 2,691 (24.2%) |
| 7:30 AM to 7:59 AM | 661 (5.5%) | 1,080 (9.7%) |
| 8:00 AM to 8:29 AM | 671 (5.6%) | 1,248 (11.2%) |
| 8:30 AM to 8:59 AM | 311 (2.6%) | 418 (3.8%) |
| 9:00 AM to 9:59 AM | 761 (6.3%) | 550 (5.0%) |
| 10:00 AM to 10:59 AM | 152 (1.3%) | 112 (1.0%) |
| 11:00 AM to 11:59 AM | 83 (0.7%) | 150 (1.3%) |
| 12:00 PM to 3:59 PM | 955 (7.9%) | 664 (6.0%) |
| 4:00 PM to 11:59 PM | 717 (5.9%) | 528 (4.8%) |
| Total | 12,042 (100.0%) | 11,099 (100.0%) |
Housing Occupancy in St Cloud
Occupancy by Ownership in St Cloud
Of the total 17,843 dwellings in St Cloud, owner-occupied units account for 12,674 (71.0%), while renter-occupied units make up 5,169 (29.0%).
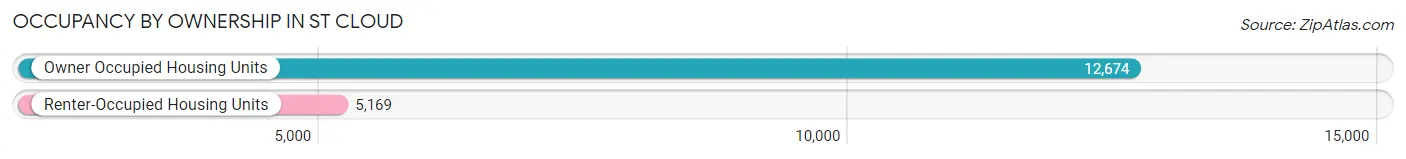
| Occupancy | # Housing Units | % Housing Units |
| Owner Occupied Housing Units | 12,674 | 71.0% |
| Renter-Occupied Housing Units | 5,169 | 29.0% |
| Total Occupied Housing Units | 17,843 | 100.0% |
Occupancy by Household Size in St Cloud
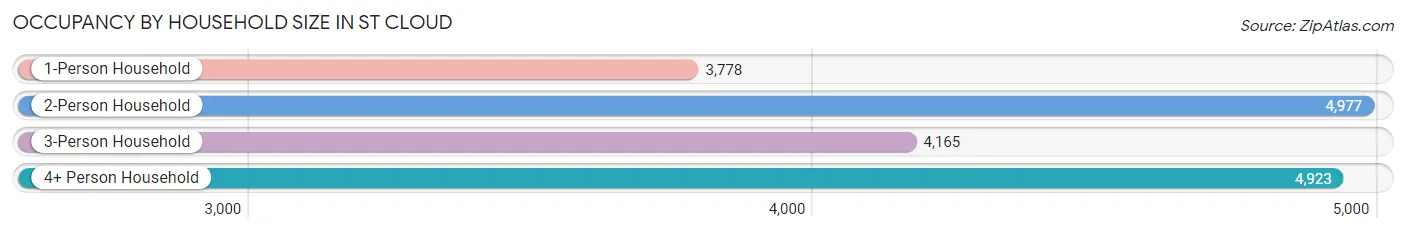
| Household Size | # Housing Units | % Housing Units |
| 1-Person Household | 3,778 | 21.2% |
| 2-Person Household | 4,977 | 27.9% |
| 3-Person Household | 4,165 | 23.3% |
| 4+ Person Household | 4,923 | 27.6% |
| Total Housing Units | 17,843 | 100.0% |
Occupancy by Ownership by Household Size in St Cloud
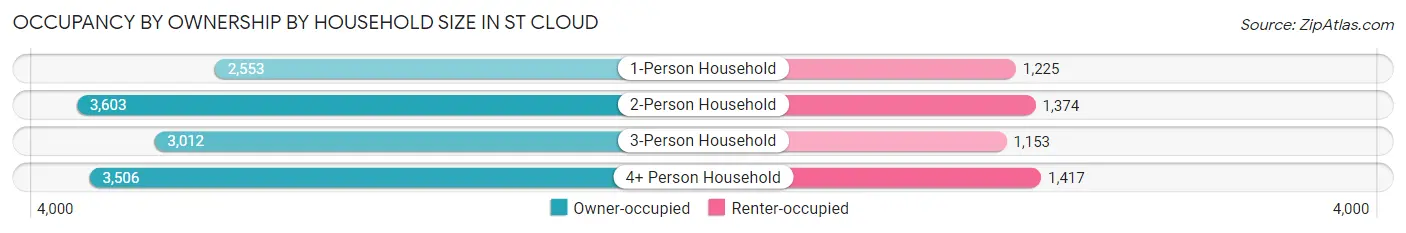
| Household Size | Owner-occupied | Renter-occupied |
| 1-Person Household | 2,553 (67.6%) | 1,225 (32.4%) |
| 2-Person Household | 3,603 (72.4%) | 1,374 (27.6%) |
| 3-Person Household | 3,012 (72.3%) | 1,153 (27.7%) |
| 4+ Person Household | 3,506 (71.2%) | 1,417 (28.8%) |
| Total Housing Units | 12,674 (71.0%) | 5,169 (29.0%) |
Occupancy by Educational Attainment in St Cloud
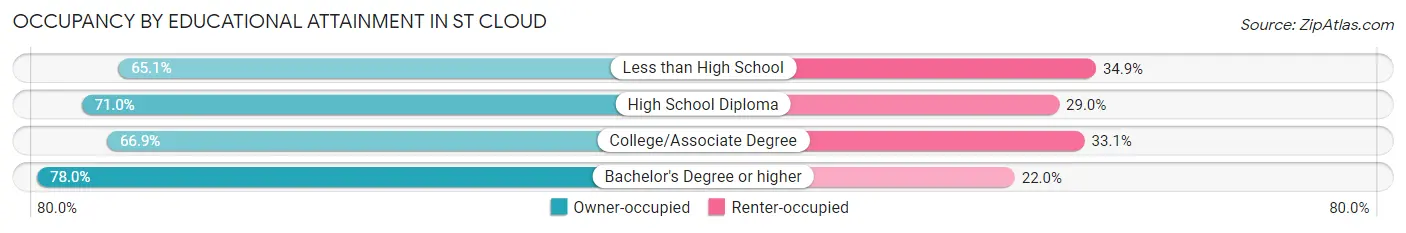
| Household Size | Owner-occupied | Renter-occupied |
| Less than High School | 841 (65.1%) | 450 (34.9%) |
| High School Diploma | 3,752 (71.0%) | 1,534 (29.0%) |
| College/Associate Degree | 4,272 (66.9%) | 2,111 (33.1%) |
| Bachelor's Degree or higher | 3,809 (78.0%) | 1,074 (22.0%) |
Occupancy by Age of Householder in St Cloud
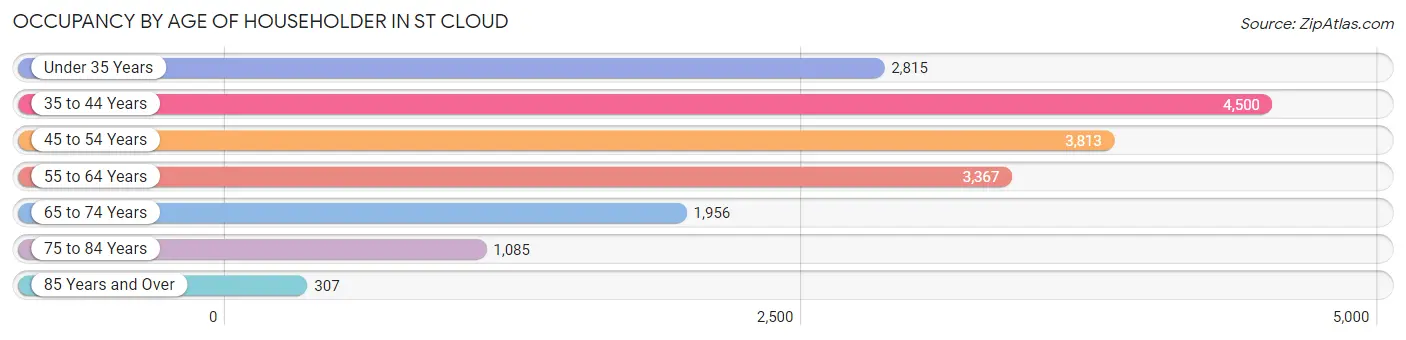
| Age Bracket | # Households | % Households |
| Under 35 Years | 2,815 | 15.8% |
| 35 to 44 Years | 4,500 | 25.2% |
| 45 to 54 Years | 3,813 | 21.4% |
| 55 to 64 Years | 3,367 | 18.9% |
| 65 to 74 Years | 1,956 | 11.0% |
| 75 to 84 Years | 1,085 | 6.1% |
| 85 Years and Over | 307 | 1.7% |
| Total | 17,843 | 100.0% |
Housing Finances in St Cloud
Median Income by Occupancy in St Cloud
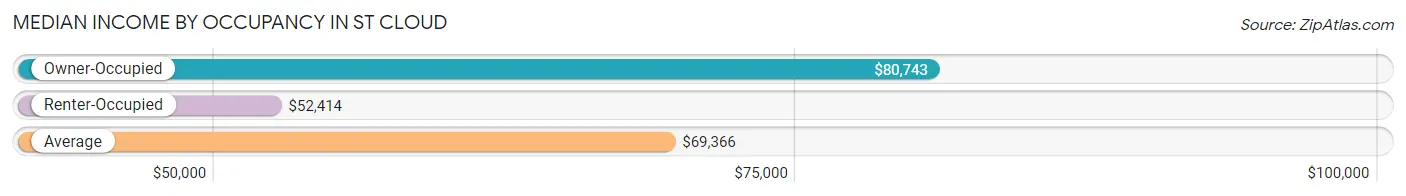
| Occupancy Type | # Households | Median Income |
| Owner-Occupied | 12,674 (71.0%) | $80,743 |
| Renter-Occupied | 5,169 (29.0%) | $52,414 |
| Average | 17,843 (100.0%) | $69,366 |
Occupancy by Householder Income Bracket in St Cloud
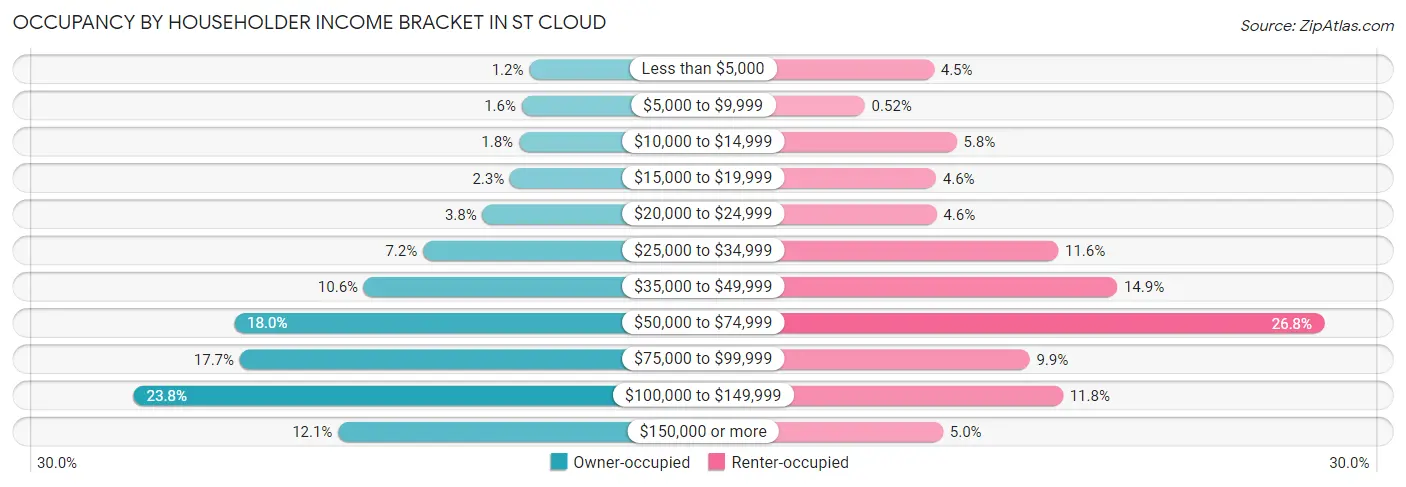
| Income Bracket | Owner-occupied | Renter-occupied |
| Less than $5,000 | 147 (1.2%) | 231 (4.5%) |
| $5,000 to $9,999 | 202 (1.6%) | 27 (0.5%) |
| $10,000 to $14,999 | 222 (1.8%) | 298 (5.8%) |
| $15,000 to $19,999 | 286 (2.3%) | 237 (4.6%) |
| $20,000 to $24,999 | 485 (3.8%) | 239 (4.6%) |
| $25,000 to $34,999 | 916 (7.2%) | 598 (11.6%) |
| $35,000 to $49,999 | 1,345 (10.6%) | 772 (14.9%) |
| $50,000 to $74,999 | 2,285 (18.0%) | 1,383 (26.8%) |
| $75,000 to $99,999 | 2,243 (17.7%) | 514 (9.9%) |
| $100,000 to $149,999 | 3,012 (23.8%) | 612 (11.8%) |
| $150,000 or more | 1,531 (12.1%) | 258 (5.0%) |
| Total | 12,674 (100.0%) | 5,169 (100.0%) |
Monthly Housing Cost Tiers in St Cloud
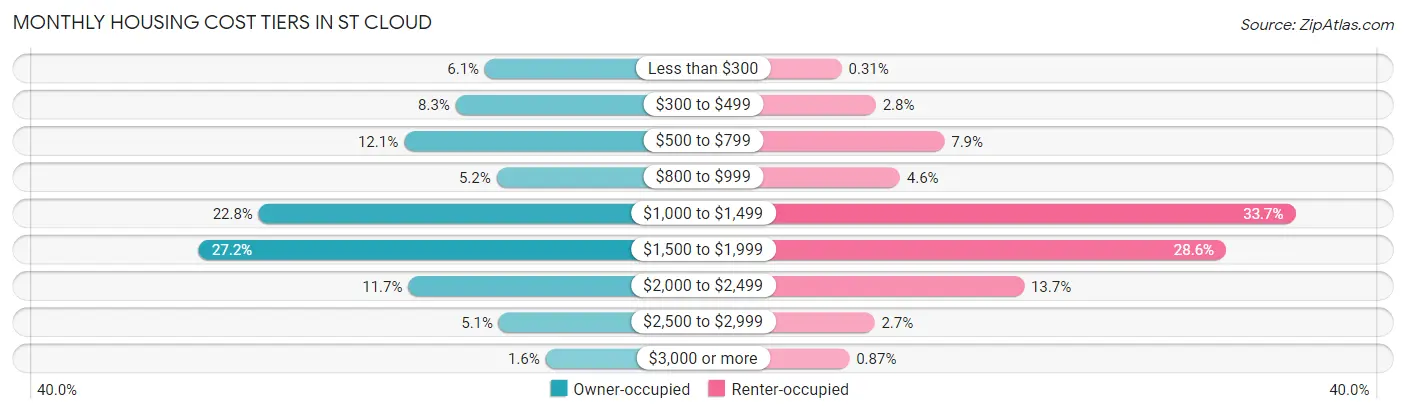
| Monthly Cost | Owner-occupied | Renter-occupied |
| Less than $300 | 773 (6.1%) | 16 (0.3%) |
| $300 to $499 | 1,045 (8.3%) | 146 (2.8%) |
| $500 to $799 | 1,528 (12.1%) | 407 (7.9%) |
| $800 to $999 | 664 (5.2%) | 238 (4.6%) |
| $1,000 to $1,499 | 2,884 (22.8%) | 1,743 (33.7%) |
| $1,500 to $1,999 | 3,442 (27.2%) | 1,479 (28.6%) |
| $2,000 to $2,499 | 1,488 (11.7%) | 710 (13.7%) |
| $2,500 to $2,999 | 643 (5.1%) | 141 (2.7%) |
| $3,000 or more | 207 (1.6%) | 45 (0.9%) |
| Total | 12,674 (100.0%) | 5,169 (100.0%) |
Physical Housing Characteristics in St Cloud
Housing Structures in St Cloud
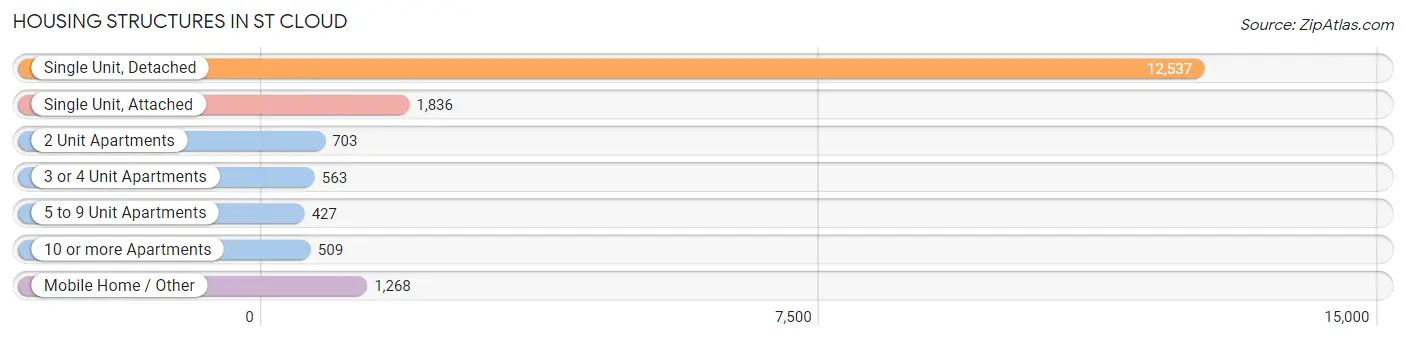
| Structure Type | # Housing Units | % Housing Units |
| Single Unit, Detached | 12,537 | 70.3% |
| Single Unit, Attached | 1,836 | 10.3% |
| 2 Unit Apartments | 703 | 3.9% |
| 3 or 4 Unit Apartments | 563 | 3.2% |
| 5 to 9 Unit Apartments | 427 | 2.4% |
| 10 or more Apartments | 509 | 2.9% |
| Mobile Home / Other | 1,268 | 7.1% |
| Total | 17,843 | 100.0% |
Housing Structures by Occupancy in St Cloud
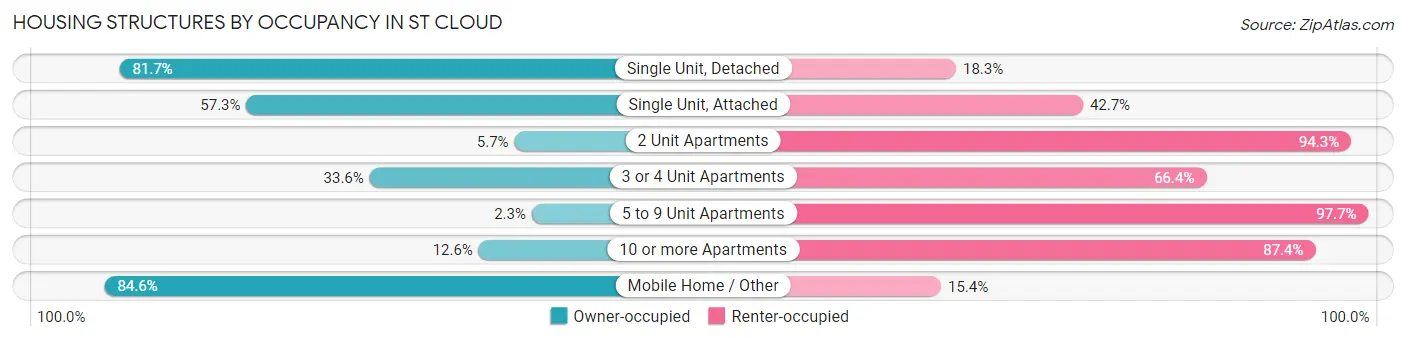
| Structure Type | Owner-occupied | Renter-occupied |
| Single Unit, Detached | 10,246 (81.7%) | 2,291 (18.3%) |
| Single Unit, Attached | 1,052 (57.3%) | 784 (42.7%) |
| 2 Unit Apartments | 40 (5.7%) | 663 (94.3%) |
| 3 or 4 Unit Apartments | 189 (33.6%) | 374 (66.4%) |
| 5 to 9 Unit Apartments | 10 (2.3%) | 417 (97.7%) |
| 10 or more Apartments | 64 (12.6%) | 445 (87.4%) |
| Mobile Home / Other | 1,073 (84.6%) | 195 (15.4%) |
| Total | 12,674 (71.0%) | 5,169 (29.0%) |
Housing Structures by Number of Rooms in St Cloud
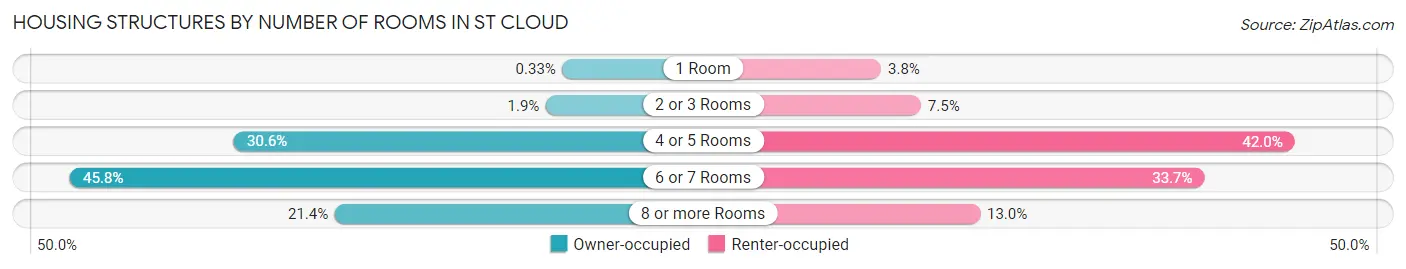
| Number of Rooms | Owner-occupied | Renter-occupied |
| 1 Room | 42 (0.3%) | 197 (3.8%) |
| 2 or 3 Rooms | 235 (1.8%) | 387 (7.5%) |
| 4 or 5 Rooms | 3,883 (30.6%) | 2,173 (42.0%) |
| 6 or 7 Rooms | 5,804 (45.8%) | 1,742 (33.7%) |
| 8 or more Rooms | 2,710 (21.4%) | 670 (13.0%) |
| Total | 12,674 (100.0%) | 5,169 (100.0%) |
Housing Structure by Heating Type in St Cloud
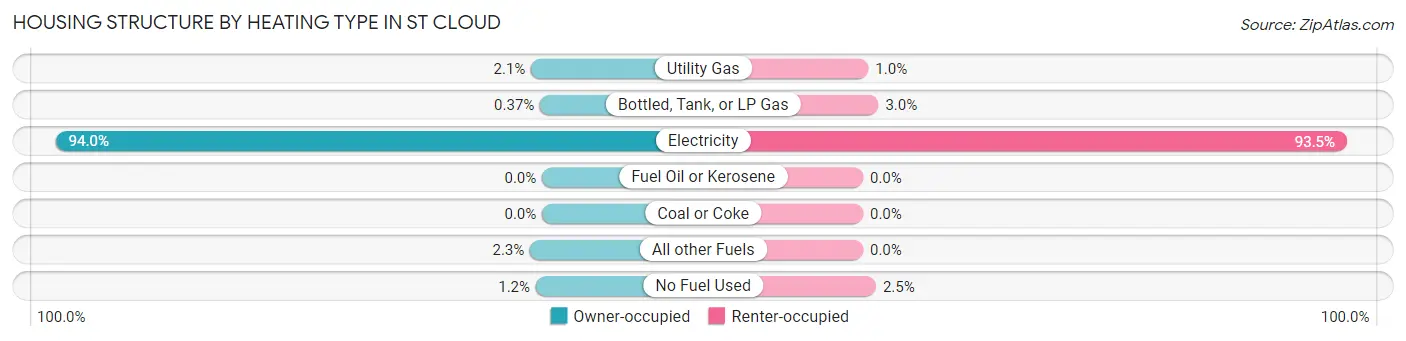
| Heating Type | Owner-occupied | Renter-occupied |
| Utility Gas | 268 (2.1%) | 54 (1.0%) |
| Bottled, Tank, or LP Gas | 47 (0.4%) | 154 (3.0%) |
| Electricity | 11,913 (94.0%) | 4,832 (93.5%) |
| Fuel Oil or Kerosene | 0 (0.0%) | 0 (0.0%) |
| Coal or Coke | 0 (0.0%) | 0 (0.0%) |
| All other Fuels | 293 (2.3%) | 0 (0.0%) |
| No Fuel Used | 153 (1.2%) | 129 (2.5%) |
| Total | 12,674 (100.0%) | 5,169 (100.0%) |
Household Vehicle Usage in St Cloud
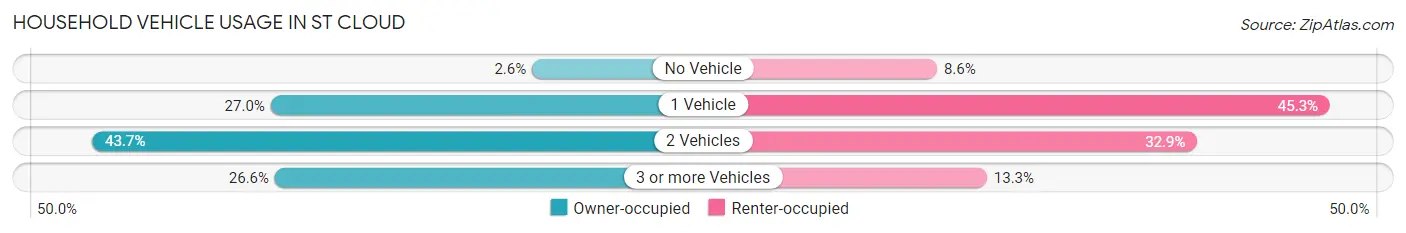
| Vehicles per Household | Owner-occupied | Renter-occupied |
| No Vehicle | 333 (2.6%) | 444 (8.6%) |
| 1 Vehicle | 3,426 (27.0%) | 2,340 (45.3%) |
| 2 Vehicles | 5,539 (43.7%) | 1,700 (32.9%) |
| 3 or more Vehicles | 3,376 (26.6%) | 685 (13.3%) |
| Total | 12,674 (100.0%) | 5,169 (100.0%) |
Real Estate & Mortgages in St Cloud
Real Estate and Mortgage Overview in St Cloud
| Characteristic | Without Mortgage | With Mortgage |
| Housing Units | 3,606 | 9,068 |
| Median Property Value | $229,700 | $307,700 |
| Median Household Income | $59,652 | $1,106 |
| Monthly Housing Costs | $545 | $186 |
| Real Estate Taxes | $1,722 | $438 |
Property Value by Mortgage Status in St Cloud
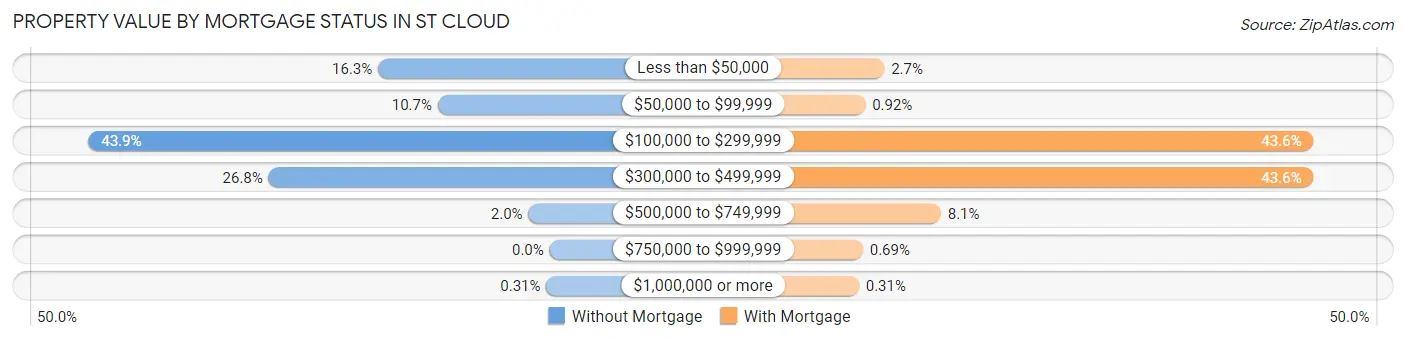
| Property Value | Without Mortgage | With Mortgage |
| Less than $50,000 | 589 (16.3%) | 248 (2.7%) |
| $50,000 to $99,999 | 384 (10.6%) | 83 (0.9%) |
| $100,000 to $299,999 | 1,584 (43.9%) | 3,955 (43.6%) |
| $300,000 to $499,999 | 965 (26.8%) | 3,955 (43.6%) |
| $500,000 to $749,999 | 73 (2.0%) | 736 (8.1%) |
| $750,000 to $999,999 | 0 (0.0%) | 63 (0.7%) |
| $1,000,000 or more | 11 (0.3%) | 28 (0.3%) |
| Total | 3,606 (100.0%) | 9,068 (100.0%) |
Household Income by Mortgage Status in St Cloud
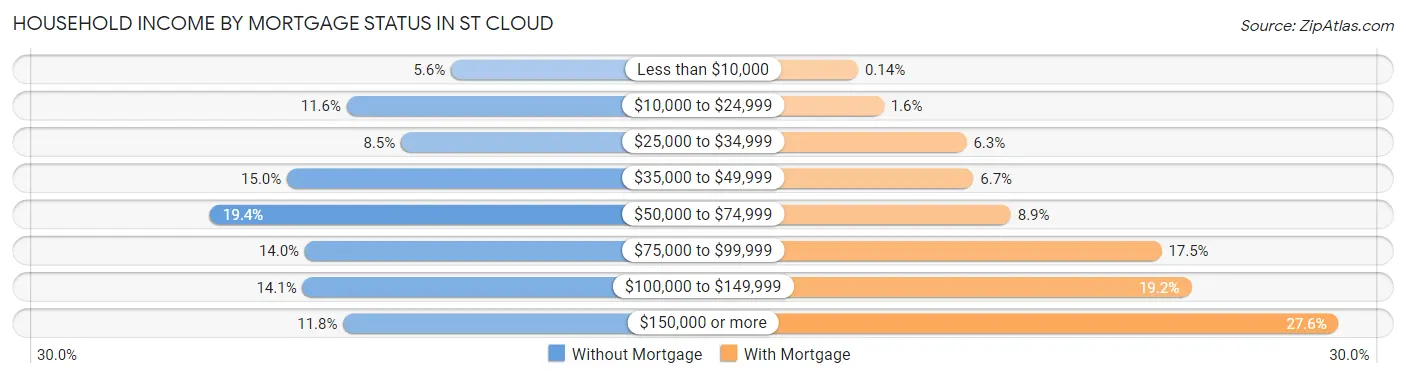
| Household Income | Without Mortgage | With Mortgage |
| Less than $10,000 | 203 (5.6%) | 13 (0.1%) |
| $10,000 to $24,999 | 418 (11.6%) | 146 (1.6%) |
| $25,000 to $34,999 | 306 (8.5%) | 575 (6.3%) |
| $35,000 to $49,999 | 541 (15.0%) | 610 (6.7%) |
| $50,000 to $74,999 | 700 (19.4%) | 804 (8.9%) |
| $75,000 to $99,999 | 504 (14.0%) | 1,585 (17.5%) |
| $100,000 to $149,999 | 509 (14.1%) | 1,739 (19.2%) |
| $150,000 or more | 425 (11.8%) | 2,503 (27.6%) |
| Total | 3,606 (100.0%) | 9,068 (100.0%) |
Property Value to Household Income Ratio in St Cloud
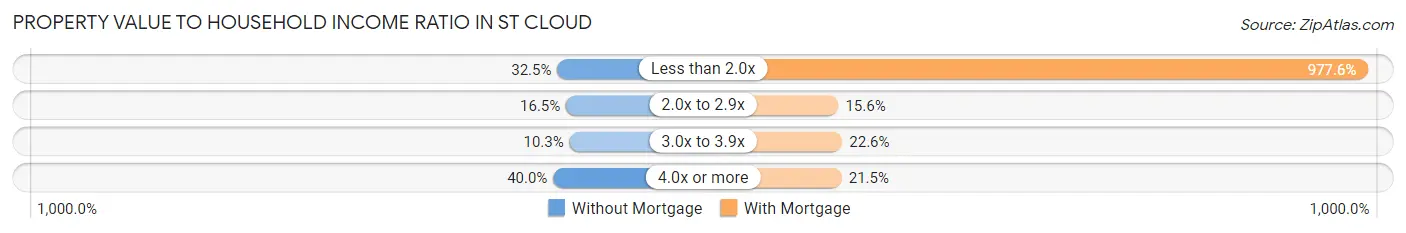
| Value-to-Income Ratio | Without Mortgage | With Mortgage |
| Less than 2.0x | 1,173 (32.5%) | 88,650 (977.6%) |
| 2.0x to 2.9x | 595 (16.5%) | 1,411 (15.6%) |
| 3.0x to 3.9x | 373 (10.3%) | 2,049 (22.6%) |
| 4.0x or more | 1,442 (40.0%) | 1,951 (21.5%) |
| Total | 3,606 (100.0%) | 9,068 (100.0%) |
Real Estate Taxes by Mortgage Status in St Cloud
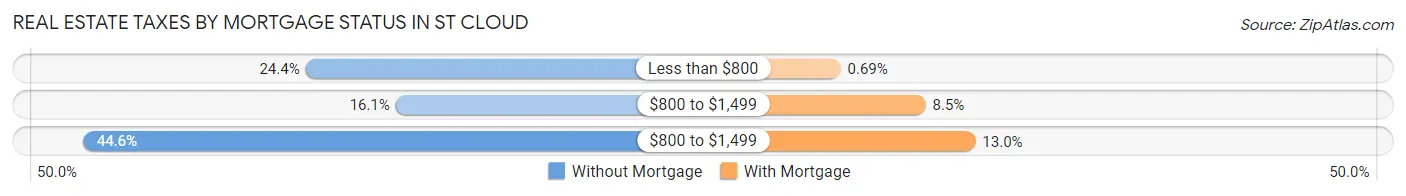
| Property Taxes | Without Mortgage | With Mortgage |
| Less than $800 | 878 (24.3%) | 63 (0.7%) |
| $800 to $1,499 | 581 (16.1%) | 766 (8.5%) |
| $800 to $1,499 | 1,608 (44.6%) | 1,179 (13.0%) |
| Total | 3,606 (100.0%) | 9,068 (100.0%) |
Health & Disability in St Cloud
Health Insurance Coverage by Age in St Cloud
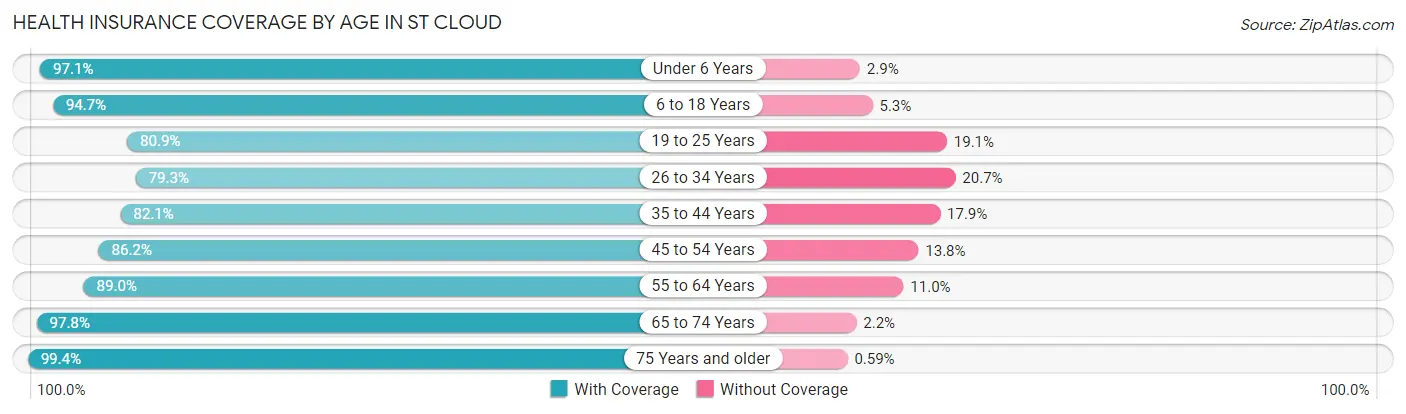
| Age Bracket | With Coverage | Without Coverage |
| Under 6 Years | 5,073 (97.1%) | 152 (2.9%) |
| 6 to 18 Years | 11,101 (94.7%) | 618 (5.3%) |
| 19 to 25 Years | 3,914 (80.9%) | 926 (19.1%) |
| 26 to 34 Years | 5,488 (79.3%) | 1,434 (20.7%) |
| 35 to 44 Years | 7,507 (82.1%) | 1,633 (17.9%) |
| 45 to 54 Years | 6,710 (86.2%) | 1,075 (13.8%) |
| 55 to 64 Years | 5,952 (89.0%) | 737 (11.0%) |
| 65 to 74 Years | 3,798 (97.8%) | 87 (2.2%) |
| 75 Years and older | 3,030 (99.4%) | 18 (0.6%) |
| Total | 52,573 (88.7%) | 6,680 (11.3%) |
Health Insurance Coverage by Citizenship Status in St Cloud
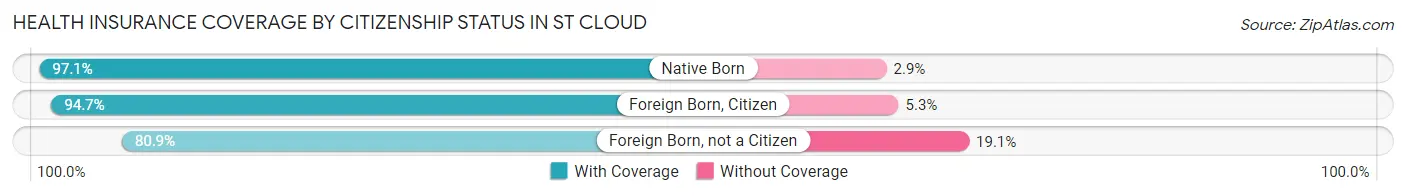
| Citizenship Status | With Coverage | Without Coverage |
| Native Born | 5,073 (97.1%) | 152 (2.9%) |
| Foreign Born, Citizen | 11,101 (94.7%) | 618 (5.3%) |
| Foreign Born, not a Citizen | 3,914 (80.9%) | 926 (19.1%) |
Health Insurance Coverage by Household Income in St Cloud
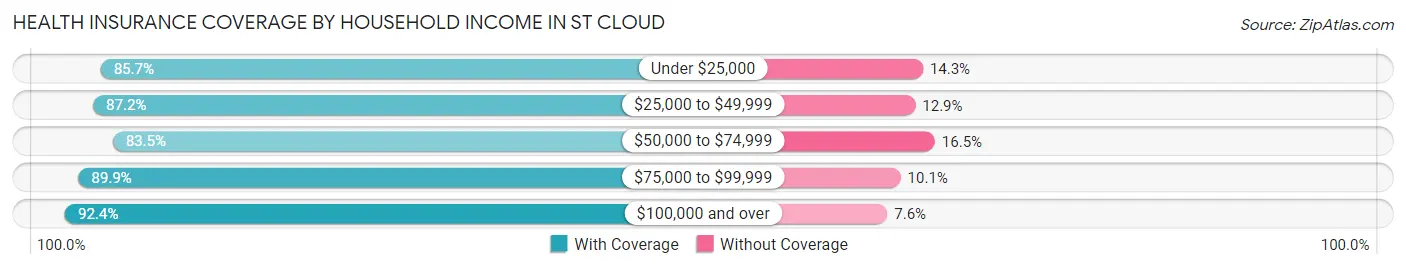
| Household Income | With Coverage | Without Coverage |
| Under $25,000 | 4,438 (85.7%) | 739 (14.3%) |
| $25,000 to $49,999 | 8,589 (87.2%) | 1,266 (12.9%) |
| $50,000 to $74,999 | 9,543 (83.5%) | 1,887 (16.5%) |
| $75,000 to $99,999 | 9,720 (89.9%) | 1,091 (10.1%) |
| $100,000 and over | 20,222 (92.4%) | 1,662 (7.6%) |
Public vs Private Health Insurance Coverage by Age in St Cloud
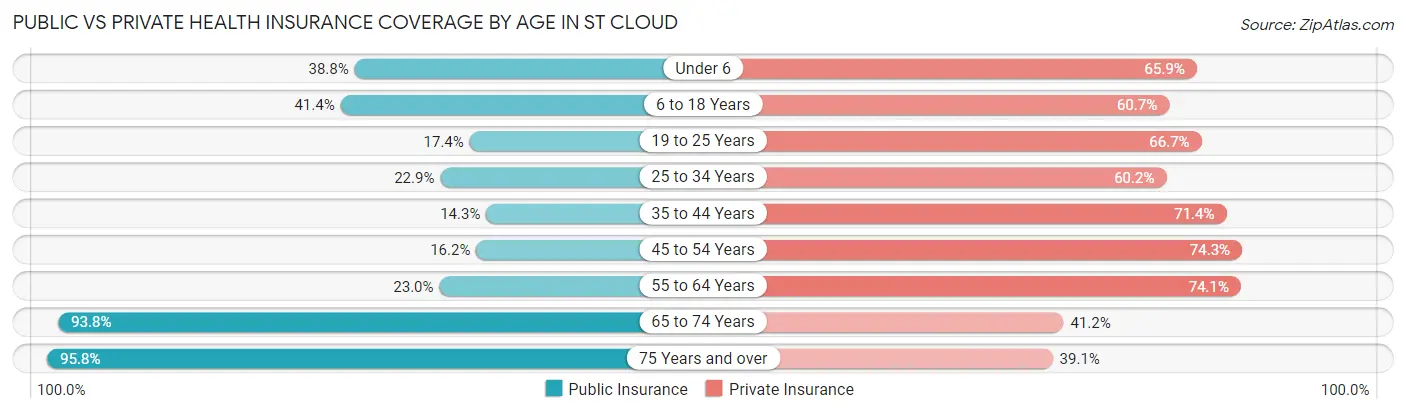
| Age Bracket | Public Insurance | Private Insurance |
| Under 6 | 2,025 (38.8%) | 3,441 (65.9%) |
| 6 to 18 Years | 4,848 (41.4%) | 7,117 (60.7%) |
| 19 to 25 Years | 842 (17.4%) | 3,230 (66.7%) |
| 25 to 34 Years | 1,582 (22.9%) | 4,168 (60.2%) |
| 35 to 44 Years | 1,308 (14.3%) | 6,522 (71.4%) |
| 45 to 54 Years | 1,259 (16.2%) | 5,781 (74.3%) |
| 55 to 64 Years | 1,540 (23.0%) | 4,954 (74.1%) |
| 65 to 74 Years | 3,643 (93.8%) | 1,599 (41.2%) |
| 75 Years and over | 2,921 (95.8%) | 1,193 (39.1%) |
| Total | 19,968 (33.7%) | 38,005 (64.1%) |
Disability Status by Sex by Age in St Cloud
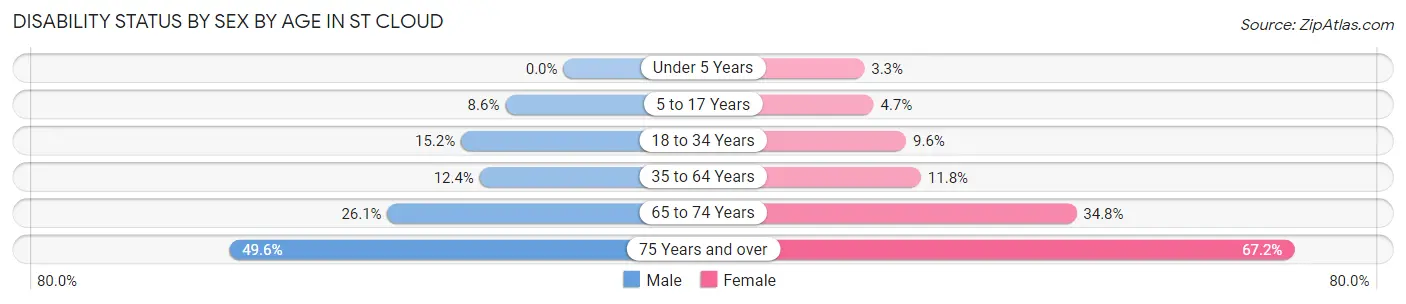
| Age Bracket | Male | Female |
| Under 5 Years | 0 (0.0%) | 91 (3.3%) |
| 5 to 17 Years | 512 (8.6%) | 273 (4.7%) |
| 18 to 34 Years | 979 (15.2%) | 581 (9.6%) |
| 35 to 64 Years | 1,486 (12.4%) | 1,369 (11.7%) |
| 65 to 74 Years | 438 (26.1%) | 769 (34.8%) |
| 75 Years and over | 696 (49.6%) | 1,105 (67.2%) |
Disability Class by Sex by Age in St Cloud
Disability Class: Hearing Difficulty
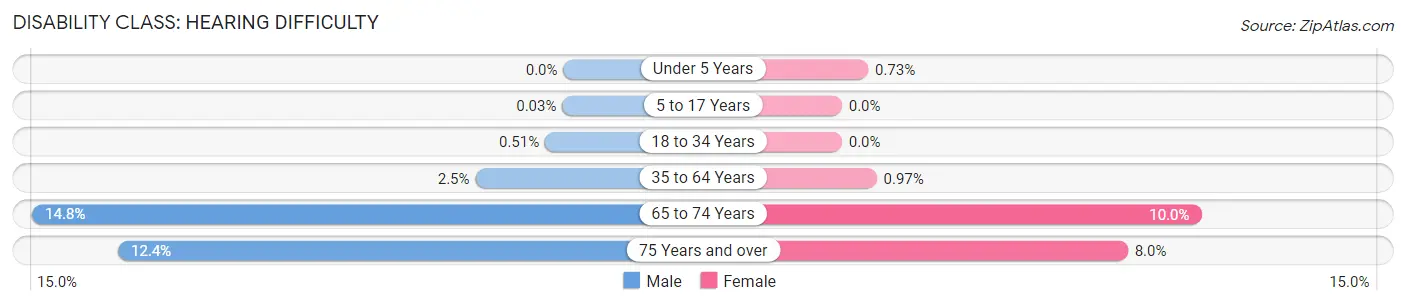
| Age Bracket | Male | Female |
| Under 5 Years | 0 (0.0%) | 20 (0.7%) |
| 5 to 17 Years | 2 (0.0%) | 0 (0.0%) |
| 18 to 34 Years | 33 (0.5%) | 0 (0.0%) |
| 35 to 64 Years | 293 (2.5%) | 113 (1.0%) |
| 65 to 74 Years | 248 (14.8%) | 221 (10.0%) |
| 75 Years and over | 174 (12.4%) | 131 (8.0%) |
Disability Class: Vision Difficulty
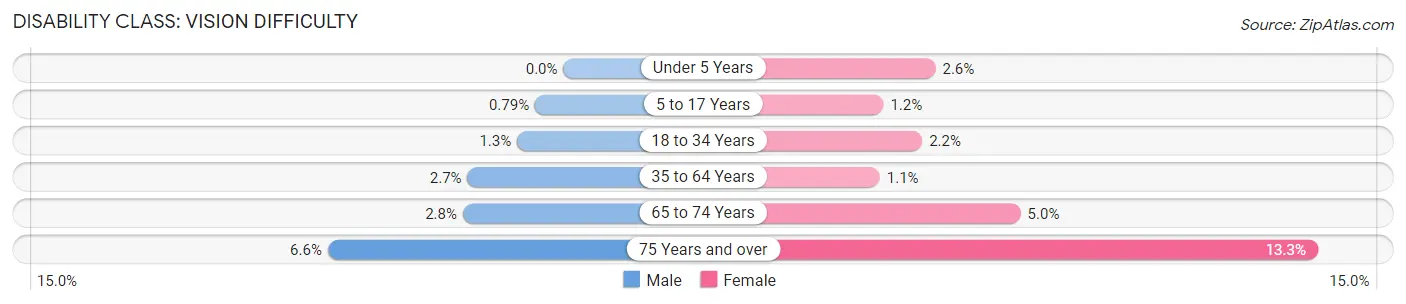
| Age Bracket | Male | Female |
| Under 5 Years | 0 (0.0%) | 71 (2.6%) |
| 5 to 17 Years | 47 (0.8%) | 67 (1.2%) |
| 18 to 34 Years | 83 (1.3%) | 136 (2.2%) |
| 35 to 64 Years | 319 (2.7%) | 123 (1.1%) |
| 65 to 74 Years | 47 (2.8%) | 110 (5.0%) |
| 75 Years and over | 92 (6.6%) | 218 (13.3%) |
Disability Class: Cognitive Difficulty
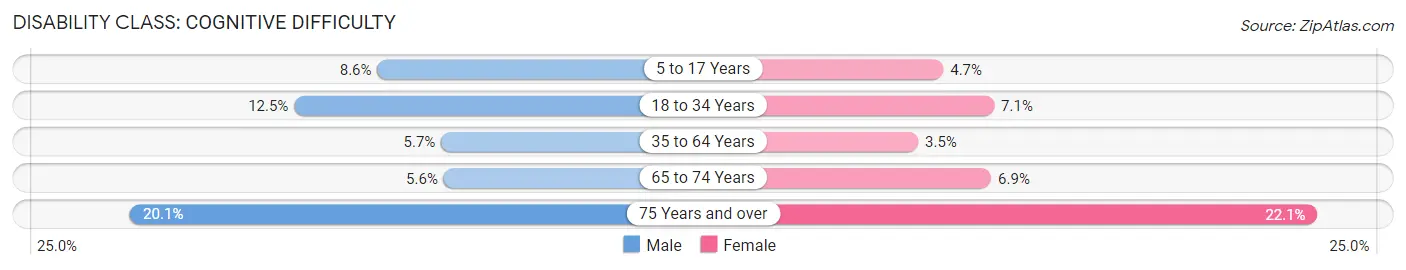
| Age Bracket | Male | Female |
| 5 to 17 Years | 512 (8.6%) | 273 (4.7%) |
| 18 to 34 Years | 805 (12.5%) | 430 (7.1%) |
| 35 to 64 Years | 678 (5.7%) | 412 (3.5%) |
| 65 to 74 Years | 93 (5.6%) | 153 (6.9%) |
| 75 Years and over | 282 (20.1%) | 363 (22.1%) |
Disability Class: Ambulatory Difficulty
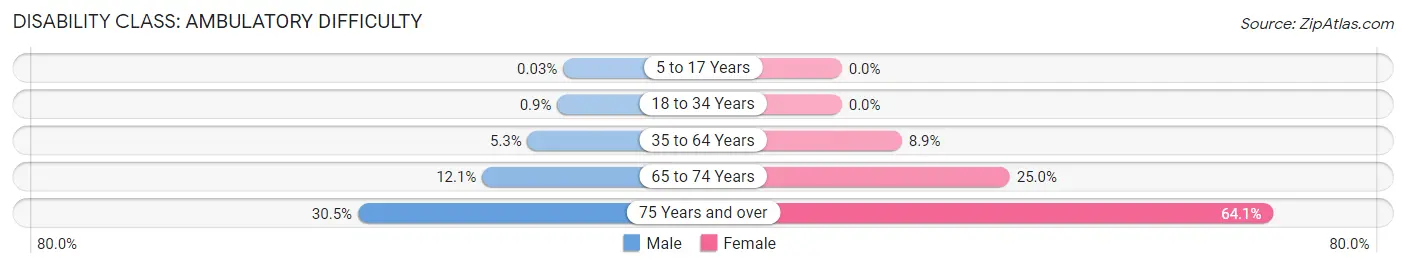
| Age Bracket | Male | Female |
| 5 to 17 Years | 2 (0.0%) | 0 (0.0%) |
| 18 to 34 Years | 58 (0.9%) | 0 (0.0%) |
| 35 to 64 Years | 635 (5.3%) | 1,038 (8.9%) |
| 65 to 74 Years | 202 (12.0%) | 551 (24.9%) |
| 75 Years and over | 428 (30.5%) | 1,054 (64.1%) |
Disability Class: Self-Care Difficulty
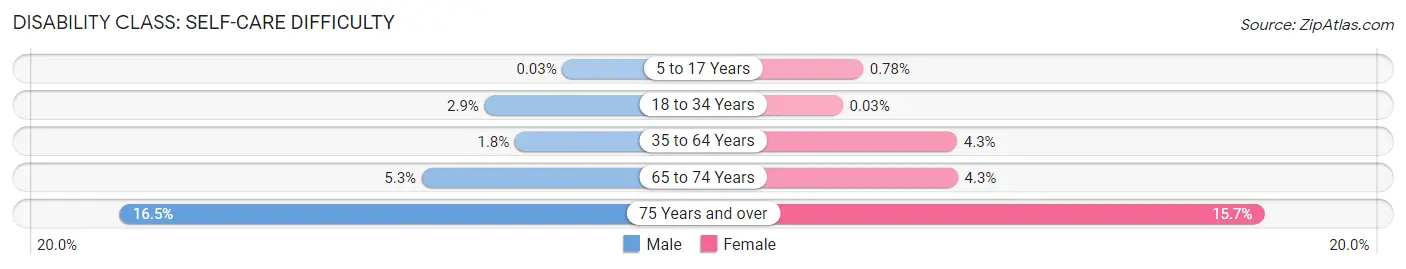
| Age Bracket | Male | Female |
| 5 to 17 Years | 2 (0.0%) | 45 (0.8%) |
| 18 to 34 Years | 188 (2.9%) | 2 (0.0%) |
| 35 to 64 Years | 214 (1.8%) | 498 (4.3%) |
| 65 to 74 Years | 88 (5.2%) | 95 (4.3%) |
| 75 Years and over | 231 (16.5%) | 258 (15.7%) |
Technology Access in St Cloud
Computing Device Access in St Cloud
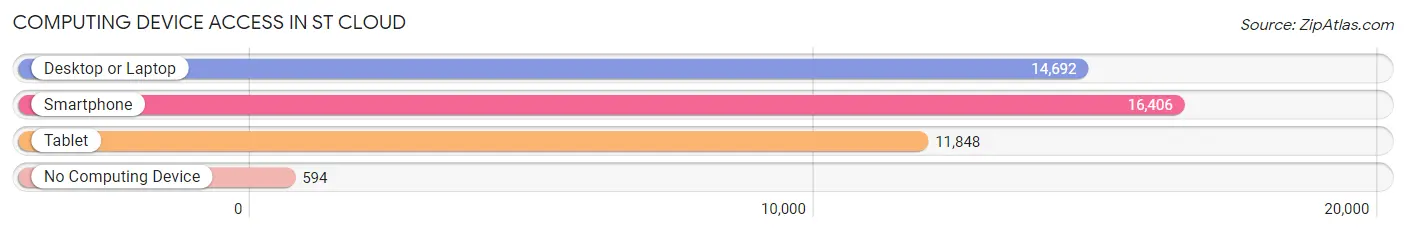
| Device Type | # Households | % Households |
| Desktop or Laptop | 14,692 | 82.3% |
| Smartphone | 16,406 | 91.9% |
| Tablet | 11,848 | 66.4% |
| No Computing Device | 594 | 3.3% |
| Total | 17,843 | 100.0% |
Internet Access in St Cloud
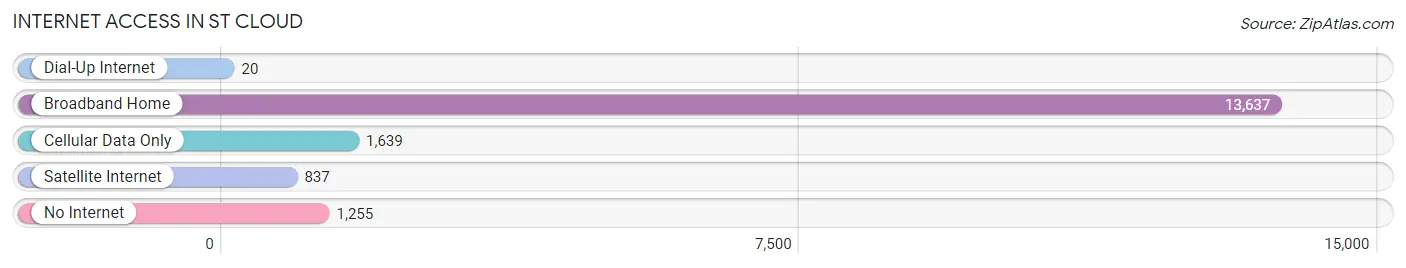
| Internet Type | # Households | % Households |
| Dial-Up Internet | 20 | 0.1% |
| Broadband Home | 13,637 | 76.4% |
| Cellular Data Only | 1,639 | 9.2% |
| Satellite Internet | 837 | 4.7% |
| No Internet | 1,255 | 7.0% |
| Total | 17,843 | 100.0% |
St Cloud Summary
St. Cloud is a city located in Osceola County, Florida, United States. It is located on the southern shore of East Lake Tohopekaliga in Central Florida, approximately 26 miles southeast of Orlando. The city population was 35,183 in the 2010 census, and 40,943 in the 2019 census estimate. St. Cloud is part of the Orlando–Kissimmee–Sanford Metropolitan Statistical Area.
History
The area in and around St. Cloud was originally inhabited by the Seminole Indians. The first non-native settlers arrived in the area in the 1850s and established small farms. The city was founded in 1909 by a group of businessmen led by John T. M. Johnston, who purchased 8,000 acres of land and named the city after St. Cloud, Minnesota. The city was incorporated in 1915.
In the early 1900s, St. Cloud was a small farming community. The city experienced rapid growth in the 1950s and 1960s, due to the influx of people from the northern United States and Canada. The city's population increased from 2,000 in 1950 to over 10,000 by 1970.
Geography
St. Cloud is located at 28°14'N 81°17'W (28.23, -81.28). According to the United States Census Bureau, the city has a total area of 24.2 square miles (62.7 km2), of which 23.9 square miles (61.8 km2) is land and 0.3 square miles (0.8 km2) (1.17%) is water.
Economy
St. Cloud's economy is largely based on tourism and agriculture. The city is home to several tourist attractions, including the St. Cloud Lakefront Park, the St. Cloud Heritage Museum, and the St. Cloud Flea Market. The city is also home to several agricultural businesses, including citrus groves, cattle ranches, and nurseries.
The city is also home to several manufacturing and distribution companies, including the St. Cloud Manufacturing Company, which produces plastic products, and the St. Cloud Distribution Center, which distributes food products.
Demographics
As of the 2010 census, there were 35,183 people, 11,945 households, and 8,845 families residing in the city. The population density was 1,467.2 people per square mile (567.2/km2). There were 12,845 housing units at an average density of 535.3 per square mile (206.9/km2). The racial makeup of the city was 77.2% White, 11.3% African American, 0.5% Native American, 1.7% Asian, 0.1% Pacific Islander, 6.3% from other races, and 3.0% from two or more races. Hispanic or Latino of any race were 19.2% of the population.
In the city, the population was spread out, with 25.2% under the age of 18, 8.3% from 18 to 24, 28.2% from 25 to 44, 22.7% from 45 to 64, and 15.6% who were 65 years of age or older. The median age was 37 years. For every 100 females, there were 94.2 males. For every 100 females age 18 and over, there were 91.2 males.
The median income for a household in the city was $37,845, and the median income for a family was $45,845. Males had a median income of $31,845 versus $25,845 for females. The per capita income for the city was $18,845. About 8.3% of families and 10.2% of the population were below the poverty line, including 14.2% of those under age 18 and 8.3% of those age 65 or over.
Common Questions
What is Per Capita Income in St Cloud?
Per Capita income in St Cloud is $26,677.
What is the Median Family Income in St Cloud?
Median Family Income in St Cloud is $80,285.
What is the Median Household income in St Cloud?
Median Household Income in St Cloud is $69,366.
What is Income or Wage Gap in St Cloud?
Income or Wage Gap in St Cloud is 12.8%.
Women in St Cloud earn 87.2 cents for every dollar earned by a man.
What is Family Income Deficit in St Cloud?
Family Income Deficit in St Cloud is $9,634.
Families that are below poverty line in St Cloud earn $9,634 less on average than the poverty threshold level.
What is Inequality or Gini Index in St Cloud?
Inequality or Gini Index in St Cloud is 0.39.
What is the Total Population of St Cloud?
Total Population of St Cloud is 59,851.
What is the Total Male Population of St Cloud?
Total Male Population of St Cloud is 29,409.
What is the Total Female Population of St Cloud?
Total Female Population of St Cloud is 30,442.
What is the Ratio of Males per 100 Females in St Cloud?
There are 96.61 Males per 100 Females in St Cloud.
What is the Ratio of Females per 100 Males in St Cloud?
There are 103.51 Females per 100 Males in St Cloud.
What is the Median Population Age in St Cloud?
Median Population Age in St Cloud is 36.6 Years.
What is the Average Family Size in St Cloud
Average Family Size in St Cloud is 3.9 People.
What is the Average Household Size in St Cloud
Average Household Size in St Cloud is 3.3 People.
How Large is the Labor Force in St Cloud?
There are 27,781 People in the Labor Forcein in St Cloud.
What is the Percentage of People in the Labor Force in St Cloud?
60.7% of People are in the Labor Force in St Cloud.
What is the Unemployment Rate in St Cloud?
Unemployment Rate in St Cloud is 6.4%.