Apex, NC Map & Demographics
Apex Map
Apex Overview
$55,896
PER CAPITA INCOME
$149,319
AVG FAMILY INCOME
$129,688
AVG HOUSEHOLD INCOME
37.3%
WAGE / INCOME GAP [ % ]
62.7¢/ $1
WAGE / INCOME GAP [ $ ]
0.39
INEQUALITY / GINI INDEX
65,541
TOTAL POPULATION
32,033
MALE POPULATION
33,508
FEMALE POPULATION
95.60
MALES / 100 FEMALES
104.60
FEMALES / 100 MALES
35.9
MEDIAN AGE
3.3
AVG FAMILY SIZE
2.9
AVG HOUSEHOLD SIZE
35,850
LABOR FORCE [ PEOPLE ]
73.7%
PERCENT IN LABOR FORCE
4.1%
UNEMPLOYMENT RATE
Apex Area Codes
Income in Apex
Income Overview in Apex
Per Capita Income in Apex is $55,896, while median incomes of families and households are $149,319 and $129,688 respectively.
| Characteristic | Number | Measure |
| Per Capita Income | 65,541 | $55,896 |
| Median Family Income | 17,523 | $149,319 |
| Mean Family Income | 17,523 | $173,368 |
| Median Household Income | 22,965 | $129,688 |
| Mean Household Income | 22,965 | $155,806 |
| Income Deficit | 17,523 | $0 |
| Wage / Income Gap (%) | 65,541 | 37.27% |
| Wage / Income Gap ($) | 65,541 | 62.73¢ per $1 |
| Gini / Inequality Index | 65,541 | 0.39 |
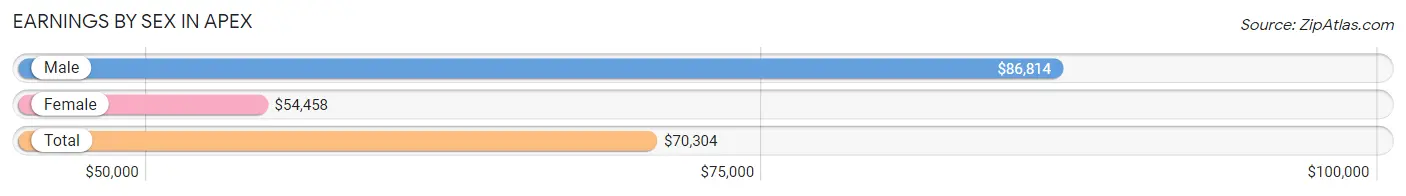
Earnings by Sex in Apex
Average Earnings in Apex are $70,304, $86,814 for men and $54,458 for women, a difference of 37.3%.
| Sex | Number | Average Earnings |
| Male | 19,605 (52.8%) | $86,814 |
| Female | 17,553 (47.2%) | $54,458 |
| Total | 37,158 (100.0%) | $70,304 |
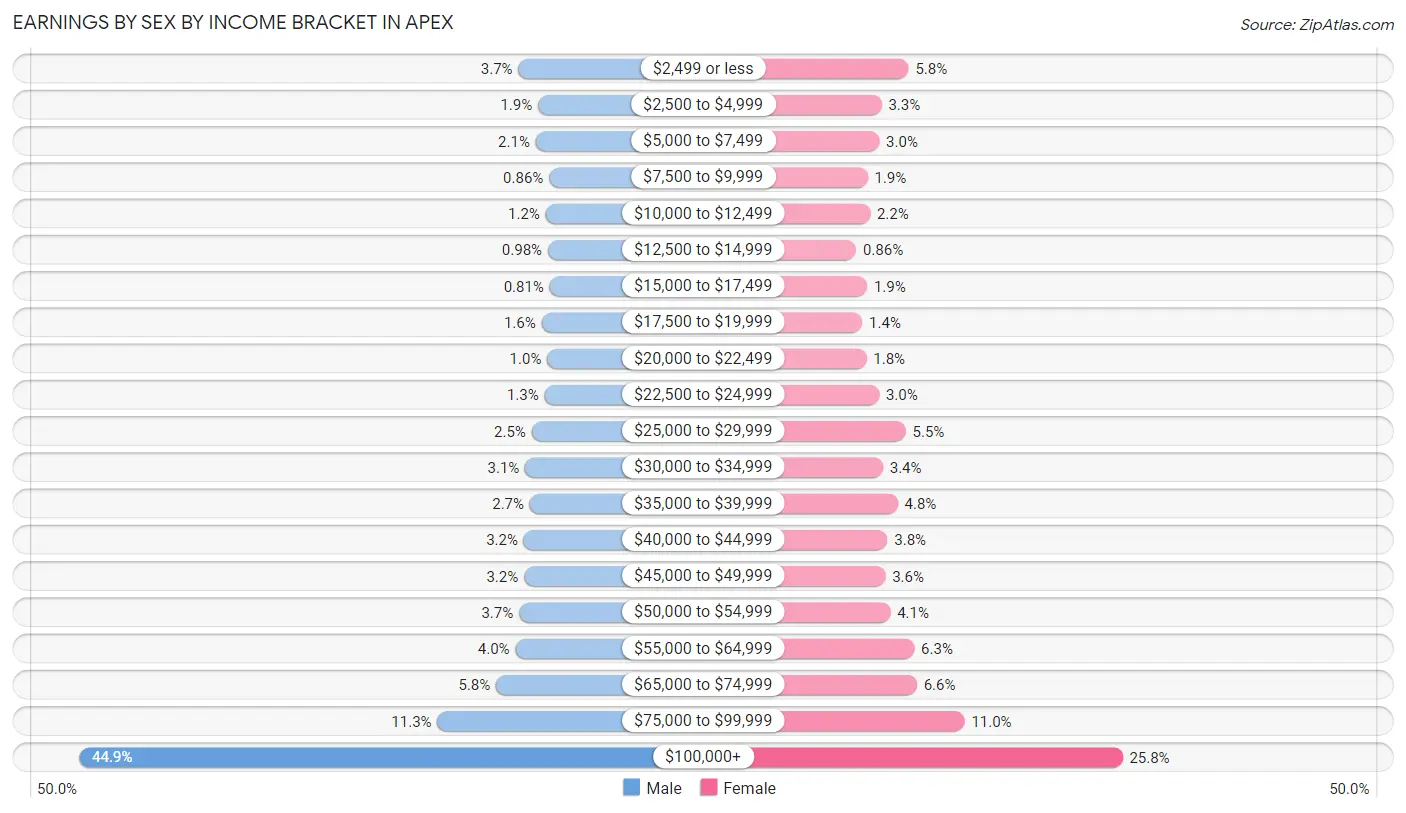
Earnings by Sex by Income Bracket in Apex
The most common earnings brackets in Apex are $100,000+ for men (8,802 | 44.9%) and $100,000+ for women (4,532 | 25.8%).
| Income | Male | Female |
| $2,499 or less | 734 (3.7%) | 1,015 (5.8%) |
| $2,500 to $4,999 | 373 (1.9%) | 570 (3.3%) |
| $5,000 to $7,499 | 416 (2.1%) | 531 (3.0%) |
| $7,500 to $9,999 | 168 (0.9%) | 340 (1.9%) |
| $10,000 to $12,499 | 233 (1.2%) | 381 (2.2%) |
| $12,500 to $14,999 | 193 (1.0%) | 151 (0.9%) |
| $15,000 to $17,499 | 158 (0.8%) | 331 (1.9%) |
| $17,500 to $19,999 | 307 (1.6%) | 252 (1.4%) |
| $20,000 to $22,499 | 203 (1.0%) | 321 (1.8%) |
| $22,500 to $24,999 | 253 (1.3%) | 528 (3.0%) |
| $25,000 to $29,999 | 491 (2.5%) | 968 (5.5%) |
| $30,000 to $34,999 | 610 (3.1%) | 591 (3.4%) |
| $35,000 to $39,999 | 523 (2.7%) | 836 (4.8%) |
| $40,000 to $44,999 | 636 (3.2%) | 667 (3.8%) |
| $45,000 to $49,999 | 630 (3.2%) | 632 (3.6%) |
| $50,000 to $54,999 | 722 (3.7%) | 715 (4.1%) |
| $55,000 to $64,999 | 789 (4.0%) | 1,108 (6.3%) |
| $65,000 to $74,999 | 1,142 (5.8%) | 1,149 (6.6%) |
| $75,000 to $99,999 | 2,222 (11.3%) | 1,935 (11.0%) |
| $100,000+ | 8,802 (44.9%) | 4,532 (25.8%) |
| Total | 19,605 (100.0%) | 17,553 (100.0%) |
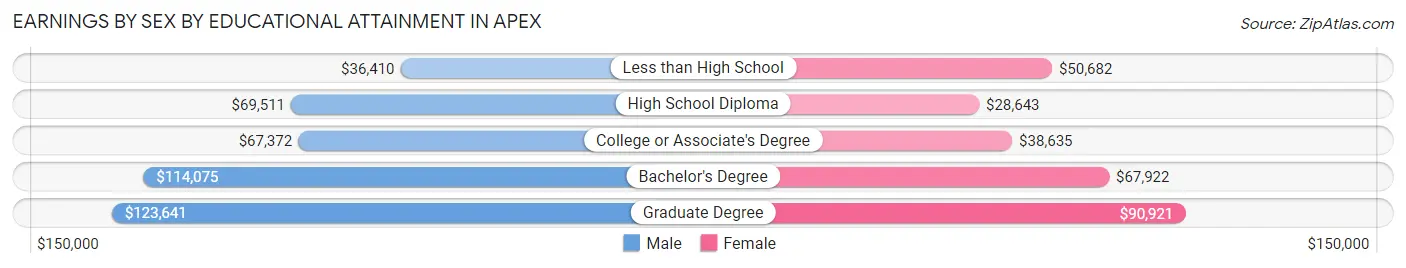
Earnings by Sex by Educational Attainment in Apex
Average earnings in Apex are $100,831 for men and $61,458 for women, a difference of 39.1%. Men with an educational attainment of graduate degree enjoy the highest average annual earnings of $123,641, while those with less than high school education earn the least with $36,410. Women with an educational attainment of graduate degree earn the most with the average annual earnings of $90,921, while those with high school diploma education have the smallest earnings of $28,643.
| Educational Attainment | Male Income | Female Income |
| Less than High School | $36,410 | $50,682 |
| High School Diploma | $69,511 | $28,643 |
| College or Associate's Degree | $67,372 | $38,635 |
| Bachelor's Degree | $114,075 | $67,922 |
| Graduate Degree | $123,641 | $90,921 |
| Total | $100,831 | $61,458 |
Family Income in Apex
Family Income Brackets in Apex
According to the Apex family income data, there are 5,134 families falling into the $200,000+ income range, which is the most common income bracket and makes up 29.3% of all families. Conversely, the less than $10,000 income bracket is the least frequent group with only 70 families (0.4%) belonging to this category.
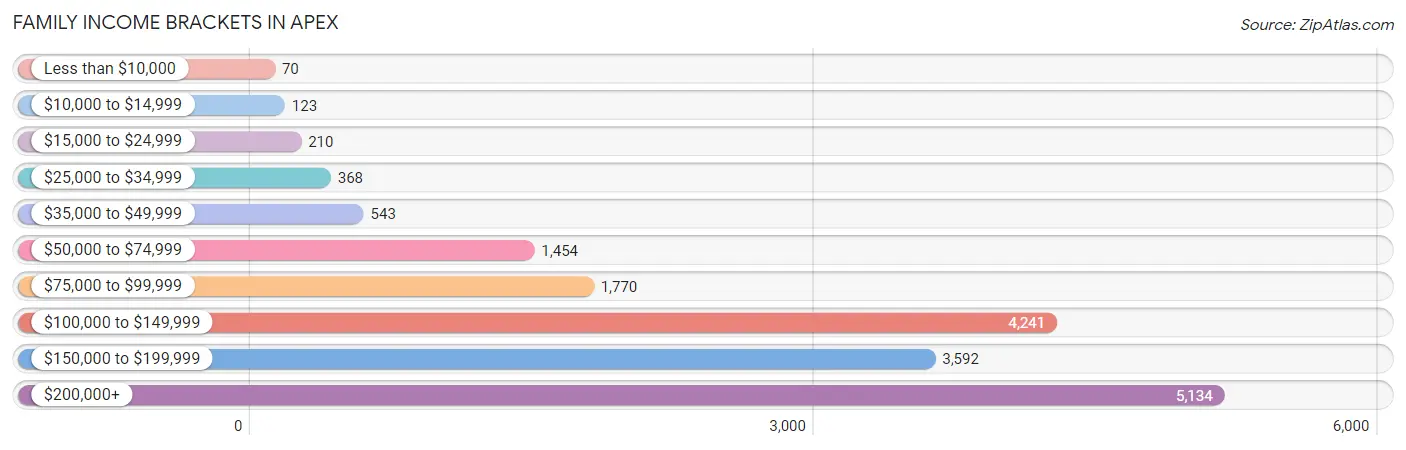
| Income Bracket | # Families | % Families |
| Less than $10,000 | 70 | 0.4% |
| $10,000 to $14,999 | 123 | 0.7% |
| $15,000 to $24,999 | 210 | 1.2% |
| $25,000 to $34,999 | 368 | 2.1% |
| $35,000 to $49,999 | 543 | 3.1% |
| $50,000 to $74,999 | 1,454 | 8.3% |
| $75,000 to $99,999 | 1,770 | 10.1% |
| $100,000 to $149,999 | 4,241 | 24.2% |
| $150,000 to $199,999 | 3,592 | 20.5% |
| $200,000+ | 5,134 | 29.3% |
Family Income by Famaliy Size in Apex
4-person families (4,749 | 27.1%) account for the highest median family income in Apex with $180,550 per family, while 2-person families (6,104 | 34.8%) have the highest median income of $59,759 per family member.
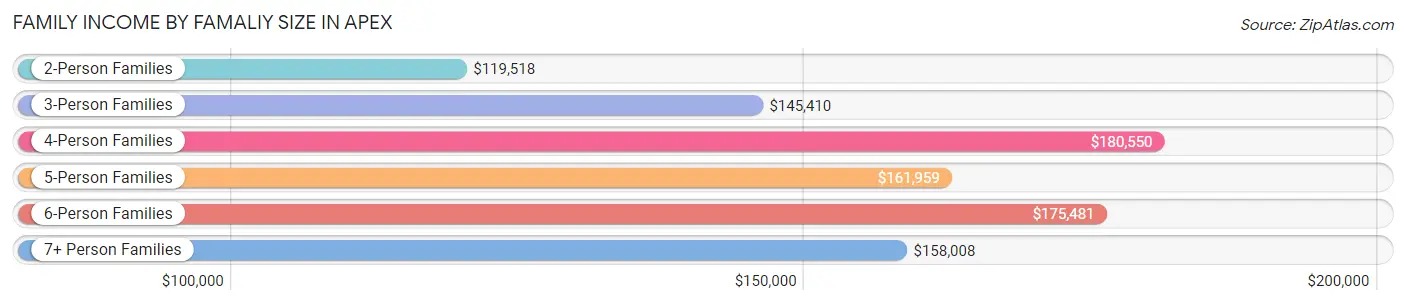
| Income Bracket | # Families | Median Income |
| 2-Person Families | 6,104 (34.8%) | $119,518 |
| 3-Person Families | 4,446 (25.4%) | $145,410 |
| 4-Person Families | 4,749 (27.1%) | $180,550 |
| 5-Person Families | 1,639 (9.3%) | $161,959 |
| 6-Person Families | 389 (2.2%) | $175,481 |
| 7+ Person Families | 196 (1.1%) | $158,008 |
| Total | 17,523 (100.0%) | $149,319 |
Family Income by Number of Earners in Apex
The median family income in Apex is $149,319, with families comprising 3+ earners (1,912) having the highest median family income of $195,714, while families with no earners (1,114) have the lowest median family income of $66,667, accounting for 10.9% and 6.4% of families, respectively.
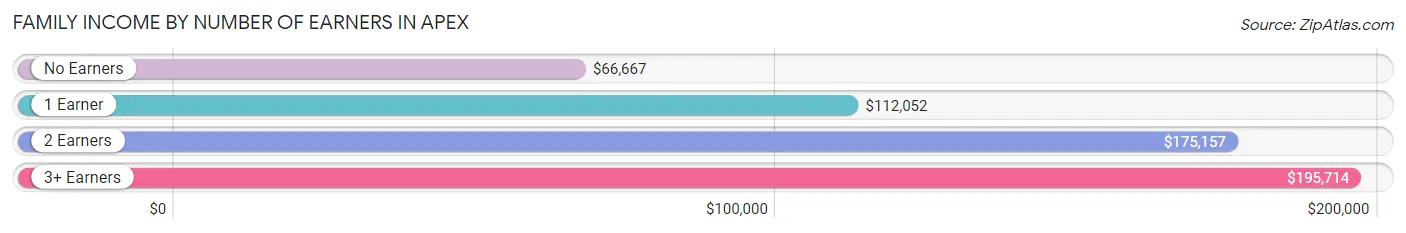
| Number of Earners | # Families | Median Income |
| No Earners | 1,114 (6.4%) | $66,667 |
| 1 Earner | 4,955 (28.3%) | $112,052 |
| 2 Earners | 9,542 (54.4%) | $175,157 |
| 3+ Earners | 1,912 (10.9%) | $195,714 |
| Total | 17,523 (100.0%) | $149,319 |
Household Income in Apex
Household Income Brackets in Apex
With 5,672 households falling in the category, the $200,000+ income range is the most frequent in Apex, accounting for 24.7% of all households. In contrast, only 230 households (1.0%) fall into the $10,000 to $14,999 income bracket, making it the least populous group.
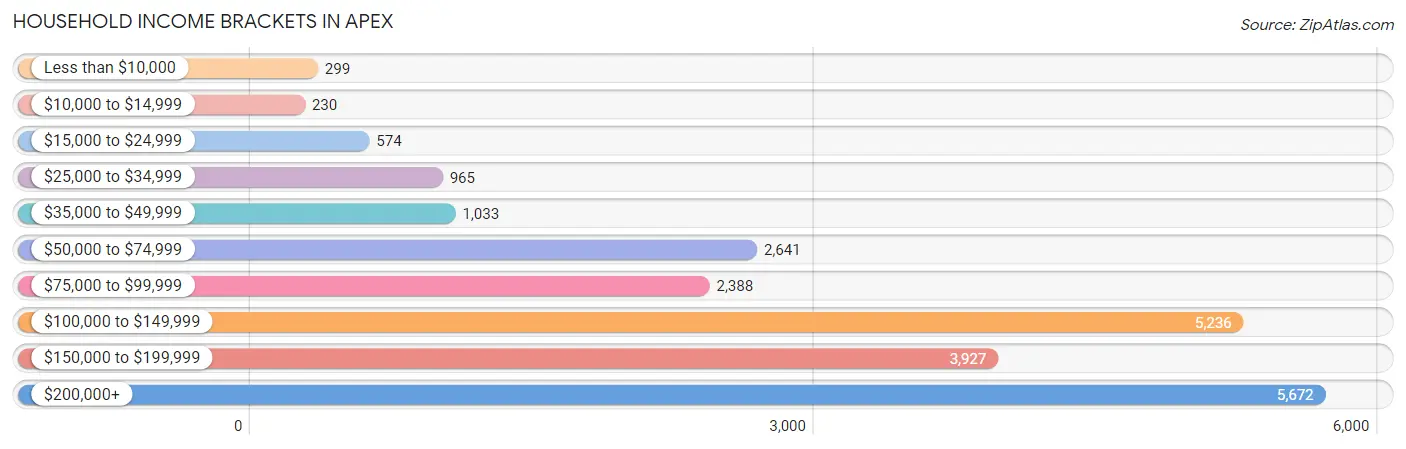
| Income Bracket | # Households | % Households |
| Less than $10,000 | 299 | 1.3% |
| $10,000 to $14,999 | 230 | 1.0% |
| $15,000 to $24,999 | 574 | 2.5% |
| $25,000 to $34,999 | 965 | 4.2% |
| $35,000 to $49,999 | 1,033 | 4.5% |
| $50,000 to $74,999 | 2,641 | 11.5% |
| $75,000 to $99,999 | 2,388 | 10.4% |
| $100,000 to $149,999 | 5,236 | 22.8% |
| $150,000 to $199,999 | 3,927 | 17.1% |
| $200,000+ | 5,672 | 24.7% |
Household Income by Householder Age in Apex
The median household income in Apex is $129,688, with the highest median household income of $152,857 found in the 45 to 64 years age bracket for the primary householder. A total of 9,440 households (41.1%) fall into this category. Meanwhile, the 65+ years age bracket for the primary householder has the lowest median household income of $69,030, with 3,305 households (14.4%) in this group.
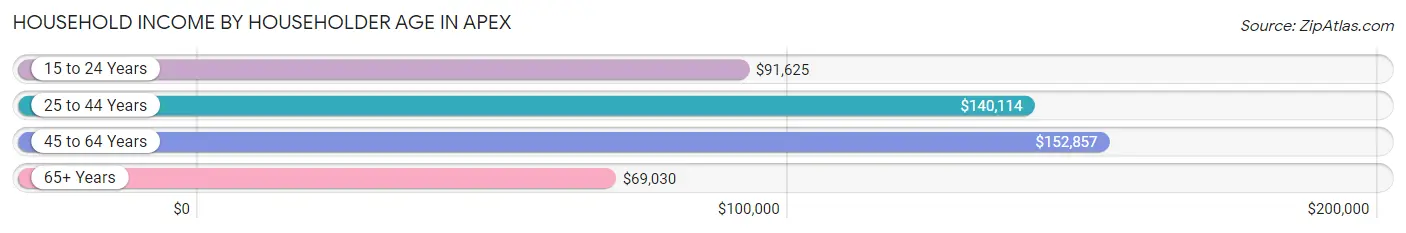
| Income Bracket | # Households | Median Income |
| 15 to 24 Years | 243 (1.1%) | $91,625 |
| 25 to 44 Years | 9,977 (43.4%) | $140,114 |
| 45 to 64 Years | 9,440 (41.1%) | $152,857 |
| 65+ Years | 3,305 (14.4%) | $69,030 |
| Total | 22,965 (100.0%) | $129,688 |
Poverty in Apex
Income Below Poverty by Sex and Age in Apex
With 2.8% poverty level for males and 2.9% for females among the residents of Apex, 5 year old males and 16 and 17 year old females are the most vulnerable to poverty, with 47 males (7.9%) and 115 females (9.6%) in their respective age groups living below the poverty level.
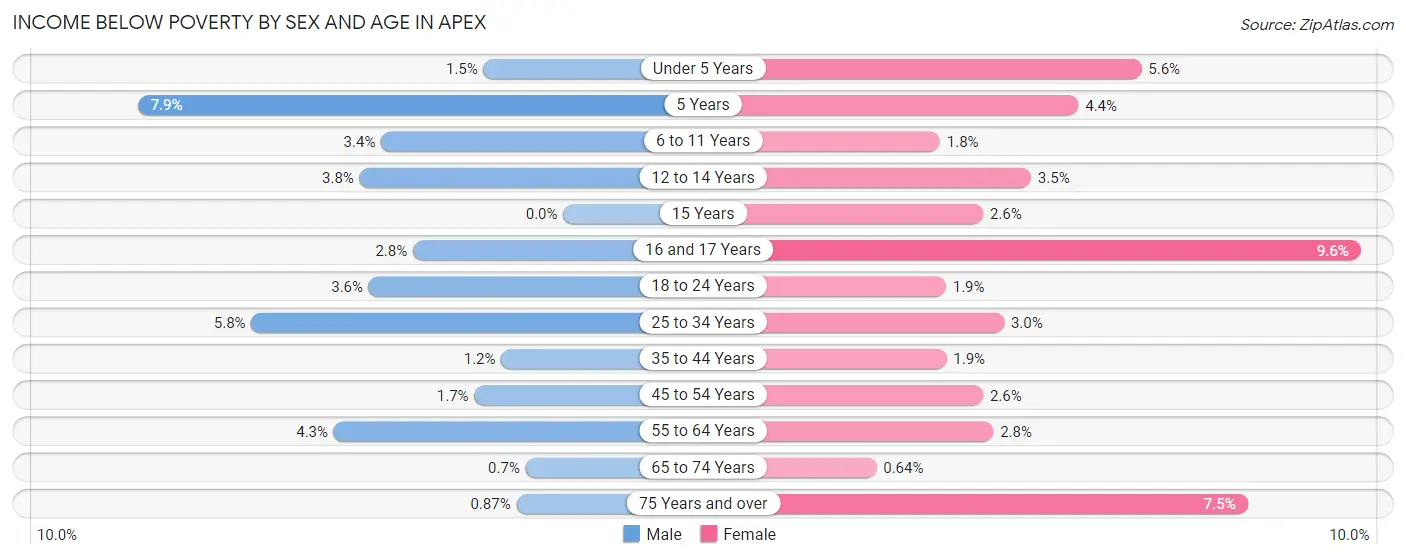
| Age Bracket | Male | Female |
| Under 5 Years | 34 (1.5%) | 98 (5.6%) |
| 5 Years | 47 (7.9%) | 33 (4.4%) |
| 6 to 11 Years | 113 (3.4%) | 63 (1.8%) |
| 12 to 14 Years | 58 (3.8%) | 56 (3.5%) |
| 15 Years | 0 (0.0%) | 20 (2.6%) |
| 16 and 17 Years | 28 (2.8%) | 115 (9.6%) |
| 18 to 24 Years | 75 (3.6%) | 36 (1.9%) |
| 25 to 34 Years | 224 (5.8%) | 145 (3.0%) |
| 35 to 44 Years | 63 (1.1%) | 117 (1.9%) |
| 45 to 54 Years | 84 (1.7%) | 131 (2.6%) |
| 55 to 64 Years | 147 (4.3%) | 85 (2.8%) |
| 65 to 74 Years | 11 (0.7%) | 14 (0.6%) |
| 75 Years and over | 8 (0.9%) | 70 (7.5%) |
| Total | 892 (2.8%) | 983 (2.9%) |
Income Above Poverty by Sex and Age in Apex
According to the poverty statistics in Apex, males aged 15 years and females aged 65 to 74 years are the age groups that are most secure financially, with 100.0% of males and 99.4% of females in these age groups living above the poverty line.
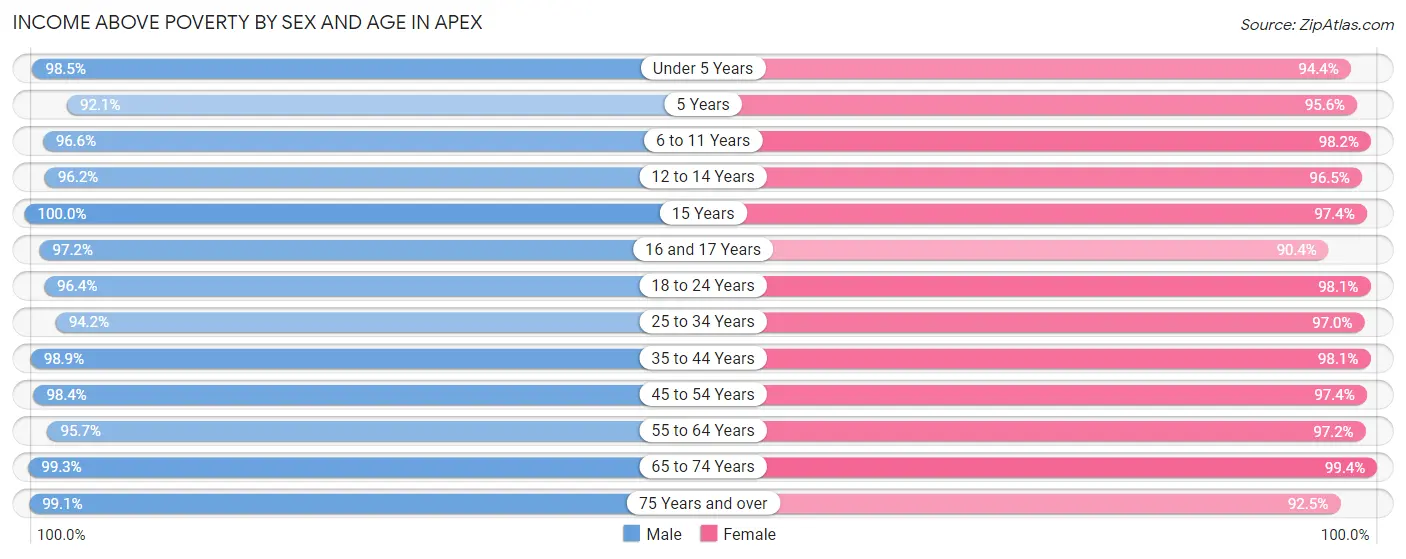
| Age Bracket | Male | Female |
| Under 5 Years | 2,265 (98.5%) | 1,665 (94.4%) |
| 5 Years | 548 (92.1%) | 719 (95.6%) |
| 6 to 11 Years | 3,231 (96.6%) | 3,404 (98.2%) |
| 12 to 14 Years | 1,478 (96.2%) | 1,538 (96.5%) |
| 15 Years | 718 (100.0%) | 744 (97.4%) |
| 16 and 17 Years | 974 (97.2%) | 1,079 (90.4%) |
| 18 to 24 Years | 2,005 (96.4%) | 1,825 (98.1%) |
| 25 to 34 Years | 3,648 (94.2%) | 4,680 (97.0%) |
| 35 to 44 Years | 5,398 (98.9%) | 5,928 (98.1%) |
| 45 to 54 Years | 5,013 (98.4%) | 4,866 (97.4%) |
| 55 to 64 Years | 3,303 (95.7%) | 2,941 (97.2%) |
| 65 to 74 Years | 1,564 (99.3%) | 2,159 (99.4%) |
| 75 Years and over | 914 (99.1%) | 860 (92.5%) |
| Total | 31,059 (97.2%) | 32,408 (97.1%) |
Income Below Poverty Among Married-Couple Families in Apex
The poverty statistics for married-couple families in Apex show that 0.6% or 88 of the total 14,662 families live below the poverty line. Families with 5 or more children have the highest poverty rate of 26.3%, comprising of 15 families. On the other hand, families with no children have the lowest poverty rate of 0.3%, which includes 20 families.
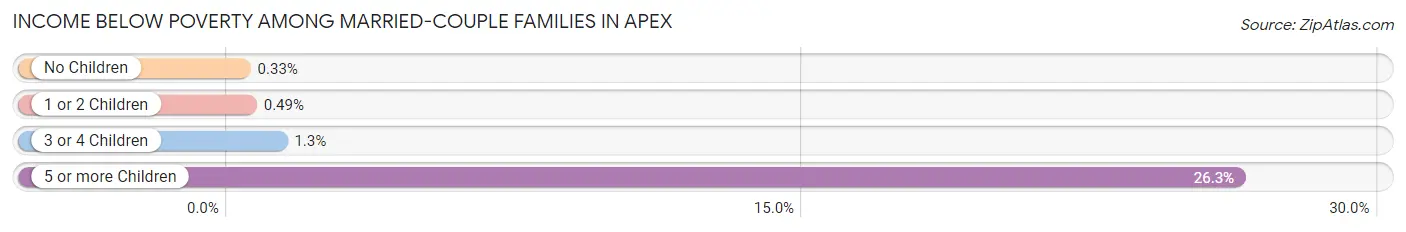
| Children | Above Poverty | Below Poverty |
| No Children | 5,980 (99.7%) | 20 (0.3%) |
| 1 or 2 Children | 7,251 (99.5%) | 36 (0.5%) |
| 3 or 4 Children | 1,301 (98.7%) | 17 (1.3%) |
| 5 or more Children | 42 (73.7%) | 15 (26.3%) |
| Total | 14,574 (99.4%) | 88 (0.6%) |
Income Below Poverty Among Single-Parent Households in Apex
According to the poverty data in Apex, 4.1% or 27 single-father households and 8.5% or 187 single-mother households are living below the poverty line. Among single-father households, those with 1 or 2 children have the highest poverty rate, with 27 households (6.4%) experiencing poverty. Likewise, among single-mother households, those with 3 or 4 children have the highest poverty rate, with 65 households (30.1%) falling below the poverty line.
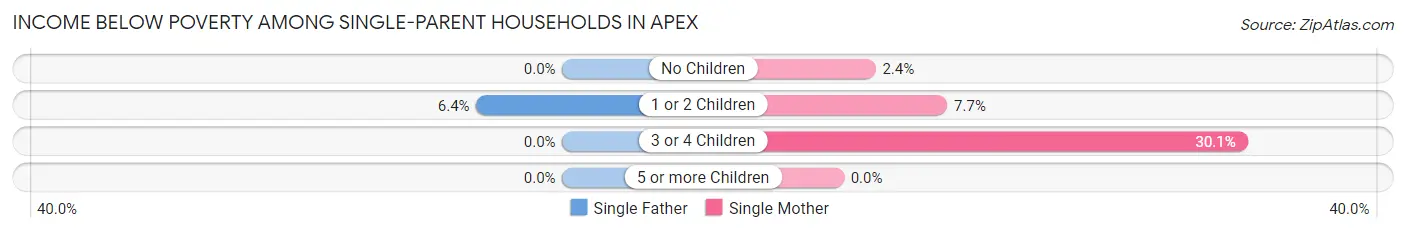
| Children | Single Father | Single Mother |
| No Children | 0 (0.0%) | 14 (2.4%) |
| 1 or 2 Children | 27 (6.4%) | 108 (7.7%) |
| 3 or 4 Children | 0 (0.0%) | 65 (30.1%) |
| 5 or more Children | 0 (0.0%) | 0 (0.0%) |
| Total | 27 (4.1%) | 187 (8.5%) |
Income Below Poverty Among Married-Couple vs Single-Parent Households in Apex
The poverty data for Apex shows that 88 of the married-couple family households (0.6%) and 214 of the single-parent households (7.5%) are living below the poverty level. Within the married-couple family households, those with 5 or more children have the highest poverty rate, with 15 households (26.3%) falling below the poverty line. Among the single-parent households, those with 3 or 4 children have the highest poverty rate, with 65 household (30.1%) living below poverty.
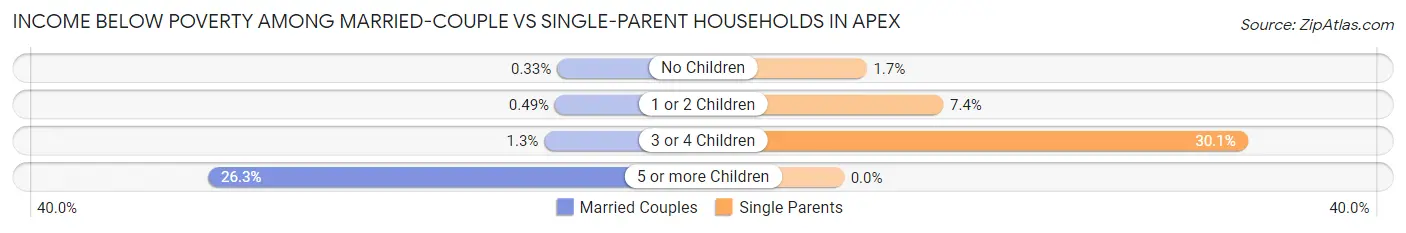
| Children | Married-Couple Families | Single-Parent Households |
| No Children | 20 (0.3%) | 14 (1.7%) |
| 1 or 2 Children | 36 (0.5%) | 135 (7.4%) |
| 3 or 4 Children | 17 (1.3%) | 65 (30.1%) |
| 5 or more Children | 15 (26.3%) | 0 (0.0%) |
| Total | 88 (0.6%) | 214 (7.5%) |
Race in Apex
The most populous races in Apex are White / Caucasian (45,022 | 68.7%), Asian (9,719 | 14.8%), and Black / African American (5,149 | 7.9%).
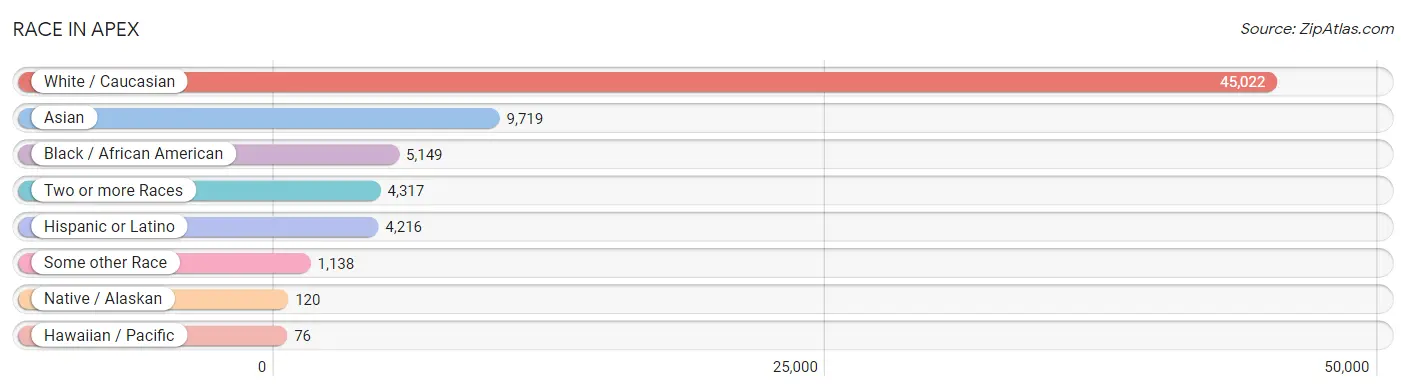
| Race | # Population | % Population |
| Asian | 9,719 | 14.8% |
| Black / African American | 5,149 | 7.9% |
| Hawaiian / Pacific | 76 | 0.1% |
| Hispanic or Latino | 4,216 | 6.4% |
| Native / Alaskan | 120 | 0.2% |
| White / Caucasian | 45,022 | 68.7% |
| Two or more Races | 4,317 | 6.6% |
| Some other Race | 1,138 | 1.7% |
| Total | 65,541 | 100.0% |
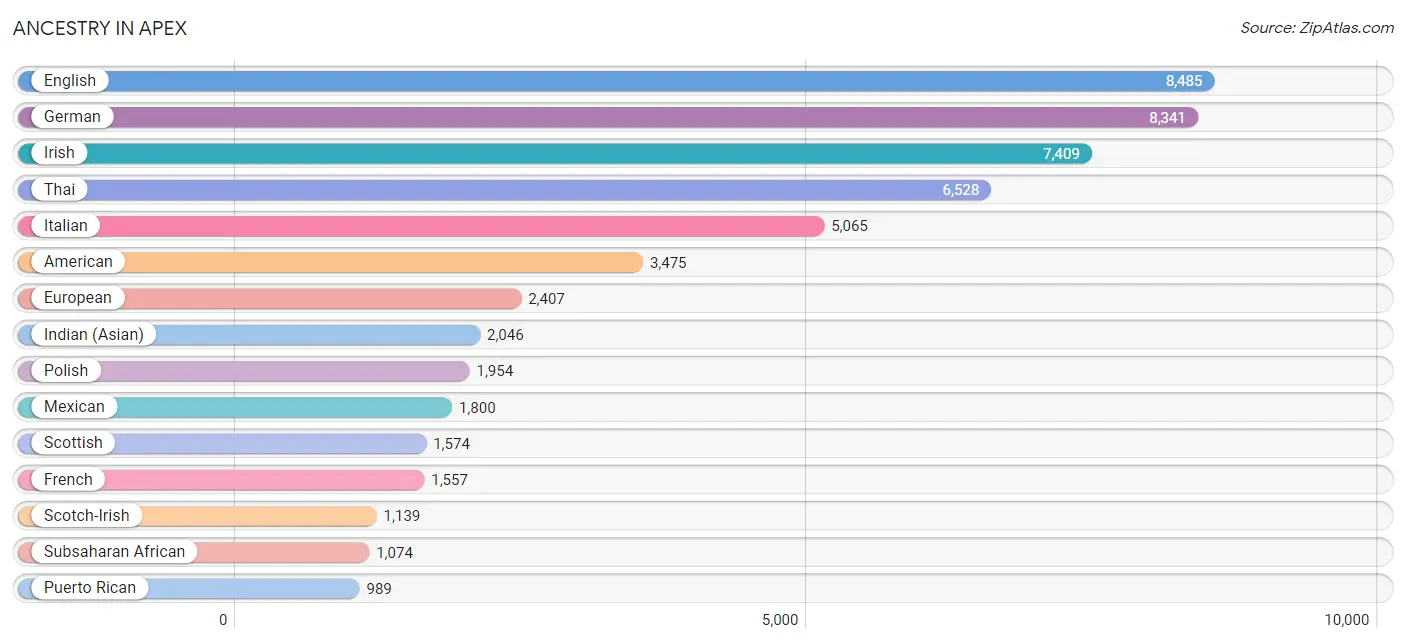
Ancestry in Apex
The most populous ancestries reported in Apex are English (8,485 | 13.0%), German (8,341 | 12.7%), Irish (7,409 | 11.3%), Thai (6,528 | 10.0%), and Italian (5,065 | 7.7%), together accounting for 54.7% of all Apex residents.
| Ancestry | # Population | % Population |
| African | 115 | 0.2% |
| Albanian | 26 | 0.0% |
| American | 3,475 | 5.3% |
| Arab | 357 | 0.5% |
| Argentinean | 79 | 0.1% |
| Armenian | 127 | 0.2% |
| Australian | 11 | 0.0% |
| Austrian | 153 | 0.2% |
| Belgian | 98 | 0.2% |
| Bhutanese | 197 | 0.3% |
| Blackfeet | 6 | 0.0% |
| Brazilian | 409 | 0.6% |
| British | 508 | 0.8% |
| Bulgarian | 199 | 0.3% |
| Burmese | 491 | 0.7% |
| Canadian | 152 | 0.2% |
| Central American | 272 | 0.4% |
| Cherokee | 185 | 0.3% |
| Chilean | 8 | 0.0% |
| Choctaw | 8 | 0.0% |
| Colombian | 95 | 0.1% |
| Costa Rican | 82 | 0.1% |
| Croatian | 63 | 0.1% |
| Cuban | 221 | 0.3% |
| Czech | 218 | 0.3% |
| Danish | 98 | 0.2% |
| Dominican | 179 | 0.3% |
| Dutch | 404 | 0.6% |
| Eastern European | 204 | 0.3% |
| Ecuadorian | 29 | 0.0% |
| Egyptian | 37 | 0.1% |
| English | 8,485 | 13.0% |
| Estonian | 37 | 0.1% |
| Ethiopian | 54 | 0.1% |
| European | 2,407 | 3.7% |
| Filipino | 135 | 0.2% |
| Finnish | 132 | 0.2% |
| French | 1,557 | 2.4% |
| French American Indian | 29 | 0.0% |
| French Canadian | 92 | 0.1% |
| German | 8,341 | 12.7% |
| Ghanaian | 127 | 0.2% |
| Greek | 213 | 0.3% |
| Guamanian / Chamorro | 23 | 0.0% |
| Guatemalan | 69 | 0.1% |
| Honduran | 21 | 0.0% |
| Hungarian | 577 | 0.9% |
| Indian (Asian) | 2,046 | 3.1% |
| Iranian | 122 | 0.2% |
| Irish | 7,409 | 11.3% |
| Iroquois | 29 | 0.0% |
| Israeli | 30 | 0.1% |
| Italian | 5,065 | 7.7% |
| Jamaican | 23 | 0.0% |
| Japanese | 8 | 0.0% |
| Kenyan | 19 | 0.0% |
| Korean | 333 | 0.5% |
| Lebanese | 162 | 0.3% |
| Lithuanian | 155 | 0.2% |
| Lumbee | 121 | 0.2% |
| Luxembourger | 13 | 0.0% |
| Maltese | 4 | 0.0% |
| Mexican | 1,800 | 2.8% |
| Mexican American Indian | 58 | 0.1% |
| Native Hawaiian | 57 | 0.1% |
| Nigerian | 177 | 0.3% |
| Northern European | 40 | 0.1% |
| Norwegian | 453 | 0.7% |
| Pakistani | 79 | 0.1% |
| Palestinian | 59 | 0.1% |
| Panamanian | 52 | 0.1% |
| Peruvian | 44 | 0.1% |
| Polish | 1,954 | 3.0% |
| Portuguese | 527 | 0.8% |
| Puerto Rican | 989 | 1.5% |
| Romanian | 63 | 0.1% |
| Russian | 452 | 0.7% |
| Salvadoran | 48 | 0.1% |
| Scandinavian | 85 | 0.1% |
| Scotch-Irish | 1,139 | 1.7% |
| Scottish | 1,574 | 2.4% |
| Sierra Leonean | 28 | 0.0% |
| Slavic | 58 | 0.1% |
| Slovak | 105 | 0.2% |
| Slovene | 178 | 0.3% |
| South African | 9 | 0.0% |
| South American | 272 | 0.4% |
| Spaniard | 107 | 0.2% |
| Spanish | 84 | 0.1% |
| Sri Lankan | 175 | 0.3% |
| Subsaharan African | 1,074 | 1.6% |
| Swedish | 676 | 1.0% |
| Swiss | 134 | 0.2% |
| Syrian | 63 | 0.1% |
| Thai | 6,528 | 10.0% |
| Turkish | 59 | 0.1% |
| U.S. Virgin Islander | 72 | 0.1% |
| Ukrainian | 135 | 0.2% |
| Venezuelan | 17 | 0.0% |
| Welsh | 364 | 0.6% |
| Yugoslavian | 124 | 0.2% | View All 101 Rows |
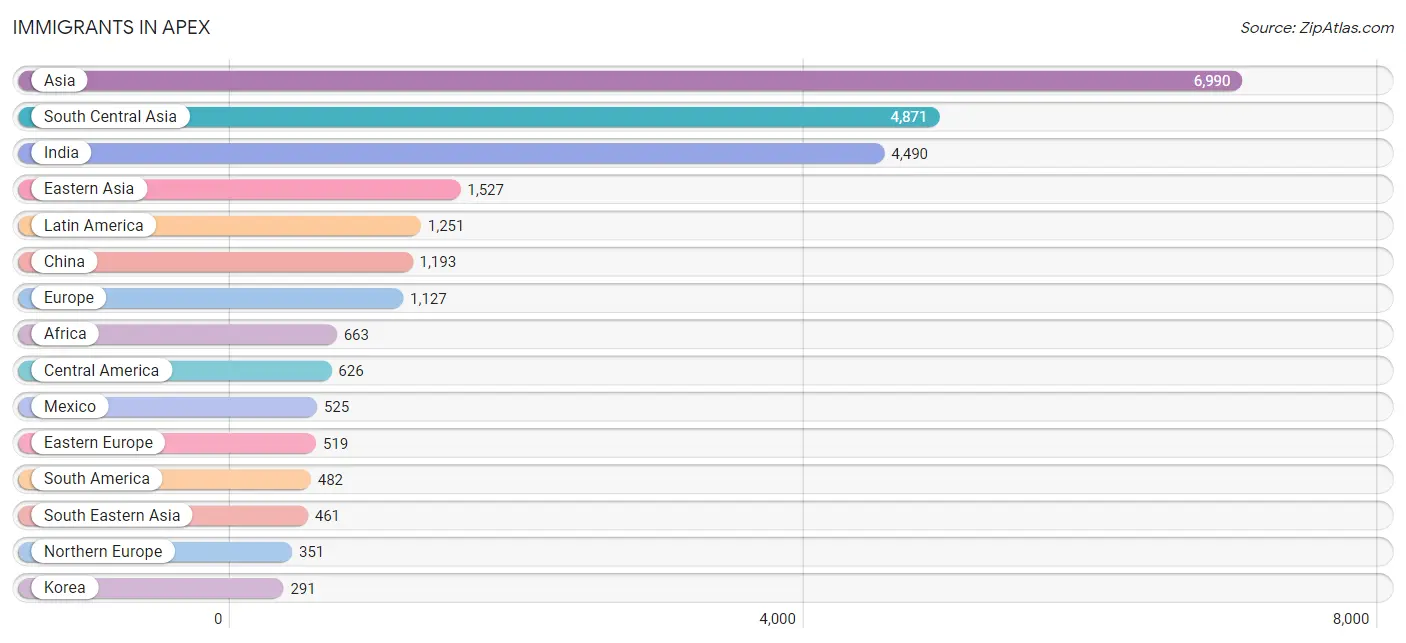
Immigrants in Apex
The most numerous immigrant groups reported in Apex came from Asia (6,990 | 10.7%), South Central Asia (4,871 | 7.4%), India (4,490 | 6.9%), Eastern Asia (1,527 | 2.3%), and Latin America (1,251 | 1.9%), together accounting for 29.2% of all Apex residents.
| Immigration Origin | # Population | % Population |
| Africa | 663 | 1.0% |
| Albania | 13 | 0.0% |
| Argentina | 156 | 0.2% |
| Asia | 6,990 | 10.7% |
| Austria | 25 | 0.0% |
| Belarus | 8 | 0.0% |
| Belgium | 50 | 0.1% |
| Brazil | 251 | 0.4% |
| Bulgaria | 127 | 0.2% |
| Cameroon | 246 | 0.4% |
| Canada | 239 | 0.4% |
| Caribbean | 143 | 0.2% |
| Central America | 626 | 1.0% |
| Chile | 8 | 0.0% |
| China | 1,193 | 1.8% |
| Colombia | 13 | 0.0% |
| Congo | 17 | 0.0% |
| Croatia | 7 | 0.0% |
| Cuba | 5 | 0.0% |
| Czechoslovakia | 22 | 0.0% |
| Dominican Republic | 119 | 0.2% |
| Eastern Africa | 97 | 0.2% |
| Eastern Asia | 1,527 | 2.3% |
| Eastern Europe | 519 | 0.8% |
| Ecuador | 29 | 0.0% |
| El Salvador | 7 | 0.0% |
| England | 12 | 0.0% |
| Eritrea | 36 | 0.1% |
| Ethiopia | 33 | 0.1% |
| Europe | 1,127 | 1.7% |
| France | 16 | 0.0% |
| Germany | 45 | 0.1% |
| Ghana | 144 | 0.2% |
| Greece | 17 | 0.0% |
| Guatemala | 68 | 0.1% |
| Hong Kong | 95 | 0.1% |
| India | 4,490 | 6.9% |
| Iran | 94 | 0.1% |
| Iraq | 16 | 0.0% |
| Ireland | 119 | 0.2% |
| Japan | 43 | 0.1% |
| Kenya | 19 | 0.0% |
| Korea | 291 | 0.4% |
| Kuwait | 21 | 0.0% |
| Latin America | 1,251 | 1.9% |
| Lithuania | 11 | 0.0% |
| Malaysia | 14 | 0.0% |
| Mexico | 525 | 0.8% |
| Middle Africa | 263 | 0.4% |
| Nepal | 70 | 0.1% |
| Netherlands | 7 | 0.0% |
| Nigeria | 58 | 0.1% |
| Northern Europe | 351 | 0.5% |
| Oceania | 65 | 0.1% |
| Pakistan | 159 | 0.2% |
| Panama | 26 | 0.0% |
| Peru | 8 | 0.0% |
| Philippines | 89 | 0.1% |
| Poland | 32 | 0.1% |
| Portugal | 22 | 0.0% |
| Romania | 16 | 0.0% |
| Russia | 126 | 0.2% |
| Scotland | 17 | 0.0% |
| Senegal | 21 | 0.0% |
| Sierra Leone | 26 | 0.0% |
| Singapore | 46 | 0.1% |
| South Africa | 54 | 0.1% |
| South America | 482 | 0.7% |
| South Central Asia | 4,871 | 7.4% |
| South Eastern Asia | 461 | 0.7% |
| Southern Europe | 114 | 0.2% |
| Spain | 75 | 0.1% |
| Sweden | 31 | 0.1% |
| Syria | 63 | 0.1% |
| Taiwan | 107 | 0.2% |
| Thailand | 43 | 0.1% |
| Trinidad and Tobago | 19 | 0.0% |
| Turkey | 26 | 0.0% |
| Ukraine | 13 | 0.0% |
| Venezuela | 17 | 0.0% |
| Vietnam | 269 | 0.4% |
| Western Africa | 249 | 0.4% |
| Western Asia | 131 | 0.2% |
| Western Europe | 143 | 0.2% | View All 84 Rows |
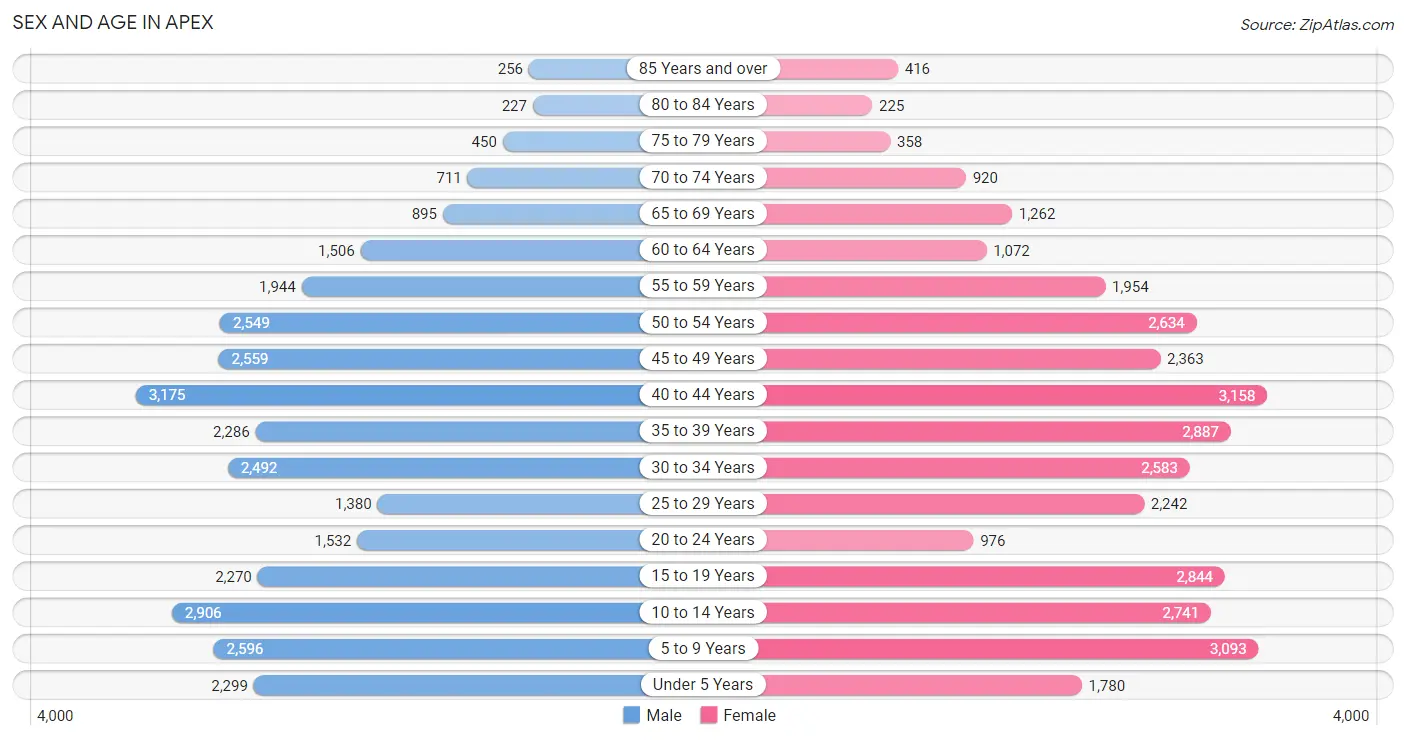
Sex and Age in Apex
Sex and Age in Apex
The most populous age groups in Apex are 40 to 44 Years (3,175 | 9.9%) for men and 40 to 44 Years (3,158 | 9.4%) for women.
| Age Bracket | Male | Female |
| Under 5 Years | 2,299 (7.2%) | 1,780 (5.3%) |
| 5 to 9 Years | 2,596 (8.1%) | 3,093 (9.2%) |
| 10 to 14 Years | 2,906 (9.1%) | 2,741 (8.2%) |
| 15 to 19 Years | 2,270 (7.1%) | 2,844 (8.5%) |
| 20 to 24 Years | 1,532 (4.8%) | 976 (2.9%) |
| 25 to 29 Years | 1,380 (4.3%) | 2,242 (6.7%) |
| 30 to 34 Years | 2,492 (7.8%) | 2,583 (7.7%) |
| 35 to 39 Years | 2,286 (7.1%) | 2,887 (8.6%) |
| 40 to 44 Years | 3,175 (9.9%) | 3,158 (9.4%) |
| 45 to 49 Years | 2,559 (8.0%) | 2,363 (7.0%) |
| 50 to 54 Years | 2,549 (8.0%) | 2,634 (7.9%) |
| 55 to 59 Years | 1,944 (6.1%) | 1,954 (5.8%) |
| 60 to 64 Years | 1,506 (4.7%) | 1,072 (3.2%) |
| 65 to 69 Years | 895 (2.8%) | 1,262 (3.8%) |
| 70 to 74 Years | 711 (2.2%) | 920 (2.8%) |
| 75 to 79 Years | 450 (1.4%) | 358 (1.1%) |
| 80 to 84 Years | 227 (0.7%) | 225 (0.7%) |
| 85 Years and over | 256 (0.8%) | 416 (1.2%) |
| Total | 32,033 (100.0%) | 33,508 (100.0%) |
Families and Households in Apex
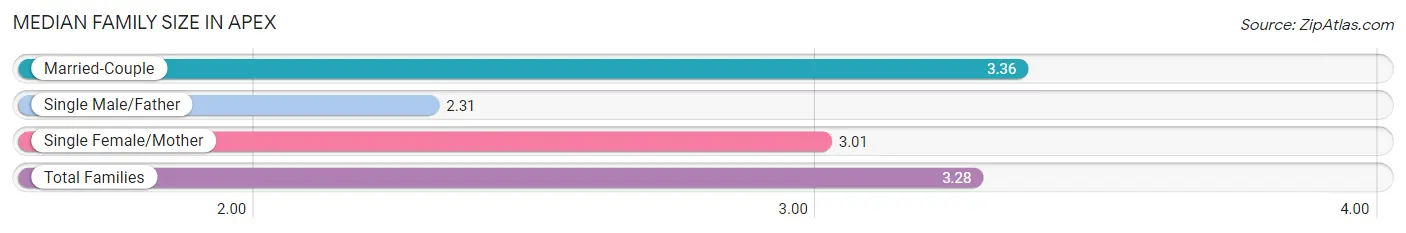
Median Family Size in Apex
The median family size in Apex is 3.28 persons per family, with married-couple families (14,662 | 83.7%) accounting for the largest median family size of 3.36 persons per family. On the other hand, single male/father families (654 | 3.7%) represent the smallest median family size with 2.31 persons per family.
| Family Type | # Families | Family Size |
| Married-Couple | 14,662 (83.7%) | 3.36 |
| Single Male/Father | 654 (3.7%) | 2.31 |
| Single Female/Mother | 2,207 (12.6%) | 3.01 |
| Total Families | 17,523 (100.0%) | 3.28 |
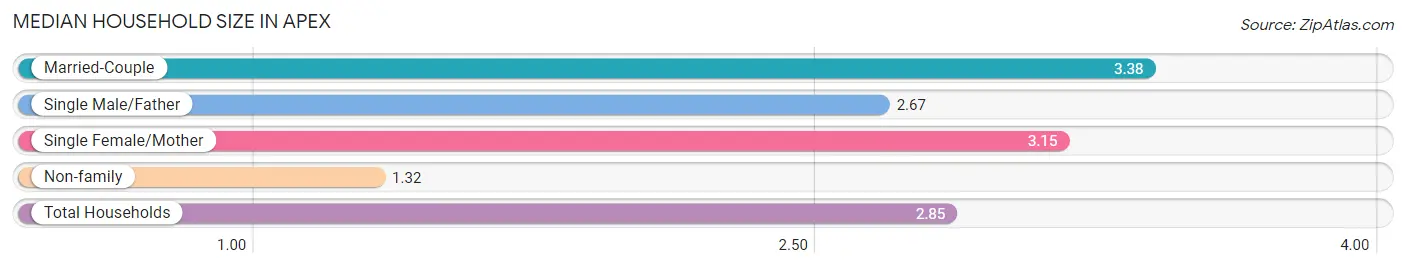
Median Household Size in Apex
The median household size in Apex is 2.85 persons per household, with married-couple households (14,662 | 63.8%) accounting for the largest median household size of 3.38 persons per household. non-family households (5,442 | 23.7%) represent the smallest median household size with 1.32 persons per household.
| Household Type | # Households | Household Size |
| Married-Couple | 14,662 (63.8%) | 3.38 |
| Single Male/Father | 654 (2.9%) | 2.67 |
| Single Female/Mother | 2,207 (9.6%) | 3.15 |
| Non-family | 5,442 (23.7%) | 1.32 |
| Total Households | 22,965 (100.0%) | 2.85 |
Household Size by Marriage Status in Apex
Out of a total of 22,965 households in Apex, 17,523 (76.3%) are family households, while 5,442 (23.7%) are nonfamily households. The most numerous type of family households are 2-person households, comprising 5,774, and the most common type of nonfamily households are 1-person households, comprising 4,173.
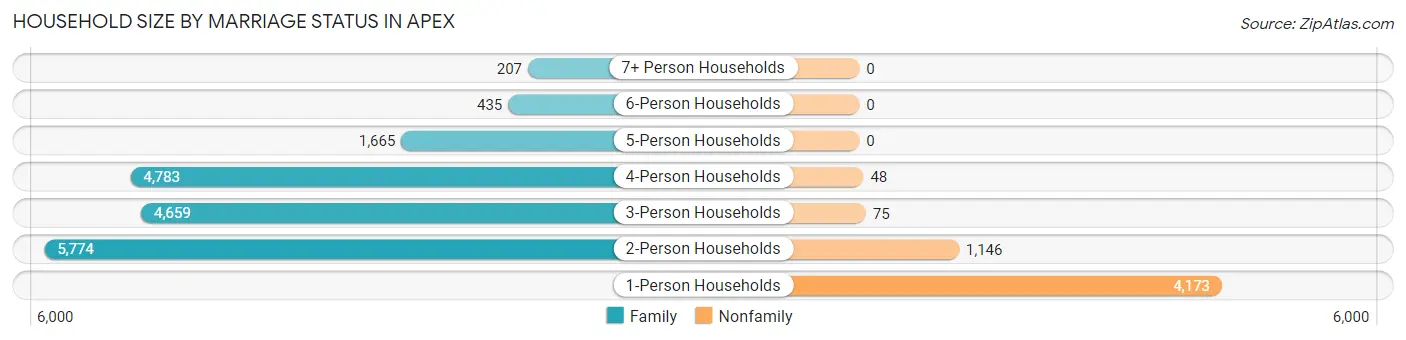
| Household Size | Family Households | Nonfamily Households |
| 1-Person Households | - | 4,173 (18.2%) |
| 2-Person Households | 5,774 (25.1%) | 1,146 (5.0%) |
| 3-Person Households | 4,659 (20.3%) | 75 (0.3%) |
| 4-Person Households | 4,783 (20.8%) | 48 (0.2%) |
| 5-Person Households | 1,665 (7.2%) | 0 (0.0%) |
| 6-Person Households | 435 (1.9%) | 0 (0.0%) |
| 7+ Person Households | 207 (0.9%) | 0 (0.0%) |
| Total | 17,523 (76.3%) | 5,442 (23.7%) |
Female Fertility in Apex
Fertility by Age in Apex
Average fertility rate in Apex is 71.0 births per 1,000 women. Women in the age bracket of 20 to 34 years have the highest fertility rate with 167.0 births per 1,000 women. Women in the age bracket of 20 to 34 years acount for 77.7% of all women with births.
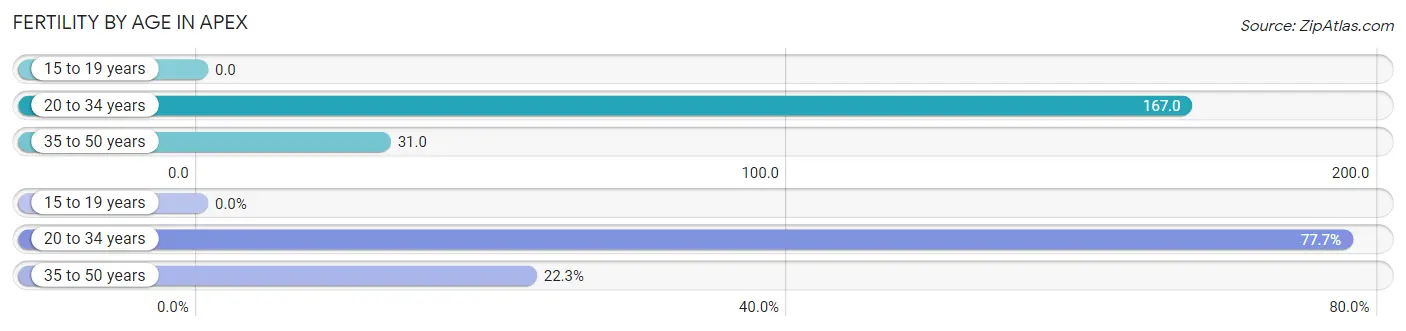
| Age Bracket | Women with Births | Births / 1,000 Women |
| 15 to 19 years | 0 (0.0%) | 0.0 |
| 20 to 34 years | 968 (77.7%) | 167.0 |
| 35 to 50 years | 278 (22.3%) | 31.0 |
| Total | 1,246 (100.0%) | 71.0 |
Fertility by Age by Marriage Status in Apex
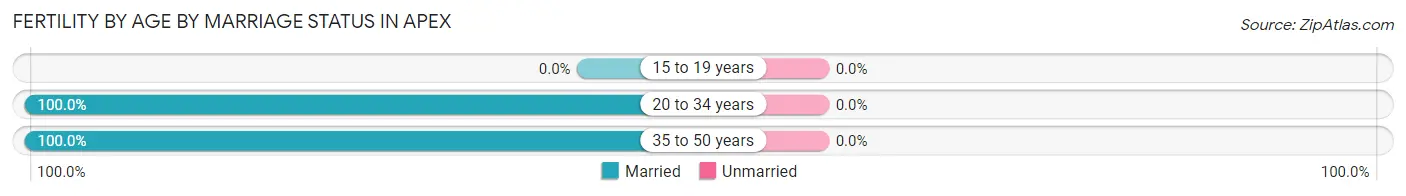
| Age Bracket | Married | Unmarried |
| 15 to 19 years | 0 (0.0%) | 0 (0.0%) |
| 20 to 34 years | 968 (100.0%) | 0 (0.0%) |
| 35 to 50 years | 278 (100.0%) | 0 (0.0%) |
| Total | 1,246 (100.0%) | 0 (0.0%) |
Fertility by Education in Apex
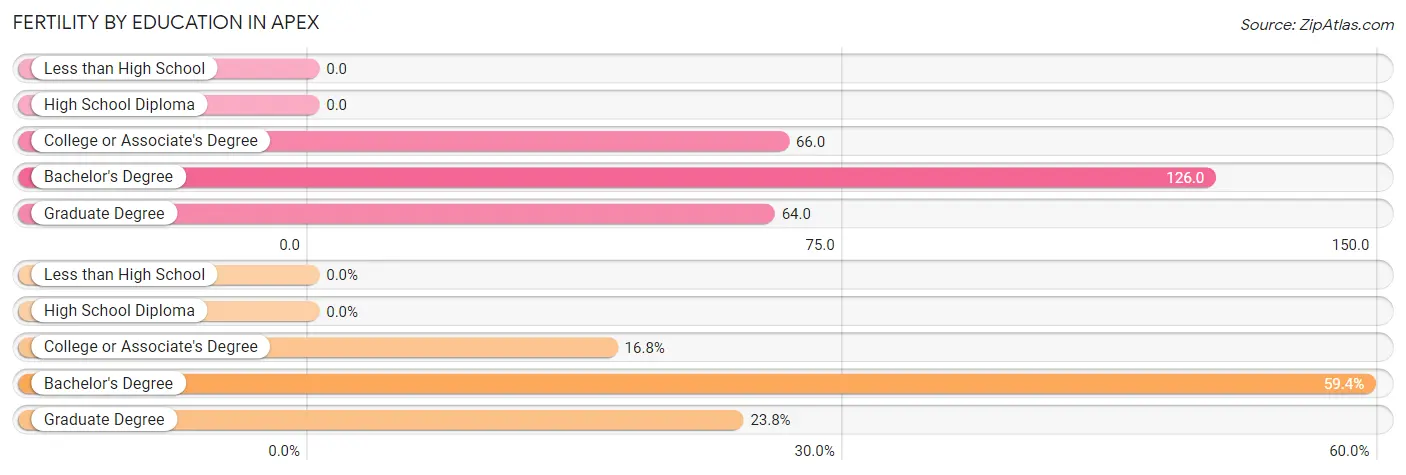
| Educational Attainment | Women with Births | Births / 1,000 Women |
| Less than High School | 0 (0.0%) | 0.0 |
| High School Diploma | 0 (0.0%) | 0.0 |
| College or Associate's Degree | 209 (16.8%) | 66.0 |
| Bachelor's Degree | 740 (59.4%) | 126.0 |
| Graduate Degree | 297 (23.8%) | 64.0 |
| Total | 1,246 (100.0%) | 71.0 |
Fertility by Education by Marriage Status in Apex
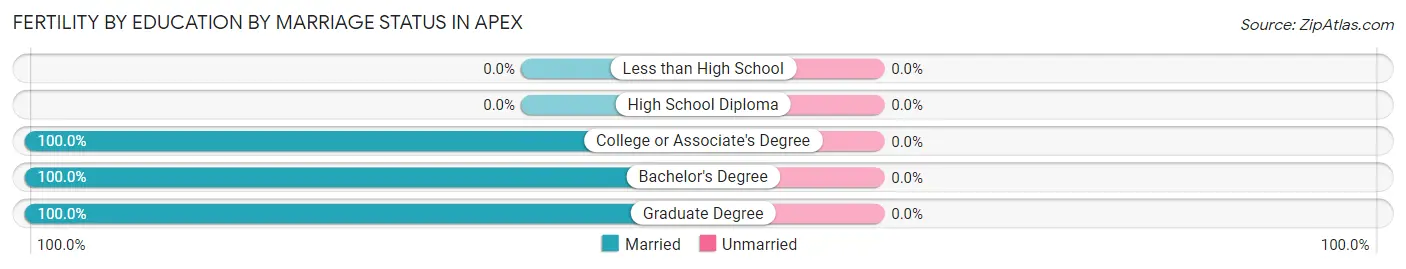
| Educational Attainment | Married | Unmarried |
| Less than High School | 0 (0.0%) | 0 (0.0%) |
| High School Diploma | 0 (0.0%) | 0 (0.0%) |
| College or Associate's Degree | 209 (100.0%) | 0 (0.0%) |
| Bachelor's Degree | 740 (100.0%) | 0 (0.0%) |
| Graduate Degree | 297 (100.0%) | 0 (0.0%) |
| Total | 1,246 (100.0%) | 0 (0.0%) |
Employment Characteristics in Apex
Employment by Class of Employer in Apex
Among the 34,029 employed individuals in Apex, private company employees (25,153 | 73.9%), not-for-profit organizations (2,626 | 7.7%), and state government employees (2,131 | 6.3%) make up the most common classes of employment.
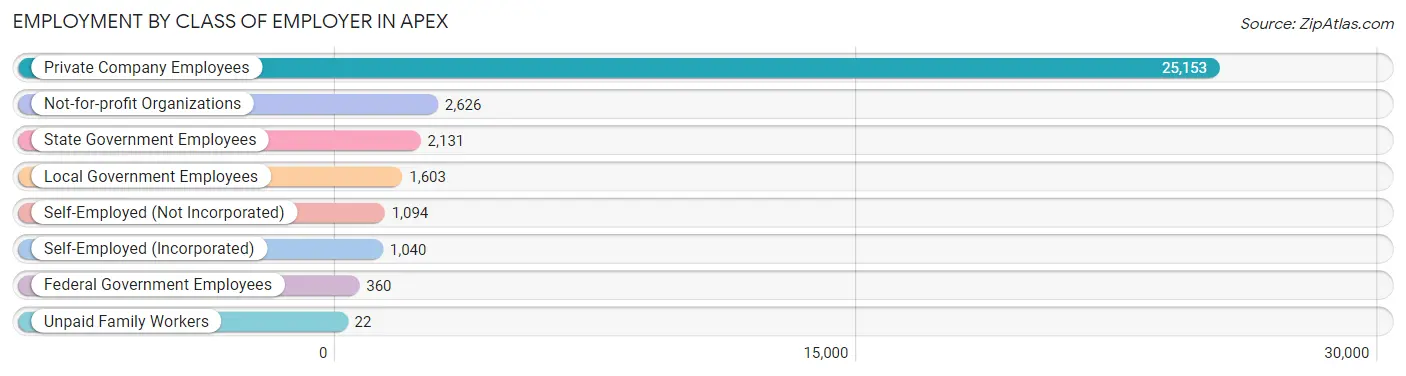
| Employer Class | # Employees | % Employees |
| Private Company Employees | 25,153 | 73.9% |
| Self-Employed (Incorporated) | 1,040 | 3.1% |
| Self-Employed (Not Incorporated) | 1,094 | 3.2% |
| Not-for-profit Organizations | 2,626 | 7.7% |
| Local Government Employees | 1,603 | 4.7% |
| State Government Employees | 2,131 | 6.3% |
| Federal Government Employees | 360 | 1.1% |
| Unpaid Family Workers | 22 | 0.1% |
| Total | 34,029 | 100.0% |
Employment Status by Age in Apex
According to the labor force statistics for Apex, out of the total population over 16 years of age (48,643), 73.7% or 35,850 individuals are in the labor force, with 4.1% or 1,470 of them unemployed. The age group with the highest labor force participation rate is 30 to 34 years, with 90.3% or 4,583 individuals in the labor force. Within the labor force, the 16 to 19 years age range has the highest percentage of unemployed individuals, with 20.8% or 251 of them being unemployed.
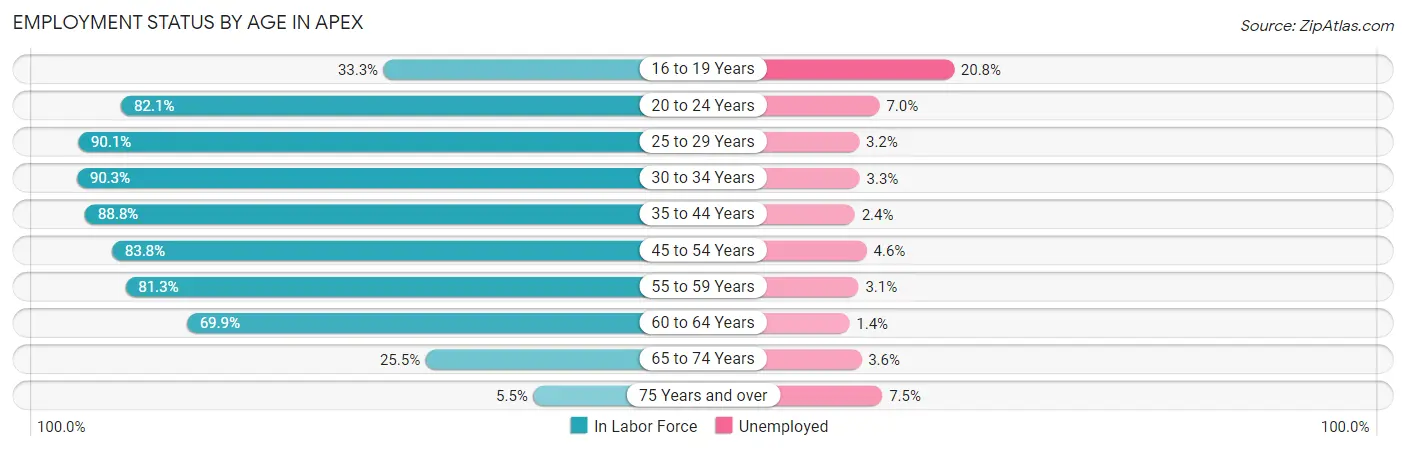
| Age Bracket | In Labor Force | Unemployed |
| 16 to 19 Years | 1,209 (33.3%) | 251 (20.8%) |
| 20 to 24 Years | 2,059 (82.1%) | 144 (7.0%) |
| 25 to 29 Years | 3,263 (90.1%) | 104 (3.2%) |
| 30 to 34 Years | 4,583 (90.3%) | 151 (3.3%) |
| 35 to 44 Years | 10,217 (88.8%) | 245 (2.4%) |
| 45 to 54 Years | 8,468 (83.8%) | 390 (4.6%) |
| 55 to 59 Years | 3,169 (81.3%) | 98 (3.1%) |
| 60 to 64 Years | 1,802 (69.9%) | 25 (1.4%) |
| 65 to 74 Years | 966 (25.5%) | 35 (3.6%) |
| 75 Years and over | 106 (5.5%) | 8 (7.5%) |
| Total | 35,850 (73.7%) | 1,470 (4.1%) |
Employment Status by Educational Attainment in Apex
According to labor force statistics for Apex, 85.6% of individuals (31,487) out of the total population between 25 and 64 years of age (36,784) are in the labor force, with 3.2% or 1,008 of them being unemployed. The group with the highest labor force participation rate are those with the educational attainment of bachelor's degree or higher, with 88.2% or 22,193 individuals in the labor force. Within the labor force, individuals with high school diploma education have the highest percentage of unemployment, with 17.1% or 386 of them being unemployed.
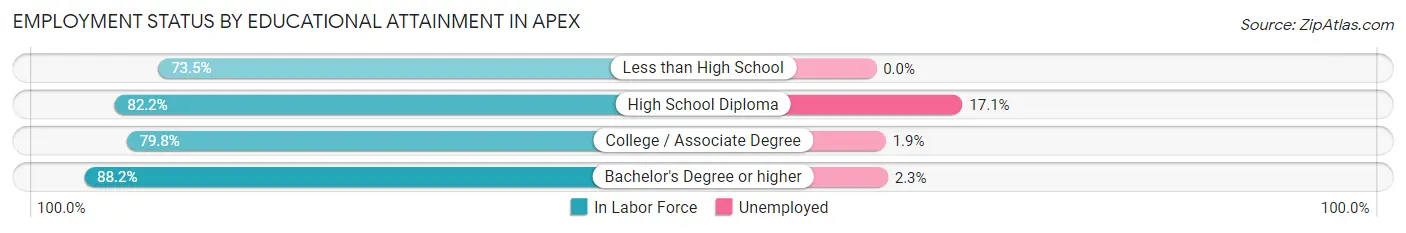
| Educational Attainment | In Labor Force | Unemployed |
| Less than High School | 440 (73.5%) | 0 (0.0%) |
| High School Diploma | 2,255 (82.2%) | 469 (17.1%) |
| College / Associate Degree | 6,607 (79.8%) | 157 (1.9%) |
| Bachelor's Degree or higher | 22,193 (88.2%) | 579 (2.3%) |
| Total | 31,487 (85.6%) | 1,177 (3.2%) |
Employment Occupations by Sex in Apex
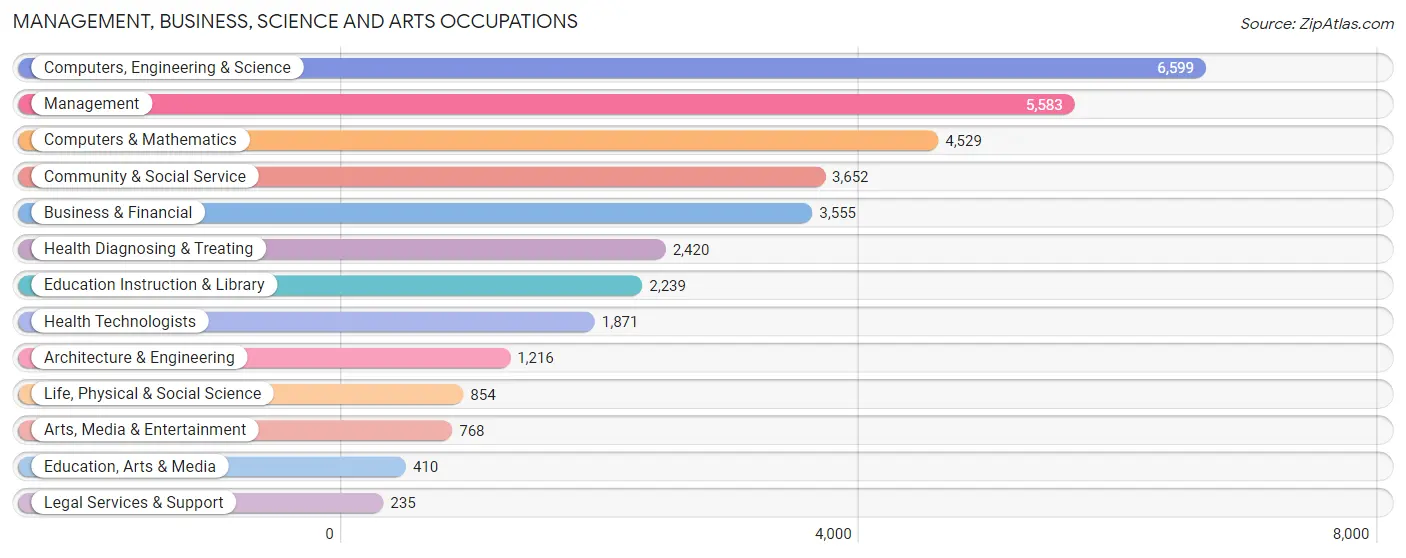
Management, Business, Science and Arts Occupations
The most common Management, Business, Science and Arts occupations in Apex are Computers, Engineering & Science (6,599 | 19.2%), Management (5,583 | 16.3%), Computers & Mathematics (4,529 | 13.2%), Community & Social Service (3,652 | 10.6%), and Business & Financial (3,555 | 10.4%).
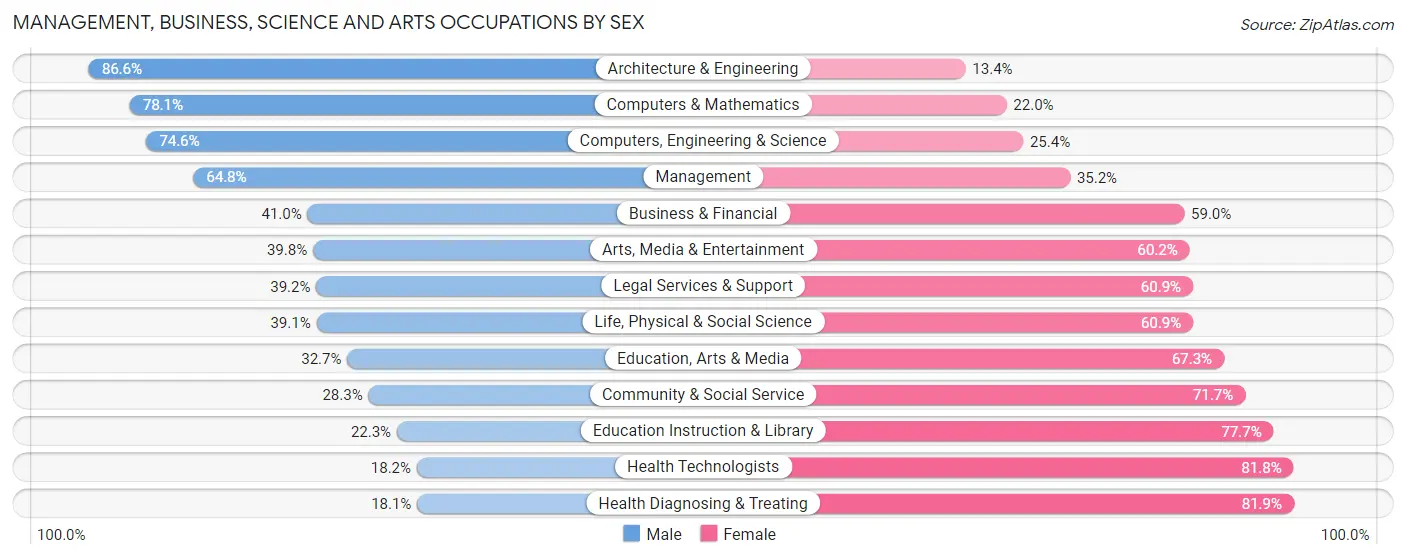
Management, Business, Science and Arts Occupations by Sex
Within the Management, Business, Science and Arts occupations in Apex, the most male-oriented occupations are Architecture & Engineering (86.6%), Computers & Mathematics (78.0%), and Computers, Engineering & Science (74.6%), while the most female-oriented occupations are Health Diagnosing & Treating (81.9%), Health Technologists (81.8%), and Education Instruction & Library (77.7%).
| Occupation | Male | Female |
| Management | 3,617 (64.8%) | 1,966 (35.2%) |
| Business & Financial | 1,457 (41.0%) | 2,098 (59.0%) |
| Computers, Engineering & Science | 4,922 (74.6%) | 1,677 (25.4%) |
| Computers & Mathematics | 3,535 (78.0%) | 994 (22.0%) |
| Architecture & Engineering | 1,053 (86.6%) | 163 (13.4%) |
| Life, Physical & Social Science | 334 (39.1%) | 520 (60.9%) |
| Community & Social Service | 1,032 (28.3%) | 2,620 (71.7%) |
| Education, Arts & Media | 134 (32.7%) | 276 (67.3%) |
| Legal Services & Support | 92 (39.2%) | 143 (60.9%) |
| Education Instruction & Library | 500 (22.3%) | 1,739 (77.7%) |
| Arts, Media & Entertainment | 306 (39.8%) | 462 (60.2%) |
| Health Diagnosing & Treating | 438 (18.1%) | 1,982 (81.9%) |
| Health Technologists | 340 (18.2%) | 1,531 (81.8%) |
| Total (Category) | 11,466 (52.6%) | 10,343 (47.4%) |
| Total (Overall) | 17,789 (51.8%) | 16,536 (48.2%) |
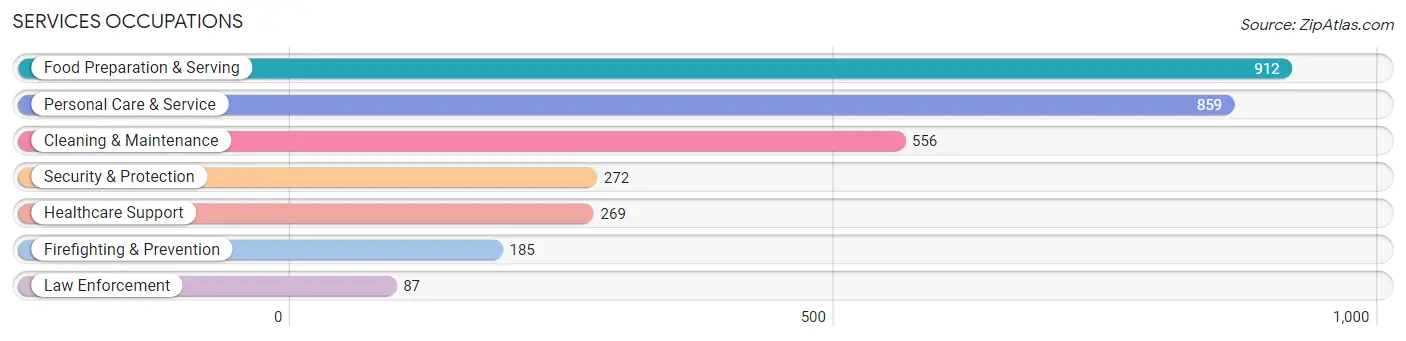
Services Occupations
The most common Services occupations in Apex are Food Preparation & Serving (912 | 2.7%), Personal Care & Service (859 | 2.5%), Cleaning & Maintenance (556 | 1.6%), Security & Protection (272 | 0.8%), and Healthcare Support (269 | 0.8%).
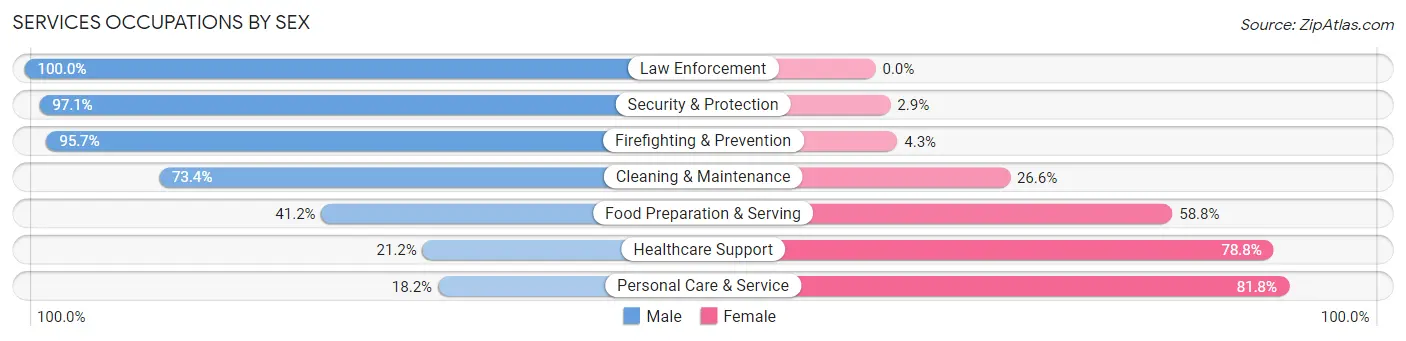
Services Occupations by Sex
Within the Services occupations in Apex, the most male-oriented occupations are Law Enforcement (100.0%), Security & Protection (97.1%), and Firefighting & Prevention (95.7%), while the most female-oriented occupations are Personal Care & Service (81.8%), Healthcare Support (78.8%), and Food Preparation & Serving (58.8%).
| Occupation | Male | Female |
| Healthcare Support | 57 (21.2%) | 212 (78.8%) |
| Security & Protection | 264 (97.1%) | 8 (2.9%) |
| Firefighting & Prevention | 177 (95.7%) | 8 (4.3%) |
| Law Enforcement | 87 (100.0%) | 0 (0.0%) |
| Food Preparation & Serving | 376 (41.2%) | 536 (58.8%) |
| Cleaning & Maintenance | 408 (73.4%) | 148 (26.6%) |
| Personal Care & Service | 156 (18.2%) | 703 (81.8%) |
| Total (Category) | 1,261 (44.0%) | 1,607 (56.0%) |
| Total (Overall) | 17,789 (51.8%) | 16,536 (48.2%) |
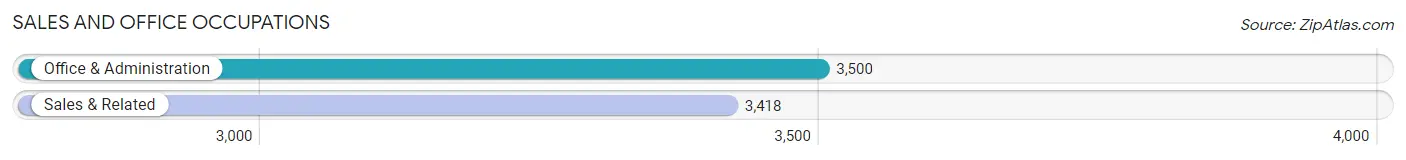
Sales and Office Occupations
The most common Sales and Office occupations in Apex are Office & Administration (3,500 | 10.2%), and Sales & Related (3,418 | 10.0%).
Sales and Office Occupations by Sex
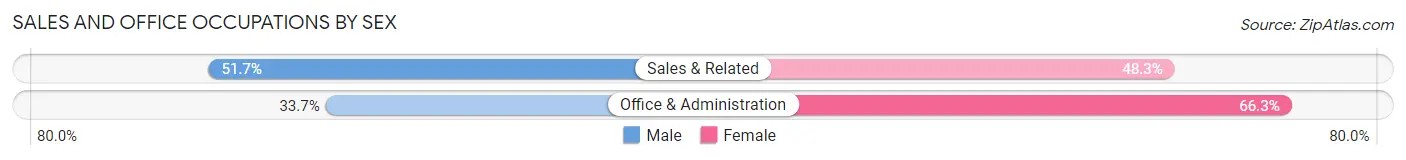
| Occupation | Male | Female |
| Sales & Related | 1,767 (51.7%) | 1,651 (48.3%) |
| Office & Administration | 1,180 (33.7%) | 2,320 (66.3%) |
| Total (Category) | 2,947 (42.6%) | 3,971 (57.4%) |
| Total (Overall) | 17,789 (51.8%) | 16,536 (48.2%) |
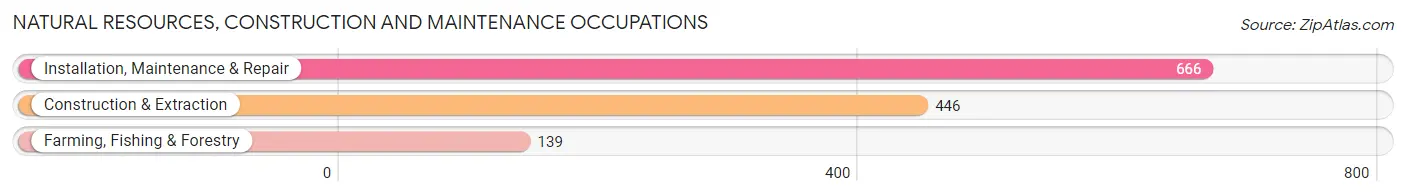
Natural Resources, Construction and Maintenance Occupations
The most common Natural Resources, Construction and Maintenance occupations in Apex are Installation, Maintenance & Repair (666 | 1.9%), Construction & Extraction (446 | 1.3%), and Farming, Fishing & Forestry (139 | 0.4%).
Natural Resources, Construction and Maintenance Occupations by Sex
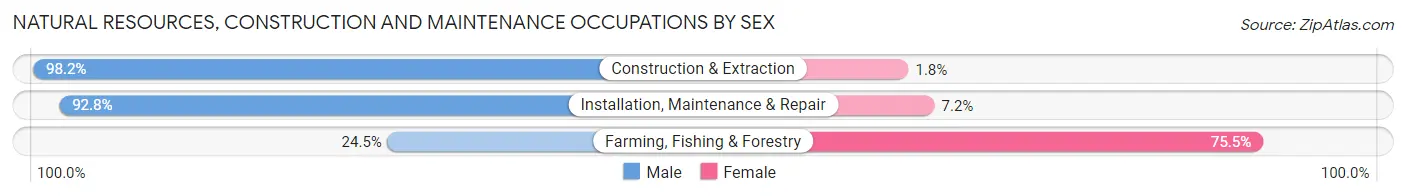
| Occupation | Male | Female |
| Farming, Fishing & Forestry | 34 (24.5%) | 105 (75.5%) |
| Construction & Extraction | 438 (98.2%) | 8 (1.8%) |
| Installation, Maintenance & Repair | 618 (92.8%) | 48 (7.2%) |
| Total (Category) | 1,090 (87.1%) | 161 (12.9%) |
| Total (Overall) | 17,789 (51.8%) | 16,536 (48.2%) |
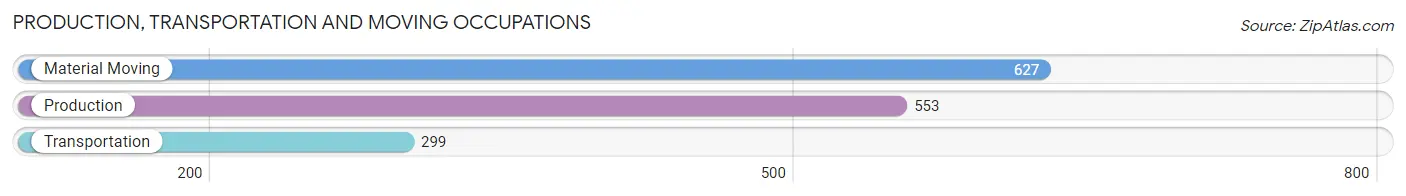
Production, Transportation and Moving Occupations
The most common Production, Transportation and Moving occupations in Apex are Material Moving (627 | 1.8%), Production (553 | 1.6%), and Transportation (299 | 0.9%).
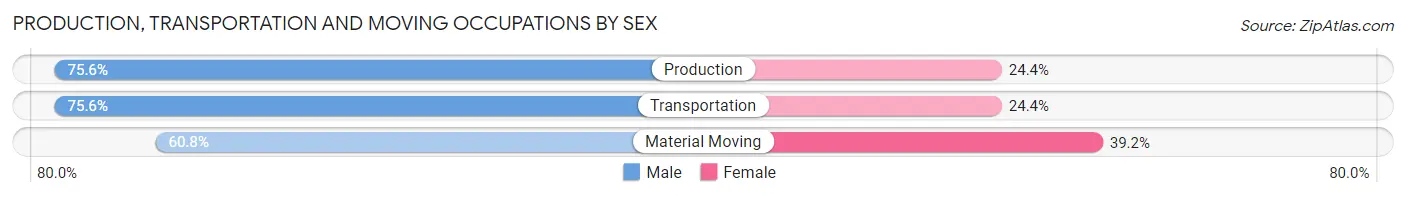
Production, Transportation and Moving Occupations by Sex
| Occupation | Male | Female |
| Production | 418 (75.6%) | 135 (24.4%) |
| Transportation | 226 (75.6%) | 73 (24.4%) |
| Material Moving | 381 (60.8%) | 246 (39.2%) |
| Total (Category) | 1,025 (69.3%) | 454 (30.7%) |
| Total (Overall) | 17,789 (51.8%) | 16,536 (48.2%) |
Employment Industries by Sex in Apex
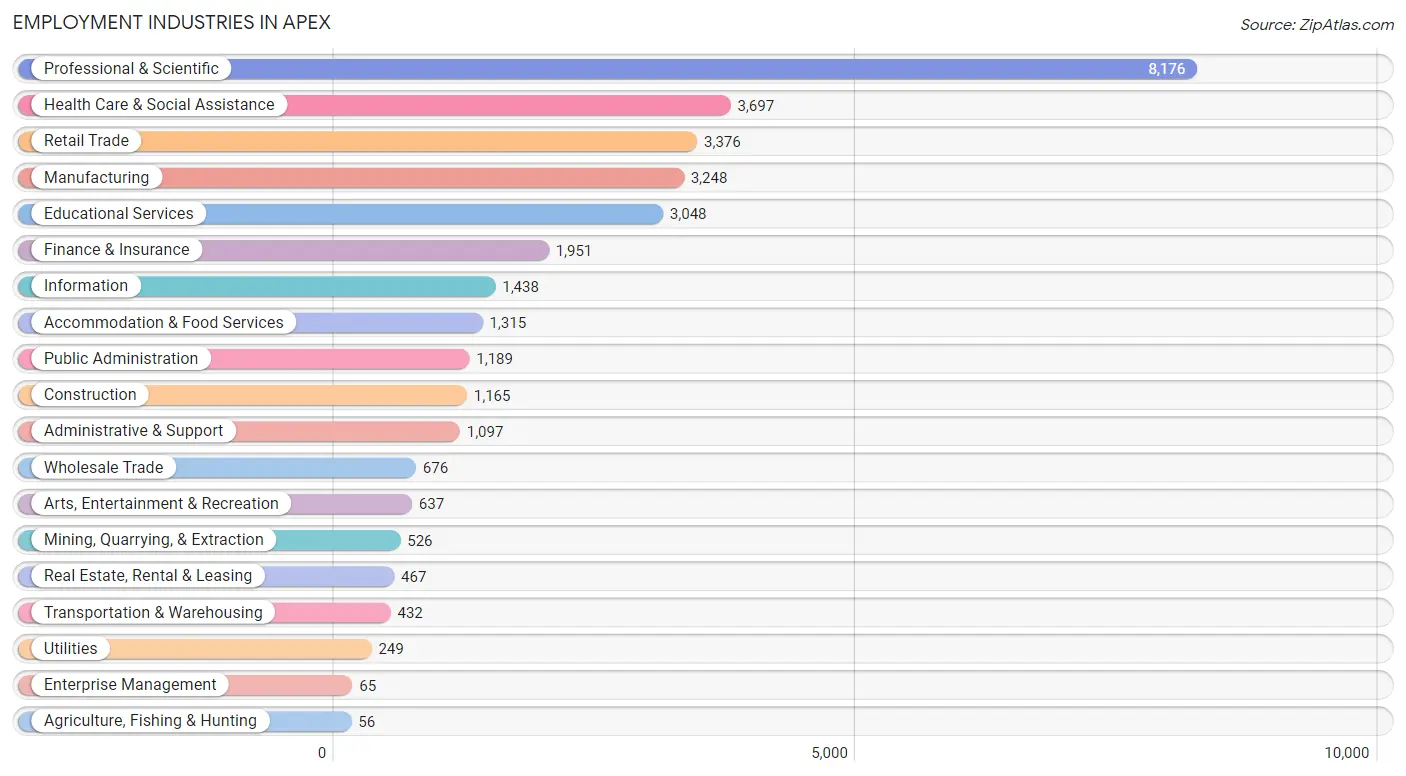
Employment Industries in Apex
The major employment industries in Apex include Professional & Scientific (8,176 | 23.8%), Health Care & Social Assistance (3,697 | 10.8%), Retail Trade (3,376 | 9.8%), Manufacturing (3,248 | 9.5%), and Educational Services (3,048 | 8.9%).
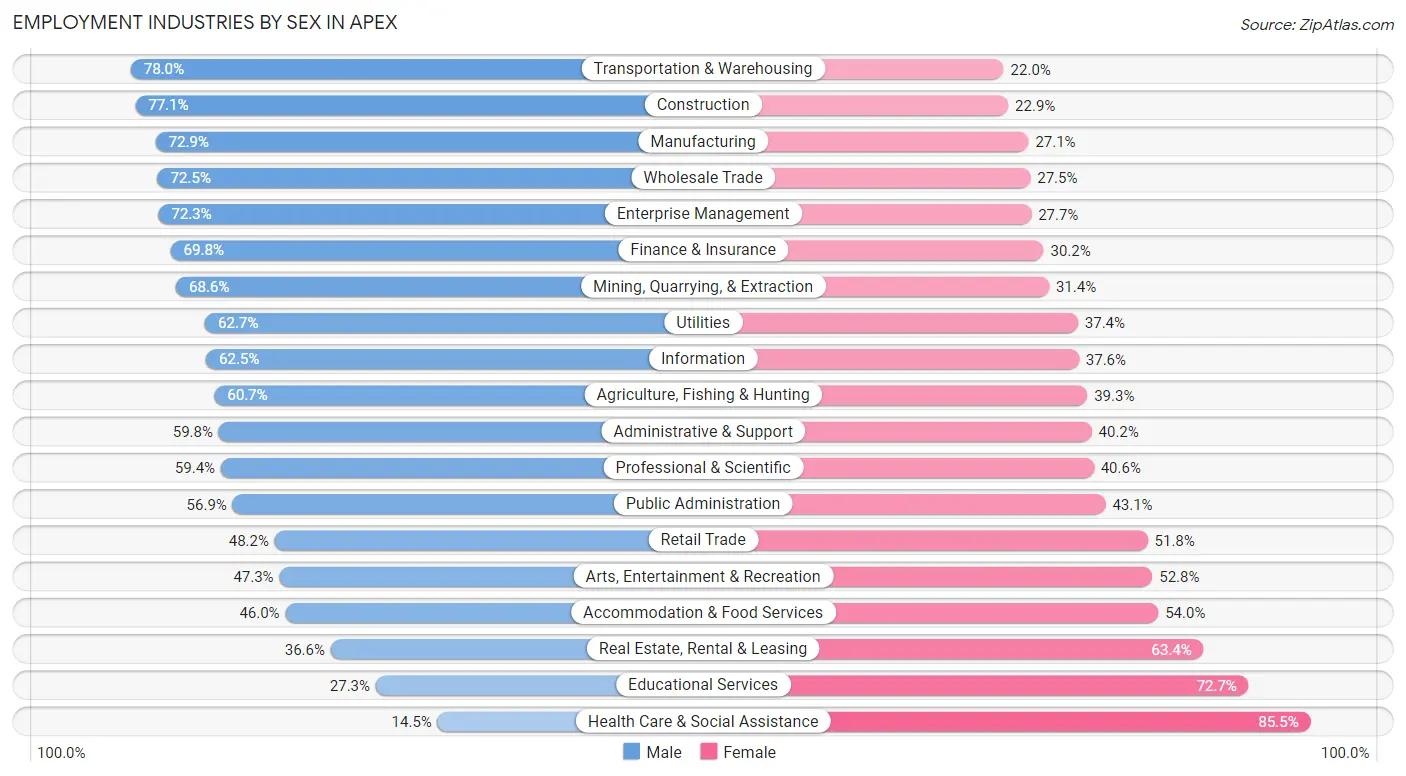
Employment Industries by Sex in Apex
The Apex industries that see more men than women are Transportation & Warehousing (78.0%), Construction (77.1%), and Manufacturing (72.9%), whereas the industries that tend to have a higher number of women are Health Care & Social Assistance (85.5%), Educational Services (72.7%), and Real Estate, Rental & Leasing (63.4%).
| Industry | Male | Female |
| Agriculture, Fishing & Hunting | 34 (60.7%) | 22 (39.3%) |
| Mining, Quarrying, & Extraction | 361 (68.6%) | 165 (31.4%) |
| Construction | 898 (77.1%) | 267 (22.9%) |
| Manufacturing | 2,367 (72.9%) | 881 (27.1%) |
| Wholesale Trade | 490 (72.5%) | 186 (27.5%) |
| Retail Trade | 1,628 (48.2%) | 1,748 (51.8%) |
| Transportation & Warehousing | 337 (78.0%) | 95 (22.0%) |
| Utilities | 156 (62.6%) | 93 (37.3%) |
| Information | 898 (62.5%) | 540 (37.6%) |
| Finance & Insurance | 1,361 (69.8%) | 590 (30.2%) |
| Real Estate, Rental & Leasing | 171 (36.6%) | 296 (63.4%) |
| Professional & Scientific | 4,854 (59.4%) | 3,322 (40.6%) |
| Enterprise Management | 47 (72.3%) | 18 (27.7%) |
| Administrative & Support | 656 (59.8%) | 441 (40.2%) |
| Educational Services | 832 (27.3%) | 2,216 (72.7%) |
| Health Care & Social Assistance | 536 (14.5%) | 3,161 (85.5%) |
| Arts, Entertainment & Recreation | 301 (47.2%) | 336 (52.7%) |
| Accommodation & Food Services | 605 (46.0%) | 710 (54.0%) |
| Public Administration | 677 (56.9%) | 512 (43.1%) |
| Total | 17,789 (51.8%) | 16,536 (48.2%) |
Education in Apex
School Enrollment in Apex
The most common levels of schooling among the 19,509 students in Apex are high school (4,812 | 24.7%), middle school (4,694 | 24.1%), and elementary school (4,529 | 23.2%).
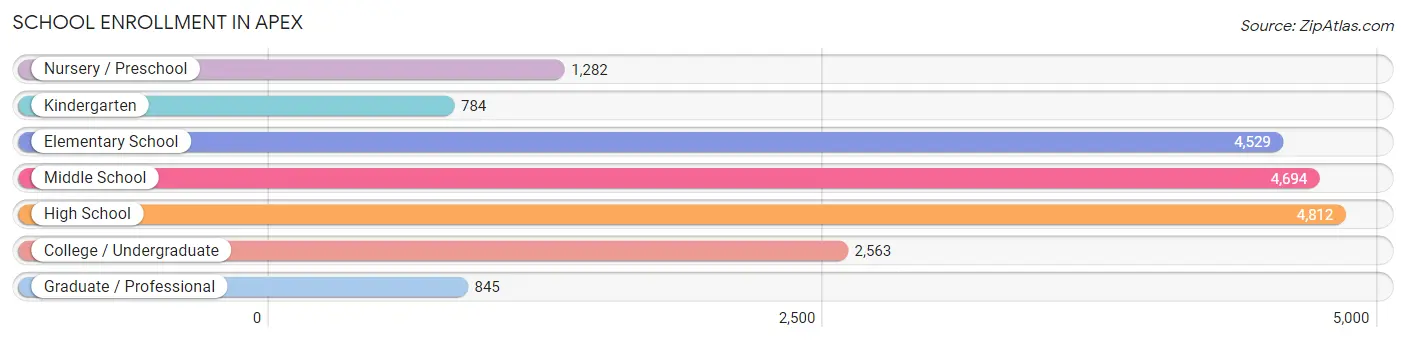
| School Level | # Students | % Students |
| Nursery / Preschool | 1,282 | 6.6% |
| Kindergarten | 784 | 4.0% |
| Elementary School | 4,529 | 23.2% |
| Middle School | 4,694 | 24.1% |
| High School | 4,812 | 24.7% |
| College / Undergraduate | 2,563 | 13.1% |
| Graduate / Professional | 845 | 4.3% |
| Total | 19,509 | 100.0% |
School Enrollment by Age by Funding Source in Apex
Out of a total of 19,509 students who are enrolled in schools in Apex, 3,375 (17.3%) attend a private institution, while the remaining 16,134 (82.7%) are enrolled in public schools. The age group of 3 to 4 year olds has the highest likelihood of being enrolled in private schools, with 447 (74.1% in the age bracket) enrolled. Conversely, the age group of 15 to 17 year olds has the lowest likelihood of being enrolled in a private school, with 3,331 (90.5% in the age bracket) attending a public institution.
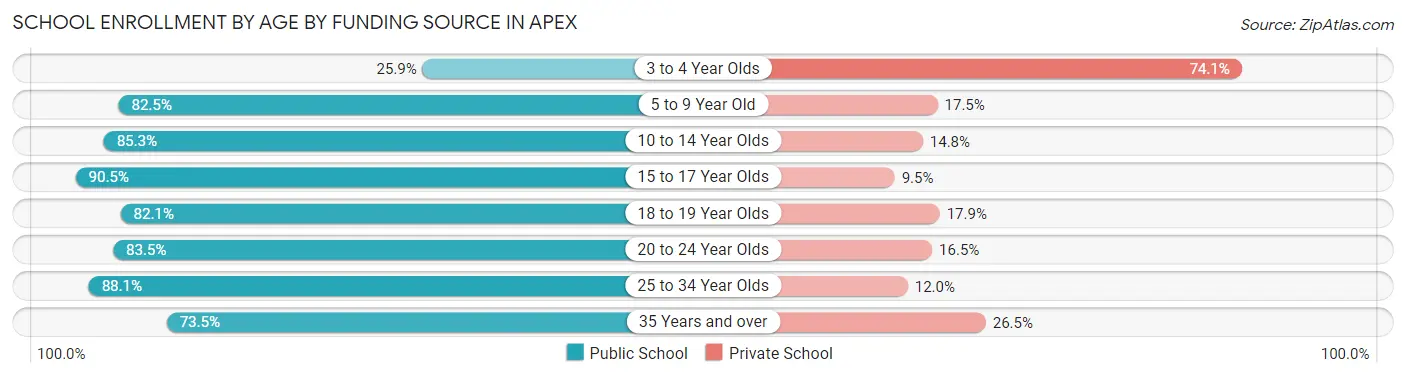
| Age Bracket | Public School | Private School |
| 3 to 4 Year Olds | 156 (25.9%) | 447 (74.1%) |
| 5 to 9 Year Old | 4,489 (82.5%) | 952 (17.5%) |
| 10 to 14 Year Olds | 4,770 (85.3%) | 825 (14.7%) |
| 15 to 17 Year Olds | 3,331 (90.5%) | 350 (9.5%) |
| 18 to 19 Year Olds | 1,010 (82.1%) | 220 (17.9%) |
| 20 to 24 Year Olds | 836 (83.5%) | 165 (16.5%) |
| 25 to 34 Year Olds | 597 (88.0%) | 81 (11.9%) |
| 35 Years and over | 941 (73.5%) | 339 (26.5%) |
| Total | 16,134 (82.7%) | 3,375 (17.3%) |
Educational Attainment by Field of Study in Apex
Business (5,229 | 17.4%), engineering (4,285 | 14.2%), computers & mathematics (3,697 | 12.3%), science & technology (3,362 | 11.2%), and bio, nature & agricultural (1,962 | 6.5%) are the most common fields of study among 30,079 individuals in Apex who have obtained a bachelor's degree or higher.
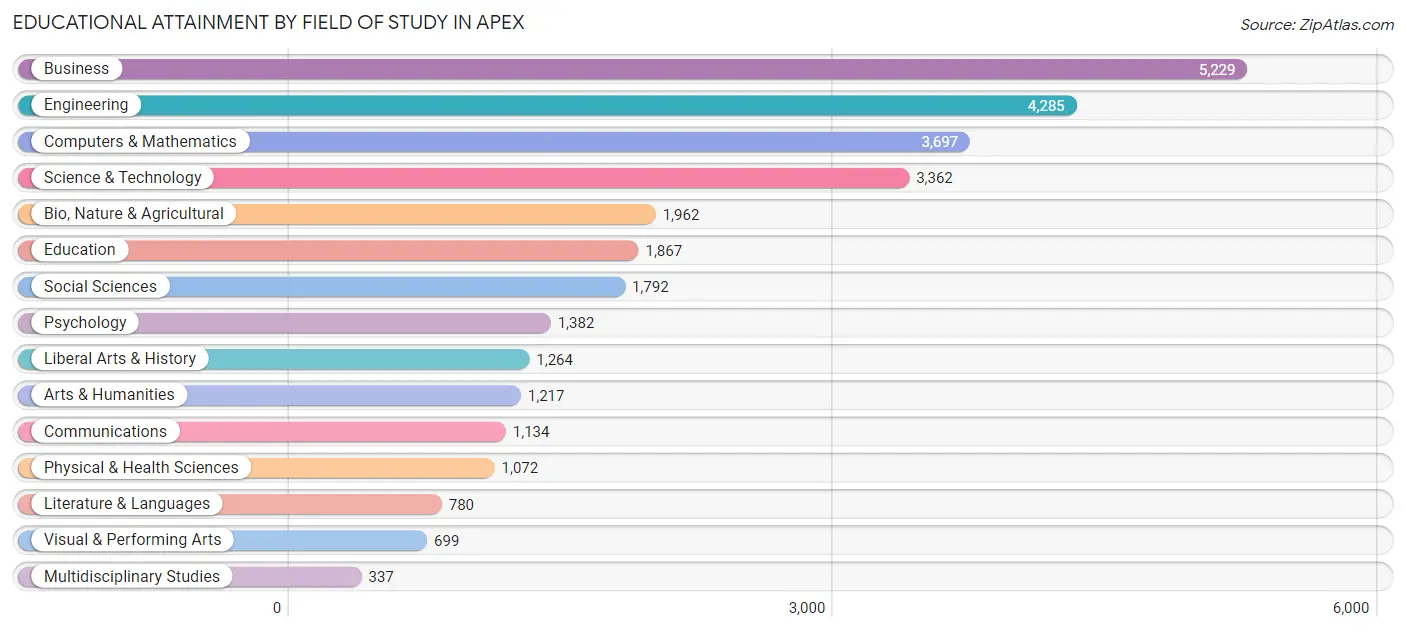
| Field of Study | # Graduates | % Graduates |
| Computers & Mathematics | 3,697 | 12.3% |
| Bio, Nature & Agricultural | 1,962 | 6.5% |
| Physical & Health Sciences | 1,072 | 3.6% |
| Psychology | 1,382 | 4.6% |
| Social Sciences | 1,792 | 6.0% |
| Engineering | 4,285 | 14.2% |
| Multidisciplinary Studies | 337 | 1.1% |
| Science & Technology | 3,362 | 11.2% |
| Business | 5,229 | 17.4% |
| Education | 1,867 | 6.2% |
| Literature & Languages | 780 | 2.6% |
| Liberal Arts & History | 1,264 | 4.2% |
| Visual & Performing Arts | 699 | 2.3% |
| Communications | 1,134 | 3.8% |
| Arts & Humanities | 1,217 | 4.1% |
| Total | 30,079 | 100.0% |
Transportation & Commute in Apex
Vehicle Availability by Sex in Apex
The most prevalent vehicle ownership categories in Apex are males with 2 vehicles (10,334, accounting for 58.2%) and females with 2 vehicles (8,777, making up 63.5%).
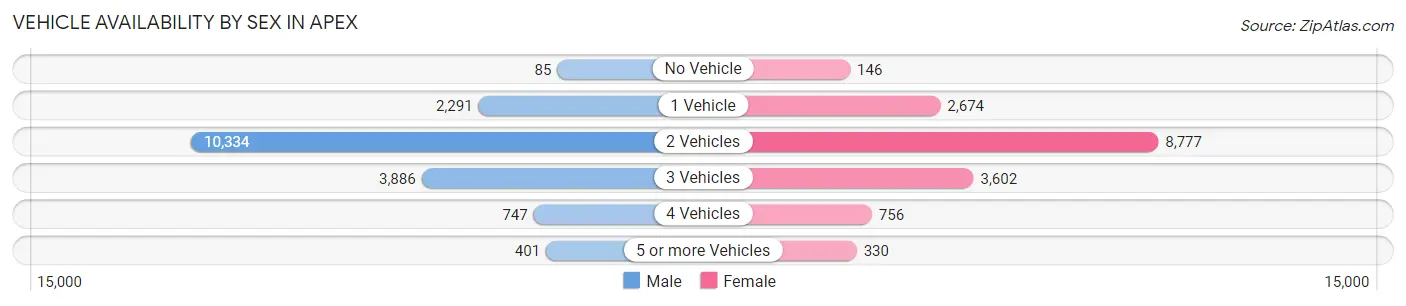
| Vehicles Available | Male | Female |
| No Vehicle | 85 (0.5%) | 146 (0.9%) |
| 1 Vehicle | 2,291 (12.9%) | 2,674 (16.4%) |
| 2 Vehicles | 10,334 (58.2%) | 8,777 (53.9%) |
| 3 Vehicles | 3,886 (21.9%) | 3,602 (22.1%) |
| 4 Vehicles | 747 (4.2%) | 756 (4.6%) |
| 5 or more Vehicles | 401 (2.3%) | 330 (2.0%) |
| Total | 17,744 (100.0%) | 16,285 (100.0%) |
Commute Time in Apex
The most frequently occuring commute durations in Apex are 30 to 34 minutes (4,986 commuters, 20.3%), 20 to 24 minutes (4,361 commuters, 17.8%), and 15 to 19 minutes (3,637 commuters, 14.8%).
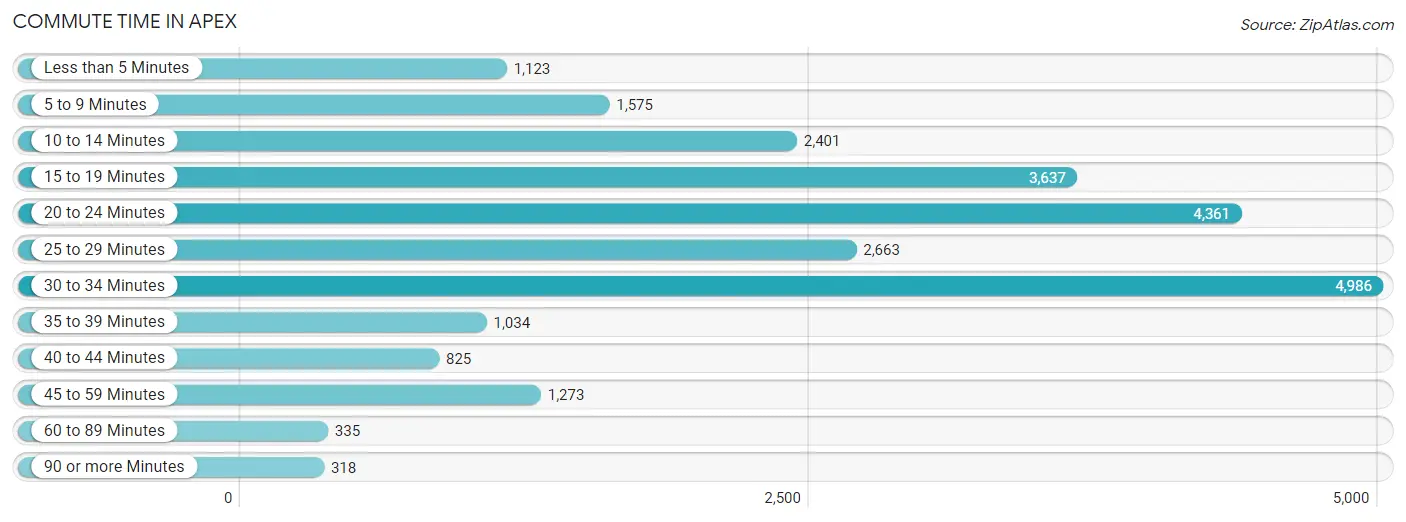
| Commute Time | # Commuters | % Commuters |
| Less than 5 Minutes | 1,123 | 4.6% |
| 5 to 9 Minutes | 1,575 | 6.4% |
| 10 to 14 Minutes | 2,401 | 9.8% |
| 15 to 19 Minutes | 3,637 | 14.8% |
| 20 to 24 Minutes | 4,361 | 17.8% |
| 25 to 29 Minutes | 2,663 | 10.9% |
| 30 to 34 Minutes | 4,986 | 20.3% |
| 35 to 39 Minutes | 1,034 | 4.2% |
| 40 to 44 Minutes | 825 | 3.4% |
| 45 to 59 Minutes | 1,273 | 5.2% |
| 60 to 89 Minutes | 335 | 1.4% |
| 90 or more Minutes | 318 | 1.3% |
Commute Time by Sex in Apex
The most common commute times in Apex are 20 to 24 minutes (2,900 commuters, 23.2%) for males and 30 to 34 minutes (2,320 commuters, 19.3%) for females.
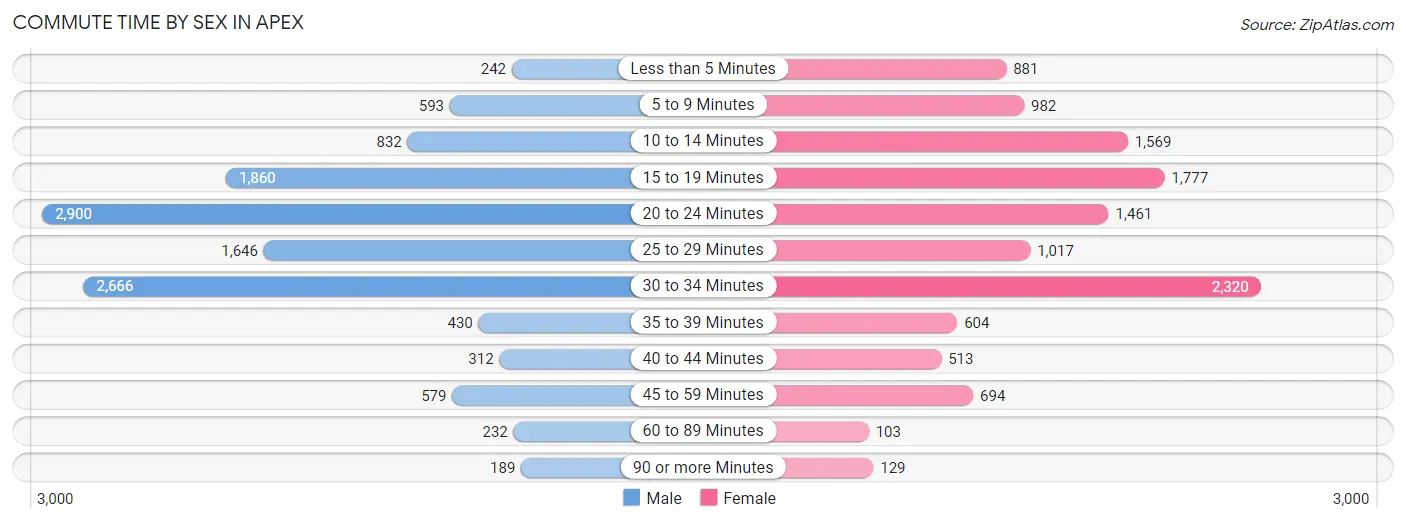
| Commute Time | Male | Female |
| Less than 5 Minutes | 242 (1.9%) | 881 (7.3%) |
| 5 to 9 Minutes | 593 (4.8%) | 982 (8.2%) |
| 10 to 14 Minutes | 832 (6.7%) | 1,569 (13.0%) |
| 15 to 19 Minutes | 1,860 (14.9%) | 1,777 (14.7%) |
| 20 to 24 Minutes | 2,900 (23.2%) | 1,461 (12.1%) |
| 25 to 29 Minutes | 1,646 (13.2%) | 1,017 (8.4%) |
| 30 to 34 Minutes | 2,666 (21.4%) | 2,320 (19.3%) |
| 35 to 39 Minutes | 430 (3.5%) | 604 (5.0%) |
| 40 to 44 Minutes | 312 (2.5%) | 513 (4.3%) |
| 45 to 59 Minutes | 579 (4.6%) | 694 (5.8%) |
| 60 to 89 Minutes | 232 (1.9%) | 103 (0.9%) |
| 90 or more Minutes | 189 (1.5%) | 129 (1.1%) |
Time of Departure to Work by Sex in Apex
The most frequent times of departure to work in Apex are 7:00 AM to 7:29 AM (2,256, 18.1%) for males and 7:30 AM to 7:59 AM (2,397, 19.9%) for females.
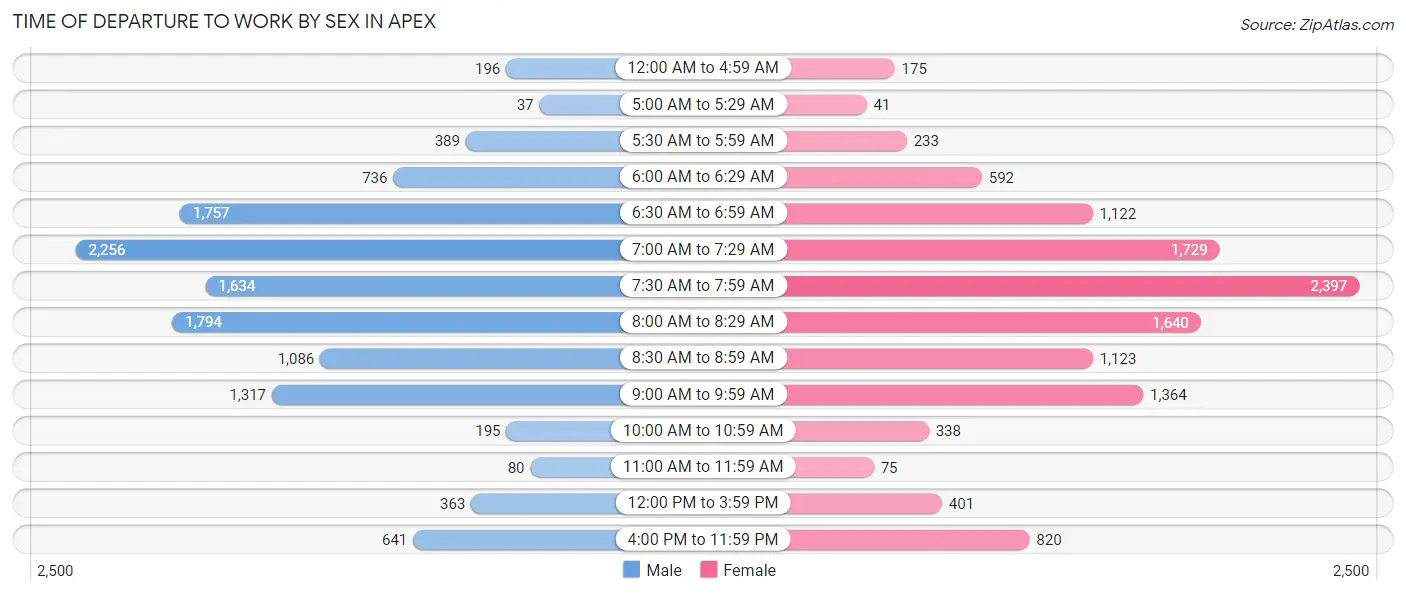
| Time of Departure | Male | Female |
| 12:00 AM to 4:59 AM | 196 (1.6%) | 175 (1.5%) |
| 5:00 AM to 5:29 AM | 37 (0.3%) | 41 (0.3%) |
| 5:30 AM to 5:59 AM | 389 (3.1%) | 233 (1.9%) |
| 6:00 AM to 6:29 AM | 736 (5.9%) | 592 (4.9%) |
| 6:30 AM to 6:59 AM | 1,757 (14.1%) | 1,122 (9.3%) |
| 7:00 AM to 7:29 AM | 2,256 (18.1%) | 1,729 (14.3%) |
| 7:30 AM to 7:59 AM | 1,634 (13.1%) | 2,397 (19.9%) |
| 8:00 AM to 8:29 AM | 1,794 (14.4%) | 1,640 (13.6%) |
| 8:30 AM to 8:59 AM | 1,086 (8.7%) | 1,123 (9.3%) |
| 9:00 AM to 9:59 AM | 1,317 (10.5%) | 1,364 (11.3%) |
| 10:00 AM to 10:59 AM | 195 (1.6%) | 338 (2.8%) |
| 11:00 AM to 11:59 AM | 80 (0.6%) | 75 (0.6%) |
| 12:00 PM to 3:59 PM | 363 (2.9%) | 401 (3.3%) |
| 4:00 PM to 11:59 PM | 641 (5.1%) | 820 (6.8%) |
| Total | 12,481 (100.0%) | 12,050 (100.0%) |
Housing Occupancy in Apex
Occupancy by Ownership in Apex
Of the total 22,965 dwellings in Apex, owner-occupied units account for 17,282 (75.2%), while renter-occupied units make up 5,683 (24.7%).
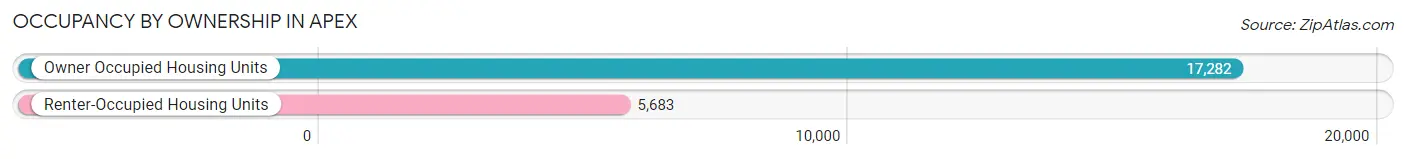
| Occupancy | # Housing Units | % Housing Units |
| Owner Occupied Housing Units | 17,282 | 75.2% |
| Renter-Occupied Housing Units | 5,683 | 24.7% |
| Total Occupied Housing Units | 22,965 | 100.0% |
Occupancy by Household Size in Apex
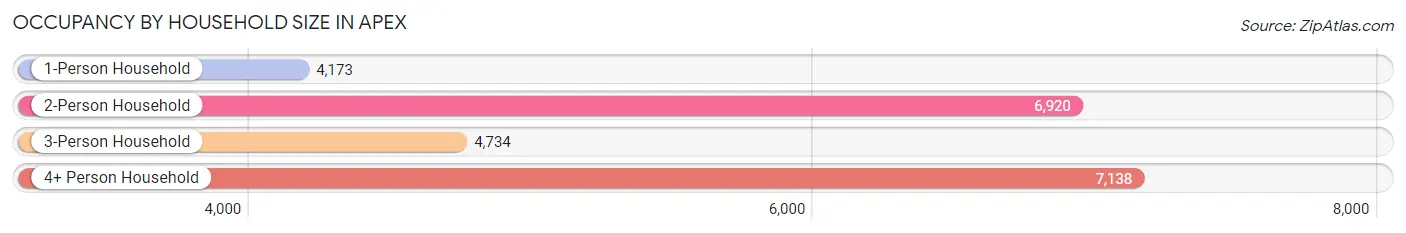
| Household Size | # Housing Units | % Housing Units |
| 1-Person Household | 4,173 | 18.2% |
| 2-Person Household | 6,920 | 30.1% |
| 3-Person Household | 4,734 | 20.6% |
| 4+ Person Household | 7,138 | 31.1% |
| Total Housing Units | 22,965 | 100.0% |
Occupancy by Ownership by Household Size in Apex
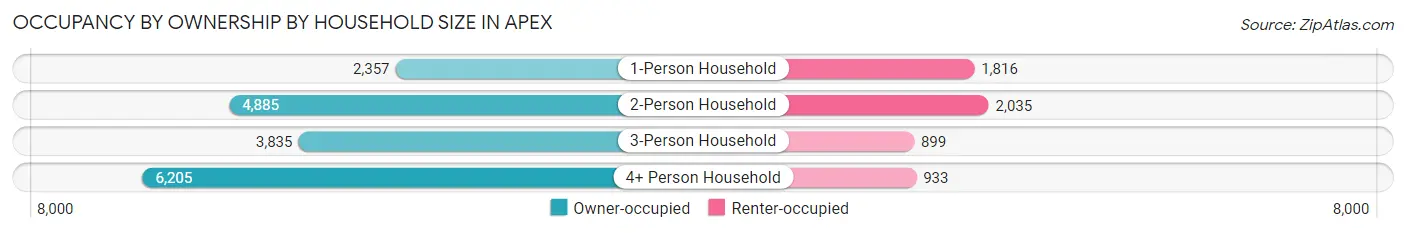
| Household Size | Owner-occupied | Renter-occupied |
| 1-Person Household | 2,357 (56.5%) | 1,816 (43.5%) |
| 2-Person Household | 4,885 (70.6%) | 2,035 (29.4%) |
| 3-Person Household | 3,835 (81.0%) | 899 (19.0%) |
| 4+ Person Household | 6,205 (86.9%) | 933 (13.1%) |
| Total Housing Units | 17,282 (75.2%) | 5,683 (24.7%) |
Occupancy by Educational Attainment in Apex
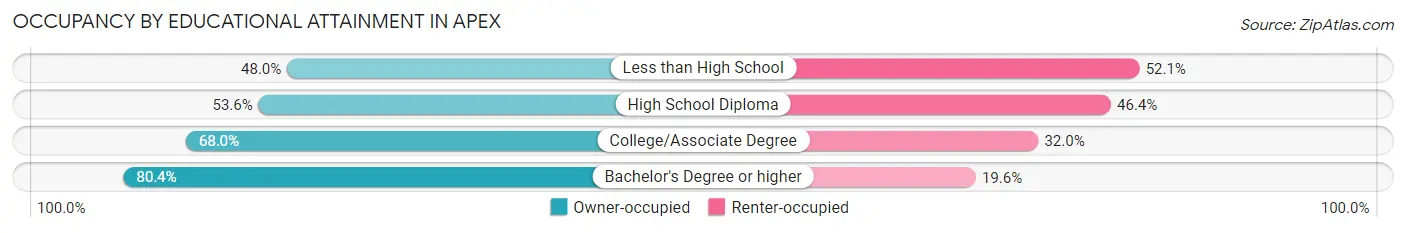
| Household Size | Owner-occupied | Renter-occupied |
| Less than High School | 105 (47.9%) | 114 (52.0%) |
| High School Diploma | 873 (53.6%) | 755 (46.4%) |
| College/Associate Degree | 3,720 (68.0%) | 1,749 (32.0%) |
| Bachelor's Degree or higher | 12,584 (80.4%) | 3,065 (19.6%) |
Occupancy by Age of Householder in Apex
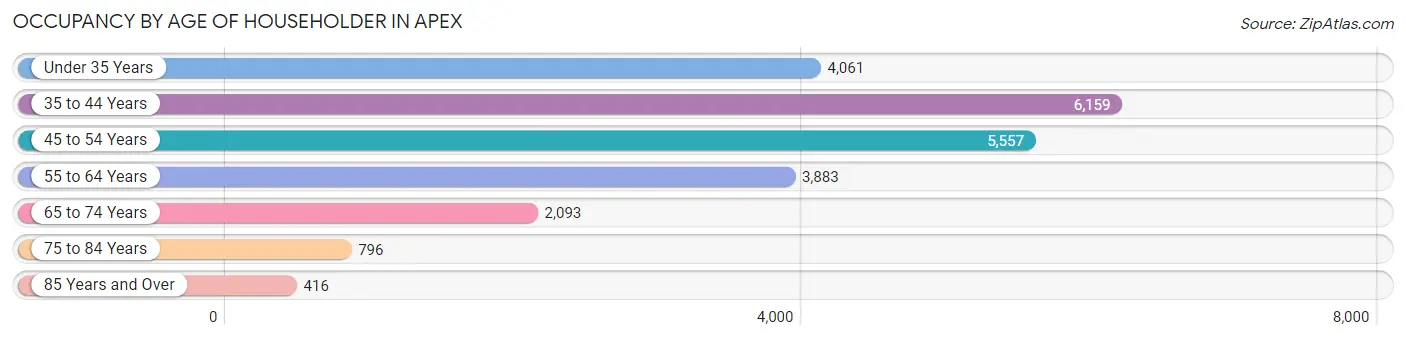
| Age Bracket | # Households | % Households |
| Under 35 Years | 4,061 | 17.7% |
| 35 to 44 Years | 6,159 | 26.8% |
| 45 to 54 Years | 5,557 | 24.2% |
| 55 to 64 Years | 3,883 | 16.9% |
| 65 to 74 Years | 2,093 | 9.1% |
| 75 to 84 Years | 796 | 3.5% |
| 85 Years and Over | 416 | 1.8% |
| Total | 22,965 | 100.0% |
Housing Finances in Apex
Median Income by Occupancy in Apex
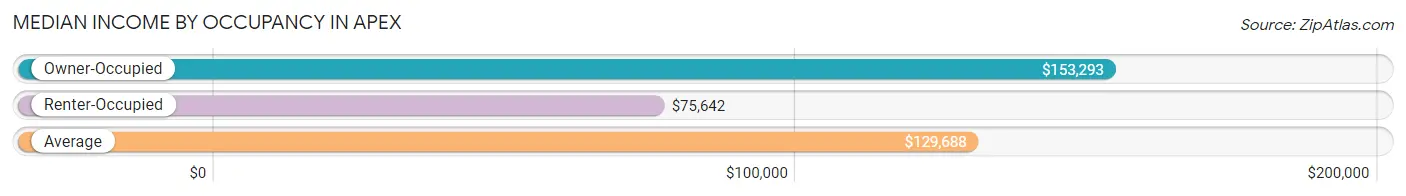
| Occupancy Type | # Households | Median Income |
| Owner-Occupied | 17,282 (75.2%) | $153,293 |
| Renter-Occupied | 5,683 (24.7%) | $75,642 |
| Average | 22,965 (100.0%) | $129,688 |
Occupancy by Householder Income Bracket in Apex
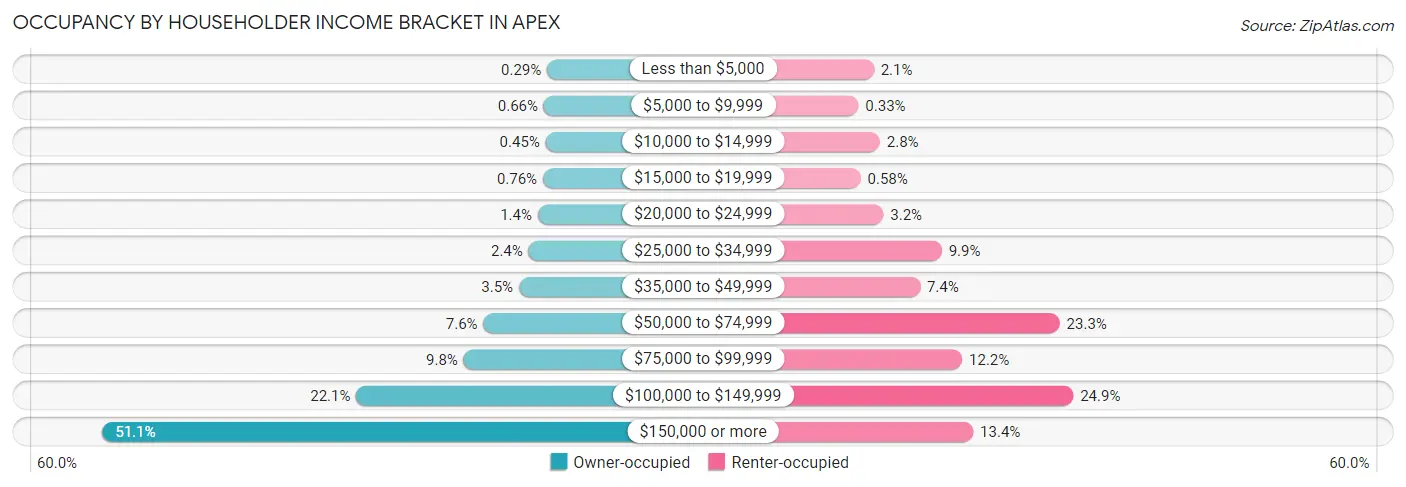
| Income Bracket | Owner-occupied | Renter-occupied |
| Less than $5,000 | 50 (0.3%) | 118 (2.1%) |
| $5,000 to $9,999 | 114 (0.7%) | 19 (0.3%) |
| $10,000 to $14,999 | 77 (0.4%) | 158 (2.8%) |
| $15,000 to $19,999 | 132 (0.8%) | 33 (0.6%) |
| $20,000 to $24,999 | 234 (1.3%) | 181 (3.2%) |
| $25,000 to $34,999 | 415 (2.4%) | 560 (9.9%) |
| $35,000 to $49,999 | 605 (3.5%) | 418 (7.4%) |
| $50,000 to $74,999 | 1,306 (7.6%) | 1,326 (23.3%) |
| $75,000 to $99,999 | 1,697 (9.8%) | 692 (12.2%) |
| $100,000 to $149,999 | 3,818 (22.1%) | 1,414 (24.9%) |
| $150,000 or more | 8,834 (51.1%) | 764 (13.4%) |
| Total | 17,282 (100.0%) | 5,683 (100.0%) |
Monthly Housing Cost Tiers in Apex
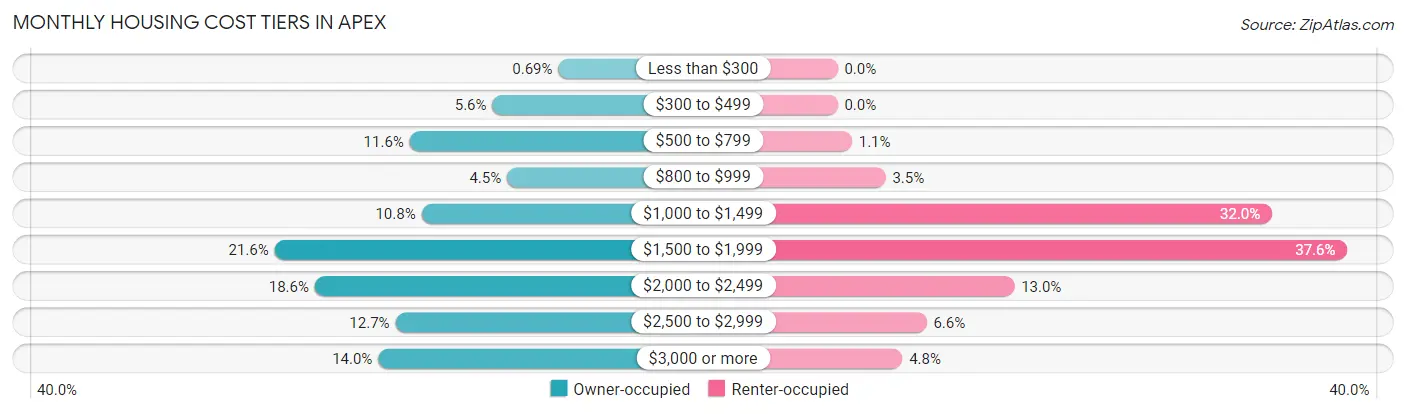
| Monthly Cost | Owner-occupied | Renter-occupied |
| Less than $300 | 120 (0.7%) | 0 (0.0%) |
| $300 to $499 | 959 (5.6%) | 0 (0.0%) |
| $500 to $799 | 2,012 (11.6%) | 60 (1.1%) |
| $800 to $999 | 773 (4.5%) | 201 (3.5%) |
| $1,000 to $1,499 | 1,861 (10.8%) | 1,819 (32.0%) |
| $1,500 to $1,999 | 3,731 (21.6%) | 2,134 (37.6%) |
| $2,000 to $2,499 | 3,220 (18.6%) | 740 (13.0%) |
| $2,500 to $2,999 | 2,193 (12.7%) | 373 (6.6%) |
| $3,000 or more | 2,413 (14.0%) | 271 (4.8%) |
| Total | 17,282 (100.0%) | 5,683 (100.0%) |
Physical Housing Characteristics in Apex
Housing Structures in Apex
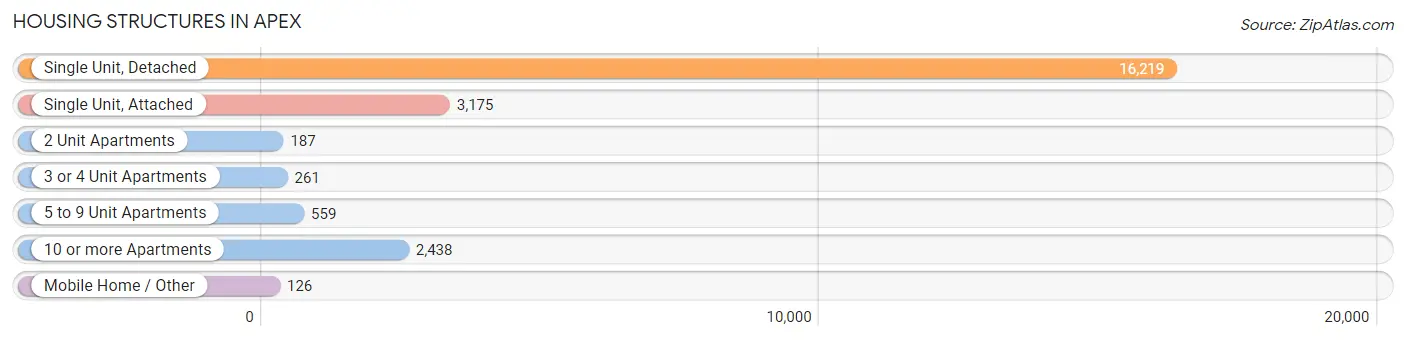
| Structure Type | # Housing Units | % Housing Units |
| Single Unit, Detached | 16,219 | 70.6% |
| Single Unit, Attached | 3,175 | 13.8% |
| 2 Unit Apartments | 187 | 0.8% |
| 3 or 4 Unit Apartments | 261 | 1.1% |
| 5 to 9 Unit Apartments | 559 | 2.4% |
| 10 or more Apartments | 2,438 | 10.6% |
| Mobile Home / Other | 126 | 0.5% |
| Total | 22,965 | 100.0% |
Housing Structures by Occupancy in Apex
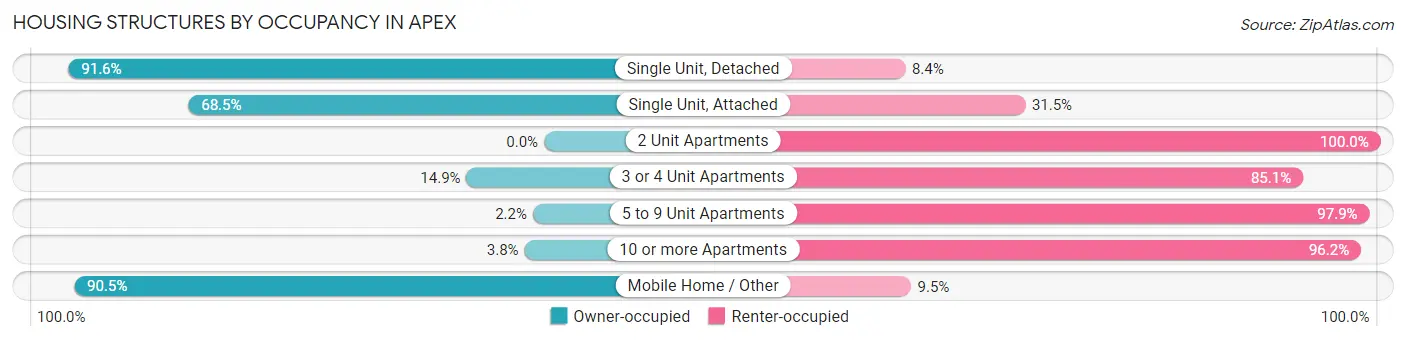
| Structure Type | Owner-occupied | Renter-occupied |
| Single Unit, Detached | 14,851 (91.6%) | 1,368 (8.4%) |
| Single Unit, Attached | 2,174 (68.5%) | 1,001 (31.5%) |
| 2 Unit Apartments | 0 (0.0%) | 187 (100.0%) |
| 3 or 4 Unit Apartments | 39 (14.9%) | 222 (85.1%) |
| 5 to 9 Unit Apartments | 12 (2.1%) | 547 (97.9%) |
| 10 or more Apartments | 92 (3.8%) | 2,346 (96.2%) |
| Mobile Home / Other | 114 (90.5%) | 12 (9.5%) |
| Total | 17,282 (75.2%) | 5,683 (24.7%) |
Housing Structures by Number of Rooms in Apex
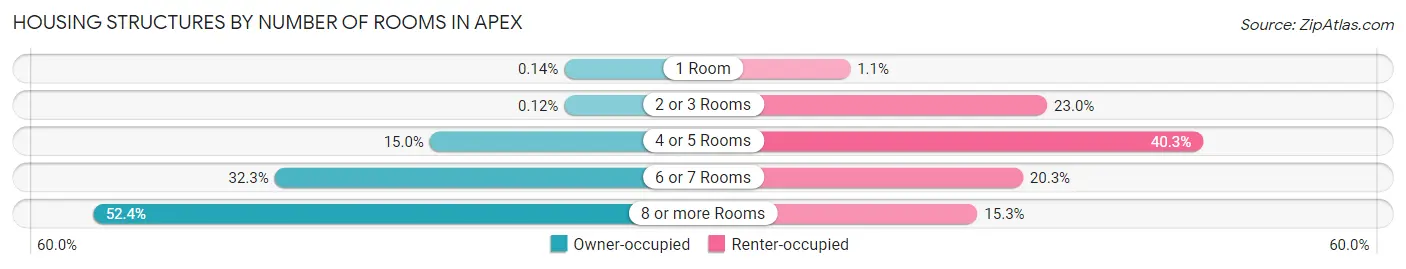
| Number of Rooms | Owner-occupied | Renter-occupied |
| 1 Room | 24 (0.1%) | 65 (1.1%) |
| 2 or 3 Rooms | 21 (0.1%) | 1,307 (23.0%) |
| 4 or 5 Rooms | 2,599 (15.0%) | 2,290 (40.3%) |
| 6 or 7 Rooms | 5,576 (32.3%) | 1,154 (20.3%) |
| 8 or more Rooms | 9,062 (52.4%) | 867 (15.3%) |
| Total | 17,282 (100.0%) | 5,683 (100.0%) |
Housing Structure by Heating Type in Apex
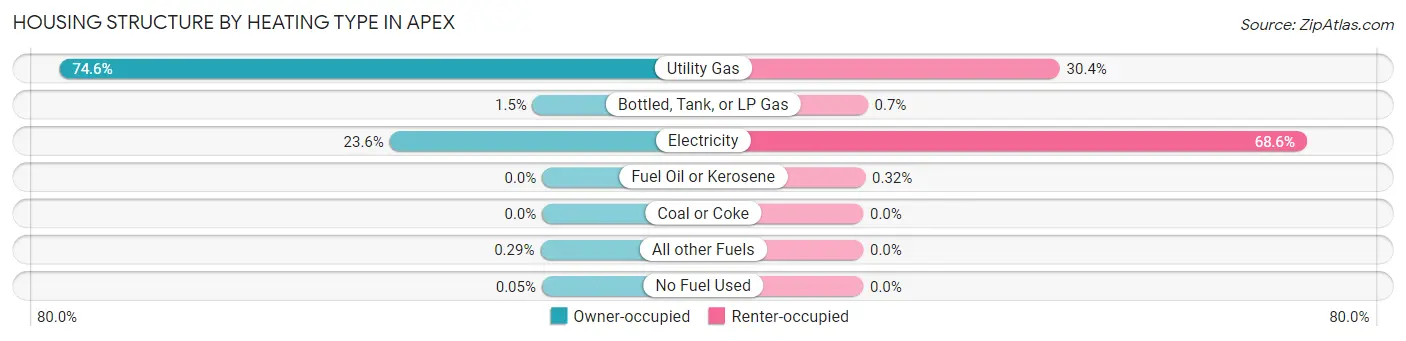
| Heating Type | Owner-occupied | Renter-occupied |
| Utility Gas | 12,897 (74.6%) | 1,727 (30.4%) |
| Bottled, Tank, or LP Gas | 253 (1.5%) | 40 (0.7%) |
| Electricity | 4,073 (23.6%) | 3,898 (68.6%) |
| Fuel Oil or Kerosene | 0 (0.0%) | 18 (0.3%) |
| Coal or Coke | 0 (0.0%) | 0 (0.0%) |
| All other Fuels | 50 (0.3%) | 0 (0.0%) |
| No Fuel Used | 9 (0.1%) | 0 (0.0%) |
| Total | 17,282 (100.0%) | 5,683 (100.0%) |
Household Vehicle Usage in Apex
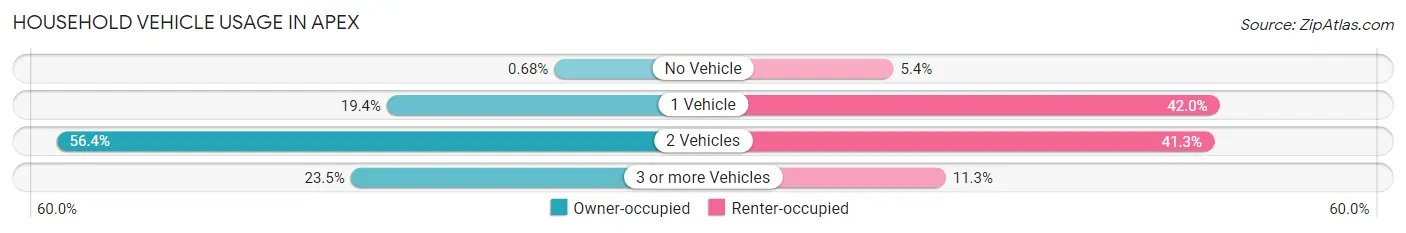
| Vehicles per Household | Owner-occupied | Renter-occupied |
| No Vehicle | 118 (0.7%) | 309 (5.4%) |
| 1 Vehicle | 3,356 (19.4%) | 2,384 (41.9%) |
| 2 Vehicles | 9,748 (56.4%) | 2,348 (41.3%) |
| 3 or more Vehicles | 4,060 (23.5%) | 642 (11.3%) |
| Total | 17,282 (100.0%) | 5,683 (100.0%) |
Real Estate & Mortgages in Apex
Real Estate and Mortgage Overview in Apex
| Characteristic | Without Mortgage | With Mortgage |
| Housing Units | 3,986 | 13,296 |
| Median Property Value | $428,100 | $465,600 |
| Median Household Income | $110,912 | $7,471 |
| Monthly Housing Costs | $641 | $2,413 |
| Real Estate Taxes | $3,351 | $121 |
Property Value by Mortgage Status in Apex
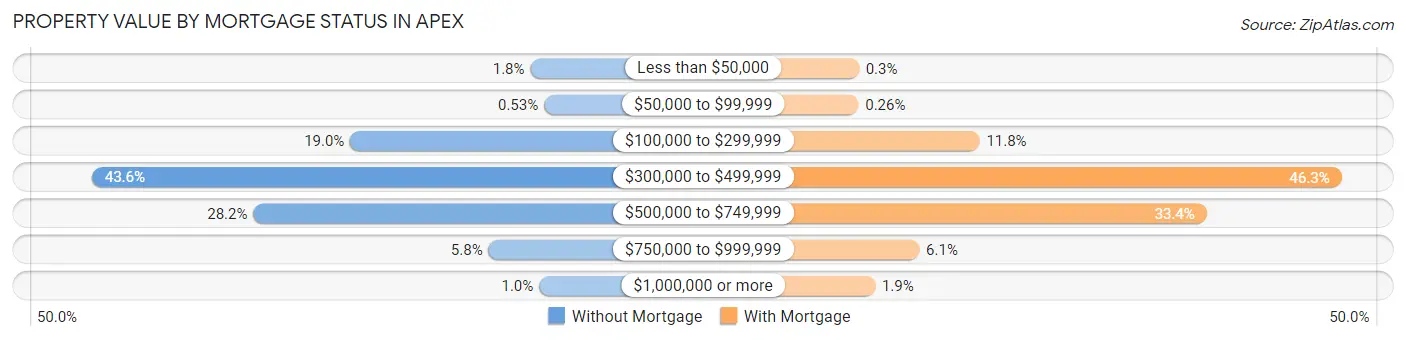
| Property Value | Without Mortgage | With Mortgage |
| Less than $50,000 | 73 (1.8%) | 40 (0.3%) |
| $50,000 to $99,999 | 21 (0.5%) | 34 (0.3%) |
| $100,000 to $299,999 | 757 (19.0%) | 1,569 (11.8%) |
| $300,000 to $499,999 | 1,738 (43.6%) | 6,155 (46.3%) |
| $500,000 to $749,999 | 1,125 (28.2%) | 4,446 (33.4%) |
| $750,000 to $999,999 | 232 (5.8%) | 806 (6.1%) |
| $1,000,000 or more | 40 (1.0%) | 246 (1.8%) |
| Total | 3,986 (100.0%) | 13,296 (100.0%) |
Household Income by Mortgage Status in Apex
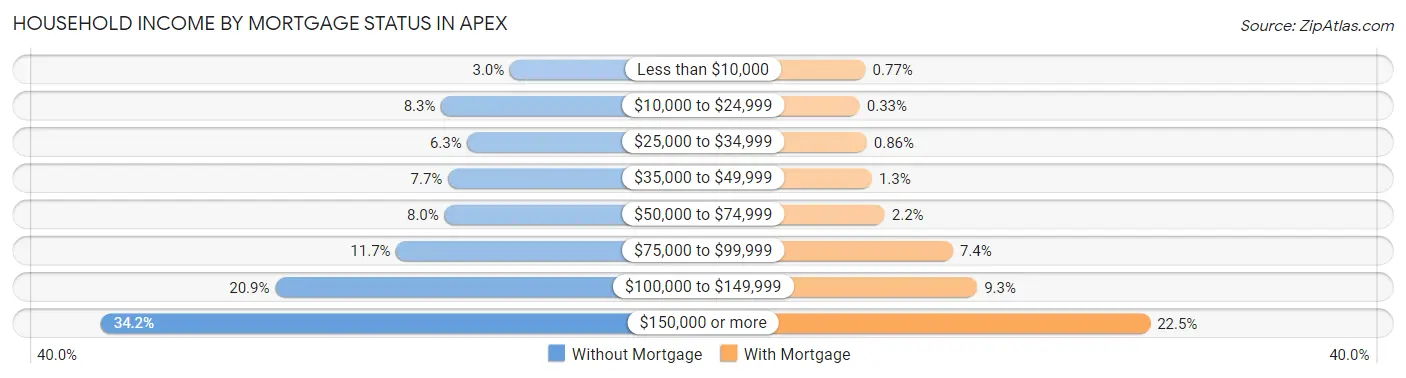
| Household Income | Without Mortgage | With Mortgage |
| Less than $10,000 | 120 (3.0%) | 103 (0.8%) |
| $10,000 to $24,999 | 329 (8.3%) | 44 (0.3%) |
| $25,000 to $34,999 | 249 (6.2%) | 114 (0.9%) |
| $35,000 to $49,999 | 308 (7.7%) | 166 (1.3%) |
| $50,000 to $74,999 | 319 (8.0%) | 297 (2.2%) |
| $75,000 to $99,999 | 465 (11.7%) | 987 (7.4%) |
| $100,000 to $149,999 | 833 (20.9%) | 1,232 (9.3%) |
| $150,000 or more | 1,363 (34.2%) | 2,985 (22.5%) |
| Total | 3,986 (100.0%) | 13,296 (100.0%) |
Property Value to Household Income Ratio in Apex
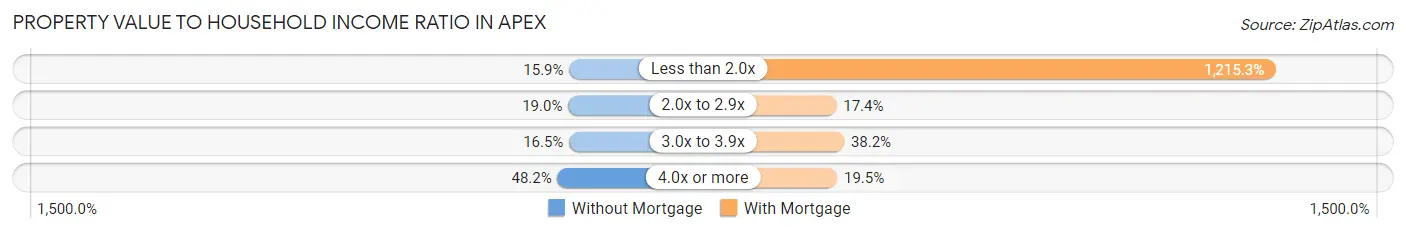
| Value-to-Income Ratio | Without Mortgage | With Mortgage |
| Less than 2.0x | 635 (15.9%) | 161,591 (1,215.3%) |
| 2.0x to 2.9x | 759 (19.0%) | 2,313 (17.4%) |
| 3.0x to 3.9x | 657 (16.5%) | 5,076 (38.2%) |
| 4.0x or more | 1,921 (48.2%) | 2,595 (19.5%) |
| Total | 3,986 (100.0%) | 13,296 (100.0%) |
Real Estate Taxes by Mortgage Status in Apex
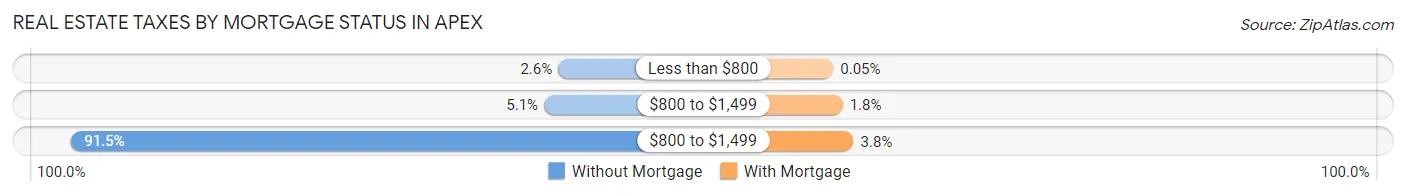
| Property Taxes | Without Mortgage | With Mortgage |
| Less than $800 | 102 (2.6%) | 6 (0.1%) |
| $800 to $1,499 | 205 (5.1%) | 234 (1.8%) |
| $800 to $1,499 | 3,645 (91.4%) | 499 (3.7%) |
| Total | 3,986 (100.0%) | 13,296 (100.0%) |
Health & Disability in Apex
Health Insurance Coverage by Age in Apex
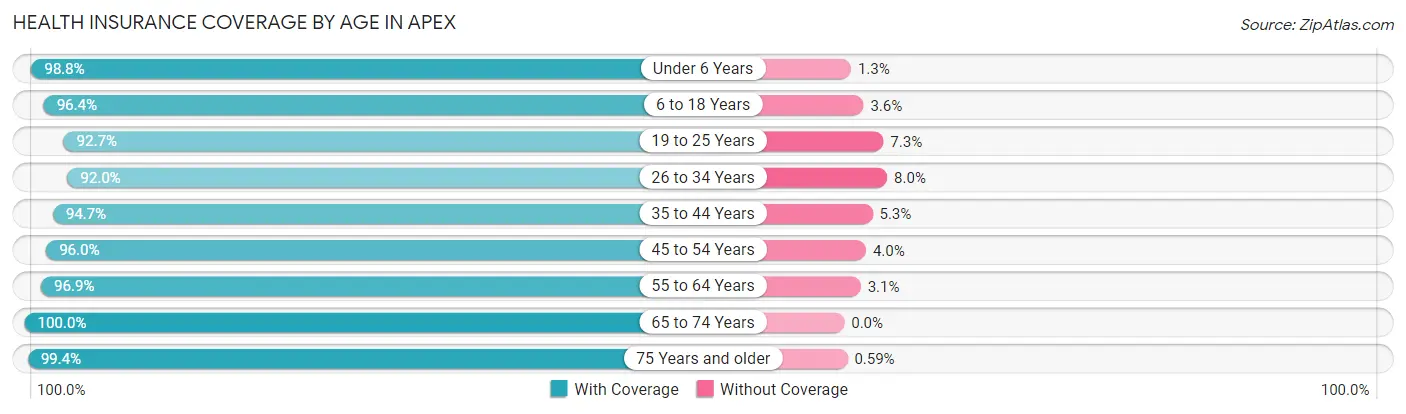
| Age Bracket | With Coverage | Without Coverage |
| Under 6 Years | 5,358 (98.8%) | 68 (1.3%) |
| 6 to 18 Years | 14,042 (96.4%) | 522 (3.6%) |
| 19 to 25 Years | 3,611 (92.7%) | 284 (7.3%) |
| 26 to 34 Years | 7,178 (92.0%) | 623 (8.0%) |
| 35 to 44 Years | 10,884 (94.7%) | 606 (5.3%) |
| 45 to 54 Years | 9,686 (96.0%) | 408 (4.0%) |
| 55 to 64 Years | 6,277 (96.9%) | 199 (3.1%) |
| 65 to 74 Years | 3,748 (100.0%) | 0 (0.0%) |
| 75 Years and older | 1,841 (99.4%) | 11 (0.6%) |
| Total | 62,625 (95.8%) | 2,721 (4.2%) |
Health Insurance Coverage by Citizenship Status in Apex
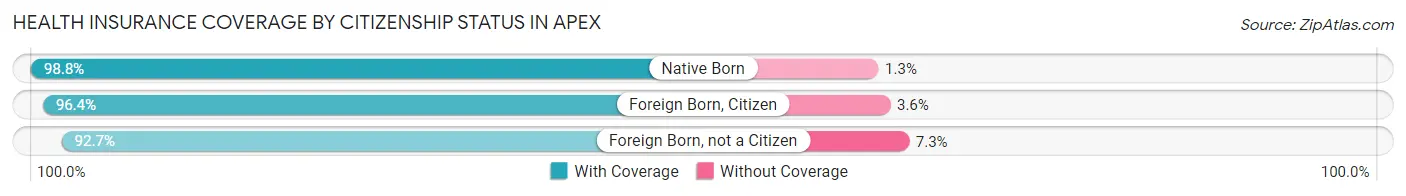
| Citizenship Status | With Coverage | Without Coverage |
| Native Born | 5,358 (98.8%) | 68 (1.3%) |
| Foreign Born, Citizen | 14,042 (96.4%) | 522 (3.6%) |
| Foreign Born, not a Citizen | 3,611 (92.7%) | 284 (7.3%) |
Health Insurance Coverage by Household Income in Apex
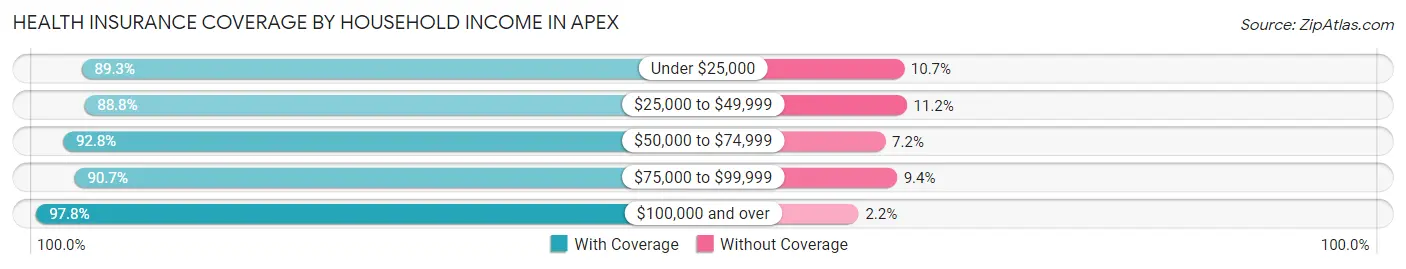
| Household Income | With Coverage | Without Coverage |
| Under $25,000 | 1,771 (89.3%) | 212 (10.7%) |
| $25,000 to $49,999 | 3,666 (88.8%) | 462 (11.2%) |
| $50,000 to $74,999 | 4,594 (92.8%) | 356 (7.2%) |
| $75,000 to $99,999 | 6,400 (90.6%) | 660 (9.3%) |
| $100,000 and over | 46,154 (97.8%) | 1,031 (2.2%) |
Public vs Private Health Insurance Coverage by Age in Apex
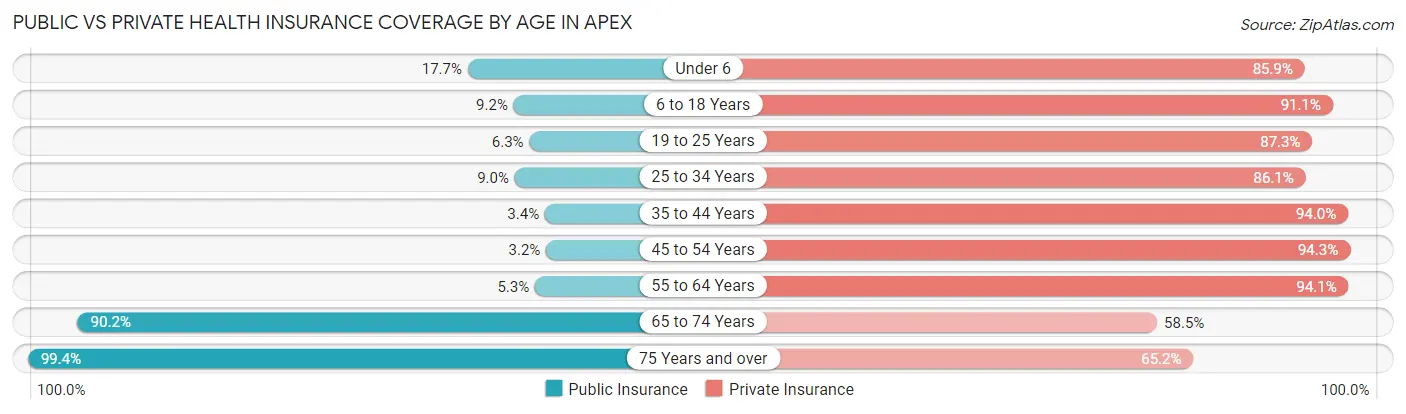
| Age Bracket | Public Insurance | Private Insurance |
| Under 6 | 962 (17.7%) | 4,662 (85.9%) |
| 6 to 18 Years | 1,341 (9.2%) | 13,271 (91.1%) |
| 19 to 25 Years | 245 (6.3%) | 3,401 (87.3%) |
| 25 to 34 Years | 703 (9.0%) | 6,715 (86.1%) |
| 35 to 44 Years | 392 (3.4%) | 10,797 (94.0%) |
| 45 to 54 Years | 321 (3.2%) | 9,521 (94.3%) |
| 55 to 64 Years | 340 (5.2%) | 6,091 (94.1%) |
| 65 to 74 Years | 3,379 (90.1%) | 2,194 (58.5%) |
| 75 Years and over | 1,841 (99.4%) | 1,208 (65.2%) |
| Total | 9,524 (14.6%) | 57,860 (88.5%) |
Disability Status by Sex by Age in Apex
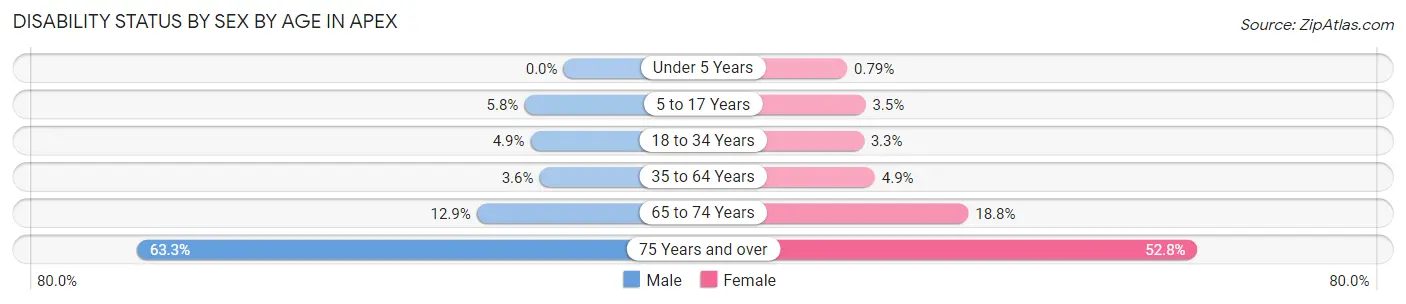
| Age Bracket | Male | Female |
| Under 5 Years | 0 (0.0%) | 14 (0.8%) |
| 5 to 17 Years | 420 (5.8%) | 274 (3.5%) |
| 18 to 34 Years | 290 (4.9%) | 217 (3.3%) |
| 35 to 64 Years | 500 (3.6%) | 691 (4.9%) |
| 65 to 74 Years | 203 (12.9%) | 408 (18.8%) |
| 75 Years and over | 584 (63.3%) | 491 (52.8%) |
Disability Class by Sex by Age in Apex
Disability Class: Hearing Difficulty
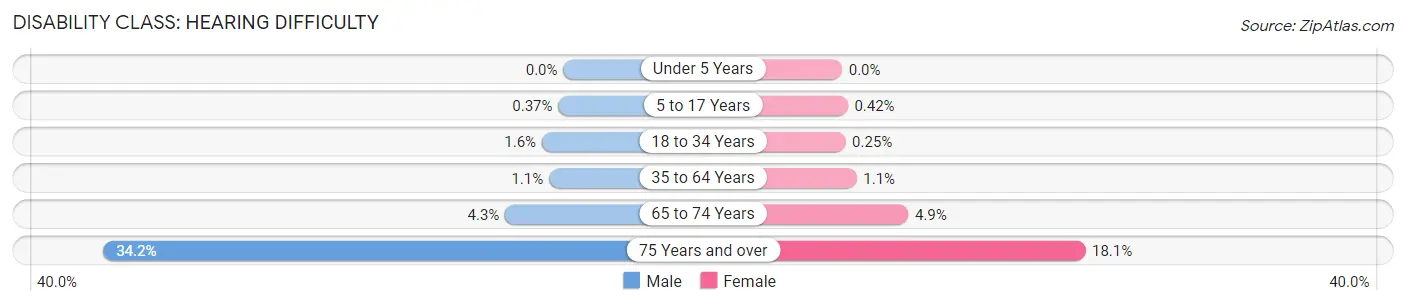
| Age Bracket | Male | Female |
| Under 5 Years | 0 (0.0%) | 0 (0.0%) |
| 5 to 17 Years | 27 (0.4%) | 33 (0.4%) |
| 18 to 34 Years | 94 (1.6%) | 17 (0.3%) |
| 35 to 64 Years | 149 (1.1%) | 152 (1.1%) |
| 65 to 74 Years | 68 (4.3%) | 107 (4.9%) |
| 75 Years and over | 315 (34.2%) | 168 (18.1%) |
Disability Class: Vision Difficulty
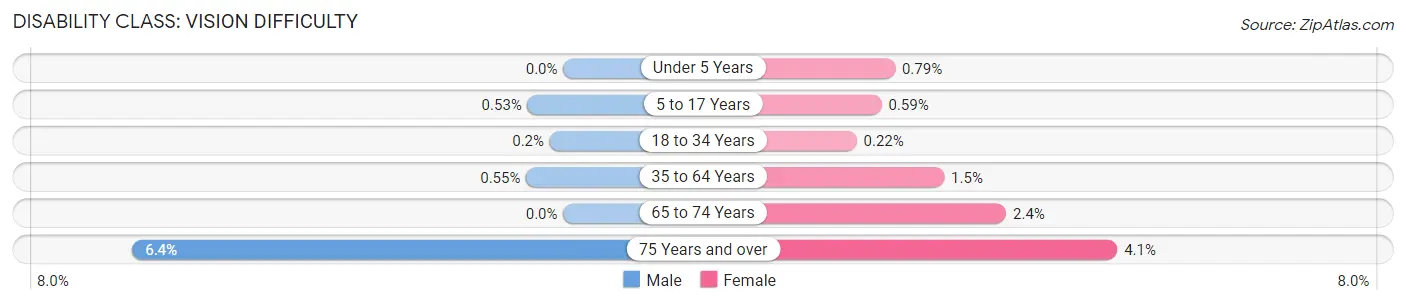
| Age Bracket | Male | Female |
| Under 5 Years | 0 (0.0%) | 14 (0.8%) |
| 5 to 17 Years | 38 (0.5%) | 46 (0.6%) |
| 18 to 34 Years | 12 (0.2%) | 15 (0.2%) |
| 35 to 64 Years | 77 (0.5%) | 214 (1.5%) |
| 65 to 74 Years | 0 (0.0%) | 53 (2.4%) |
| 75 Years and over | 59 (6.4%) | 38 (4.1%) |
Disability Class: Cognitive Difficulty
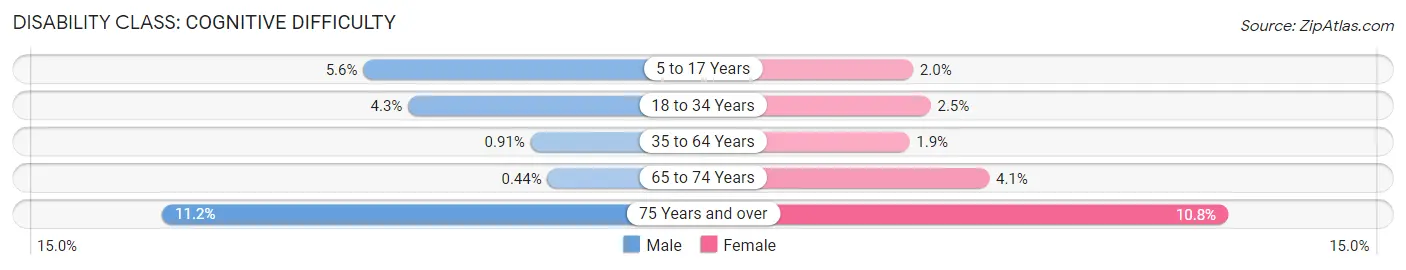
| Age Bracket | Male | Female |
| 5 to 17 Years | 402 (5.6%) | 154 (2.0%) |
| 18 to 34 Years | 255 (4.3%) | 165 (2.5%) |
| 35 to 64 Years | 128 (0.9%) | 264 (1.9%) |
| 65 to 74 Years | 7 (0.4%) | 89 (4.1%) |
| 75 Years and over | 103 (11.2%) | 100 (10.7%) |
Disability Class: Ambulatory Difficulty
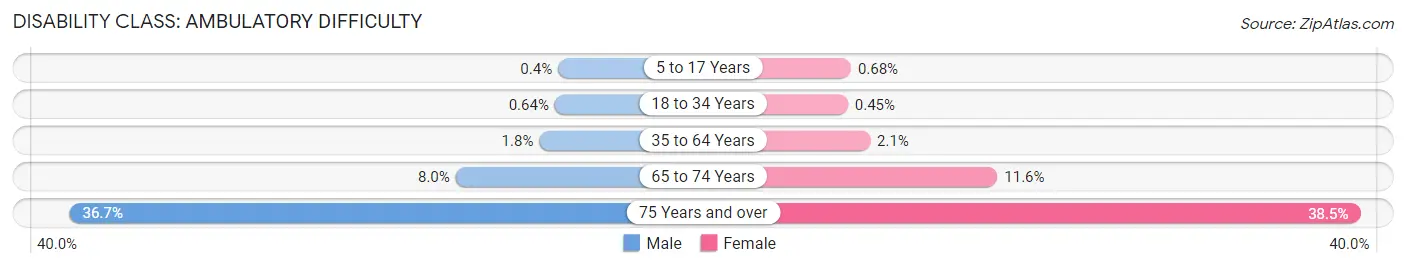
| Age Bracket | Male | Female |
| 5 to 17 Years | 29 (0.4%) | 53 (0.7%) |
| 18 to 34 Years | 38 (0.6%) | 30 (0.4%) |
| 35 to 64 Years | 250 (1.8%) | 296 (2.1%) |
| 65 to 74 Years | 126 (8.0%) | 251 (11.6%) |
| 75 Years and over | 338 (36.7%) | 358 (38.5%) |
Disability Class: Self-Care Difficulty
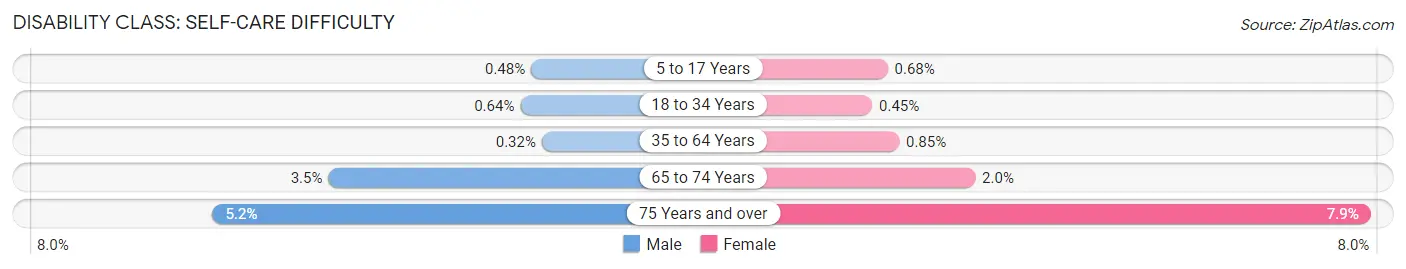
| Age Bracket | Male | Female |
| 5 to 17 Years | 35 (0.5%) | 53 (0.7%) |
| 18 to 34 Years | 38 (0.6%) | 30 (0.4%) |
| 35 to 64 Years | 45 (0.3%) | 119 (0.9%) |
| 65 to 74 Years | 55 (3.5%) | 43 (2.0%) |
| 75 Years and over | 48 (5.2%) | 73 (7.9%) |
Technology Access in Apex
Computing Device Access in Apex
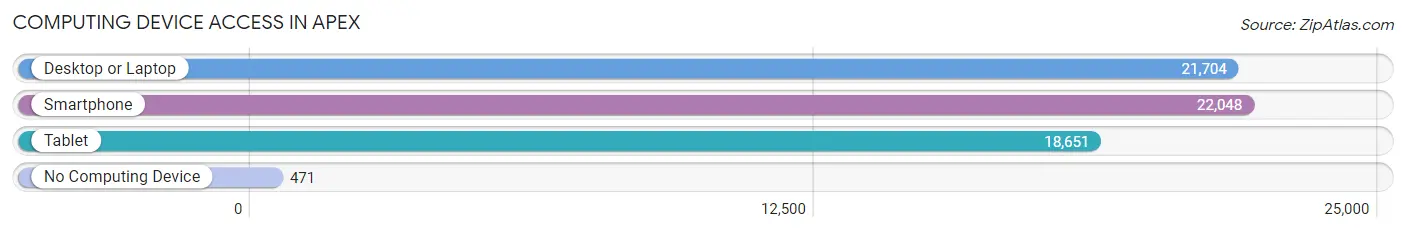
| Device Type | # Households | % Households |
| Desktop or Laptop | 21,704 | 94.5% |
| Smartphone | 22,048 | 96.0% |
| Tablet | 18,651 | 81.2% |
| No Computing Device | 471 | 2.1% |
| Total | 22,965 | 100.0% |
Internet Access in Apex
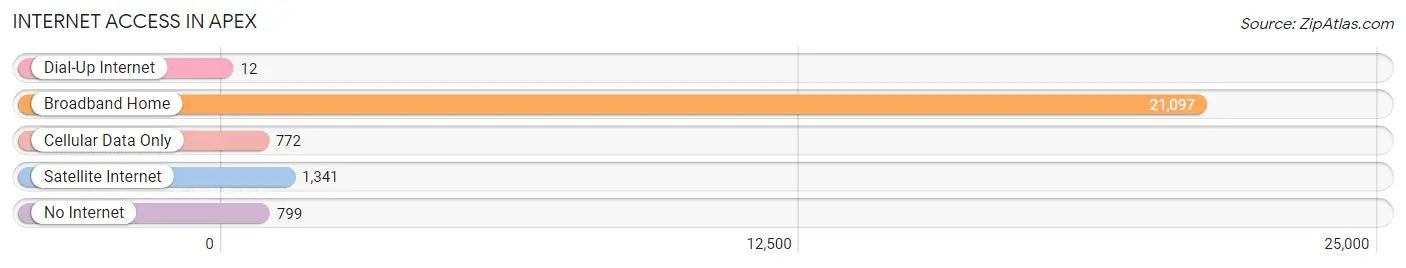
| Internet Type | # Households | % Households |
| Dial-Up Internet | 12 | 0.1% |
| Broadband Home | 21,097 | 91.9% |
| Cellular Data Only | 772 | 3.4% |
| Satellite Internet | 1,341 | 5.8% |
| No Internet | 799 | 3.5% |
| Total | 22,965 | 100.0% |
Apex Summary
Apex, North Carolina is a town located in Wake County, North Carolina. It is part of the Research Triangle metropolitan area and is located approximately 12 miles southwest of Raleigh, the state capital. The town was founded in 1873 and incorporated in 1887. As of the 2010 census, the population of Apex was 37,476, making it the largest town in Wake County.
Geography
Apex is located at 35°43'25" North, 78°51'17" West (35.723862, -78.854720). According to the United States Census Bureau, the town has a total area of 11.2 square miles, of which 11.1 square miles is land and 0.1 square miles is water.
The town is located in the Piedmont region of North Carolina, which is characterized by rolling hills and flat plains. The town is located in the Neuse River Basin, which is part of the larger Cape Fear River Basin. The Neuse River flows through the town and is a major source of drinking water for the area.
Climate
Apex has a humid subtropical climate, with hot, humid summers and mild winters. The average annual temperature is 61.3°F, with an average high of 79.2°F in July and an average low of 43.2°F in January. The average annual precipitation is 44.3 inches, with an average of 4.7 inches of snowfall per year.
Demographics
As of the 2010 census, there were 37,476 people, 13,845 households, and 10,072 families residing in the town. The population density was 3,372.2 people per square mile. The racial makeup of the town was 79.2% White, 11.3% African American, 0.3% Native American, 4.2% Asian, 0.1% Pacific Islander, 2.3% from other races, and 2.6% from two or more races. Hispanic or Latino of any race were 6.7% of the population.
The median income for a household in the town was $71,945, and the median income for a family was $87,811. The per capita income for the town was $33,945. About 4.2% of families and 6.2% of the population were below the poverty line, including 8.2% of those under age 18 and 4.2% of those age 65 or over.
Economy
Apex is home to a variety of businesses, including technology, manufacturing, and retail. The town is home to several large employers, including IBM, SAS Institute, and WakeMed Health & Hospitals. The town is also home to several smaller businesses, including restaurants, shops, and professional services.
The town is served by the Research Triangle Park, which is located approximately 20 miles away in Durham. The park is home to over 200 companies, including IBM, Cisco Systems, and GlaxoSmithKline.
Education
Apex is served by the Wake County Public School System. The town is home to several public schools, including Apex High School, Apex Middle School, and Apex Elementary School. The town is also home to several private schools, including Apex Academy and Apex Christian School.
The town is also home to Wake Technical Community College, which offers a variety of associate degree and certificate programs. The college also offers a variety of continuing education courses and workshops.
Conclusion
Apex, North Carolina is a town located in Wake County, North Carolina. It is part of the Research Triangle metropolitan area and is located approximately 12 miles southwest of Raleigh, the state capital. The town was founded in 1873 and incorporated in 1887. As of the 2010 census, the population of Apex was 37,476, making it the largest town in Wake County. The town is located in the Piedmont region of North Carolina and has a humid subtropical climate. The town is home to a variety of businesses, including technology, manufacturing, and retail. The town is served by the Wake County Public School System and Wake Technical Community College.
Common Questions
What is Per Capita Income in Apex?
Per Capita income in Apex is $55,896.
What is the Median Family Income in Apex?
Median Family Income in Apex is $149,319.
What is the Median Household income in Apex?
Median Household Income in Apex is $129,688.
What is Income or Wage Gap in Apex?
Income or Wage Gap in Apex is 37.3%.
Women in Apex earn 62.7 cents for every dollar earned by a man.
What is Inequality or Gini Index in Apex?
Inequality or Gini Index in Apex is 0.39.
What is the Total Population of Apex?
Total Population of Apex is 65,541.
What is the Total Male Population of Apex?
Total Male Population of Apex is 32,033.
What is the Total Female Population of Apex?
Total Female Population of Apex is 33,508.
What is the Ratio of Males per 100 Females in Apex?
There are 95.60 Males per 100 Females in Apex.
What is the Ratio of Females per 100 Males in Apex?
There are 104.60 Females per 100 Males in Apex.
What is the Median Population Age in Apex?
Median Population Age in Apex is 35.9 Years.
What is the Average Family Size in Apex
Average Family Size in Apex is 3.3 People.
What is the Average Household Size in Apex
Average Household Size in Apex is 2.9 People.
How Large is the Labor Force in Apex?
There are 35,850 People in the Labor Forcein in Apex.
What is the Percentage of People in the Labor Force in Apex?
73.7% of People are in the Labor Force in Apex.
What is the Unemployment Rate in Apex?
Unemployment Rate in Apex is 4.1%.