Cut Bank, MT Map & Demographics
Cut Bank Map
Cut Bank Overview
$22,232
PER CAPITA INCOME
$53,697
AVG FAMILY INCOME
$41,759
AVG HOUSEHOLD INCOME
22.7%
WAGE / INCOME GAP [ % ]
77.3¢/ $1
WAGE / INCOME GAP [ $ ]
0.42
INEQUALITY / GINI INDEX
3,061
TOTAL POPULATION
1,632
MALE POPULATION
1,429
FEMALE POPULATION
114.21
MALES / 100 FEMALES
87.56
FEMALES / 100 MALES
37.8
MEDIAN AGE
3.3
AVG FAMILY SIZE
2.6
AVG HOUSEHOLD SIZE
1,072
LABOR FORCE [ PEOPLE ]
50.6%
PERCENT IN LABOR FORCE
2.6%
UNEMPLOYMENT RATE
Cut Bank Zip Codes
Cut Bank Area Codes
Income in Cut Bank
Income Overview in Cut Bank
Per Capita Income in Cut Bank is $22,232, while median incomes of families and households are $53,697 and $41,759 respectively.
| Characteristic | Number | Measure |
| Per Capita Income | 3,061 | $22,232 |
| Median Family Income | 755 | $53,697 |
| Mean Family Income | 755 | $62,725 |
| Median Household Income | 1,168 | $41,759 |
| Mean Household Income | 1,168 | $54,917 |
| Income Deficit | 755 | $0 |
| Wage / Income Gap (%) | 3,061 | 22.75% |
| Wage / Income Gap ($) | 3,061 | 77.25¢ per $1 |
| Gini / Inequality Index | 3,061 | 0.42 |
Earnings by Sex in Cut Bank
Average Earnings in Cut Bank are $37,938, $38,996 for men and $30,125 for women, a difference of 22.8%.
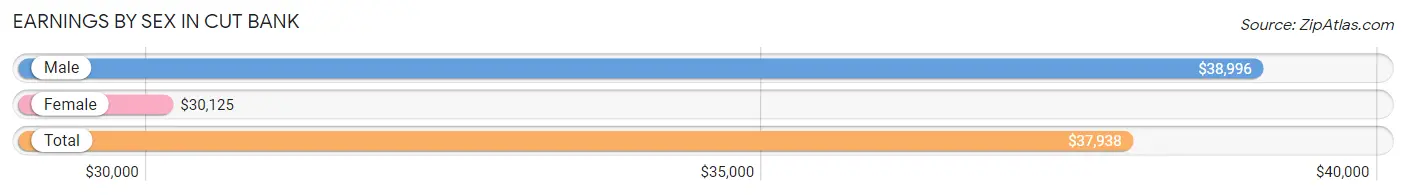
| Sex | Number | Average Earnings |
| Male | 595 (49.8%) | $38,996 |
| Female | 599 (50.2%) | $30,125 |
| Total | 1,194 (100.0%) | $37,938 |
Earnings by Sex by Income Bracket in Cut Bank
The most common earnings brackets in Cut Bank are $35,000 to $39,999 for men (114 | 19.2%) and $5,000 to $7,499 for women (83 | 13.9%).
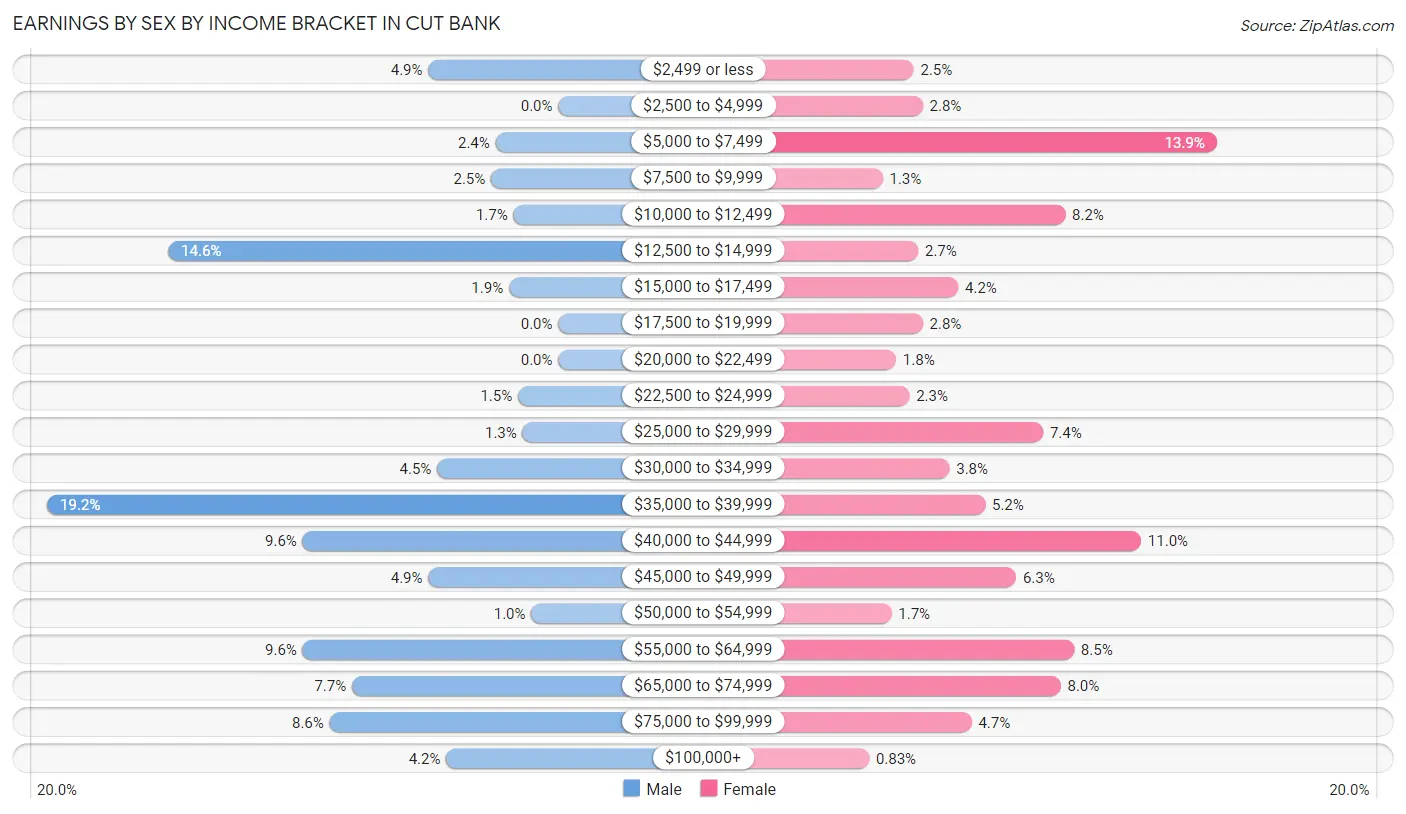
| Income | Male | Female |
| $2,499 or less | 29 (4.9%) | 15 (2.5%) |
| $2,500 to $4,999 | 0 (0.0%) | 17 (2.8%) |
| $5,000 to $7,499 | 14 (2.4%) | 83 (13.9%) |
| $7,500 to $9,999 | 15 (2.5%) | 8 (1.3%) |
| $10,000 to $12,499 | 10 (1.7%) | 49 (8.2%) |
| $12,500 to $14,999 | 87 (14.6%) | 16 (2.7%) |
| $15,000 to $17,499 | 11 (1.8%) | 25 (4.2%) |
| $17,500 to $19,999 | 0 (0.0%) | 17 (2.8%) |
| $20,000 to $22,499 | 0 (0.0%) | 11 (1.8%) |
| $22,500 to $24,999 | 9 (1.5%) | 14 (2.3%) |
| $25,000 to $29,999 | 8 (1.3%) | 44 (7.3%) |
| $30,000 to $34,999 | 27 (4.5%) | 23 (3.8%) |
| $35,000 to $39,999 | 114 (19.2%) | 31 (5.2%) |
| $40,000 to $44,999 | 57 (9.6%) | 66 (11.0%) |
| $45,000 to $49,999 | 29 (4.9%) | 38 (6.3%) |
| $50,000 to $54,999 | 6 (1.0%) | 10 (1.7%) |
| $55,000 to $64,999 | 57 (9.6%) | 51 (8.5%) |
| $65,000 to $74,999 | 46 (7.7%) | 48 (8.0%) |
| $75,000 to $99,999 | 51 (8.6%) | 28 (4.7%) |
| $100,000+ | 25 (4.2%) | 5 (0.8%) |
| Total | 595 (100.0%) | 599 (100.0%) |
Earnings by Sex by Educational Attainment in Cut Bank
Average earnings in Cut Bank are $40,086 for men and $32,981 for women, a difference of 17.7%. Men with an educational attainment of graduate degree enjoy the highest average annual earnings of $75,909, while those with bachelor's degree education earn the least with $30,469. Women with an educational attainment of graduate degree earn the most with the average annual earnings of $49,583, while those with college or associate's degree education have the smallest earnings of $15,667.
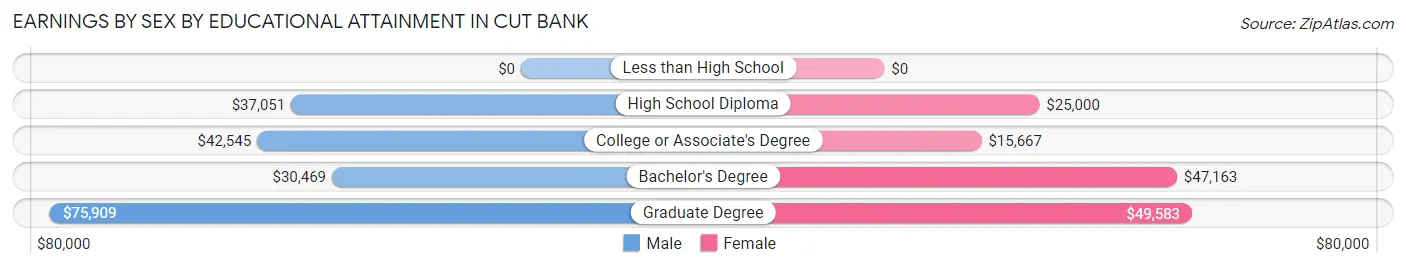
| Educational Attainment | Male Income | Female Income |
| Less than High School | - | - |
| High School Diploma | $37,051 | $25,000 |
| College or Associate's Degree | $42,545 | $15,667 |
| Bachelor's Degree | $30,469 | $47,163 |
| Graduate Degree | $75,909 | $49,583 |
| Total | $40,086 | $32,981 |
Family Income in Cut Bank
Family Income Brackets in Cut Bank
According to the Cut Bank family income data, there are 175 families falling into the $50,000 to $74,999 income range, which is the most common income bracket and makes up 23.2% of all families. Conversely, the $200,000+ income bracket is the least frequent group with only 14 families (1.8%) belonging to this category.
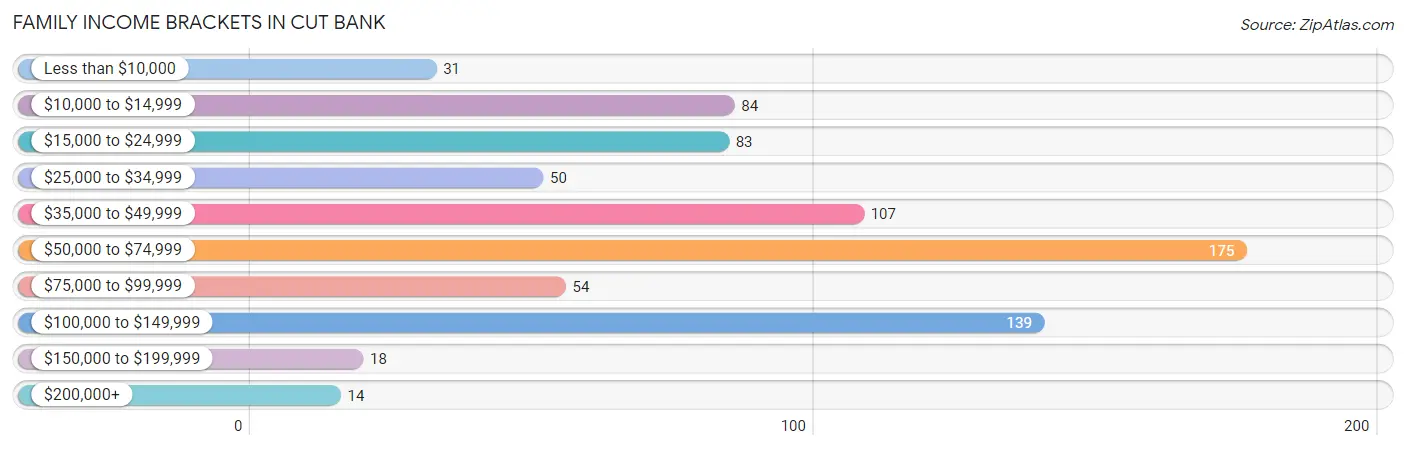
| Income Bracket | # Families | % Families |
| Less than $10,000 | 31 | 4.1% |
| $10,000 to $14,999 | 84 | 11.1% |
| $15,000 to $24,999 | 83 | 11.0% |
| $25,000 to $34,999 | 50 | 6.6% |
| $35,000 to $49,999 | 107 | 14.2% |
| $50,000 to $74,999 | 175 | 23.2% |
| $75,000 to $99,999 | 54 | 7.2% |
| $100,000 to $149,999 | 139 | 18.4% |
| $150,000 to $199,999 | 18 | 2.4% |
| $200,000+ | 14 | 1.9% |
Family Income by Famaliy Size in Cut Bank
2-person families (343 | 45.4%) account for the highest median family income in Cut Bank with $66,767 per family, while 2-person families (343 | 45.4%) have the highest median income of $33,384 per family member.
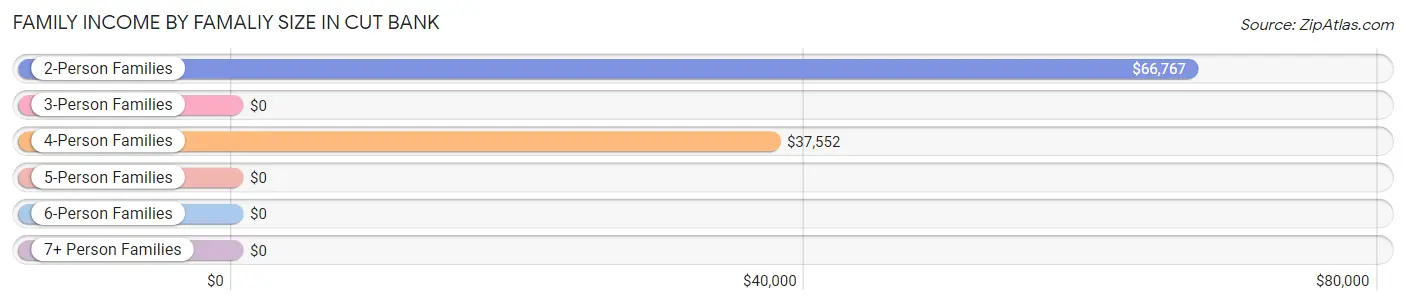
| Income Bracket | # Families | Median Income |
| 2-Person Families | 343 (45.4%) | $66,767 |
| 3-Person Families | 225 (29.8%) | $0 |
| 4-Person Families | 119 (15.8%) | $37,552 |
| 5-Person Families | 57 (7.5%) | $0 |
| 6-Person Families | 0 (0.0%) | $0 |
| 7+ Person Families | 11 (1.5%) | $0 |
| Total | 755 (100.0%) | $53,697 |
Family Income by Number of Earners in Cut Bank
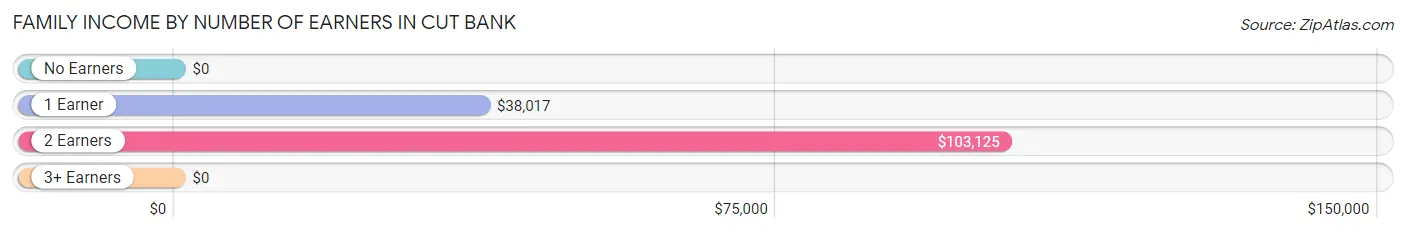
| Number of Earners | # Families | Median Income |
| No Earners | 240 (31.8%) | $0 |
| 1 Earner | 226 (29.9%) | $38,017 |
| 2 Earners | 282 (37.3%) | $103,125 |
| 3+ Earners | 7 (0.9%) | $0 |
| Total | 755 (100.0%) | $53,697 |
Household Income in Cut Bank
Household Income Brackets in Cut Bank
With 227 households falling in the category, the $35,000 to $49,999 income range is the most frequent in Cut Bank, accounting for 19.4% of all households. In contrast, only 14 households (1.2%) fall into the $200,000+ income bracket, making it the least populous group.
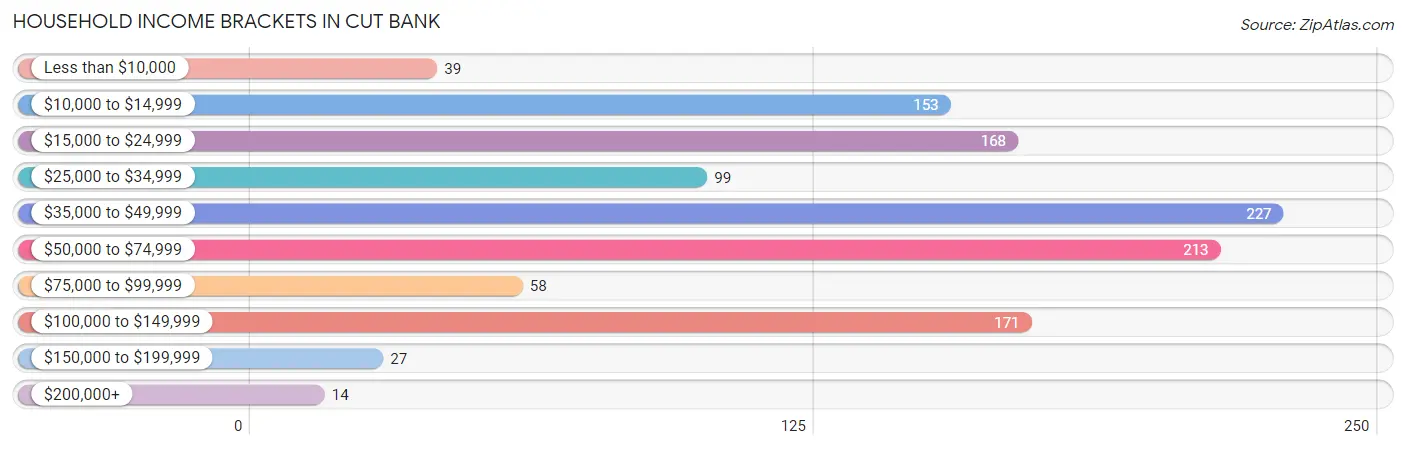
| Income Bracket | # Households | % Households |
| Less than $10,000 | 39 | 3.3% |
| $10,000 to $14,999 | 153 | 13.1% |
| $15,000 to $24,999 | 168 | 14.4% |
| $25,000 to $34,999 | 99 | 8.5% |
| $35,000 to $49,999 | 227 | 19.4% |
| $50,000 to $74,999 | 213 | 18.2% |
| $75,000 to $99,999 | 58 | 5.0% |
| $100,000 to $149,999 | 171 | 14.6% |
| $150,000 to $199,999 | 27 | 2.3% |
| $200,000+ | 14 | 1.2% |
Household Income by Householder Age in Cut Bank
The median household income in Cut Bank is $41,759, with the highest median household income of $47,109 found in the 25 to 44 years age bracket for the primary householder. A total of 389 households (33.3%) fall into this category. Meanwhile, the 15 to 24 years age bracket for the primary householder has the lowest median household income of $0, with 55 households (4.7%) in this group.
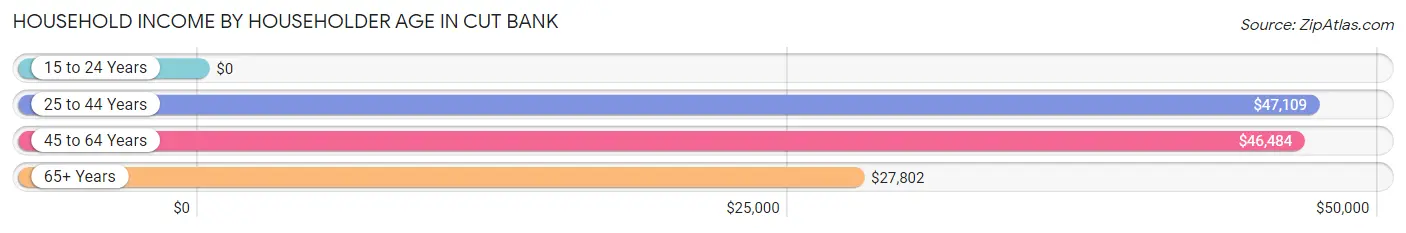
| Income Bracket | # Households | Median Income |
| 15 to 24 Years | 55 (4.7%) | $0 |
| 25 to 44 Years | 389 (33.3%) | $47,109 |
| 45 to 64 Years | 457 (39.1%) | $46,484 |
| 65+ Years | 267 (22.9%) | $27,802 |
| Total | 1,168 (100.0%) | $41,759 |
Poverty in Cut Bank
Income Below Poverty by Sex and Age in Cut Bank
With 23.5% poverty level for males and 30.4% for females among the residents of Cut Bank, 16 and 17 year old males and 12 to 14 year old females are the most vulnerable to poverty, with 43 males (72.9%) and 93 females (93.0%) in their respective age groups living below the poverty level.
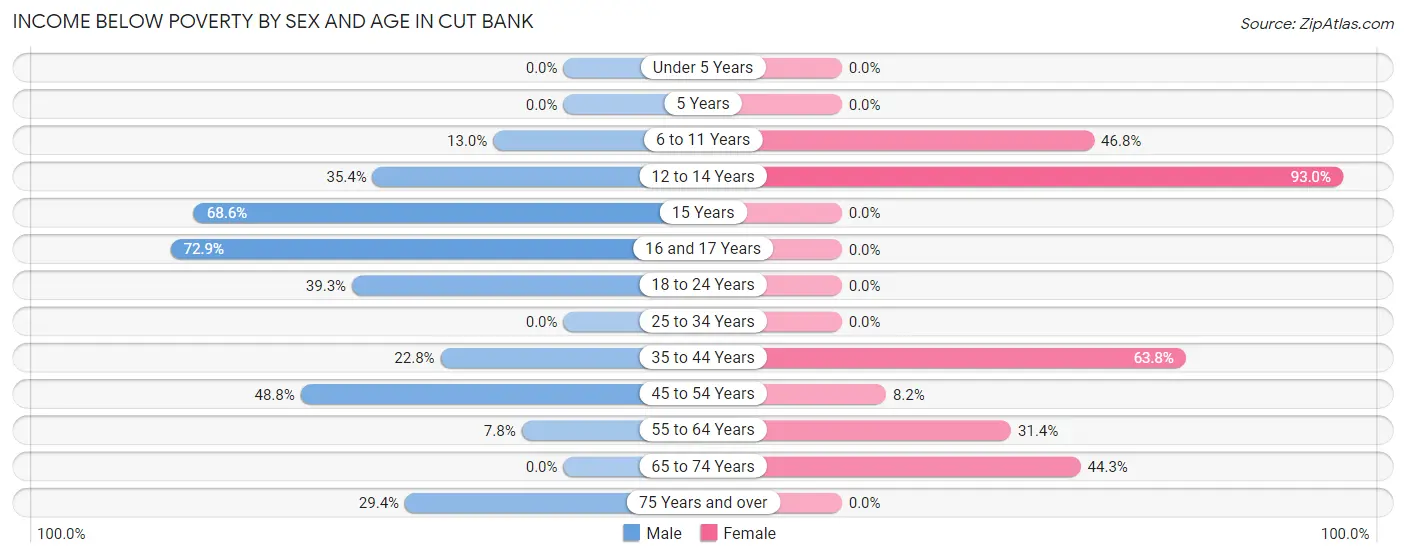
| Age Bracket | Male | Female |
| Under 5 Years | 0 (0.0%) | 0 (0.0%) |
| 5 Years | 0 (0.0%) | 0 (0.0%) |
| 6 to 11 Years | 18 (13.0%) | 74 (46.8%) |
| 12 to 14 Years | 34 (35.4%) | 93 (93.0%) |
| 15 Years | 72 (68.6%) | 0 (0.0%) |
| 16 and 17 Years | 43 (72.9%) | 0 (0.0%) |
| 18 to 24 Years | 42 (39.3%) | 0 (0.0%) |
| 25 to 34 Years | 0 (0.0%) | 0 (0.0%) |
| 35 to 44 Years | 47 (22.8%) | 120 (63.8%) |
| 45 to 54 Years | 80 (48.8%) | 15 (8.2%) |
| 55 to 64 Years | 15 (7.8%) | 77 (31.4%) |
| 65 to 74 Years | 0 (0.0%) | 47 (44.3%) |
| 75 Years and over | 25 (29.4%) | 0 (0.0%) |
| Total | 376 (23.5%) | 426 (30.4%) |
Income Above Poverty by Sex and Age in Cut Bank
According to the poverty statistics in Cut Bank, males aged under 5 years and females aged under 5 years are the age groups that are most secure financially, with 100.0% of males and 100.0% of females in these age groups living above the poverty line.
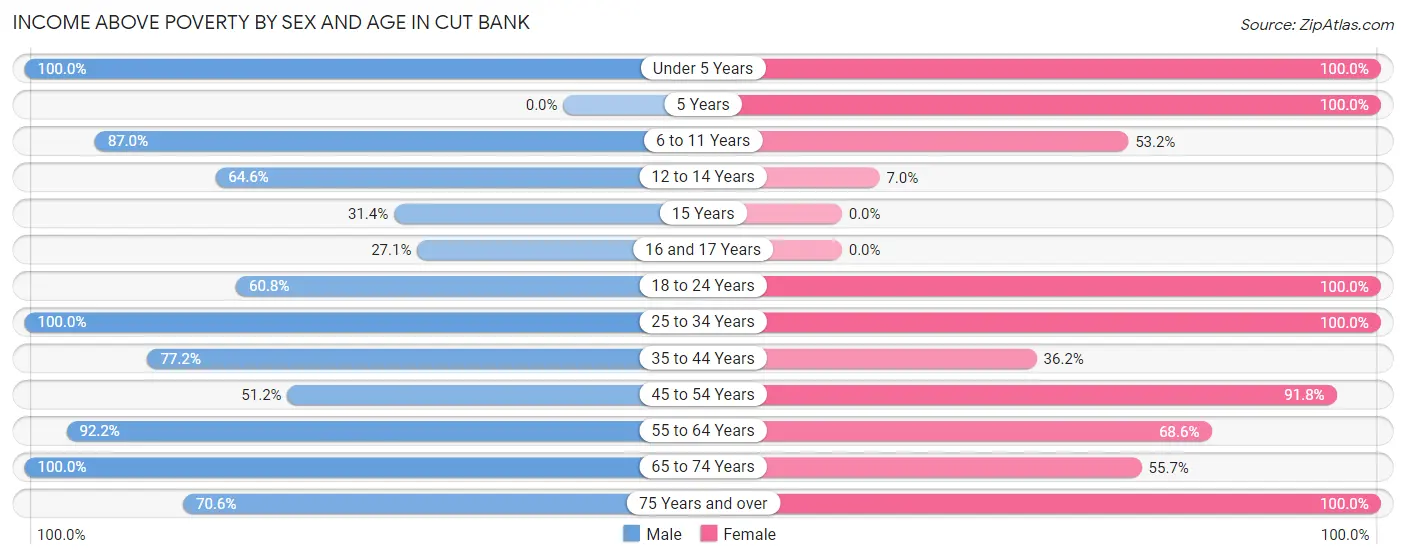
| Age Bracket | Male | Female |
| Under 5 Years | 247 (100.0%) | 54 (100.0%) |
| 5 Years | 0 (0.0%) | 45 (100.0%) |
| 6 to 11 Years | 120 (87.0%) | 84 (53.2%) |
| 12 to 14 Years | 62 (64.6%) | 7 (7.0%) |
| 15 Years | 33 (31.4%) | 0 (0.0%) |
| 16 and 17 Years | 16 (27.1%) | 0 (0.0%) |
| 18 to 24 Years | 65 (60.8%) | 48 (100.0%) |
| 25 to 34 Years | 75 (100.0%) | 181 (100.0%) |
| 35 to 44 Years | 159 (77.2%) | 68 (36.2%) |
| 45 to 54 Years | 84 (51.2%) | 168 (91.8%) |
| 55 to 64 Years | 178 (92.2%) | 168 (68.6%) |
| 65 to 74 Years | 124 (100.0%) | 59 (55.7%) |
| 75 Years and over | 60 (70.6%) | 92 (100.0%) |
| Total | 1,223 (76.5%) | 974 (69.6%) |
Income Below Poverty Among Married-Couple Families in Cut Bank
The poverty statistics for married-couple families in Cut Bank show that 14.1% or 70 of the total 496 families live below the poverty line. Families with no children have the highest poverty rate of 18.1%, comprising of 55 families. On the other hand, families with 3 or 4 children have the lowest poverty rate of 0.0%, which includes 0 families.
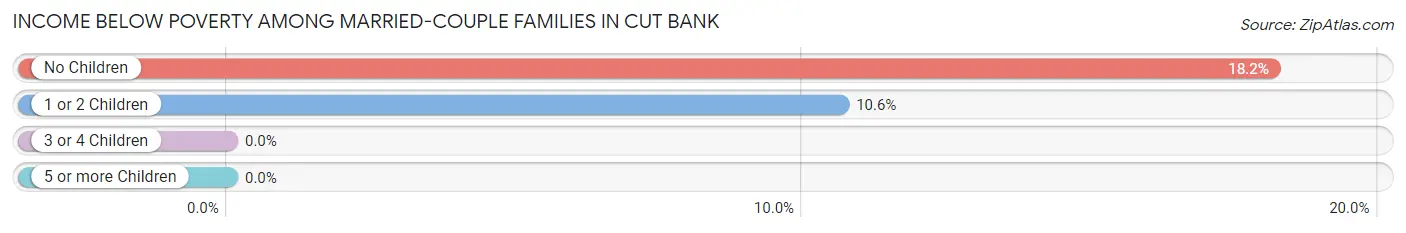
| Children | Above Poverty | Below Poverty |
| No Children | 248 (81.9%) | 55 (18.1%) |
| 1 or 2 Children | 126 (89.4%) | 15 (10.6%) |
| 3 or 4 Children | 41 (100.0%) | 0 (0.0%) |
| 5 or more Children | 11 (100.0%) | 0 (0.0%) |
| Total | 426 (85.9%) | 70 (14.1%) |
Income Below Poverty Among Single-Parent Households in Cut Bank
According to the poverty data in Cut Bank, 46.4% or 39 single-father households and 64.6% or 113 single-mother households are living below the poverty line. Among single-father households, those with 1 or 2 children have the highest poverty rate, with 39 households (66.1%) experiencing poverty. Likewise, among single-mother households, those with 1 or 2 children have the highest poverty rate, with 113 households (66.1%) falling below the poverty line.
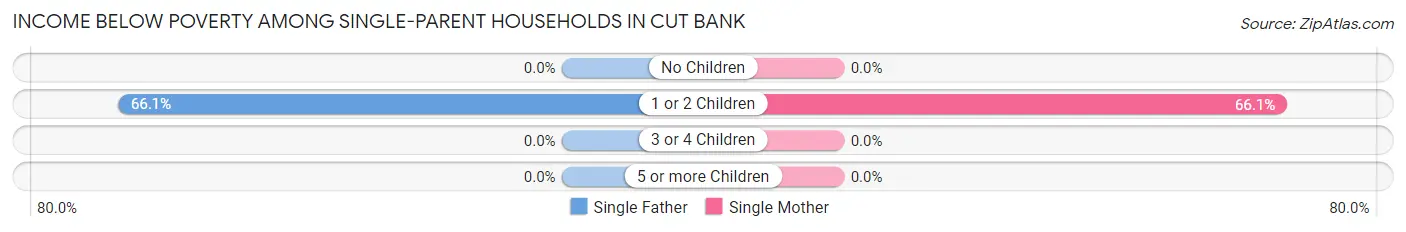
| Children | Single Father | Single Mother |
| No Children | 0 (0.0%) | 0 (0.0%) |
| 1 or 2 Children | 39 (66.1%) | 113 (66.1%) |
| 3 or 4 Children | 0 (0.0%) | 0 (0.0%) |
| 5 or more Children | 0 (0.0%) | 0 (0.0%) |
| Total | 39 (46.4%) | 113 (64.6%) |
Income Below Poverty Among Married-Couple vs Single-Parent Households in Cut Bank
The poverty data for Cut Bank shows that 70 of the married-couple family households (14.1%) and 152 of the single-parent households (58.7%) are living below the poverty level. Within the married-couple family households, those with no children have the highest poverty rate, with 55 households (18.1%) falling below the poverty line. Among the single-parent households, those with 1 or 2 children have the highest poverty rate, with 152 household (66.1%) living below poverty.
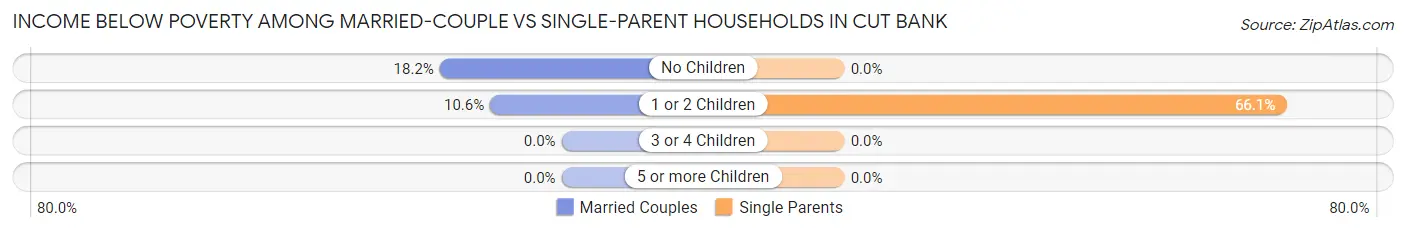
| Children | Married-Couple Families | Single-Parent Households |
| No Children | 55 (18.1%) | 0 (0.0%) |
| 1 or 2 Children | 15 (10.6%) | 152 (66.1%) |
| 3 or 4 Children | 0 (0.0%) | 0 (0.0%) |
| 5 or more Children | 0 (0.0%) | 0 (0.0%) |
| Total | 70 (14.1%) | 152 (58.7%) |
Race in Cut Bank
The most populous races in Cut Bank are White / Caucasian (1,996 | 65.2%), Native / Alaskan (774 | 25.3%), and Two or more Races (236 | 7.7%).
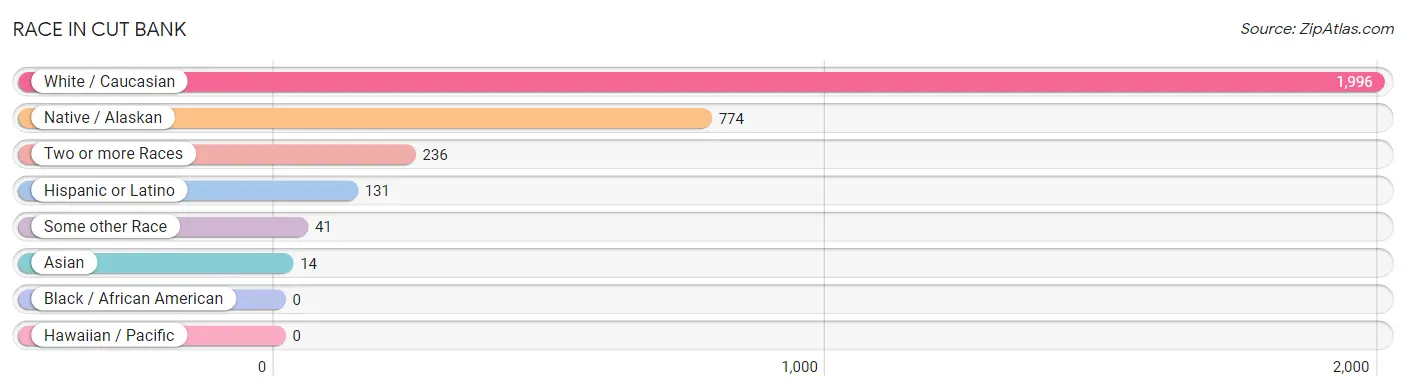
| Race | # Population | % Population |
| Asian | 14 | 0.5% |
| Black / African American | 0 | 0.0% |
| Hawaiian / Pacific | 0 | 0.0% |
| Hispanic or Latino | 131 | 4.3% |
| Native / Alaskan | 774 | 25.3% |
| White / Caucasian | 1,996 | 65.2% |
| Two or more Races | 236 | 7.7% |
| Some other Race | 41 | 1.3% |
| Total | 3,061 | 100.0% |
Ancestry in Cut Bank
The most populous ancestries reported in Cut Bank are German (726 | 23.7%), Blackfeet (549 | 17.9%), Norwegian (341 | 11.1%), Irish (286 | 9.3%), and English (234 | 7.6%), together accounting for 69.8% of all Cut Bank residents.
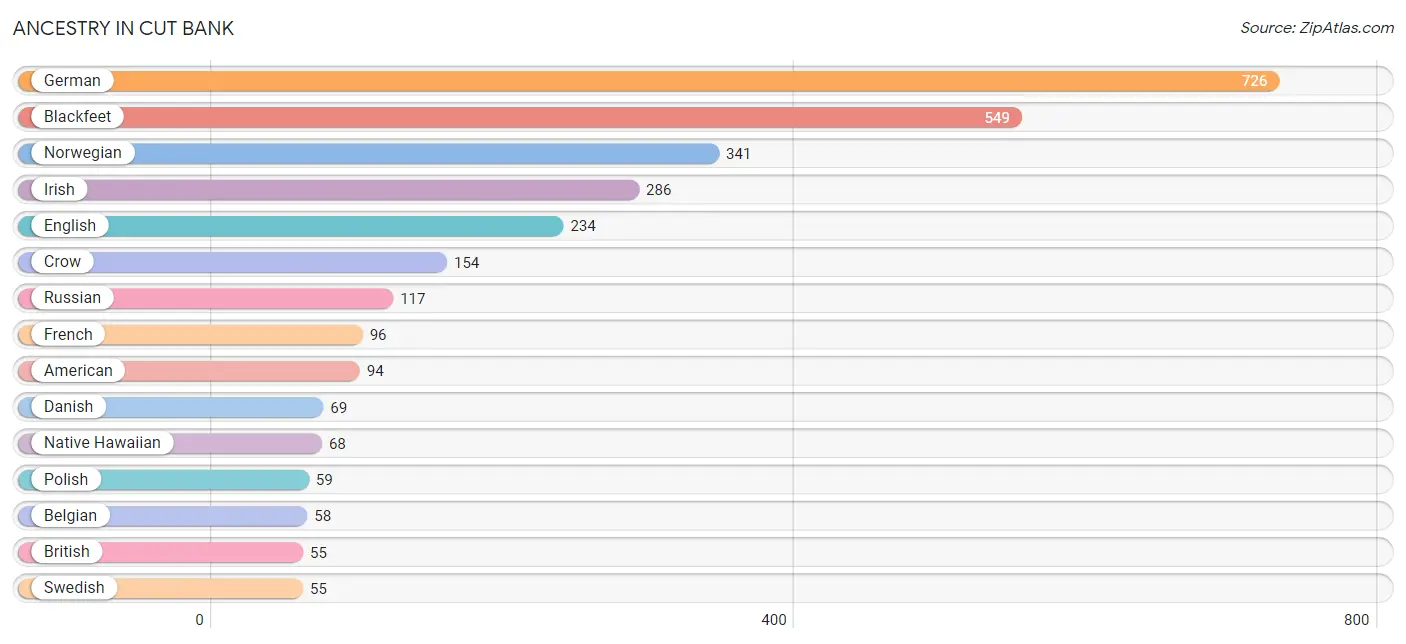
| Ancestry | # Population | % Population |
| American | 94 | 3.1% |
| Apache | 18 | 0.6% |
| Arapaho | 39 | 1.3% |
| Belgian | 58 | 1.9% |
| Blackfeet | 549 | 17.9% |
| British | 55 | 1.8% |
| Burmese | 6 | 0.2% |
| Cherokee | 36 | 1.2% |
| Chippewa | 21 | 0.7% |
| Cree | 13 | 0.4% |
| Crow | 154 | 5.0% |
| Czech | 8 | 0.3% |
| Danish | 69 | 2.2% |
| Dutch | 34 | 1.1% |
| English | 234 | 7.6% |
| French | 96 | 3.1% |
| German | 726 | 23.7% |
| Irish | 286 | 9.3% |
| Italian | 17 | 0.6% |
| Korean | 7 | 0.2% |
| Mexican | 45 | 1.5% |
| Native Hawaiian | 68 | 2.2% |
| Navajo | 30 | 1.0% |
| Northern European | 12 | 0.4% |
| Norwegian | 341 | 11.1% |
| Pakistani | 7 | 0.2% |
| Polish | 59 | 1.9% |
| Puerto Rican | 11 | 0.4% |
| Russian | 117 | 3.8% |
| Scandinavian | 30 | 1.0% |
| Scotch-Irish | 49 | 1.6% |
| Scottish | 21 | 0.7% |
| Sioux | 10 | 0.3% |
| Spaniard | 30 | 1.0% |
| Swedish | 55 | 1.8% | View All 35 Rows |
Immigrants in Cut Bank
The most numerous immigrant groups reported in Cut Bank came from Canada (23 | 0.7%), Asia (14 | 0.5%), South Eastern Asia (14 | 0.5%), England (7 | 0.2%), and Europe (7 | 0.2%), together accounting for 2.1% of all Cut Bank residents.
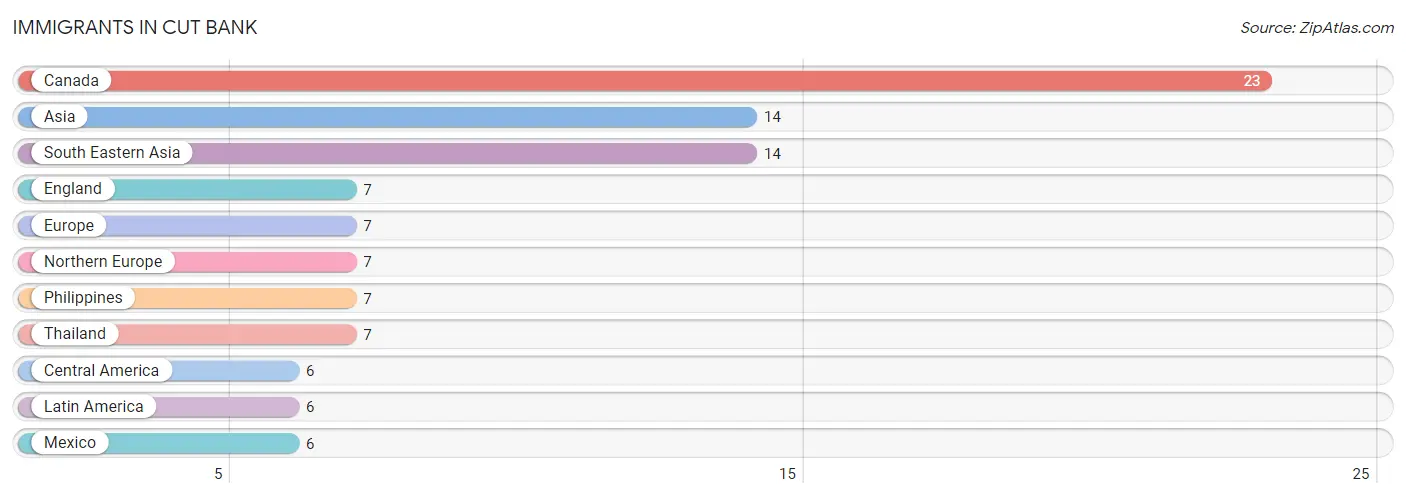
| Immigration Origin | # Population | % Population |
| Asia | 14 | 0.5% |
| Canada | 23 | 0.7% |
| Central America | 6 | 0.2% |
| England | 7 | 0.2% |
| Europe | 7 | 0.2% |
| Latin America | 6 | 0.2% |
| Mexico | 6 | 0.2% |
| Northern Europe | 7 | 0.2% |
| Philippines | 7 | 0.2% |
| South Eastern Asia | 14 | 0.5% |
| Thailand | 7 | 0.2% | View All 11 Rows |
Sex and Age in Cut Bank
Sex and Age in Cut Bank
The most populous age groups in Cut Bank are Under 5 Years (247 | 15.1%) for men and 55 to 59 Years (171 | 12.0%) for women.
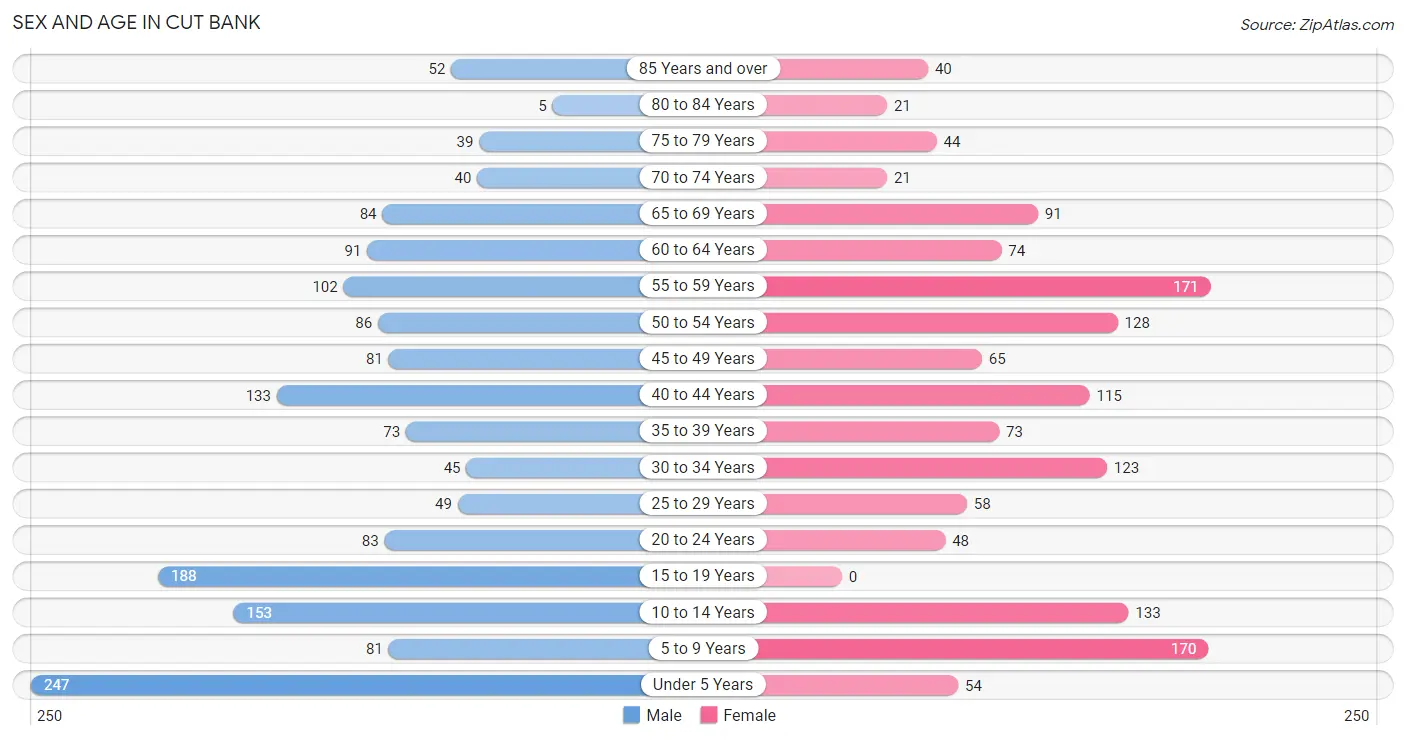
| Age Bracket | Male | Female |
| Under 5 Years | 247 (15.1%) | 54 (3.8%) |
| 5 to 9 Years | 81 (5.0%) | 170 (11.9%) |
| 10 to 14 Years | 153 (9.4%) | 133 (9.3%) |
| 15 to 19 Years | 188 (11.5%) | 0 (0.0%) |
| 20 to 24 Years | 83 (5.1%) | 48 (3.4%) |
| 25 to 29 Years | 49 (3.0%) | 58 (4.1%) |
| 30 to 34 Years | 45 (2.8%) | 123 (8.6%) |
| 35 to 39 Years | 73 (4.5%) | 73 (5.1%) |
| 40 to 44 Years | 133 (8.2%) | 115 (8.1%) |
| 45 to 49 Years | 81 (5.0%) | 65 (4.5%) |
| 50 to 54 Years | 86 (5.3%) | 128 (9.0%) |
| 55 to 59 Years | 102 (6.2%) | 171 (12.0%) |
| 60 to 64 Years | 91 (5.6%) | 74 (5.2%) |
| 65 to 69 Years | 84 (5.1%) | 91 (6.4%) |
| 70 to 74 Years | 40 (2.5%) | 21 (1.5%) |
| 75 to 79 Years | 39 (2.4%) | 44 (3.1%) |
| 80 to 84 Years | 5 (0.3%) | 21 (1.5%) |
| 85 Years and over | 52 (3.2%) | 40 (2.8%) |
| Total | 1,632 (100.0%) | 1,429 (100.0%) |
Families and Households in Cut Bank
Median Family Size in Cut Bank
The median family size in Cut Bank is 3.26 persons per family, with single female/mother families (175 | 23.2%) accounting for the largest median family size of 3.43 persons per family. On the other hand, single male/father families (84 | 11.1%) represent the smallest median family size with 3.14 persons per family.
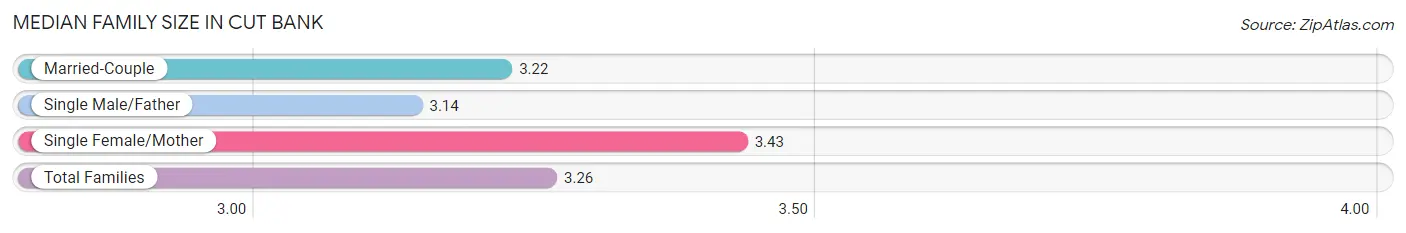
| Family Type | # Families | Family Size |
| Married-Couple | 496 (65.7%) | 3.22 |
| Single Male/Father | 84 (11.1%) | 3.14 |
| Single Female/Mother | 175 (23.2%) | 3.43 |
| Total Families | 755 (100.0%) | 3.26 |
Median Household Size in Cut Bank
The median household size in Cut Bank is 2.57 persons per household, with single male/father households (84 | 7.2%) accounting for the largest median household size of 3.45 persons per household. non-family households (413 | 35.4%) represent the smallest median household size with 1.24 persons per household.
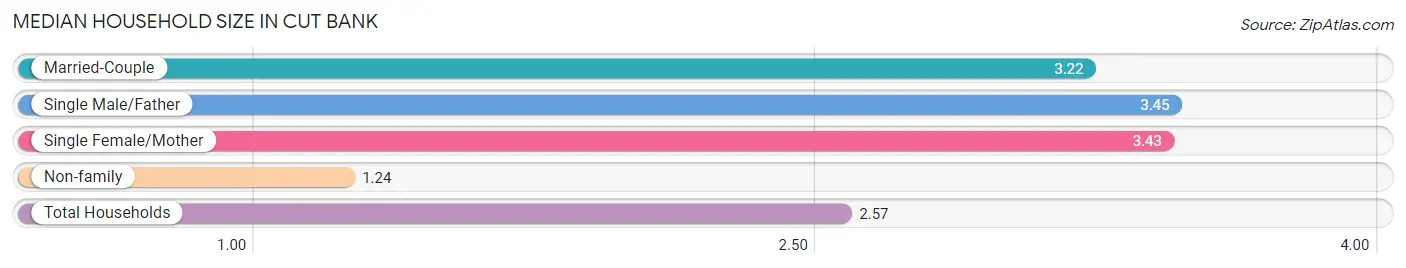
| Household Type | # Households | Household Size |
| Married-Couple | 496 (42.5%) | 3.22 |
| Single Male/Father | 84 (7.2%) | 3.45 |
| Single Female/Mother | 175 (15.0%) | 3.43 |
| Non-family | 413 (35.4%) | 1.24 |
| Total Households | 1,168 (100.0%) | 2.57 |
Household Size by Marriage Status in Cut Bank
Out of a total of 1,168 households in Cut Bank, 755 (64.6%) are family households, while 413 (35.4%) are nonfamily households. The most numerous type of family households are 2-person households, comprising 321, and the most common type of nonfamily households are 1-person households, comprising 361.
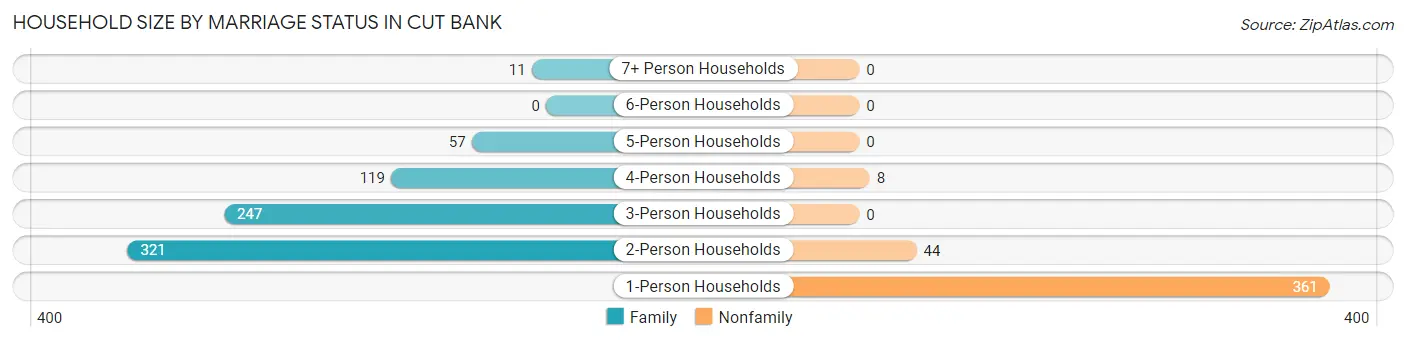
| Household Size | Family Households | Nonfamily Households |
| 1-Person Households | - | 361 (30.9%) |
| 2-Person Households | 321 (27.5%) | 44 (3.8%) |
| 3-Person Households | 247 (21.1%) | 0 (0.0%) |
| 4-Person Households | 119 (10.2%) | 8 (0.7%) |
| 5-Person Households | 57 (4.9%) | 0 (0.0%) |
| 6-Person Households | 0 (0.0%) | 0 (0.0%) |
| 7+ Person Households | 11 (0.9%) | 0 (0.0%) |
| Total | 755 (64.6%) | 413 (35.4%) |
Female Fertility in Cut Bank
Fertility by Age in Cut Bank
Average fertility rate in Cut Bank is 57.0 births per 1,000 women. Women in the age bracket of 20 to 34 years have the highest fertility rate with 131.0 births per 1,000 women. Women in the age bracket of 20 to 34 years acount for 100.0% of all women with births.
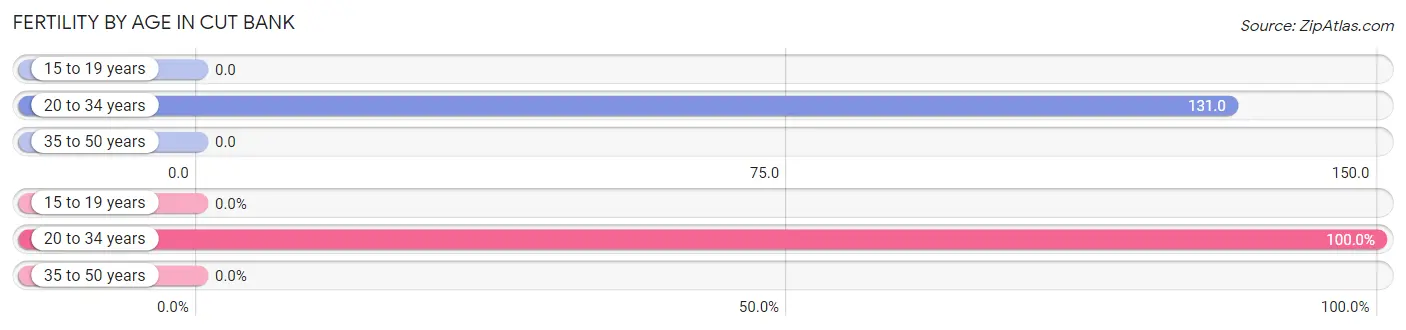
| Age Bracket | Women with Births | Births / 1,000 Women |
| 15 to 19 years | 0 (0.0%) | 0.0 |
| 20 to 34 years | 30 (100.0%) | 131.0 |
| 35 to 50 years | 0 (0.0%) | 0.0 |
| Total | 30 (100.0%) | 57.0 |
Fertility by Age by Marriage Status in Cut Bank
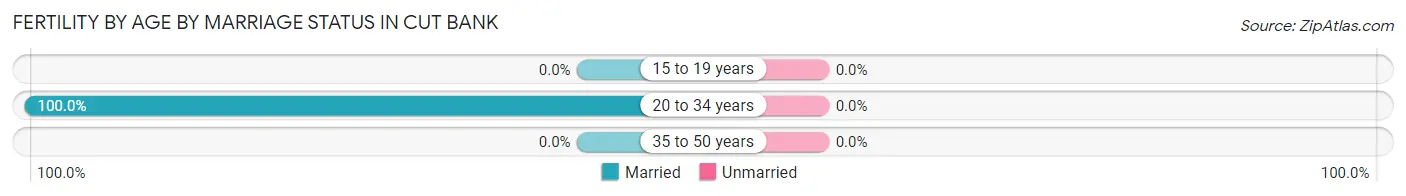
| Age Bracket | Married | Unmarried |
| 15 to 19 years | 0 (0.0%) | 0 (0.0%) |
| 20 to 34 years | 30 (100.0%) | 0 (0.0%) |
| 35 to 50 years | 0 (0.0%) | 0 (0.0%) |
| Total | 30 (100.0%) | 0 (0.0%) |
Fertility by Education in Cut Bank
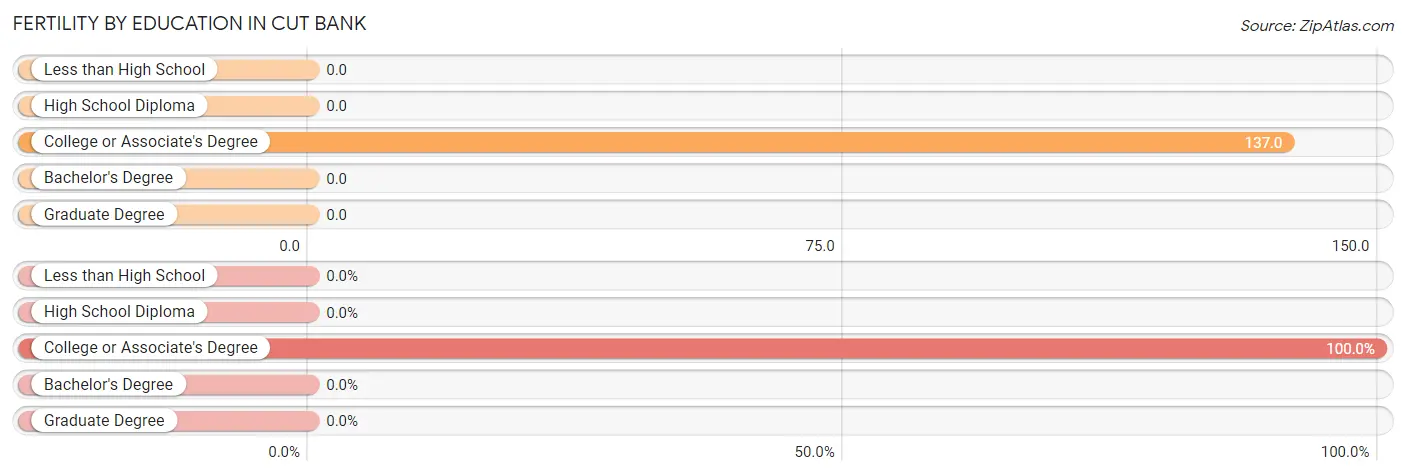
| Educational Attainment | Women with Births | Births / 1,000 Women |
| Less than High School | 0 (0.0%) | 0.0 |
| High School Diploma | 0 (0.0%) | 0.0 |
| College or Associate's Degree | 30 (100.0%) | 137.0 |
| Bachelor's Degree | 0 (0.0%) | 0.0 |
| Graduate Degree | 0 (0.0%) | 0.0 |
| Total | 30 (100.0%) | 57.0 |
Fertility by Education by Marriage Status in Cut Bank
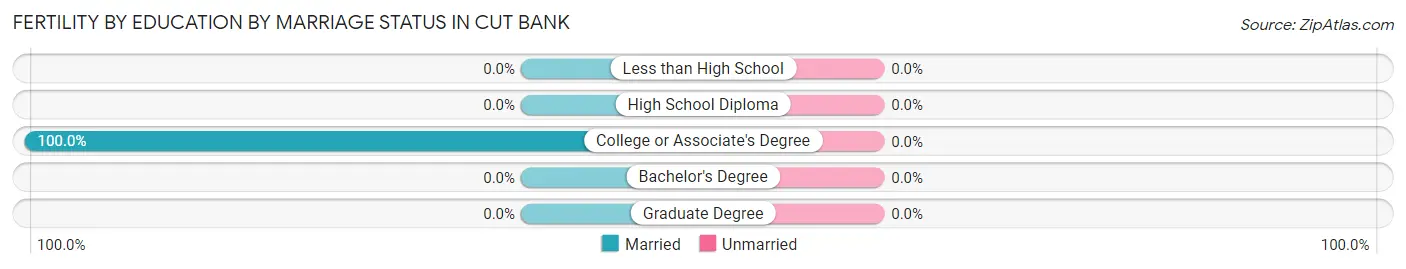
| Educational Attainment | Married | Unmarried |
| Less than High School | 0 (0.0%) | 0 (0.0%) |
| High School Diploma | 0 (0.0%) | 0 (0.0%) |
| College or Associate's Degree | 30 (100.0%) | 0 (0.0%) |
| Bachelor's Degree | 0 (0.0%) | 0 (0.0%) |
| Graduate Degree | 0 (0.0%) | 0 (0.0%) |
| Total | 30 (100.0%) | 0 (0.0%) |
Employment Characteristics in Cut Bank
Employment by Class of Employer in Cut Bank
Among the 995 employed individuals in Cut Bank, private company employees (464 | 46.6%), local government employees (222 | 22.3%), and self-employed (not incorporated) (148 | 14.9%) make up the most common classes of employment.
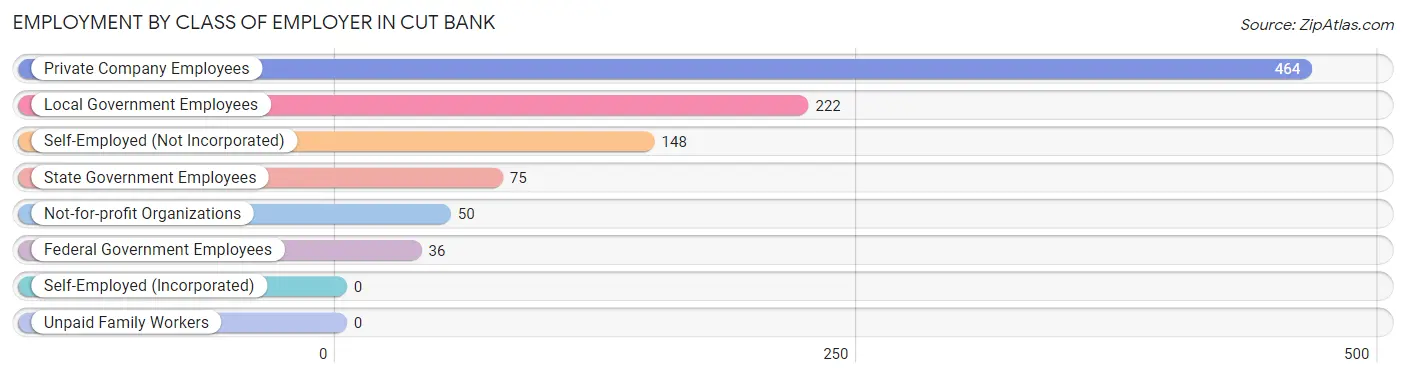
| Employer Class | # Employees | % Employees |
| Private Company Employees | 464 | 46.6% |
| Self-Employed (Incorporated) | 0 | 0.0% |
| Self-Employed (Not Incorporated) | 148 | 14.9% |
| Not-for-profit Organizations | 50 | 5.0% |
| Local Government Employees | 222 | 22.3% |
| State Government Employees | 75 | 7.5% |
| Federal Government Employees | 36 | 3.6% |
| Unpaid Family Workers | 0 | 0.0% |
| Total | 995 | 100.0% |
Employment Status by Age in Cut Bank
According to the labor force statistics for Cut Bank, out of the total population over 16 years of age (2,118), 50.6% or 1,072 individuals are in the labor force, with 2.6% or 28 of them unemployed. The age group with the highest labor force participation rate is 30 to 34 years, with 83.9% or 141 individuals in the labor force. Within the labor force, the 45 to 54 years age range has the highest percentage of unemployed individuals, with 5.6% or 12 of them being unemployed.
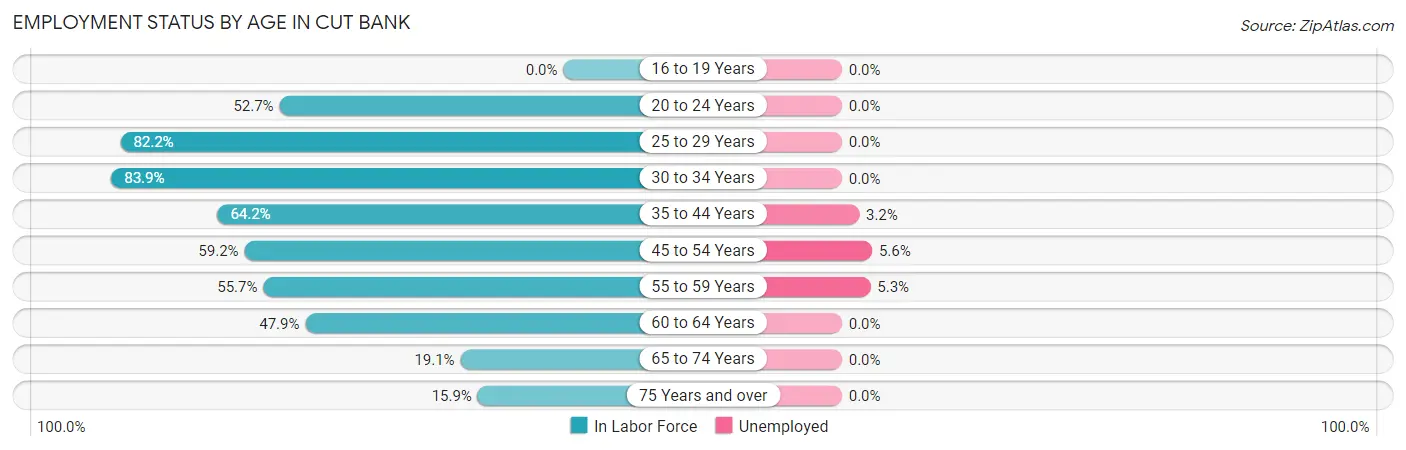
| Age Bracket | In Labor Force | Unemployed |
| 16 to 19 Years | 0 (0.0%) | 0 (0.0%) |
| 20 to 24 Years | 69 (52.7%) | 0 (0.0%) |
| 25 to 29 Years | 88 (82.2%) | 0 (0.0%) |
| 30 to 34 Years | 141 (83.9%) | 0 (0.0%) |
| 35 to 44 Years | 253 (64.2%) | 8 (3.2%) |
| 45 to 54 Years | 213 (59.2%) | 12 (5.6%) |
| 55 to 59 Years | 152 (55.7%) | 8 (5.3%) |
| 60 to 64 Years | 79 (47.9%) | 0 (0.0%) |
| 65 to 74 Years | 45 (19.1%) | 0 (0.0%) |
| 75 Years and over | 32 (15.9%) | 0 (0.0%) |
| Total | 1,072 (50.6%) | 28 (2.6%) |
Employment Status by Educational Attainment in Cut Bank
According to labor force statistics for Cut Bank, 63.1% of individuals (926) out of the total population between 25 and 64 years of age (1,467) are in the labor force, with 3.0% or 28 of them being unemployed. The group with the highest labor force participation rate are those with the educational attainment of bachelor's degree or higher, with 84.8% or 246 individuals in the labor force. Within the labor force, individuals with less than high school education have the highest percentage of unemployment, with 76.9% or 20 of them being unemployed.
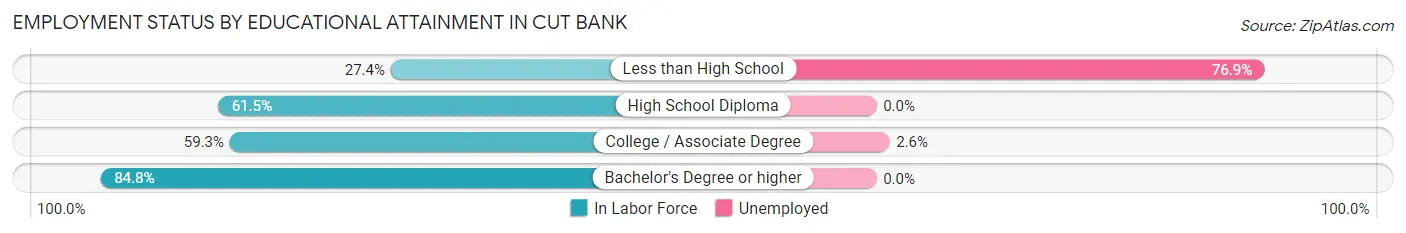
| Educational Attainment | In Labor Force | Unemployed |
| Less than High School | 26 (27.4%) | 73 (76.9%) |
| High School Diploma | 351 (61.5%) | 0 (0.0%) |
| College / Associate Degree | 303 (59.3%) | 13 (2.6%) |
| Bachelor's Degree or higher | 246 (84.8%) | 0 (0.0%) |
| Total | 926 (63.1%) | 44 (3.0%) |
Employment Occupations by Sex in Cut Bank
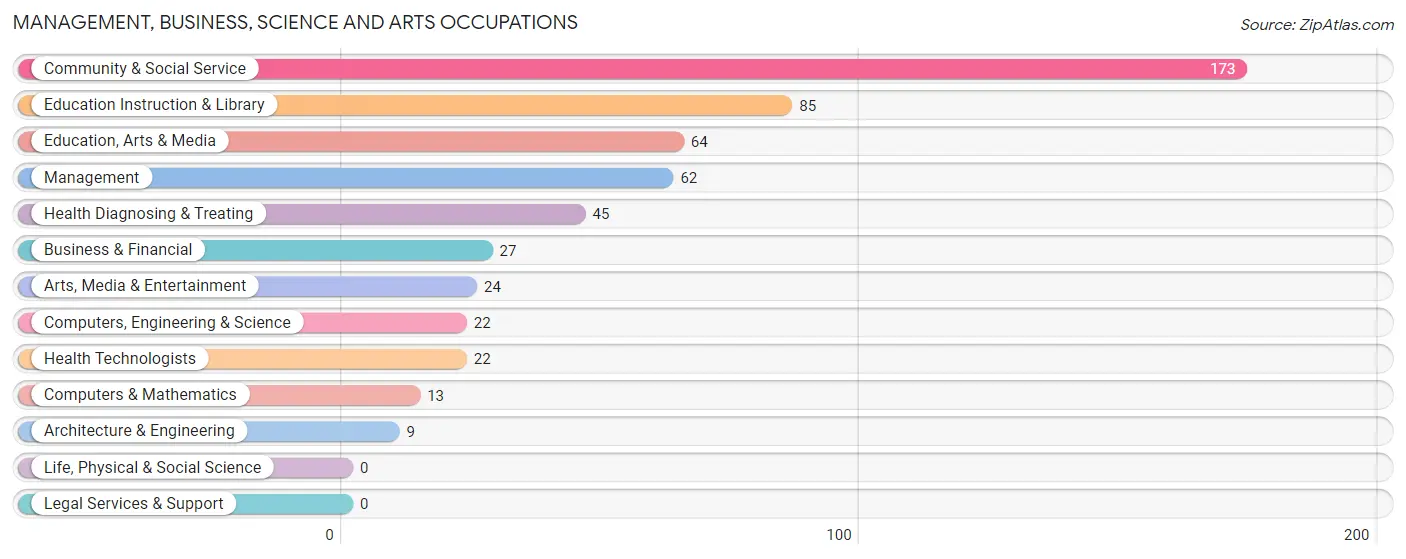
Management, Business, Science and Arts Occupations
The most common Management, Business, Science and Arts occupations in Cut Bank are Community & Social Service (173 | 16.6%), Education Instruction & Library (85 | 8.1%), Education, Arts & Media (64 | 6.1%), Management (62 | 5.9%), and Health Diagnosing & Treating (45 | 4.3%).
Management, Business, Science and Arts Occupations by Sex
Within the Management, Business, Science and Arts occupations in Cut Bank, the most male-oriented occupations are Computers, Engineering & Science (100.0%), Computers & Mathematics (100.0%), and Architecture & Engineering (100.0%), while the most female-oriented occupations are Health Diagnosing & Treating (100.0%), Health Technologists (100.0%), and Education, Arts & Media (87.5%).
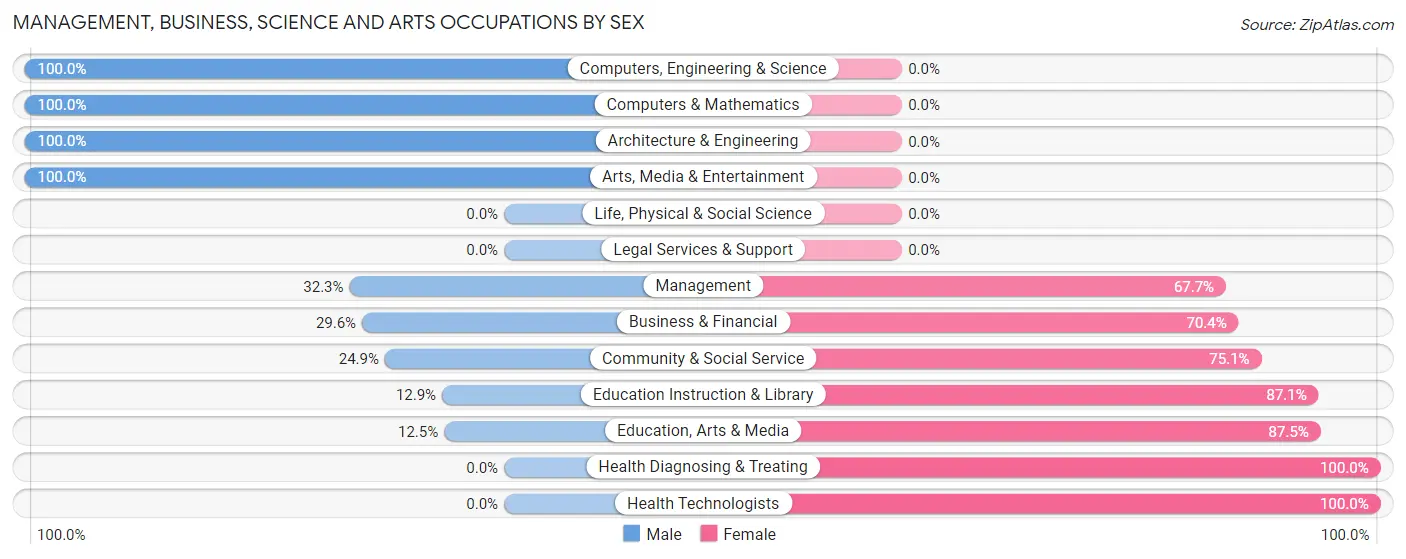
| Occupation | Male | Female |
| Management | 20 (32.3%) | 42 (67.7%) |
| Business & Financial | 8 (29.6%) | 19 (70.4%) |
| Computers, Engineering & Science | 22 (100.0%) | 0 (0.0%) |
| Computers & Mathematics | 13 (100.0%) | 0 (0.0%) |
| Architecture & Engineering | 9 (100.0%) | 0 (0.0%) |
| Life, Physical & Social Science | 0 (0.0%) | 0 (0.0%) |
| Community & Social Service | 43 (24.9%) | 130 (75.1%) |
| Education, Arts & Media | 8 (12.5%) | 56 (87.5%) |
| Legal Services & Support | 0 (0.0%) | 0 (0.0%) |
| Education Instruction & Library | 11 (12.9%) | 74 (87.1%) |
| Arts, Media & Entertainment | 24 (100.0%) | 0 (0.0%) |
| Health Diagnosing & Treating | 0 (0.0%) | 45 (100.0%) |
| Health Technologists | 0 (0.0%) | 22 (100.0%) |
| Total (Category) | 93 (28.3%) | 236 (71.7%) |
| Total (Overall) | 472 (45.2%) | 572 (54.8%) |
Services Occupations
The most common Services occupations in Cut Bank are Personal Care & Service (75 | 7.2%), Healthcare Support (70 | 6.7%), Security & Protection (56 | 5.4%), Firefighting & Prevention (39 | 3.7%), and Cleaning & Maintenance (32 | 3.1%).
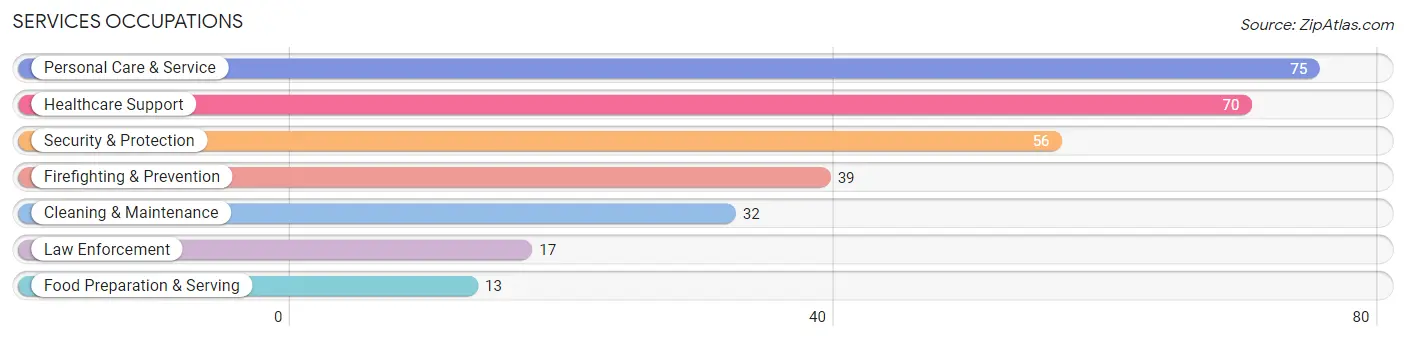
Services Occupations by Sex
Within the Services occupations in Cut Bank, the most male-oriented occupations are Security & Protection (100.0%), Firefighting & Prevention (100.0%), and Law Enforcement (100.0%), while the most female-oriented occupations are Food Preparation & Serving (100.0%), Healthcare Support (80.0%), and Personal Care & Service (62.7%).
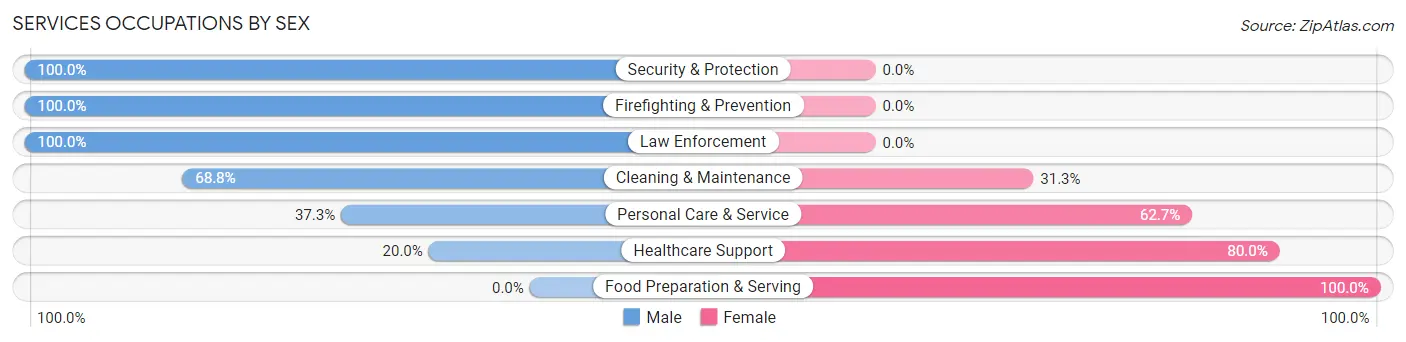
| Occupation | Male | Female |
| Healthcare Support | 14 (20.0%) | 56 (80.0%) |
| Security & Protection | 56 (100.0%) | 0 (0.0%) |
| Firefighting & Prevention | 39 (100.0%) | 0 (0.0%) |
| Law Enforcement | 17 (100.0%) | 0 (0.0%) |
| Food Preparation & Serving | 0 (0.0%) | 13 (100.0%) |
| Cleaning & Maintenance | 22 (68.8%) | 10 (31.2%) |
| Personal Care & Service | 28 (37.3%) | 47 (62.7%) |
| Total (Category) | 120 (48.8%) | 126 (51.2%) |
| Total (Overall) | 472 (45.2%) | 572 (54.8%) |
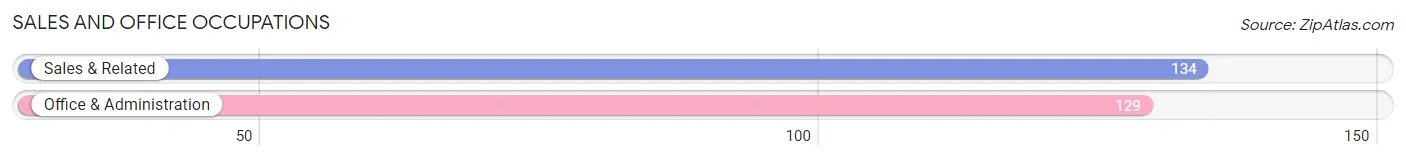
Sales and Office Occupations
The most common Sales and Office occupations in Cut Bank are Sales & Related (134 | 12.8%), and Office & Administration (129 | 12.4%).
Sales and Office Occupations by Sex
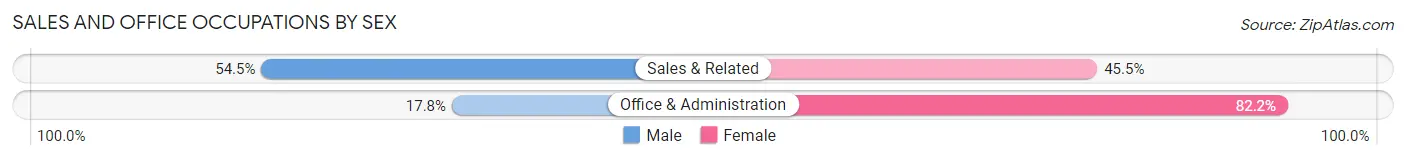
| Occupation | Male | Female |
| Sales & Related | 73 (54.5%) | 61 (45.5%) |
| Office & Administration | 23 (17.8%) | 106 (82.2%) |
| Total (Category) | 96 (36.5%) | 167 (63.5%) |
| Total (Overall) | 472 (45.2%) | 572 (54.8%) |
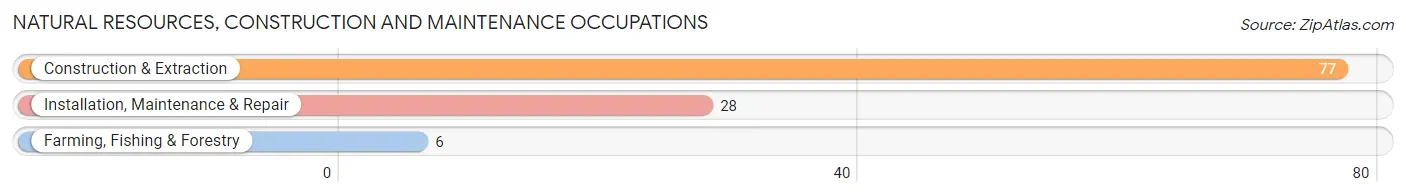
Natural Resources, Construction and Maintenance Occupations
The most common Natural Resources, Construction and Maintenance occupations in Cut Bank are Construction & Extraction (77 | 7.4%), Installation, Maintenance & Repair (28 | 2.7%), and Farming, Fishing & Forestry (6 | 0.6%).
Natural Resources, Construction and Maintenance Occupations by Sex
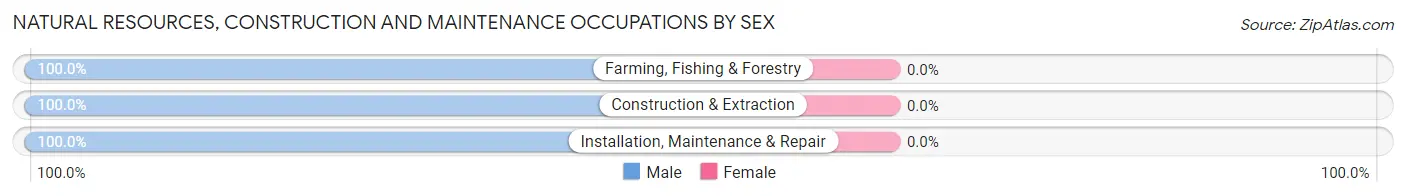
| Occupation | Male | Female |
| Farming, Fishing & Forestry | 6 (100.0%) | 0 (0.0%) |
| Construction & Extraction | 77 (100.0%) | 0 (0.0%) |
| Installation, Maintenance & Repair | 28 (100.0%) | 0 (0.0%) |
| Total (Category) | 111 (100.0%) | 0 (0.0%) |
| Total (Overall) | 472 (45.2%) | 572 (54.8%) |
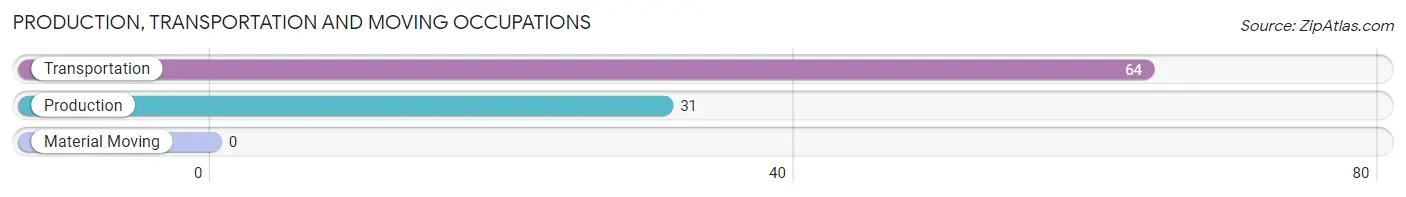
Production, Transportation and Moving Occupations
The most common Production, Transportation and Moving occupations in Cut Bank are Transportation (64 | 6.1%), and Production (31 | 3.0%).
Production, Transportation and Moving Occupations by Sex
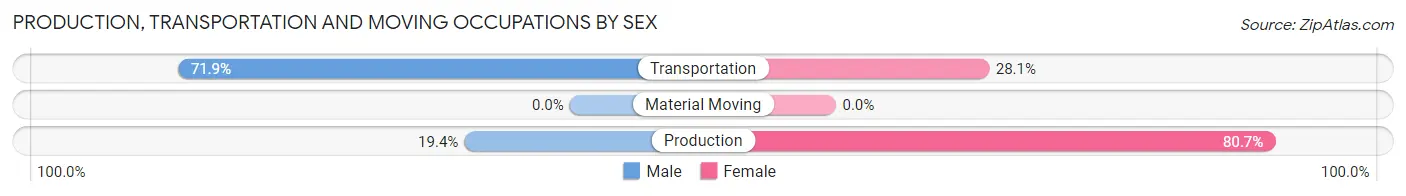
| Occupation | Male | Female |
| Production | 6 (19.4%) | 25 (80.6%) |
| Transportation | 46 (71.9%) | 18 (28.1%) |
| Material Moving | 0 (0.0%) | 0 (0.0%) |
| Total (Category) | 52 (54.7%) | 43 (45.3%) |
| Total (Overall) | 472 (45.2%) | 572 (54.8%) |
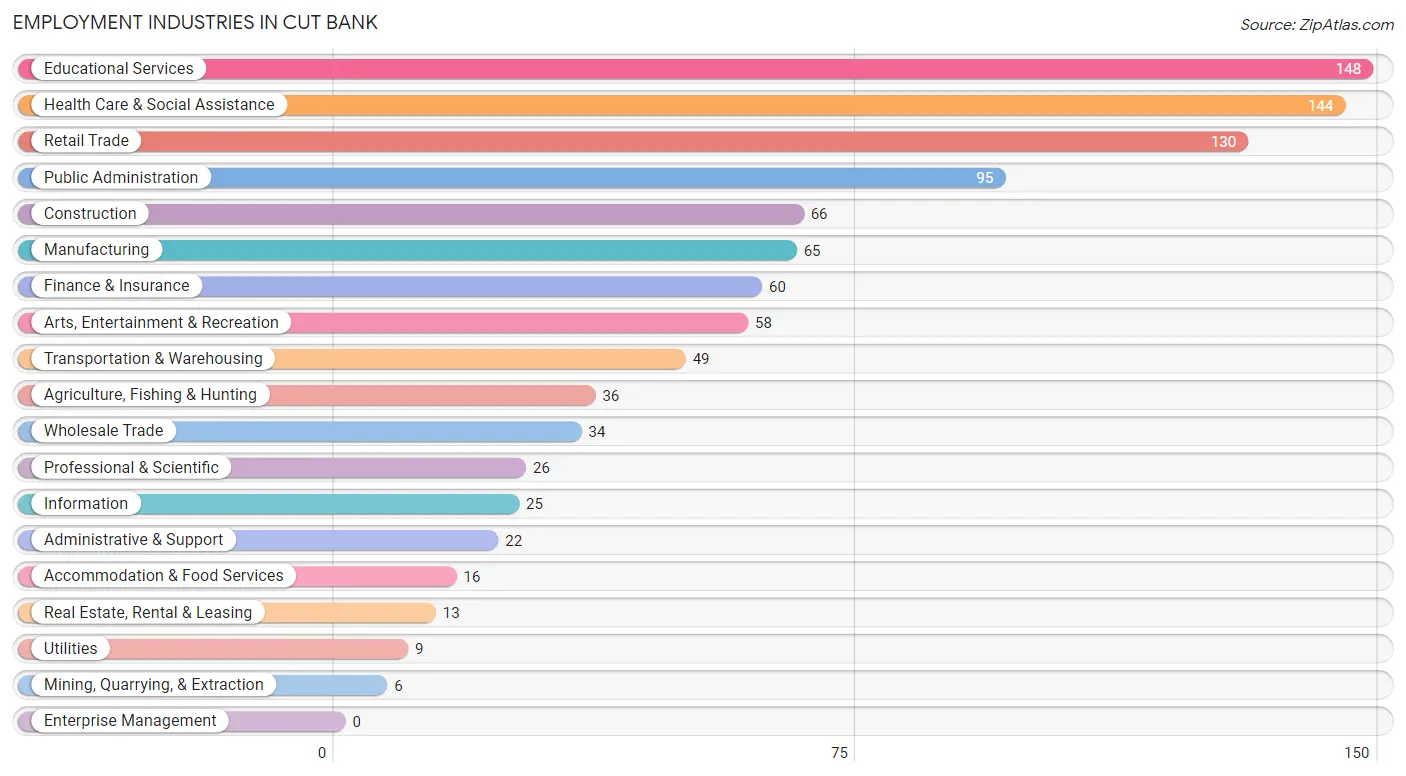
Employment Industries by Sex in Cut Bank
Employment Industries in Cut Bank
The major employment industries in Cut Bank include Educational Services (148 | 14.2%), Health Care & Social Assistance (144 | 13.8%), Retail Trade (130 | 12.4%), Public Administration (95 | 9.1%), and Construction (66 | 6.3%).
Employment Industries by Sex in Cut Bank
The Cut Bank industries that see more men than women are Agriculture, Fishing & Hunting (100.0%), Mining, Quarrying, & Extraction (100.0%), and Construction (100.0%), whereas the industries that tend to have a higher number of women are Information (100.0%), Finance & Insurance (100.0%), and Administrative & Support (100.0%).
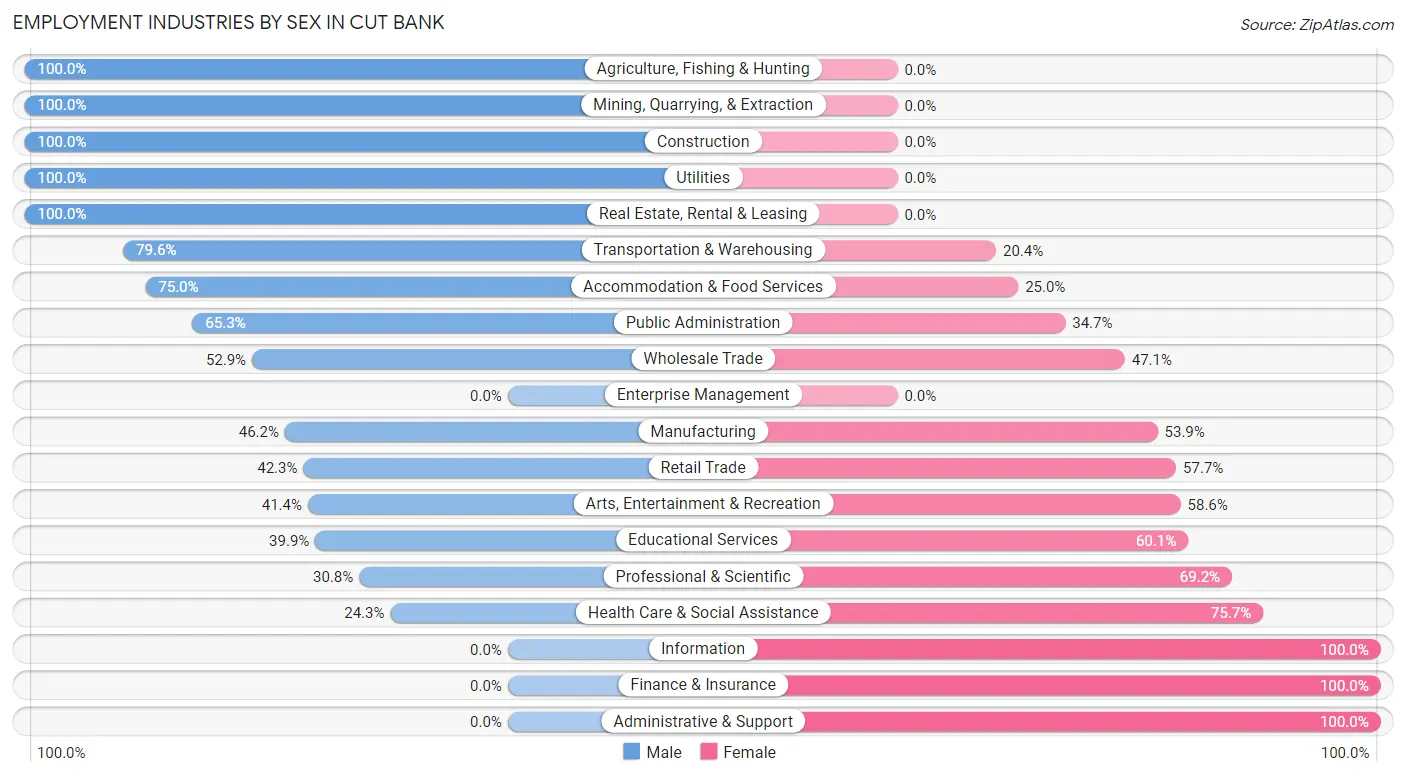
| Industry | Male | Female |
| Agriculture, Fishing & Hunting | 36 (100.0%) | 0 (0.0%) |
| Mining, Quarrying, & Extraction | 6 (100.0%) | 0 (0.0%) |
| Construction | 66 (100.0%) | 0 (0.0%) |
| Manufacturing | 30 (46.2%) | 35 (53.8%) |
| Wholesale Trade | 18 (52.9%) | 16 (47.1%) |
| Retail Trade | 55 (42.3%) | 75 (57.7%) |
| Transportation & Warehousing | 39 (79.6%) | 10 (20.4%) |
| Utilities | 9 (100.0%) | 0 (0.0%) |
| Information | 0 (0.0%) | 25 (100.0%) |
| Finance & Insurance | 0 (0.0%) | 60 (100.0%) |
| Real Estate, Rental & Leasing | 13 (100.0%) | 0 (0.0%) |
| Professional & Scientific | 8 (30.8%) | 18 (69.2%) |
| Enterprise Management | 0 (0.0%) | 0 (0.0%) |
| Administrative & Support | 0 (0.0%) | 22 (100.0%) |
| Educational Services | 59 (39.9%) | 89 (60.1%) |
| Health Care & Social Assistance | 35 (24.3%) | 109 (75.7%) |
| Arts, Entertainment & Recreation | 24 (41.4%) | 34 (58.6%) |
| Accommodation & Food Services | 12 (75.0%) | 4 (25.0%) |
| Public Administration | 62 (65.3%) | 33 (34.7%) |
| Total | 472 (45.2%) | 572 (54.8%) |
Education in Cut Bank
School Enrollment in Cut Bank
The most common levels of schooling among the 822 students in Cut Bank are middle school (252 | 30.7%), elementary school (220 | 26.8%), and high school (201 | 24.4%).
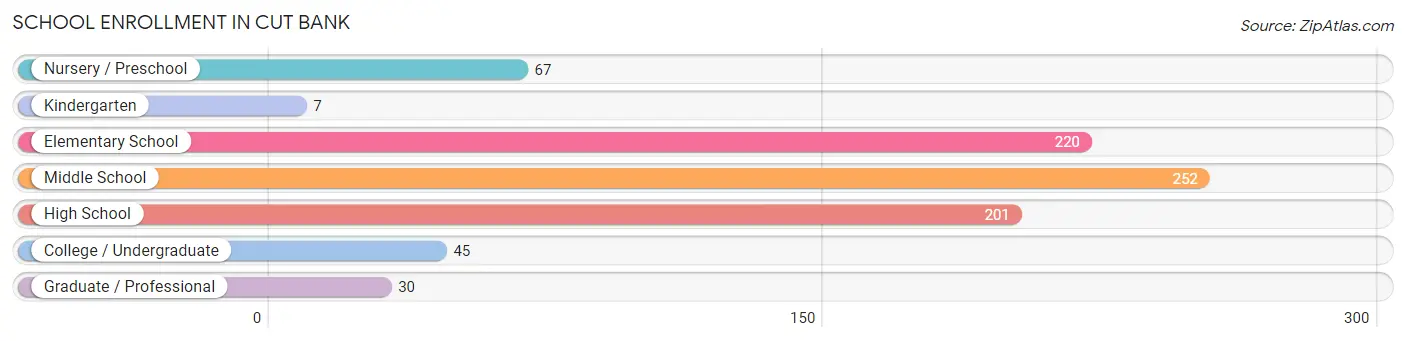
| School Level | # Students | % Students |
| Nursery / Preschool | 67 | 8.2% |
| Kindergarten | 7 | 0.9% |
| Elementary School | 220 | 26.8% |
| Middle School | 252 | 30.7% |
| High School | 201 | 24.4% |
| College / Undergraduate | 45 | 5.5% |
| Graduate / Professional | 30 | 3.6% |
| Total | 822 | 100.0% |
School Enrollment by Age by Funding Source in Cut Bank
Out of a total of 822 students who are enrolled in schools in Cut Bank, 7 (0.9%) attend a private institution, while the remaining 815 (99.1%) are enrolled in public schools. The age group of 25 to 34 year olds has the highest likelihood of being enrolled in private schools, with 7 (100.0% in the age bracket) enrolled. Conversely, the age group of 3 to 4 year olds has the lowest likelihood of being enrolled in a private school, with 22 (100.0% in the age bracket) attending a public institution.
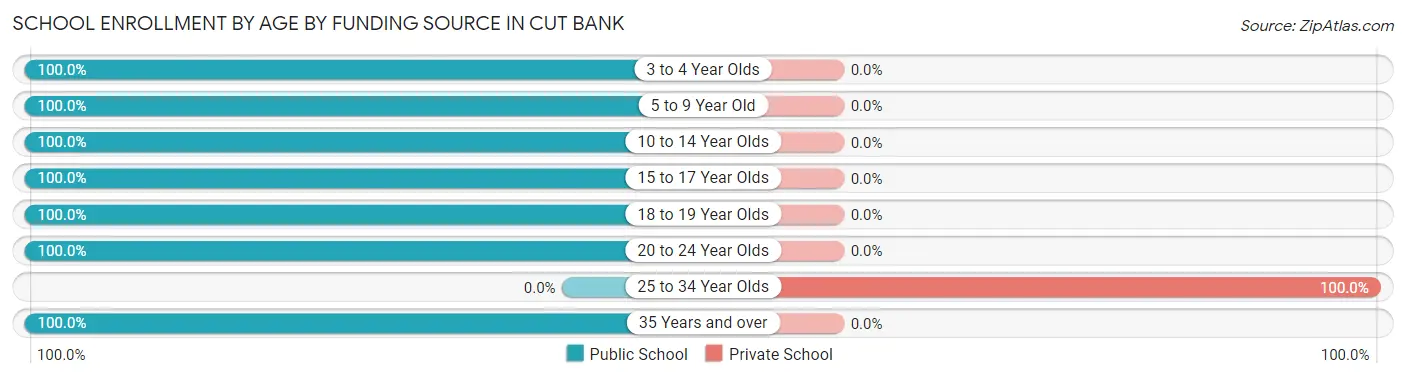
| Age Bracket | Public School | Private School |
| 3 to 4 Year Olds | 22 (100.0%) | 0 (0.0%) |
| 5 to 9 Year Old | 251 (100.0%) | 0 (0.0%) |
| 10 to 14 Year Olds | 286 (100.0%) | 0 (0.0%) |
| 15 to 17 Year Olds | 164 (100.0%) | 0 (0.0%) |
| 18 to 19 Year Olds | 24 (100.0%) | 0 (0.0%) |
| 20 to 24 Year Olds | 38 (100.0%) | 0 (0.0%) |
| 25 to 34 Year Olds | 0 (0.0%) | 7 (100.0%) |
| 35 Years and over | 30 (100.0%) | 0 (0.0%) |
| Total | 815 (99.1%) | 7 (0.9%) |
Educational Attainment by Field of Study in Cut Bank
Education (154 | 39.3%), business (68 | 17.3%), arts & humanities (51 | 13.0%), social sciences (39 | 10.0%), and science & technology (36 | 9.2%) are the most common fields of study among 392 individuals in Cut Bank who have obtained a bachelor's degree or higher.
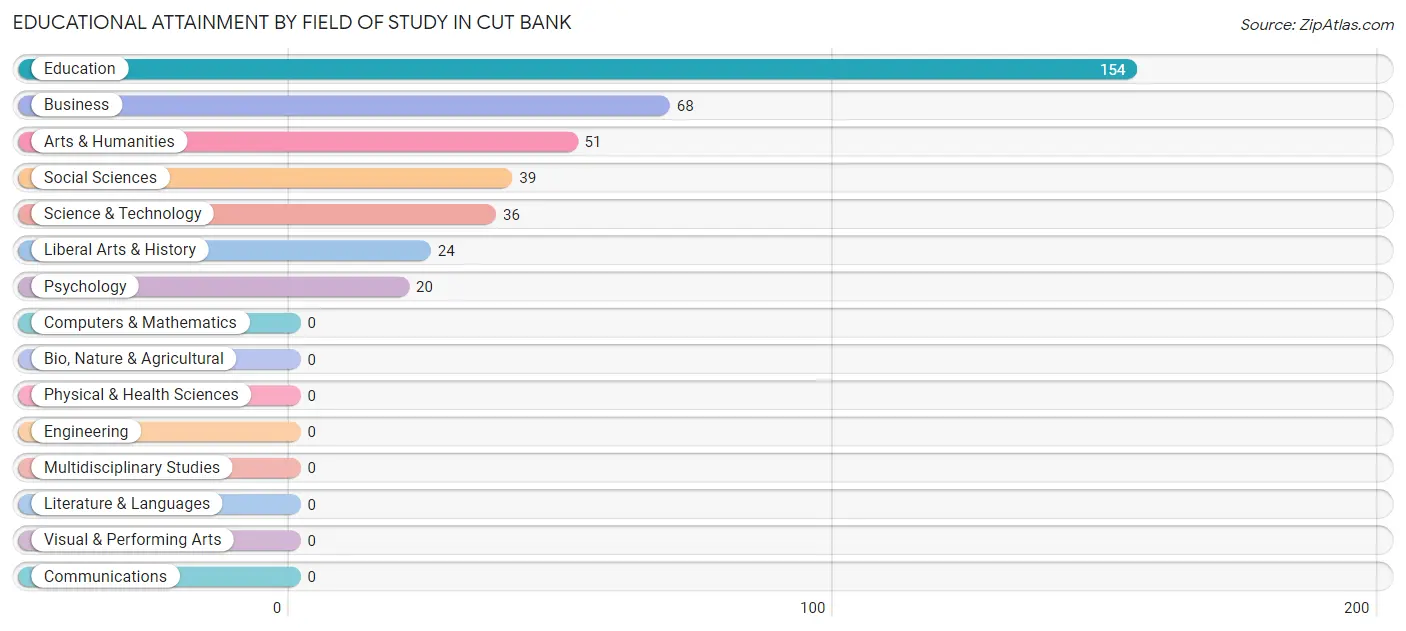
| Field of Study | # Graduates | % Graduates |
| Computers & Mathematics | 0 | 0.0% |
| Bio, Nature & Agricultural | 0 | 0.0% |
| Physical & Health Sciences | 0 | 0.0% |
| Psychology | 20 | 5.1% |
| Social Sciences | 39 | 10.0% |
| Engineering | 0 | 0.0% |
| Multidisciplinary Studies | 0 | 0.0% |
| Science & Technology | 36 | 9.2% |
| Business | 68 | 17.3% |
| Education | 154 | 39.3% |
| Literature & Languages | 0 | 0.0% |
| Liberal Arts & History | 24 | 6.1% |
| Visual & Performing Arts | 0 | 0.0% |
| Communications | 0 | 0.0% |
| Arts & Humanities | 51 | 13.0% |
| Total | 392 | 100.0% |
Transportation & Commute in Cut Bank
Vehicle Availability by Sex in Cut Bank
The most prevalent vehicle ownership categories in Cut Bank are males with 2 vehicles (238, accounting for 53.6%) and females with 2 vehicles (150, making up 43.2%).
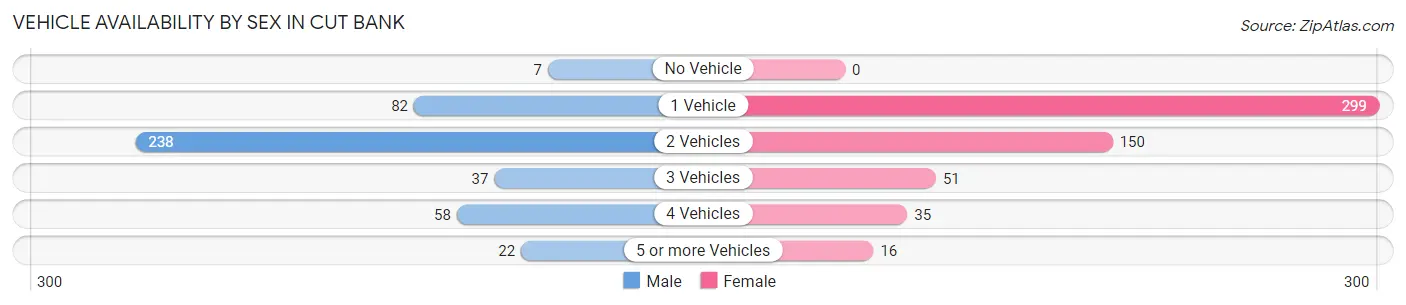
| Vehicles Available | Male | Female |
| No Vehicle | 7 (1.6%) | 0 (0.0%) |
| 1 Vehicle | 82 (18.5%) | 299 (54.3%) |
| 2 Vehicles | 238 (53.6%) | 150 (27.2%) |
| 3 Vehicles | 37 (8.3%) | 51 (9.3%) |
| 4 Vehicles | 58 (13.1%) | 35 (6.4%) |
| 5 or more Vehicles | 22 (5.0%) | 16 (2.9%) |
| Total | 444 (100.0%) | 551 (100.0%) |
Commute Time in Cut Bank
The most frequently occuring commute durations in Cut Bank are 5 to 9 minutes (340 commuters, 36.5%), less than 5 minutes (223 commuters, 23.9%), and 10 to 14 minutes (139 commuters, 14.9%).
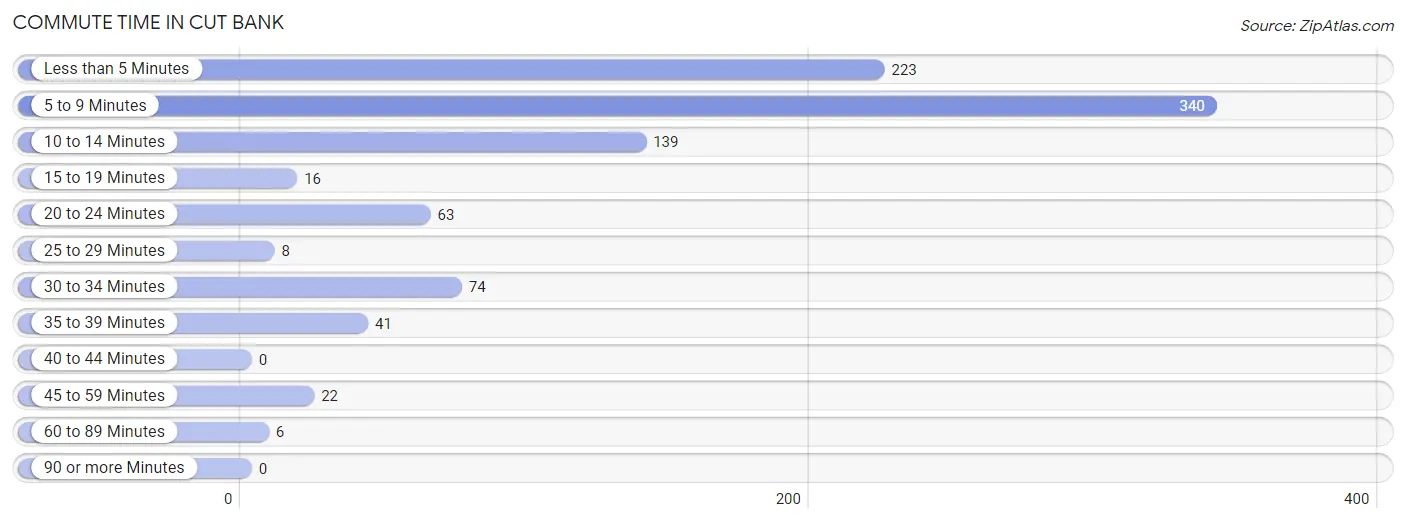
| Commute Time | # Commuters | % Commuters |
| Less than 5 Minutes | 223 | 23.9% |
| 5 to 9 Minutes | 340 | 36.5% |
| 10 to 14 Minutes | 139 | 14.9% |
| 15 to 19 Minutes | 16 | 1.7% |
| 20 to 24 Minutes | 63 | 6.8% |
| 25 to 29 Minutes | 8 | 0.9% |
| 30 to 34 Minutes | 74 | 7.9% |
| 35 to 39 Minutes | 41 | 4.4% |
| 40 to 44 Minutes | 0 | 0.0% |
| 45 to 59 Minutes | 22 | 2.4% |
| 60 to 89 Minutes | 6 | 0.6% |
| 90 or more Minutes | 0 | 0.0% |
Commute Time by Sex in Cut Bank
The most common commute times in Cut Bank are 5 to 9 minutes (116 commuters, 27.5%) for males and 5 to 9 minutes (224 commuters, 43.9%) for females.
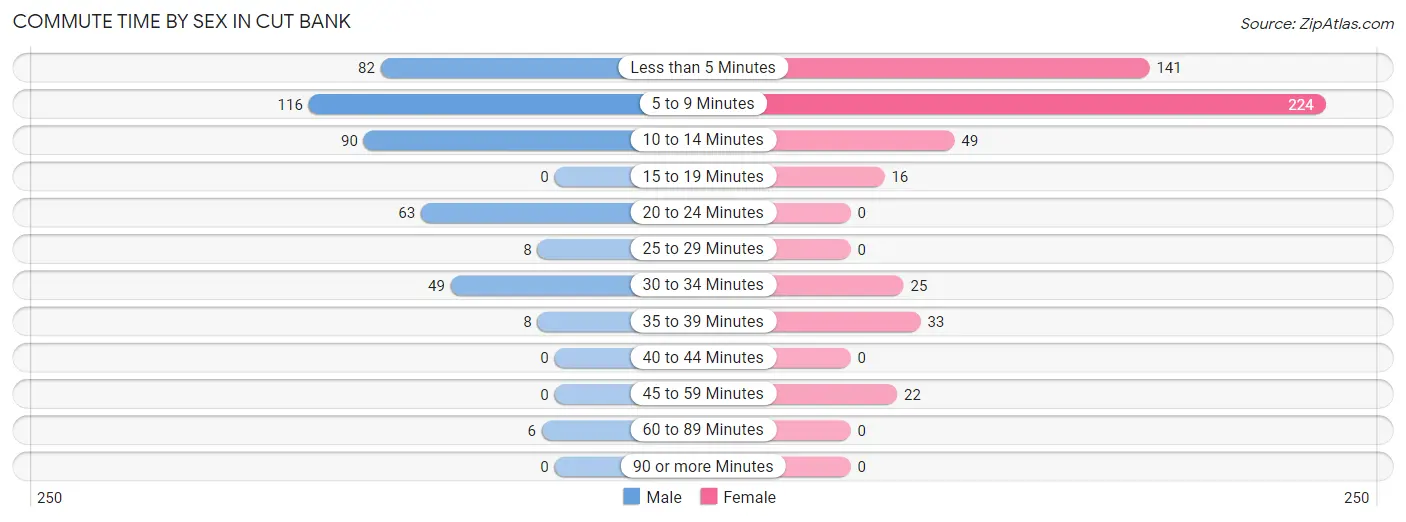
| Commute Time | Male | Female |
| Less than 5 Minutes | 82 (19.4%) | 141 (27.7%) |
| 5 to 9 Minutes | 116 (27.5%) | 224 (43.9%) |
| 10 to 14 Minutes | 90 (21.3%) | 49 (9.6%) |
| 15 to 19 Minutes | 0 (0.0%) | 16 (3.1%) |
| 20 to 24 Minutes | 63 (14.9%) | 0 (0.0%) |
| 25 to 29 Minutes | 8 (1.9%) | 0 (0.0%) |
| 30 to 34 Minutes | 49 (11.6%) | 25 (4.9%) |
| 35 to 39 Minutes | 8 (1.9%) | 33 (6.5%) |
| 40 to 44 Minutes | 0 (0.0%) | 0 (0.0%) |
| 45 to 59 Minutes | 0 (0.0%) | 22 (4.3%) |
| 60 to 89 Minutes | 6 (1.4%) | 0 (0.0%) |
| 90 or more Minutes | 0 (0.0%) | 0 (0.0%) |
Time of Departure to Work by Sex in Cut Bank
The most frequent times of departure to work in Cut Bank are 7:30 AM to 7:59 AM (115, 27.3%) for males and 7:30 AM to 7:59 AM (209, 41.0%) for females.
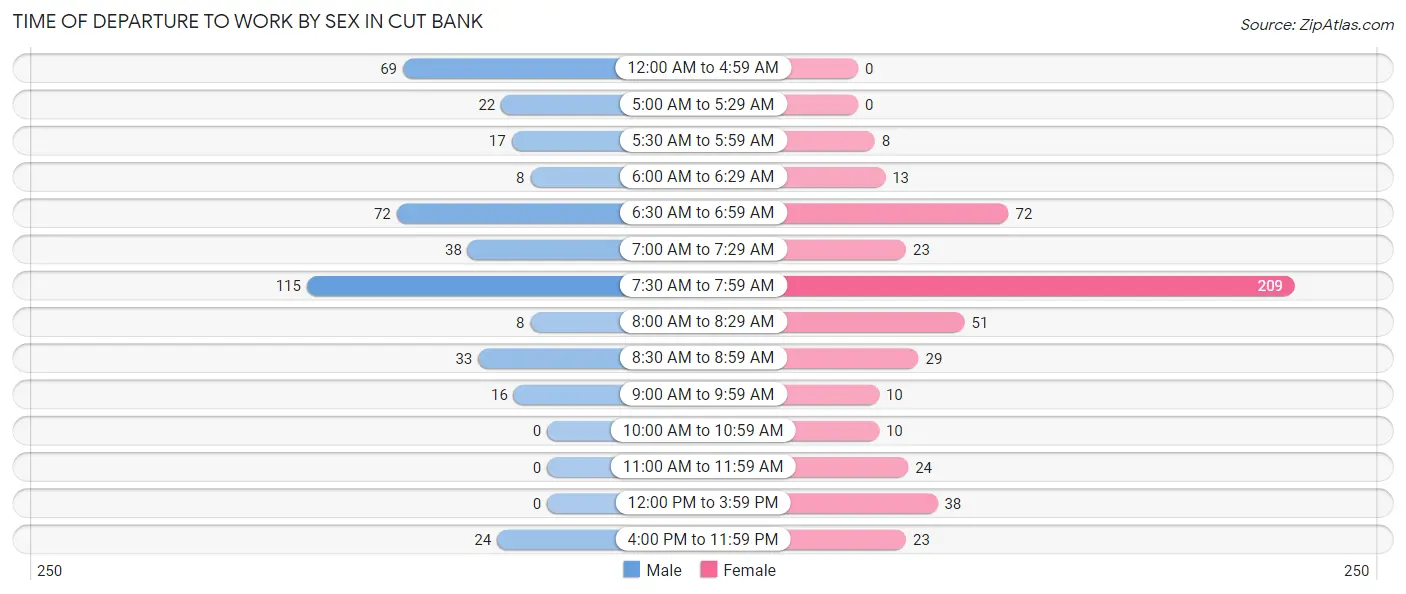
| Time of Departure | Male | Female |
| 12:00 AM to 4:59 AM | 69 (16.4%) | 0 (0.0%) |
| 5:00 AM to 5:29 AM | 22 (5.2%) | 0 (0.0%) |
| 5:30 AM to 5:59 AM | 17 (4.0%) | 8 (1.6%) |
| 6:00 AM to 6:29 AM | 8 (1.9%) | 13 (2.5%) |
| 6:30 AM to 6:59 AM | 72 (17.1%) | 72 (14.1%) |
| 7:00 AM to 7:29 AM | 38 (9.0%) | 23 (4.5%) |
| 7:30 AM to 7:59 AM | 115 (27.3%) | 209 (41.0%) |
| 8:00 AM to 8:29 AM | 8 (1.9%) | 51 (10.0%) |
| 8:30 AM to 8:59 AM | 33 (7.8%) | 29 (5.7%) |
| 9:00 AM to 9:59 AM | 16 (3.8%) | 10 (2.0%) |
| 10:00 AM to 10:59 AM | 0 (0.0%) | 10 (2.0%) |
| 11:00 AM to 11:59 AM | 0 (0.0%) | 24 (4.7%) |
| 12:00 PM to 3:59 PM | 0 (0.0%) | 38 (7.4%) |
| 4:00 PM to 11:59 PM | 24 (5.7%) | 23 (4.5%) |
| Total | 422 (100.0%) | 510 (100.0%) |
Housing Occupancy in Cut Bank
Occupancy by Ownership in Cut Bank
Of the total 1,168 dwellings in Cut Bank, owner-occupied units account for 752 (64.4%), while renter-occupied units make up 416 (35.6%).
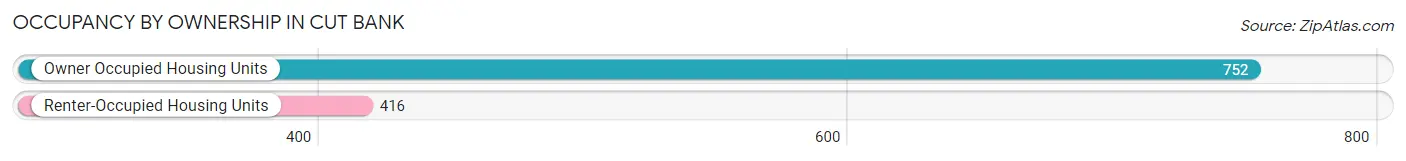
| Occupancy | # Housing Units | % Housing Units |
| Owner Occupied Housing Units | 752 | 64.4% |
| Renter-Occupied Housing Units | 416 | 35.6% |
| Total Occupied Housing Units | 1,168 | 100.0% |
Occupancy by Household Size in Cut Bank
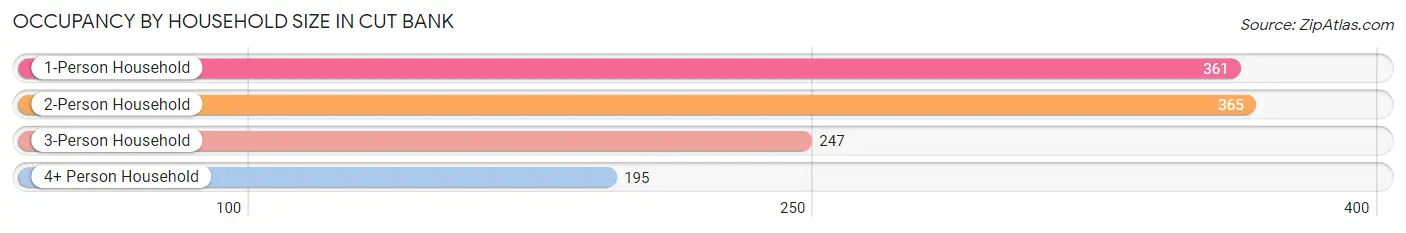
| Household Size | # Housing Units | % Housing Units |
| 1-Person Household | 361 | 30.9% |
| 2-Person Household | 365 | 31.2% |
| 3-Person Household | 247 | 21.1% |
| 4+ Person Household | 195 | 16.7% |
| Total Housing Units | 1,168 | 100.0% |
Occupancy by Ownership by Household Size in Cut Bank
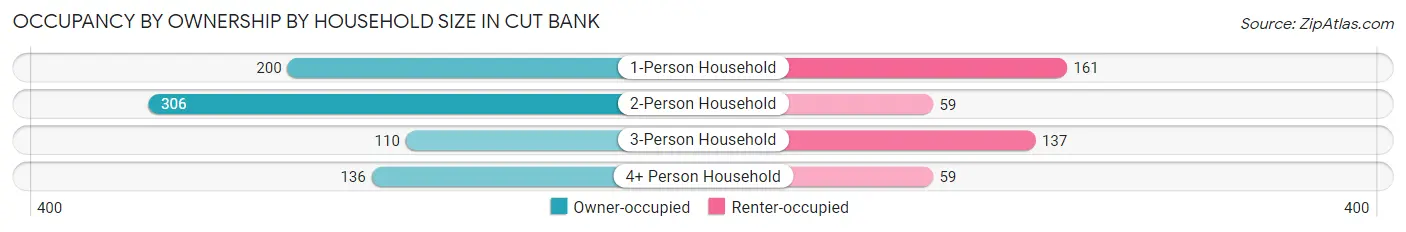
| Household Size | Owner-occupied | Renter-occupied |
| 1-Person Household | 200 (55.4%) | 161 (44.6%) |
| 2-Person Household | 306 (83.8%) | 59 (16.2%) |
| 3-Person Household | 110 (44.5%) | 137 (55.5%) |
| 4+ Person Household | 136 (69.7%) | 59 (30.3%) |
| Total Housing Units | 752 (64.4%) | 416 (35.6%) |
Occupancy by Educational Attainment in Cut Bank
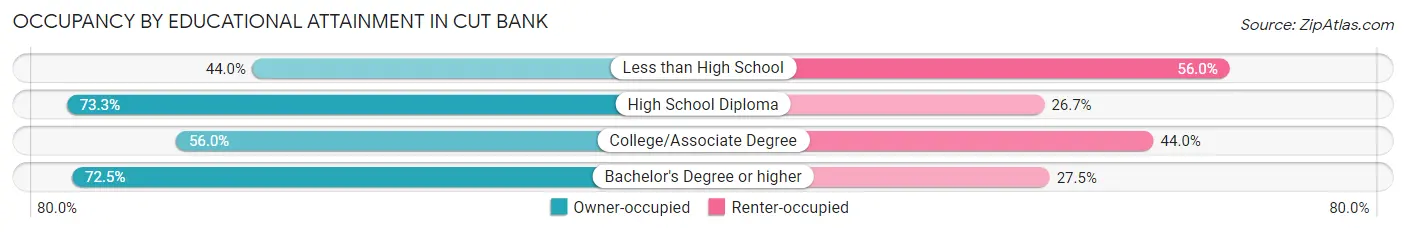
| Household Size | Owner-occupied | Renter-occupied |
| Less than High School | 40 (44.0%) | 51 (56.0%) |
| High School Diploma | 261 (73.3%) | 95 (26.7%) |
| College/Associate Degree | 243 (56.0%) | 191 (44.0%) |
| Bachelor's Degree or higher | 208 (72.5%) | 79 (27.5%) |
Occupancy by Age of Householder in Cut Bank
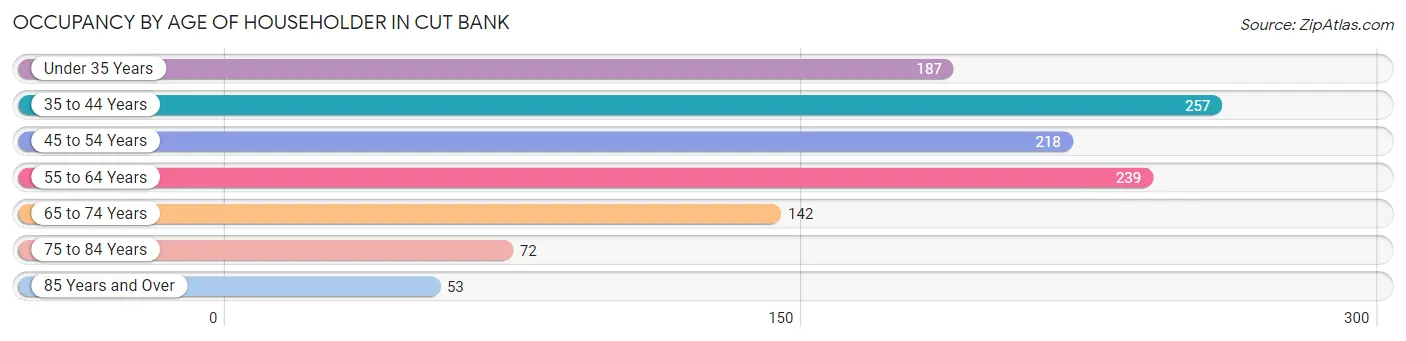
| Age Bracket | # Households | % Households |
| Under 35 Years | 187 | 16.0% |
| 35 to 44 Years | 257 | 22.0% |
| 45 to 54 Years | 218 | 18.7% |
| 55 to 64 Years | 239 | 20.5% |
| 65 to 74 Years | 142 | 12.2% |
| 75 to 84 Years | 72 | 6.2% |
| 85 Years and Over | 53 | 4.5% |
| Total | 1,168 | 100.0% |
Housing Finances in Cut Bank
Median Income by Occupancy in Cut Bank
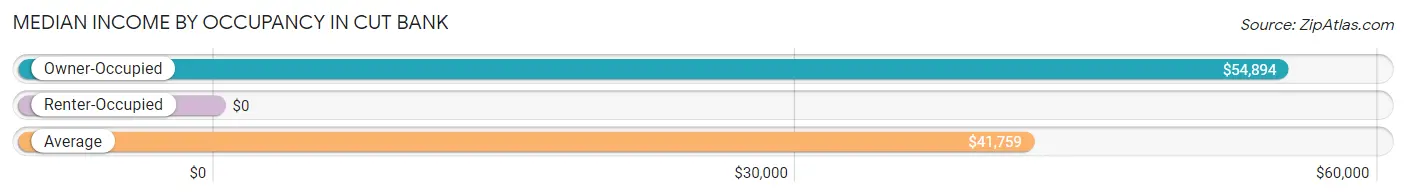
| Occupancy Type | # Households | Median Income |
| Owner-Occupied | 752 (64.4%) | $54,894 |
| Renter-Occupied | 416 (35.6%) | $0 |
| Average | 1,168 (100.0%) | $41,759 |
Occupancy by Householder Income Bracket in Cut Bank
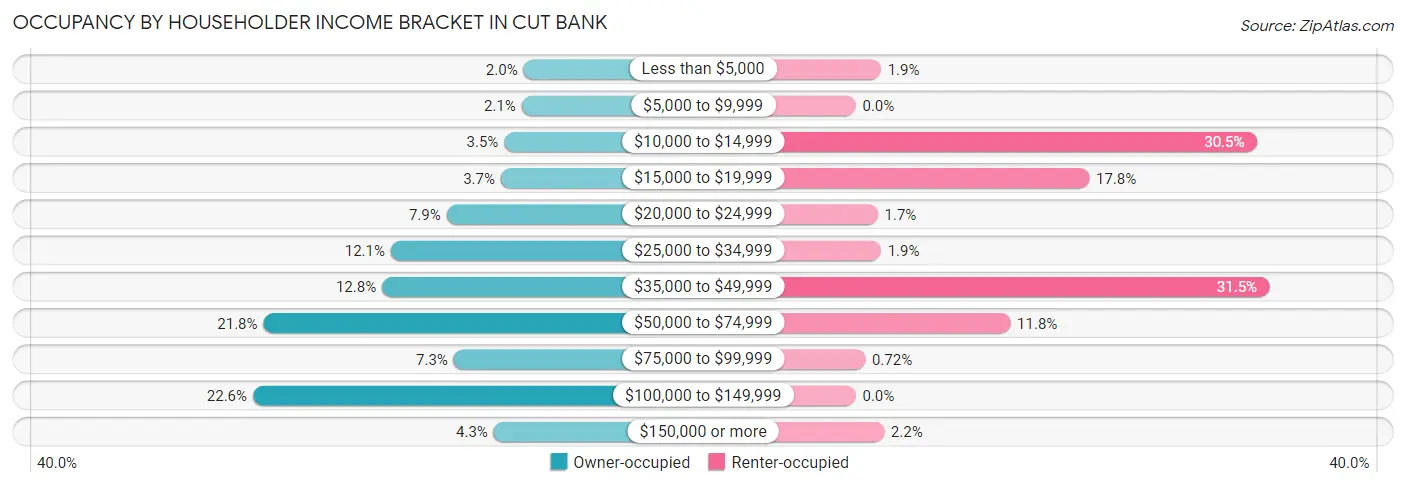
| Income Bracket | Owner-occupied | Renter-occupied |
| Less than $5,000 | 15 (2.0%) | 8 (1.9%) |
| $5,000 to $9,999 | 16 (2.1%) | 0 (0.0%) |
| $10,000 to $14,999 | 26 (3.5%) | 127 (30.5%) |
| $15,000 to $19,999 | 28 (3.7%) | 74 (17.8%) |
| $20,000 to $24,999 | 59 (7.9%) | 7 (1.7%) |
| $25,000 to $34,999 | 91 (12.1%) | 8 (1.9%) |
| $35,000 to $49,999 | 96 (12.8%) | 131 (31.5%) |
| $50,000 to $74,999 | 164 (21.8%) | 49 (11.8%) |
| $75,000 to $99,999 | 55 (7.3%) | 3 (0.7%) |
| $100,000 to $149,999 | 170 (22.6%) | 0 (0.0%) |
| $150,000 or more | 32 (4.3%) | 9 (2.2%) |
| Total | 752 (100.0%) | 416 (100.0%) |
Monthly Housing Cost Tiers in Cut Bank
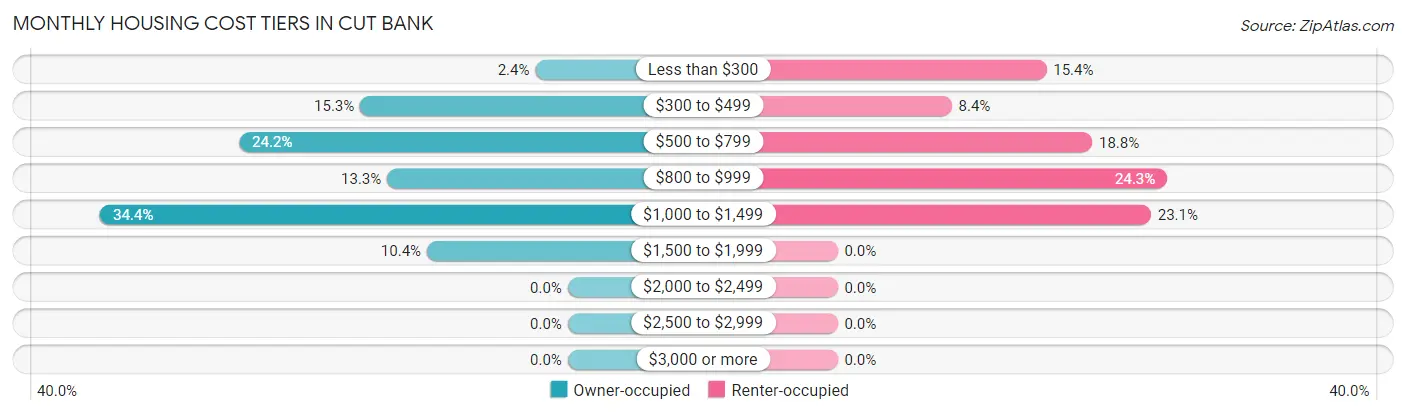
| Monthly Cost | Owner-occupied | Renter-occupied |
| Less than $300 | 18 (2.4%) | 64 (15.4%) |
| $300 to $499 | 115 (15.3%) | 35 (8.4%) |
| $500 to $799 | 182 (24.2%) | 78 (18.8%) |
| $800 to $999 | 100 (13.3%) | 101 (24.3%) |
| $1,000 to $1,499 | 259 (34.4%) | 96 (23.1%) |
| $1,500 to $1,999 | 78 (10.4%) | 0 (0.0%) |
| $2,000 to $2,499 | 0 (0.0%) | 0 (0.0%) |
| $2,500 to $2,999 | 0 (0.0%) | 0 (0.0%) |
| $3,000 or more | 0 (0.0%) | 0 (0.0%) |
| Total | 752 (100.0%) | 416 (100.0%) |
Physical Housing Characteristics in Cut Bank
Housing Structures in Cut Bank
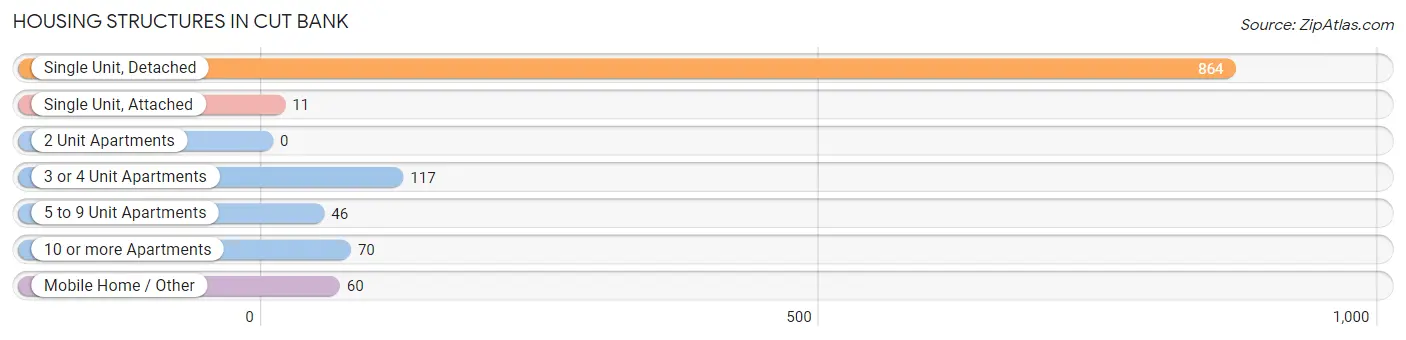
| Structure Type | # Housing Units | % Housing Units |
| Single Unit, Detached | 864 | 74.0% |
| Single Unit, Attached | 11 | 0.9% |
| 2 Unit Apartments | 0 | 0.0% |
| 3 or 4 Unit Apartments | 117 | 10.0% |
| 5 to 9 Unit Apartments | 46 | 3.9% |
| 10 or more Apartments | 70 | 6.0% |
| Mobile Home / Other | 60 | 5.1% |
| Total | 1,168 | 100.0% |
Housing Structures by Occupancy in Cut Bank
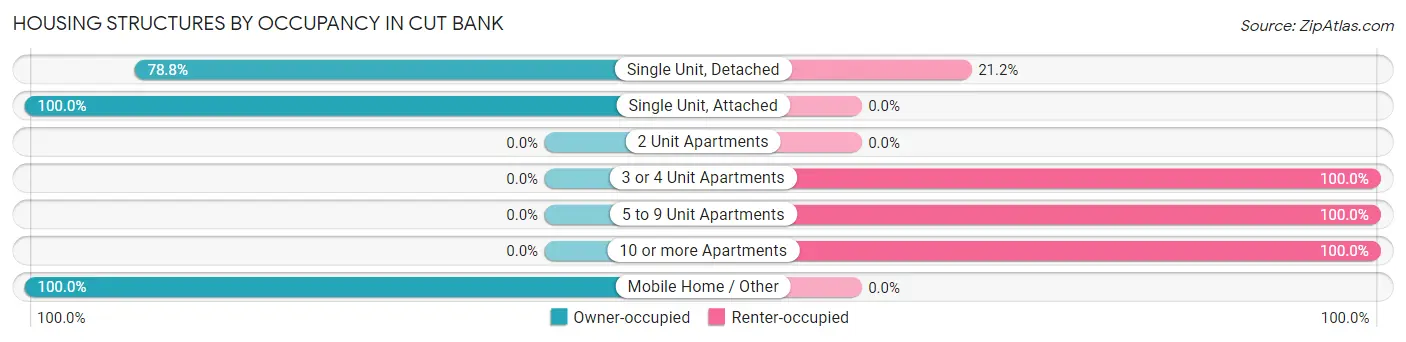
| Structure Type | Owner-occupied | Renter-occupied |
| Single Unit, Detached | 681 (78.8%) | 183 (21.2%) |
| Single Unit, Attached | 11 (100.0%) | 0 (0.0%) |
| 2 Unit Apartments | 0 (0.0%) | 0 (0.0%) |
| 3 or 4 Unit Apartments | 0 (0.0%) | 117 (100.0%) |
| 5 to 9 Unit Apartments | 0 (0.0%) | 46 (100.0%) |
| 10 or more Apartments | 0 (0.0%) | 70 (100.0%) |
| Mobile Home / Other | 60 (100.0%) | 0 (0.0%) |
| Total | 752 (64.4%) | 416 (35.6%) |
Housing Structures by Number of Rooms in Cut Bank
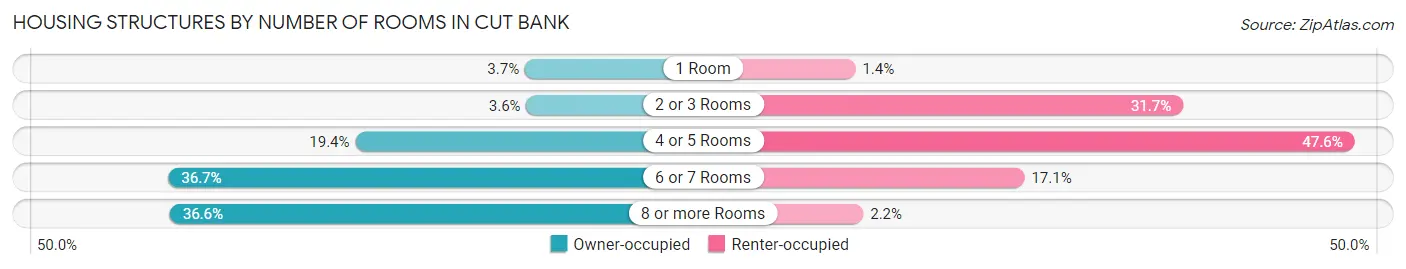
| Number of Rooms | Owner-occupied | Renter-occupied |
| 1 Room | 28 (3.7%) | 6 (1.4%) |
| 2 or 3 Rooms | 27 (3.6%) | 132 (31.7%) |
| 4 or 5 Rooms | 146 (19.4%) | 198 (47.6%) |
| 6 or 7 Rooms | 276 (36.7%) | 71 (17.1%) |
| 8 or more Rooms | 275 (36.6%) | 9 (2.2%) |
| Total | 752 (100.0%) | 416 (100.0%) |
Housing Structure by Heating Type in Cut Bank
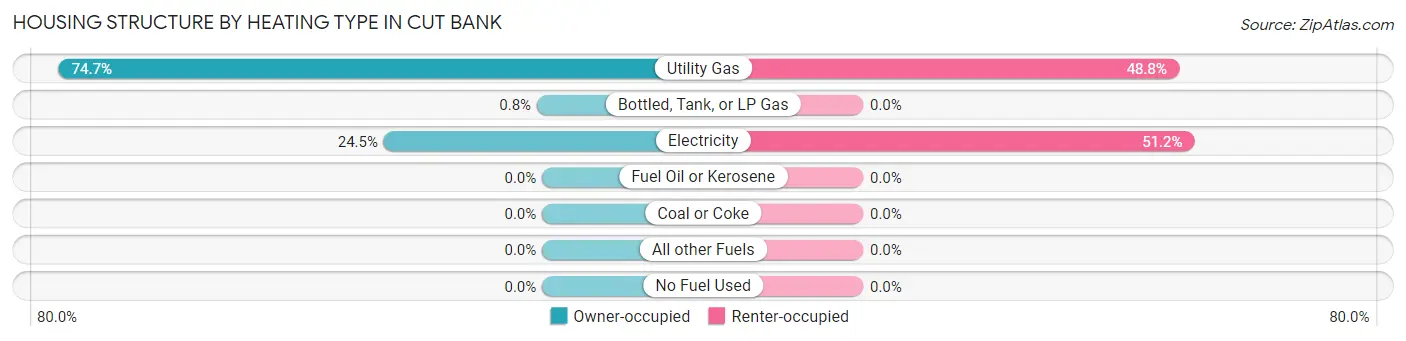
| Heating Type | Owner-occupied | Renter-occupied |
| Utility Gas | 562 (74.7%) | 203 (48.8%) |
| Bottled, Tank, or LP Gas | 6 (0.8%) | 0 (0.0%) |
| Electricity | 184 (24.5%) | 213 (51.2%) |
| Fuel Oil or Kerosene | 0 (0.0%) | 0 (0.0%) |
| Coal or Coke | 0 (0.0%) | 0 (0.0%) |
| All other Fuels | 0 (0.0%) | 0 (0.0%) |
| No Fuel Used | 0 (0.0%) | 0 (0.0%) |
| Total | 752 (100.0%) | 416 (100.0%) |
Household Vehicle Usage in Cut Bank
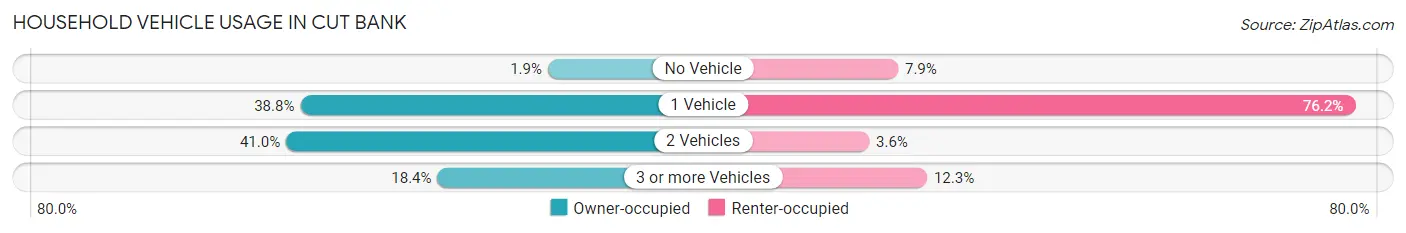
| Vehicles per Household | Owner-occupied | Renter-occupied |
| No Vehicle | 14 (1.9%) | 33 (7.9%) |
| 1 Vehicle | 292 (38.8%) | 317 (76.2%) |
| 2 Vehicles | 308 (41.0%) | 15 (3.6%) |
| 3 or more Vehicles | 138 (18.3%) | 51 (12.3%) |
| Total | 752 (100.0%) | 416 (100.0%) |
Real Estate & Mortgages in Cut Bank
Real Estate and Mortgage Overview in Cut Bank
| Characteristic | Without Mortgage | With Mortgage |
| Housing Units | 261 | 491 |
| Median Property Value | $80,500 | $141,300 |
| Median Household Income | $35,875 | $22 |
| Monthly Housing Costs | $489 | $0 |
| Real Estate Taxes | $951 | $0 |
Property Value by Mortgage Status in Cut Bank
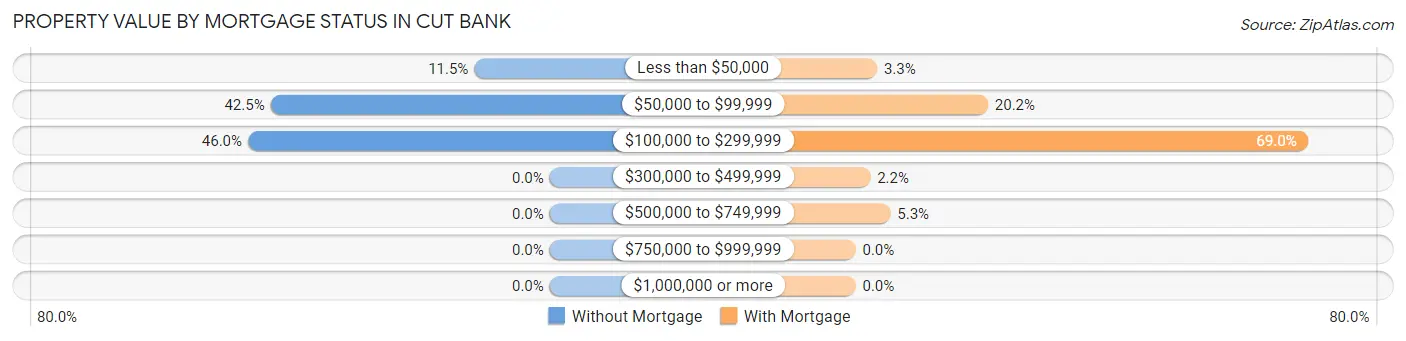
| Property Value | Without Mortgage | With Mortgage |
| Less than $50,000 | 30 (11.5%) | 16 (3.3%) |
| $50,000 to $99,999 | 111 (42.5%) | 99 (20.2%) |
| $100,000 to $299,999 | 120 (46.0%) | 339 (69.0%) |
| $300,000 to $499,999 | 0 (0.0%) | 11 (2.2%) |
| $500,000 to $749,999 | 0 (0.0%) | 26 (5.3%) |
| $750,000 to $999,999 | 0 (0.0%) | 0 (0.0%) |
| $1,000,000 or more | 0 (0.0%) | 0 (0.0%) |
| Total | 261 (100.0%) | 491 (100.0%) |
Household Income by Mortgage Status in Cut Bank
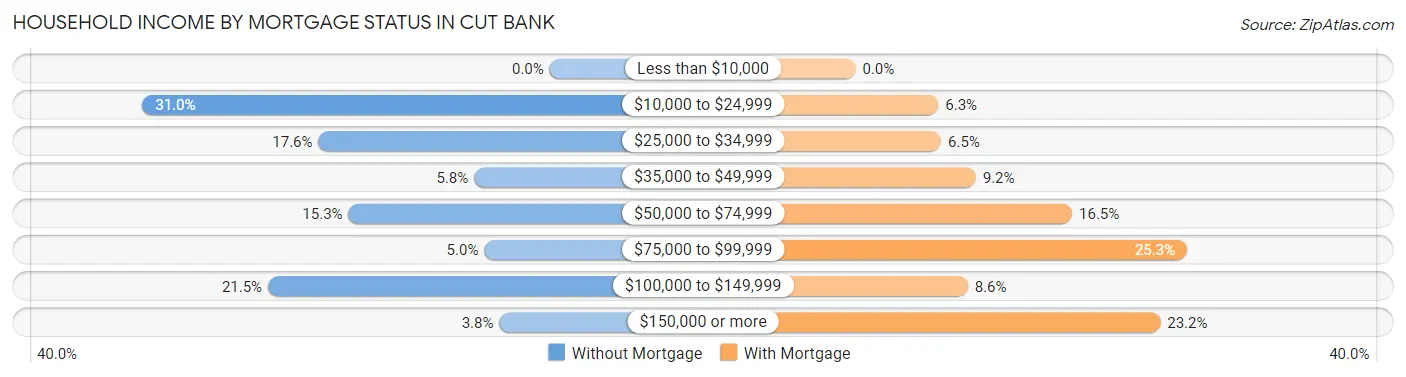
| Household Income | Without Mortgage | With Mortgage |
| Less than $10,000 | 0 (0.0%) | 0 (0.0%) |
| $10,000 to $24,999 | 81 (31.0%) | 31 (6.3%) |
| $25,000 to $34,999 | 46 (17.6%) | 32 (6.5%) |
| $35,000 to $49,999 | 15 (5.8%) | 45 (9.2%) |
| $50,000 to $74,999 | 40 (15.3%) | 81 (16.5%) |
| $75,000 to $99,999 | 13 (5.0%) | 124 (25.3%) |
| $100,000 to $149,999 | 56 (21.5%) | 42 (8.6%) |
| $150,000 or more | 10 (3.8%) | 114 (23.2%) |
| Total | 261 (100.0%) | 491 (100.0%) |
Property Value to Household Income Ratio in Cut Bank
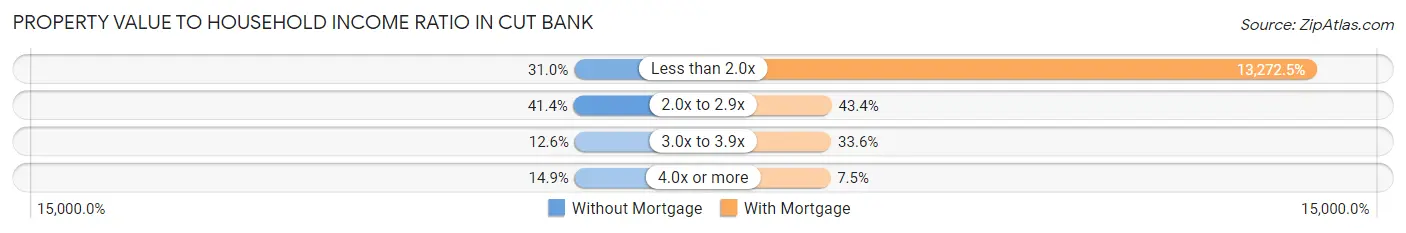
| Value-to-Income Ratio | Without Mortgage | With Mortgage |
| Less than 2.0x | 81 (31.0%) | 65,168 (13,272.5%) |
| 2.0x to 2.9x | 108 (41.4%) | 213 (43.4%) |
| 3.0x to 3.9x | 33 (12.6%) | 165 (33.6%) |
| 4.0x or more | 39 (14.9%) | 37 (7.5%) |
| Total | 261 (100.0%) | 491 (100.0%) |
Real Estate Taxes by Mortgage Status in Cut Bank
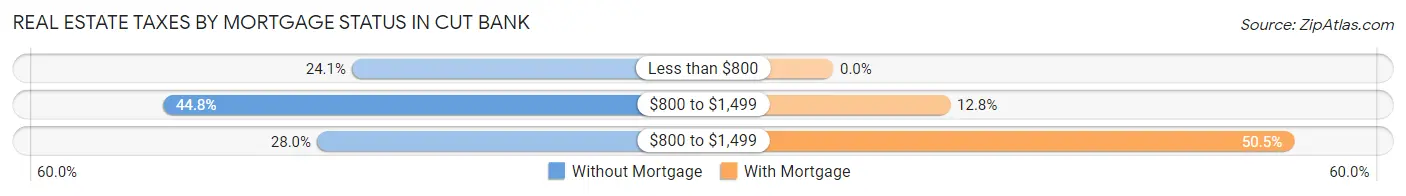
| Property Taxes | Without Mortgage | With Mortgage |
| Less than $800 | 63 (24.1%) | 0 (0.0%) |
| $800 to $1,499 | 117 (44.8%) | 63 (12.8%) |
| $800 to $1,499 | 73 (28.0%) | 248 (50.5%) |
| Total | 261 (100.0%) | 491 (100.0%) |
Health & Disability in Cut Bank
Health Insurance Coverage by Age in Cut Bank
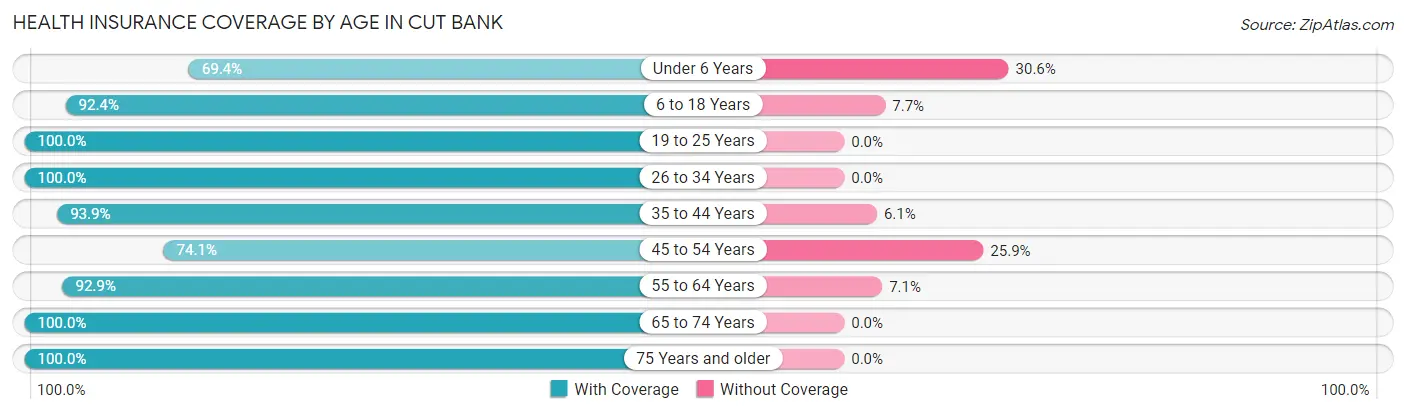
| Age Bracket | With Coverage | Without Coverage |
| Under 6 Years | 240 (69.4%) | 106 (30.6%) |
| 6 to 18 Years | 628 (92.3%) | 52 (7.6%) |
| 19 to 25 Years | 131 (100.0%) | 0 (0.0%) |
| 26 to 34 Years | 256 (100.0%) | 0 (0.0%) |
| 35 to 44 Years | 370 (93.9%) | 24 (6.1%) |
| 45 to 54 Years | 257 (74.1%) | 90 (25.9%) |
| 55 to 64 Years | 407 (92.9%) | 31 (7.1%) |
| 65 to 74 Years | 230 (100.0%) | 0 (0.0%) |
| 75 Years and older | 177 (100.0%) | 0 (0.0%) |
| Total | 2,696 (89.9%) | 303 (10.1%) |
Health Insurance Coverage by Citizenship Status in Cut Bank
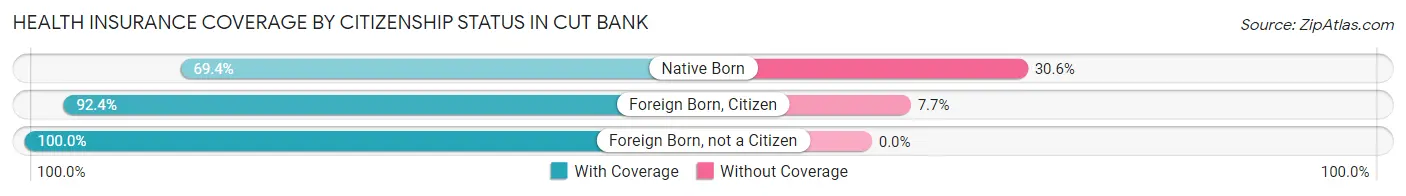
| Citizenship Status | With Coverage | Without Coverage |
| Native Born | 240 (69.4%) | 106 (30.6%) |
| Foreign Born, Citizen | 628 (92.3%) | 52 (7.6%) |
| Foreign Born, not a Citizen | 131 (100.0%) | 0 (0.0%) |
Health Insurance Coverage by Household Income in Cut Bank
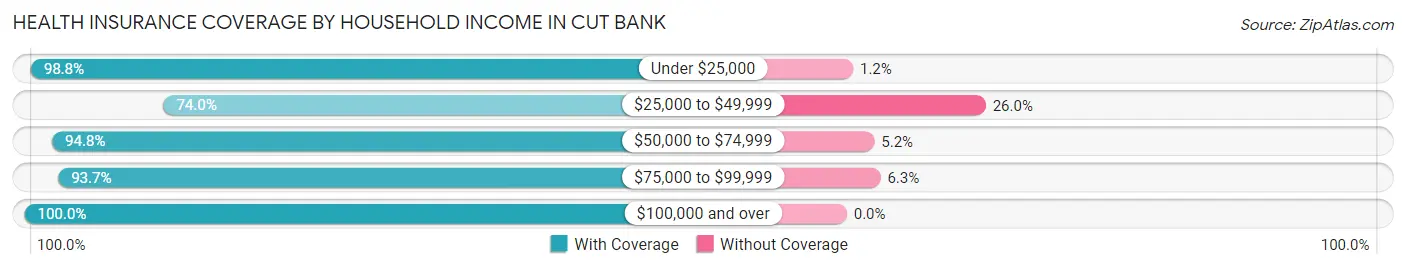
| Household Income | With Coverage | Without Coverage |
| Under $25,000 | 676 (98.8%) | 8 (1.2%) |
| $25,000 to $49,999 | 719 (74.0%) | 253 (26.0%) |
| $50,000 to $74,999 | 533 (94.8%) | 29 (5.2%) |
| $75,000 to $99,999 | 193 (93.7%) | 13 (6.3%) |
| $100,000 and over | 575 (100.0%) | 0 (0.0%) |
Public vs Private Health Insurance Coverage by Age in Cut Bank
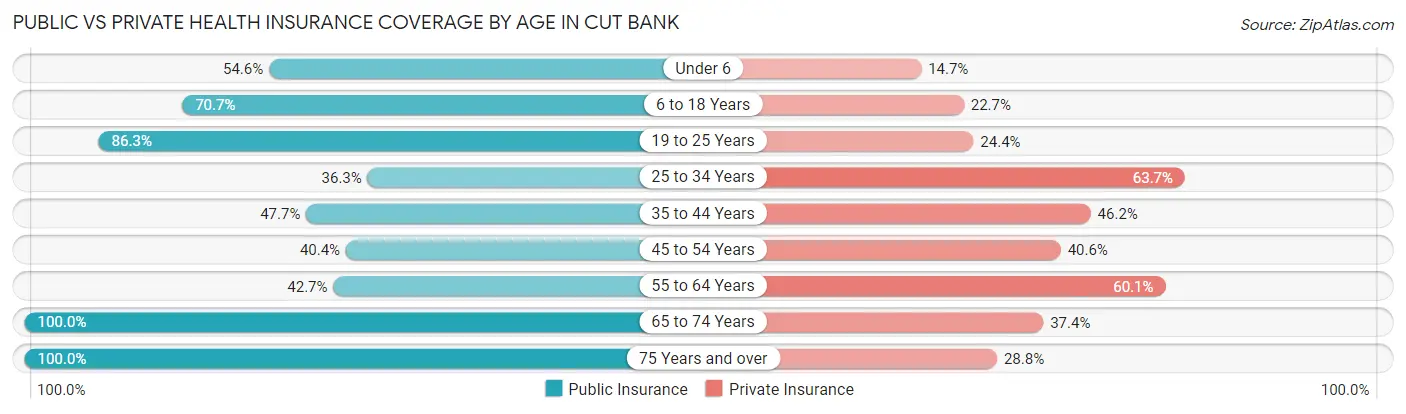
| Age Bracket | Public Insurance | Private Insurance |
| Under 6 | 189 (54.6%) | 51 (14.7%) |
| 6 to 18 Years | 481 (70.7%) | 154 (22.7%) |
| 19 to 25 Years | 113 (86.3%) | 32 (24.4%) |
| 25 to 34 Years | 93 (36.3%) | 163 (63.7%) |
| 35 to 44 Years | 188 (47.7%) | 182 (46.2%) |
| 45 to 54 Years | 140 (40.4%) | 141 (40.6%) |
| 55 to 64 Years | 187 (42.7%) | 263 (60.1%) |
| 65 to 74 Years | 230 (100.0%) | 86 (37.4%) |
| 75 Years and over | 177 (100.0%) | 51 (28.8%) |
| Total | 1,798 (60.0%) | 1,123 (37.4%) |
Disability Status by Sex by Age in Cut Bank
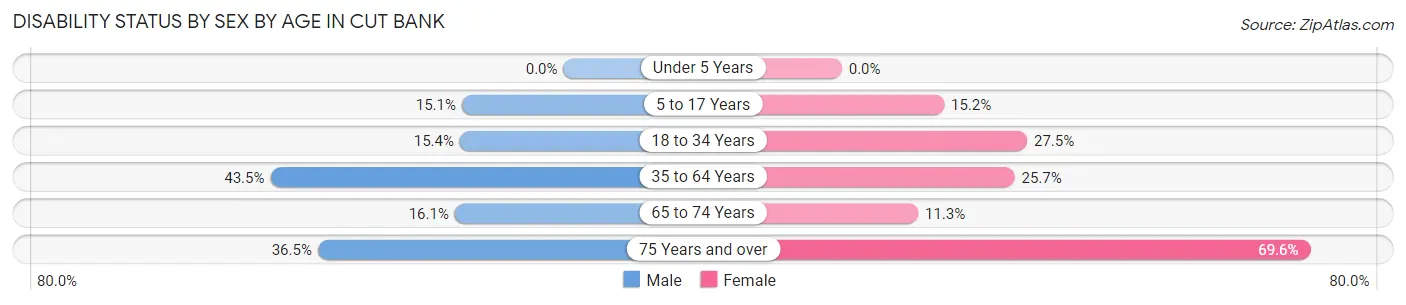
| Age Bracket | Male | Female |
| Under 5 Years | 0 (0.0%) | 0 (0.0%) |
| 5 to 17 Years | 60 (15.1%) | 46 (15.2%) |
| 18 to 34 Years | 28 (15.4%) | 63 (27.5%) |
| 35 to 64 Years | 245 (43.5%) | 158 (25.7%) |
| 65 to 74 Years | 20 (16.1%) | 12 (11.3%) |
| 75 Years and over | 31 (36.5%) | 64 (69.6%) |
Disability Class by Sex by Age in Cut Bank
Disability Class: Hearing Difficulty
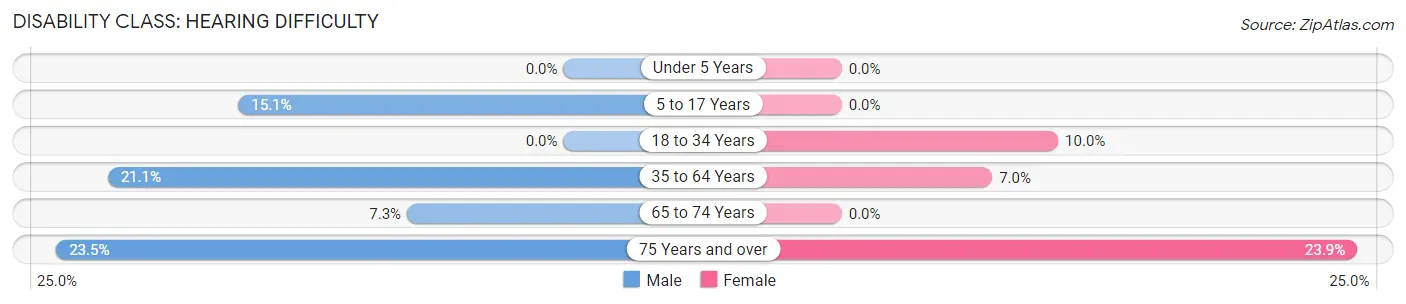
| Age Bracket | Male | Female |
| Under 5 Years | 0 (0.0%) | 0 (0.0%) |
| 5 to 17 Years | 60 (15.1%) | 0 (0.0%) |
| 18 to 34 Years | 0 (0.0%) | 23 (10.0%) |
| 35 to 64 Years | 119 (21.1%) | 43 (7.0%) |
| 65 to 74 Years | 9 (7.3%) | 0 (0.0%) |
| 75 Years and over | 20 (23.5%) | 22 (23.9%) |
Disability Class: Vision Difficulty
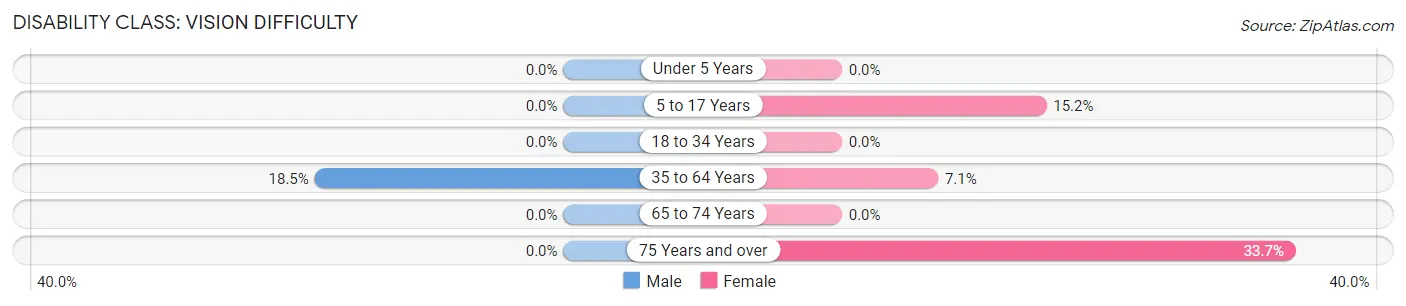
| Age Bracket | Male | Female |
| Under 5 Years | 0 (0.0%) | 0 (0.0%) |
| 5 to 17 Years | 0 (0.0%) | 46 (15.2%) |
| 18 to 34 Years | 0 (0.0%) | 0 (0.0%) |
| 35 to 64 Years | 104 (18.5%) | 44 (7.1%) |
| 65 to 74 Years | 0 (0.0%) | 0 (0.0%) |
| 75 Years and over | 0 (0.0%) | 31 (33.7%) |
Disability Class: Cognitive Difficulty
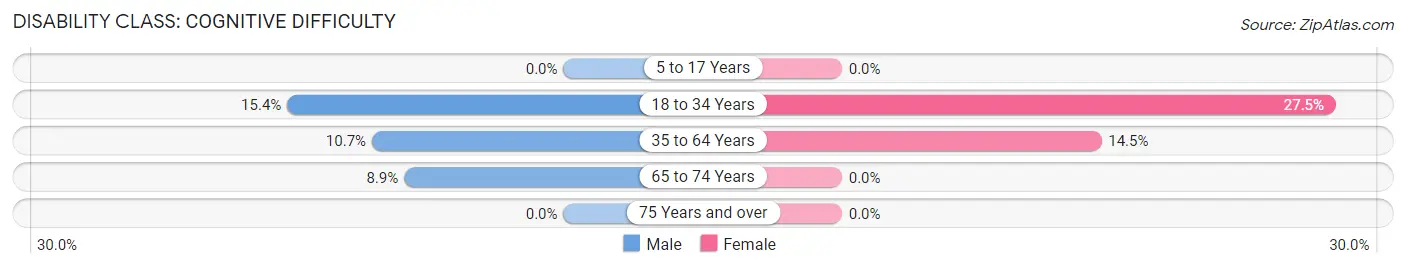
| Age Bracket | Male | Female |
| 5 to 17 Years | 0 (0.0%) | 0 (0.0%) |
| 18 to 34 Years | 28 (15.4%) | 63 (27.5%) |
| 35 to 64 Years | 60 (10.7%) | 89 (14.4%) |
| 65 to 74 Years | 11 (8.9%) | 0 (0.0%) |
| 75 Years and over | 0 (0.0%) | 0 (0.0%) |
Disability Class: Ambulatory Difficulty
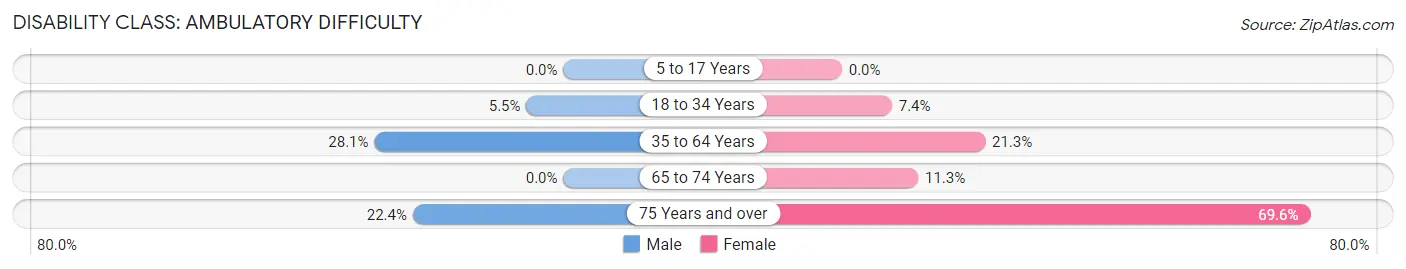
| Age Bracket | Male | Female |
| 5 to 17 Years | 0 (0.0%) | 0 (0.0%) |
| 18 to 34 Years | 10 (5.5%) | 17 (7.4%) |
| 35 to 64 Years | 158 (28.1%) | 131 (21.3%) |
| 65 to 74 Years | 0 (0.0%) | 12 (11.3%) |
| 75 Years and over | 19 (22.4%) | 64 (69.6%) |
Disability Class: Self-Care Difficulty
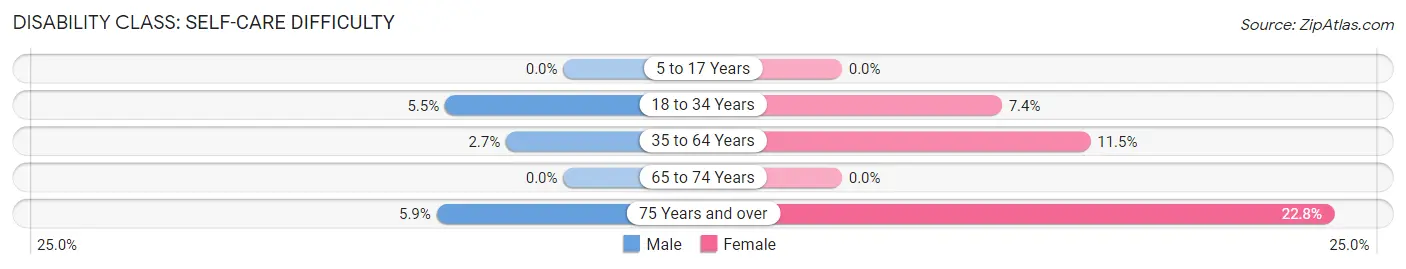
| Age Bracket | Male | Female |
| 5 to 17 Years | 0 (0.0%) | 0 (0.0%) |
| 18 to 34 Years | 10 (5.5%) | 17 (7.4%) |
| 35 to 64 Years | 15 (2.7%) | 71 (11.5%) |
| 65 to 74 Years | 0 (0.0%) | 0 (0.0%) |
| 75 Years and over | 5 (5.9%) | 21 (22.8%) |
Technology Access in Cut Bank
Computing Device Access in Cut Bank
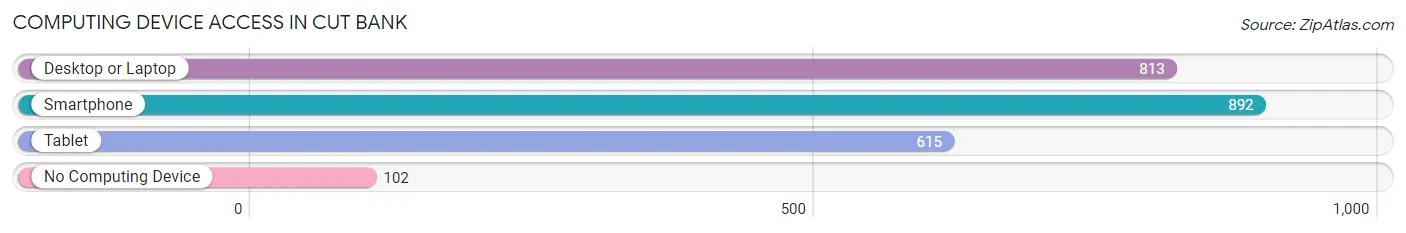
| Device Type | # Households | % Households |
| Desktop or Laptop | 813 | 69.6% |
| Smartphone | 892 | 76.4% |
| Tablet | 615 | 52.6% |
| No Computing Device | 102 | 8.7% |
| Total | 1,168 | 100.0% |
Internet Access in Cut Bank
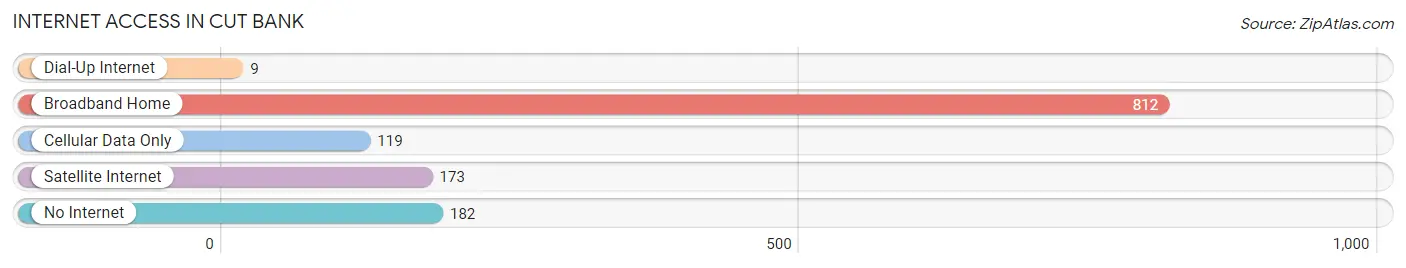
| Internet Type | # Households | % Households |
| Dial-Up Internet | 9 | 0.8% |
| Broadband Home | 812 | 69.5% |
| Cellular Data Only | 119 | 10.2% |
| Satellite Internet | 173 | 14.8% |
| No Internet | 182 | 15.6% |
| Total | 1,168 | 100.0% |
Cut Bank Summary
Bank, Montana is a small town located in the north-central part of the state, in Glacier County. It is situated on the banks of the Cut Bank Creek, which is a tributary of the Marias River. The town was founded in 1887 and was named after the creek. It is the county seat of Glacier County and is the largest town in the county.
History
The area around Cut Bank was first inhabited by the Blackfeet Indians, who used the area for hunting and gathering. The first white settlers arrived in the area in the late 1800s, and the town of Cut Bank was founded in 1887. The town was named after the creek, which was named by fur traders who used the creek to cut through the thick brush in the area.
The town grew quickly, and by the early 1900s, it had become a major trading center for the surrounding area. The town was also home to a number of businesses, including a bank, a hotel, a newspaper, and a number of stores.
In the early 1900s, the Great Northern Railway was built through the town, connecting it to other parts of the state. This helped to further spur the growth of the town, and by the 1920s, it had become a major agricultural center.
Geography
Cut Bank is located in the north-central part of Montana, in Glacier County. It is situated on the banks of the Cut Bank Creek, which is a tributary of the Marias River. The town is located at an elevation of 3,400 feet, and the surrounding area is mostly flat, with rolling hills and grasslands.
The town is located in a semi-arid climate, with hot summers and cold winters. The average annual temperature is around 45 degrees Fahrenheit, and the average annual precipitation is around 12 inches.
Economy
The economy of Cut Bank is largely based on agriculture and tourism. The town is home to a number of farms, which produce a variety of crops, including wheat, barley, oats, and hay. The town is also home to a number of tourist attractions, including the Cut Bank Creek Wildlife Refuge, the Cut Bank Museum, and the Cut Bank Historic District.
The town is also home to a number of businesses, including a bank, a hotel, a newspaper, and a number of stores. The town is also home to a number of manufacturing companies, which produce a variety of products, including furniture, clothing, and food products.
Demographics
As of the 2010 census, the population of Cut Bank was 2,844. The racial makeup of the town was 94.3% White, 0.3% African American, 0.7% Native American, 0.2% Asian, 0.1% Pacific Islander, and 4.4% from other races. The median household income was $37,917, and the median family income was $45,938.
Conclusion
Cut Bank, Montana is a small town located in the north-central part of the state, in Glacier County. It is situated on the banks of the Cut Bank Creek, which is a tributary of the Marias River. The town was founded in 1887 and was named after the creek. It is the county seat of Glacier County and is the largest town in the county. The economy of Cut Bank is largely based on agriculture and tourism, and the town is home to a number of businesses, including a bank, a hotel, a newspaper, and a number of stores. As of the 2010 census, the population of Cut Bank was 2,844. The racial makeup of the town was 94.3% White, 0.3% African American, 0.7% Native American, 0.2% Asian, 0.1% Pacific Islander, and 4.4% from other races. The median household income was $37,917, and the median family income was $45,938.
Common Questions
What is Per Capita Income in Cut Bank?
Per Capita income in Cut Bank is $22,232.
What is the Median Family Income in Cut Bank?
Median Family Income in Cut Bank is $53,697.
What is the Median Household income in Cut Bank?
Median Household Income in Cut Bank is $41,759.
What is Income or Wage Gap in Cut Bank?
Income or Wage Gap in Cut Bank is 22.7%.
Women in Cut Bank earn 77.3 cents for every dollar earned by a man.
What is Inequality or Gini Index in Cut Bank?
Inequality or Gini Index in Cut Bank is 0.42.
What is the Total Population of Cut Bank?
Total Population of Cut Bank is 3,061.
What is the Total Male Population of Cut Bank?
Total Male Population of Cut Bank is 1,632.
What is the Total Female Population of Cut Bank?
Total Female Population of Cut Bank is 1,429.
What is the Ratio of Males per 100 Females in Cut Bank?
There are 114.21 Males per 100 Females in Cut Bank.
What is the Ratio of Females per 100 Males in Cut Bank?
There are 87.56 Females per 100 Males in Cut Bank.
What is the Median Population Age in Cut Bank?
Median Population Age in Cut Bank is 37.8 Years.
What is the Average Family Size in Cut Bank
Average Family Size in Cut Bank is 3.3 People.
What is the Average Household Size in Cut Bank
Average Household Size in Cut Bank is 2.6 People.
How Large is the Labor Force in Cut Bank?
There are 1,072 People in the Labor Forcein in Cut Bank.
What is the Percentage of People in the Labor Force in Cut Bank?
50.6% of People are in the Labor Force in Cut Bank.
What is the Unemployment Rate in Cut Bank?
Unemployment Rate in Cut Bank is 2.6%.