Sherman, TX Map & Demographics
Sherman Map
Sherman Overview
$30,605
PER CAPITA INCOME
$68,525
AVG FAMILY INCOME
$58,020
AVG HOUSEHOLD INCOME
30.3%
WAGE / INCOME GAP [ % ]
69.7¢/ $1
WAGE / INCOME GAP [ $ ]
$10,268
FAMILY INCOME DEFICIT
0.45
INEQUALITY / GINI INDEX
44,052
TOTAL POPULATION
21,534
MALE POPULATION
22,518
FEMALE POPULATION
95.63
MALES / 100 FEMALES
104.57
FEMALES / 100 MALES
35.3
MEDIAN AGE
3.2
AVG FAMILY SIZE
2.5
AVG HOUSEHOLD SIZE
22,427
LABOR FORCE [ PEOPLE ]
64.8%
PERCENT IN LABOR FORCE
3.6%
UNEMPLOYMENT RATE
Sherman Area Codes
Income in Sherman
Income Overview in Sherman
Per Capita Income in Sherman is $30,605, while median incomes of families and households are $68,525 and $58,020 respectively.
| Characteristic | Number | Measure |
| Per Capita Income | 44,052 | $30,605 |
| Median Family Income | 10,801 | $68,525 |
| Mean Family Income | 10,801 | $89,649 |
| Median Household Income | 16,800 | $58,020 |
| Mean Household Income | 16,800 | $77,152 |
| Income Deficit | 10,801 | $10,268 |
| Wage / Income Gap (%) | 44,052 | 30.35% |
| Wage / Income Gap ($) | 44,052 | 69.65¢ per $1 |
| Gini / Inequality Index | 44,052 | 0.45 |
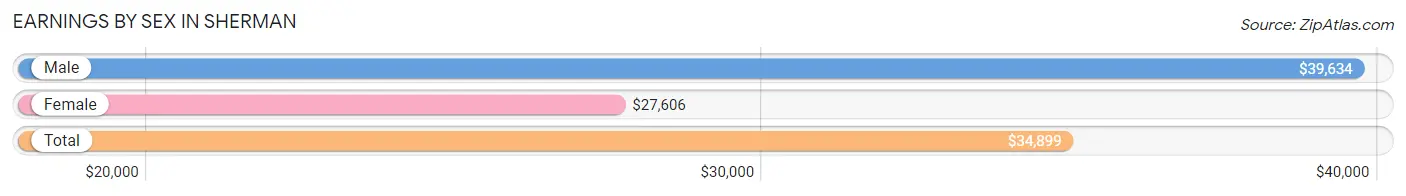
Earnings by Sex in Sherman
Average Earnings in Sherman are $34,899, $39,634 for men and $27,606 for women, a difference of 30.3%.
| Sex | Number | Average Earnings |
| Male | 12,006 (50.9%) | $39,634 |
| Female | 11,566 (49.1%) | $27,606 |
| Total | 23,572 (100.0%) | $34,899 |
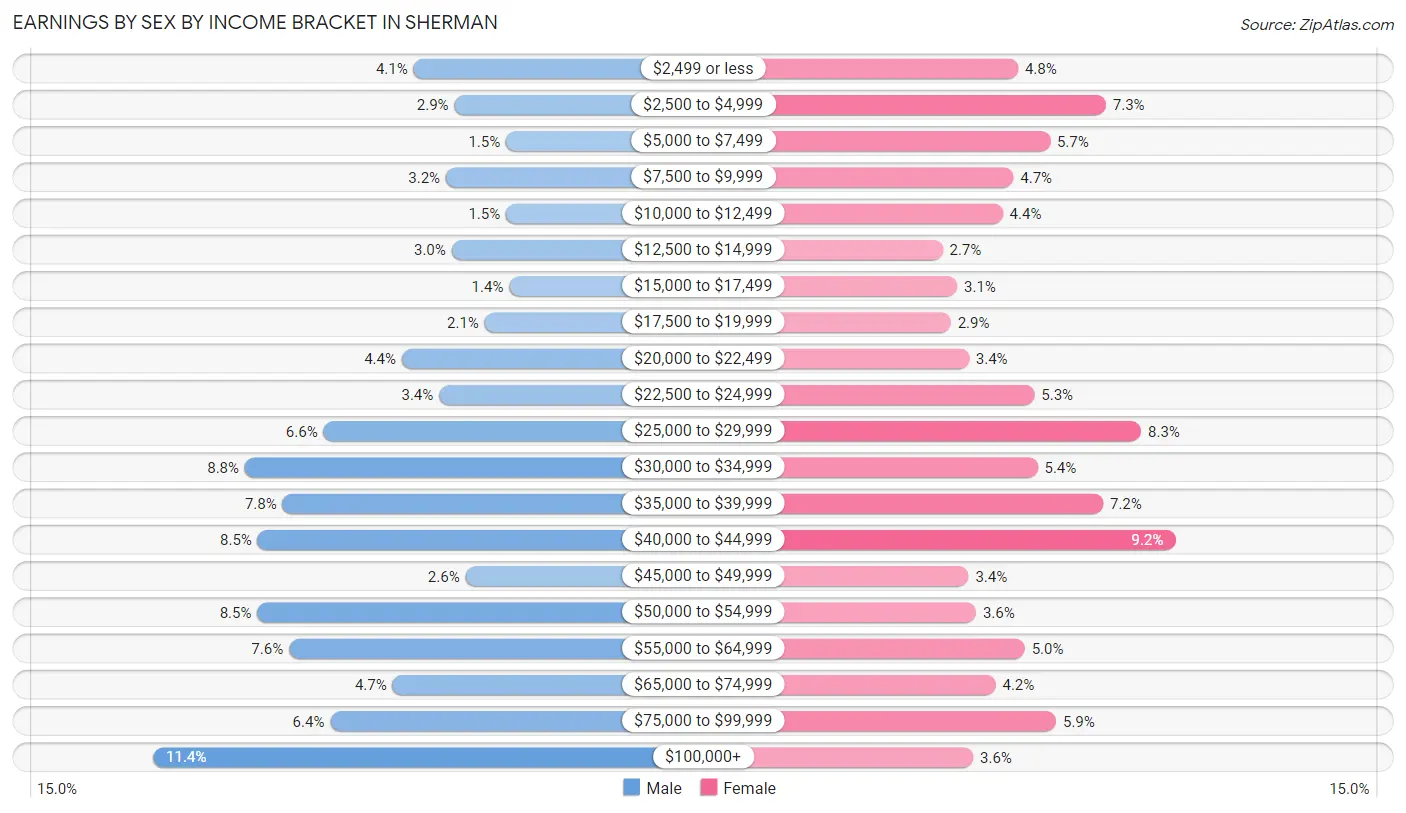
Earnings by Sex by Income Bracket in Sherman
The most common earnings brackets in Sherman are $100,000+ for men (1,367 | 11.4%) and $40,000 to $44,999 for women (1,068 | 9.2%).
| Income | Male | Female |
| $2,499 or less | 489 (4.1%) | 556 (4.8%) |
| $2,500 to $4,999 | 351 (2.9%) | 842 (7.3%) |
| $5,000 to $7,499 | 176 (1.5%) | 660 (5.7%) |
| $7,500 to $9,999 | 379 (3.2%) | 541 (4.7%) |
| $10,000 to $12,499 | 177 (1.5%) | 507 (4.4%) |
| $12,500 to $14,999 | 360 (3.0%) | 311 (2.7%) |
| $15,000 to $17,499 | 166 (1.4%) | 358 (3.1%) |
| $17,500 to $19,999 | 249 (2.1%) | 338 (2.9%) |
| $20,000 to $22,499 | 528 (4.4%) | 397 (3.4%) |
| $22,500 to $24,999 | 402 (3.4%) | 610 (5.3%) |
| $25,000 to $29,999 | 792 (6.6%) | 956 (8.3%) |
| $30,000 to $34,999 | 1,058 (8.8%) | 620 (5.4%) |
| $35,000 to $39,999 | 930 (7.7%) | 833 (7.2%) |
| $40,000 to $44,999 | 1,014 (8.5%) | 1,068 (9.2%) |
| $45,000 to $49,999 | 313 (2.6%) | 396 (3.4%) |
| $50,000 to $54,999 | 1,016 (8.5%) | 420 (3.6%) |
| $55,000 to $64,999 | 909 (7.6%) | 578 (5.0%) |
| $65,000 to $74,999 | 560 (4.7%) | 484 (4.2%) |
| $75,000 to $99,999 | 770 (6.4%) | 680 (5.9%) |
| $100,000+ | 1,367 (11.4%) | 411 (3.5%) |
| Total | 12,006 (100.0%) | 11,566 (100.0%) |
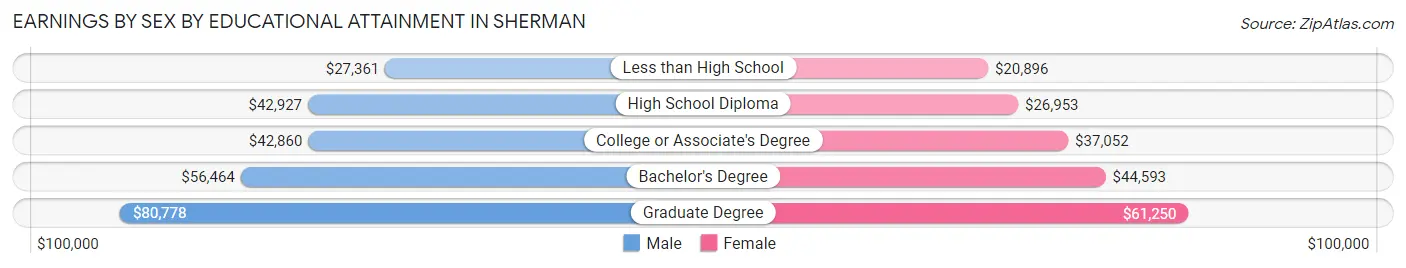
Earnings by Sex by Educational Attainment in Sherman
Average earnings in Sherman are $43,275 for men and $35,298 for women, a difference of 18.4%. Men with an educational attainment of graduate degree enjoy the highest average annual earnings of $80,778, while those with less than high school education earn the least with $27,361. Women with an educational attainment of graduate degree earn the most with the average annual earnings of $61,250, while those with less than high school education have the smallest earnings of $20,896.
| Educational Attainment | Male Income | Female Income |
| Less than High School | $27,361 | $20,896 |
| High School Diploma | $42,927 | $26,953 |
| College or Associate's Degree | $42,860 | $37,052 |
| Bachelor's Degree | $56,464 | $44,593 |
| Graduate Degree | $80,778 | $61,250 |
| Total | $43,275 | $35,298 |
Family Income in Sherman
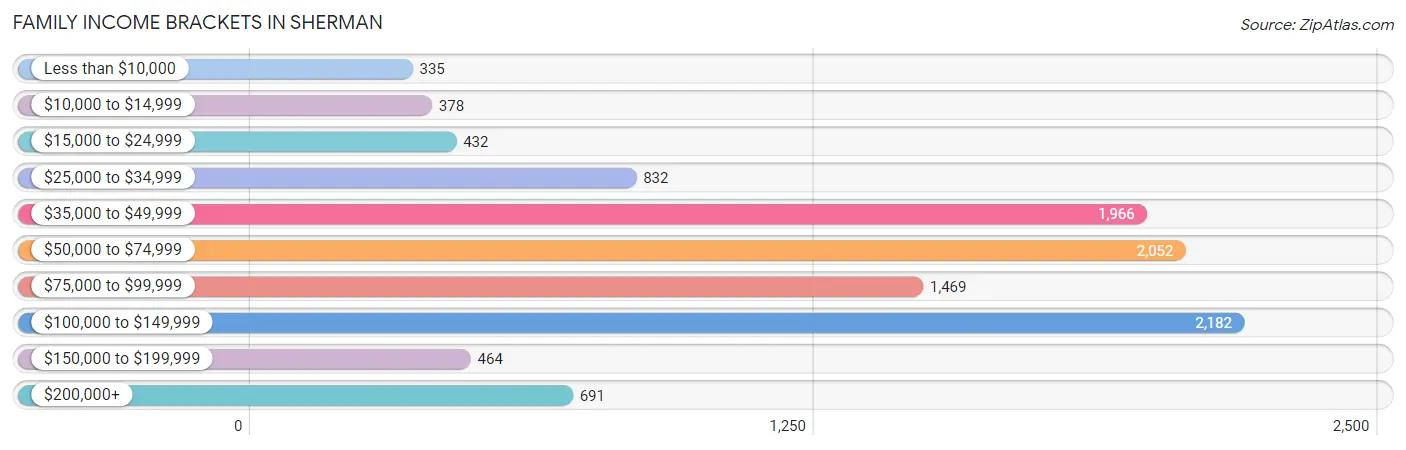
Family Income Brackets in Sherman
According to the Sherman family income data, there are 2,182 families falling into the $100,000 to $149,999 income range, which is the most common income bracket and makes up 20.2% of all families. Conversely, the less than $10,000 income bracket is the least frequent group with only 335 families (3.1%) belonging to this category.
| Income Bracket | # Families | % Families |
| Less than $10,000 | 335 | 3.1% |
| $10,000 to $14,999 | 378 | 3.5% |
| $15,000 to $24,999 | 432 | 4.0% |
| $25,000 to $34,999 | 832 | 7.7% |
| $35,000 to $49,999 | 1,966 | 18.2% |
| $50,000 to $74,999 | 2,052 | 19.0% |
| $75,000 to $99,999 | 1,469 | 13.6% |
| $100,000 to $149,999 | 2,182 | 20.2% |
| $150,000 to $199,999 | 464 | 4.3% |
| $200,000+ | 691 | 6.4% |
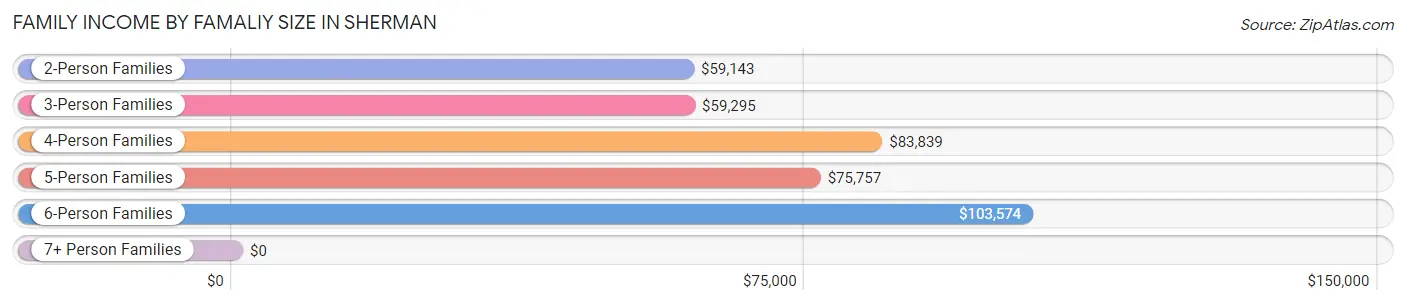
Family Income by Famaliy Size in Sherman
6-person families (485 | 4.5%) account for the highest median family income in Sherman with $103,574 per family, while 2-person families (5,385 | 49.9%) have the highest median income of $29,572 per family member.
| Income Bracket | # Families | Median Income |
| 2-Person Families | 5,385 (49.9%) | $59,143 |
| 3-Person Families | 2,302 (21.3%) | $59,295 |
| 4-Person Families | 1,674 (15.5%) | $83,839 |
| 5-Person Families | 891 (8.3%) | $75,757 |
| 6-Person Families | 485 (4.5%) | $103,574 |
| 7+ Person Families | 64 (0.6%) | $0 |
| Total | 10,801 (100.0%) | $68,525 |
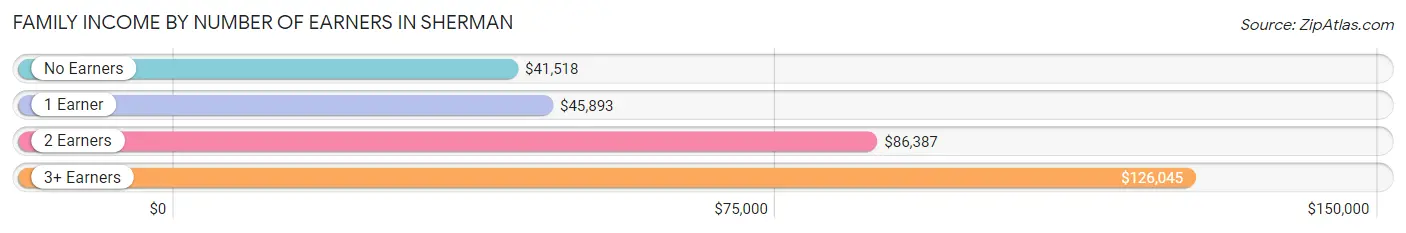
Family Income by Number of Earners in Sherman
The median family income in Sherman is $68,525, with families comprising 3+ earners (958) having the highest median family income of $126,045, while families with no earners (1,355) have the lowest median family income of $41,518, accounting for 8.9% and 12.6% of families, respectively.
| Number of Earners | # Families | Median Income |
| No Earners | 1,355 (12.6%) | $41,518 |
| 1 Earner | 3,811 (35.3%) | $45,893 |
| 2 Earners | 4,677 (43.3%) | $86,387 |
| 3+ Earners | 958 (8.9%) | $126,045 |
| Total | 10,801 (100.0%) | $68,525 |
Household Income in Sherman
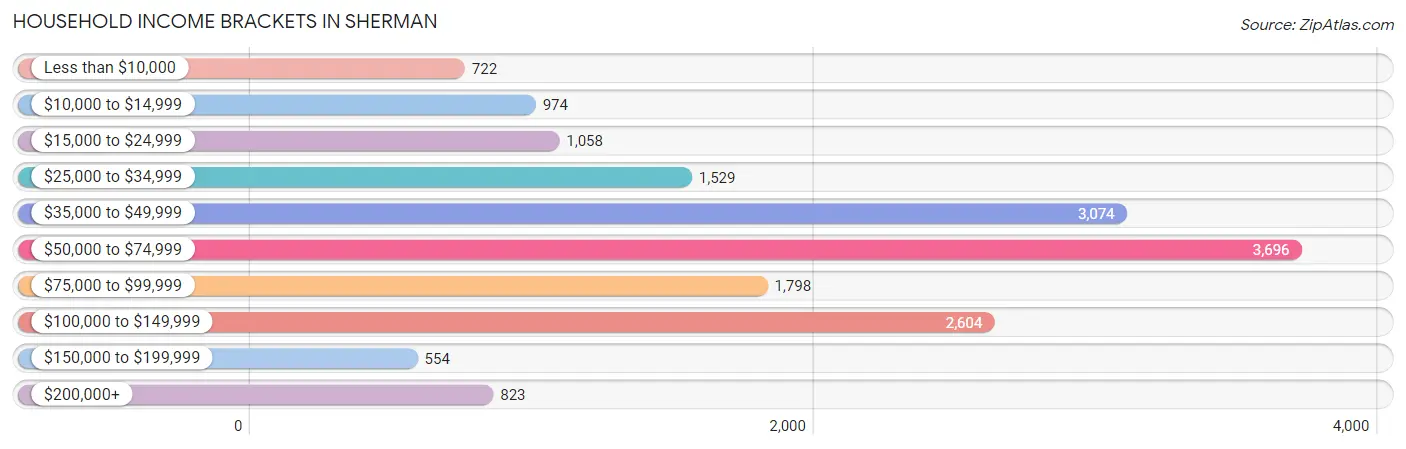
Household Income Brackets in Sherman
With 3,696 households falling in the category, the $50,000 to $74,999 income range is the most frequent in Sherman, accounting for 22.0% of all households. In contrast, only 554 households (3.3%) fall into the $150,000 to $199,999 income bracket, making it the least populous group.
| Income Bracket | # Households | % Households |
| Less than $10,000 | 722 | 4.3% |
| $10,000 to $14,999 | 974 | 5.8% |
| $15,000 to $24,999 | 1,058 | 6.3% |
| $25,000 to $34,999 | 1,529 | 9.1% |
| $35,000 to $49,999 | 3,074 | 18.3% |
| $50,000 to $74,999 | 3,696 | 22.0% |
| $75,000 to $99,999 | 1,798 | 10.7% |
| $100,000 to $149,999 | 2,604 | 15.5% |
| $150,000 to $199,999 | 554 | 3.3% |
| $200,000+ | 823 | 4.9% |
Household Income by Householder Age in Sherman
The median household income in Sherman is $58,020, with the highest median household income of $67,927 found in the 45 to 64 years age bracket for the primary householder. A total of 6,125 households (36.5%) fall into this category. Meanwhile, the 15 to 24 years age bracket for the primary householder has the lowest median household income of $44,185, with 1,005 households (6.0%) in this group.
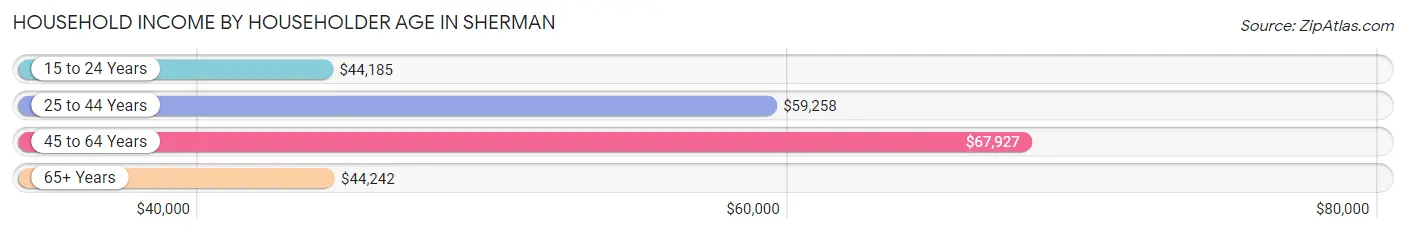
| Income Bracket | # Households | Median Income |
| 15 to 24 Years | 1,005 (6.0%) | $44,185 |
| 25 to 44 Years | 5,503 (32.8%) | $59,258 |
| 45 to 64 Years | 6,125 (36.5%) | $67,927 |
| 65+ Years | 4,167 (24.8%) | $44,242 |
| Total | 16,800 (100.0%) | $58,020 |
Poverty in Sherman
Income Below Poverty by Sex and Age in Sherman
With 11.3% poverty level for males and 14.2% for females among the residents of Sherman, 15 year old males and 16 and 17 year old females are the most vulnerable to poverty, with 83 males (43.5%) and 219 females (31.0%) in their respective age groups living below the poverty level.
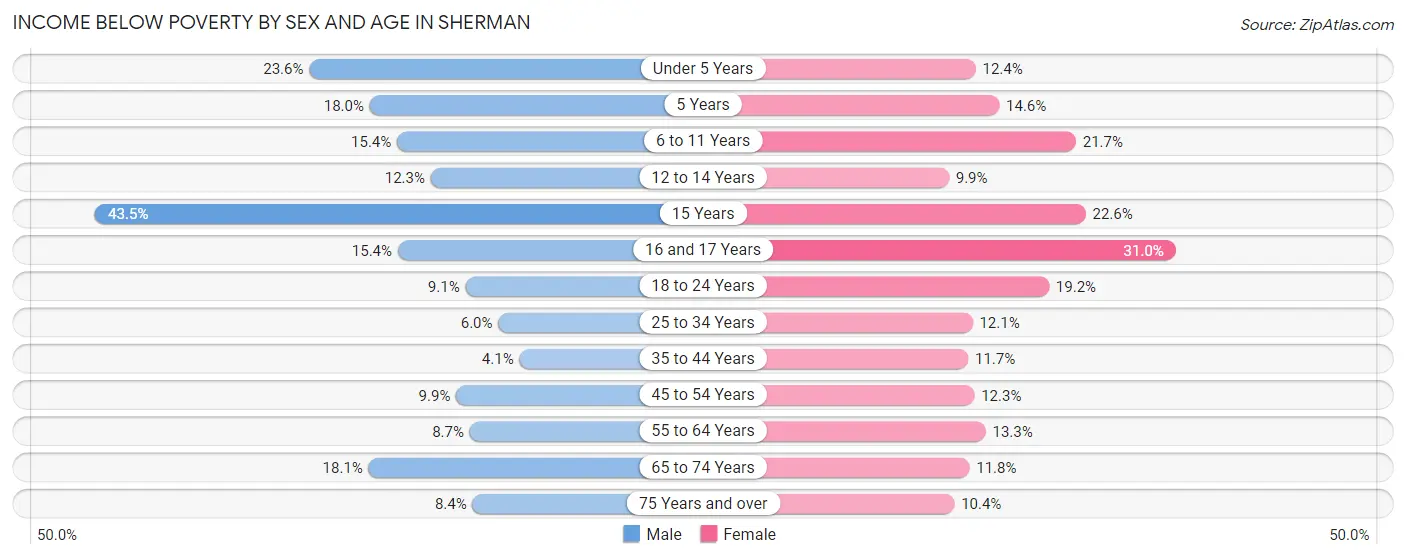
| Age Bracket | Male | Female |
| Under 5 Years | 393 (23.6%) | 177 (12.4%) |
| 5 Years | 37 (18.0%) | 73 (14.6%) |
| 6 to 11 Years | 265 (15.4%) | 344 (21.7%) |
| 12 to 14 Years | 145 (12.3%) | 71 (9.9%) |
| 15 Years | 83 (43.5%) | 19 (22.6%) |
| 16 and 17 Years | 82 (15.4%) | 219 (31.0%) |
| 18 to 24 Years | 144 (9.1%) | 407 (19.2%) |
| 25 to 34 Years | 213 (6.0%) | 344 (12.1%) |
| 35 to 44 Years | 94 (4.1%) | 288 (11.7%) |
| 45 to 54 Years | 215 (9.9%) | 308 (12.3%) |
| 55 to 64 Years | 227 (8.7%) | 421 (13.3%) |
| 65 to 74 Years | 353 (18.1%) | 253 (11.8%) |
| 75 Years and over | 82 (8.4%) | 149 (10.4%) |
| Total | 2,333 (11.3%) | 3,073 (14.2%) |
Income Above Poverty by Sex and Age in Sherman
According to the poverty statistics in Sherman, males aged 35 to 44 years and females aged 12 to 14 years are the age groups that are most secure financially, with 95.9% of males and 90.1% of females in these age groups living above the poverty line.
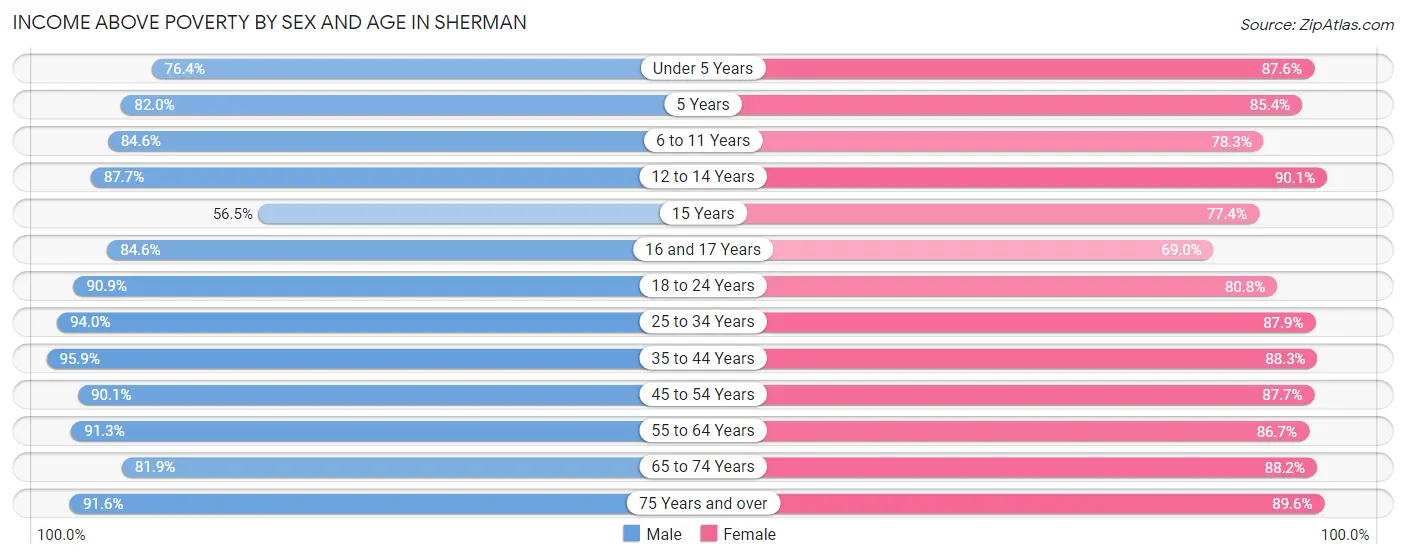
| Age Bracket | Male | Female |
| Under 5 Years | 1,274 (76.4%) | 1,249 (87.6%) |
| 5 Years | 169 (82.0%) | 427 (85.4%) |
| 6 to 11 Years | 1,452 (84.6%) | 1,240 (78.3%) |
| 12 to 14 Years | 1,034 (87.7%) | 644 (90.1%) |
| 15 Years | 108 (56.5%) | 65 (77.4%) |
| 16 and 17 Years | 452 (84.6%) | 488 (69.0%) |
| 18 to 24 Years | 1,442 (90.9%) | 1,711 (80.8%) |
| 25 to 34 Years | 3,317 (94.0%) | 2,491 (87.9%) |
| 35 to 44 Years | 2,213 (95.9%) | 2,169 (88.3%) |
| 45 to 54 Years | 1,948 (90.1%) | 2,199 (87.7%) |
| 55 to 64 Years | 2,389 (91.3%) | 2,736 (86.7%) |
| 65 to 74 Years | 1,600 (81.9%) | 1,885 (88.2%) |
| 75 Years and over | 891 (91.6%) | 1,280 (89.6%) |
| Total | 18,289 (88.7%) | 18,584 (85.8%) |
Income Below Poverty Among Married-Couple Families in Sherman
The poverty statistics for married-couple families in Sherman show that 4.0% or 296 of the total 7,484 families live below the poverty line. Families with 3 or 4 children have the highest poverty rate of 6.9%, comprising of 45 families. On the other hand, families with 1 or 2 children have the lowest poverty rate of 2.8%, which includes 77 families.
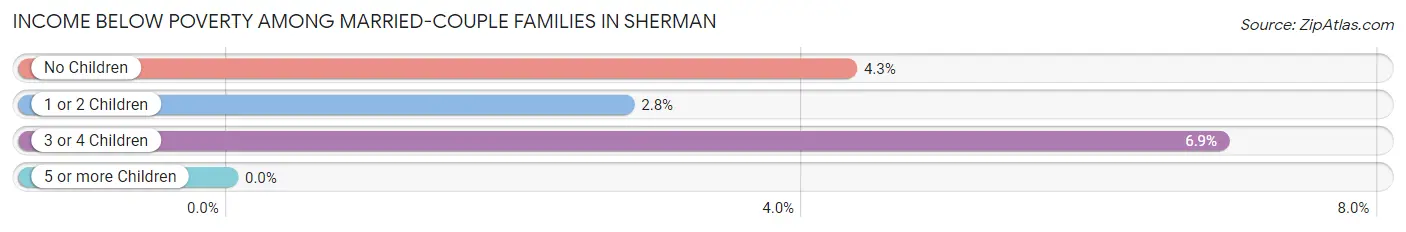
| Children | Above Poverty | Below Poverty |
| No Children | 3,865 (95.7%) | 174 (4.3%) |
| 1 or 2 Children | 2,716 (97.2%) | 77 (2.8%) |
| 3 or 4 Children | 607 (93.1%) | 45 (6.9%) |
| 5 or more Children | 0 (0.0%) | 0 (0.0%) |
| Total | 7,188 (96.0%) | 296 (4.0%) |
Income Below Poverty Among Single-Parent Households in Sherman
According to the poverty data in Sherman, 18.3% or 149 single-father households and 27.9% or 698 single-mother households are living below the poverty line. Among single-father households, those with 1 or 2 children have the highest poverty rate, with 114 households (31.1%) experiencing poverty. Likewise, among single-mother households, those with 3 or 4 children have the highest poverty rate, with 218 households (100.0%) falling below the poverty line.
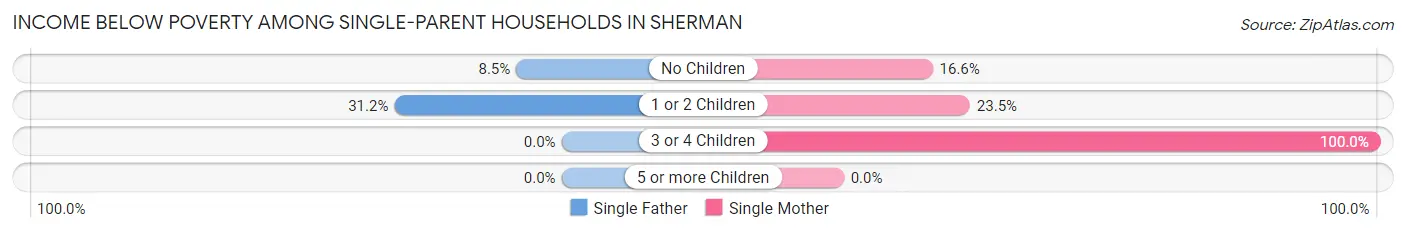
| Children | Single Father | Single Mother |
| No Children | 35 (8.5%) | 137 (16.6%) |
| 1 or 2 Children | 114 (31.1%) | 343 (23.5%) |
| 3 or 4 Children | 0 (0.0%) | 218 (100.0%) |
| 5 or more Children | 0 (0.0%) | 0 (0.0%) |
| Total | 149 (18.3%) | 698 (27.9%) |
Income Below Poverty Among Married-Couple vs Single-Parent Households in Sherman
The poverty data for Sherman shows that 296 of the married-couple family households (4.0%) and 847 of the single-parent households (25.5%) are living below the poverty level. Within the married-couple family households, those with 3 or 4 children have the highest poverty rate, with 45 households (6.9%) falling below the poverty line. Among the single-parent households, those with 3 or 4 children have the highest poverty rate, with 218 household (86.9%) living below poverty.
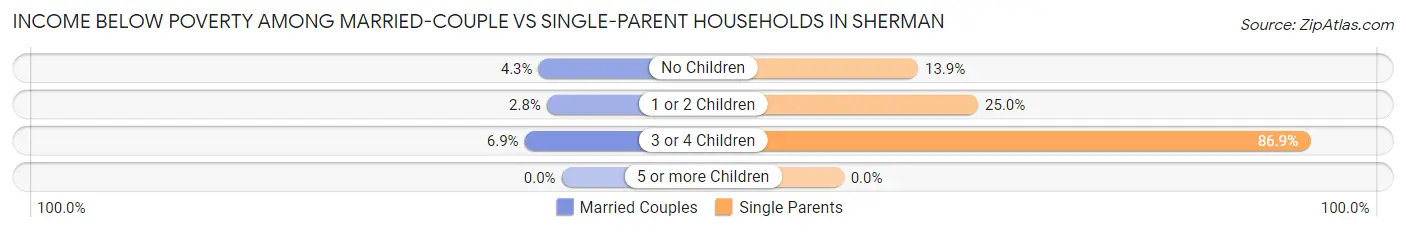
| Children | Married-Couple Families | Single-Parent Households |
| No Children | 174 (4.3%) | 172 (13.9%) |
| 1 or 2 Children | 77 (2.8%) | 457 (25.0%) |
| 3 or 4 Children | 45 (6.9%) | 218 (86.9%) |
| 5 or more Children | 0 (0.0%) | 0 (0.0%) |
| Total | 296 (4.0%) | 847 (25.5%) |
Race in Sherman
The most populous races in Sherman are White / Caucasian (32,439 | 73.6%), Hispanic or Latino (9,881 | 22.4%), and Black / African American (4,446 | 10.1%).
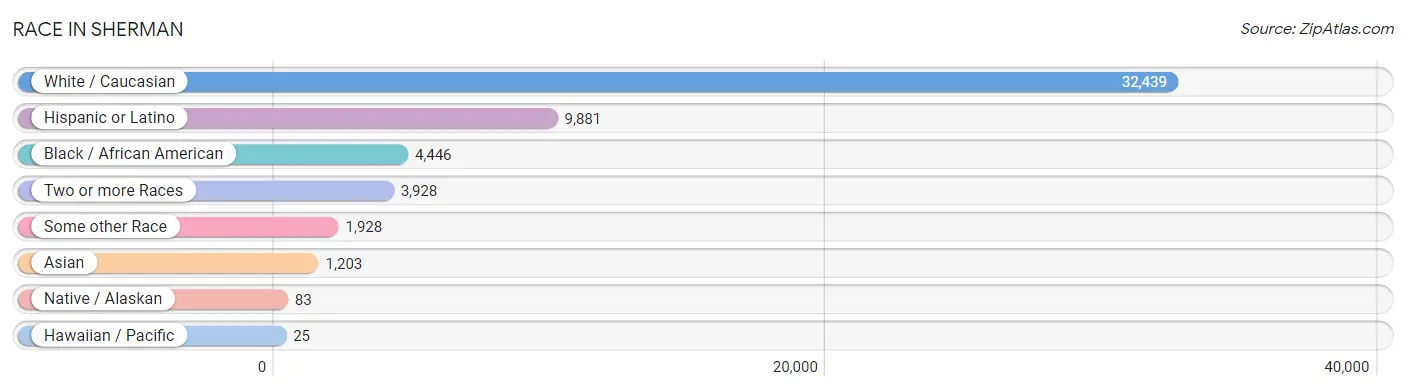
| Race | # Population | % Population |
| Asian | 1,203 | 2.7% |
| Black / African American | 4,446 | 10.1% |
| Hawaiian / Pacific | 25 | 0.1% |
| Hispanic or Latino | 9,881 | 22.4% |
| Native / Alaskan | 83 | 0.2% |
| White / Caucasian | 32,439 | 73.6% |
| Two or more Races | 3,928 | 8.9% |
| Some other Race | 1,928 | 4.4% |
| Total | 44,052 | 100.0% |
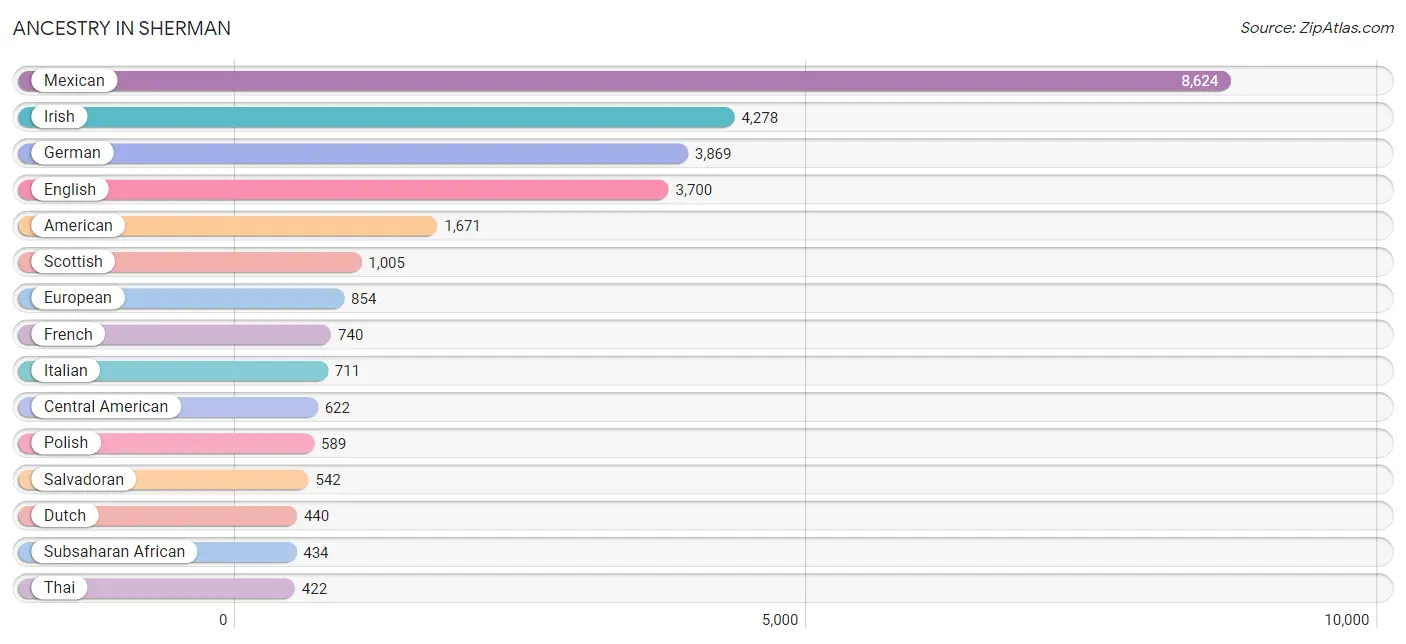
Ancestry in Sherman
The most populous ancestries reported in Sherman are Mexican (8,624 | 19.6%), Irish (4,278 | 9.7%), German (3,869 | 8.8%), English (3,700 | 8.4%), and American (1,671 | 3.8%), together accounting for 50.3% of all Sherman residents.
| Ancestry | # Population | % Population |
| African | 202 | 0.5% |
| American | 1,671 | 3.8% |
| Arab | 99 | 0.2% |
| Austrian | 160 | 0.4% |
| Bahamian | 41 | 0.1% |
| Belgian | 16 | 0.0% |
| Bhutanese | 10 | 0.0% |
| Blackfeet | 293 | 0.7% |
| British | 169 | 0.4% |
| Burmese | 171 | 0.4% |
| Cajun | 82 | 0.2% |
| Canadian | 7 | 0.0% |
| Celtic | 217 | 0.5% |
| Central American | 622 | 1.4% |
| Central American Indian | 16 | 0.0% |
| Cherokee | 207 | 0.5% |
| Chickasaw | 135 | 0.3% |
| Chilean | 14 | 0.0% |
| Choctaw | 273 | 0.6% |
| Colombian | 48 | 0.1% |
| Comanche | 46 | 0.1% |
| Cuban | 75 | 0.2% |
| Czech | 165 | 0.4% |
| Danish | 15 | 0.0% |
| Dutch | 440 | 1.0% |
| Dutch West Indian | 8 | 0.0% |
| Eastern European | 97 | 0.2% |
| English | 3,700 | 8.4% |
| European | 854 | 1.9% |
| Finnish | 54 | 0.1% |
| French | 740 | 1.7% |
| French Canadian | 121 | 0.3% |
| German | 3,869 | 8.8% |
| Greek | 3 | 0.0% |
| Guyanese | 32 | 0.1% |
| Honduran | 80 | 0.2% |
| Hungarian | 36 | 0.1% |
| Indian (Asian) | 34 | 0.1% |
| Indonesian | 239 | 0.5% |
| Irish | 4,278 | 9.7% |
| Italian | 711 | 1.6% |
| Korean | 14 | 0.0% |
| Lebanese | 33 | 0.1% |
| Mexican | 8,624 | 19.6% |
| Norwegian | 252 | 0.6% |
| Polish | 589 | 1.3% |
| Puerto Rican | 178 | 0.4% |
| Salvadoran | 542 | 1.2% |
| Scandinavian | 86 | 0.2% |
| Scotch-Irish | 360 | 0.8% |
| Scottish | 1,005 | 2.3% |
| Sioux | 21 | 0.1% |
| South American | 71 | 0.2% |
| Spaniard | 47 | 0.1% |
| Spanish | 9 | 0.0% |
| Sri Lankan | 190 | 0.4% |
| Subsaharan African | 434 | 1.0% |
| Swedish | 147 | 0.3% |
| Swiss | 60 | 0.1% |
| Syrian | 7 | 0.0% |
| Thai | 422 | 1.0% |
| Tongan | 10 | 0.0% |
| Venezuelan | 9 | 0.0% |
| Vietnamese | 72 | 0.2% |
| Welsh | 210 | 0.5% |
| West Indian | 16 | 0.0% |
| Yugoslavian | 16 | 0.0% | View All 67 Rows |
Immigrants in Sherman
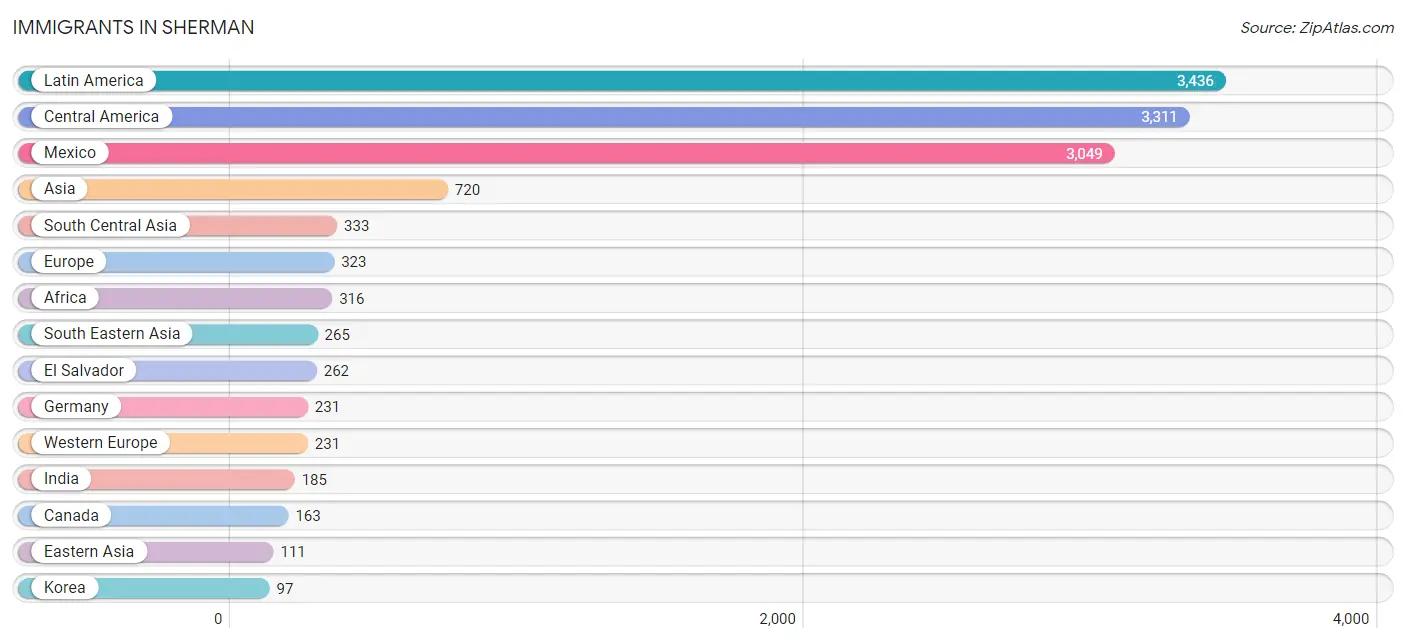
The most numerous immigrant groups reported in Sherman came from Latin America (3,436 | 7.8%), Central America (3,311 | 7.5%), Mexico (3,049 | 6.9%), Asia (720 | 1.6%), and South Central Asia (333 | 0.8%), together accounting for 24.6% of all Sherman residents.
| Immigration Origin | # Population | % Population |
| Africa | 316 | 0.7% |
| Asia | 720 | 1.6% |
| Bangladesh | 55 | 0.1% |
| Canada | 163 | 0.4% |
| Caribbean | 40 | 0.1% |
| Central America | 3,311 | 7.5% |
| Chile | 10 | 0.0% |
| China | 14 | 0.0% |
| Colombia | 43 | 0.1% |
| Czechoslovakia | 55 | 0.1% |
| Eastern Asia | 111 | 0.3% |
| Eastern Europe | 55 | 0.1% |
| El Salvador | 262 | 0.6% |
| England | 37 | 0.1% |
| Europe | 323 | 0.7% |
| Germany | 231 | 0.5% |
| Grenada | 16 | 0.0% |
| Guyana | 32 | 0.1% |
| India | 185 | 0.4% |
| Kazakhstan | 3 | 0.0% |
| Korea | 97 | 0.2% |
| Latin America | 3,436 | 7.8% |
| Lebanon | 11 | 0.0% |
| Malaysia | 21 | 0.1% |
| Mexico | 3,049 | 6.9% |
| Middle Africa | 84 | 0.2% |
| Nepal | 78 | 0.2% |
| Nigeria | 41 | 0.1% |
| Northern Europe | 37 | 0.1% |
| Oceania | 10 | 0.0% |
| Pakistan | 12 | 0.0% |
| Philippines | 22 | 0.1% |
| South Africa | 32 | 0.1% |
| South America | 85 | 0.2% |
| South Central Asia | 333 | 0.8% |
| South Eastern Asia | 265 | 0.6% |
| Thailand | 6 | 0.0% |
| Trinidad and Tobago | 10 | 0.0% |
| Vietnam | 7 | 0.0% |
| Western Africa | 41 | 0.1% |
| Western Asia | 11 | 0.0% |
| Western Europe | 231 | 0.5% | View All 42 Rows |
Sex and Age in Sherman
Sex and Age in Sherman
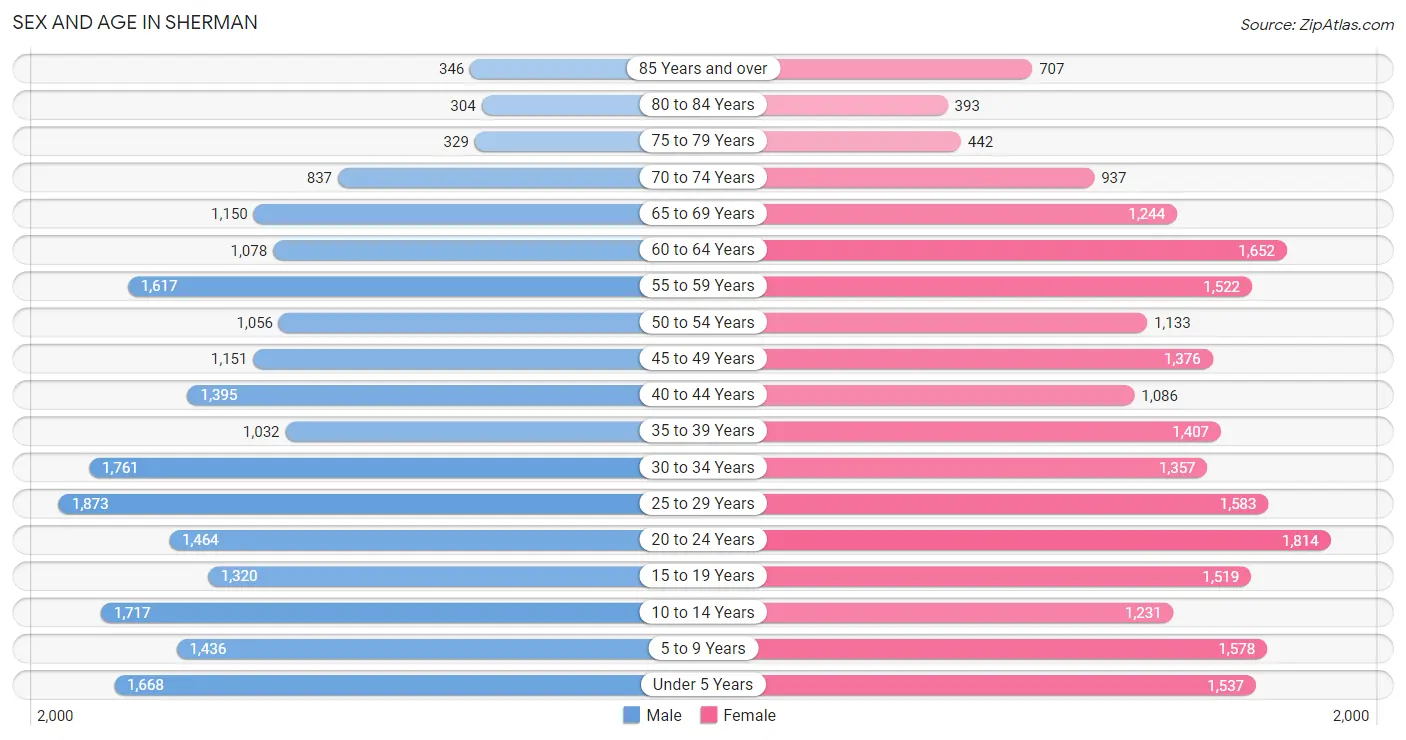
The most populous age groups in Sherman are 25 to 29 Years (1,873 | 8.7%) for men and 20 to 24 Years (1,814 | 8.1%) for women.
| Age Bracket | Male | Female |
| Under 5 Years | 1,668 (7.7%) | 1,537 (6.8%) |
| 5 to 9 Years | 1,436 (6.7%) | 1,578 (7.0%) |
| 10 to 14 Years | 1,717 (8.0%) | 1,231 (5.5%) |
| 15 to 19 Years | 1,320 (6.1%) | 1,519 (6.8%) |
| 20 to 24 Years | 1,464 (6.8%) | 1,814 (8.1%) |
| 25 to 29 Years | 1,873 (8.7%) | 1,583 (7.0%) |
| 30 to 34 Years | 1,761 (8.2%) | 1,357 (6.0%) |
| 35 to 39 Years | 1,032 (4.8%) | 1,407 (6.2%) |
| 40 to 44 Years | 1,395 (6.5%) | 1,086 (4.8%) |
| 45 to 49 Years | 1,151 (5.3%) | 1,376 (6.1%) |
| 50 to 54 Years | 1,056 (4.9%) | 1,133 (5.0%) |
| 55 to 59 Years | 1,617 (7.5%) | 1,522 (6.8%) |
| 60 to 64 Years | 1,078 (5.0%) | 1,652 (7.3%) |
| 65 to 69 Years | 1,150 (5.3%) | 1,244 (5.5%) |
| 70 to 74 Years | 837 (3.9%) | 937 (4.2%) |
| 75 to 79 Years | 329 (1.5%) | 442 (2.0%) |
| 80 to 84 Years | 304 (1.4%) | 393 (1.8%) |
| 85 Years and over | 346 (1.6%) | 707 (3.1%) |
| Total | 21,534 (100.0%) | 22,518 (100.0%) |
Families and Households in Sherman
Median Family Size in Sherman
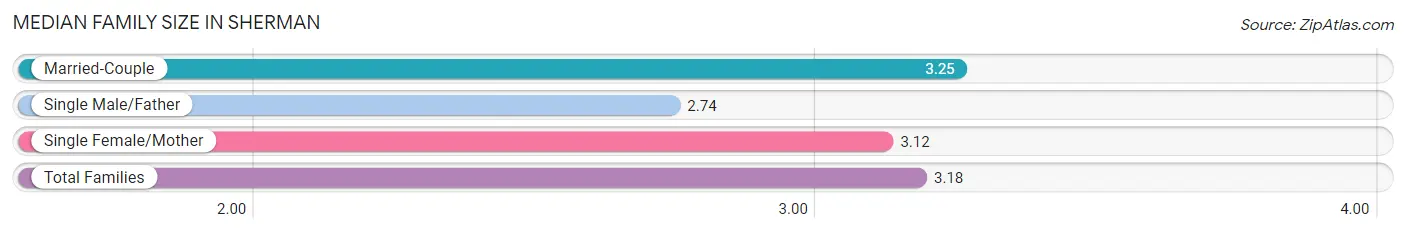
The median family size in Sherman is 3.18 persons per family, with married-couple families (7,484 | 69.3%) accounting for the largest median family size of 3.25 persons per family. On the other hand, single male/father families (813 | 7.5%) represent the smallest median family size with 2.74 persons per family.
| Family Type | # Families | Family Size |
| Married-Couple | 7,484 (69.3%) | 3.25 |
| Single Male/Father | 813 (7.5%) | 2.74 |
| Single Female/Mother | 2,504 (23.2%) | 3.12 |
| Total Families | 10,801 (100.0%) | 3.18 |
Median Household Size in Sherman
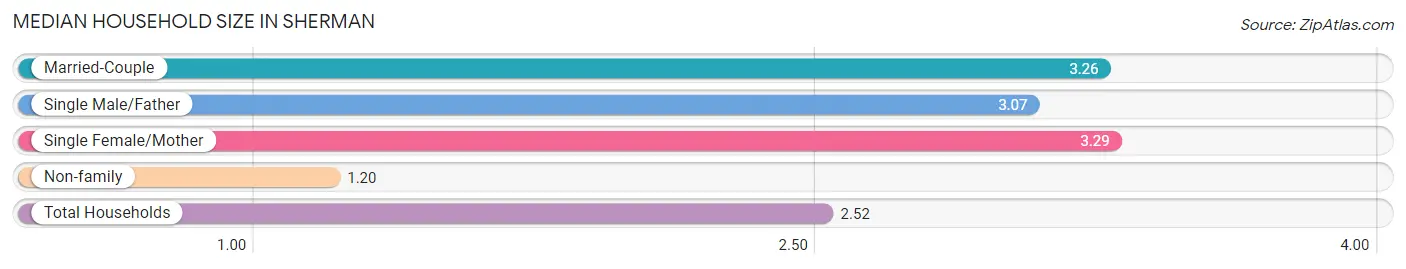
The median household size in Sherman is 2.52 persons per household, with single female/mother households (2,504 | 14.9%) accounting for the largest median household size of 3.29 persons per household. non-family households (5,999 | 35.7%) represent the smallest median household size with 1.20 persons per household.
| Household Type | # Households | Household Size |
| Married-Couple | 7,484 (44.6%) | 3.26 |
| Single Male/Father | 813 (4.8%) | 3.07 |
| Single Female/Mother | 2,504 (14.9%) | 3.29 |
| Non-family | 5,999 (35.7%) | 1.20 |
| Total Households | 16,800 (100.0%) | 2.52 |
Household Size by Marriage Status in Sherman
Out of a total of 16,800 households in Sherman, 10,801 (64.3%) are family households, while 5,999 (35.7%) are nonfamily households. The most numerous type of family households are 2-person households, comprising 5,015, and the most common type of nonfamily households are 1-person households, comprising 5,066.
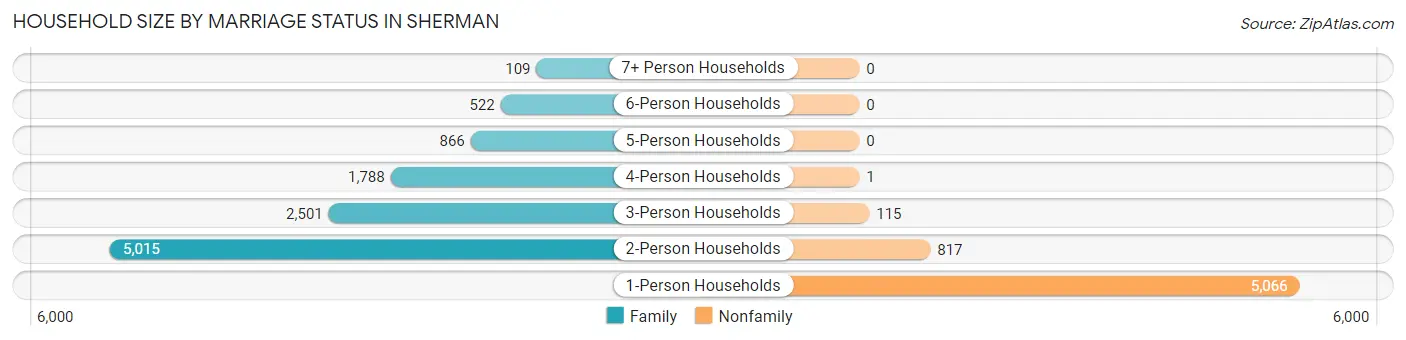
| Household Size | Family Households | Nonfamily Households |
| 1-Person Households | - | 5,066 (30.1%) |
| 2-Person Households | 5,015 (29.8%) | 817 (4.9%) |
| 3-Person Households | 2,501 (14.9%) | 115 (0.7%) |
| 4-Person Households | 1,788 (10.6%) | 1 (0.0%) |
| 5-Person Households | 866 (5.1%) | 0 (0.0%) |
| 6-Person Households | 522 (3.1%) | 0 (0.0%) |
| 7+ Person Households | 109 (0.6%) | 0 (0.0%) |
| Total | 10,801 (64.3%) | 5,999 (35.7%) |
Female Fertility in Sherman
Fertility by Age in Sherman
Average fertility rate in Sherman is 62.0 births per 1,000 women. Women in the age bracket of 20 to 34 years have the highest fertility rate with 98.0 births per 1,000 women. Women in the age bracket of 20 to 34 years acount for 73.1% of all women with births.
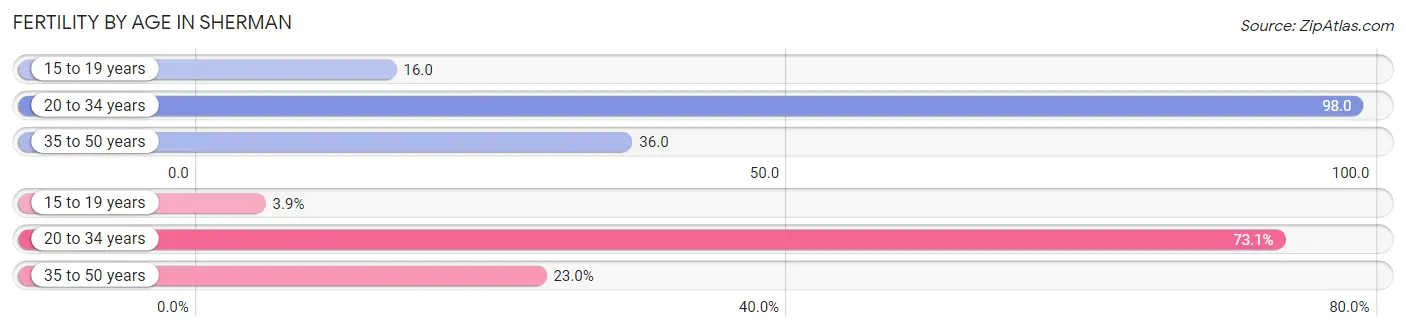
| Age Bracket | Women with Births | Births / 1,000 Women |
| 15 to 19 years | 25 (3.9%) | 16.0 |
| 20 to 34 years | 468 (73.1%) | 98.0 |
| 35 to 50 years | 147 (23.0%) | 36.0 |
| Total | 640 (100.0%) | 62.0 |
Fertility by Age by Marriage Status in Sherman
65.9% of women with births (640) in Sherman are married. The highest percentage of unmarried women with births falls into 15 to 19 years age bracket with 100.0% of them unmarried at the time of birth, while the lowest percentage of unmarried women with births belong to 35 to 50 years age bracket with 12.2% of them unmarried.
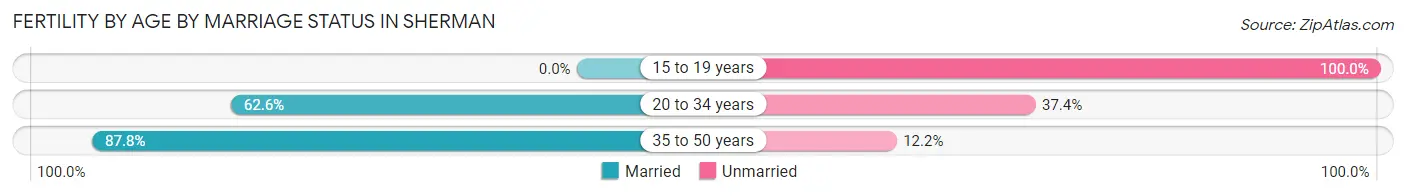
| Age Bracket | Married | Unmarried |
| 15 to 19 years | 0 (0.0%) | 25 (100.0%) |
| 20 to 34 years | 293 (62.6%) | 175 (37.4%) |
| 35 to 50 years | 129 (87.8%) | 18 (12.2%) |
| Total | 422 (65.9%) | 218 (34.1%) |
Fertility by Education in Sherman
Average fertility rate in Sherman is 62.0 births per 1,000 women. Women with the education attainment of high school diploma have the highest fertility rate of 122.0 births per 1,000 women, while women with the education attainment of bachelor's degree have the lowest fertility at 8.0 births per 1,000 women. Women with the education attainment of high school diploma represent 54.5% of all women with births.
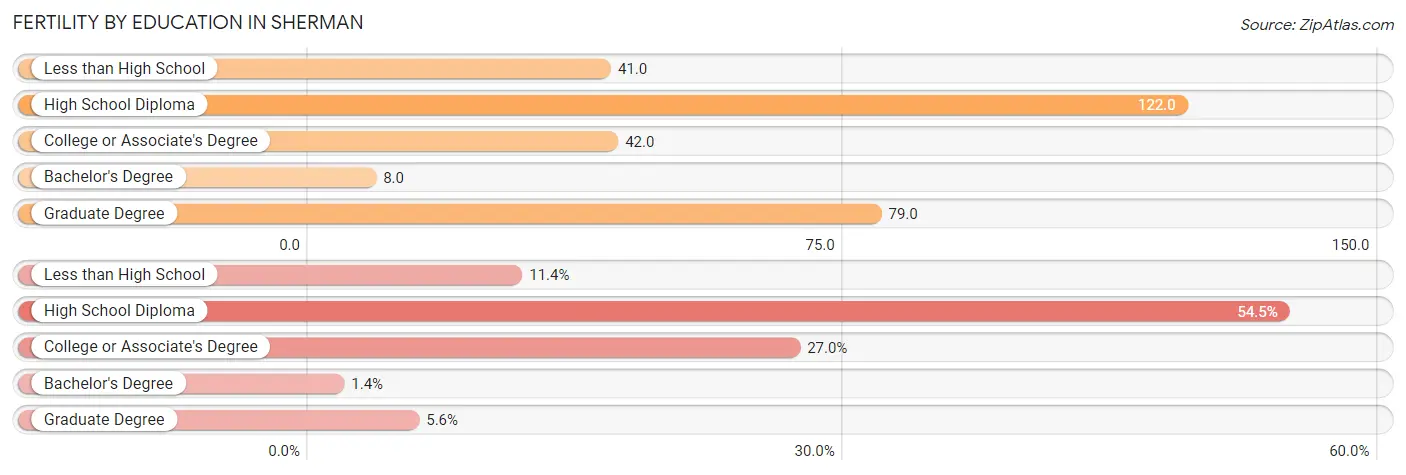
| Educational Attainment | Women with Births | Births / 1,000 Women |
| Less than High School | 73 (11.4%) | 41.0 |
| High School Diploma | 349 (54.5%) | 122.0 |
| College or Associate's Degree | 173 (27.0%) | 42.0 |
| Bachelor's Degree | 9 (1.4%) | 8.0 |
| Graduate Degree | 36 (5.6%) | 79.0 |
| Total | 640 (100.0%) | 62.0 |
Fertility by Education by Marriage Status in Sherman
34.1% of women with births in Sherman are unmarried. Women with the educational attainment of less than high school are most likely to be married with 100.0% of them married at childbirth, while women with the educational attainment of high school diploma are least likely to be married with 47.3% of them unmarried at childbirth.
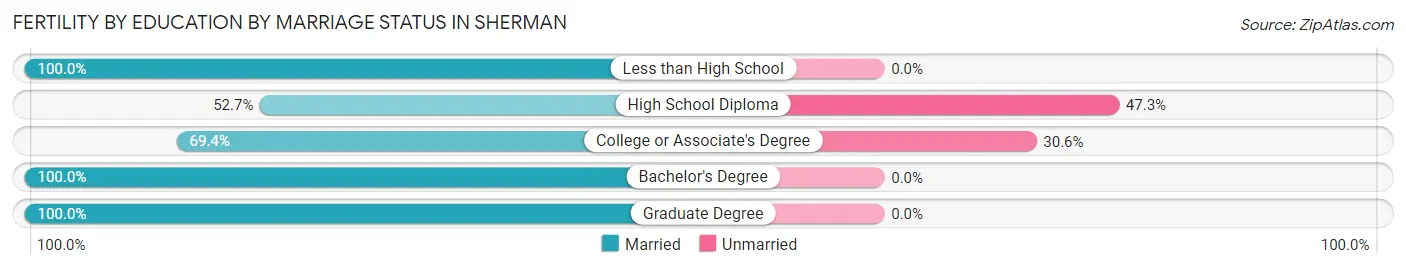
| Educational Attainment | Married | Unmarried |
| Less than High School | 73 (100.0%) | 0 (0.0%) |
| High School Diploma | 184 (52.7%) | 165 (47.3%) |
| College or Associate's Degree | 120 (69.4%) | 53 (30.6%) |
| Bachelor's Degree | 9 (100.0%) | 0 (0.0%) |
| Graduate Degree | 36 (100.0%) | 0 (0.0%) |
| Total | 422 (65.9%) | 218 (34.1%) |
Employment Characteristics in Sherman
Employment by Class of Employer in Sherman
Among the 21,214 employed individuals in Sherman, private company employees (16,499 | 77.8%), local government employees (1,186 | 5.6%), and not-for-profit organizations (1,161 | 5.5%) make up the most common classes of employment.
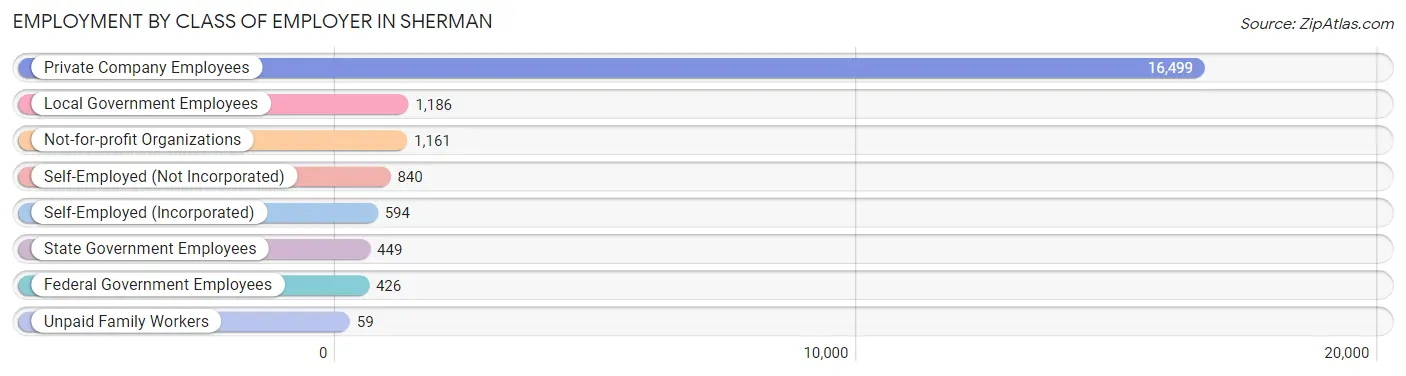
| Employer Class | # Employees | % Employees |
| Private Company Employees | 16,499 | 77.8% |
| Self-Employed (Incorporated) | 594 | 2.8% |
| Self-Employed (Not Incorporated) | 840 | 4.0% |
| Not-for-profit Organizations | 1,161 | 5.5% |
| Local Government Employees | 1,186 | 5.6% |
| State Government Employees | 449 | 2.1% |
| Federal Government Employees | 426 | 2.0% |
| Unpaid Family Workers | 59 | 0.3% |
| Total | 21,214 | 100.0% |
Employment Status by Age in Sherman
According to the labor force statistics for Sherman, out of the total population over 16 years of age (34,610), 64.8% or 22,427 individuals are in the labor force, with 3.6% or 807 of them unemployed. The age group with the highest labor force participation rate is 25 to 29 years, with 84.8% or 2,931 individuals in the labor force. Within the labor force, the 16 to 19 years age range has the highest percentage of unemployed individuals, with 13.3% or 142 of them being unemployed.
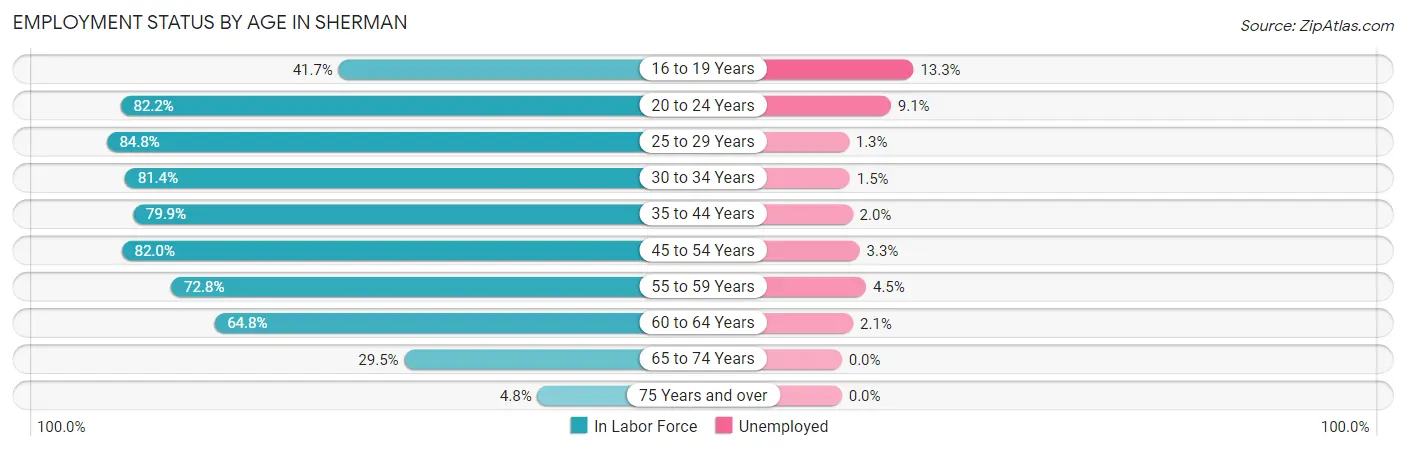
| Age Bracket | In Labor Force | Unemployed |
| 16 to 19 Years | 1,069 (41.7%) | 142 (13.3%) |
| 20 to 24 Years | 2,695 (82.2%) | 245 (9.1%) |
| 25 to 29 Years | 2,931 (84.8%) | 38 (1.3%) |
| 30 to 34 Years | 2,538 (81.4%) | 38 (1.5%) |
| 35 to 44 Years | 3,931 (79.9%) | 79 (2.0%) |
| 45 to 54 Years | 3,867 (82.0%) | 128 (3.3%) |
| 55 to 59 Years | 2,285 (72.8%) | 103 (4.5%) |
| 60 to 64 Years | 1,769 (64.8%) | 37 (2.1%) |
| 65 to 74 Years | 1,230 (29.5%) | 0 (0.0%) |
| 75 Years and over | 121 (4.8%) | 0 (0.0%) |
| Total | 22,427 (64.8%) | 807 (3.6%) |
Employment Status by Educational Attainment in Sherman
According to labor force statistics for Sherman, 78.5% of individuals (17,332) out of the total population between 25 and 64 years of age (22,079) are in the labor force, with 2.4% or 416 of them being unemployed. The group with the highest labor force participation rate are those with the educational attainment of bachelor's degree or higher, with 85.8% or 4,026 individuals in the labor force. Within the labor force, individuals with less than high school education have the highest percentage of unemployment, with 3.9% or 69 of them being unemployed.
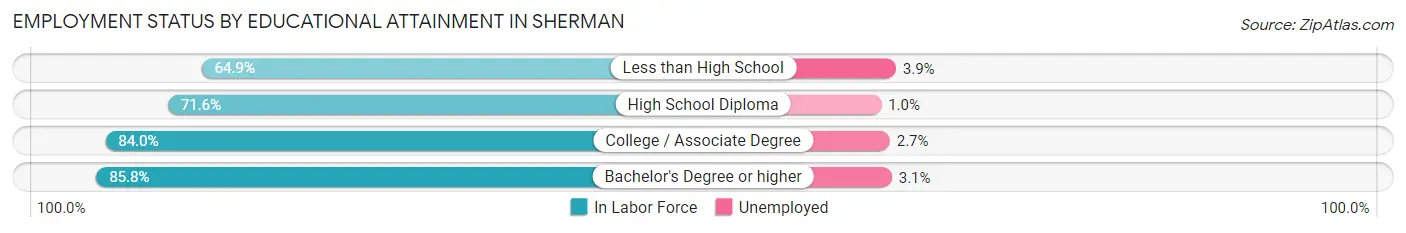
| Educational Attainment | In Labor Force | Unemployed |
| Less than High School | 1,776 (64.9%) | 107 (3.9%) |
| High School Diploma | 4,548 (71.6%) | 64 (1.0%) |
| College / Associate Degree | 6,971 (84.0%) | 224 (2.7%) |
| Bachelor's Degree or higher | 4,026 (85.8%) | 145 (3.1%) |
| Total | 17,332 (78.5%) | 530 (2.4%) |
Employment Occupations by Sex in Sherman
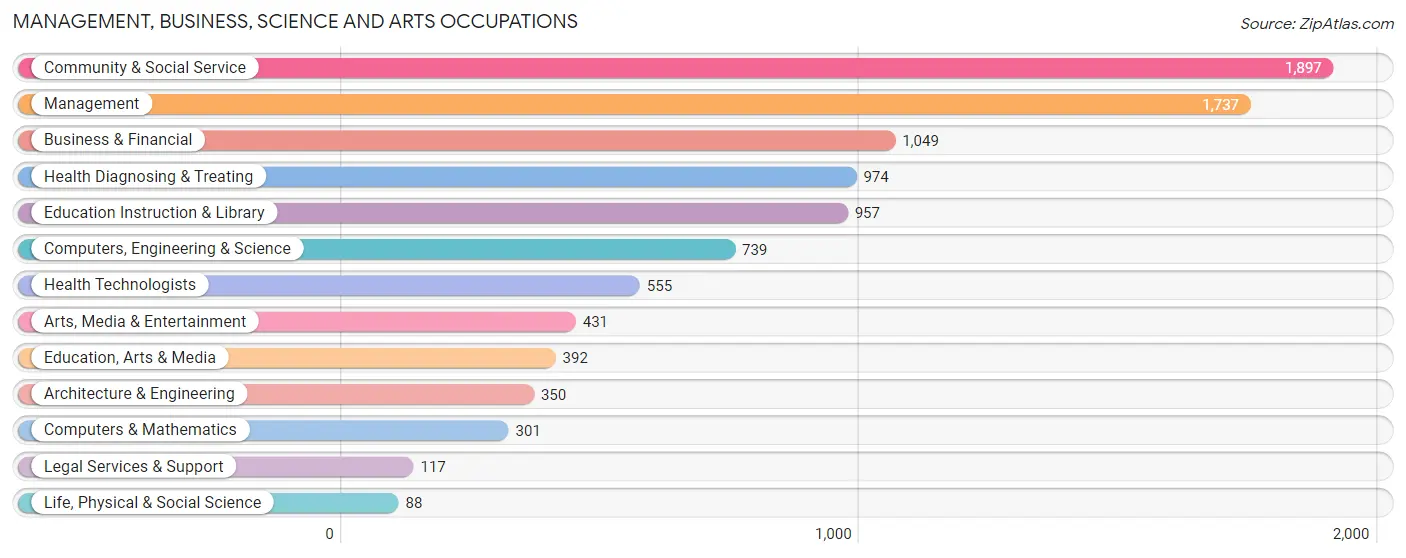
Management, Business, Science and Arts Occupations
The most common Management, Business, Science and Arts occupations in Sherman are Community & Social Service (1,897 | 8.8%), Management (1,737 | 8.0%), Business & Financial (1,049 | 4.9%), Health Diagnosing & Treating (974 | 4.5%), and Education Instruction & Library (957 | 4.4%).
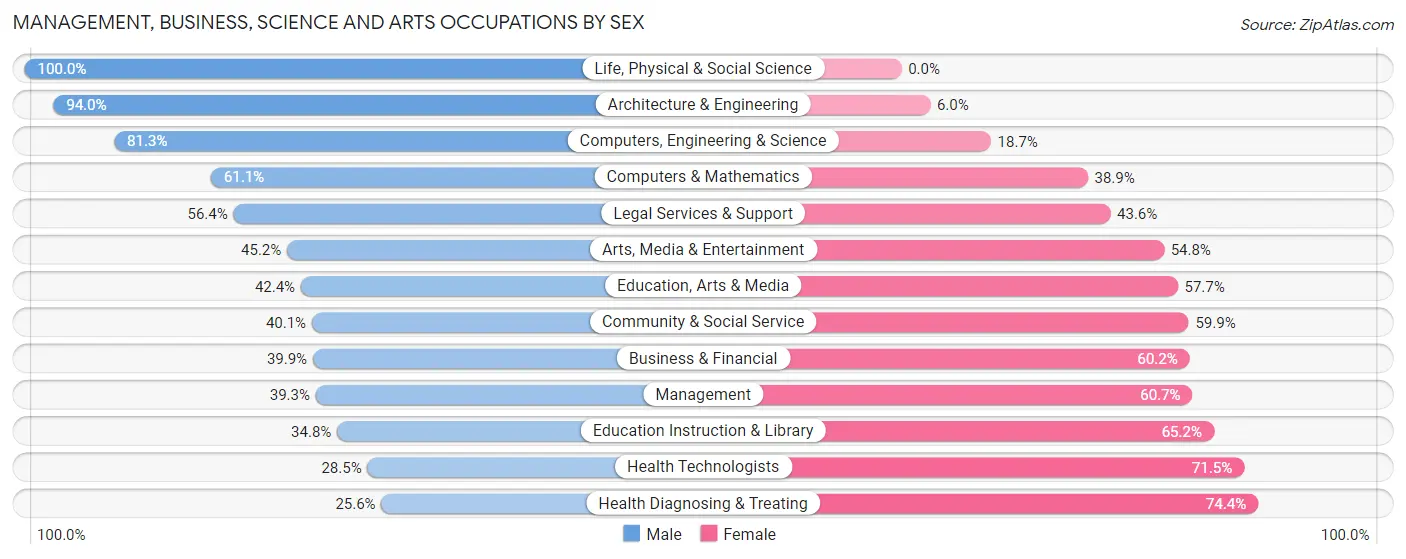
Management, Business, Science and Arts Occupations by Sex
Within the Management, Business, Science and Arts occupations in Sherman, the most male-oriented occupations are Life, Physical & Social Science (100.0%), Architecture & Engineering (94.0%), and Computers, Engineering & Science (81.3%), while the most female-oriented occupations are Health Diagnosing & Treating (74.4%), Health Technologists (71.5%), and Education Instruction & Library (65.2%).
| Occupation | Male | Female |
| Management | 682 (39.3%) | 1,055 (60.7%) |
| Business & Financial | 418 (39.9%) | 631 (60.2%) |
| Computers, Engineering & Science | 601 (81.3%) | 138 (18.7%) |
| Computers & Mathematics | 184 (61.1%) | 117 (38.9%) |
| Architecture & Engineering | 329 (94.0%) | 21 (6.0%) |
| Life, Physical & Social Science | 88 (100.0%) | 0 (0.0%) |
| Community & Social Service | 760 (40.1%) | 1,137 (59.9%) |
| Education, Arts & Media | 166 (42.3%) | 226 (57.7%) |
| Legal Services & Support | 66 (56.4%) | 51 (43.6%) |
| Education Instruction & Library | 333 (34.8%) | 624 (65.2%) |
| Arts, Media & Entertainment | 195 (45.2%) | 236 (54.8%) |
| Health Diagnosing & Treating | 249 (25.6%) | 725 (74.4%) |
| Health Technologists | 158 (28.5%) | 397 (71.5%) |
| Total (Category) | 2,710 (42.4%) | 3,686 (57.6%) |
| Total (Overall) | 10,981 (50.8%) | 10,644 (49.2%) |
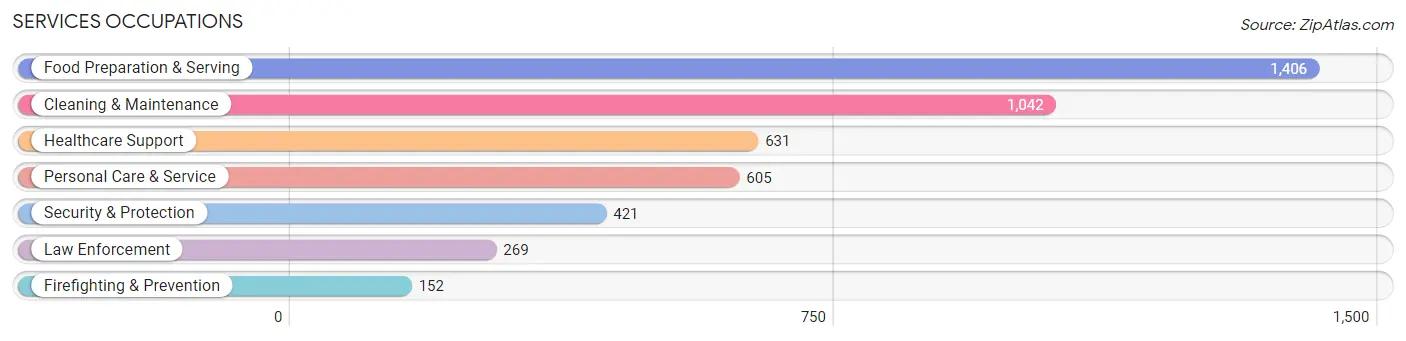
Services Occupations
The most common Services occupations in Sherman are Food Preparation & Serving (1,406 | 6.5%), Cleaning & Maintenance (1,042 | 4.8%), Healthcare Support (631 | 2.9%), Personal Care & Service (605 | 2.8%), and Security & Protection (421 | 1.9%).
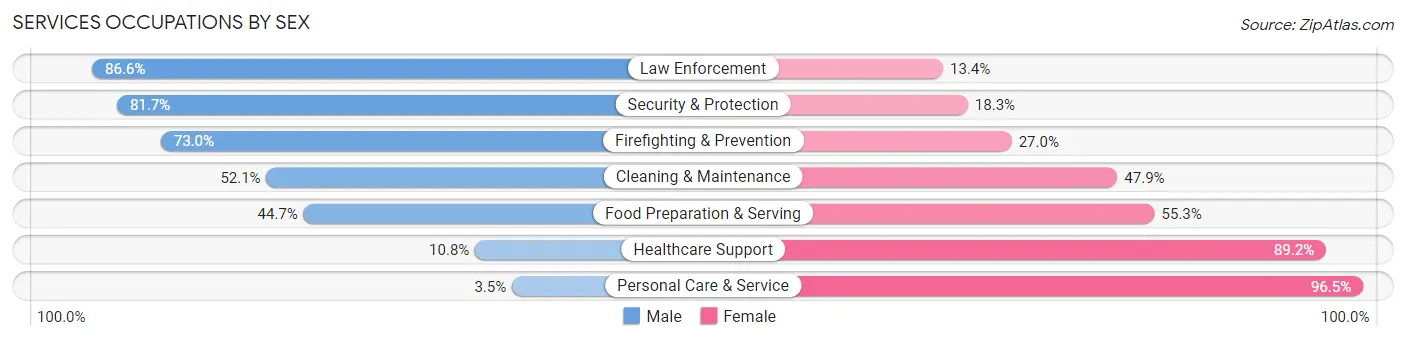
Services Occupations by Sex
Within the Services occupations in Sherman, the most male-oriented occupations are Law Enforcement (86.6%), Security & Protection (81.7%), and Firefighting & Prevention (73.0%), while the most female-oriented occupations are Personal Care & Service (96.5%), Healthcare Support (89.2%), and Food Preparation & Serving (55.3%).
| Occupation | Male | Female |
| Healthcare Support | 68 (10.8%) | 563 (89.2%) |
| Security & Protection | 344 (81.7%) | 77 (18.3%) |
| Firefighting & Prevention | 111 (73.0%) | 41 (27.0%) |
| Law Enforcement | 233 (86.6%) | 36 (13.4%) |
| Food Preparation & Serving | 629 (44.7%) | 777 (55.3%) |
| Cleaning & Maintenance | 543 (52.1%) | 499 (47.9%) |
| Personal Care & Service | 21 (3.5%) | 584 (96.5%) |
| Total (Category) | 1,605 (39.1%) | 2,500 (60.9%) |
| Total (Overall) | 10,981 (50.8%) | 10,644 (49.2%) |
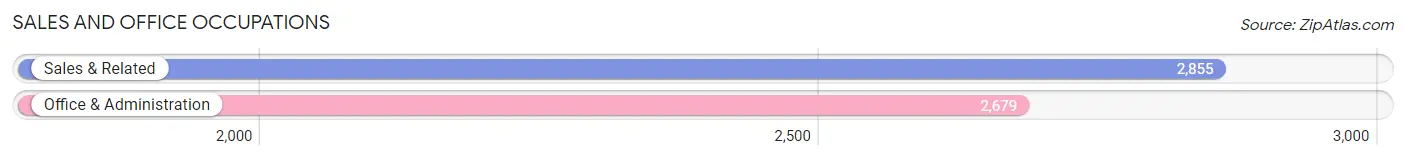
Sales and Office Occupations
The most common Sales and Office occupations in Sherman are Sales & Related (2,855 | 13.2%), and Office & Administration (2,679 | 12.4%).
Sales and Office Occupations by Sex
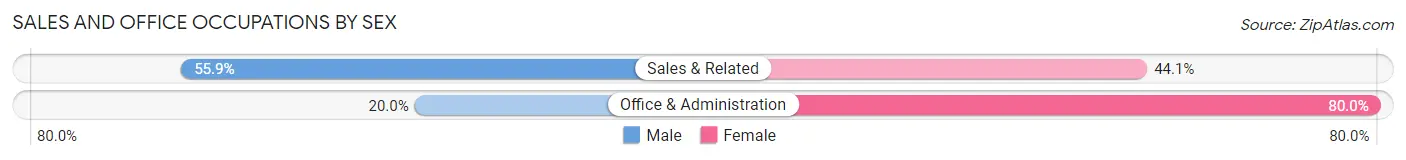
| Occupation | Male | Female |
| Sales & Related | 1,596 (55.9%) | 1,259 (44.1%) |
| Office & Administration | 536 (20.0%) | 2,143 (80.0%) |
| Total (Category) | 2,132 (38.5%) | 3,402 (61.5%) |
| Total (Overall) | 10,981 (50.8%) | 10,644 (49.2%) |
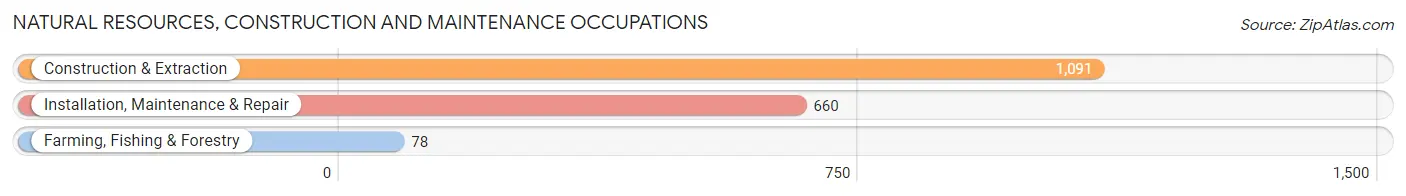
Natural Resources, Construction and Maintenance Occupations
The most common Natural Resources, Construction and Maintenance occupations in Sherman are Construction & Extraction (1,091 | 5.1%), Installation, Maintenance & Repair (660 | 3.0%), and Farming, Fishing & Forestry (78 | 0.4%).
Natural Resources, Construction and Maintenance Occupations by Sex
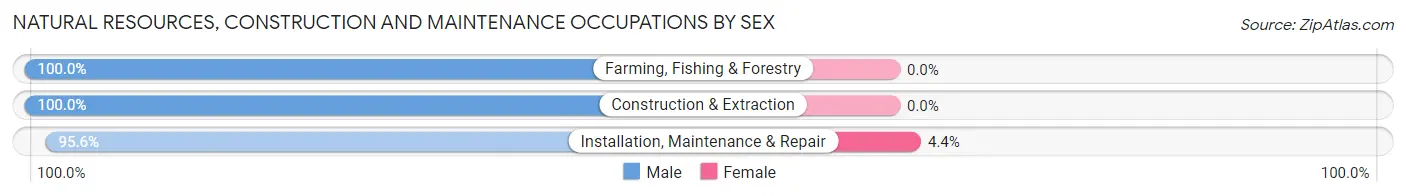
| Occupation | Male | Female |
| Farming, Fishing & Forestry | 78 (100.0%) | 0 (0.0%) |
| Construction & Extraction | 1,091 (100.0%) | 0 (0.0%) |
| Installation, Maintenance & Repair | 631 (95.6%) | 29 (4.4%) |
| Total (Category) | 1,800 (98.4%) | 29 (1.6%) |
| Total (Overall) | 10,981 (50.8%) | 10,644 (49.2%) |
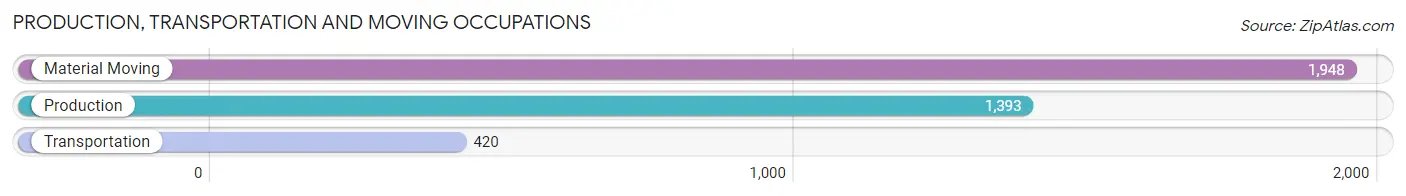
Production, Transportation and Moving Occupations
The most common Production, Transportation and Moving occupations in Sherman are Material Moving (1,948 | 9.0%), Production (1,393 | 6.4%), and Transportation (420 | 1.9%).
Production, Transportation and Moving Occupations by Sex
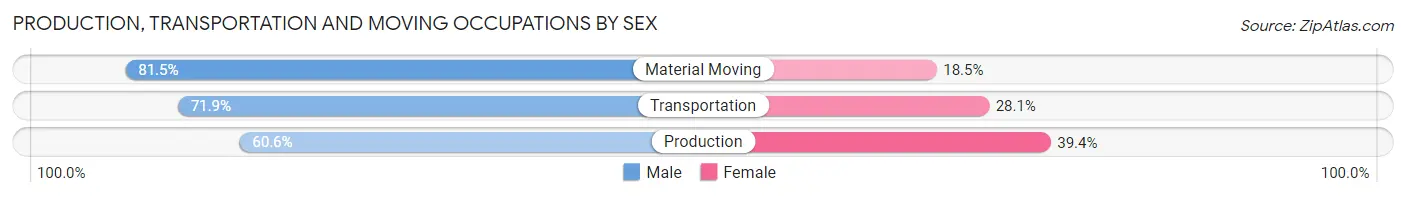
| Occupation | Male | Female |
| Production | 844 (60.6%) | 549 (39.4%) |
| Transportation | 302 (71.9%) | 118 (28.1%) |
| Material Moving | 1,588 (81.5%) | 360 (18.5%) |
| Total (Category) | 2,734 (72.7%) | 1,027 (27.3%) |
| Total (Overall) | 10,981 (50.8%) | 10,644 (49.2%) |
Employment Industries by Sex in Sherman
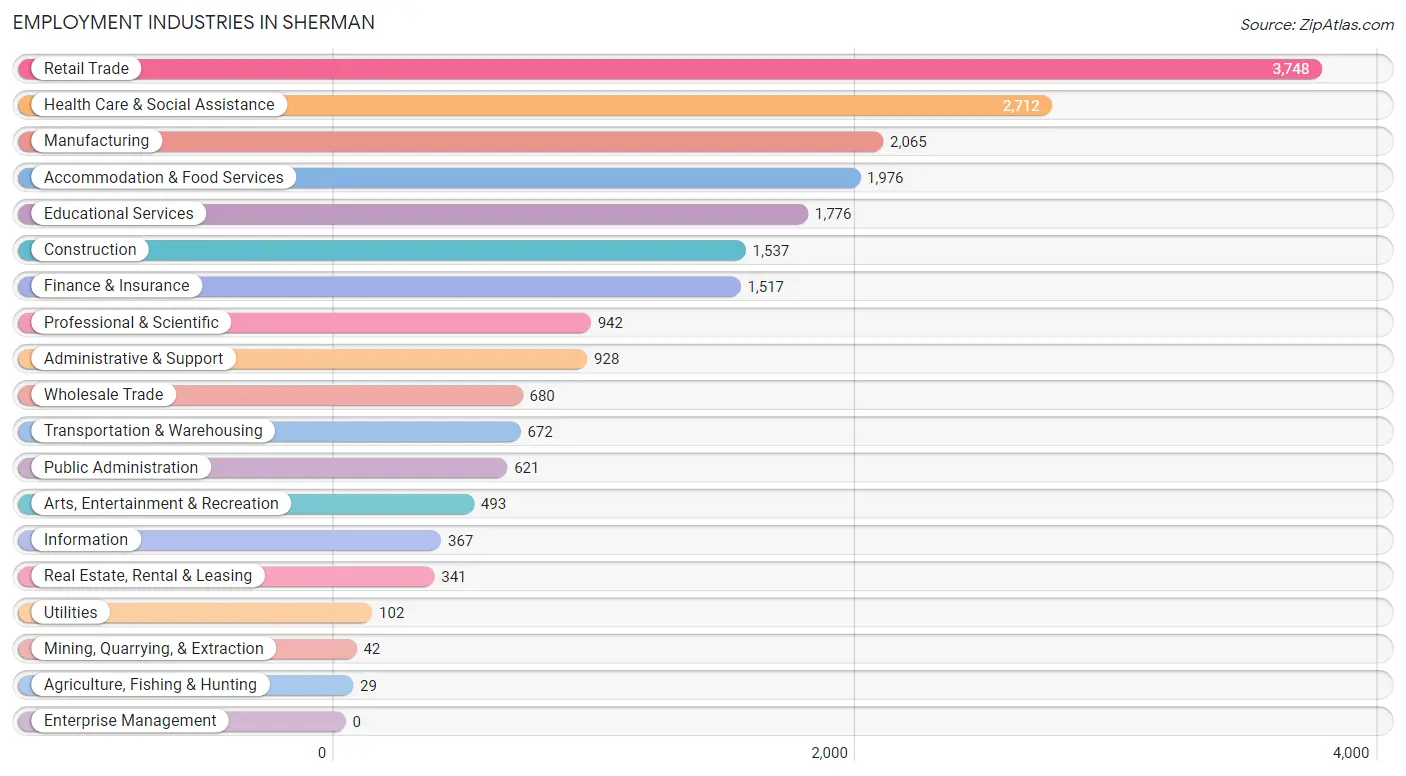
Employment Industries in Sherman
The major employment industries in Sherman include Retail Trade (3,748 | 17.3%), Health Care & Social Assistance (2,712 | 12.5%), Manufacturing (2,065 | 9.6%), Accommodation & Food Services (1,976 | 9.1%), and Educational Services (1,776 | 8.2%).
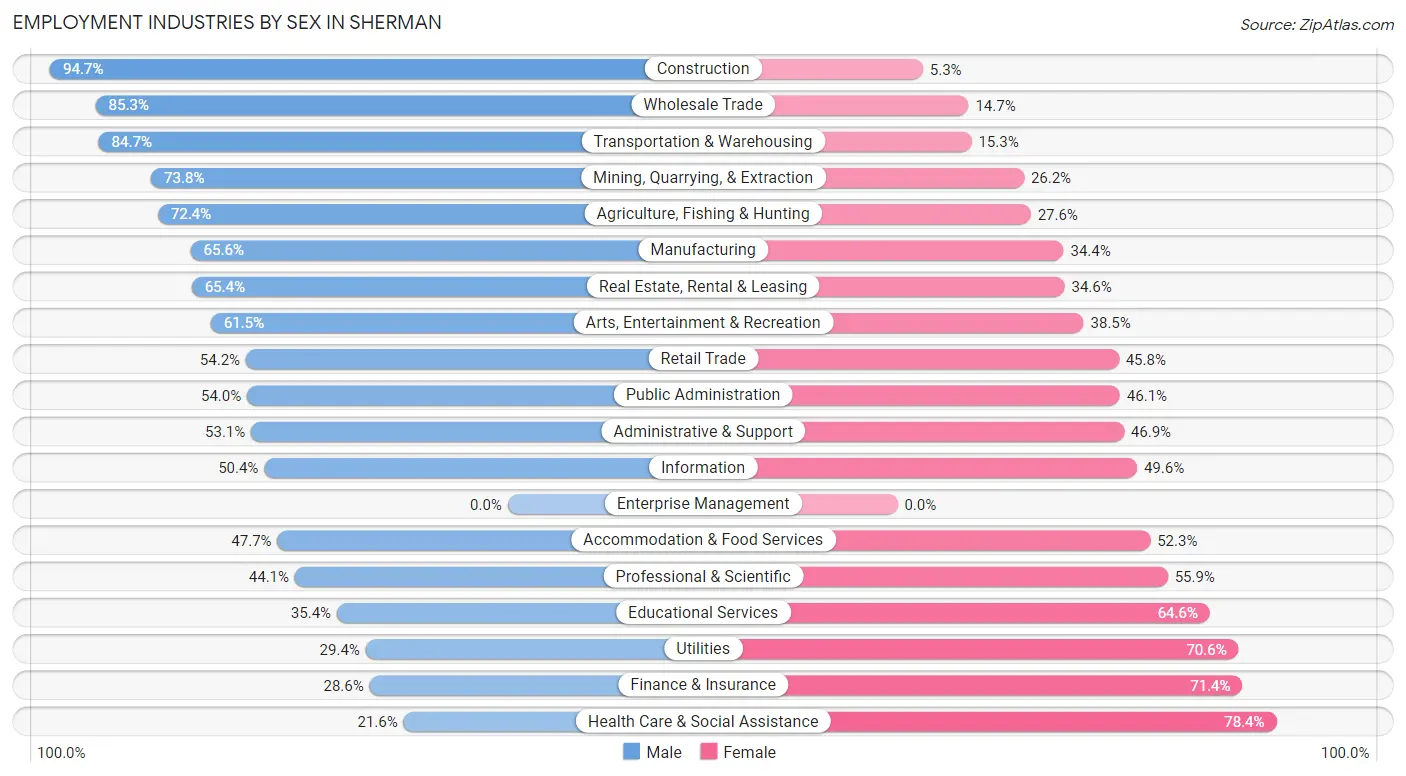
Employment Industries by Sex in Sherman
The Sherman industries that see more men than women are Construction (94.7%), Wholesale Trade (85.3%), and Transportation & Warehousing (84.7%), whereas the industries that tend to have a higher number of women are Health Care & Social Assistance (78.4%), Finance & Insurance (71.4%), and Utilities (70.6%).
| Industry | Male | Female |
| Agriculture, Fishing & Hunting | 21 (72.4%) | 8 (27.6%) |
| Mining, Quarrying, & Extraction | 31 (73.8%) | 11 (26.2%) |
| Construction | 1,456 (94.7%) | 81 (5.3%) |
| Manufacturing | 1,355 (65.6%) | 710 (34.4%) |
| Wholesale Trade | 580 (85.3%) | 100 (14.7%) |
| Retail Trade | 2,031 (54.2%) | 1,717 (45.8%) |
| Transportation & Warehousing | 569 (84.7%) | 103 (15.3%) |
| Utilities | 30 (29.4%) | 72 (70.6%) |
| Information | 185 (50.4%) | 182 (49.6%) |
| Finance & Insurance | 434 (28.6%) | 1,083 (71.4%) |
| Real Estate, Rental & Leasing | 223 (65.4%) | 118 (34.6%) |
| Professional & Scientific | 415 (44.1%) | 527 (55.9%) |
| Enterprise Management | 0 (0.0%) | 0 (0.0%) |
| Administrative & Support | 493 (53.1%) | 435 (46.9%) |
| Educational Services | 628 (35.4%) | 1,148 (64.6%) |
| Health Care & Social Assistance | 585 (21.6%) | 2,127 (78.4%) |
| Arts, Entertainment & Recreation | 303 (61.5%) | 190 (38.5%) |
| Accommodation & Food Services | 942 (47.7%) | 1,034 (52.3%) |
| Public Administration | 335 (53.9%) | 286 (46.1%) |
| Total | 10,981 (50.8%) | 10,644 (49.2%) |
Education in Sherman
School Enrollment in Sherman
The most common levels of schooling among the 10,930 students in Sherman are college / undergraduate (2,835 | 25.9%), middle school (2,588 | 23.7%), and elementary school (2,056 | 18.8%).
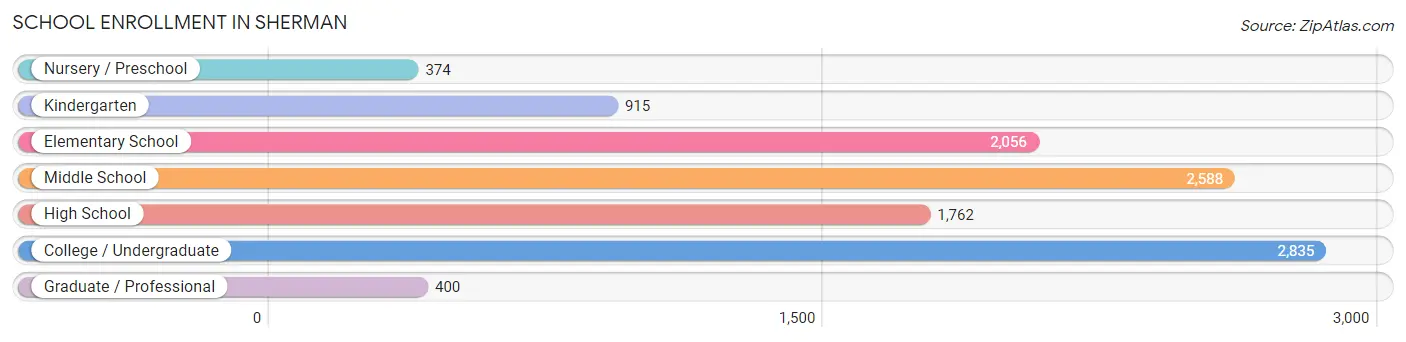
| School Level | # Students | % Students |
| Nursery / Preschool | 374 | 3.4% |
| Kindergarten | 915 | 8.4% |
| Elementary School | 2,056 | 18.8% |
| Middle School | 2,588 | 23.7% |
| High School | 1,762 | 16.1% |
| College / Undergraduate | 2,835 | 25.9% |
| Graduate / Professional | 400 | 3.7% |
| Total | 10,930 | 100.0% |
School Enrollment by Age by Funding Source in Sherman
Out of a total of 10,930 students who are enrolled in schools in Sherman, 1,279 (11.7%) attend a private institution, while the remaining 9,651 (88.3%) are enrolled in public schools. The age group of 18 to 19 year olds has the highest likelihood of being enrolled in private schools, with 545 (53.2% in the age bracket) enrolled. Conversely, the age group of 10 to 14 year olds has the lowest likelihood of being enrolled in a private school, with 2,933 (99.5% in the age bracket) attending a public institution.
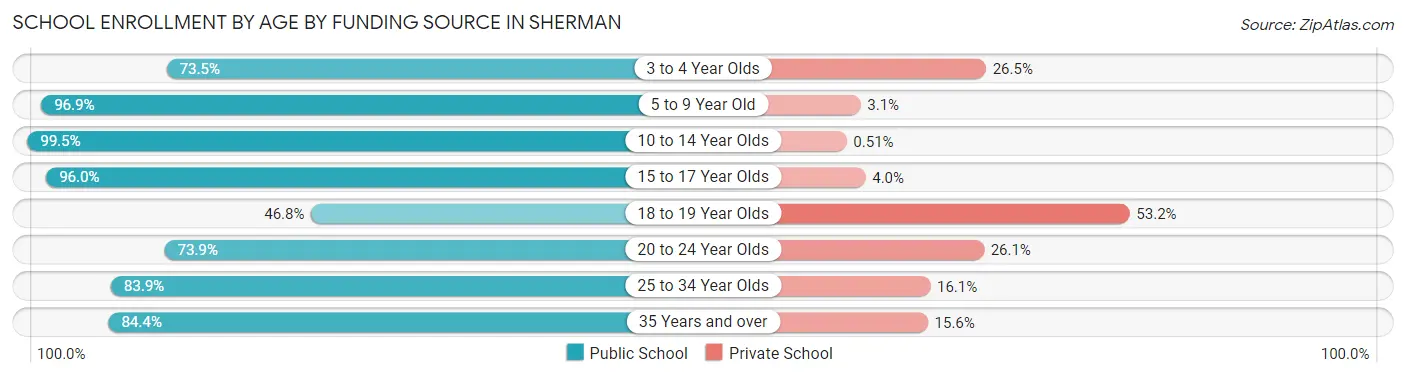
| Age Bracket | Public School | Private School |
| 3 to 4 Year Olds | 289 (73.5%) | 104 (26.5%) |
| 5 to 9 Year Old | 2,683 (96.9%) | 86 (3.1%) |
| 10 to 14 Year Olds | 2,933 (99.5%) | 15 (0.5%) |
| 15 to 17 Year Olds | 1,451 (96.0%) | 61 (4.0%) |
| 18 to 19 Year Olds | 479 (46.8%) | 545 (53.2%) |
| 20 to 24 Year Olds | 771 (73.9%) | 272 (26.1%) |
| 25 to 34 Year Olds | 757 (83.9%) | 145 (16.1%) |
| 35 Years and over | 286 (84.4%) | 53 (15.6%) |
| Total | 9,651 (88.3%) | 1,279 (11.7%) |
Educational Attainment by Field of Study in Sherman
Business (1,658 | 23.1%), education (828 | 11.6%), science & technology (707 | 9.9%), arts & humanities (557 | 7.8%), and bio, nature & agricultural (448 | 6.2%) are the most common fields of study among 7,165 individuals in Sherman who have obtained a bachelor's degree or higher.
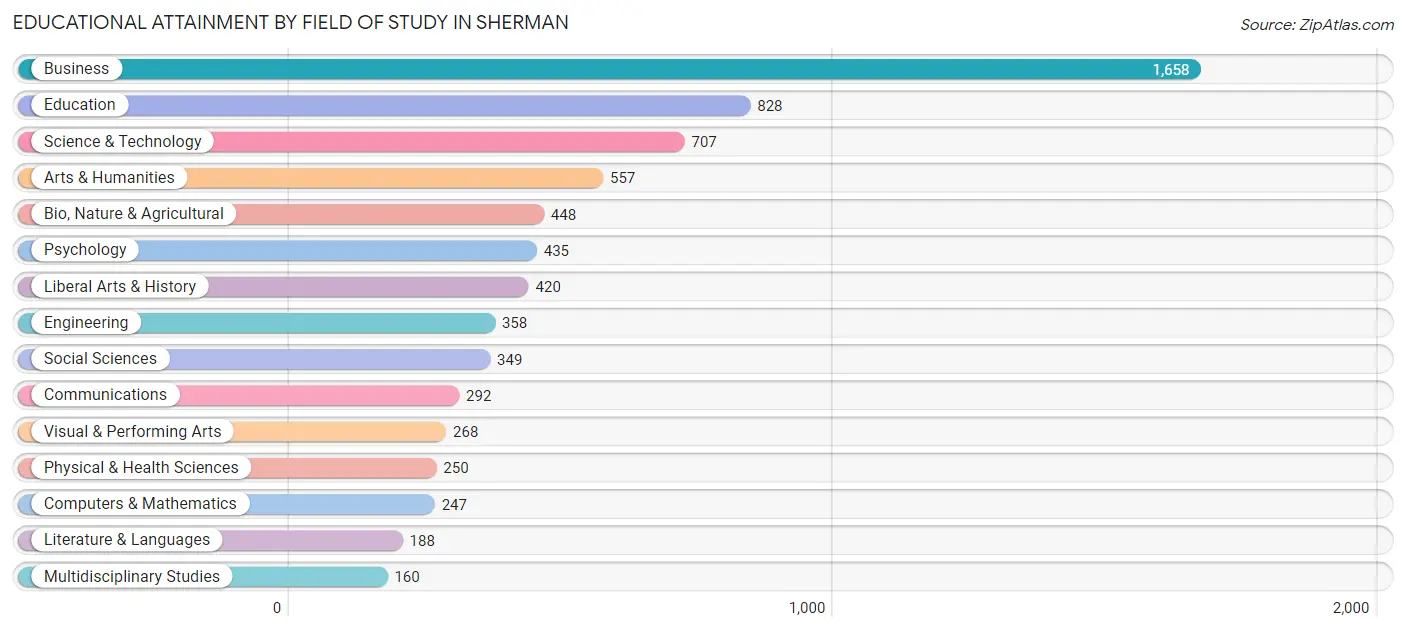
| Field of Study | # Graduates | % Graduates |
| Computers & Mathematics | 247 | 3.5% |
| Bio, Nature & Agricultural | 448 | 6.2% |
| Physical & Health Sciences | 250 | 3.5% |
| Psychology | 435 | 6.1% |
| Social Sciences | 349 | 4.9% |
| Engineering | 358 | 5.0% |
| Multidisciplinary Studies | 160 | 2.2% |
| Science & Technology | 707 | 9.9% |
| Business | 1,658 | 23.1% |
| Education | 828 | 11.6% |
| Literature & Languages | 188 | 2.6% |
| Liberal Arts & History | 420 | 5.9% |
| Visual & Performing Arts | 268 | 3.7% |
| Communications | 292 | 4.1% |
| Arts & Humanities | 557 | 7.8% |
| Total | 7,165 | 100.0% |
Transportation & Commute in Sherman
Vehicle Availability by Sex in Sherman
The most prevalent vehicle ownership categories in Sherman are males with 2 vehicles (4,892, accounting for 46.1%) and females with 2 vehicles (4,040, making up 48.1%).
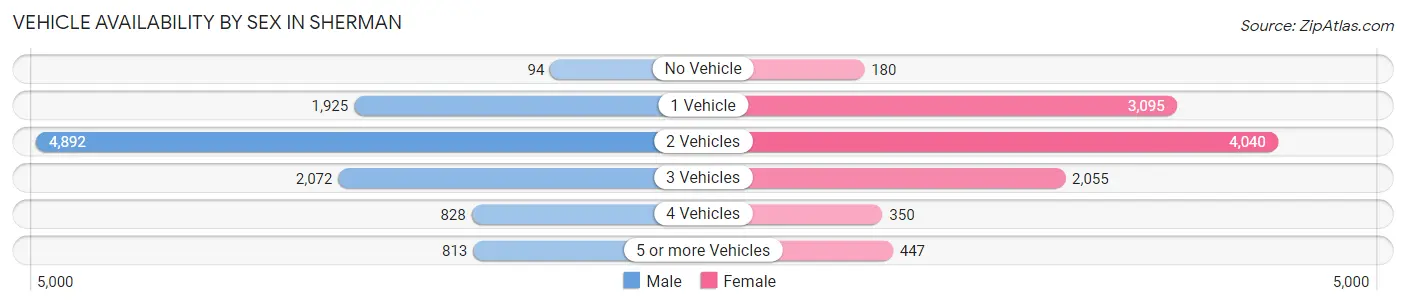
| Vehicles Available | Male | Female |
| No Vehicle | 94 (0.9%) | 180 (1.8%) |
| 1 Vehicle | 1,925 (18.1%) | 3,095 (30.4%) |
| 2 Vehicles | 4,892 (46.1%) | 4,040 (39.7%) |
| 3 Vehicles | 2,072 (19.5%) | 2,055 (20.2%) |
| 4 Vehicles | 828 (7.8%) | 350 (3.4%) |
| 5 or more Vehicles | 813 (7.6%) | 447 (4.4%) |
| Total | 10,624 (100.0%) | 10,167 (100.0%) |
Commute Time in Sherman
The most frequently occuring commute durations in Sherman are 10 to 14 minutes (5,216 commuters, 26.8%), 5 to 9 minutes (3,632 commuters, 18.6%), and 15 to 19 minutes (3,526 commuters, 18.1%).
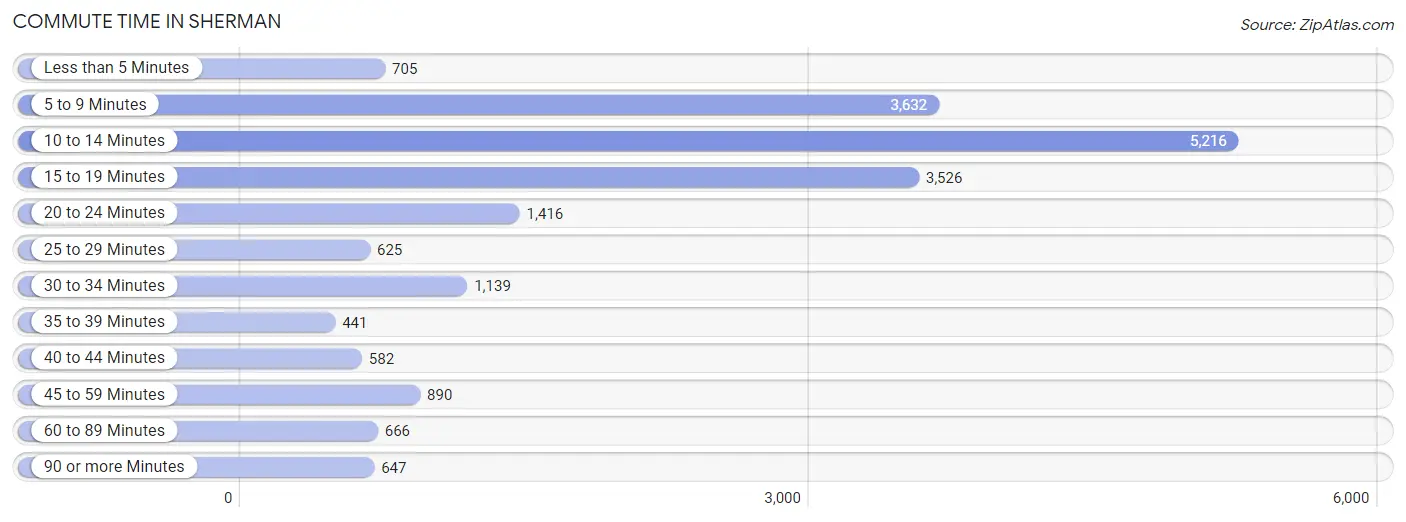
| Commute Time | # Commuters | % Commuters |
| Less than 5 Minutes | 705 | 3.6% |
| 5 to 9 Minutes | 3,632 | 18.6% |
| 10 to 14 Minutes | 5,216 | 26.8% |
| 15 to 19 Minutes | 3,526 | 18.1% |
| 20 to 24 Minutes | 1,416 | 7.3% |
| 25 to 29 Minutes | 625 | 3.2% |
| 30 to 34 Minutes | 1,139 | 5.9% |
| 35 to 39 Minutes | 441 | 2.3% |
| 40 to 44 Minutes | 582 | 3.0% |
| 45 to 59 Minutes | 890 | 4.6% |
| 60 to 89 Minutes | 666 | 3.4% |
| 90 or more Minutes | 647 | 3.3% |
Commute Time by Sex in Sherman
The most common commute times in Sherman are 10 to 14 minutes (2,912 commuters, 28.4%) for males and 10 to 14 minutes (2,304 commuters, 24.9%) for females.
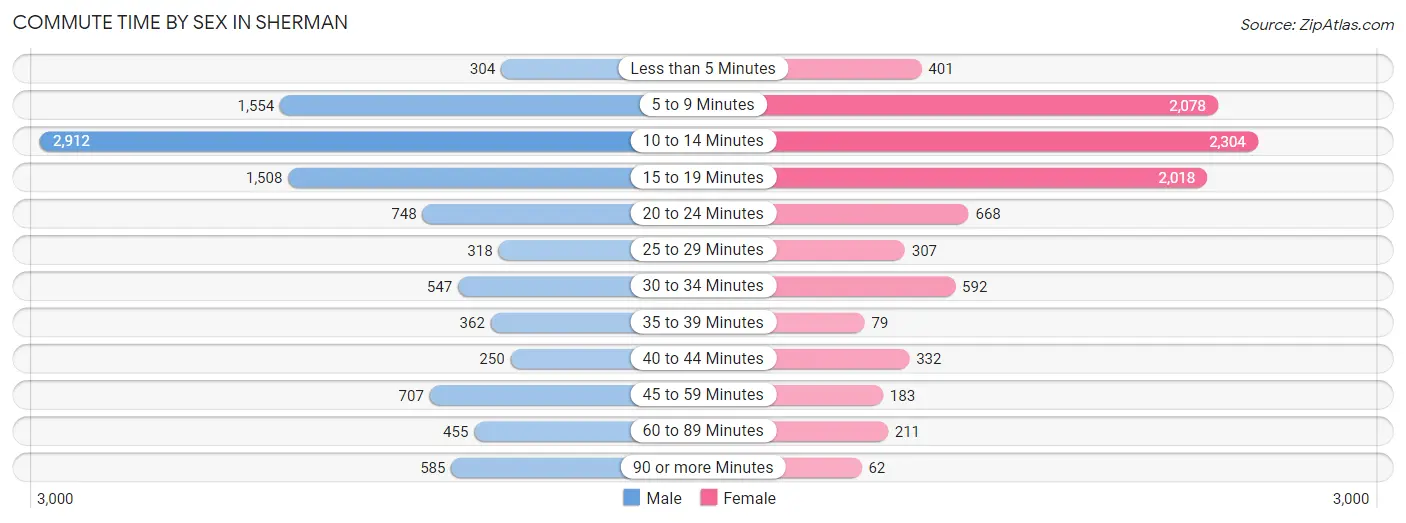
| Commute Time | Male | Female |
| Less than 5 Minutes | 304 (3.0%) | 401 (4.3%) |
| 5 to 9 Minutes | 1,554 (15.2%) | 2,078 (22.5%) |
| 10 to 14 Minutes | 2,912 (28.4%) | 2,304 (24.9%) |
| 15 to 19 Minutes | 1,508 (14.7%) | 2,018 (21.8%) |
| 20 to 24 Minutes | 748 (7.3%) | 668 (7.2%) |
| 25 to 29 Minutes | 318 (3.1%) | 307 (3.3%) |
| 30 to 34 Minutes | 547 (5.3%) | 592 (6.4%) |
| 35 to 39 Minutes | 362 (3.5%) | 79 (0.9%) |
| 40 to 44 Minutes | 250 (2.4%) | 332 (3.6%) |
| 45 to 59 Minutes | 707 (6.9%) | 183 (2.0%) |
| 60 to 89 Minutes | 455 (4.4%) | 211 (2.3%) |
| 90 or more Minutes | 585 (5.7%) | 62 (0.7%) |
Time of Departure to Work by Sex in Sherman
The most frequent times of departure to work in Sherman are 7:00 AM to 7:29 AM (2,003, 19.5%) for males and 7:30 AM to 7:59 AM (1,443, 15.6%) for females.

| Time of Departure | Male | Female |
| 12:00 AM to 4:59 AM | 696 (6.8%) | 273 (3.0%) |
| 5:00 AM to 5:29 AM | 298 (2.9%) | 93 (1.0%) |
| 5:30 AM to 5:59 AM | 333 (3.3%) | 511 (5.5%) |
| 6:00 AM to 6:29 AM | 571 (5.6%) | 610 (6.6%) |
| 6:30 AM to 6:59 AM | 1,108 (10.8%) | 1,165 (12.6%) |
| 7:00 AM to 7:29 AM | 2,003 (19.5%) | 1,075 (11.6%) |
| 7:30 AM to 7:59 AM | 1,427 (13.9%) | 1,443 (15.6%) |
| 8:00 AM to 8:29 AM | 729 (7.1%) | 1,319 (14.3%) |
| 8:30 AM to 8:59 AM | 403 (3.9%) | 642 (7.0%) |
| 9:00 AM to 9:59 AM | 721 (7.0%) | 440 (4.8%) |
| 10:00 AM to 10:59 AM | 180 (1.8%) | 298 (3.2%) |
| 11:00 AM to 11:59 AM | 544 (5.3%) | 91 (1.0%) |
| 12:00 PM to 3:59 PM | 648 (6.3%) | 637 (6.9%) |
| 4:00 PM to 11:59 PM | 589 (5.8%) | 638 (6.9%) |
| Total | 10,250 (100.0%) | 9,235 (100.0%) |
Housing Occupancy in Sherman
Occupancy by Ownership in Sherman
Of the total 16,800 dwellings in Sherman, owner-occupied units account for 8,777 (52.2%), while renter-occupied units make up 8,023 (47.8%).
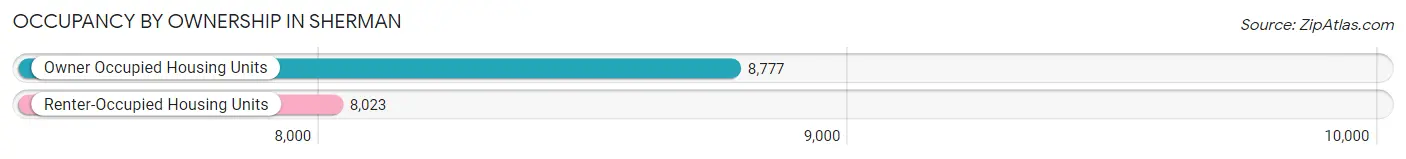
| Occupancy | # Housing Units | % Housing Units |
| Owner Occupied Housing Units | 8,777 | 52.2% |
| Renter-Occupied Housing Units | 8,023 | 47.8% |
| Total Occupied Housing Units | 16,800 | 100.0% |
Occupancy by Household Size in Sherman
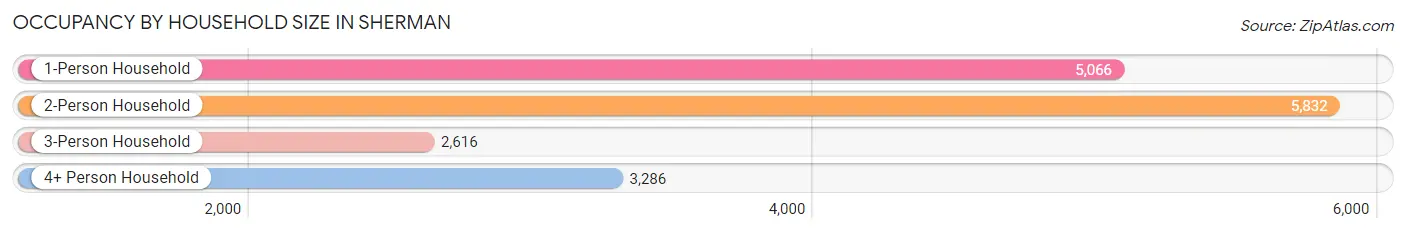
| Household Size | # Housing Units | % Housing Units |
| 1-Person Household | 5,066 | 30.1% |
| 2-Person Household | 5,832 | 34.7% |
| 3-Person Household | 2,616 | 15.6% |
| 4+ Person Household | 3,286 | 19.6% |
| Total Housing Units | 16,800 | 100.0% |
Occupancy by Ownership by Household Size in Sherman
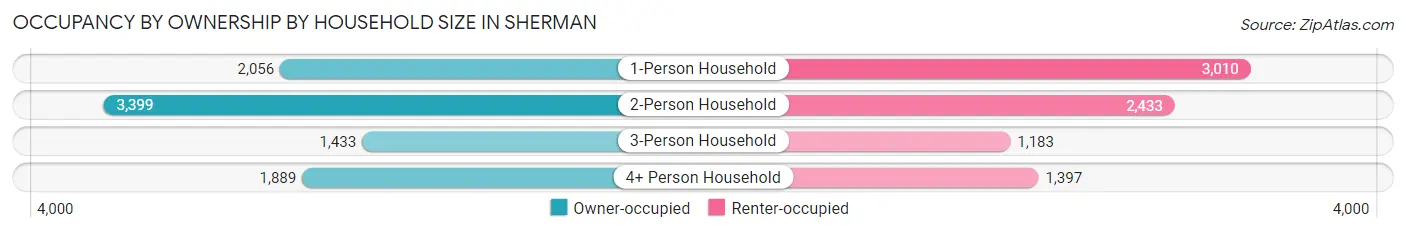
| Household Size | Owner-occupied | Renter-occupied |
| 1-Person Household | 2,056 (40.6%) | 3,010 (59.4%) |
| 2-Person Household | 3,399 (58.3%) | 2,433 (41.7%) |
| 3-Person Household | 1,433 (54.8%) | 1,183 (45.2%) |
| 4+ Person Household | 1,889 (57.5%) | 1,397 (42.5%) |
| Total Housing Units | 8,777 (52.2%) | 8,023 (47.8%) |
Occupancy by Educational Attainment in Sherman
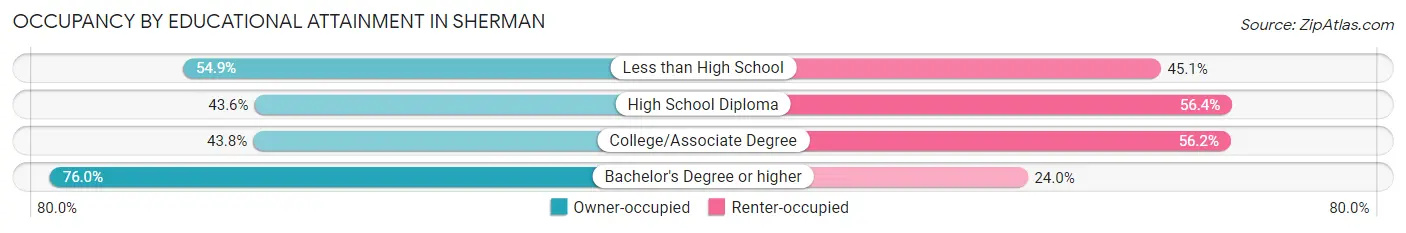
| Household Size | Owner-occupied | Renter-occupied |
| Less than High School | 686 (54.9%) | 564 (45.1%) |
| High School Diploma | 1,997 (43.6%) | 2,588 (56.4%) |
| College/Associate Degree | 3,041 (43.8%) | 3,907 (56.2%) |
| Bachelor's Degree or higher | 3,053 (76.0%) | 964 (24.0%) |
Occupancy by Age of Householder in Sherman
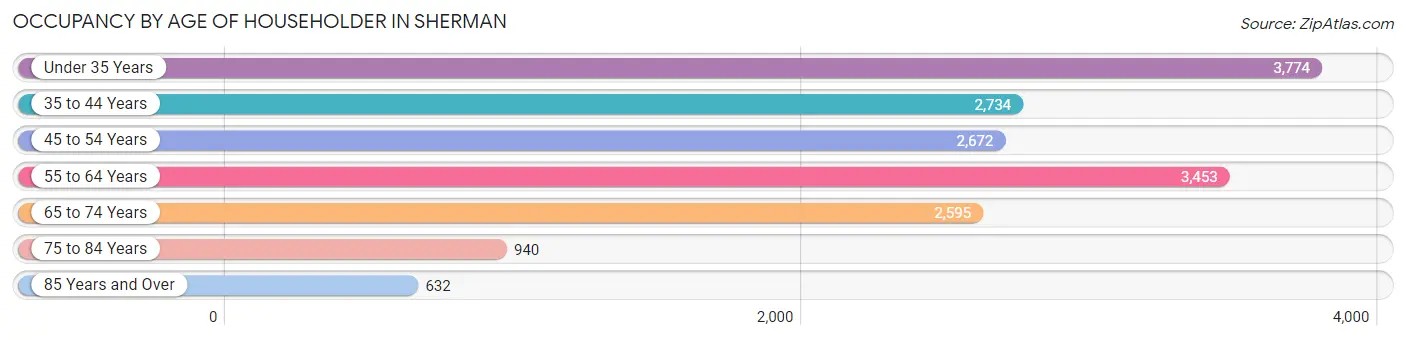
| Age Bracket | # Households | % Households |
| Under 35 Years | 3,774 | 22.5% |
| 35 to 44 Years | 2,734 | 16.3% |
| 45 to 54 Years | 2,672 | 15.9% |
| 55 to 64 Years | 3,453 | 20.5% |
| 65 to 74 Years | 2,595 | 15.4% |
| 75 to 84 Years | 940 | 5.6% |
| 85 Years and Over | 632 | 3.8% |
| Total | 16,800 | 100.0% |
Housing Finances in Sherman
Median Income by Occupancy in Sherman
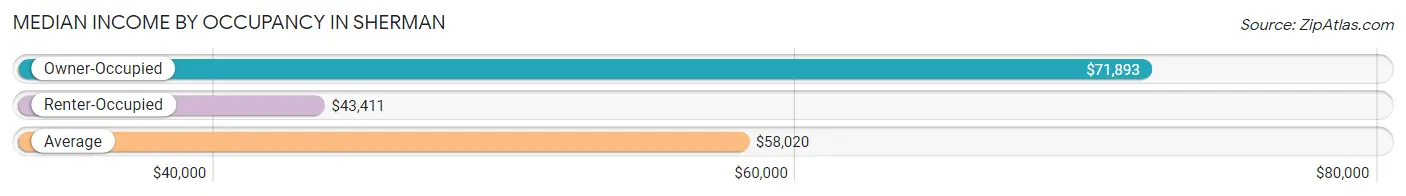
| Occupancy Type | # Households | Median Income |
| Owner-Occupied | 8,777 (52.2%) | $71,893 |
| Renter-Occupied | 8,023 (47.8%) | $43,411 |
| Average | 16,800 (100.0%) | $58,020 |
Occupancy by Householder Income Bracket in Sherman
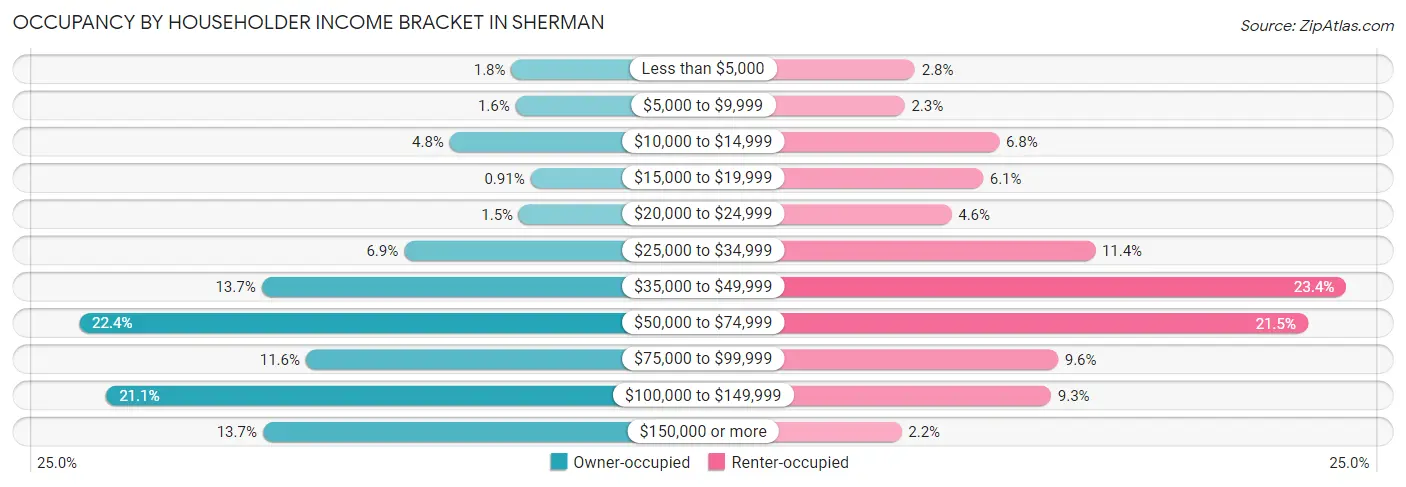
| Income Bracket | Owner-occupied | Renter-occupied |
| Less than $5,000 | 160 (1.8%) | 226 (2.8%) |
| $5,000 to $9,999 | 142 (1.6%) | 187 (2.3%) |
| $10,000 to $14,999 | 418 (4.8%) | 548 (6.8%) |
| $15,000 to $19,999 | 80 (0.9%) | 486 (6.1%) |
| $20,000 to $24,999 | 128 (1.5%) | 366 (4.6%) |
| $25,000 to $34,999 | 608 (6.9%) | 915 (11.4%) |
| $35,000 to $49,999 | 1,204 (13.7%) | 1,874 (23.4%) |
| $50,000 to $74,999 | 1,966 (22.4%) | 1,727 (21.5%) |
| $75,000 to $99,999 | 1,019 (11.6%) | 773 (9.6%) |
| $100,000 to $149,999 | 1,853 (21.1%) | 746 (9.3%) |
| $150,000 or more | 1,199 (13.7%) | 175 (2.2%) |
| Total | 8,777 (100.0%) | 8,023 (100.0%) |
Monthly Housing Cost Tiers in Sherman
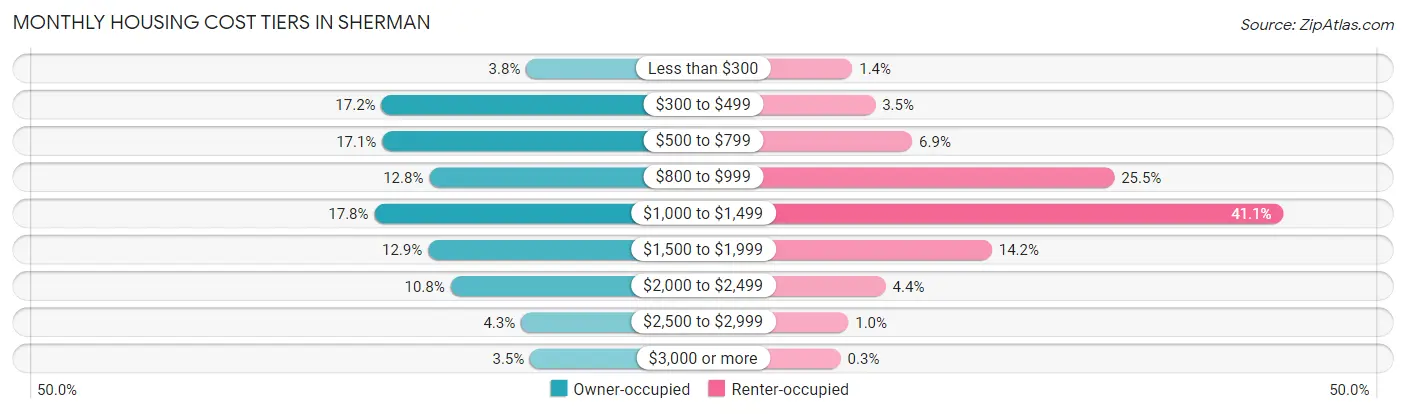
| Monthly Cost | Owner-occupied | Renter-occupied |
| Less than $300 | 335 (3.8%) | 110 (1.4%) |
| $300 to $499 | 1,505 (17.2%) | 279 (3.5%) |
| $500 to $799 | 1,499 (17.1%) | 552 (6.9%) |
| $800 to $999 | 1,119 (12.8%) | 2,044 (25.5%) |
| $1,000 to $1,499 | 1,562 (17.8%) | 3,294 (41.1%) |
| $1,500 to $1,999 | 1,129 (12.9%) | 1,140 (14.2%) |
| $2,000 to $2,499 | 947 (10.8%) | 356 (4.4%) |
| $2,500 to $2,999 | 377 (4.3%) | 80 (1.0%) |
| $3,000 or more | 304 (3.5%) | 24 (0.3%) |
| Total | 8,777 (100.0%) | 8,023 (100.0%) |
Physical Housing Characteristics in Sherman
Housing Structures in Sherman
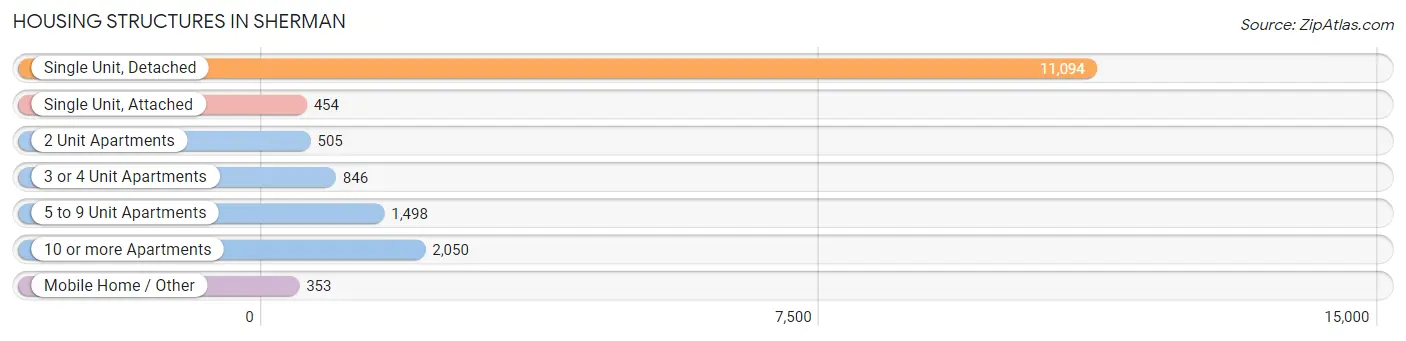
| Structure Type | # Housing Units | % Housing Units |
| Single Unit, Detached | 11,094 | 66.0% |
| Single Unit, Attached | 454 | 2.7% |
| 2 Unit Apartments | 505 | 3.0% |
| 3 or 4 Unit Apartments | 846 | 5.0% |
| 5 to 9 Unit Apartments | 1,498 | 8.9% |
| 10 or more Apartments | 2,050 | 12.2% |
| Mobile Home / Other | 353 | 2.1% |
| Total | 16,800 | 100.0% |
Housing Structures by Occupancy in Sherman
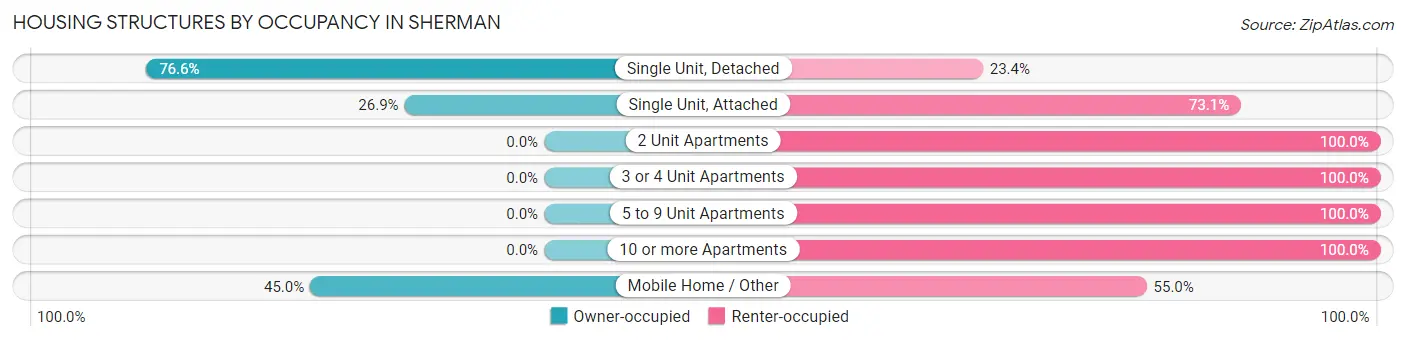
| Structure Type | Owner-occupied | Renter-occupied |
| Single Unit, Detached | 8,496 (76.6%) | 2,598 (23.4%) |
| Single Unit, Attached | 122 (26.9%) | 332 (73.1%) |
| 2 Unit Apartments | 0 (0.0%) | 505 (100.0%) |
| 3 or 4 Unit Apartments | 0 (0.0%) | 846 (100.0%) |
| 5 to 9 Unit Apartments | 0 (0.0%) | 1,498 (100.0%) |
| 10 or more Apartments | 0 (0.0%) | 2,050 (100.0%) |
| Mobile Home / Other | 159 (45.0%) | 194 (55.0%) |
| Total | 8,777 (52.2%) | 8,023 (47.8%) |
Housing Structures by Number of Rooms in Sherman
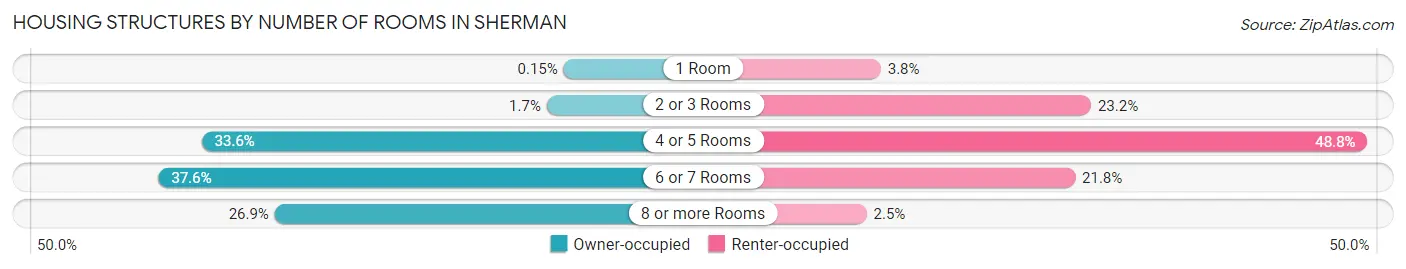
| Number of Rooms | Owner-occupied | Renter-occupied |
| 1 Room | 13 (0.2%) | 303 (3.8%) |
| 2 or 3 Rooms | 150 (1.7%) | 1,863 (23.2%) |
| 4 or 5 Rooms | 2,953 (33.6%) | 3,914 (48.8%) |
| 6 or 7 Rooms | 3,303 (37.6%) | 1,745 (21.7%) |
| 8 or more Rooms | 2,358 (26.9%) | 198 (2.5%) |
| Total | 8,777 (100.0%) | 8,023 (100.0%) |
Housing Structure by Heating Type in Sherman
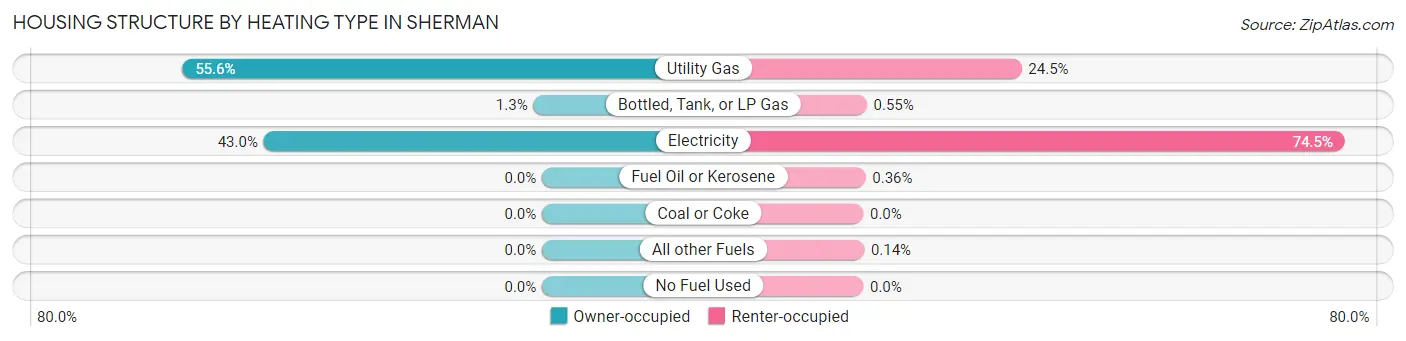
| Heating Type | Owner-occupied | Renter-occupied |
| Utility Gas | 4,883 (55.6%) | 1,964 (24.5%) |
| Bottled, Tank, or LP Gas | 117 (1.3%) | 44 (0.5%) |
| Electricity | 3,777 (43.0%) | 5,975 (74.5%) |
| Fuel Oil or Kerosene | 0 (0.0%) | 29 (0.4%) |
| Coal or Coke | 0 (0.0%) | 0 (0.0%) |
| All other Fuels | 0 (0.0%) | 11 (0.1%) |
| No Fuel Used | 0 (0.0%) | 0 (0.0%) |
| Total | 8,777 (100.0%) | 8,023 (100.0%) |
Household Vehicle Usage in Sherman
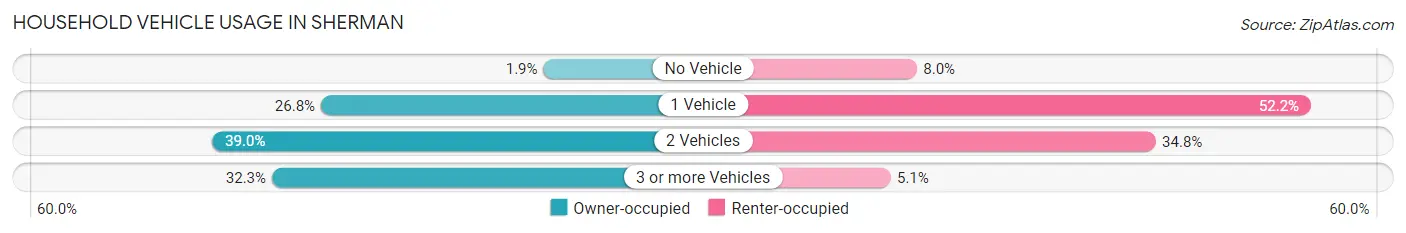
| Vehicles per Household | Owner-occupied | Renter-occupied |
| No Vehicle | 166 (1.9%) | 642 (8.0%) |
| 1 Vehicle | 2,353 (26.8%) | 4,188 (52.2%) |
| 2 Vehicles | 3,423 (39.0%) | 2,788 (34.7%) |
| 3 or more Vehicles | 2,835 (32.3%) | 405 (5.1%) |
| Total | 8,777 (100.0%) | 8,023 (100.0%) |
Real Estate & Mortgages in Sherman
Real Estate and Mortgage Overview in Sherman
| Characteristic | Without Mortgage | With Mortgage |
| Housing Units | 4,085 | 4,692 |
| Median Property Value | $163,700 | $222,000 |
| Median Household Income | $58,573 | $806 |
| Monthly Housing Costs | $536 | $304 |
| Real Estate Taxes | $1,687 | $65 |
Property Value by Mortgage Status in Sherman
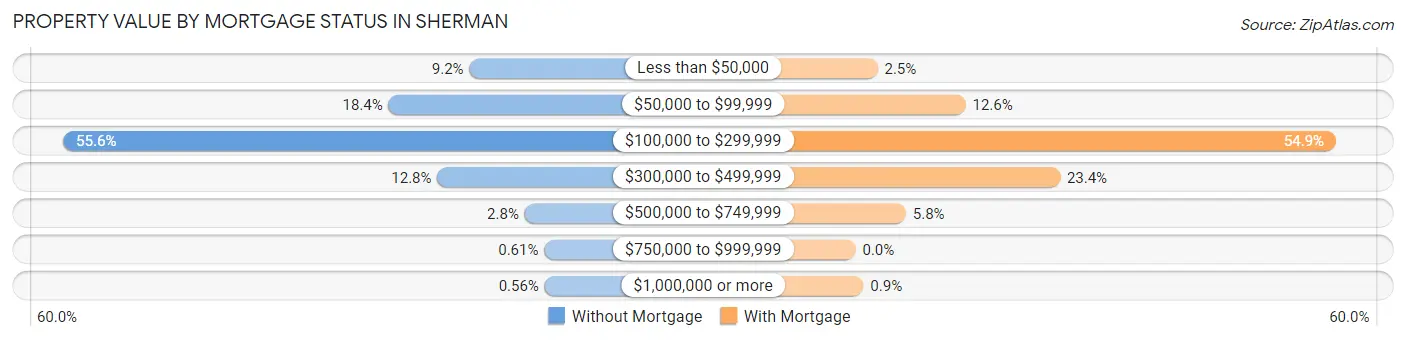
| Property Value | Without Mortgage | With Mortgage |
| Less than $50,000 | 374 (9.2%) | 118 (2.5%) |
| $50,000 to $99,999 | 752 (18.4%) | 590 (12.6%) |
| $100,000 to $299,999 | 2,271 (55.6%) | 2,576 (54.9%) |
| $300,000 to $499,999 | 524 (12.8%) | 1,096 (23.4%) |
| $500,000 to $749,999 | 116 (2.8%) | 270 (5.8%) |
| $750,000 to $999,999 | 25 (0.6%) | 0 (0.0%) |
| $1,000,000 or more | 23 (0.6%) | 42 (0.9%) |
| Total | 4,085 (100.0%) | 4,692 (100.0%) |
Household Income by Mortgage Status in Sherman
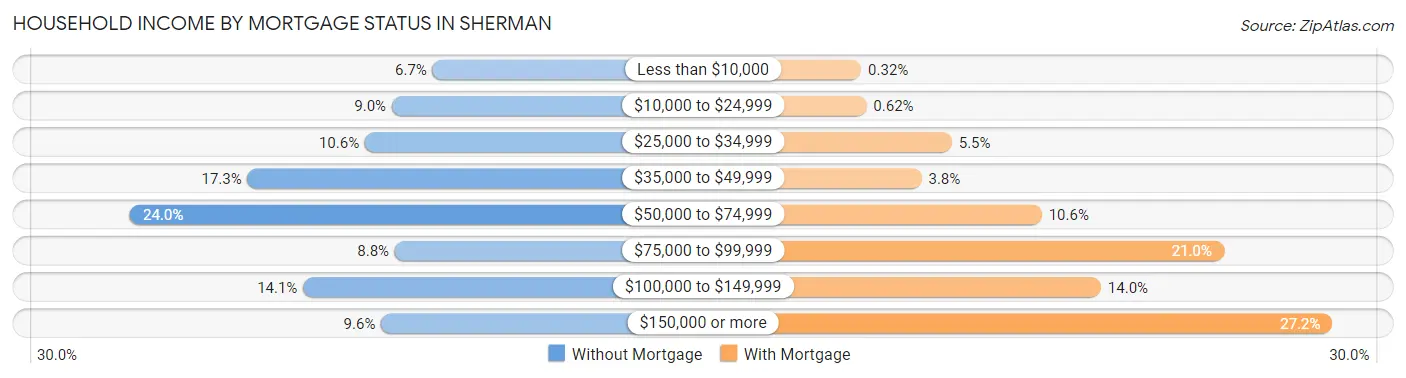
| Household Income | Without Mortgage | With Mortgage |
| Less than $10,000 | 273 (6.7%) | 15 (0.3%) |
| $10,000 to $24,999 | 368 (9.0%) | 29 (0.6%) |
| $25,000 to $34,999 | 431 (10.5%) | 258 (5.5%) |
| $35,000 to $49,999 | 705 (17.3%) | 177 (3.8%) |
| $50,000 to $74,999 | 979 (24.0%) | 499 (10.6%) |
| $75,000 to $99,999 | 361 (8.8%) | 987 (21.0%) |
| $100,000 to $149,999 | 575 (14.1%) | 658 (14.0%) |
| $150,000 or more | 393 (9.6%) | 1,278 (27.2%) |
| Total | 4,085 (100.0%) | 4,692 (100.0%) |
Property Value to Household Income Ratio in Sherman
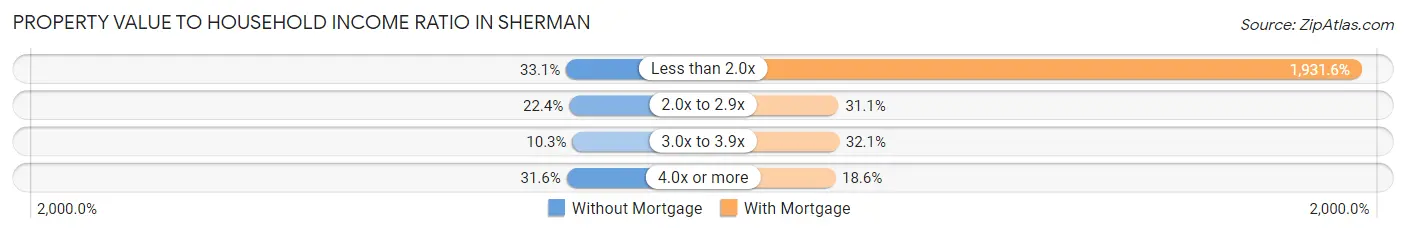
| Value-to-Income Ratio | Without Mortgage | With Mortgage |
| Less than 2.0x | 1,353 (33.1%) | 90,632 (1,931.6%) |
| 2.0x to 2.9x | 914 (22.4%) | 1,457 (31.0%) |
| 3.0x to 3.9x | 421 (10.3%) | 1,507 (32.1%) |
| 4.0x or more | 1,290 (31.6%) | 871 (18.6%) |
| Total | 4,085 (100.0%) | 4,692 (100.0%) |
Real Estate Taxes by Mortgage Status in Sherman
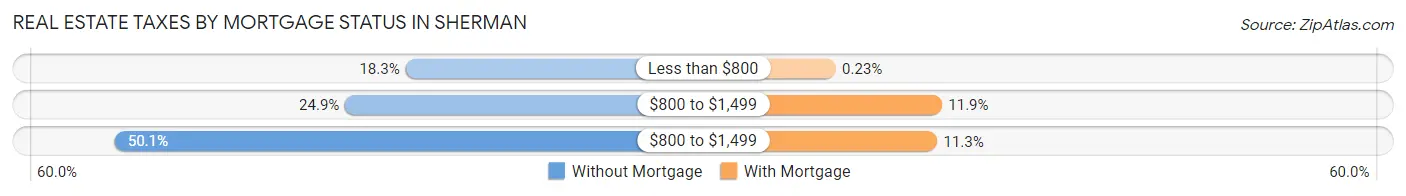
| Property Taxes | Without Mortgage | With Mortgage |
| Less than $800 | 746 (18.3%) | 11 (0.2%) |
| $800 to $1,499 | 1,016 (24.9%) | 557 (11.9%) |
| $800 to $1,499 | 2,047 (50.1%) | 532 (11.3%) |
| Total | 4,085 (100.0%) | 4,692 (100.0%) |
Health & Disability in Sherman
Health Insurance Coverage by Age in Sherman
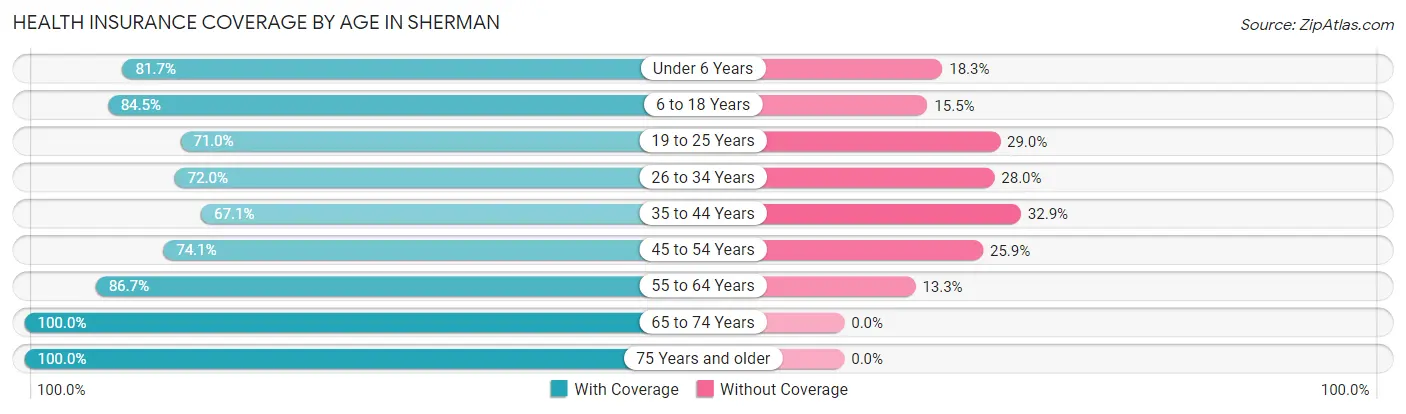
| Age Bracket | With Coverage | Without Coverage |
| Under 6 Years | 3,196 (81.7%) | 715 (18.3%) |
| 6 to 18 Years | 6,235 (84.5%) | 1,144 (15.5%) |
| 19 to 25 Years | 3,331 (71.0%) | 1,363 (29.0%) |
| 26 to 34 Years | 4,113 (72.0%) | 1,599 (28.0%) |
| 35 to 44 Years | 3,195 (67.1%) | 1,569 (32.9%) |
| 45 to 54 Years | 3,462 (74.1%) | 1,208 (25.9%) |
| 55 to 64 Years | 5,007 (86.7%) | 766 (13.3%) |
| 65 to 74 Years | 4,091 (100.0%) | 0 (0.0%) |
| 75 Years and older | 2,402 (100.0%) | 0 (0.0%) |
| Total | 35,032 (80.7%) | 8,364 (19.3%) |
Health Insurance Coverage by Citizenship Status in Sherman
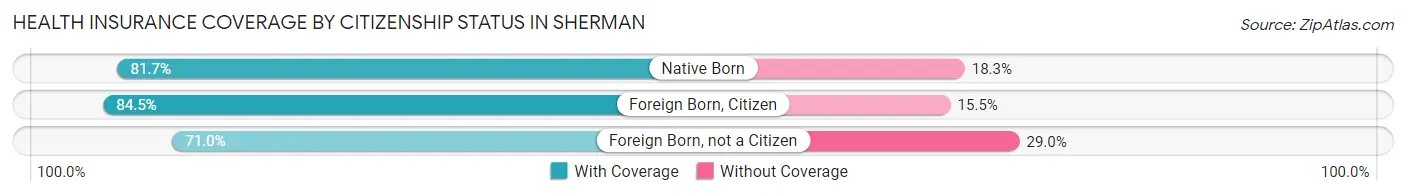
| Citizenship Status | With Coverage | Without Coverage |
| Native Born | 3,196 (81.7%) | 715 (18.3%) |
| Foreign Born, Citizen | 6,235 (84.5%) | 1,144 (15.5%) |
| Foreign Born, not a Citizen | 3,331 (71.0%) | 1,363 (29.0%) |
Health Insurance Coverage by Household Income in Sherman
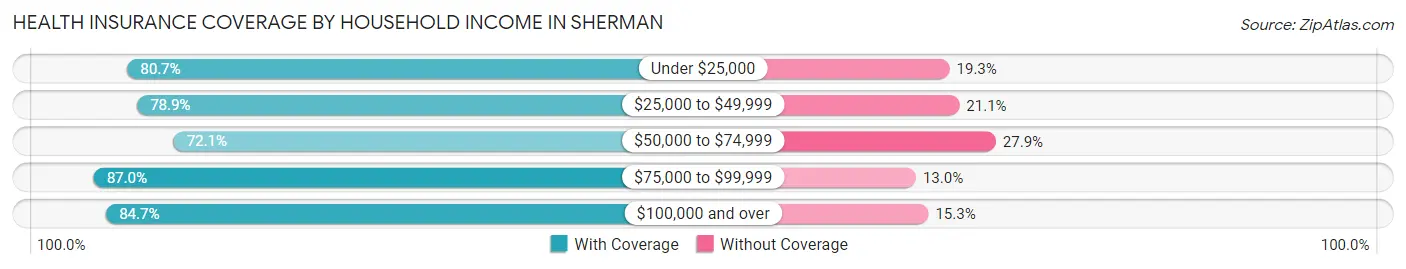
| Household Income | With Coverage | Without Coverage |
| Under $25,000 | 3,944 (80.7%) | 941 (19.3%) |
| $25,000 to $49,999 | 7,876 (78.9%) | 2,106 (21.1%) |
| $50,000 to $74,999 | 6,643 (72.1%) | 2,576 (27.9%) |
| $75,000 to $99,999 | 4,615 (87.0%) | 687 (13.0%) |
| $100,000 and over | 11,004 (84.7%) | 1,988 (15.3%) |
Public vs Private Health Insurance Coverage by Age in Sherman
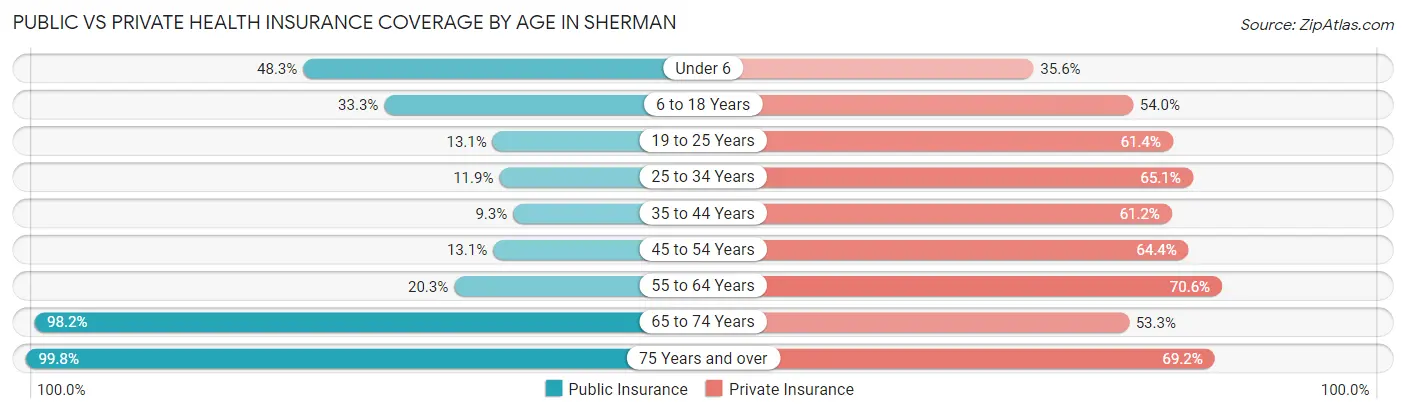
| Age Bracket | Public Insurance | Private Insurance |
| Under 6 | 1,889 (48.3%) | 1,391 (35.6%) |
| 6 to 18 Years | 2,454 (33.3%) | 3,986 (54.0%) |
| 19 to 25 Years | 617 (13.1%) | 2,883 (61.4%) |
| 25 to 34 Years | 680 (11.9%) | 3,719 (65.1%) |
| 35 to 44 Years | 445 (9.3%) | 2,917 (61.2%) |
| 45 to 54 Years | 610 (13.1%) | 3,006 (64.4%) |
| 55 to 64 Years | 1,171 (20.3%) | 4,073 (70.6%) |
| 65 to 74 Years | 4,018 (98.2%) | 2,179 (53.3%) |
| 75 Years and over | 2,398 (99.8%) | 1,662 (69.2%) |
| Total | 14,282 (32.9%) | 25,816 (59.5%) |
Disability Status by Sex by Age in Sherman
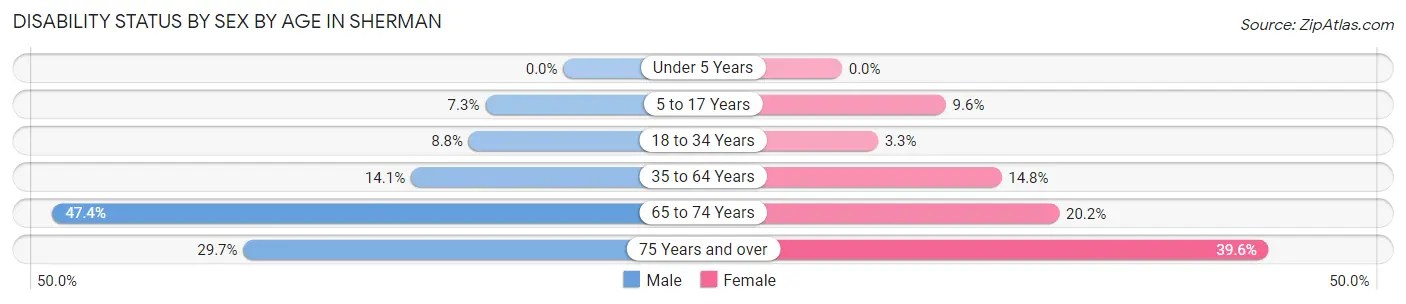
| Age Bracket | Male | Female |
| Under 5 Years | 0 (0.0%) | 0 (0.0%) |
| 5 to 17 Years | 281 (7.2%) | 349 (9.6%) |
| 18 to 34 Years | 490 (8.8%) | 180 (3.3%) |
| 35 to 64 Years | 1,002 (14.1%) | 1,203 (14.8%) |
| 65 to 74 Years | 926 (47.4%) | 431 (20.2%) |
| 75 Years and over | 289 (29.7%) | 566 (39.6%) |
Disability Class by Sex by Age in Sherman
Disability Class: Hearing Difficulty
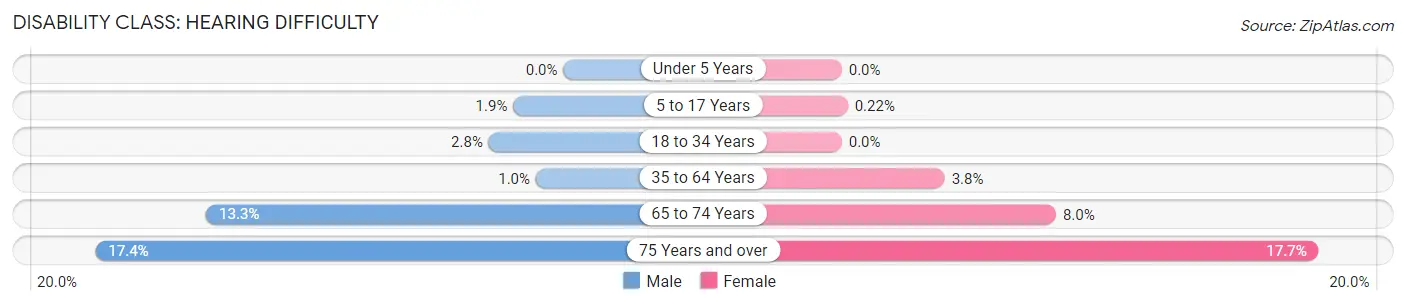
| Age Bracket | Male | Female |
| Under 5 Years | 0 (0.0%) | 0 (0.0%) |
| 5 to 17 Years | 72 (1.9%) | 8 (0.2%) |
| 18 to 34 Years | 155 (2.8%) | 0 (0.0%) |
| 35 to 64 Years | 72 (1.0%) | 310 (3.8%) |
| 65 to 74 Years | 259 (13.3%) | 170 (8.0%) |
| 75 Years and over | 169 (17.4%) | 253 (17.7%) |
Disability Class: Vision Difficulty
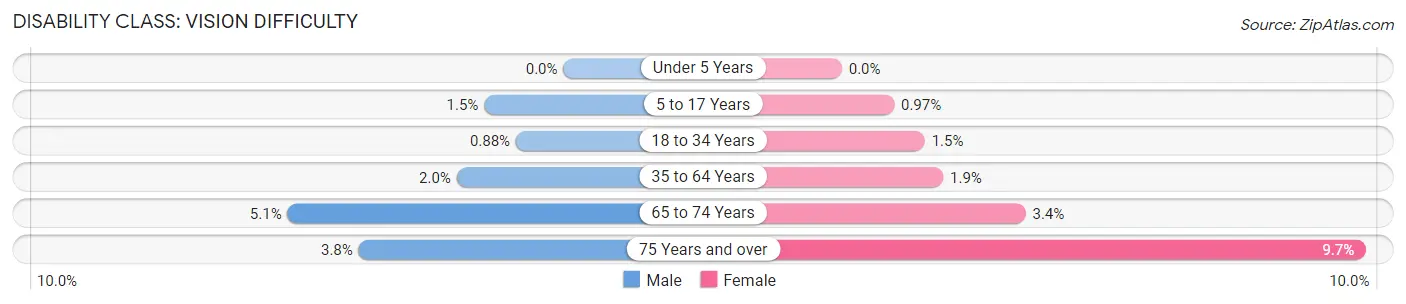
| Age Bracket | Male | Female |
| Under 5 Years | 0 (0.0%) | 0 (0.0%) |
| 5 to 17 Years | 57 (1.5%) | 35 (1.0%) |
| 18 to 34 Years | 49 (0.9%) | 83 (1.5%) |
| 35 to 64 Years | 140 (2.0%) | 153 (1.9%) |
| 65 to 74 Years | 100 (5.1%) | 73 (3.4%) |
| 75 Years and over | 37 (3.8%) | 139 (9.7%) |
Disability Class: Cognitive Difficulty
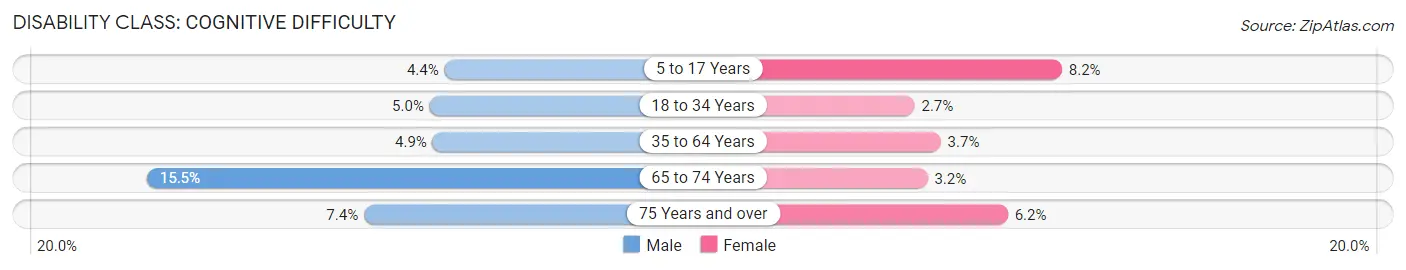
| Age Bracket | Male | Female |
| 5 to 17 Years | 171 (4.4%) | 296 (8.2%) |
| 18 to 34 Years | 277 (5.0%) | 146 (2.7%) |
| 35 to 64 Years | 344 (4.9%) | 298 (3.7%) |
| 65 to 74 Years | 302 (15.5%) | 68 (3.2%) |
| 75 Years and over | 72 (7.4%) | 88 (6.2%) |
Disability Class: Ambulatory Difficulty
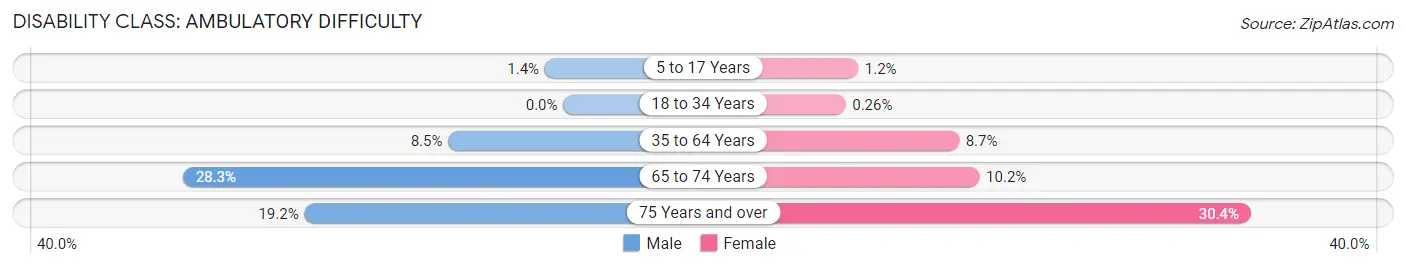
| Age Bracket | Male | Female |
| 5 to 17 Years | 53 (1.4%) | 43 (1.2%) |
| 18 to 34 Years | 0 (0.0%) | 14 (0.3%) |
| 35 to 64 Years | 605 (8.5%) | 705 (8.7%) |
| 65 to 74 Years | 552 (28.3%) | 218 (10.2%) |
| 75 Years and over | 187 (19.2%) | 434 (30.4%) |
Disability Class: Self-Care Difficulty
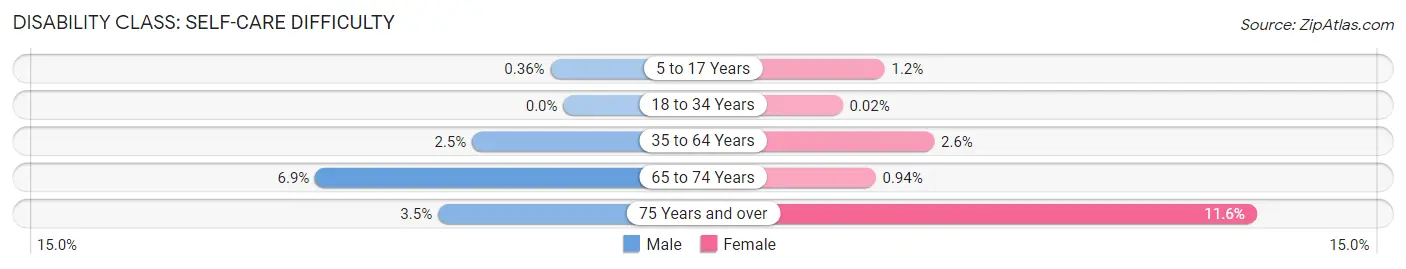
| Age Bracket | Male | Female |
| 5 to 17 Years | 14 (0.4%) | 43 (1.2%) |
| 18 to 34 Years | 0 (0.0%) | 1 (0.0%) |
| 35 to 64 Years | 180 (2.5%) | 209 (2.6%) |
| 65 to 74 Years | 135 (6.9%) | 20 (0.9%) |
| 75 Years and over | 34 (3.5%) | 165 (11.6%) |
Technology Access in Sherman
Computing Device Access in Sherman
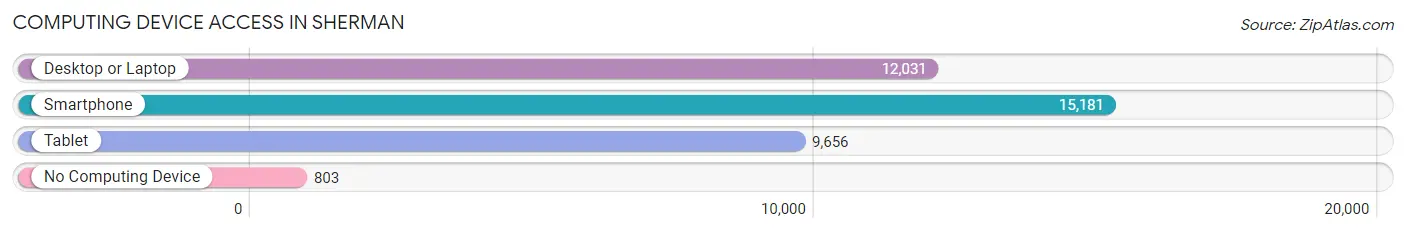
| Device Type | # Households | % Households |
| Desktop or Laptop | 12,031 | 71.6% |
| Smartphone | 15,181 | 90.4% |
| Tablet | 9,656 | 57.5% |
| No Computing Device | 803 | 4.8% |
| Total | 16,800 | 100.0% |
Internet Access in Sherman
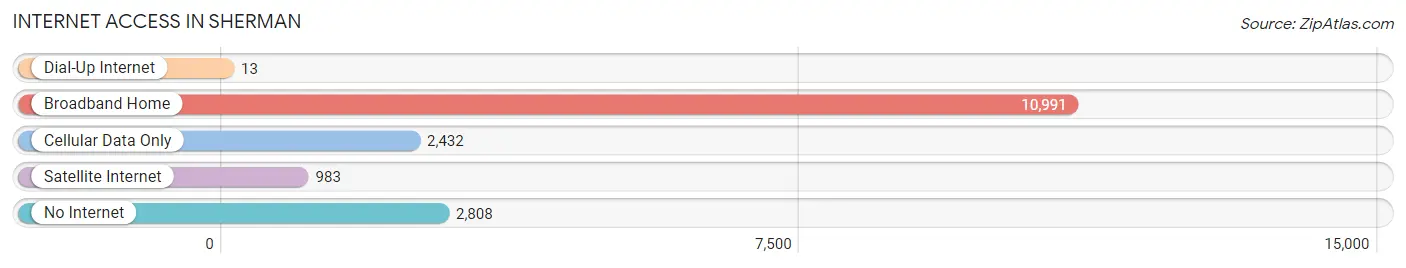
| Internet Type | # Households | % Households |
| Dial-Up Internet | 13 | 0.1% |
| Broadband Home | 10,991 | 65.4% |
| Cellular Data Only | 2,432 | 14.5% |
| Satellite Internet | 983 | 5.9% |
| No Internet | 2,808 | 16.7% |
| Total | 16,800 | 100.0% |
Sherman Summary
Sherman, Texas is a city located in Grayson County, Texas, United States. It is the county seat of Grayson County and is located approximately 65 miles north of Dallas. The city had a population of 38,521 at the 2010 census, making it the largest city in the county.
History
Sherman was founded in 1846 by a group of settlers from Kentucky and Tennessee. The city was named after General Sidney Sherman, a hero of the Texas Revolution. The city was incorporated in 1846 and was the site of the first county courthouse in Grayson County.
In 1848, Sherman was chosen as the county seat of Grayson County. The city quickly grew and became an important center for trade and commerce in the region. The city was also a major stop on the Butterfield Overland Mail route.
In the late 19th century, Sherman became an important railroad hub. The city was the site of the first railroad bridge across the Red River and was the site of the first railroad bridge across the Brazos River.
In the early 20th century, Sherman was a major center for cotton production and processing. The city was also home to several large manufacturing plants, including the Texas Cotton Oil Company and the Sherman Manufacturing Company.
Geography
Sherman is located in the eastern part of Grayson County, at the intersection of U.S. Route 75 and State Highway 56. The city is situated on the Red River, which forms the border between Texas and Oklahoma. The city is located approximately 65 miles north of Dallas and is part of the Texoma region.
The city has a total area of 24.2 square miles, of which 24.1 square miles is land and 0.1 square miles is water. The city is located in a humid subtropical climate zone and has hot, humid summers and mild winters.
Economy
Sherman has a diverse economy that is driven by manufacturing, healthcare, education, and retail. The city is home to several large manufacturing plants, including the Texas Cotton Oil Company and the Sherman Manufacturing Company. The city is also home to several healthcare facilities, including the Texoma Medical Center and the Sherman Health Center.
The city is also home to Austin College, a private liberal arts college, and Grayson College, a two-year community college. The city is also home to several retail stores, including Walmart, Target, and Lowe's.
Demographics
As of the 2010 census, there were 38,521 people, 14,945 households, and 9,845 families residing in the city. The population density was 1,594.3 people per square mile. The racial makeup of the city was 75.3% White, 11.3% African American, 0.7% Native American, 1.2% Asian, 0.1% Pacific Islander, 8.7% from other races, and 2.9% from two or more races. Hispanic or Latino of any race were 17.3% of the population.
The median income for a household in the city was $37,945, and the median income for a family was $45,945. The per capita income for the city was $20,845. About 14.3% of families and 17.7% of the population were below the poverty line, including 25.2% of those under age 18 and 10.2% of those age 65 or over.
Common Questions
What is Per Capita Income in Sherman?
Per Capita income in Sherman is $30,605.
What is the Median Family Income in Sherman?
Median Family Income in Sherman is $68,525.
What is the Median Household income in Sherman?
Median Household Income in Sherman is $58,020.
What is Income or Wage Gap in Sherman?
Income or Wage Gap in Sherman is 30.3%.
Women in Sherman earn 69.7 cents for every dollar earned by a man.
What is Family Income Deficit in Sherman?
Family Income Deficit in Sherman is $10,268.
Families that are below poverty line in Sherman earn $10,268 less on average than the poverty threshold level.
What is Inequality or Gini Index in Sherman?
Inequality or Gini Index in Sherman is 0.45.
What is the Total Population of Sherman?
Total Population of Sherman is 44,052.
What is the Total Male Population of Sherman?
Total Male Population of Sherman is 21,534.
What is the Total Female Population of Sherman?
Total Female Population of Sherman is 22,518.
What is the Ratio of Males per 100 Females in Sherman?
There are 95.63 Males per 100 Females in Sherman.
What is the Ratio of Females per 100 Males in Sherman?
There are 104.57 Females per 100 Males in Sherman.
What is the Median Population Age in Sherman?
Median Population Age in Sherman is 35.3 Years.
What is the Average Family Size in Sherman
Average Family Size in Sherman is 3.2 People.
What is the Average Household Size in Sherman
Average Household Size in Sherman is 2.5 People.
How Large is the Labor Force in Sherman?
There are 22,427 People in the Labor Forcein in Sherman.
What is the Percentage of People in the Labor Force in Sherman?
64.8% of People are in the Labor Force in Sherman.
What is the Unemployment Rate in Sherman?
Unemployment Rate in Sherman is 3.6%.