South Browning, MT Map & Demographics
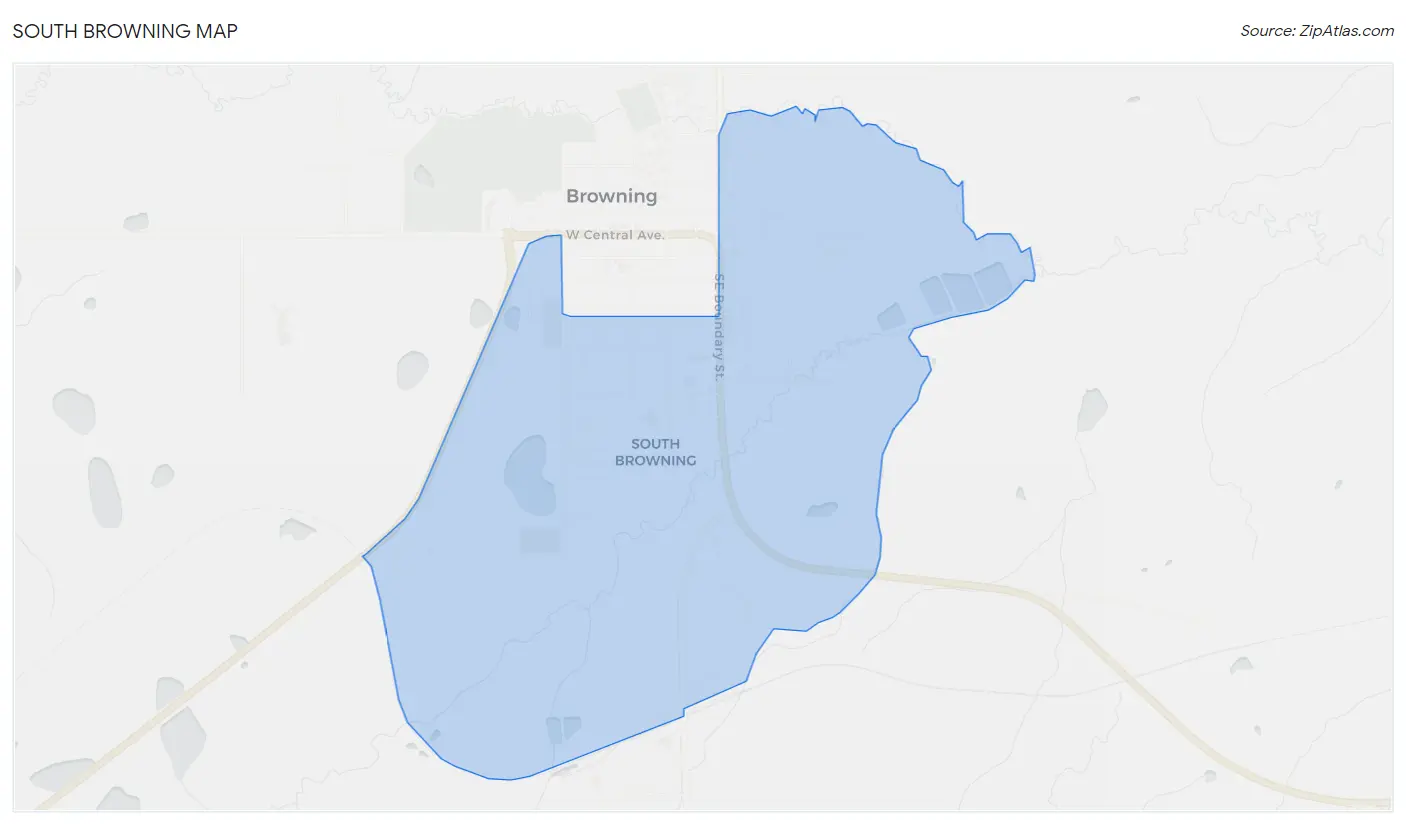
South Browning Map
South Browning Overview
$14,826
PER CAPITA INCOME
$35,898
AVG FAMILY INCOME
$26,101
AVG HOUSEHOLD INCOME
44.4%
WAGE / INCOME GAP [ % ]
55.6¢/ $1
WAGE / INCOME GAP [ $ ]
0.52
INEQUALITY / GINI INDEX
1,654
TOTAL POPULATION
683
MALE POPULATION
971
FEMALE POPULATION
70.34
MALES / 100 FEMALES
142.17
FEMALES / 100 MALES
26.3
MEDIAN AGE
3.3
AVG FAMILY SIZE
3.0
AVG HOUSEHOLD SIZE
590
LABOR FORCE [ PEOPLE ]
51.4%
PERCENT IN LABOR FORCE
15.3%
UNEMPLOYMENT RATE
Income in South Browning
Income Overview in South Browning
Per Capita Income in South Browning is $14,826, while median incomes of families and households are $35,898 and $26,101 respectively.
| Characteristic | Number | Measure |
| Per Capita Income | 1,654 | $14,826 |
| Median Family Income | 415 | $35,898 |
| Mean Family Income | 415 | $45,279 |
| Median Household Income | 561 | $26,101 |
| Mean Household Income | 561 | $37,450 |
| Income Deficit | 415 | $0 |
| Wage / Income Gap (%) | 1,654 | 44.40% |
| Wage / Income Gap ($) | 1,654 | 55.60¢ per $1 |
| Gini / Inequality Index | 1,654 | 0.52 |
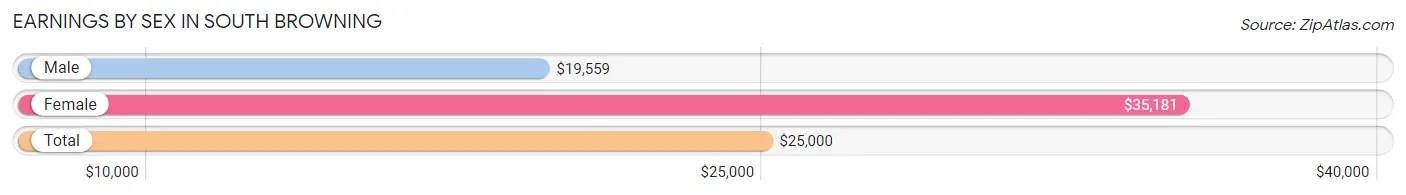
Earnings by Sex in South Browning
Average Earnings in South Browning are $25,000, $19,559 for men and $35,181 for women, a difference of 44.4%.
| Sex | Number | Average Earnings |
| Male | 294 (46.4%) | $19,559 |
| Female | 340 (53.6%) | $35,181 |
| Total | 634 (100.0%) | $25,000 |
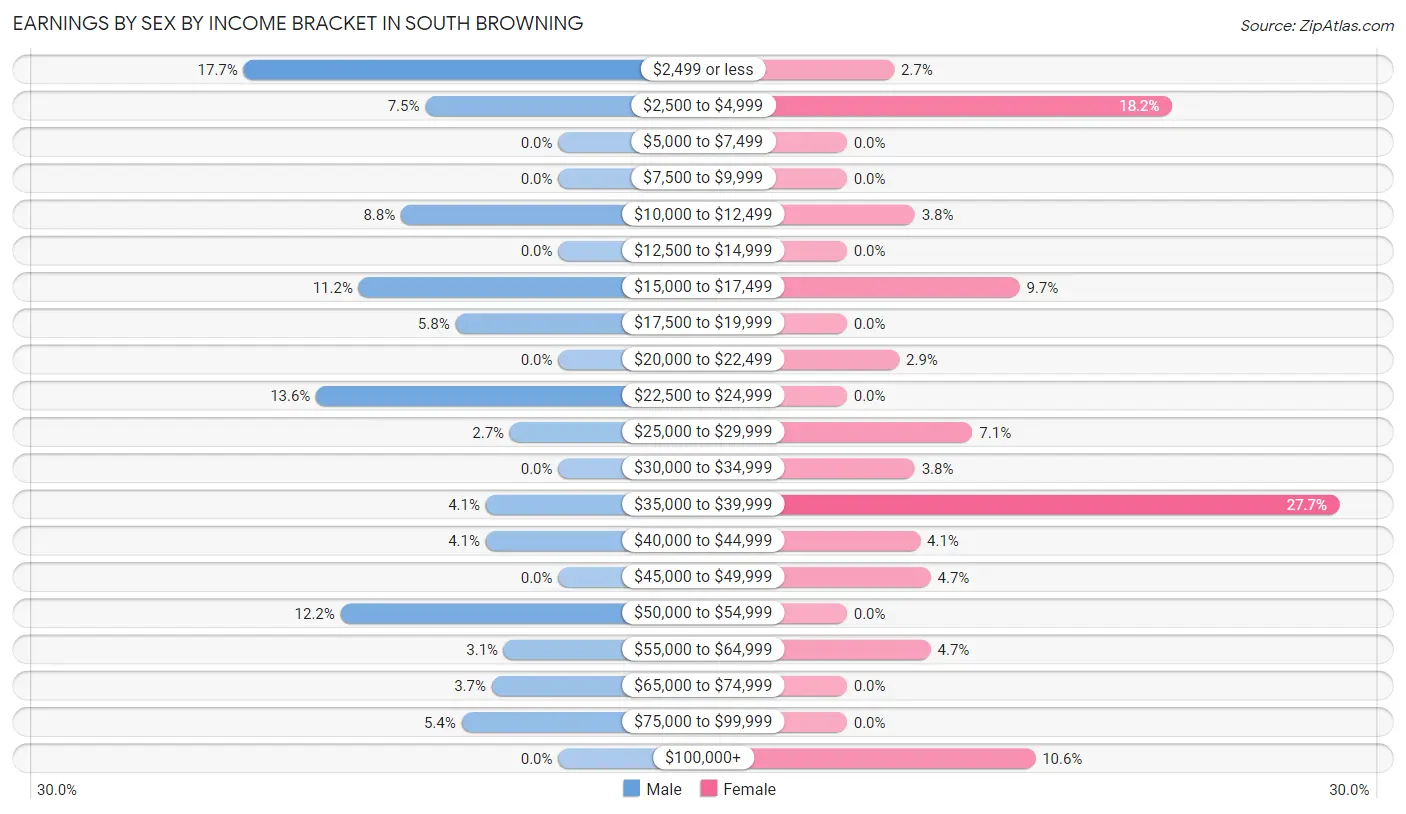
Earnings by Sex by Income Bracket in South Browning
The most common earnings brackets in South Browning are $2,499 or less for men (52 | 17.7%) and $35,000 to $39,999 for women (94 | 27.7%).
| Income | Male | Female |
| $2,499 or less | 52 (17.7%) | 9 (2.6%) |
| $2,500 to $4,999 | 22 (7.5%) | 62 (18.2%) |
| $5,000 to $7,499 | 0 (0.0%) | 0 (0.0%) |
| $7,500 to $9,999 | 0 (0.0%) | 0 (0.0%) |
| $10,000 to $12,499 | 26 (8.8%) | 13 (3.8%) |
| $12,500 to $14,999 | 0 (0.0%) | 0 (0.0%) |
| $15,000 to $17,499 | 33 (11.2%) | 33 (9.7%) |
| $17,500 to $19,999 | 17 (5.8%) | 0 (0.0%) |
| $20,000 to $22,499 | 0 (0.0%) | 10 (2.9%) |
| $22,500 to $24,999 | 40 (13.6%) | 0 (0.0%) |
| $25,000 to $29,999 | 8 (2.7%) | 24 (7.1%) |
| $30,000 to $34,999 | 0 (0.0%) | 13 (3.8%) |
| $35,000 to $39,999 | 12 (4.1%) | 94 (27.7%) |
| $40,000 to $44,999 | 12 (4.1%) | 14 (4.1%) |
| $45,000 to $49,999 | 0 (0.0%) | 16 (4.7%) |
| $50,000 to $54,999 | 36 (12.2%) | 0 (0.0%) |
| $55,000 to $64,999 | 9 (3.1%) | 16 (4.7%) |
| $65,000 to $74,999 | 11 (3.7%) | 0 (0.0%) |
| $75,000 to $99,999 | 16 (5.4%) | 0 (0.0%) |
| $100,000+ | 0 (0.0%) | 36 (10.6%) |
| Total | 294 (100.0%) | 340 (100.0%) |
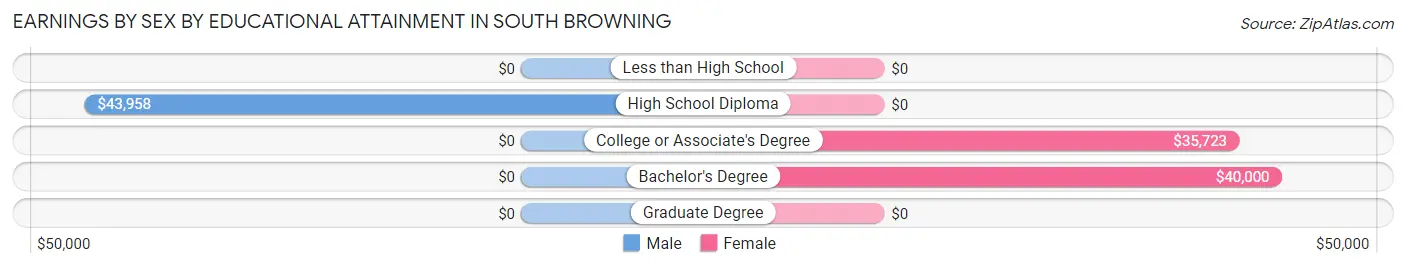
Earnings by Sex by Educational Attainment in South Browning
Average earnings in South Browning are $38,125 for men and $35,497 for women, a difference of 6.9%. Men with an educational attainment of high school diploma enjoy the highest average annual earnings of $43,958, while those with high school diploma education earn the least with $43,958. Women with an educational attainment of bachelor's degree earn the most with the average annual earnings of $40,000, while those with college or associate's degree education have the smallest earnings of $35,723.
| Educational Attainment | Male Income | Female Income |
| Less than High School | - | - |
| High School Diploma | $43,958 | $0 |
| College or Associate's Degree | - | - |
| Bachelor's Degree | - | - |
| Graduate Degree | - | - |
| Total | $38,125 | $35,497 |
Family Income in South Browning
Family Income Brackets in South Browning
According to the South Browning family income data, there are 104 families falling into the $35,000 to $49,999 income range, which is the most common income bracket and makes up 25.1% of all families.
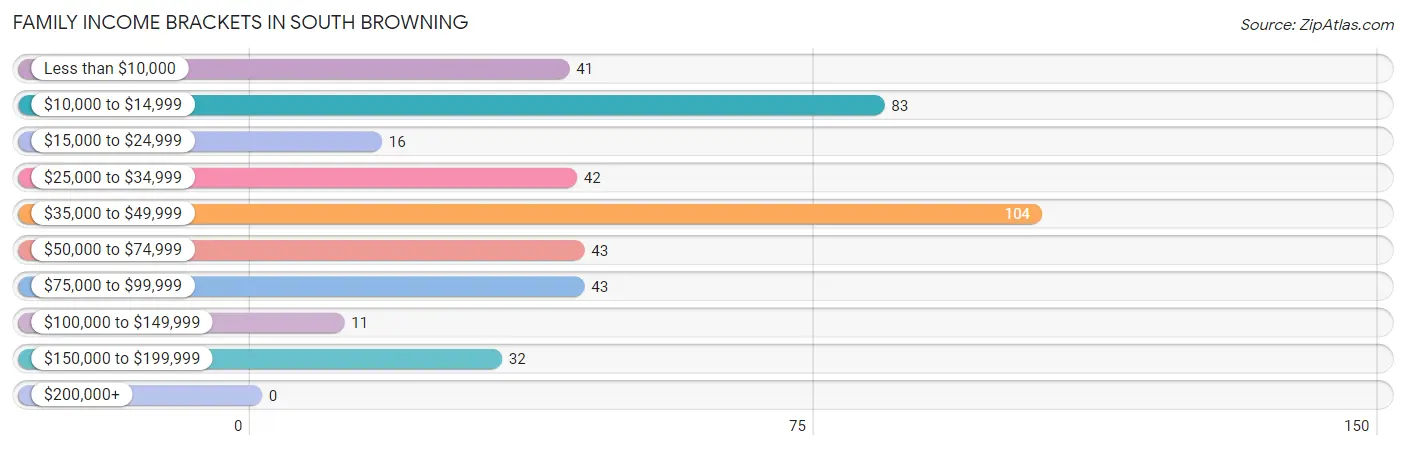
| Income Bracket | # Families | % Families |
| Less than $10,000 | 41 | 9.9% |
| $10,000 to $14,999 | 83 | 20.0% |
| $15,000 to $24,999 | 16 | 3.9% |
| $25,000 to $34,999 | 42 | 10.1% |
| $35,000 to $49,999 | 104 | 25.1% |
| $50,000 to $74,999 | 43 | 10.4% |
| $75,000 to $99,999 | 43 | 10.4% |
| $100,000 to $149,999 | 11 | 2.7% |
| $150,000 to $199,999 | 32 | 7.7% |
| $200,000+ | 0 | 0.0% |
Family Income by Famaliy Size in South Browning
4-person families (60 | 14.5%) account for the highest median family income in South Browning with $52,159 per family, while 2-person families (242 | 58.3%) have the highest median income of $17,708 per family member.
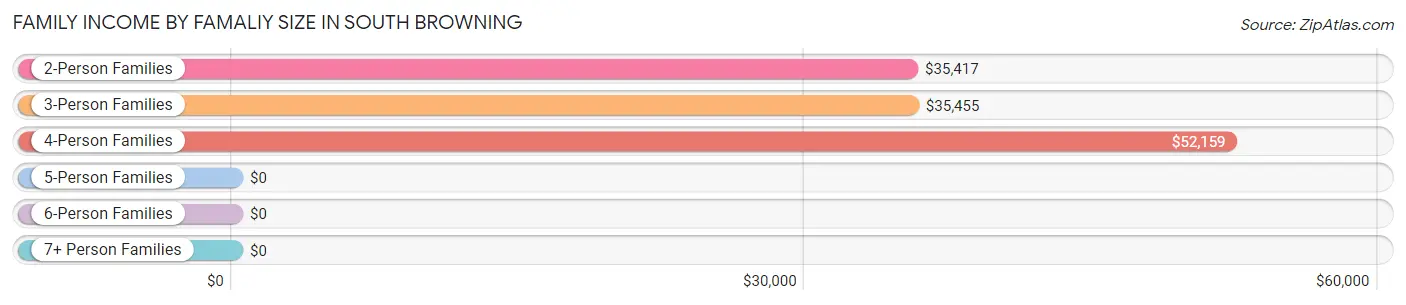
| Income Bracket | # Families | Median Income |
| 2-Person Families | 242 (58.3%) | $35,417 |
| 3-Person Families | 52 (12.5%) | $35,455 |
| 4-Person Families | 60 (14.5%) | $52,159 |
| 5-Person Families | 42 (10.1%) | $0 |
| 6-Person Families | 12 (2.9%) | $0 |
| 7+ Person Families | 7 (1.7%) | $0 |
| Total | 415 (100.0%) | $35,898 |
Family Income by Number of Earners in South Browning
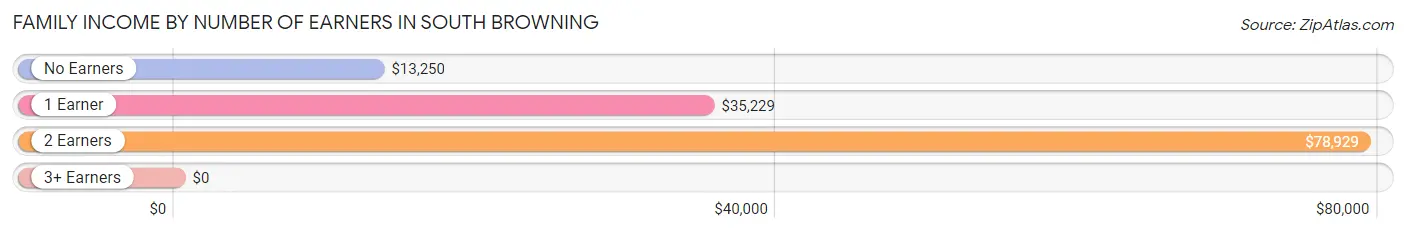
| Number of Earners | # Families | Median Income |
| No Earners | 53 (12.8%) | $13,250 |
| 1 Earner | 267 (64.3%) | $35,229 |
| 2 Earners | 82 (19.8%) | $78,929 |
| 3+ Earners | 13 (3.1%) | $0 |
| Total | 415 (100.0%) | $35,898 |
Household Income in South Browning
Household Income Brackets in South Browning
With 142 households falling in the category, the $10,000 to $14,999 income range is the most frequent in South Browning, accounting for 25.3% of all households.
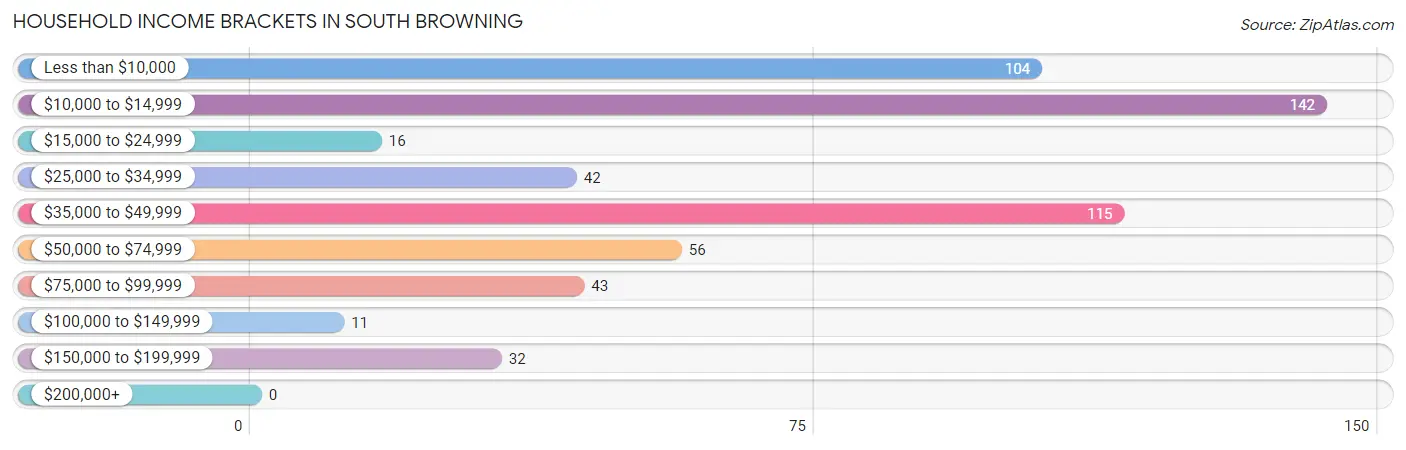
| Income Bracket | # Households | % Households |
| Less than $10,000 | 104 | 18.5% |
| $10,000 to $14,999 | 142 | 25.3% |
| $15,000 to $24,999 | 16 | 2.9% |
| $25,000 to $34,999 | 42 | 7.5% |
| $35,000 to $49,999 | 115 | 20.5% |
| $50,000 to $74,999 | 56 | 10.0% |
| $75,000 to $99,999 | 43 | 7.7% |
| $100,000 to $149,999 | 11 | 2.0% |
| $150,000 to $199,999 | 32 | 5.7% |
| $200,000+ | 0 | 0.0% |
Household Income by Householder Age in South Browning
The median household income in South Browning is $26,101, with the highest median household income of $35,757 found in the 25 to 44 years age bracket for the primary householder. A total of 237 households (42.2%) fall into this category. Meanwhile, the 15 to 24 years age bracket for the primary householder has the lowest median household income of $0, with 30 households (5.3%) in this group.
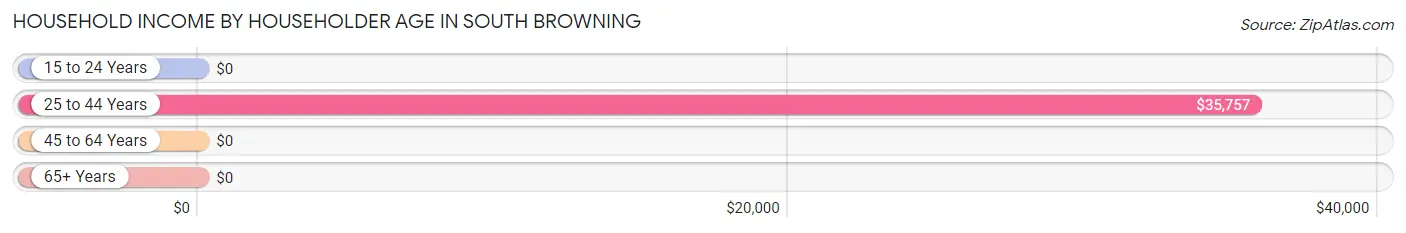
| Income Bracket | # Households | Median Income |
| 15 to 24 Years | 30 (5.3%) | $0 |
| 25 to 44 Years | 237 (42.2%) | $35,757 |
| 45 to 64 Years | 204 (36.4%) | $0 |
| 65+ Years | 90 (16.0%) | $0 |
| Total | 561 (100.0%) | $26,101 |
Poverty in South Browning
Income Below Poverty by Sex and Age in South Browning
With 46.9% poverty level for males and 44.9% for females among the residents of South Browning, 18 to 24 year old males and 12 to 14 year old females are the most vulnerable to poverty, with 100 males (92.6%) and 15 females (100.0%) in their respective age groups living below the poverty level.
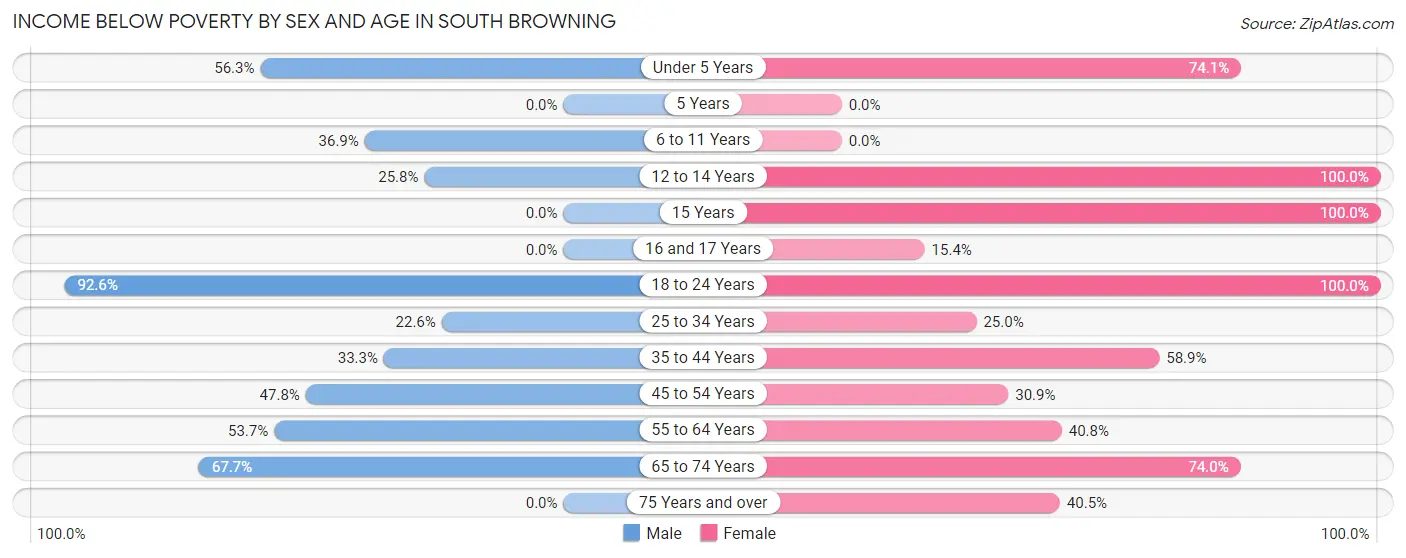
| Age Bracket | Male | Female |
| Under 5 Years | 63 (56.2%) | 83 (74.1%) |
| 5 Years | 0 (0.0%) | 0 (0.0%) |
| 6 to 11 Years | 38 (36.9%) | 0 (0.0%) |
| 12 to 14 Years | 8 (25.8%) | 15 (100.0%) |
| 15 Years | 0 (0.0%) | 18 (100.0%) |
| 16 and 17 Years | 0 (0.0%) | 6 (15.4%) |
| 18 to 24 Years | 100 (92.6%) | 68 (100.0%) |
| 25 to 34 Years | 33 (22.6%) | 60 (25.0%) |
| 35 to 44 Years | 8 (33.3%) | 66 (58.9%) |
| 45 to 54 Years | 11 (47.8%) | 17 (30.9%) |
| 55 to 64 Years | 29 (53.7%) | 49 (40.8%) |
| 65 to 74 Years | 23 (67.6%) | 37 (74.0%) |
| 75 Years and over | 0 (0.0%) | 17 (40.5%) |
| Total | 313 (46.9%) | 436 (44.9%) |
Income Above Poverty by Sex and Age in South Browning
According to the poverty statistics in South Browning, males aged 16 and 17 years and females aged 6 to 11 years are the age groups that are most secure financially, with 100.0% of males and 100.0% of females in these age groups living above the poverty line.
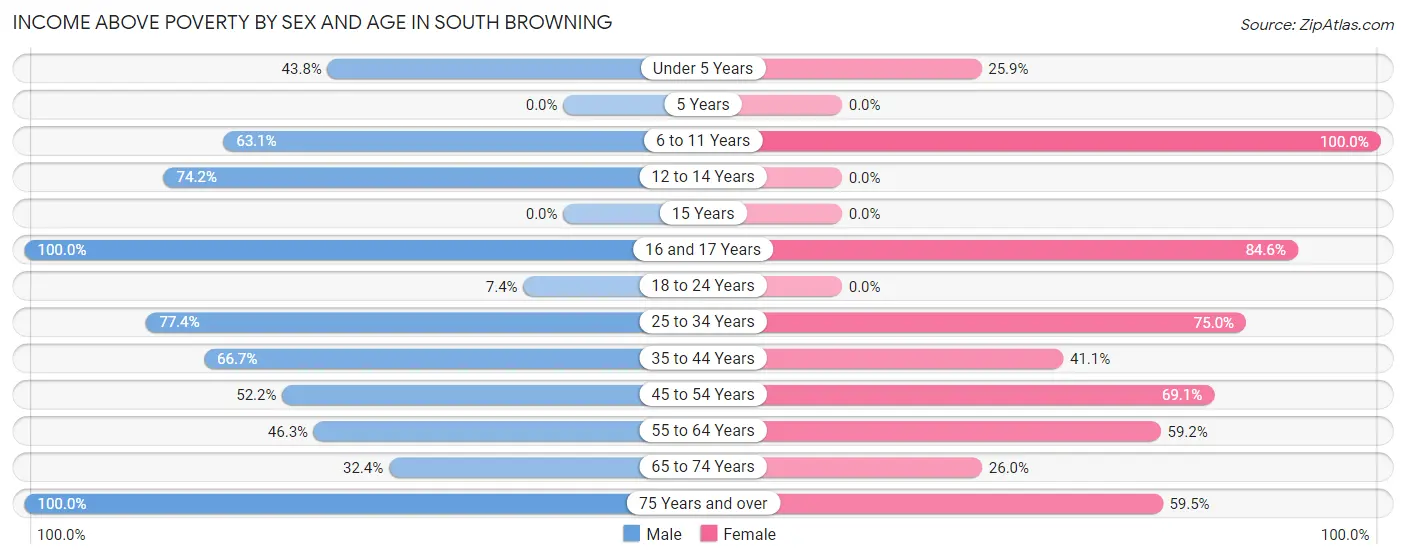
| Age Bracket | Male | Female |
| Under 5 Years | 49 (43.8%) | 29 (25.9%) |
| 5 Years | 0 (0.0%) | 0 (0.0%) |
| 6 to 11 Years | 65 (63.1%) | 100 (100.0%) |
| 12 to 14 Years | 23 (74.2%) | 0 (0.0%) |
| 15 Years | 0 (0.0%) | 0 (0.0%) |
| 16 and 17 Years | 11 (100.0%) | 33 (84.6%) |
| 18 to 24 Years | 8 (7.4%) | 0 (0.0%) |
| 25 to 34 Years | 113 (77.4%) | 180 (75.0%) |
| 35 to 44 Years | 16 (66.7%) | 46 (41.1%) |
| 45 to 54 Years | 12 (52.2%) | 38 (69.1%) |
| 55 to 64 Years | 25 (46.3%) | 71 (59.2%) |
| 65 to 74 Years | 11 (32.4%) | 13 (26.0%) |
| 75 Years and over | 21 (100.0%) | 25 (59.5%) |
| Total | 354 (53.1%) | 535 (55.1%) |
Income Below Poverty Among Married-Couple Families in South Browning
The poverty statistics for married-couple families in South Browning show that 16.0% or 23 of the total 144 families live below the poverty line. Families with 5 or more children have the highest poverty rate of 100.0%, comprising of 7 families. On the other hand, families with no children have the lowest poverty rate of 0.0%, which includes 0 families.
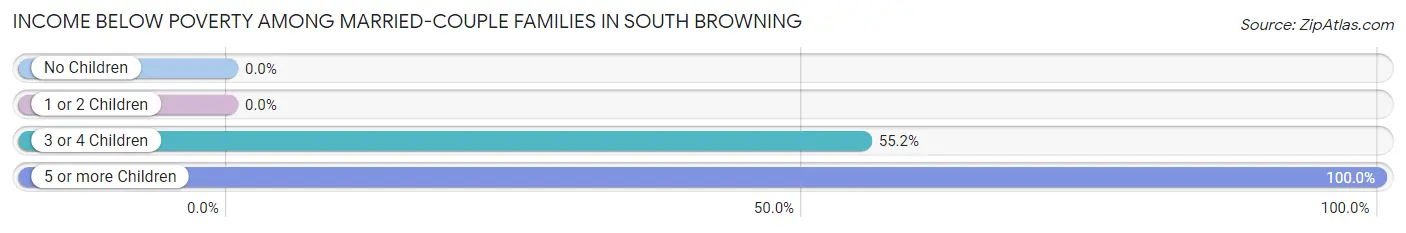
| Children | Above Poverty | Below Poverty |
| No Children | 55 (100.0%) | 0 (0.0%) |
| 1 or 2 Children | 53 (100.0%) | 0 (0.0%) |
| 3 or 4 Children | 13 (44.8%) | 16 (55.2%) |
| 5 or more Children | 0 (0.0%) | 7 (100.0%) |
| Total | 121 (84.0%) | 23 (16.0%) |
Income Below Poverty Among Single-Parent Households in South Browning
According to the poverty data in South Browning, 59.6% or 31 single-father households and 39.3% or 86 single-mother households are living below the poverty line. Among single-father households, those with no children have the highest poverty rate, with 9 households (100.0%) experiencing poverty. Likewise, among single-mother households, those with no children have the highest poverty rate, with 50 households (83.3%) falling below the poverty line.
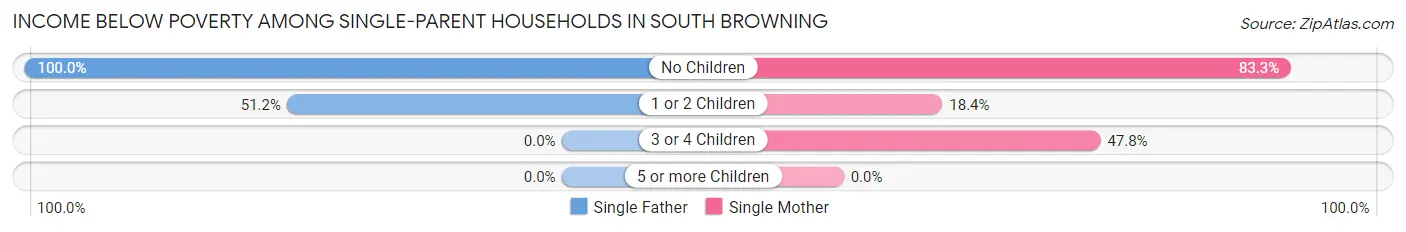
| Children | Single Father | Single Mother |
| No Children | 9 (100.0%) | 50 (83.3%) |
| 1 or 2 Children | 22 (51.2%) | 25 (18.4%) |
| 3 or 4 Children | 0 (0.0%) | 11 (47.8%) |
| 5 or more Children | 0 (0.0%) | 0 (0.0%) |
| Total | 31 (59.6%) | 86 (39.3%) |
Income Below Poverty Among Married-Couple vs Single-Parent Households in South Browning
The poverty data for South Browning shows that 23 of the married-couple family households (16.0%) and 117 of the single-parent households (43.2%) are living below the poverty level. Within the married-couple family households, those with 5 or more children have the highest poverty rate, with 7 households (100.0%) falling below the poverty line. Among the single-parent households, those with no children have the highest poverty rate, with 59 household (85.5%) living below poverty.
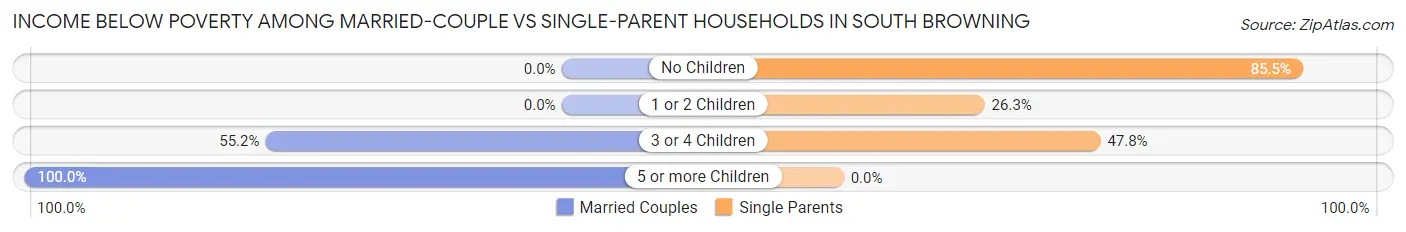
| Children | Married-Couple Families | Single-Parent Households |
| No Children | 0 (0.0%) | 59 (85.5%) |
| 1 or 2 Children | 0 (0.0%) | 47 (26.3%) |
| 3 or 4 Children | 16 (55.2%) | 11 (47.8%) |
| 5 or more Children | 7 (100.0%) | 0 (0.0%) |
| Total | 23 (16.0%) | 117 (43.2%) |
Race in South Browning
The most populous races in South Browning are Native / Alaskan (1,533 | 92.7%), White / Caucasian (66 | 4.0%), and Hispanic or Latino (50 | 3.0%).
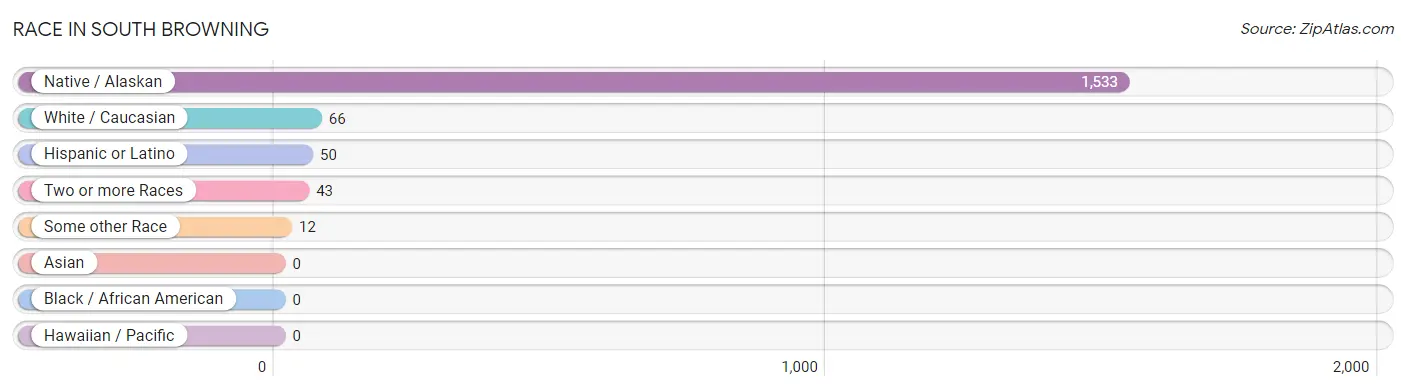
| Race | # Population | % Population |
| Asian | 0 | 0.0% |
| Black / African American | 0 | 0.0% |
| Hawaiian / Pacific | 0 | 0.0% |
| Hispanic or Latino | 50 | 3.0% |
| Native / Alaskan | 1,533 | 92.7% |
| White / Caucasian | 66 | 4.0% |
| Two or more Races | 43 | 2.6% |
| Some other Race | 12 | 0.7% |
| Total | 1,654 | 100.0% |
Ancestry in South Browning
The most populous ancestries reported in South Browning are Blackfeet (1,362 | 82.4%), Chippewa (67 | 4.1%), Mexican (50 | 3.0%), Arapaho (29 | 1.8%), and American (28 | 1.7%), together accounting for 92.9% of all South Browning residents.
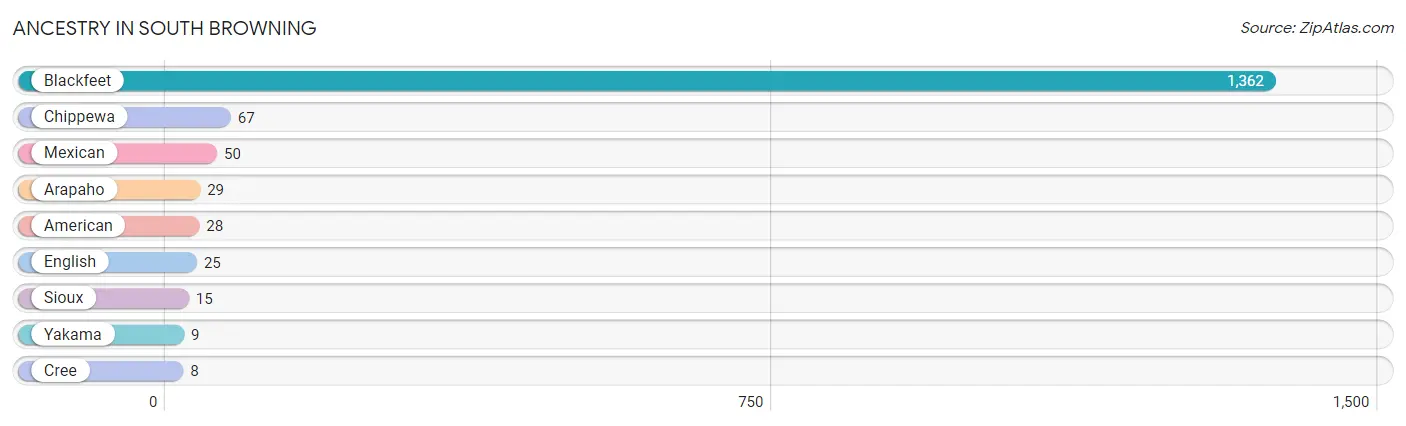
| Ancestry | # Population | % Population |
| American | 28 | 1.7% |
| Arapaho | 29 | 1.8% |
| Blackfeet | 1,362 | 82.4% |
| Chippewa | 67 | 4.1% |
| Cree | 8 | 0.5% |
| English | 25 | 1.5% |
| Mexican | 50 | 3.0% |
| Sioux | 15 | 0.9% |
| Yakama | 9 | 0.5% | View All 9 Rows |
Immigrants in South Browning

| Immigration Origin | # Population | % Population | View All 0 Rows |
Sex and Age in South Browning
Sex and Age in South Browning
The most populous age groups in South Browning are Under 5 Years (128 | 18.7%) for men and 25 to 29 Years (167 | 17.2%) for women.
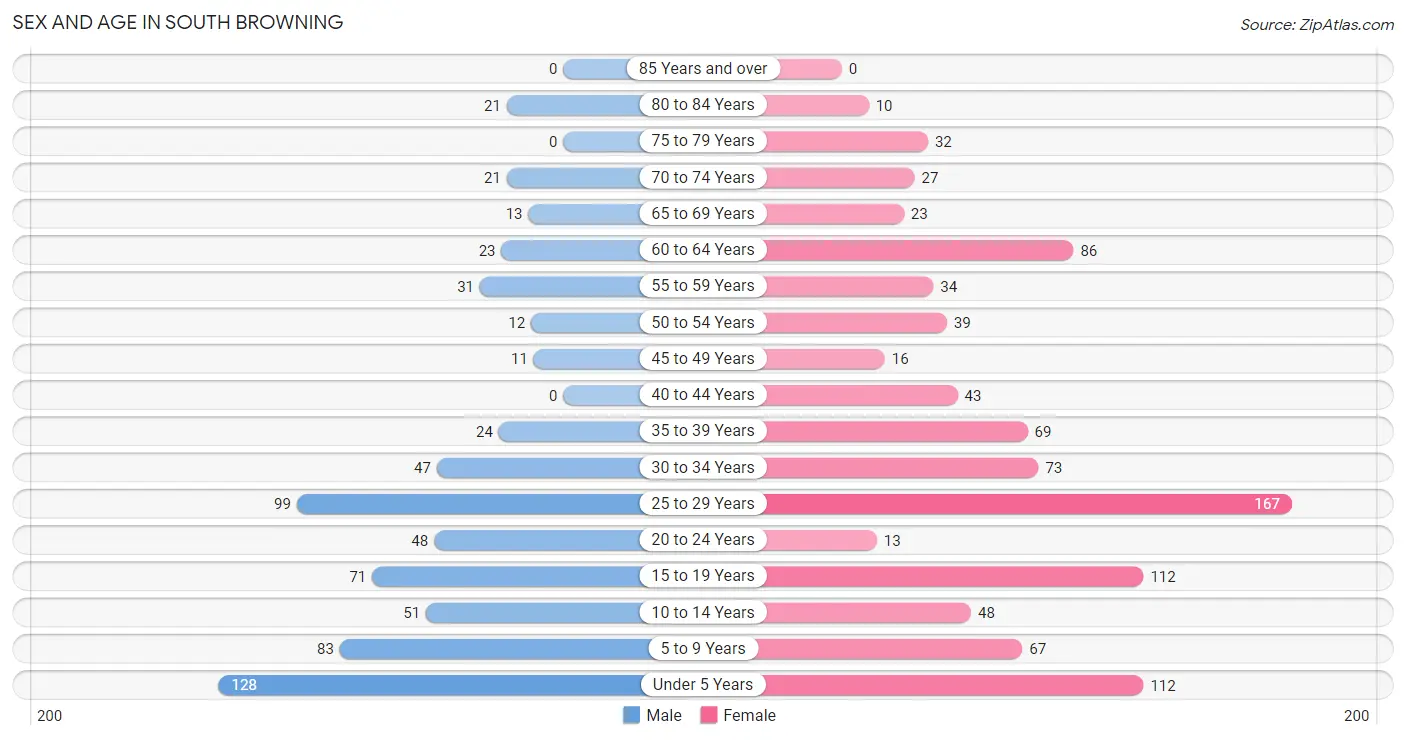
| Age Bracket | Male | Female |
| Under 5 Years | 128 (18.7%) | 112 (11.5%) |
| 5 to 9 Years | 83 (12.1%) | 67 (6.9%) |
| 10 to 14 Years | 51 (7.5%) | 48 (4.9%) |
| 15 to 19 Years | 71 (10.4%) | 112 (11.5%) |
| 20 to 24 Years | 48 (7.0%) | 13 (1.3%) |
| 25 to 29 Years | 99 (14.5%) | 167 (17.2%) |
| 30 to 34 Years | 47 (6.9%) | 73 (7.5%) |
| 35 to 39 Years | 24 (3.5%) | 69 (7.1%) |
| 40 to 44 Years | 0 (0.0%) | 43 (4.4%) |
| 45 to 49 Years | 11 (1.6%) | 16 (1.7%) |
| 50 to 54 Years | 12 (1.8%) | 39 (4.0%) |
| 55 to 59 Years | 31 (4.5%) | 34 (3.5%) |
| 60 to 64 Years | 23 (3.4%) | 86 (8.9%) |
| 65 to 69 Years | 13 (1.9%) | 23 (2.4%) |
| 70 to 74 Years | 21 (3.1%) | 27 (2.8%) |
| 75 to 79 Years | 0 (0.0%) | 32 (3.3%) |
| 80 to 84 Years | 21 (3.1%) | 10 (1.0%) |
| 85 Years and over | 0 (0.0%) | 0 (0.0%) |
| Total | 683 (100.0%) | 971 (100.0%) |
Families and Households in South Browning
Median Family Size in South Browning
The median family size in South Browning is 3.30 persons per family, with married-couple families (144 | 34.7%) accounting for the largest median family size of 3.61 persons per family. On the other hand, single male/father families (52 | 12.5%) represent the smallest median family size with 3.06 persons per family.
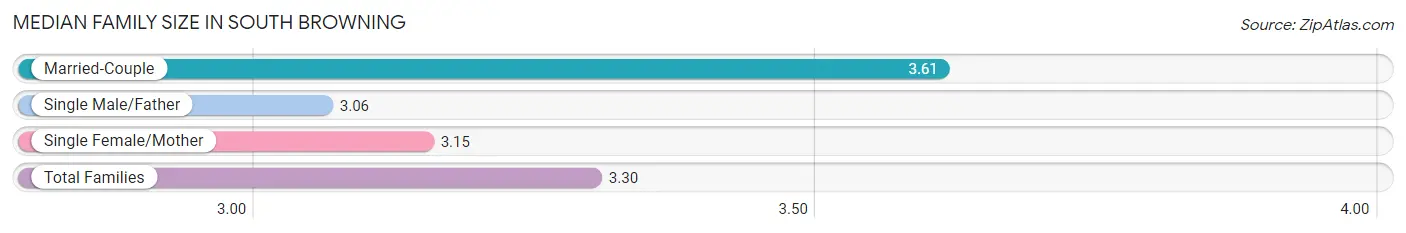
| Family Type | # Families | Family Size |
| Married-Couple | 144 (34.7%) | 3.61 |
| Single Male/Father | 52 (12.5%) | 3.06 |
| Single Female/Mother | 219 (52.8%) | 3.15 |
| Total Families | 415 (100.0%) | 3.30 |
Median Household Size in South Browning
The median household size in South Browning is 2.95 persons per household, with single male/father households (52 | 9.3%) accounting for the largest median household size of 4.21 persons per household. non-family households (146 | 26.0%) represent the smallest median household size with 1.16 persons per household.
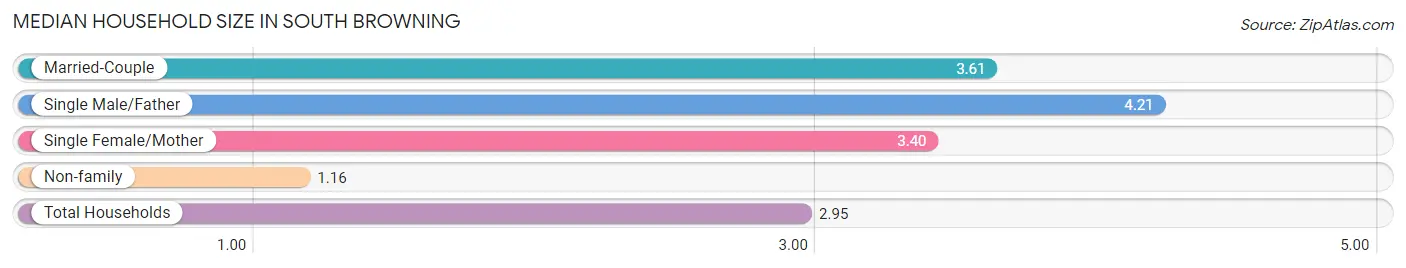
| Household Type | # Households | Household Size |
| Married-Couple | 144 (25.7%) | 3.61 |
| Single Male/Father | 52 (9.3%) | 4.21 |
| Single Female/Mother | 219 (39.0%) | 3.40 |
| Non-family | 146 (26.0%) | 1.16 |
| Total Households | 561 (100.0%) | 2.95 |
Household Size by Marriage Status in South Browning
Out of a total of 561 households in South Browning, 415 (74.0%) are family households, while 146 (26.0%) are nonfamily households. The most numerous type of family households are 2-person households, comprising 183, and the most common type of nonfamily households are 1-person households, comprising 116.
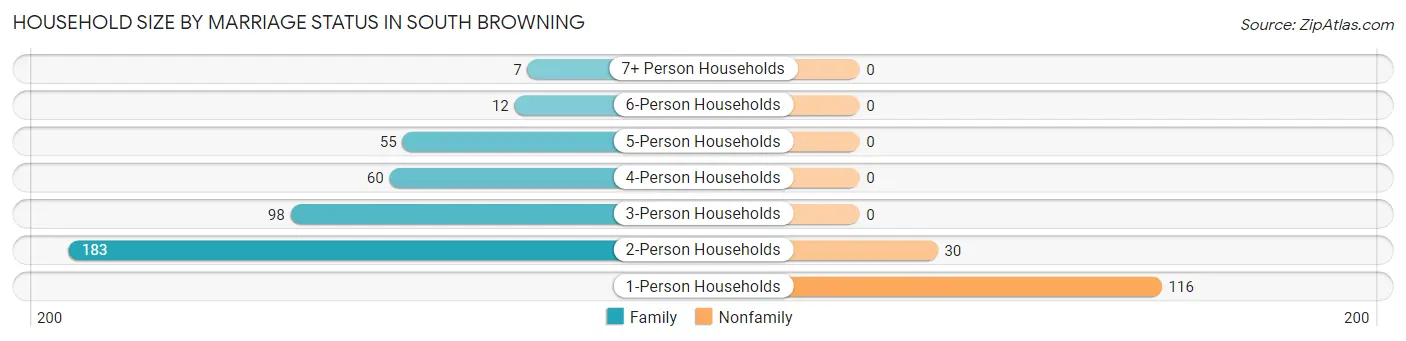
| Household Size | Family Households | Nonfamily Households |
| 1-Person Households | - | 116 (20.7%) |
| 2-Person Households | 183 (32.6%) | 30 (5.3%) |
| 3-Person Households | 98 (17.5%) | 0 (0.0%) |
| 4-Person Households | 60 (10.7%) | 0 (0.0%) |
| 5-Person Households | 55 (9.8%) | 0 (0.0%) |
| 6-Person Households | 12 (2.1%) | 0 (0.0%) |
| 7+ Person Households | 7 (1.3%) | 0 (0.0%) |
| Total | 415 (74.0%) | 146 (26.0%) |
Female Fertility in South Browning
Fertility by Age in South Browning
| Age Bracket | Women with Births | Births / 1,000 Women |
| 15 to 19 years | 0 (0.0%) | 0.0 |
| 20 to 34 years | 0 (0.0%) | 0.0 |
| 35 to 50 years | 0 (0.0%) | 0.0 |
| Total | 0 (0.0%) | 0.0 |
Fertility by Age by Marriage Status in South Browning
| Age Bracket | Married | Unmarried |
| 15 to 19 years | 0 (0.0%) | 0 (0.0%) |
| 20 to 34 years | 0 (0.0%) | 0 (0.0%) |
| 35 to 50 years | 0 (0.0%) | 0 (0.0%) |
| Total | 0 (0.0%) | 0 (0.0%) |
Fertility by Education in South Browning
| Educational Attainment | Women with Births | Births / 1,000 Women |
| Less than High School | 0 (0.0%) | 0.0 |
| High School Diploma | 0 (0.0%) | 0.0 |
| College or Associate's Degree | 0 (0.0%) | 0.0 |
| Bachelor's Degree | 0 (0.0%) | 0.0 |
| Graduate Degree | 0 (0.0%) | 0.0 |
| Total | 0 (0.0%) | 0.0 |
Fertility by Education by Marriage Status in South Browning
| Educational Attainment | Married | Unmarried |
| Less than High School | 0 (0.0%) | 0 (0.0%) |
| High School Diploma | 0 (0.0%) | 0 (0.0%) |
| College or Associate's Degree | 0 (0.0%) | 0 (0.0%) |
| Bachelor's Degree | 0 (0.0%) | 0 (0.0%) |
| Graduate Degree | 0 (0.0%) | 0 (0.0%) |
| Total | 0 (0.0%) | 0 (0.0%) |
Employment Characteristics in South Browning
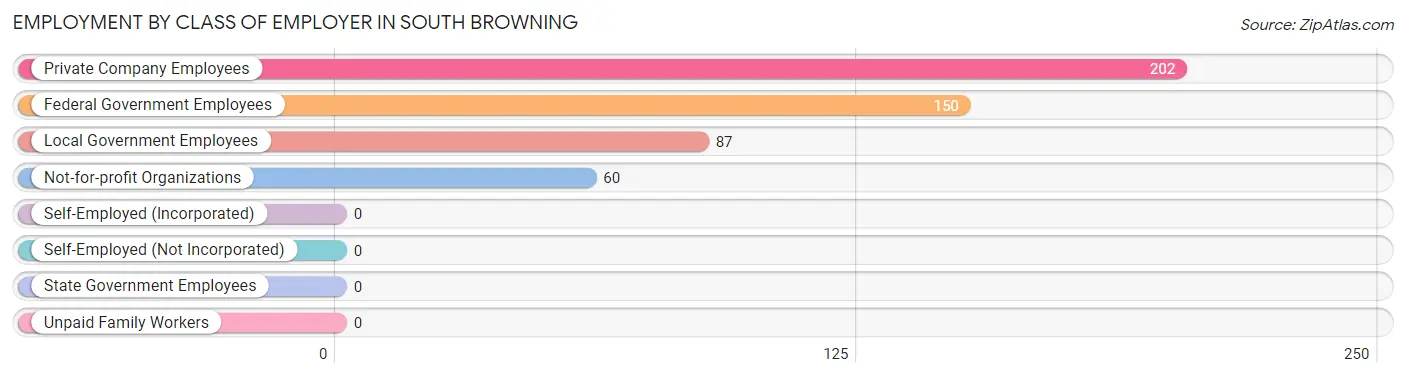
Employment by Class of Employer in South Browning
Among the 499 employed individuals in South Browning, private company employees (202 | 40.5%), federal government employees (150 | 30.1%), and local government employees (87 | 17.4%) make up the most common classes of employment.
| Employer Class | # Employees | % Employees |
| Private Company Employees | 202 | 40.5% |
| Self-Employed (Incorporated) | 0 | 0.0% |
| Self-Employed (Not Incorporated) | 0 | 0.0% |
| Not-for-profit Organizations | 60 | 12.0% |
| Local Government Employees | 87 | 17.4% |
| State Government Employees | 0 | 0.0% |
| Federal Government Employees | 150 | 30.1% |
| Unpaid Family Workers | 0 | 0.0% |
| Total | 499 | 100.0% |
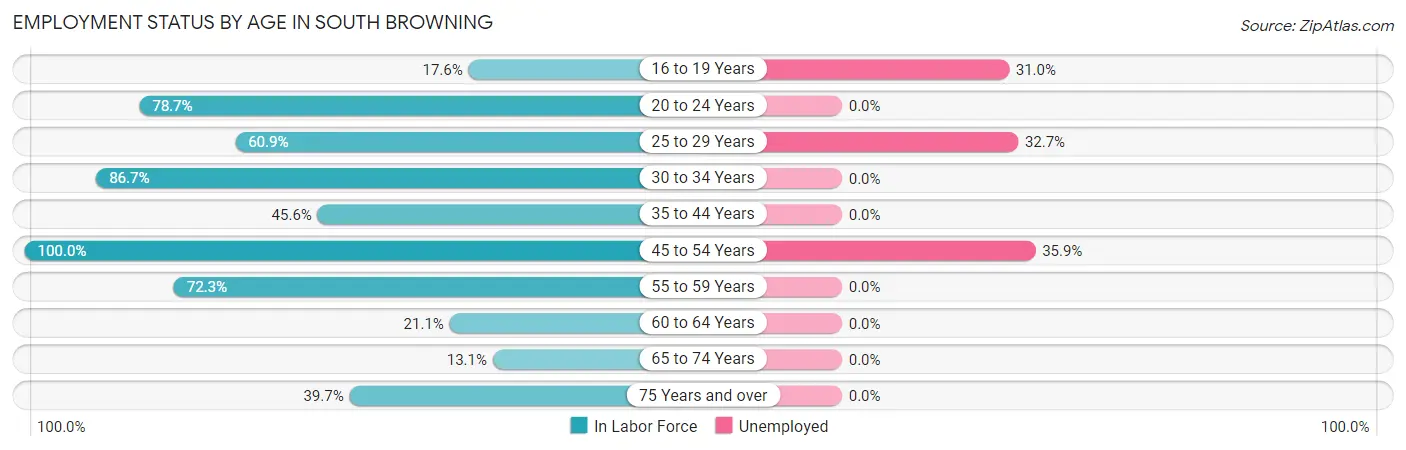
Employment Status by Age in South Browning
According to the labor force statistics for South Browning, out of the total population over 16 years of age (1,147), 51.4% or 590 individuals are in the labor force, with 15.3% or 90 of them unemployed. The age group with the highest labor force participation rate is 45 to 54 years, with 100.0% or 78 individuals in the labor force. Within the labor force, the 45 to 54 years age range has the highest percentage of unemployed individuals, with 35.9% or 28 of them being unemployed.
| Age Bracket | In Labor Force | Unemployed |
| 16 to 19 Years | 29 (17.6%) | 9 (31.0%) |
| 20 to 24 Years | 48 (78.7%) | 0 (0.0%) |
| 25 to 29 Years | 162 (60.9%) | 53 (32.7%) |
| 30 to 34 Years | 104 (86.7%) | 0 (0.0%) |
| 35 to 44 Years | 62 (45.6%) | 0 (0.0%) |
| 45 to 54 Years | 78 (100.0%) | 28 (35.9%) |
| 55 to 59 Years | 47 (72.3%) | 0 (0.0%) |
| 60 to 64 Years | 23 (21.1%) | 0 (0.0%) |
| 65 to 74 Years | 11 (13.1%) | 0 (0.0%) |
| 75 Years and over | 25 (39.7%) | 0 (0.0%) |
| Total | 590 (51.4%) | 90 (15.3%) |
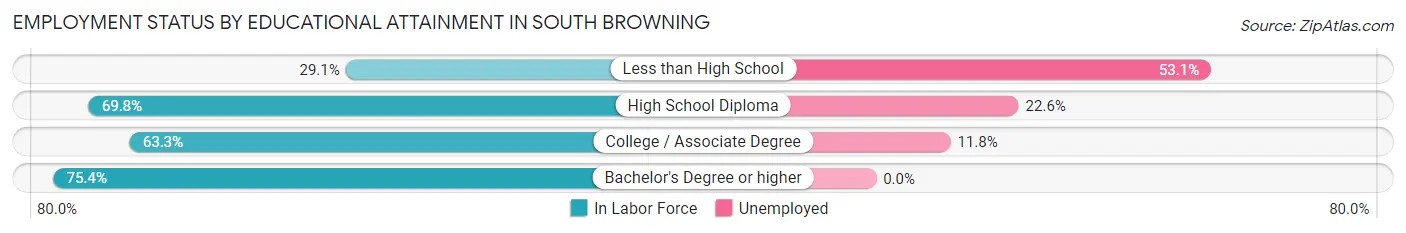
Employment Status by Educational Attainment in South Browning
According to labor force statistics for South Browning, 61.5% of individuals (476) out of the total population between 25 and 64 years of age (774) are in the labor force, with 17.0% or 81 of them being unemployed. The group with the highest labor force participation rate are those with the educational attainment of bachelor's degree or higher, with 75.4% or 52 individuals in the labor force. Within the labor force, individuals with less than high school education have the highest percentage of unemployment, with 53.1% or 17 of them being unemployed.
| Educational Attainment | In Labor Force | Unemployed |
| Less than High School | 32 (29.1%) | 58 (53.1%) |
| High School Diploma | 164 (69.8%) | 53 (22.6%) |
| College / Associate Degree | 228 (63.3%) | 42 (11.8%) |
| Bachelor's Degree or higher | 52 (75.4%) | 0 (0.0%) |
| Total | 476 (61.5%) | 132 (17.0%) |
Employment Occupations by Sex in South Browning
Management, Business, Science and Arts Occupations
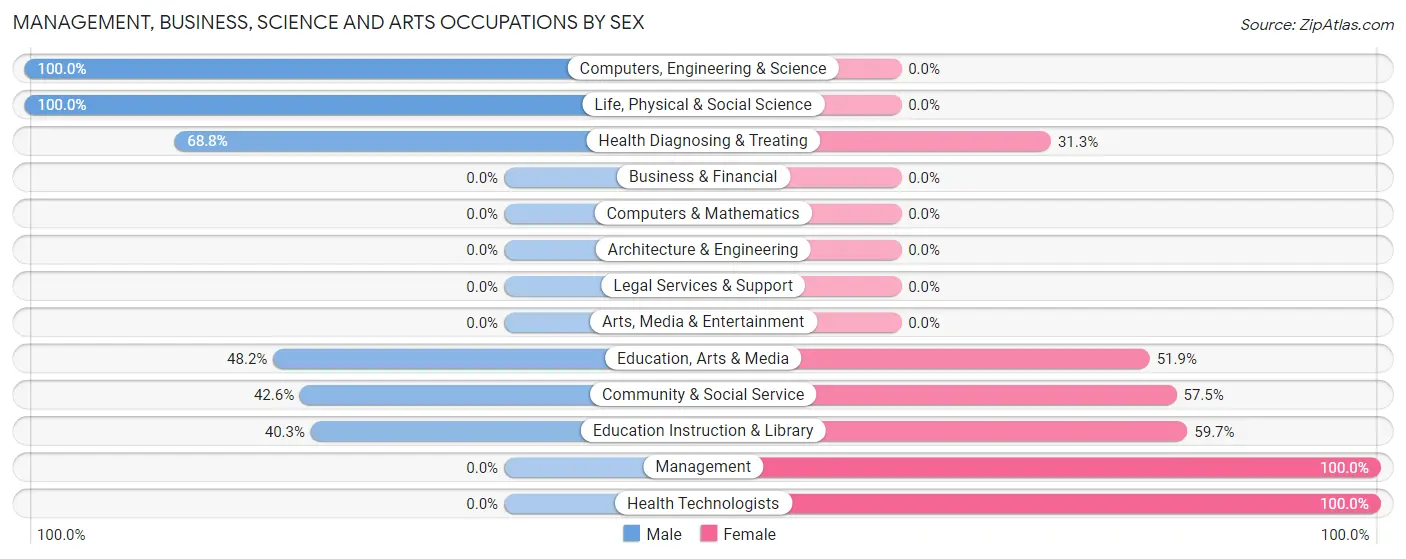
The most common Management, Business, Science and Arts occupations in South Browning are Community & Social Service (94 | 18.8%), Education Instruction & Library (67 | 13.4%), Health Diagnosing & Treating (32 | 6.4%), Education, Arts & Media (27 | 5.4%), and Management (11 | 2.2%).
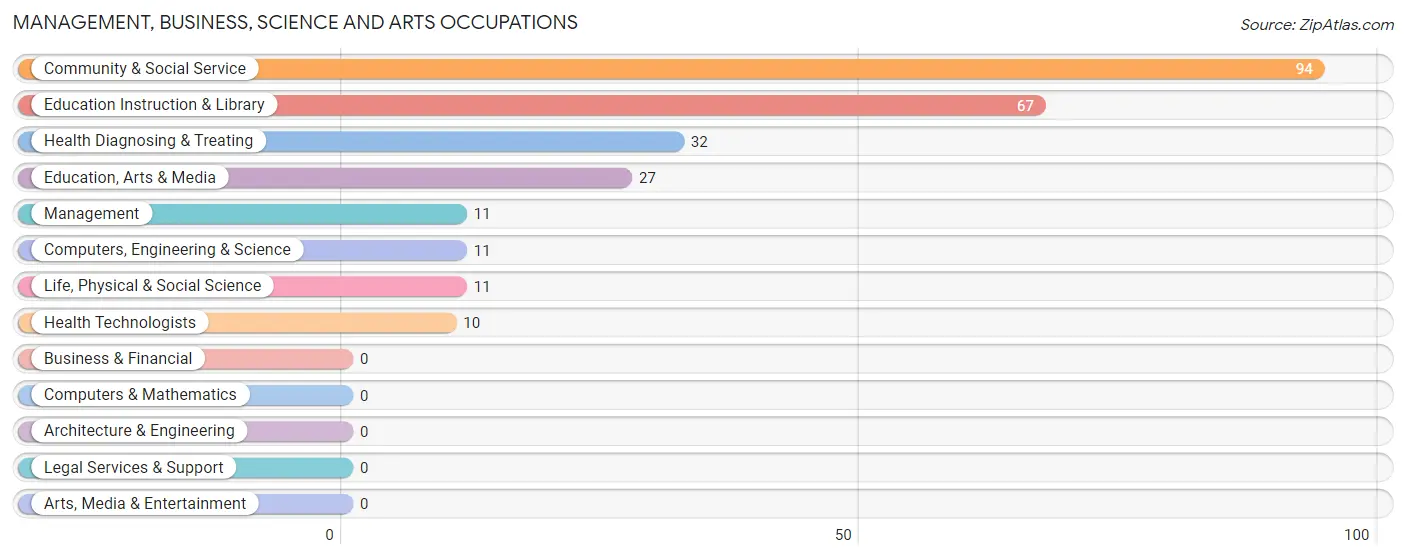
Management, Business, Science and Arts Occupations by Sex
Within the Management, Business, Science and Arts occupations in South Browning, the most male-oriented occupations are Computers, Engineering & Science (100.0%), Life, Physical & Social Science (100.0%), and Health Diagnosing & Treating (68.8%), while the most female-oriented occupations are Management (100.0%), Health Technologists (100.0%), and Education Instruction & Library (59.7%).
| Occupation | Male | Female |
| Management | 0 (0.0%) | 11 (100.0%) |
| Business & Financial | 0 (0.0%) | 0 (0.0%) |
| Computers, Engineering & Science | 11 (100.0%) | 0 (0.0%) |
| Computers & Mathematics | 0 (0.0%) | 0 (0.0%) |
| Architecture & Engineering | 0 (0.0%) | 0 (0.0%) |
| Life, Physical & Social Science | 11 (100.0%) | 0 (0.0%) |
| Community & Social Service | 40 (42.5%) | 54 (57.5%) |
| Education, Arts & Media | 13 (48.1%) | 14 (51.8%) |
| Legal Services & Support | 0 (0.0%) | 0 (0.0%) |
| Education Instruction & Library | 27 (40.3%) | 40 (59.7%) |
| Arts, Media & Entertainment | 0 (0.0%) | 0 (0.0%) |
| Health Diagnosing & Treating | 22 (68.8%) | 10 (31.2%) |
| Health Technologists | 0 (0.0%) | 10 (100.0%) |
| Total (Category) | 73 (49.3%) | 75 (50.7%) |
| Total (Overall) | 242 (48.5%) | 257 (51.5%) |
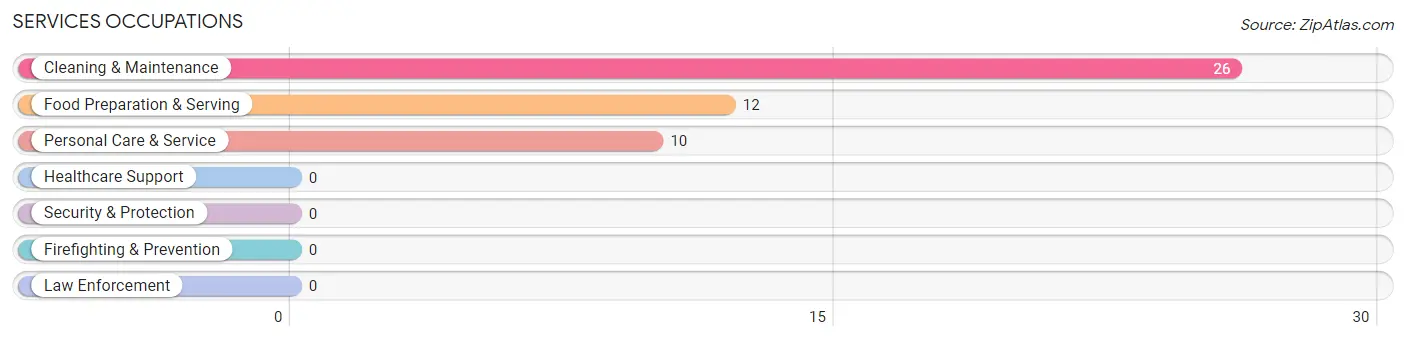
Services Occupations
The most common Services occupations in South Browning are Cleaning & Maintenance (26 | 5.2%), Food Preparation & Serving (12 | 2.4%), and Personal Care & Service (10 | 2.0%).
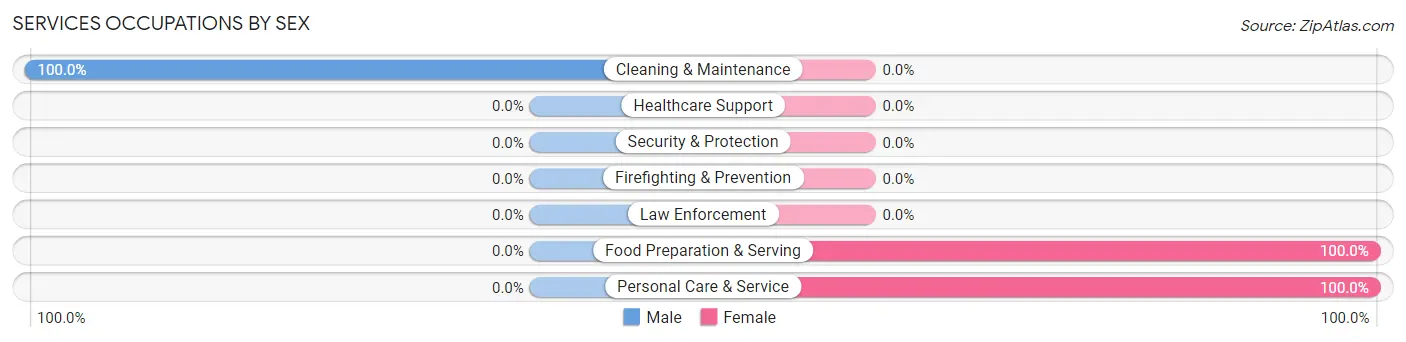
Services Occupations by Sex
| Occupation | Male | Female |
| Healthcare Support | 0 (0.0%) | 0 (0.0%) |
| Security & Protection | 0 (0.0%) | 0 (0.0%) |
| Firefighting & Prevention | 0 (0.0%) | 0 (0.0%) |
| Law Enforcement | 0 (0.0%) | 0 (0.0%) |
| Food Preparation & Serving | 0 (0.0%) | 12 (100.0%) |
| Cleaning & Maintenance | 26 (100.0%) | 0 (0.0%) |
| Personal Care & Service | 0 (0.0%) | 10 (100.0%) |
| Total (Category) | 26 (54.2%) | 22 (45.8%) |
| Total (Overall) | 242 (48.5%) | 257 (51.5%) |
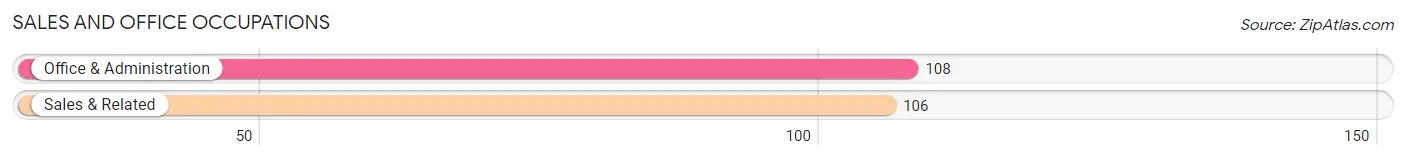
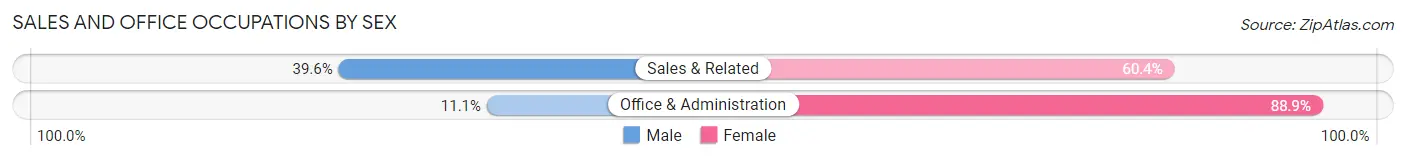
Sales and Office Occupations
The most common Sales and Office occupations in South Browning are Office & Administration (108 | 21.6%), and Sales & Related (106 | 21.2%).
Sales and Office Occupations by Sex
| Occupation | Male | Female |
| Sales & Related | 42 (39.6%) | 64 (60.4%) |
| Office & Administration | 12 (11.1%) | 96 (88.9%) |
| Total (Category) | 54 (25.2%) | 160 (74.8%) |
| Total (Overall) | 242 (48.5%) | 257 (51.5%) |
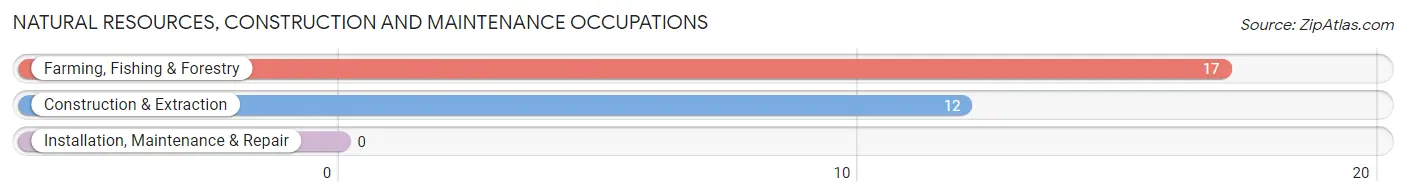
Natural Resources, Construction and Maintenance Occupations
The most common Natural Resources, Construction and Maintenance occupations in South Browning are Farming, Fishing & Forestry (17 | 3.4%), and Construction & Extraction (12 | 2.4%).
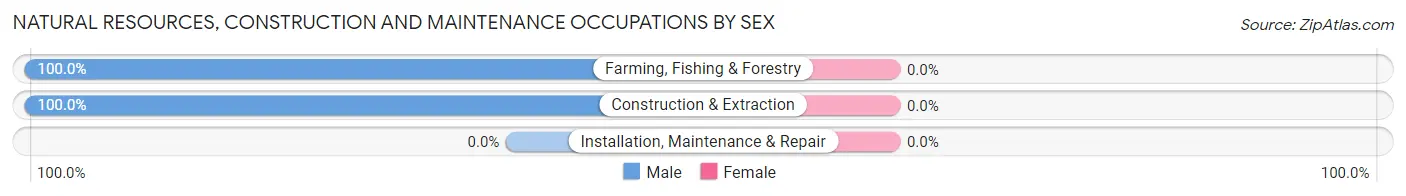
Natural Resources, Construction and Maintenance Occupations by Sex
| Occupation | Male | Female |
| Farming, Fishing & Forestry | 17 (100.0%) | 0 (0.0%) |
| Construction & Extraction | 12 (100.0%) | 0 (0.0%) |
| Installation, Maintenance & Repair | 0 (0.0%) | 0 (0.0%) |
| Total (Category) | 29 (100.0%) | 0 (0.0%) |
| Total (Overall) | 242 (48.5%) | 257 (51.5%) |
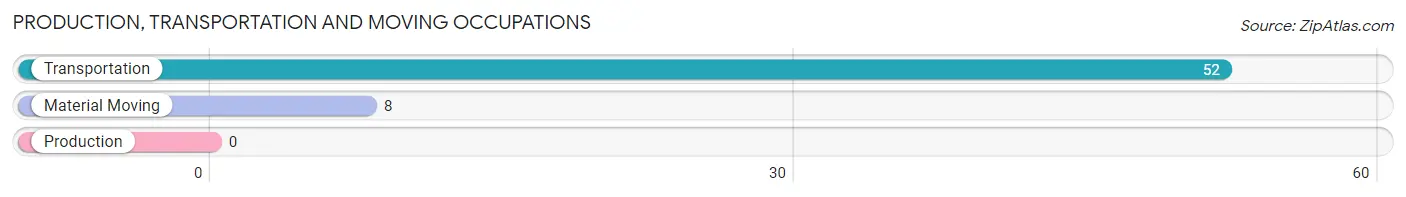
Production, Transportation and Moving Occupations
The most common Production, Transportation and Moving occupations in South Browning are Transportation (52 | 10.4%), and Material Moving (8 | 1.6%).
Production, Transportation and Moving Occupations by Sex
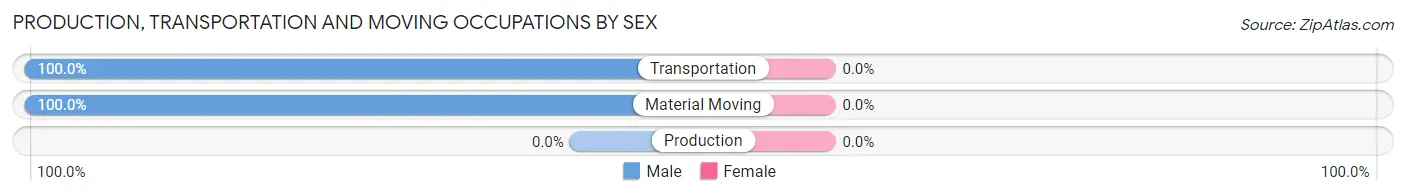
| Occupation | Male | Female |
| Production | 0 (0.0%) | 0 (0.0%) |
| Transportation | 52 (100.0%) | 0 (0.0%) |
| Material Moving | 8 (100.0%) | 0 (0.0%) |
| Total (Category) | 60 (100.0%) | 0 (0.0%) |
| Total (Overall) | 242 (48.5%) | 257 (51.5%) |
Employment Industries by Sex in South Browning
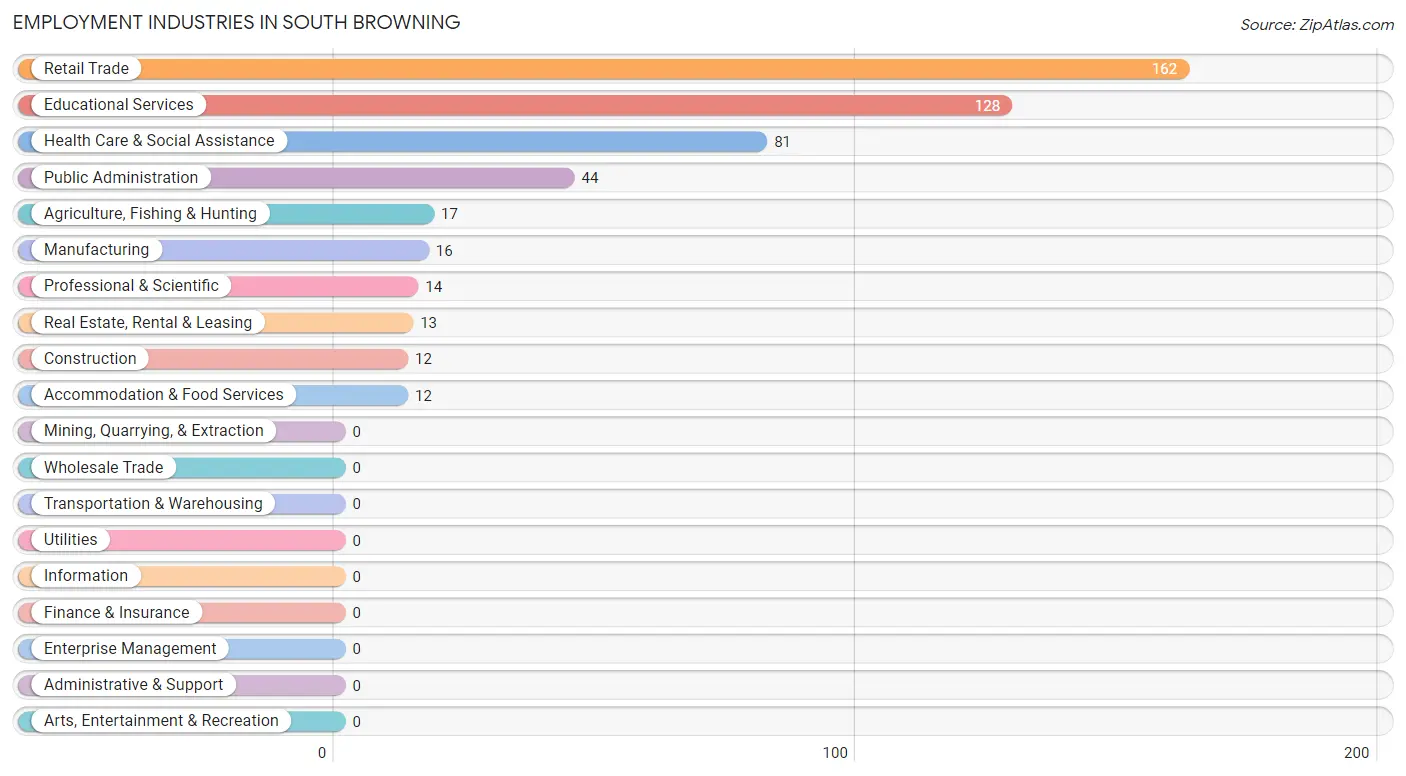
Employment Industries in South Browning
The major employment industries in South Browning include Retail Trade (162 | 32.5%), Educational Services (128 | 25.7%), Health Care & Social Assistance (81 | 16.2%), Public Administration (44 | 8.8%), and Agriculture, Fishing & Hunting (17 | 3.4%).
Employment Industries by Sex in South Browning
The South Browning industries that see more men than women are Agriculture, Fishing & Hunting (100.0%), Construction (100.0%), and Manufacturing (100.0%), whereas the industries that tend to have a higher number of women are Real Estate, Rental & Leasing (100.0%), Accommodation & Food Services (100.0%), and Educational Services (78.9%).
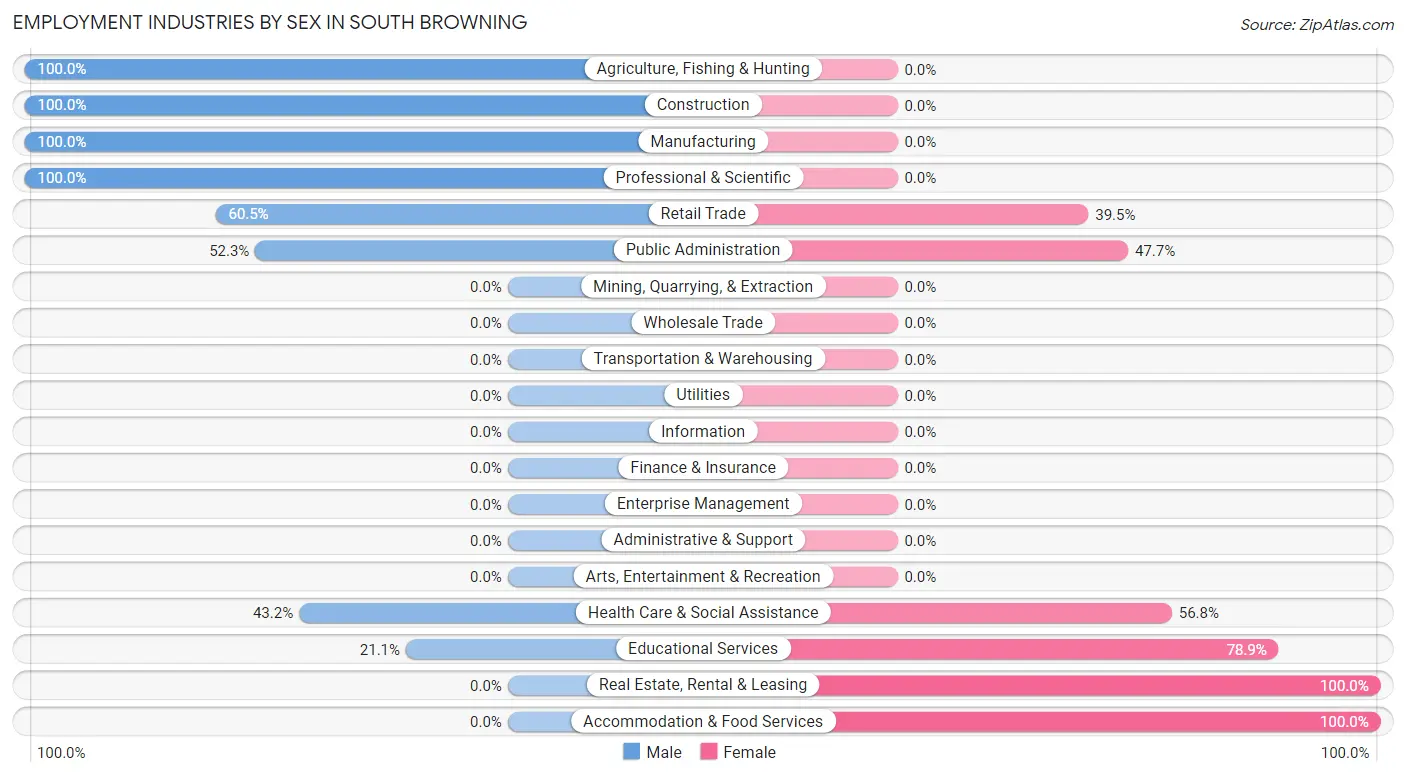
| Industry | Male | Female |
| Agriculture, Fishing & Hunting | 17 (100.0%) | 0 (0.0%) |
| Mining, Quarrying, & Extraction | 0 (0.0%) | 0 (0.0%) |
| Construction | 12 (100.0%) | 0 (0.0%) |
| Manufacturing | 16 (100.0%) | 0 (0.0%) |
| Wholesale Trade | 0 (0.0%) | 0 (0.0%) |
| Retail Trade | 98 (60.5%) | 64 (39.5%) |
| Transportation & Warehousing | 0 (0.0%) | 0 (0.0%) |
| Utilities | 0 (0.0%) | 0 (0.0%) |
| Information | 0 (0.0%) | 0 (0.0%) |
| Finance & Insurance | 0 (0.0%) | 0 (0.0%) |
| Real Estate, Rental & Leasing | 0 (0.0%) | 13 (100.0%) |
| Professional & Scientific | 14 (100.0%) | 0 (0.0%) |
| Enterprise Management | 0 (0.0%) | 0 (0.0%) |
| Administrative & Support | 0 (0.0%) | 0 (0.0%) |
| Educational Services | 27 (21.1%) | 101 (78.9%) |
| Health Care & Social Assistance | 35 (43.2%) | 46 (56.8%) |
| Arts, Entertainment & Recreation | 0 (0.0%) | 0 (0.0%) |
| Accommodation & Food Services | 0 (0.0%) | 12 (100.0%) |
| Public Administration | 23 (52.3%) | 21 (47.7%) |
| Total | 242 (48.5%) | 257 (51.5%) |
Education in South Browning
School Enrollment in South Browning
The most common levels of schooling among the 397 students in South Browning are elementary school (124 | 31.2%), middle school (64 | 16.1%), and high school (62 | 15.6%).
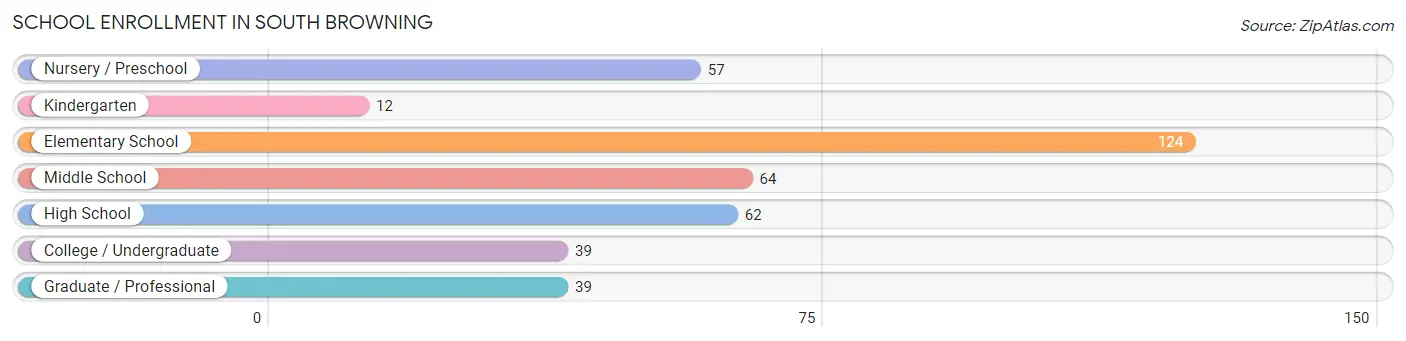
| School Level | # Students | % Students |
| Nursery / Preschool | 57 | 14.4% |
| Kindergarten | 12 | 3.0% |
| Elementary School | 124 | 31.2% |
| Middle School | 64 | 16.1% |
| High School | 62 | 15.6% |
| College / Undergraduate | 39 | 9.8% |
| Graduate / Professional | 39 | 9.8% |
| Total | 397 | 100.0% |
School Enrollment by Age by Funding Source in South Browning
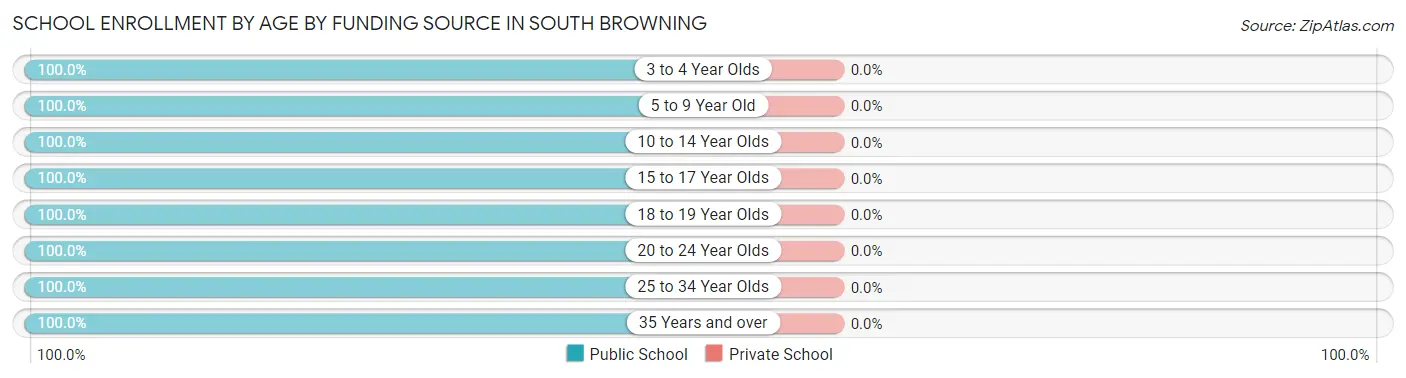
| Age Bracket | Public School | Private School |
| 3 to 4 Year Olds | 57 (100.0%) | 0 (0.0%) |
| 5 to 9 Year Old | 124 (100.0%) | 0 (0.0%) |
| 10 to 14 Year Olds | 82 (100.0%) | 0 (0.0%) |
| 15 to 17 Year Olds | 56 (100.0%) | 0 (0.0%) |
| 18 to 19 Year Olds | 8 (100.0%) | 0 (0.0%) |
| 20 to 24 Year Olds | 22 (100.0%) | 0 (0.0%) |
| 25 to 34 Year Olds | 37 (100.0%) | 0 (0.0%) |
| 35 Years and over | 11 (100.0%) | 0 (0.0%) |
| Total | 397 (100.0%) | 0 (0.0%) |
Educational Attainment by Field of Study in South Browning
Education (29 | 30.5%), science & technology (22 | 23.2%), liberal arts & history (17 | 17.9%), business (14 | 14.7%), and computers & mathematics (13 | 13.7%) are the most common fields of study among 95 individuals in South Browning who have obtained a bachelor's degree or higher.
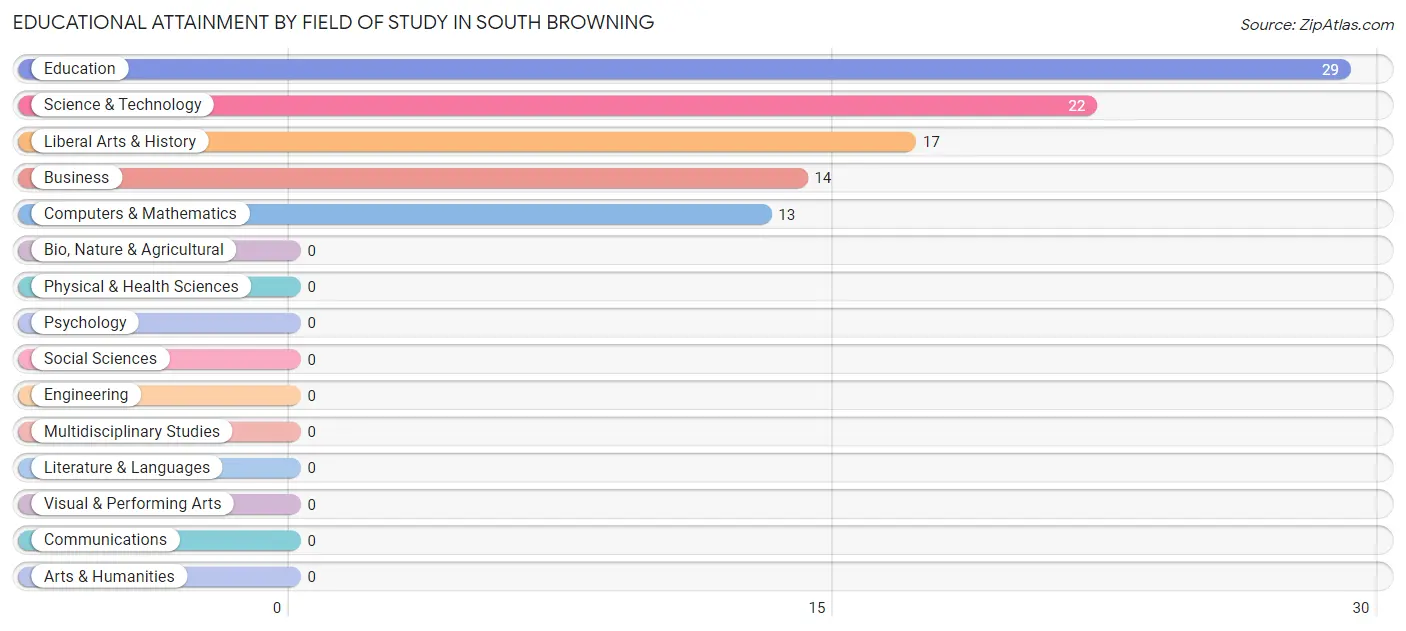
| Field of Study | # Graduates | % Graduates |
| Computers & Mathematics | 13 | 13.7% |
| Bio, Nature & Agricultural | 0 | 0.0% |
| Physical & Health Sciences | 0 | 0.0% |
| Psychology | 0 | 0.0% |
| Social Sciences | 0 | 0.0% |
| Engineering | 0 | 0.0% |
| Multidisciplinary Studies | 0 | 0.0% |
| Science & Technology | 22 | 23.2% |
| Business | 14 | 14.7% |
| Education | 29 | 30.5% |
| Literature & Languages | 0 | 0.0% |
| Liberal Arts & History | 17 | 17.9% |
| Visual & Performing Arts | 0 | 0.0% |
| Communications | 0 | 0.0% |
| Arts & Humanities | 0 | 0.0% |
| Total | 95 | 100.0% |
Transportation & Commute in South Browning
Vehicle Availability by Sex in South Browning
The most prevalent vehicle ownership categories in South Browning are males with 1 vehicle (149, accounting for 61.6%) and females with 1 vehicle (101, making up 58.0%).
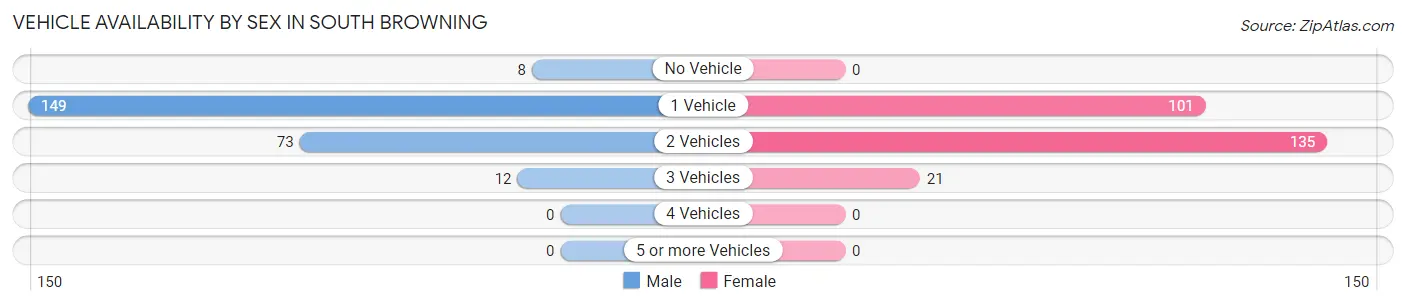
| Vehicles Available | Male | Female |
| No Vehicle | 8 (3.3%) | 0 (0.0%) |
| 1 Vehicle | 149 (61.6%) | 101 (39.3%) |
| 2 Vehicles | 73 (30.2%) | 135 (52.5%) |
| 3 Vehicles | 12 (5.0%) | 21 (8.2%) |
| 4 Vehicles | 0 (0.0%) | 0 (0.0%) |
| 5 or more Vehicles | 0 (0.0%) | 0 (0.0%) |
| Total | 242 (100.0%) | 257 (100.0%) |
Commute Time in South Browning
The most frequently occuring commute durations in South Browning are 10 to 14 minutes (212 commuters, 42.5%), 15 to 19 minutes (162 commuters, 32.5%), and less than 5 minutes (44 commuters, 8.8%).
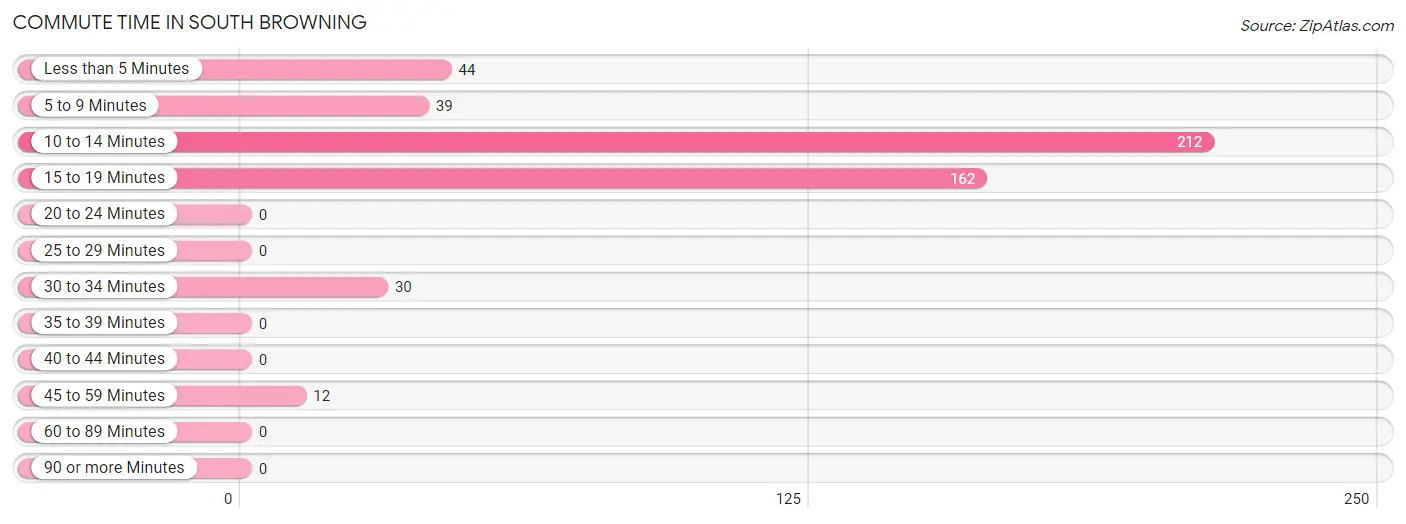
| Commute Time | # Commuters | % Commuters |
| Less than 5 Minutes | 44 | 8.8% |
| 5 to 9 Minutes | 39 | 7.8% |
| 10 to 14 Minutes | 212 | 42.5% |
| 15 to 19 Minutes | 162 | 32.5% |
| 20 to 24 Minutes | 0 | 0.0% |
| 25 to 29 Minutes | 0 | 0.0% |
| 30 to 34 Minutes | 30 | 6.0% |
| 35 to 39 Minutes | 0 | 0.0% |
| 40 to 44 Minutes | 0 | 0.0% |
| 45 to 59 Minutes | 12 | 2.4% |
| 60 to 89 Minutes | 0 | 0.0% |
| 90 or more Minutes | 0 | 0.0% |
Commute Time by Sex in South Browning
The most common commute times in South Browning are 10 to 14 minutes (165 commuters, 68.2%) for males and 15 to 19 minutes (126 commuters, 49.0%) for females.
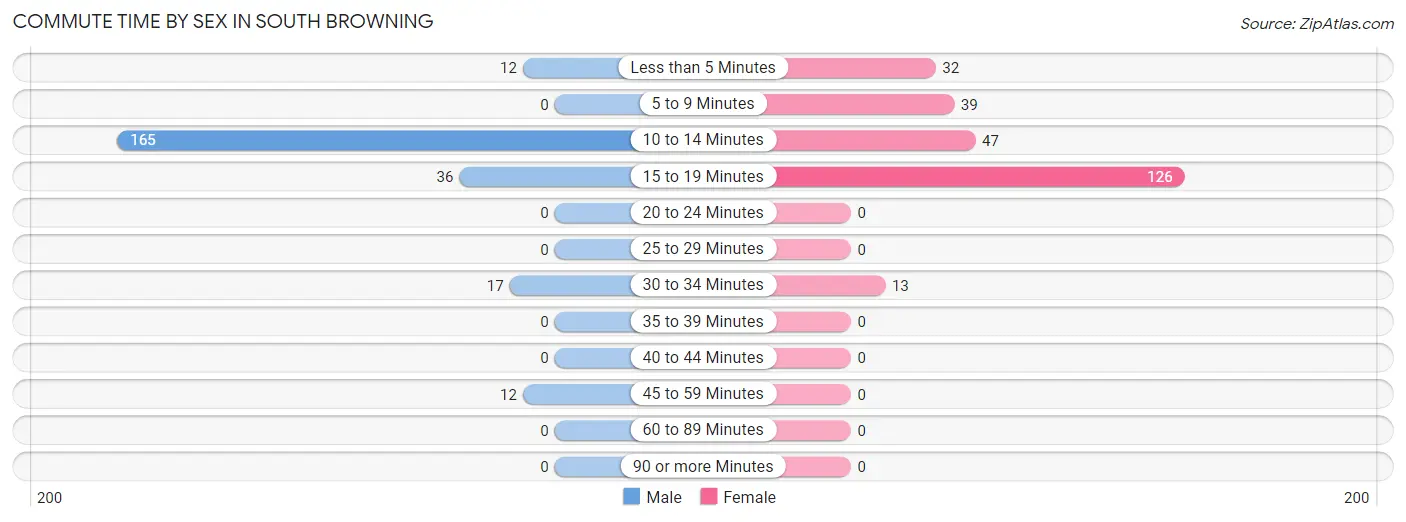
| Commute Time | Male | Female |
| Less than 5 Minutes | 12 (5.0%) | 32 (12.4%) |
| 5 to 9 Minutes | 0 (0.0%) | 39 (15.2%) |
| 10 to 14 Minutes | 165 (68.2%) | 47 (18.3%) |
| 15 to 19 Minutes | 36 (14.9%) | 126 (49.0%) |
| 20 to 24 Minutes | 0 (0.0%) | 0 (0.0%) |
| 25 to 29 Minutes | 0 (0.0%) | 0 (0.0%) |
| 30 to 34 Minutes | 17 (7.0%) | 13 (5.1%) |
| 35 to 39 Minutes | 0 (0.0%) | 0 (0.0%) |
| 40 to 44 Minutes | 0 (0.0%) | 0 (0.0%) |
| 45 to 59 Minutes | 12 (5.0%) | 0 (0.0%) |
| 60 to 89 Minutes | 0 (0.0%) | 0 (0.0%) |
| 90 or more Minutes | 0 (0.0%) | 0 (0.0%) |
Time of Departure to Work by Sex in South Browning
The most frequent times of departure to work in South Browning are 7:30 AM to 7:59 AM (94, 38.8%) for males and 8:00 AM to 8:29 AM (103, 40.1%) for females.
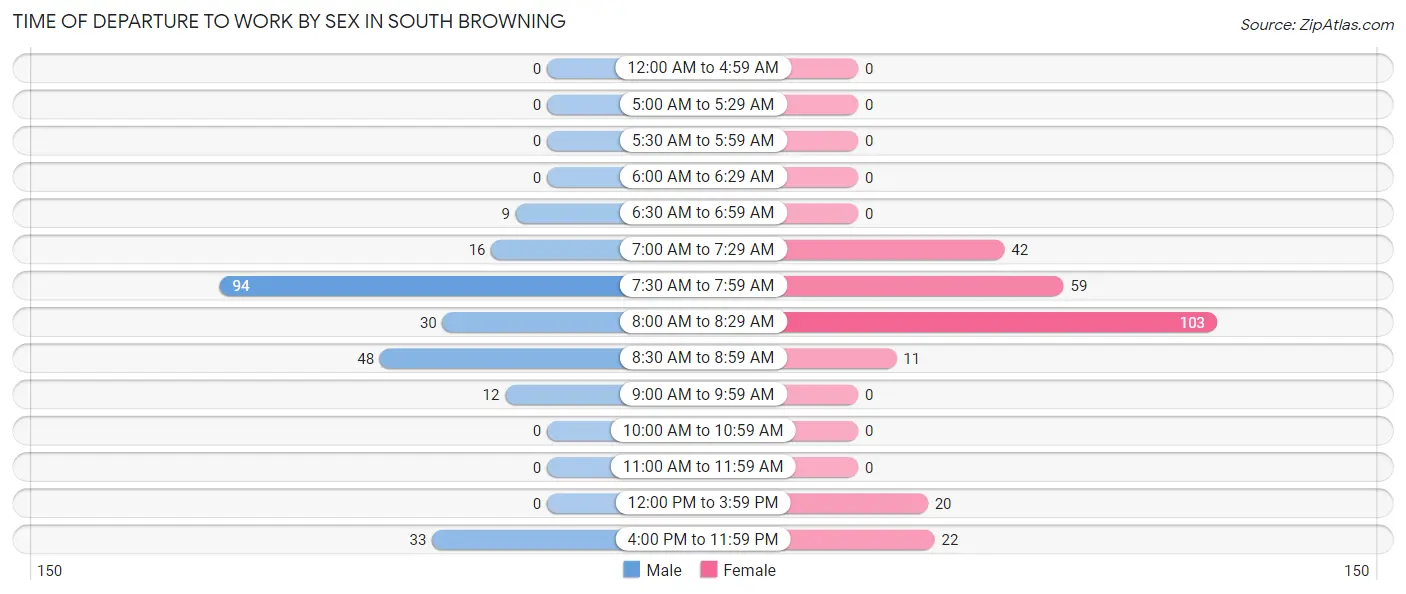
| Time of Departure | Male | Female |
| 12:00 AM to 4:59 AM | 0 (0.0%) | 0 (0.0%) |
| 5:00 AM to 5:29 AM | 0 (0.0%) | 0 (0.0%) |
| 5:30 AM to 5:59 AM | 0 (0.0%) | 0 (0.0%) |
| 6:00 AM to 6:29 AM | 0 (0.0%) | 0 (0.0%) |
| 6:30 AM to 6:59 AM | 9 (3.7%) | 0 (0.0%) |
| 7:00 AM to 7:29 AM | 16 (6.6%) | 42 (16.3%) |
| 7:30 AM to 7:59 AM | 94 (38.8%) | 59 (23.0%) |
| 8:00 AM to 8:29 AM | 30 (12.4%) | 103 (40.1%) |
| 8:30 AM to 8:59 AM | 48 (19.8%) | 11 (4.3%) |
| 9:00 AM to 9:59 AM | 12 (5.0%) | 0 (0.0%) |
| 10:00 AM to 10:59 AM | 0 (0.0%) | 0 (0.0%) |
| 11:00 AM to 11:59 AM | 0 (0.0%) | 0 (0.0%) |
| 12:00 PM to 3:59 PM | 0 (0.0%) | 20 (7.8%) |
| 4:00 PM to 11:59 PM | 33 (13.6%) | 22 (8.6%) |
| Total | 242 (100.0%) | 257 (100.0%) |
Housing Occupancy in South Browning
Occupancy by Ownership in South Browning
Of the total 561 dwellings in South Browning, owner-occupied units account for 182 (32.4%), while renter-occupied units make up 379 (67.6%).
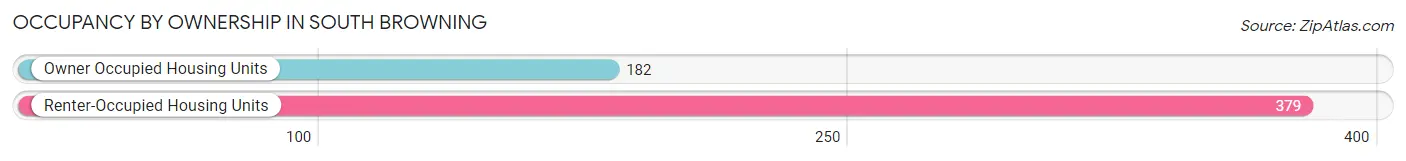
| Occupancy | # Housing Units | % Housing Units |
| Owner Occupied Housing Units | 182 | 32.4% |
| Renter-Occupied Housing Units | 379 | 67.6% |
| Total Occupied Housing Units | 561 | 100.0% |
Occupancy by Household Size in South Browning
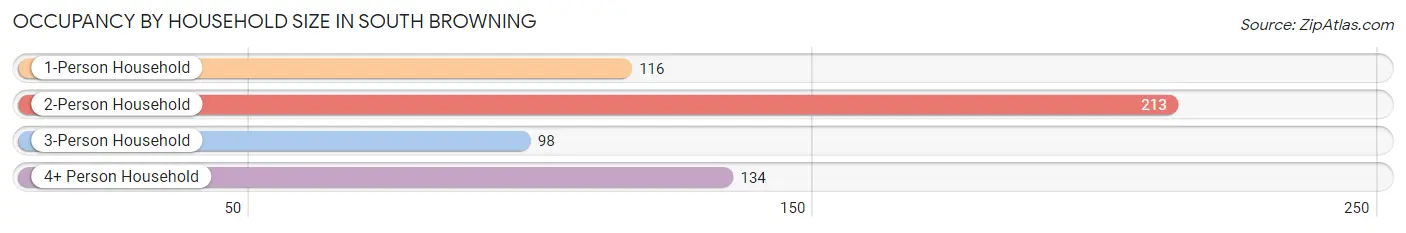
| Household Size | # Housing Units | % Housing Units |
| 1-Person Household | 116 | 20.7% |
| 2-Person Household | 213 | 38.0% |
| 3-Person Household | 98 | 17.5% |
| 4+ Person Household | 134 | 23.9% |
| Total Housing Units | 561 | 100.0% |
Occupancy by Ownership by Household Size in South Browning
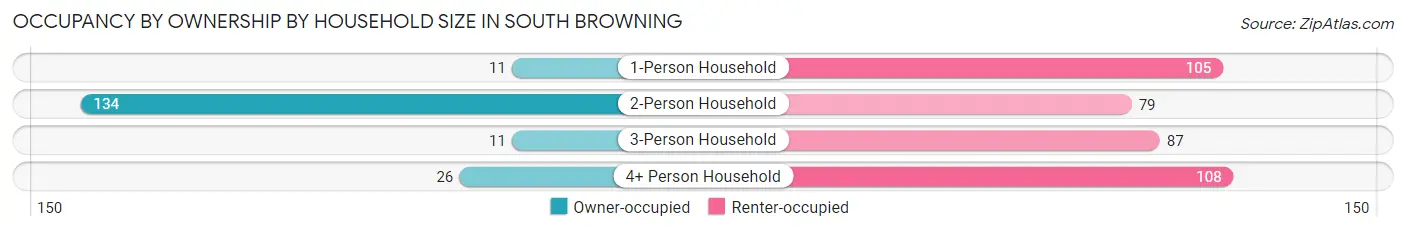
| Household Size | Owner-occupied | Renter-occupied |
| 1-Person Household | 11 (9.5%) | 105 (90.5%) |
| 2-Person Household | 134 (62.9%) | 79 (37.1%) |
| 3-Person Household | 11 (11.2%) | 87 (88.8%) |
| 4+ Person Household | 26 (19.4%) | 108 (80.6%) |
| Total Housing Units | 182 (32.4%) | 379 (67.6%) |
Occupancy by Educational Attainment in South Browning
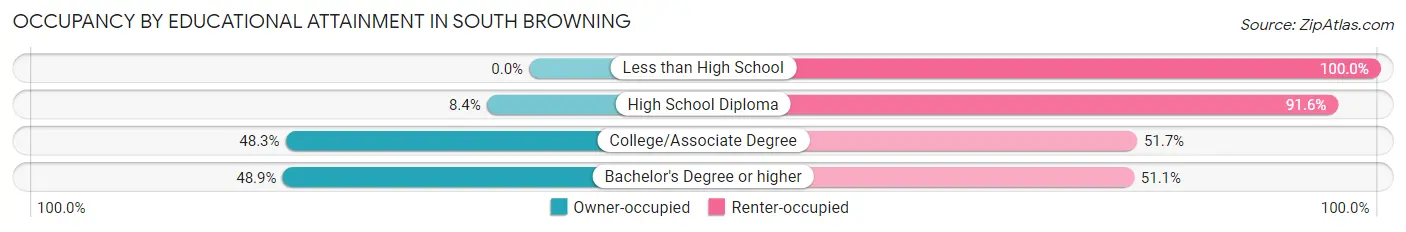
| Household Size | Owner-occupied | Renter-occupied |
| Less than High School | 0 (0.0%) | 97 (100.0%) |
| High School Diploma | 9 (8.4%) | 98 (91.6%) |
| College/Associate Degree | 128 (48.3%) | 137 (51.7%) |
| Bachelor's Degree or higher | 45 (48.9%) | 47 (51.1%) |
Occupancy by Age of Householder in South Browning
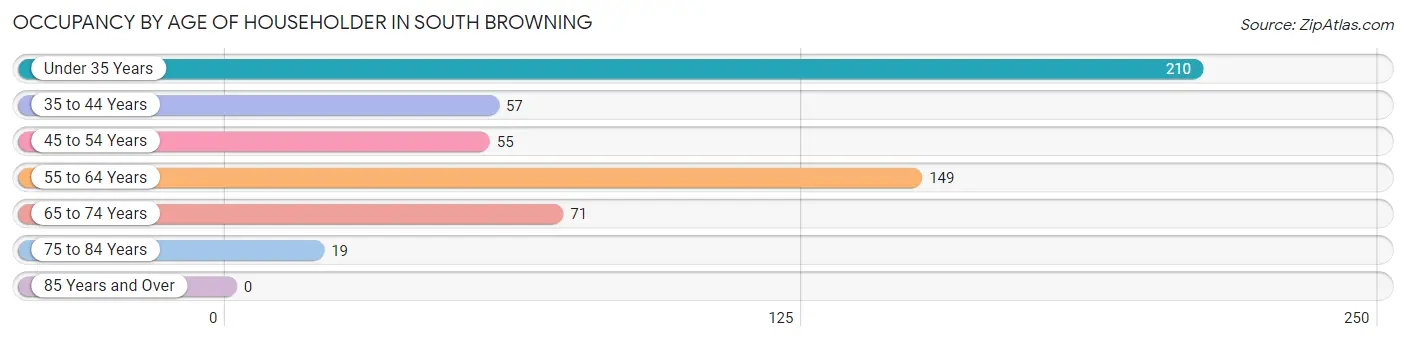
| Age Bracket | # Households | % Households |
| Under 35 Years | 210 | 37.4% |
| 35 to 44 Years | 57 | 10.2% |
| 45 to 54 Years | 55 | 9.8% |
| 55 to 64 Years | 149 | 26.6% |
| 65 to 74 Years | 71 | 12.7% |
| 75 to 84 Years | 19 | 3.4% |
| 85 Years and Over | 0 | 0.0% |
| Total | 561 | 100.0% |
Housing Finances in South Browning
Median Income by Occupancy in South Browning
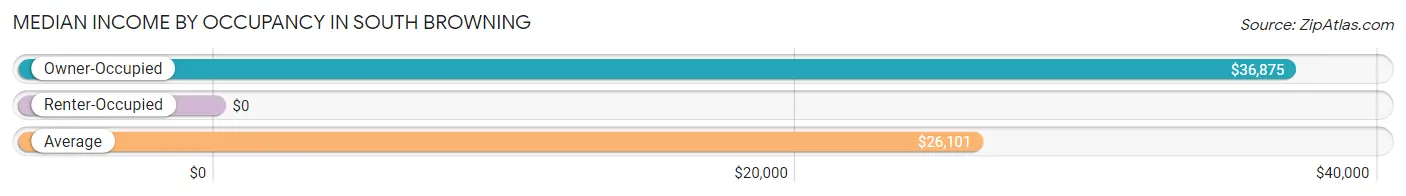
| Occupancy Type | # Households | Median Income |
| Owner-Occupied | 182 (32.4%) | $36,875 |
| Renter-Occupied | 379 (67.6%) | $0 |
| Average | 561 (100.0%) | $26,101 |
Occupancy by Householder Income Bracket in South Browning
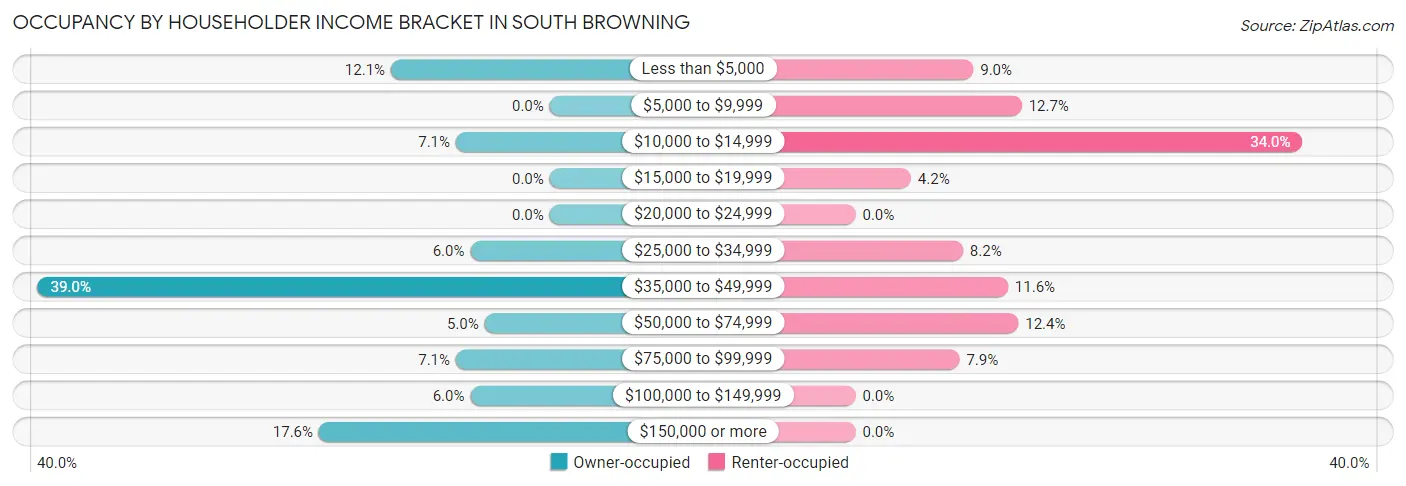
| Income Bracket | Owner-occupied | Renter-occupied |
| Less than $5,000 | 22 (12.1%) | 34 (9.0%) |
| $5,000 to $9,999 | 0 (0.0%) | 48 (12.7%) |
| $10,000 to $14,999 | 13 (7.1%) | 129 (34.0%) |
| $15,000 to $19,999 | 0 (0.0%) | 16 (4.2%) |
| $20,000 to $24,999 | 0 (0.0%) | 0 (0.0%) |
| $25,000 to $34,999 | 11 (6.0%) | 31 (8.2%) |
| $35,000 to $49,999 | 71 (39.0%) | 44 (11.6%) |
| $50,000 to $74,999 | 9 (5.0%) | 47 (12.4%) |
| $75,000 to $99,999 | 13 (7.1%) | 30 (7.9%) |
| $100,000 to $149,999 | 11 (6.0%) | 0 (0.0%) |
| $150,000 or more | 32 (17.6%) | 0 (0.0%) |
| Total | 182 (100.0%) | 379 (100.0%) |
Monthly Housing Cost Tiers in South Browning
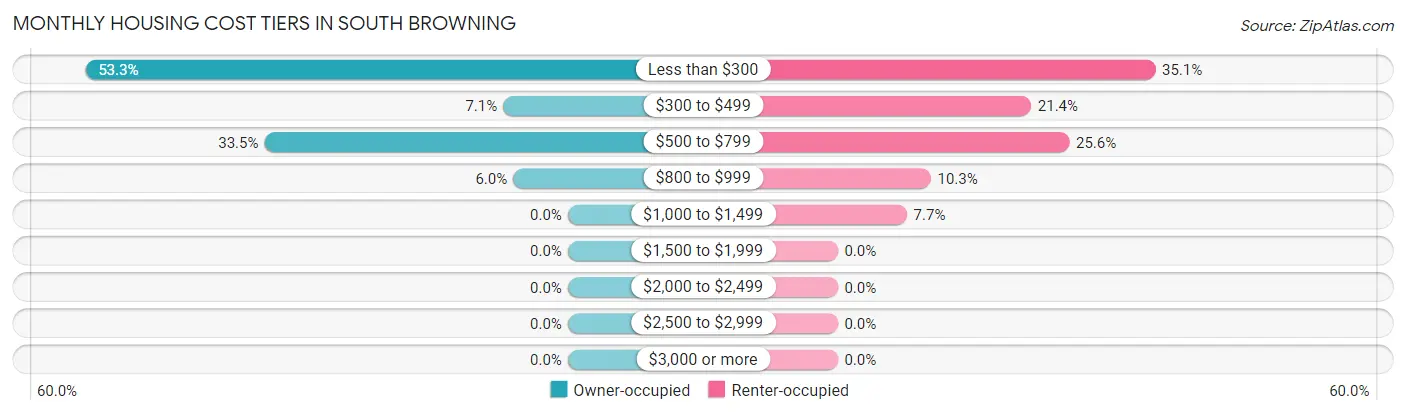
| Monthly Cost | Owner-occupied | Renter-occupied |
| Less than $300 | 97 (53.3%) | 133 (35.1%) |
| $300 to $499 | 13 (7.1%) | 81 (21.4%) |
| $500 to $799 | 61 (33.5%) | 97 (25.6%) |
| $800 to $999 | 11 (6.0%) | 39 (10.3%) |
| $1,000 to $1,499 | 0 (0.0%) | 29 (7.6%) |
| $1,500 to $1,999 | 0 (0.0%) | 0 (0.0%) |
| $2,000 to $2,499 | 0 (0.0%) | 0 (0.0%) |
| $2,500 to $2,999 | 0 (0.0%) | 0 (0.0%) |
| $3,000 or more | 0 (0.0%) | 0 (0.0%) |
| Total | 182 (100.0%) | 379 (100.0%) |
Physical Housing Characteristics in South Browning
Housing Structures in South Browning
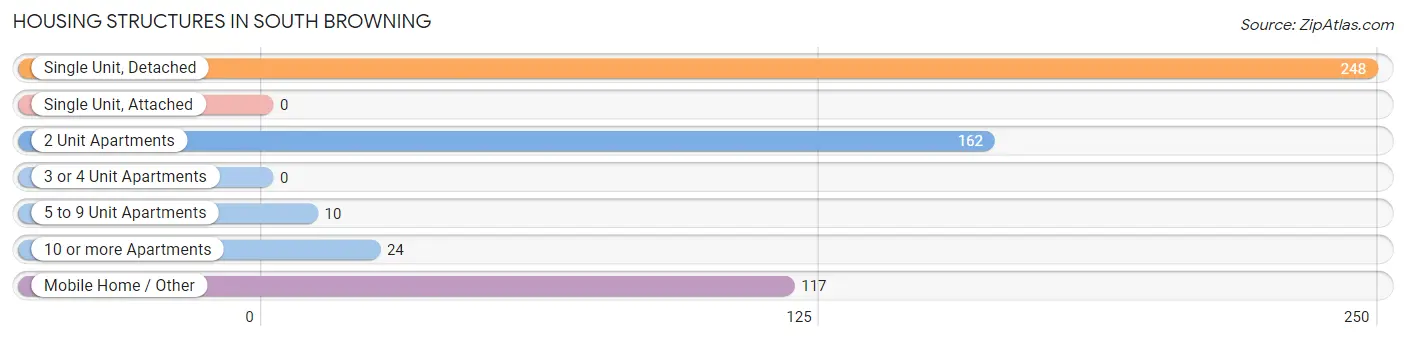
| Structure Type | # Housing Units | % Housing Units |
| Single Unit, Detached | 248 | 44.2% |
| Single Unit, Attached | 0 | 0.0% |
| 2 Unit Apartments | 162 | 28.9% |
| 3 or 4 Unit Apartments | 0 | 0.0% |
| 5 to 9 Unit Apartments | 10 | 1.8% |
| 10 or more Apartments | 24 | 4.3% |
| Mobile Home / Other | 117 | 20.9% |
| Total | 561 | 100.0% |
Housing Structures by Occupancy in South Browning
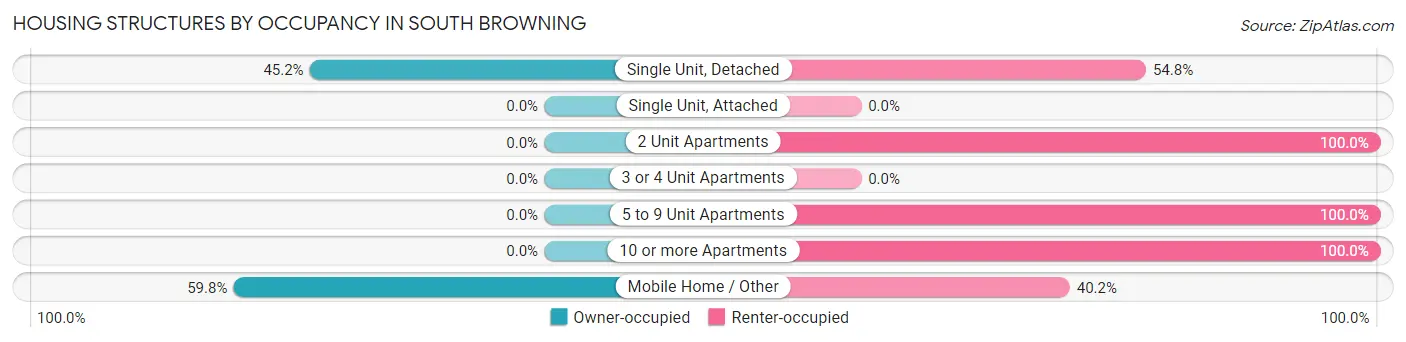
| Structure Type | Owner-occupied | Renter-occupied |
| Single Unit, Detached | 112 (45.2%) | 136 (54.8%) |
| Single Unit, Attached | 0 (0.0%) | 0 (0.0%) |
| 2 Unit Apartments | 0 (0.0%) | 162 (100.0%) |
| 3 or 4 Unit Apartments | 0 (0.0%) | 0 (0.0%) |
| 5 to 9 Unit Apartments | 0 (0.0%) | 10 (100.0%) |
| 10 or more Apartments | 0 (0.0%) | 24 (100.0%) |
| Mobile Home / Other | 70 (59.8%) | 47 (40.2%) |
| Total | 182 (32.4%) | 379 (67.6%) |
Housing Structures by Number of Rooms in South Browning
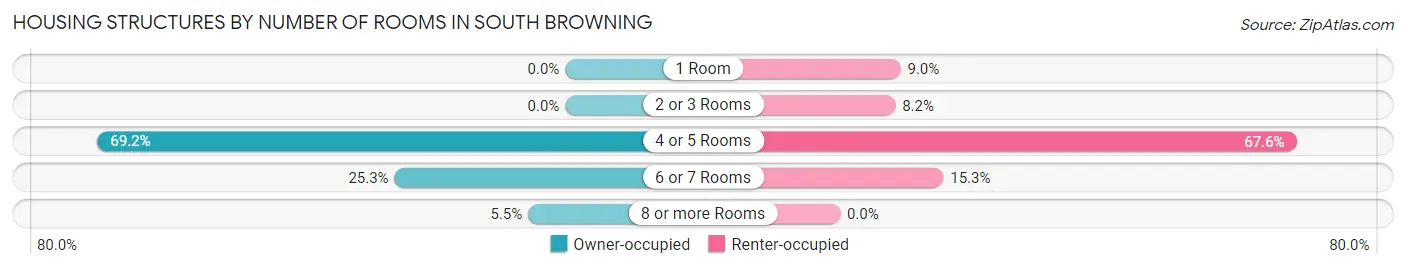
| Number of Rooms | Owner-occupied | Renter-occupied |
| 1 Room | 0 (0.0%) | 34 (9.0%) |
| 2 or 3 Rooms | 0 (0.0%) | 31 (8.2%) |
| 4 or 5 Rooms | 126 (69.2%) | 256 (67.5%) |
| 6 or 7 Rooms | 46 (25.3%) | 58 (15.3%) |
| 8 or more Rooms | 10 (5.5%) | 0 (0.0%) |
| Total | 182 (100.0%) | 379 (100.0%) |
Housing Structure by Heating Type in South Browning
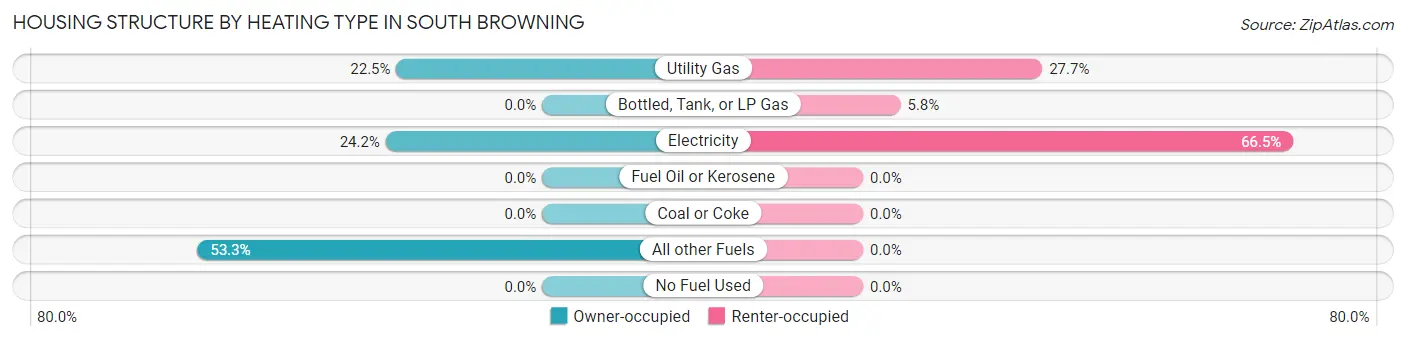
| Heating Type | Owner-occupied | Renter-occupied |
| Utility Gas | 41 (22.5%) | 105 (27.7%) |
| Bottled, Tank, or LP Gas | 0 (0.0%) | 22 (5.8%) |
| Electricity | 44 (24.2%) | 252 (66.5%) |
| Fuel Oil or Kerosene | 0 (0.0%) | 0 (0.0%) |
| Coal or Coke | 0 (0.0%) | 0 (0.0%) |
| All other Fuels | 97 (53.3%) | 0 (0.0%) |
| No Fuel Used | 0 (0.0%) | 0 (0.0%) |
| Total | 182 (100.0%) | 379 (100.0%) |
Household Vehicle Usage in South Browning
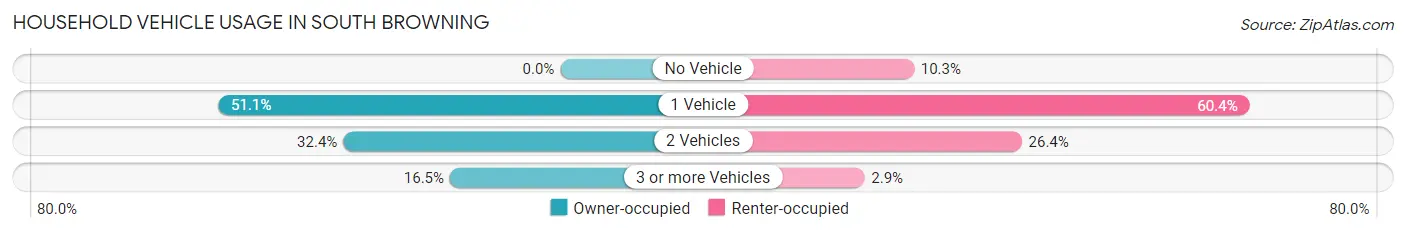
| Vehicles per Household | Owner-occupied | Renter-occupied |
| No Vehicle | 0 (0.0%) | 39 (10.3%) |
| 1 Vehicle | 93 (51.1%) | 229 (60.4%) |
| 2 Vehicles | 59 (32.4%) | 100 (26.4%) |
| 3 or more Vehicles | 30 (16.5%) | 11 (2.9%) |
| Total | 182 (100.0%) | 379 (100.0%) |
Real Estate & Mortgages in South Browning
Real Estate and Mortgage Overview in South Browning
| Characteristic | Without Mortgage | With Mortgage |
| Housing Units | 172 | 10 |
| Median Property Value | - | - |
| Median Household Income | $36,667 | $10 |
| Monthly Housing Costs | $258 | $0 |
| Real Estate Taxes | $199 | $10 |
Property Value by Mortgage Status in South Browning
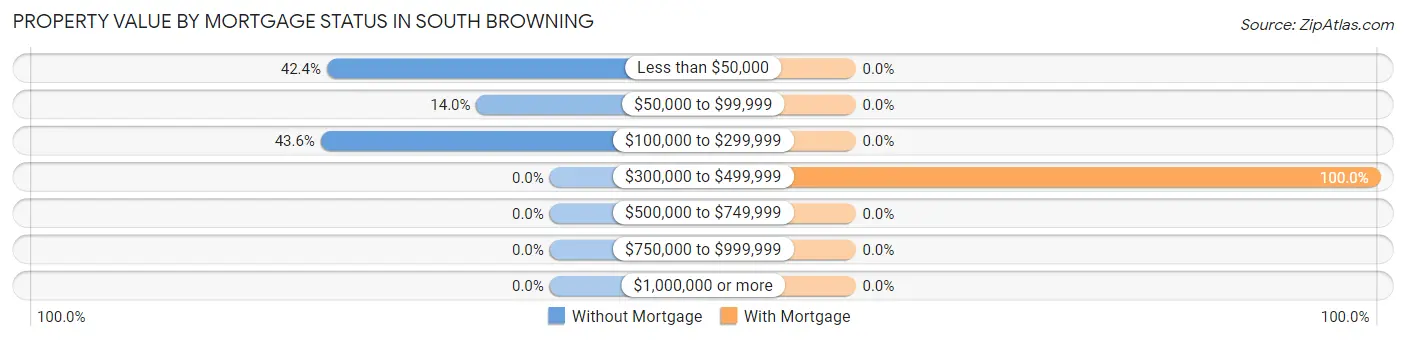
| Property Value | Without Mortgage | With Mortgage |
| Less than $50,000 | 73 (42.4%) | 0 (0.0%) |
| $50,000 to $99,999 | 24 (14.0%) | 0 (0.0%) |
| $100,000 to $299,999 | 75 (43.6%) | 0 (0.0%) |
| $300,000 to $499,999 | 0 (0.0%) | 10 (100.0%) |
| $500,000 to $749,999 | 0 (0.0%) | 0 (0.0%) |
| $750,000 to $999,999 | 0 (0.0%) | 0 (0.0%) |
| $1,000,000 or more | 0 (0.0%) | 0 (0.0%) |
| Total | 172 (100.0%) | 10 (100.0%) |
Household Income by Mortgage Status in South Browning
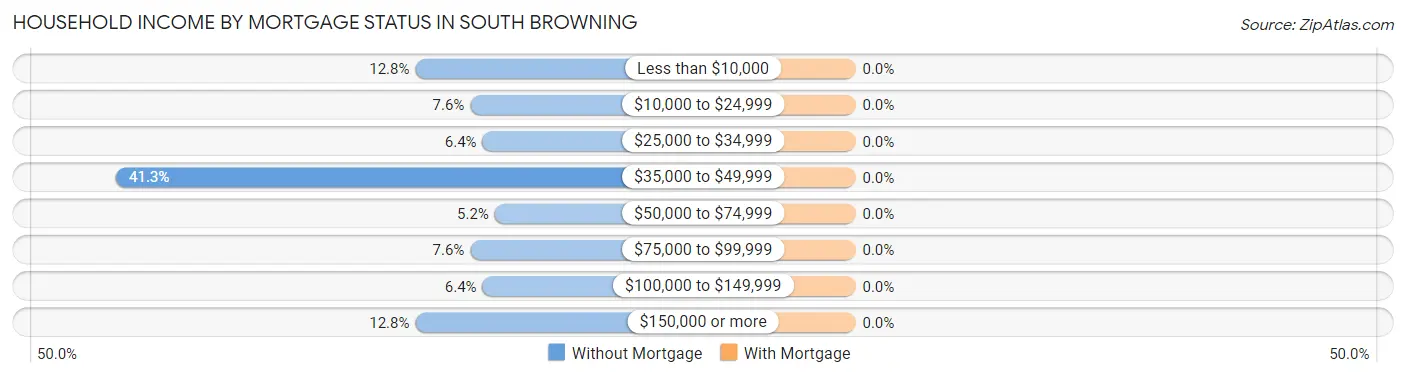
| Household Income | Without Mortgage | With Mortgage |
| Less than $10,000 | 22 (12.8%) | 0 (0.0%) |
| $10,000 to $24,999 | 13 (7.6%) | 0 (0.0%) |
| $25,000 to $34,999 | 11 (6.4%) | 0 (0.0%) |
| $35,000 to $49,999 | 71 (41.3%) | 0 (0.0%) |
| $50,000 to $74,999 | 9 (5.2%) | 0 (0.0%) |
| $75,000 to $99,999 | 13 (7.6%) | 0 (0.0%) |
| $100,000 to $149,999 | 11 (6.4%) | 0 (0.0%) |
| $150,000 or more | 22 (12.8%) | 0 (0.0%) |
| Total | 172 (100.0%) | 10 (100.0%) |
Property Value to Household Income Ratio in South Browning
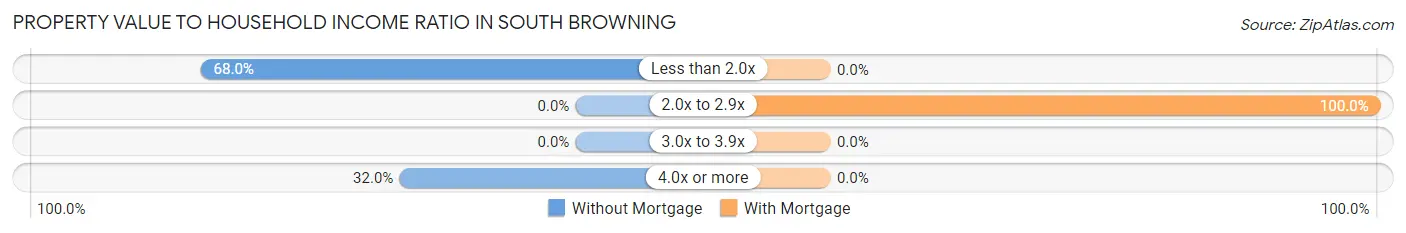
| Value-to-Income Ratio | Without Mortgage | With Mortgage |
| Less than 2.0x | 117 (68.0%) | 0 (0.0%) |
| 2.0x to 2.9x | 0 (0.0%) | 10 (100.0%) |
| 3.0x to 3.9x | 0 (0.0%) | 0 (0.0%) |
| 4.0x or more | 55 (32.0%) | 0 (0.0%) |
| Total | 172 (100.0%) | 10 (100.0%) |
Real Estate Taxes by Mortgage Status in South Browning
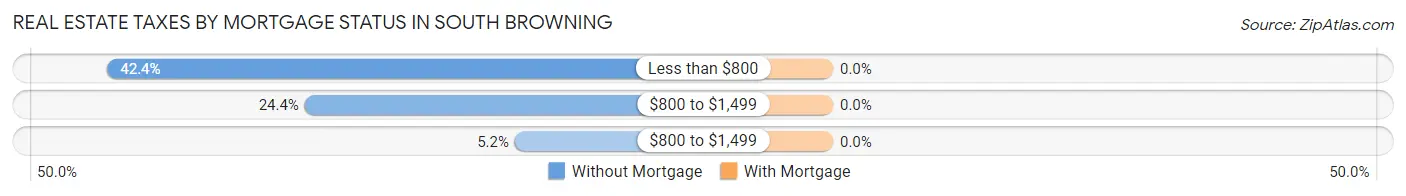
| Property Taxes | Without Mortgage | With Mortgage |
| Less than $800 | 73 (42.4%) | 0 (0.0%) |
| $800 to $1,499 | 42 (24.4%) | 0 (0.0%) |
| $800 to $1,499 | 9 (5.2%) | 0 (0.0%) |
| Total | 172 (100.0%) | 10 (100.0%) |
Health & Disability in South Browning
Health Insurance Coverage by Age in South Browning
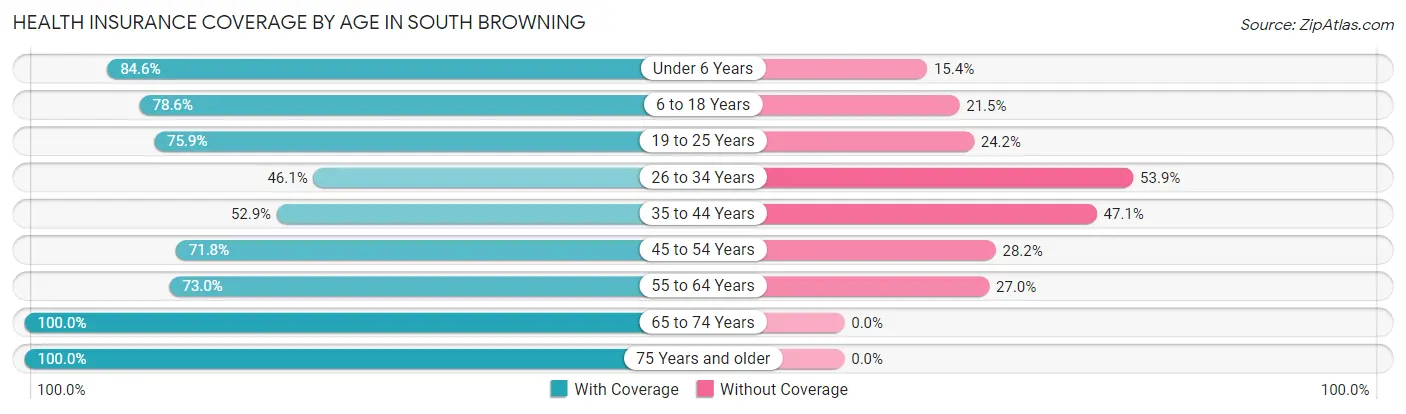
| Age Bracket | With Coverage | Without Coverage |
| Under 6 Years | 203 (84.6%) | 37 (15.4%) |
| 6 to 18 Years | 249 (78.5%) | 68 (21.4%) |
| 19 to 25 Years | 201 (75.8%) | 64 (24.1%) |
| 26 to 34 Years | 137 (46.1%) | 160 (53.9%) |
| 35 to 44 Years | 72 (52.9%) | 64 (47.1%) |
| 45 to 54 Years | 56 (71.8%) | 22 (28.2%) |
| 55 to 64 Years | 127 (73.0%) | 47 (27.0%) |
| 65 to 74 Years | 84 (100.0%) | 0 (0.0%) |
| 75 Years and older | 63 (100.0%) | 0 (0.0%) |
| Total | 1,192 (72.1%) | 462 (27.9%) |
Health Insurance Coverage by Citizenship Status in South Browning
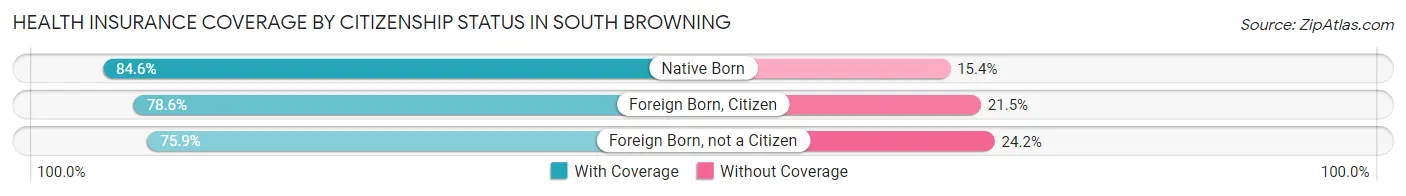
| Citizenship Status | With Coverage | Without Coverage |
| Native Born | 203 (84.6%) | 37 (15.4%) |
| Foreign Born, Citizen | 249 (78.5%) | 68 (21.4%) |
| Foreign Born, not a Citizen | 201 (75.8%) | 64 (24.1%) |
Health Insurance Coverage by Household Income in South Browning
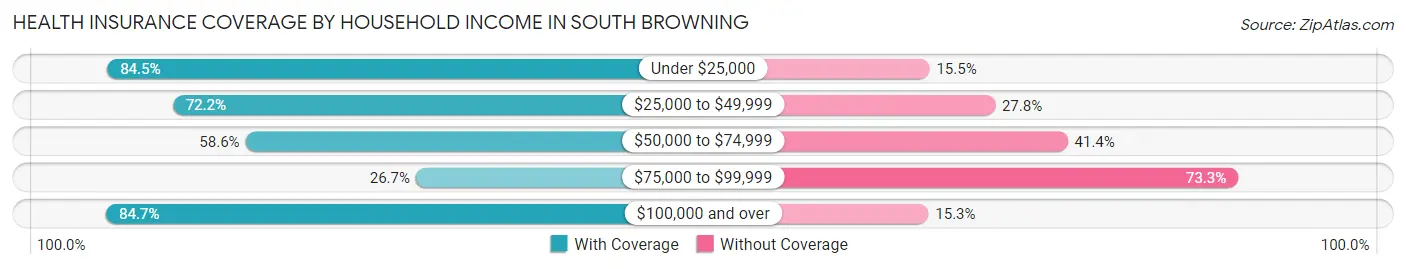
| Household Income | With Coverage | Without Coverage |
| Under $25,000 | 622 (84.5%) | 114 (15.5%) |
| $25,000 to $49,999 | 242 (72.2%) | 93 (27.8%) |
| $50,000 to $74,999 | 163 (58.6%) | 115 (41.4%) |
| $75,000 to $99,999 | 43 (26.7%) | 118 (73.3%) |
| $100,000 and over | 122 (84.7%) | 22 (15.3%) |
Public vs Private Health Insurance Coverage by Age in South Browning
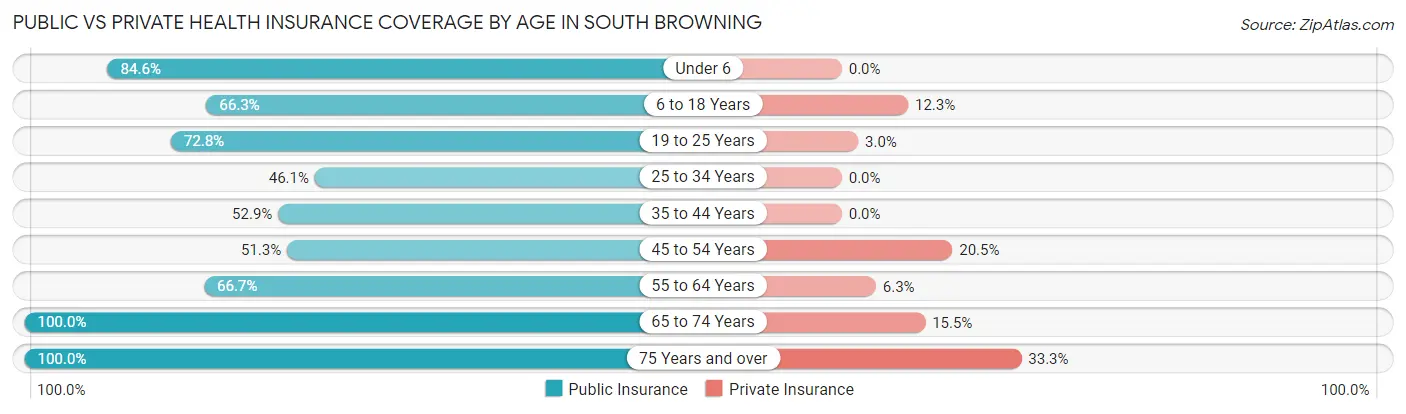
| Age Bracket | Public Insurance | Private Insurance |
| Under 6 | 203 (84.6%) | 0 (0.0%) |
| 6 to 18 Years | 210 (66.2%) | 39 (12.3%) |
| 19 to 25 Years | 193 (72.8%) | 8 (3.0%) |
| 25 to 34 Years | 137 (46.1%) | 0 (0.0%) |
| 35 to 44 Years | 72 (52.9%) | 0 (0.0%) |
| 45 to 54 Years | 40 (51.3%) | 16 (20.5%) |
| 55 to 64 Years | 116 (66.7%) | 11 (6.3%) |
| 65 to 74 Years | 84 (100.0%) | 13 (15.5%) |
| 75 Years and over | 63 (100.0%) | 21 (33.3%) |
| Total | 1,118 (67.6%) | 108 (6.5%) |
Disability Status by Sex by Age in South Browning
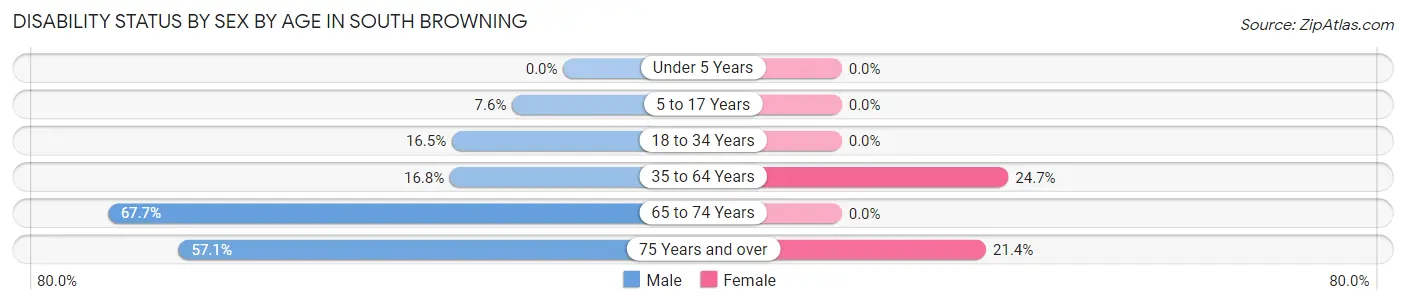
| Age Bracket | Male | Female |
| Under 5 Years | 0 (0.0%) | 0 (0.0%) |
| 5 to 17 Years | 11 (7.6%) | 0 (0.0%) |
| 18 to 34 Years | 42 (16.5%) | 0 (0.0%) |
| 35 to 64 Years | 17 (16.8%) | 71 (24.7%) |
| 65 to 74 Years | 23 (67.6%) | 0 (0.0%) |
| 75 Years and over | 12 (57.1%) | 9 (21.4%) |
Disability Class by Sex by Age in South Browning
Disability Class: Hearing Difficulty
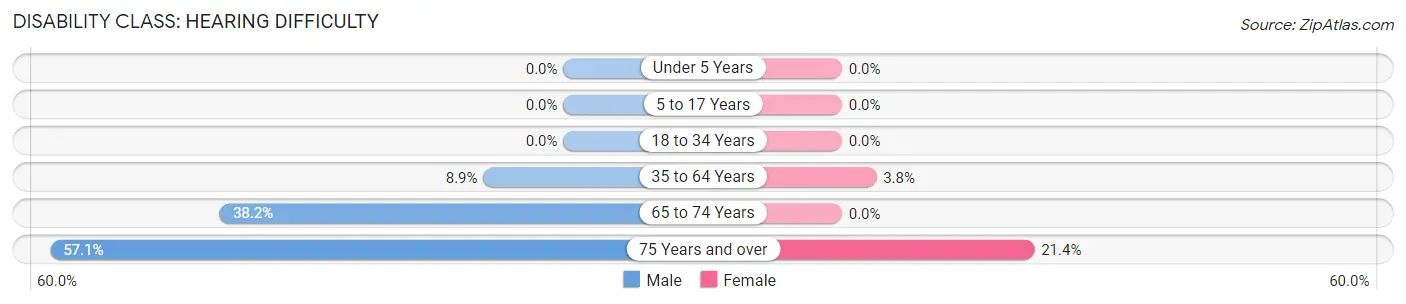
| Age Bracket | Male | Female |
| Under 5 Years | 0 (0.0%) | 0 (0.0%) |
| 5 to 17 Years | 0 (0.0%) | 0 (0.0%) |
| 18 to 34 Years | 0 (0.0%) | 0 (0.0%) |
| 35 to 64 Years | 9 (8.9%) | 11 (3.8%) |
| 65 to 74 Years | 13 (38.2%) | 0 (0.0%) |
| 75 Years and over | 12 (57.1%) | 9 (21.4%) |
Disability Class: Vision Difficulty
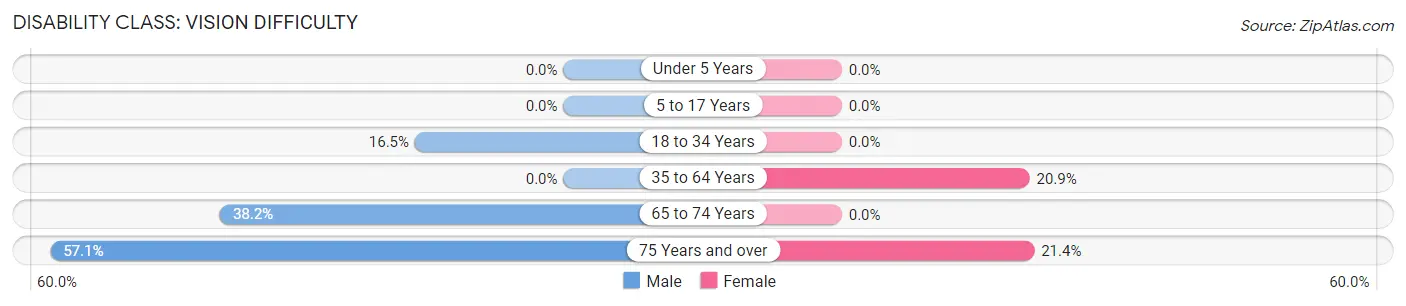
| Age Bracket | Male | Female |
| Under 5 Years | 0 (0.0%) | 0 (0.0%) |
| 5 to 17 Years | 0 (0.0%) | 0 (0.0%) |
| 18 to 34 Years | 42 (16.5%) | 0 (0.0%) |
| 35 to 64 Years | 0 (0.0%) | 60 (20.9%) |
| 65 to 74 Years | 13 (38.2%) | 0 (0.0%) |
| 75 Years and over | 12 (57.1%) | 9 (21.4%) |
Disability Class: Cognitive Difficulty
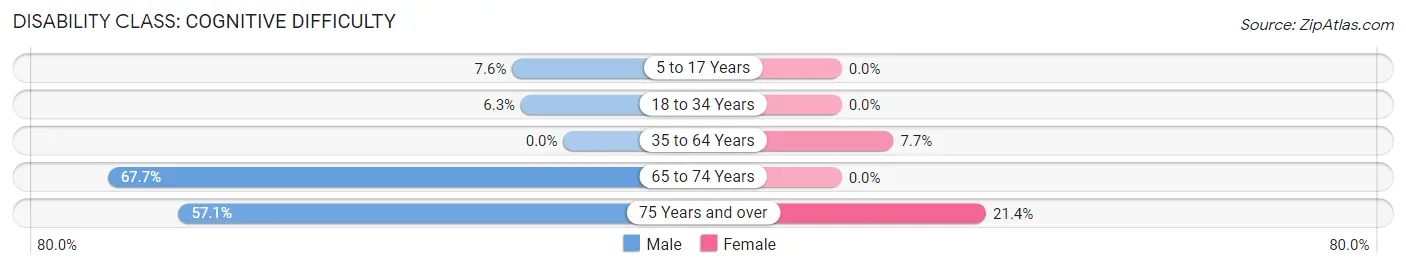
| Age Bracket | Male | Female |
| 5 to 17 Years | 11 (7.6%) | 0 (0.0%) |
| 18 to 34 Years | 16 (6.3%) | 0 (0.0%) |
| 35 to 64 Years | 0 (0.0%) | 22 (7.7%) |
| 65 to 74 Years | 23 (67.6%) | 0 (0.0%) |
| 75 Years and over | 12 (57.1%) | 9 (21.4%) |
Disability Class: Ambulatory Difficulty
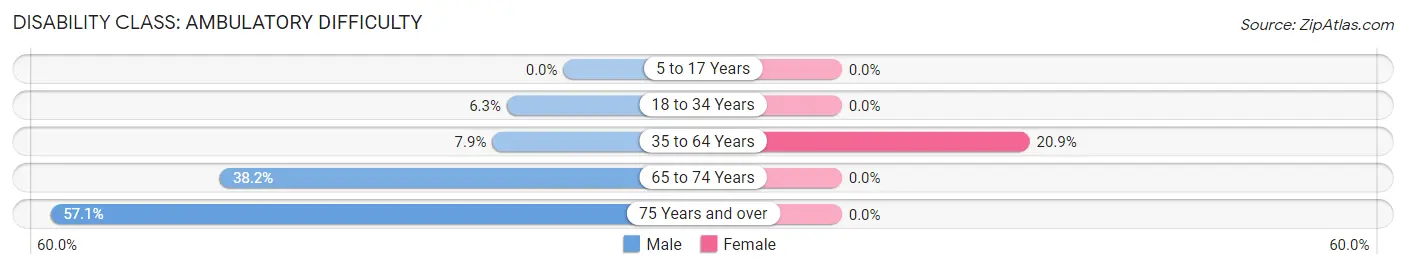
| Age Bracket | Male | Female |
| 5 to 17 Years | 0 (0.0%) | 0 (0.0%) |
| 18 to 34 Years | 16 (6.3%) | 0 (0.0%) |
| 35 to 64 Years | 8 (7.9%) | 60 (20.9%) |
| 65 to 74 Years | 13 (38.2%) | 0 (0.0%) |
| 75 Years and over | 12 (57.1%) | 0 (0.0%) |
Disability Class: Self-Care Difficulty
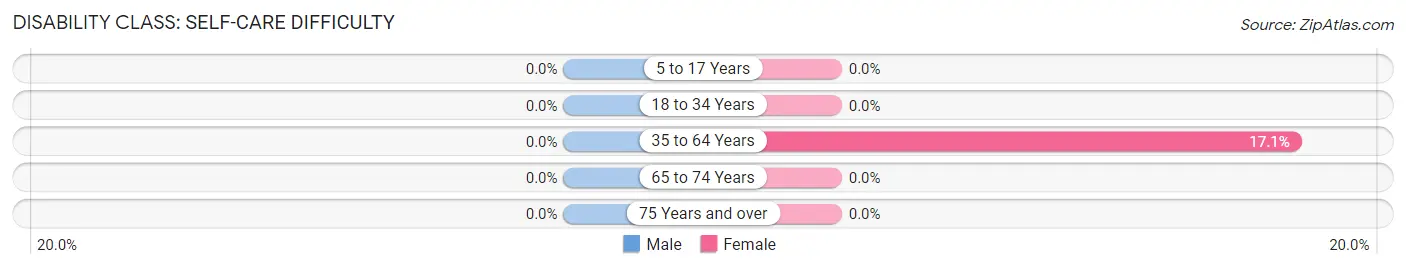
| Age Bracket | Male | Female |
| 5 to 17 Years | 0 (0.0%) | 0 (0.0%) |
| 18 to 34 Years | 0 (0.0%) | 0 (0.0%) |
| 35 to 64 Years | 0 (0.0%) | 49 (17.1%) |
| 65 to 74 Years | 0 (0.0%) | 0 (0.0%) |
| 75 Years and over | 0 (0.0%) | 0 (0.0%) |
Technology Access in South Browning
Computing Device Access in South Browning
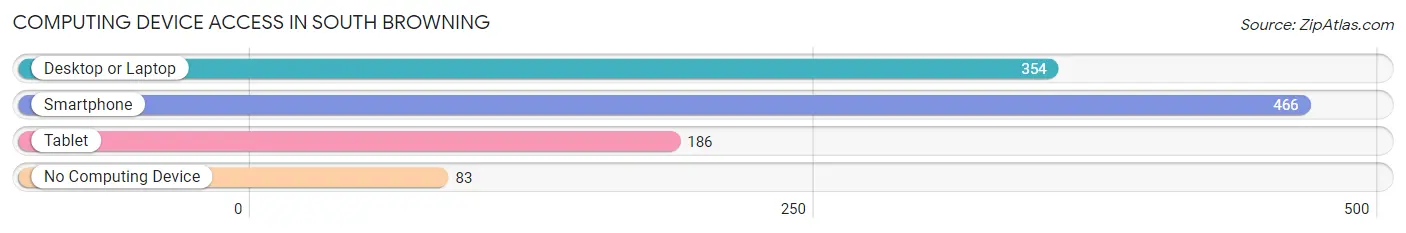
| Device Type | # Households | % Households |
| Desktop or Laptop | 354 | 63.1% |
| Smartphone | 466 | 83.1% |
| Tablet | 186 | 33.2% |
| No Computing Device | 83 | 14.8% |
| Total | 561 | 100.0% |
Internet Access in South Browning
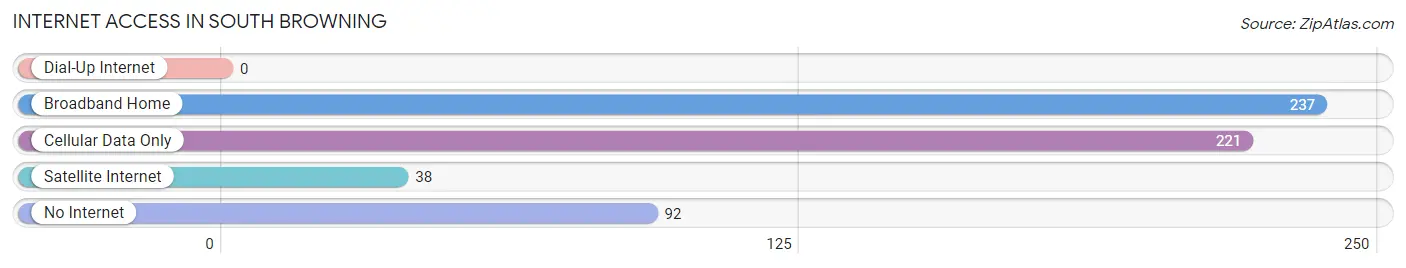
| Internet Type | # Households | % Households |
| Dial-Up Internet | 0 | 0.0% |
| Broadband Home | 237 | 42.2% |
| Cellular Data Only | 221 | 39.4% |
| Satellite Internet | 38 | 6.8% |
| No Internet | 92 | 16.4% |
| Total | 561 | 100.0% |
South Browning Summary
Browning, Montana is a small town located in the Blackfeet Indian Reservation in Glacier County. It is the largest town in the reservation and is the county seat of Glacier County. The town is located in the Rocky Mountains and is surrounded by the Rocky Mountain Front, the Great Plains, and the Blackfeet Indian Reservation. The town is located at an elevation of 4,400 feet and has a population of 1,631 as of the 2010 census.
History
The area around Browning was first inhabited by the Blackfeet Indians, who had lived in the area for thousands of years. The town was founded in 1887 by the Blackfeet Tribe and was named after Chief Browning, a prominent leader of the tribe. The town was originally a trading post and was used as a base for the tribe's buffalo hunting.
In the early 1900s, the town began to grow as more settlers moved into the area. The town was incorporated in 1909 and the first school was built in 1910. The town continued to grow and by the 1950s, it had become the largest town in the Blackfeet Indian Reservation.
Geography
Browning is located in the Rocky Mountains and is surrounded by the Rocky Mountain Front, the Great Plains, and the Blackfeet Indian Reservation. The town is located at an elevation of 4,400 feet and has a total area of 1.3 square miles. The town is located near the Two Medicine River and is close to the Blackfeet National Forest.
The climate in Browning is semi-arid, with cold winters and hot summers. The average annual temperature is 44 degrees Fahrenheit and the average annual precipitation is 13.5 inches.
Economy
The economy of Browning is largely based on tourism and the service industry. The town is home to several tourist attractions, including the Museum of the Plains Indian, the Blackfeet Heritage Center, and the Blackfeet Nation Museum. The town is also home to several restaurants, hotels, and other businesses that cater to tourists.
The town is also home to several manufacturing and industrial businesses, including a lumber mill, a grain elevator, and a meat packing plant. The town is also home to several government offices, including the Blackfeet Tribal Office, the Glacier County Courthouse, and the Glacier County Sheriff's Office.
Demographics
As of the 2010 census, the population of Browning was 1,631. The racial makeup of the town was 94.3% Native American, 2.2% White, 0.2% African American, 0.2% Asian, 0.1% Pacific Islander, 0.7% from other races, and 2.3% from two or more races. The median age of the population was 28.7 years.
The median household income in Browning was $25,938 and the median family income was $30,938. The per capita income in Browning was $13,938. The poverty rate in Browning was 44.3%. The unemployment rate in Browning was 8.3%.
Common Questions
What is Per Capita Income in South Browning?
Per Capita income in South Browning is $14,826.
What is the Median Family Income in South Browning?
Median Family Income in South Browning is $35,898.
What is the Median Household income in South Browning?
Median Household Income in South Browning is $26,101.
What is Income or Wage Gap in South Browning?
Income or Wage Gap in South Browning is 44.4%.
Women in South Browning earn 55.6 cents for every dollar earned by a man.
What is Inequality or Gini Index in South Browning?
Inequality or Gini Index in South Browning is 0.52.
What is the Total Population of South Browning?
Total Population of South Browning is 1,654.
What is the Total Male Population of South Browning?
Total Male Population of South Browning is 683.
What is the Total Female Population of South Browning?
Total Female Population of South Browning is 971.
What is the Ratio of Males per 100 Females in South Browning?
There are 70.34 Males per 100 Females in South Browning.
What is the Ratio of Females per 100 Males in South Browning?
There are 142.17 Females per 100 Males in South Browning.
What is the Median Population Age in South Browning?
Median Population Age in South Browning is 26.3 Years.
What is the Average Family Size in South Browning
Average Family Size in South Browning is 3.3 People.
What is the Average Household Size in South Browning
Average Household Size in South Browning is 3.0 People.
How Large is the Labor Force in South Browning?
There are 590 People in the Labor Forcein in South Browning.
What is the Percentage of People in the Labor Force in South Browning?
51.4% of People are in the Labor Force in South Browning.
What is the Unemployment Rate in South Browning?
Unemployment Rate in South Browning is 15.3%.