Zip Codes with the Highest Percentage of Population Employed in Community & Social Service in Springfield, VA

RELATED REPORTS & OPTIONS

Community & Social Service
Population
Families and Households
Female Fertility
Female Fertility (Unmarried)
Race (Community Size)
Race (Percentage)
Ancestry (Community Size)
AfghanAfricanAlbanianAmericanArabArgentineanAustrianBelgianBelizeanBhutaneseBlackfeetBolivianBrazilianBritishBulgarianBurmeseCanadianCentral AmericanCentral American IndianCherokeeChileanChineseColombianCosta RicanCroatianCubanCzechCzechoslovakianDanishDominicanDutchEastern EuropeanEcuadorianEgyptianEnglishEthiopianEuropeanFilipinoFinnishFrenchFrench CanadianGermanGhanaianGreekGuamanian / ChamorroGuatemalanHaitianHonduranHungarianIndian (Asian)IranianIraqiIrishItalianJamaicanJapaneseJordanianKenyanKoreanLaotianLebaneseLithuanianLuxembourgerMalaysianMexicanMexican American IndianMongolianMoroccanNicaraguanNorthern EuropeanNorwegianPakistaniPalestinianPanamanianParaguayanPennsylvania GermanPeruvianPolishPortuguesePuerto RicanRomanianRussianSalvadoranScandinavianScotch-IrishScottishSierra LeoneanSiouxSlavicSlovakSloveneSouth AmericanSouth American IndianSpaniardSpanishSri LankanSubsaharan AfricanSudaneseSwedishSwissSyrianThaiTurkishUkrainianUruguayanVenezuelanVietnameseWelsh
Ancestry (Percentage)
AfghanAfricanAlbanianAmericanArabArgentineanAustrianBelgianBelizeanBhutaneseBlackfeetBolivianBrazilianBritishBulgarianBurmeseCanadianCentral AmericanCentral American IndianCherokeeChileanChineseColombianCosta RicanCroatianCubanCzechCzechoslovakianDanishDominicanDutchEastern EuropeanEcuadorianEgyptianEnglishEthiopianEuropeanFilipinoFinnishFrenchFrench CanadianGermanGhanaianGreekGuamanian / ChamorroGuatemalanHaitianHonduranHungarianIndian (Asian)IranianIraqiIrishItalianJamaicanJapaneseJordanianKenyanKoreanLaotianLebaneseLithuanianLuxembourgerMalaysianMexicanMexican American IndianMongolianMoroccanNicaraguanNorthern EuropeanNorwegianPakistaniPalestinianPanamanianParaguayanPennsylvania GermanPeruvianPolishPortuguesePuerto RicanRomanianRussianSalvadoranScandinavianScotch-IrishScottishSierra LeoneanSiouxSlavicSlovakSloveneSouth AmericanSouth American IndianSpaniardSpanishSri LankanSubsaharan AfricanSudaneseSwedishSwissSyrianThaiTurkishUkrainianUruguayanVenezuelanVietnameseWelsh
Immigrant Origin (Total)
Immigrant Origin (Percentage)
Income
Income (Families)
Income (Households)
Poverty
Poverty (Families)
Unemployment
Employment Occupations
Employment Industries
Employer Class
Commute Time
Commute Means
School Enrollment
Education by Degree Field
Occupancy
Finances
Physical Characteristics
Springfield
Compare Zip Codes
Comparison Subject

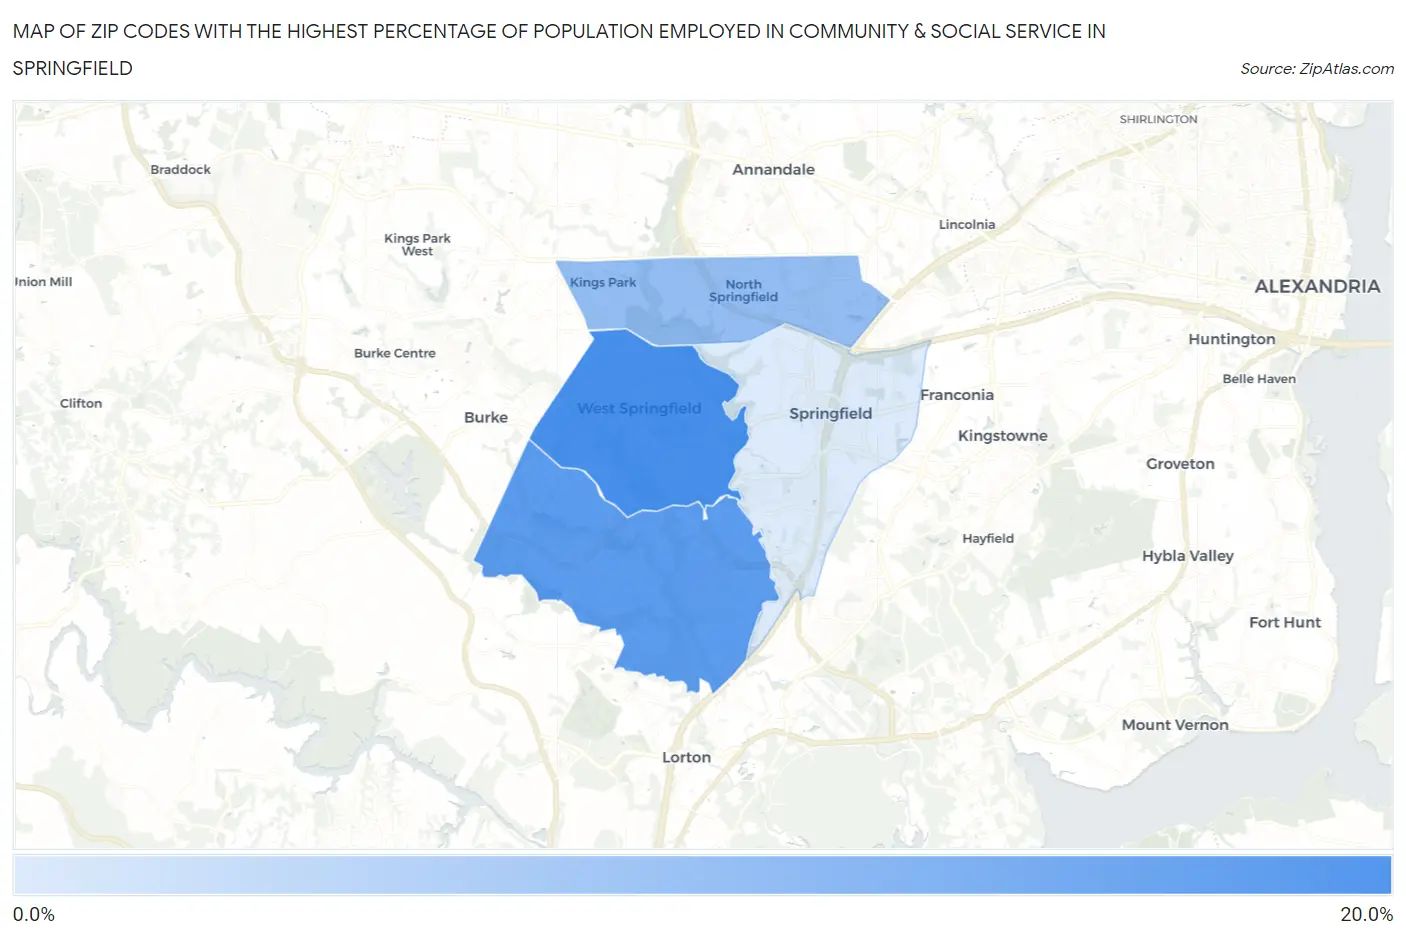
Map of Zip Codes with the Highest Percentage of Population Employed in Community & Social Service in Springfield

0.0%
20.0%
Zip Codes with the Highest Percentage of Population Employed in Community & Social Service  in Springfield Map

Zip Codes with the Highest Percentage of Population Employed in Community & Social Service in Springfield, VA

Zip Code % Employed vs State vs National
1.2215216.2%12.1%(+4.02)#13611.2%(+4.94)#3,944
2.2215314.8%12.1%(+2.68)#17111.2%(+3.60)#5,148
3.2215110.6%12.1%(-1.57)#37711.2%(-0.652)#12,724
4.221505.4%12.1%(-6.76)#67911.2%(-5.84)#25,572

Common Questions

What are the Top 3 Zip Codes with the Highest Percentage of Population Employed in Community & Social Service in Springfield, VA?
Top 3 Zip Codes with the Highest Percentage of Population Employed in Community & Social Service in Springfield, VA are:
#1
16.2%
#2
14.8%
#3
10.6%
What zip code has the Highest Percentage of Population Employed in Community & Social Service in Springfield, VA?
22152 has the Highest Percentage of Population Employed in Community & Social Service in Springfield, VA with 16.2%.
What is the Percentage of Population Employed in Community & Social Service in Springfield, VA?
Percentage of Population Employed in Community & Social Service in Springfield is 5.5%.
What is the Percentage of Population Employed in Community & Social Service in Virginia?
Percentage of Population Employed in Community & Social Service in Virginia is 12.1%.
What is the Percentage of Population Employed in Community & Social Service in the United States?
Percentage of Population Employed in Community & Social Service in the United States is 11.2%.