Zip Codes with the Highest Percentage of Population Employed in Community & Social Service in Virginia
RELATED REPORTS & OPTIONS
Community & Social Service
Virginia
Compare Zip Codes
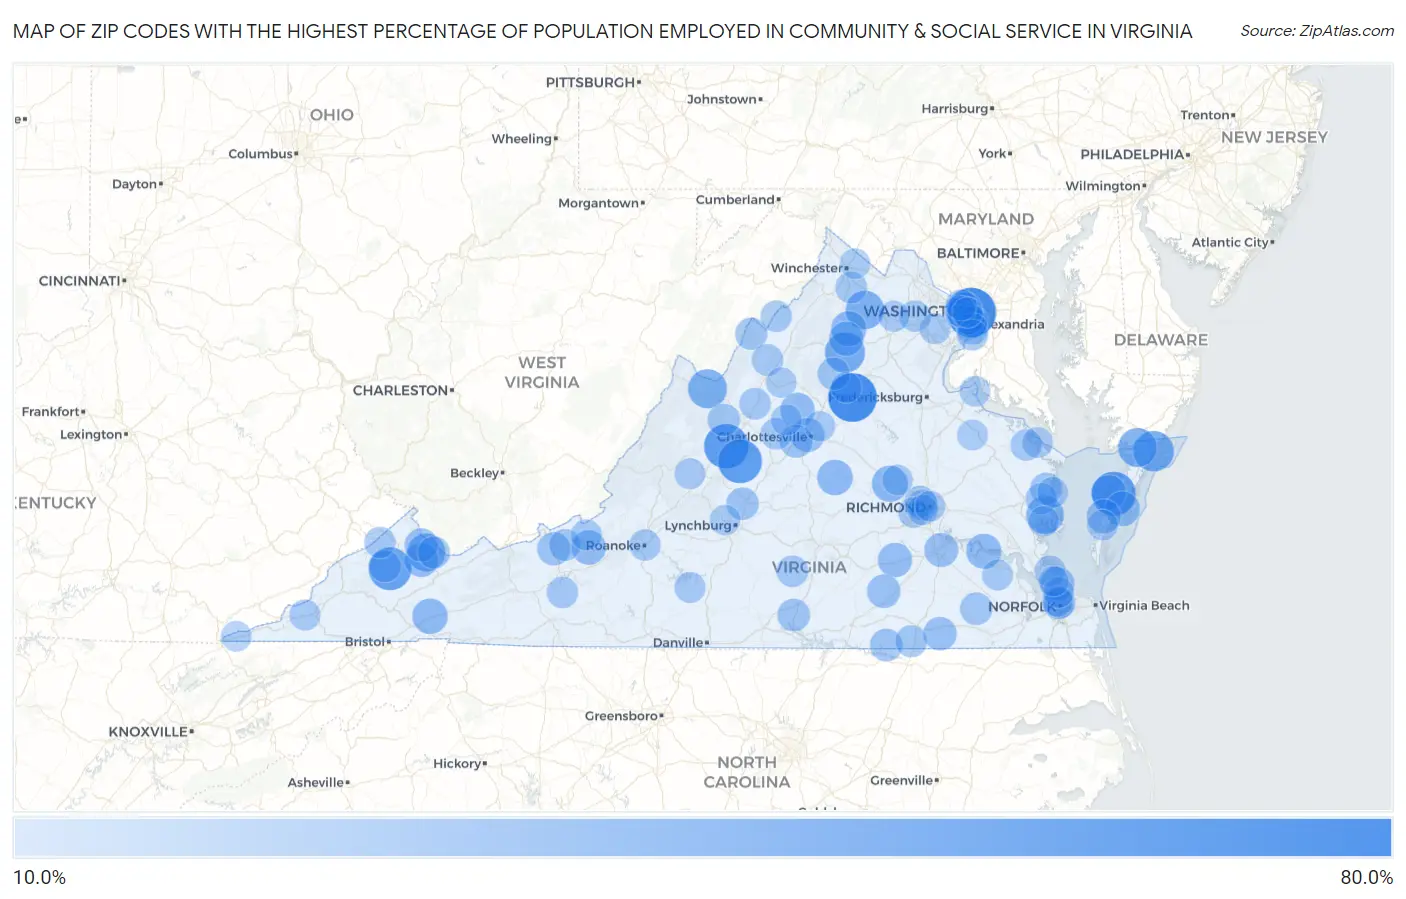
Map of Zip Codes with the Highest Percentage of Population Employed in Community & Social Service in Virginia
10.0%
80.0%
Zip Codes with the Highest Percentage of Population Employed in Community & Social Service in Virginia
| Zip Code | % Employed | vs State | vs National | |
| 1. | 22211 | 80.0% | 12.1%(+67.9)#1 | 11.2%(+68.8)#42 |
| 2. | 22989 | 77.4% | 12.1%(+65.2)#2 | 11.2%(+66.1)#45 |
| 3. | 24476 | 63.2% | 12.1%(+51.1)#3 | 11.2%(+52.0)#73 |
| 4. | 23422 | 62.5% | 12.1%(+50.4)#4 | 11.2%(+51.3)#75 |
| 5. | 24464 | 61.7% | 12.1%(+49.6)#5 | 11.2%(+50.5)#79 |
| 6. | 24217 | 57.9% | 12.1%(+45.8)#6 | 11.2%(+46.7)#93 |
| 7. | 23337 | 50.4% | 12.1%(+38.2)#7 | 11.2%(+39.2)#154 |
| 8. | 22749 | 49.3% | 12.1%(+37.2)#8 | 11.2%(+38.1)#172 |
| 9. | 24442 | 45.5% | 12.1%(+33.3)#9 | 11.2%(+34.2)#216 |
| 10. | 23488 | 44.7% | 12.1%(+32.6)#10 | 11.2%(+33.5)#228 |
| 11. | 22643 | 44.1% | 12.1%(+31.9)#11 | 11.2%(+32.9)#233 |
| 12. | 24657 | 42.1% | 12.1%(+30.0)#12 | 11.2%(+30.9)#261 |
| 13. | 23050 | 42.0% | 12.1%(+29.8)#13 | 11.2%(+30.8)#264 |
| 14. | 23129 | 36.3% | 12.1%(+24.1)#14 | 11.2%(+25.0)#369 |
| 15. | 23022 | 34.6% | 12.1%(+22.5)#15 | 11.2%(+23.4)#402 |
| 16. | 24327 | 34.1% | 12.1%(+21.9)#16 | 11.2%(+22.9)#414 |
| 17. | 22627 | 33.7% | 12.1%(+21.5)#17 | 11.2%(+22.4)#425 |
| 18. | 23899 | 33.0% | 12.1%(+20.8)#18 | 11.2%(+21.8)#451 |
| 19. | 23358 | 32.1% | 12.1%(+20.0)#19 | 11.2%(+20.9)#476 |
| 20. | 23423 | 32.1% | 12.1%(+20.0)#20 | 11.2%(+20.9)#478 |
| 21. | 22940 | 31.2% | 12.1%(+19.1)#21 | 11.2%(+20.0)#522 |
| 22. | 24060 | 31.1% | 12.1%(+19.0)#22 | 11.2%(+19.9)#528 |
| 23. | 22747 | 30.7% | 12.1%(+18.6)#23 | 11.2%(+19.5)#553 |
| 24. | 23850 | 30.3% | 12.1%(+18.2)#24 | 11.2%(+19.1)#573 |
| 25. | 24639 | 29.9% | 12.1%(+17.8)#25 | 11.2%(+18.7)#592 |
| 26. | 23354 | 29.6% | 12.1%(+17.5)#26 | 11.2%(+18.4)#604 |
| 27. | 23651 | 29.6% | 12.1%(+17.5)#27 | 11.2%(+18.4)#607 |
| 28. | 22904 | 29.5% | 12.1%(+17.4)#28 | 11.2%(+18.3)#610 |
| 29. | 23801 | 29.4% | 12.1%(+17.3)#29 | 11.2%(+18.2)#615 |
| 30. | 23876 | 27.8% | 12.1%(+15.6)#30 | 11.2%(+16.6)#707 |
| 31. | 23844 | 27.6% | 12.1%(+15.5)#31 | 11.2%(+16.4)#719 |
| 32. | 24634 | 27.2% | 12.1%(+15.0)#32 | 11.2%(+15.9)#753 |
| 33. | 24167 | 27.1% | 12.1%(+14.9)#33 | 11.2%(+15.9)#763 |
| 34. | 22903 | 26.4% | 12.1%(+14.3)#34 | 11.2%(+15.2)#826 |
| 35. | 22207 | 26.4% | 12.1%(+14.2)#35 | 11.2%(+15.1)#832 |
| 36. | 23887 | 25.1% | 12.1%(+13.0)#36 | 11.2%(+13.9)#956 |
| 37. | 23964 | 25.1% | 12.1%(+12.9)#37 | 11.2%(+13.8)#966 |
| 38. | 24595 | 24.8% | 12.1%(+12.7)#38 | 11.2%(+13.6)#997 |
| 39. | 23878 | 24.8% | 12.1%(+12.6)#39 | 11.2%(+13.6)#1,009 |
| 40. | 22205 | 24.8% | 12.1%(+12.6)#40 | 11.2%(+13.5)#1,013 |
| 41. | 22711 | 24.6% | 12.1%(+12.5)#41 | 11.2%(+13.4)#1,030 |
| 42. | 24479 | 24.2% | 12.1%(+12.1)#42 | 11.2%(+13.0)#1,071 |
| 43. | 24622 | 23.9% | 12.1%(+11.7)#43 | 11.2%(+12.6)#1,131 |
| 44. | 22820 | 23.5% | 12.1%(+11.3)#44 | 11.2%(+12.3)#1,200 |
| 45. | 22480 | 23.3% | 12.1%(+11.2)#45 | 11.2%(+12.1)#1,229 |
| 46. | 24220 | 23.2% | 12.1%(+11.1)#46 | 11.2%(+12.0)#1,241 |
| 47. | 22314 | 22.8% | 12.1%(+10.7)#47 | 11.2%(+11.6)#1,302 |
| 48. | 23879 | 22.6% | 12.1%(+10.5)#48 | 11.2%(+11.4)#1,343 |
| 49. | 24086 | 22.5% | 12.1%(+10.3)#49 | 11.2%(+11.3)#1,372 |
| 50. | 22663 | 22.2% | 12.1%(+10.1)#50 | 11.2%(+11.0)#1,408 |
| 51. | 23923 | 22.2% | 12.1%(+10.0)#51 | 11.2%(+11.0)#1,441 |
| 52. | 22834 | 22.1% | 12.1%(+9.96)#52 | 11.2%(+10.9)#1,457 |
| 53. | 22301 | 21.9% | 12.1%(+9.75)#53 | 11.2%(+10.7)#1,500 |
| 54. | 24467 | 21.8% | 12.1%(+9.62)#54 | 11.2%(+10.5)#1,527 |
| 55. | 22943 | 21.6% | 12.1%(+9.43)#55 | 11.2%(+10.4)#1,571 |
| 56. | 22206 | 21.6% | 12.1%(+9.43)#56 | 11.2%(+10.3)#1,574 |
| 57. | 22307 | 21.5% | 12.1%(+9.35)#57 | 11.2%(+10.3)#1,596 |
| 58. | 22810 | 21.4% | 12.1%(+9.26)#58 | 11.2%(+10.2)#1,617 |
| 59. | 22435 | 21.3% | 12.1%(+9.14)#59 | 11.2%(+10.1)#1,643 |
| 60. | 23169 | 21.2% | 12.1%(+9.09)#60 | 11.2%(+10.0)#1,655 |
| 61. | 24347 | 21.2% | 12.1%(+9.04)#61 | 11.2%(+9.96)#1,668 |
| 62. | 24011 | 21.1% | 12.1%(+9.01)#62 | 11.2%(+9.94)#1,674 |
| 63. | 20143 | 21.1% | 12.1%(+9.00)#63 | 11.2%(+9.92)#1,678 |
| 64. | 24607 | 21.1% | 12.1%(+8.99)#64 | 11.2%(+9.91)#1,680 |
| 65. | 23517 | 20.9% | 12.1%(+8.77)#65 | 11.2%(+9.69)#1,735 |
| 66. | 22213 | 20.7% | 12.1%(+8.59)#66 | 11.2%(+9.51)#1,802 |
| 67. | 23665 | 20.7% | 12.1%(+8.57)#67 | 11.2%(+9.49)#1,809 |
| 68. | 23507 | 20.4% | 12.1%(+8.28)#68 | 11.2%(+9.20)#1,902 |
| 69. | 23226 | 20.3% | 12.1%(+8.13)#69 | 11.2%(+9.05)#1,938 |
| 70. | 24128 | 20.1% | 12.1%(+7.92)#70 | 11.2%(+8.85)#1,996 |
| 71. | 22308 | 20.0% | 12.1%(+7.91)#71 | 11.2%(+8.83)#2,000 |
| 72. | 23221 | 20.0% | 12.1%(+7.89)#72 | 11.2%(+8.81)#2,004 |
| 73. | 23846 | 20.0% | 12.1%(+7.87)#73 | 11.2%(+8.79)#2,014 |
| 74. | 24161 | 20.0% | 12.1%(+7.87)#74 | 11.2%(+8.79)#2,015 |
| 75. | 22932 | 19.9% | 12.1%(+7.80)#75 | 11.2%(+8.72)#2,042 |
| 76. | 20198 | 19.7% | 12.1%(+7.58)#76 | 11.2%(+8.50)#2,122 |
| 77. | 24243 | 19.7% | 12.1%(+7.58)#77 | 11.2%(+8.50)#2,124 |
| 78. | 22101 | 19.7% | 12.1%(+7.55)#78 | 11.2%(+8.47)#2,128 |
| 79. | 22511 | 19.6% | 12.1%(+7.50)#79 | 11.2%(+8.42)#2,149 |
| 80. | 22578 | 19.5% | 12.1%(+7.38)#80 | 11.2%(+8.30)#2,193 |
| 81. | 23508 | 19.5% | 12.1%(+7.33)#81 | 11.2%(+8.25)#2,210 |
| 82. | 22730 | 19.3% | 12.1%(+7.18)#82 | 11.2%(+8.10)#2,263 |
| 83. | 24450 | 19.2% | 12.1%(+7.11)#83 | 11.2%(+8.04)#2,290 |
| 84. | 23405 | 19.2% | 12.1%(+7.06)#84 | 11.2%(+7.98)#2,310 |
| 85. | 20124 | 19.2% | 12.1%(+7.06)#85 | 11.2%(+7.98)#2,314 |
| 86. | 22436 | 19.1% | 12.1%(+6.95)#86 | 11.2%(+7.87)#2,356 |
| 87. | 23235 | 19.0% | 12.1%(+6.89)#87 | 11.2%(+7.81)#2,389 |
| 88. | 23146 | 18.9% | 12.1%(+6.76)#88 | 11.2%(+7.69)#2,434 |
| 89. | 23511 | 18.9% | 12.1%(+6.75)#89 | 11.2%(+7.67)#2,438 |
| 90. | 23128 | 18.8% | 12.1%(+6.71)#90 | 11.2%(+7.63)#2,452 |
| 91. | 23225 | 18.7% | 12.1%(+6.59)#91 | 11.2%(+7.51)#2,506 |
| 92. | 23219 | 18.7% | 12.1%(+6.56)#92 | 11.2%(+7.48)#2,513 |
| 93. | 22911 | 18.6% | 12.1%(+6.46)#93 | 11.2%(+7.38)#2,557 |
| 94. | 22201 | 18.5% | 12.1%(+6.40)#94 | 11.2%(+7.32)#2,584 |
| 95. | 22448 | 18.5% | 12.1%(+6.36)#95 | 11.2%(+7.28)#2,598 |
| 96. | 24248 | 18.3% | 12.1%(+6.20)#96 | 11.2%(+7.12)#2,661 |
| 97. | 22656 | 18.3% | 12.1%(+6.13)#97 | 11.2%(+7.05)#2,688 |
| 98. | 24503 | 18.1% | 12.1%(+6.00)#98 | 11.2%(+6.92)#2,752 |
| 99. | 22840 | 18.0% | 12.1%(+5.87)#99 | 11.2%(+6.79)#2,805 |
| 100. | 23668 | 18.0% | 12.1%(+5.87)#100 | 11.2%(+6.79)#2,808 |
Common Questions
What are the Top 10 Zip Codes with the Highest Percentage of Population Employed in Community & Social Service in Virginia?
Top 10 Zip Codes with the Highest Percentage of Population Employed in Community & Social Service in Virginia are:
What zip code has the Highest Percentage of Population Employed in Community & Social Service in Virginia?
22211 has the Highest Percentage of Population Employed in Community & Social Service in Virginia with 80.0%.
What is the Percentage of Population Employed in Community & Social Service in the State of Virginia?
Percentage of Population Employed in Community & Social Service in Virginia is 12.1%.
What is the Percentage of Population Employed in Community & Social Service in the United States?
Percentage of Population Employed in Community & Social Service in the United States is 11.2%.