Zip Codes with the Highest Percentage of Population Employed in Community & Social Service in Farmville, VA
RELATED REPORTS & OPTIONS
Community & Social Service
Farmville
Compare Zip Codes
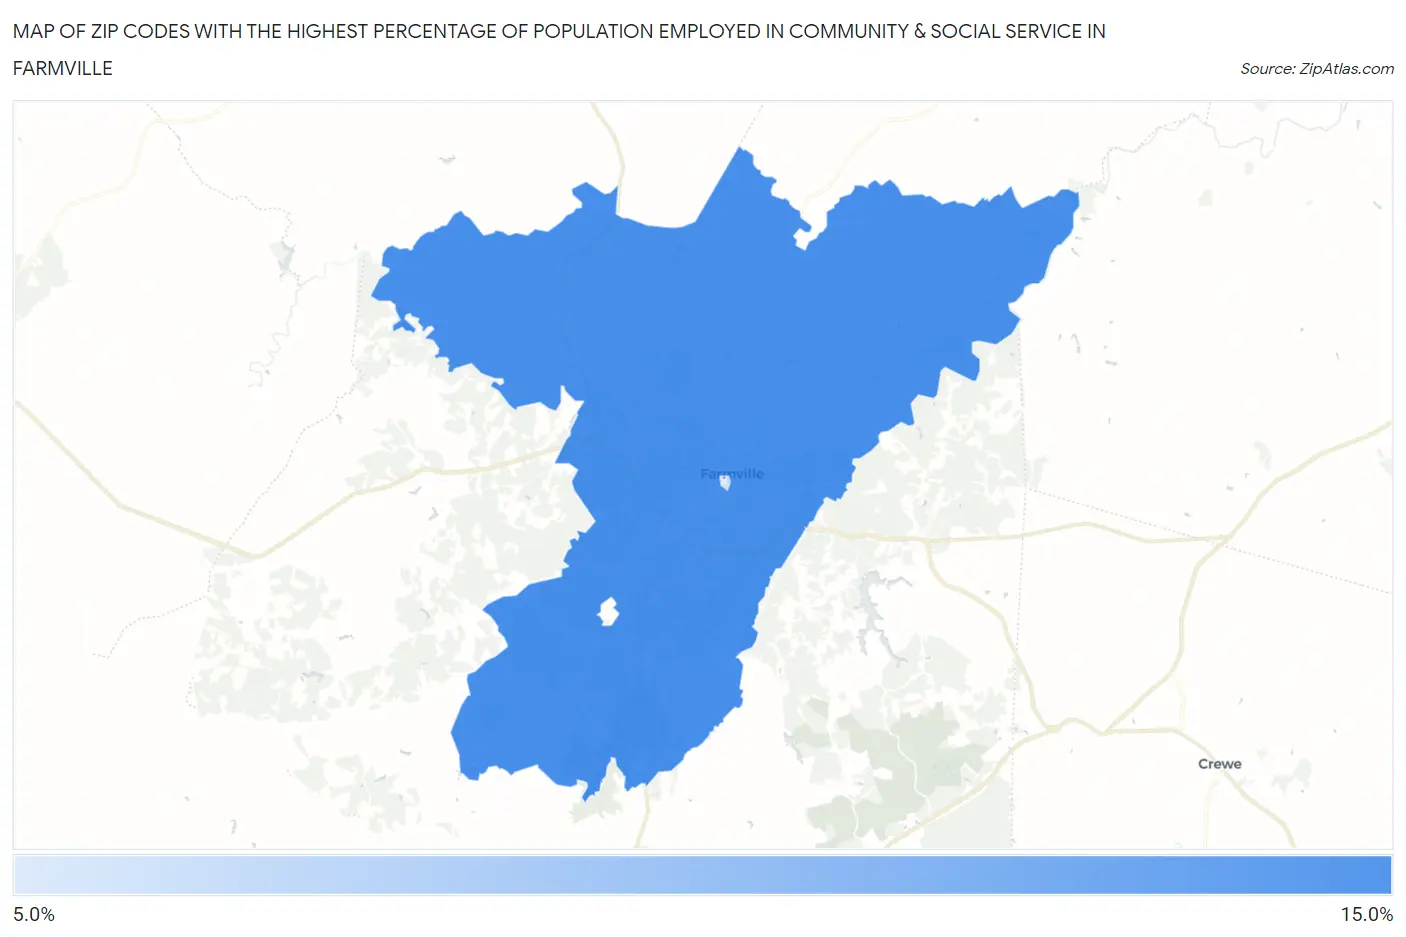
Map of Zip Codes with the Highest Percentage of Population Employed in Community & Social Service in Farmville
7.6%
12.1%
Zip Codes with the Highest Percentage of Population Employed in Community & Social Service in Farmville, VA
| Zip Code | % Employed | vs State | vs National | |
| 1. | 23901 | 12.1% | 12.1%(-0.059)#283 | 11.2%(+0.862)#9,223 |
| 2. | 23909 | 7.6% | 12.1%(-4.52)#576 | 11.2%(-3.60)#20,611 |
1
Common Questions
What are the Top Zip Codes with the Highest Percentage of Population Employed in Community & Social Service in Farmville, VA?
Top Zip Codes with the Highest Percentage of Population Employed in Community & Social Service in Farmville, VA are:
What zip code has the Highest Percentage of Population Employed in Community & Social Service in Farmville, VA?
23901 has the Highest Percentage of Population Employed in Community & Social Service in Farmville, VA with 12.1%.
What is the Percentage of Population Employed in Community & Social Service in Farmville, VA?
Percentage of Population Employed in Community & Social Service in Farmville is 18.1%.
What is the Percentage of Population Employed in Community & Social Service in Virginia?
Percentage of Population Employed in Community & Social Service in Virginia is 12.1%.
What is the Percentage of Population Employed in Community & Social Service in the United States?
Percentage of Population Employed in Community & Social Service in the United States is 11.2%.