Zip Codes with the Highest Percentage of Population Employed in Installation, Maintenance & Repair in Bay City, MI
RELATED REPORTS & OPTIONS
Installation, Maintenance & Repair
Bay City
Compare Zip Codes
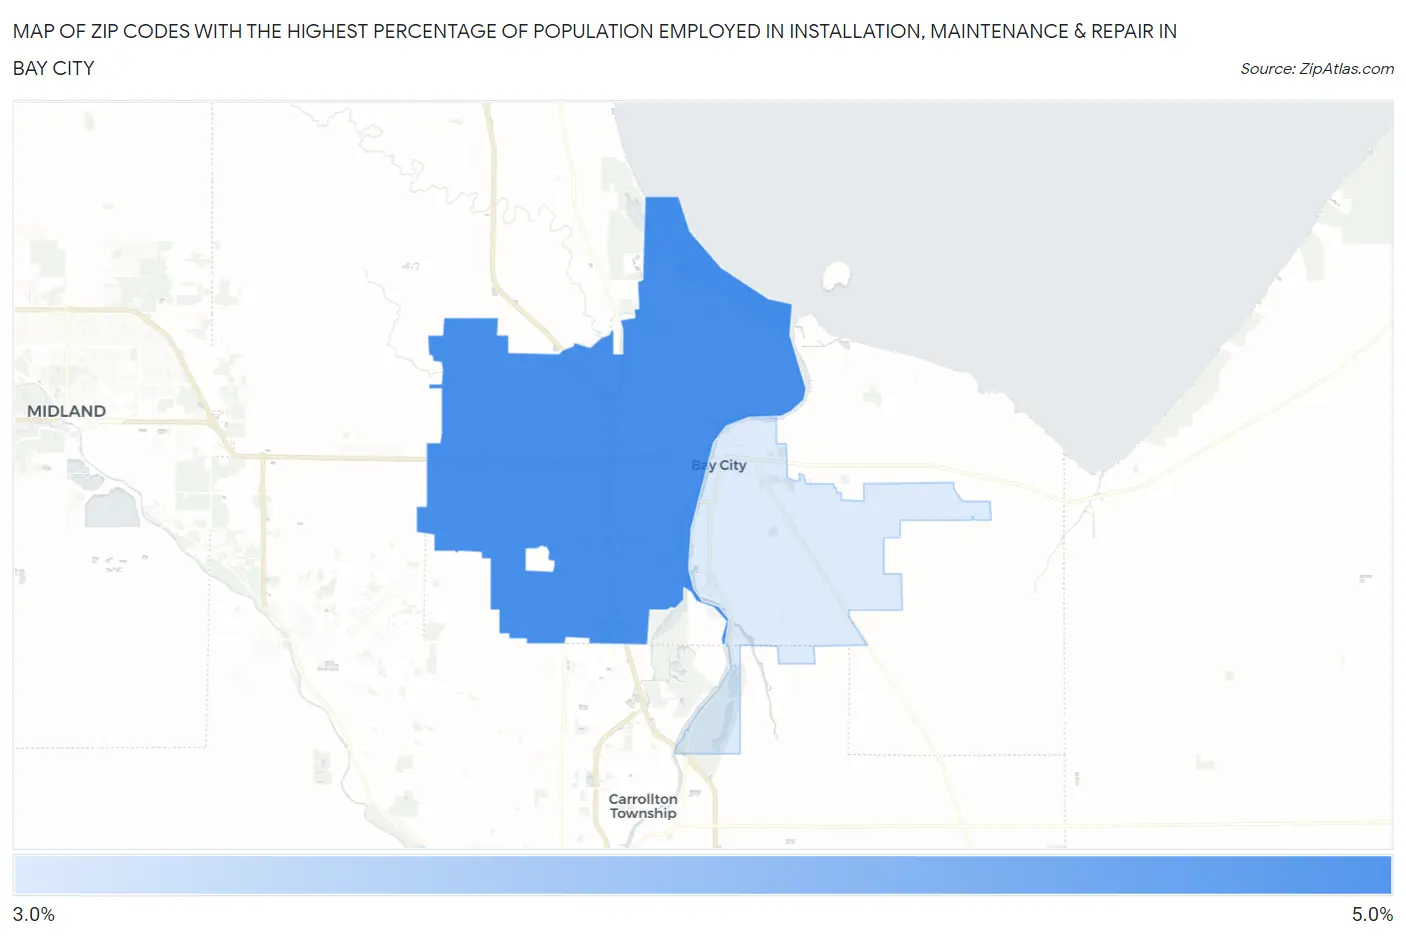
Map of Zip Codes with the Highest Percentage of Population Employed in Installation, Maintenance & Repair in Bay City
3.6%
4.6%
Zip Codes with the Highest Percentage of Population Employed in Installation, Maintenance & Repair in Bay City, MI
| Zip Code | % Employed | vs State | vs National | |
| 1. | 48706 | 4.6% | 3.1%(+1.54)#332 | 3.1%(+1.57)#9,909 |
| 2. | 48708 | 3.6% | 3.1%(+0.543)#487 | 3.1%(+0.575)#13,961 |
1
Common Questions
What are the Top Zip Codes with the Highest Percentage of Population Employed in Installation, Maintenance & Repair in Bay City, MI?
Top Zip Codes with the Highest Percentage of Population Employed in Installation, Maintenance & Repair in Bay City, MI are:
What zip code has the Highest Percentage of Population Employed in Installation, Maintenance & Repair in Bay City, MI?
48706 has the Highest Percentage of Population Employed in Installation, Maintenance & Repair in Bay City, MI with 4.6%.
What is the Percentage of Population Employed in Installation, Maintenance & Repair in Bay City, MI?
Percentage of Population Employed in Installation, Maintenance & Repair in Bay City is 3.1%.
What is the Percentage of Population Employed in Installation, Maintenance & Repair in Michigan?
Percentage of Population Employed in Installation, Maintenance & Repair in Michigan is 3.1%.
What is the Percentage of Population Employed in Installation, Maintenance & Repair in the United States?
Percentage of Population Employed in Installation, Maintenance & Repair in the United States is 3.1%.