Zip Codes with the Highest Percentage of Population Employed in Installation, Maintenance & Repair in Dearborn Heights, MI
RELATED REPORTS & OPTIONS
Installation, Maintenance & Repair
Dearborn Heights
Compare Zip Codes
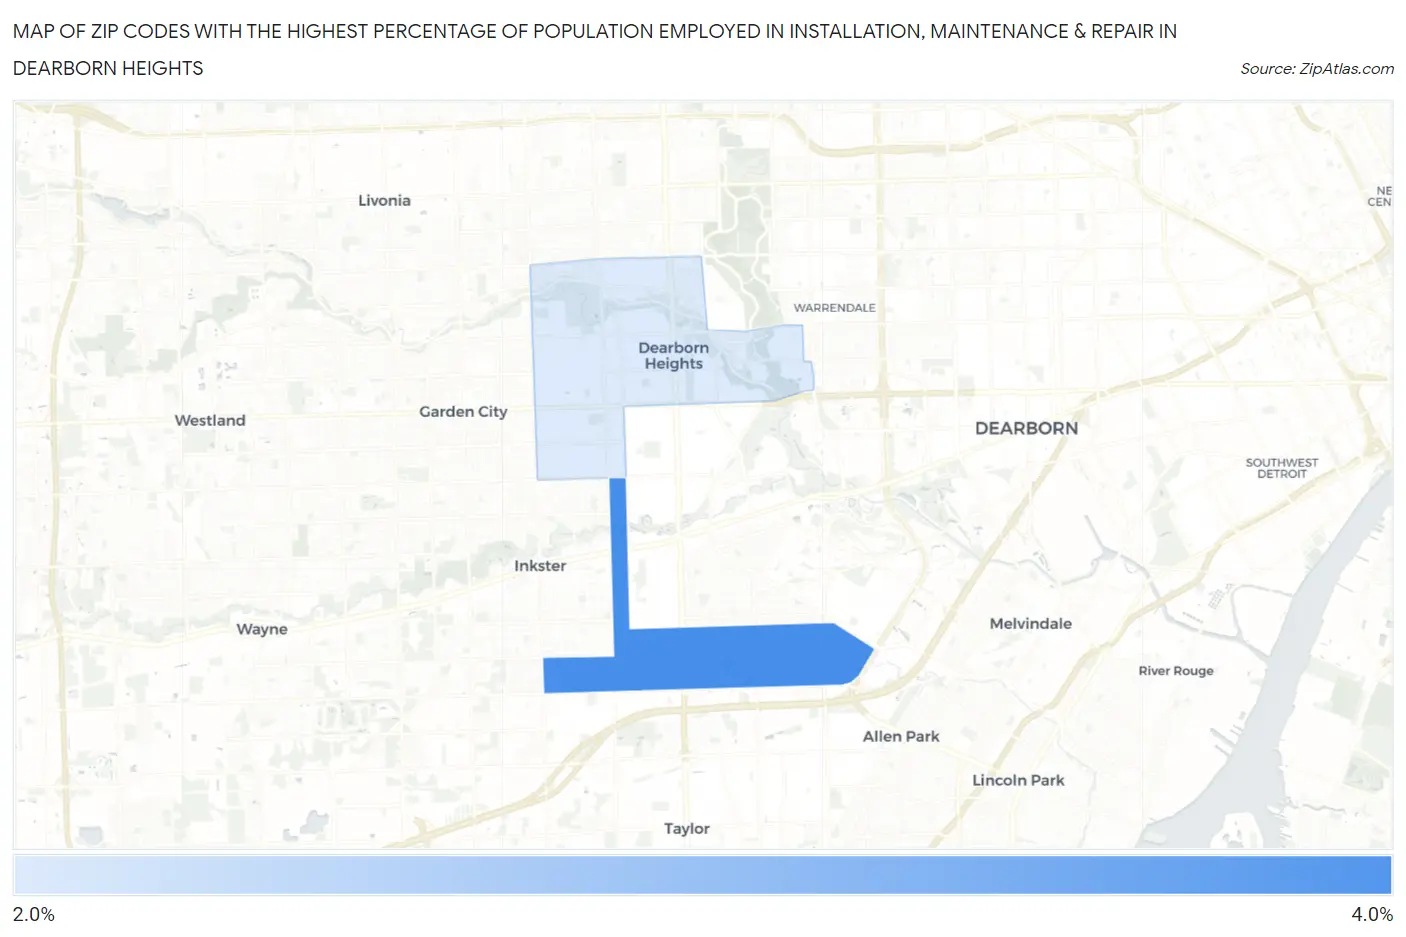
Map of Zip Codes with the Highest Percentage of Population Employed in Installation, Maintenance & Repair in Dearborn Heights
2.0%
3.3%
Zip Codes with the Highest Percentage of Population Employed in Installation, Maintenance & Repair in Dearborn Heights, MI
| Zip Code | % Employed | vs State | vs National | |
| 1. | 48125 | 3.3% | 3.1%(+0.164)#564 | 3.1%(+0.195)#15,734 |
| 2. | 48127 | 2.0% | 3.1%(-1.07)#763 | 3.1%(-1.04)#21,860 |
1
Common Questions
What are the Top Zip Codes with the Highest Percentage of Population Employed in Installation, Maintenance & Repair in Dearborn Heights, MI?
Top Zip Codes with the Highest Percentage of Population Employed in Installation, Maintenance & Repair in Dearborn Heights, MI are:
What zip code has the Highest Percentage of Population Employed in Installation, Maintenance & Repair in Dearborn Heights, MI?
48125 has the Highest Percentage of Population Employed in Installation, Maintenance & Repair in Dearborn Heights, MI with 3.3%.
What is the Percentage of Population Employed in Installation, Maintenance & Repair in Dearborn Heights, MI?
Percentage of Population Employed in Installation, Maintenance & Repair in Dearborn Heights is 2.5%.
What is the Percentage of Population Employed in Installation, Maintenance & Repair in Michigan?
Percentage of Population Employed in Installation, Maintenance & Repair in Michigan is 3.1%.
What is the Percentage of Population Employed in Installation, Maintenance & Repair in the United States?
Percentage of Population Employed in Installation, Maintenance & Repair in the United States is 3.1%.