Zip Codes with the Highest Percentage of Population Employed in Installation, Maintenance & Repair in Howell, MI
RELATED REPORTS & OPTIONS
Installation, Maintenance & Repair
Howell
Compare Zip Codes
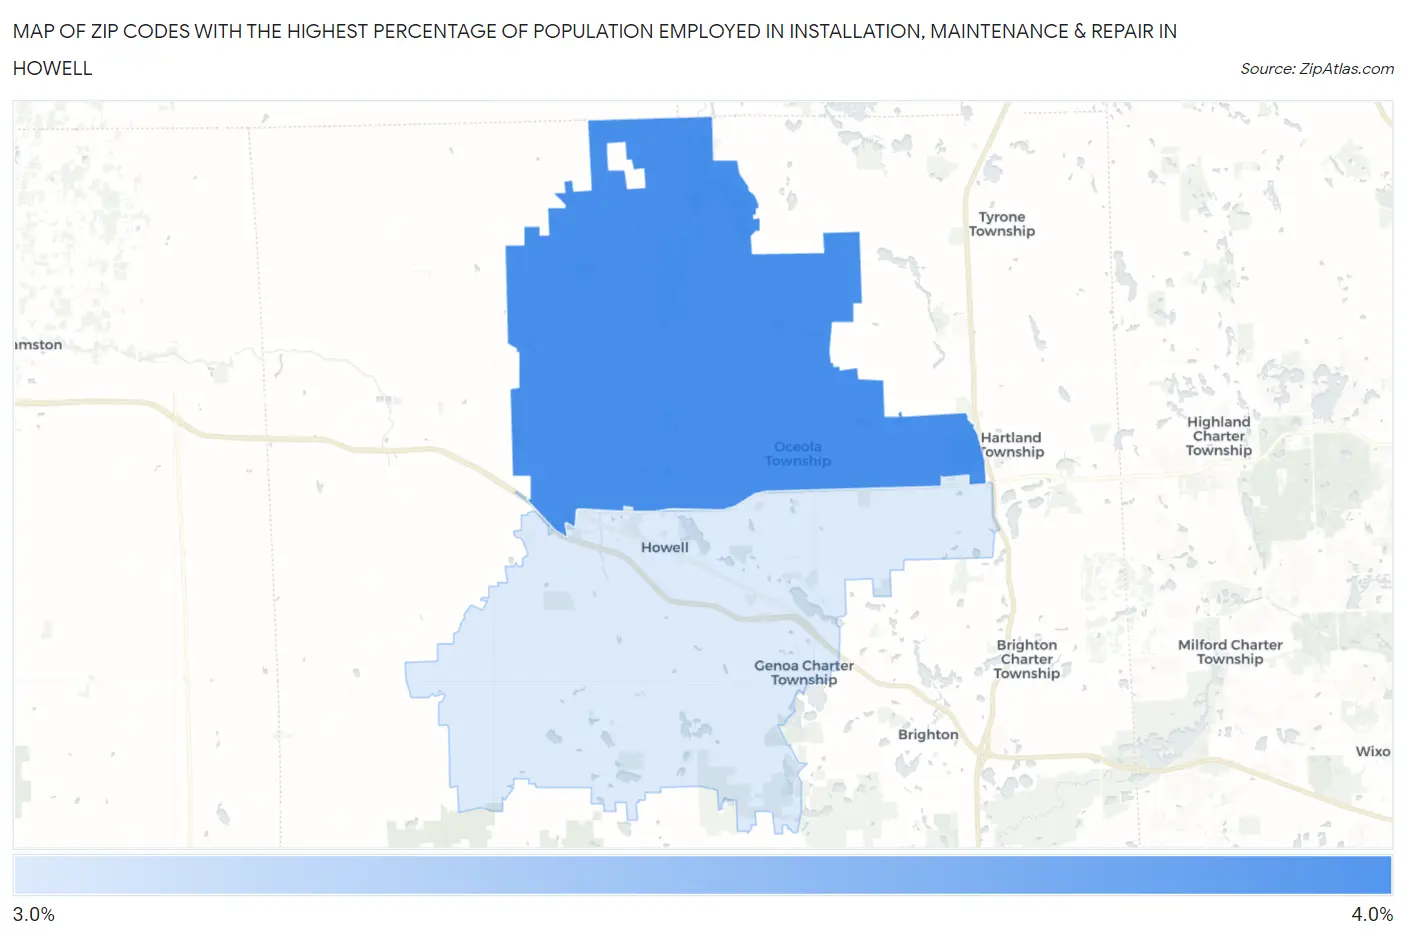
Map of Zip Codes with the Highest Percentage of Population Employed in Installation, Maintenance & Repair in Howell
3.5%
3.7%
Zip Codes with the Highest Percentage of Population Employed in Installation, Maintenance & Repair in Howell, MI
| Zip Code | % Employed | vs State | vs National | |
| 1. | 48855 | 3.7% | 3.1%(+0.605)#478 | 3.1%(+0.637)#13,642 |
| 2. | 48843 | 3.5% | 3.1%(+0.449)#500 | 3.1%(+0.481)#14,390 |
1
Common Questions
What are the Top Zip Codes with the Highest Percentage of Population Employed in Installation, Maintenance & Repair in Howell, MI?
Top Zip Codes with the Highest Percentage of Population Employed in Installation, Maintenance & Repair in Howell, MI are:
What zip code has the Highest Percentage of Population Employed in Installation, Maintenance & Repair in Howell, MI?
48855 has the Highest Percentage of Population Employed in Installation, Maintenance & Repair in Howell, MI with 3.7%.
What is the Percentage of Population Employed in Installation, Maintenance & Repair in Howell, MI?
Percentage of Population Employed in Installation, Maintenance & Repair in Howell is 2.8%.
What is the Percentage of Population Employed in Installation, Maintenance & Repair in Michigan?
Percentage of Population Employed in Installation, Maintenance & Repair in Michigan is 3.1%.
What is the Percentage of Population Employed in Installation, Maintenance & Repair in the United States?
Percentage of Population Employed in Installation, Maintenance & Repair in the United States is 3.1%.