De Tour Village, MI Map & Demographics
De Tour Village Map
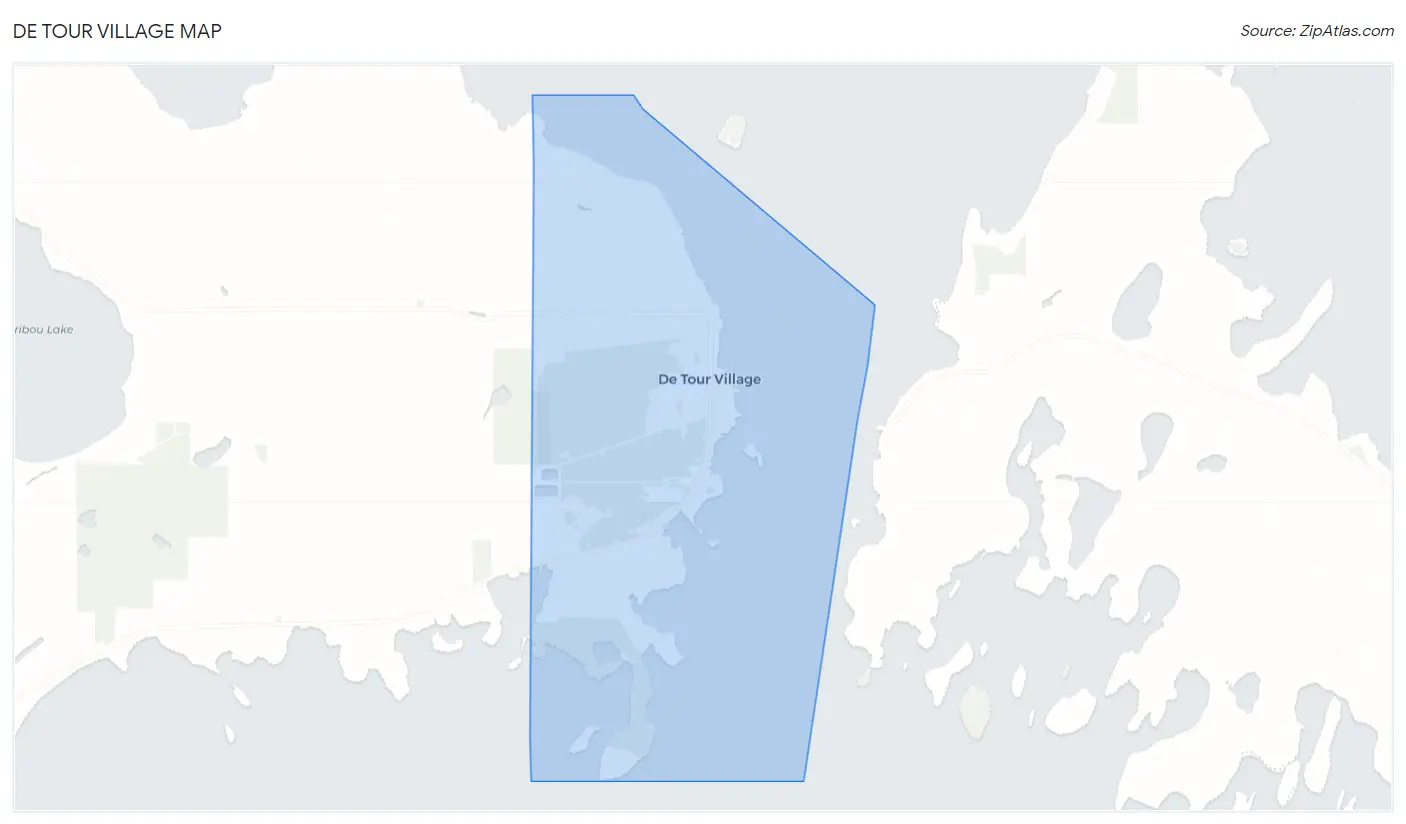
De Tour Village Overview
$33,909
PER CAPITA INCOME
$66,875
AVG FAMILY INCOME
$45,313
AVG HOUSEHOLD INCOME
10.5%
WAGE / INCOME GAP [ % ]
89.5¢/ $1
WAGE / INCOME GAP [ $ ]
0.39
INEQUALITY / GINI INDEX
226
TOTAL POPULATION
113
MALE POPULATION
113
FEMALE POPULATION
100.00
MALES / 100 FEMALES
100.00
FEMALES / 100 MALES
66.1
MEDIAN AGE
3.0
AVG FAMILY SIZE
1.8
AVG HOUSEHOLD SIZE
76
LABOR FORCE [ PEOPLE ]
36.7%
PERCENT IN LABOR FORCE
3.9%
UNEMPLOYMENT RATE
De Tour Village Zip Codes
De Tour Village Area Codes
Income in De Tour Village
Income Overview in De Tour Village
Per Capita Income in De Tour Village is $33,909, while median incomes of families and households are $66,875 and $45,313 respectively.
| Characteristic | Number | Measure |
| Per Capita Income | 226 | $33,909 |
| Median Family Income | 47 | $66,875 |
| Mean Family Income | 47 | $86,198 |
| Median Household Income | 127 | $45,313 |
| Mean Household Income | 127 | $55,212 |
| Income Deficit | 47 | $0 |
| Wage / Income Gap (%) | 226 | 10.53% |
| Wage / Income Gap ($) | 226 | 89.47¢ per $1 |
| Gini / Inequality Index | 226 | 0.39 |
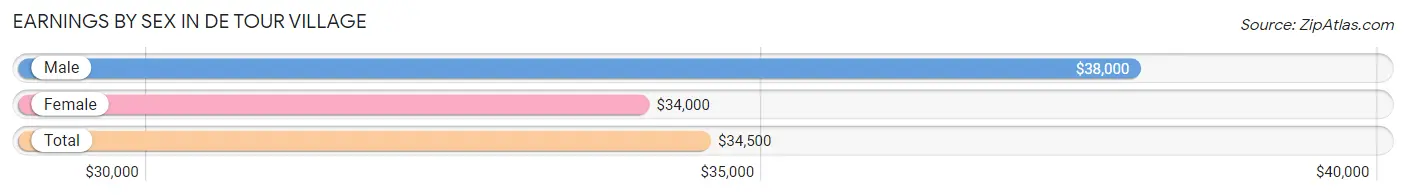
Earnings by Sex in De Tour Village
Average Earnings in De Tour Village are $34,500, $38,000 for men and $34,000 for women, a difference of 10.5%.
| Sex | Number | Average Earnings |
| Male | 50 (61.0%) | $38,000 |
| Female | 32 (39.0%) | $34,000 |
| Total | 82 (100.0%) | $34,500 |
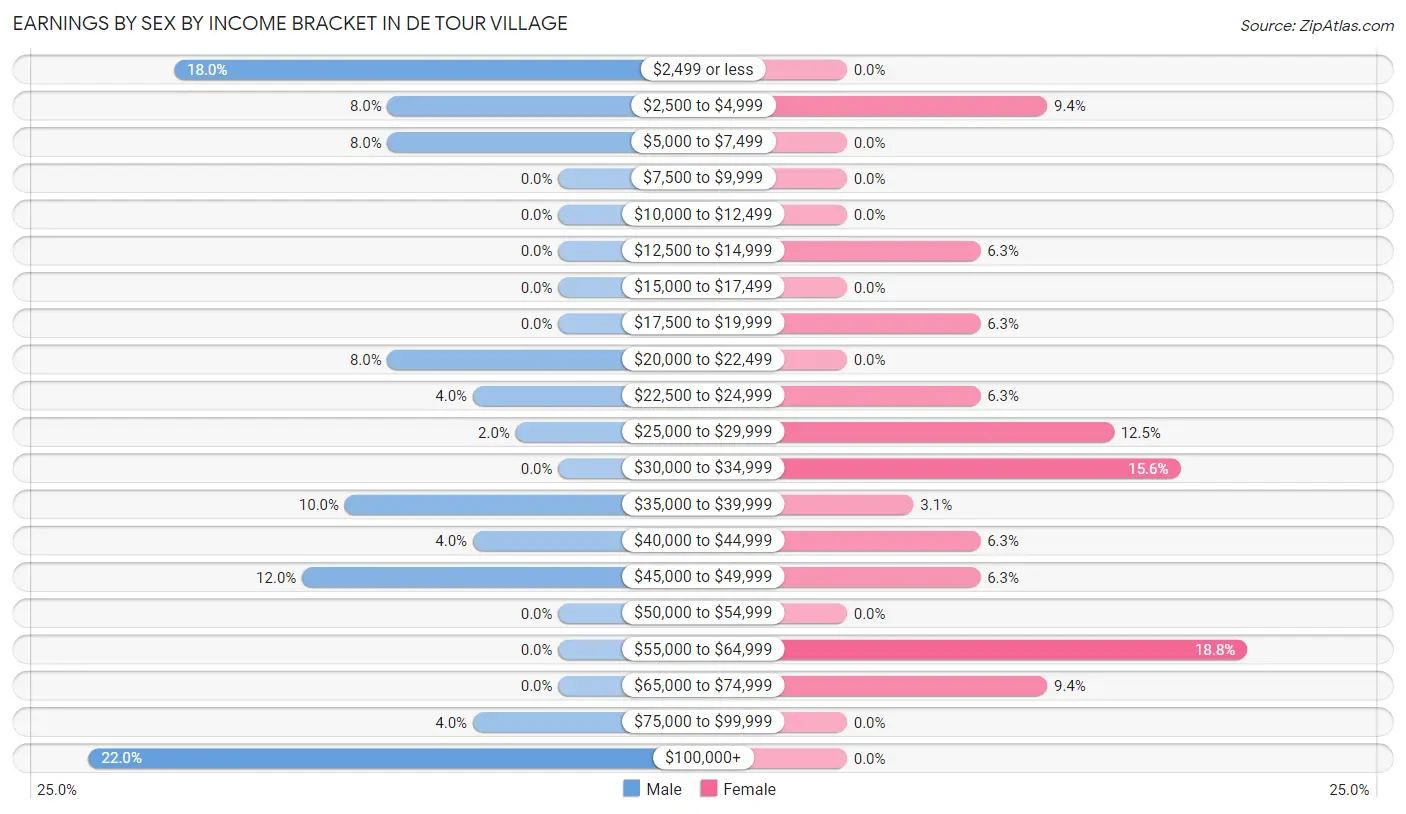
Earnings by Sex by Income Bracket in De Tour Village
The most common earnings brackets in De Tour Village are $100,000+ for men (11 | 22.0%) and $55,000 to $64,999 for women (6 | 18.8%).
| Income | Male | Female |
| $2,499 or less | 9 (18.0%) | 0 (0.0%) |
| $2,500 to $4,999 | 4 (8.0%) | 3 (9.4%) |
| $5,000 to $7,499 | 4 (8.0%) | 0 (0.0%) |
| $7,500 to $9,999 | 0 (0.0%) | 0 (0.0%) |
| $10,000 to $12,499 | 0 (0.0%) | 0 (0.0%) |
| $12,500 to $14,999 | 0 (0.0%) | 2 (6.2%) |
| $15,000 to $17,499 | 0 (0.0%) | 0 (0.0%) |
| $17,500 to $19,999 | 0 (0.0%) | 2 (6.2%) |
| $20,000 to $22,499 | 4 (8.0%) | 0 (0.0%) |
| $22,500 to $24,999 | 2 (4.0%) | 2 (6.2%) |
| $25,000 to $29,999 | 1 (2.0%) | 4 (12.5%) |
| $30,000 to $34,999 | 0 (0.0%) | 5 (15.6%) |
| $35,000 to $39,999 | 5 (10.0%) | 1 (3.1%) |
| $40,000 to $44,999 | 2 (4.0%) | 2 (6.2%) |
| $45,000 to $49,999 | 6 (12.0%) | 2 (6.2%) |
| $50,000 to $54,999 | 0 (0.0%) | 0 (0.0%) |
| $55,000 to $64,999 | 0 (0.0%) | 6 (18.8%) |
| $65,000 to $74,999 | 0 (0.0%) | 3 (9.4%) |
| $75,000 to $99,999 | 2 (4.0%) | 0 (0.0%) |
| $100,000+ | 11 (22.0%) | 0 (0.0%) |
| Total | 50 (100.0%) | 32 (100.0%) |
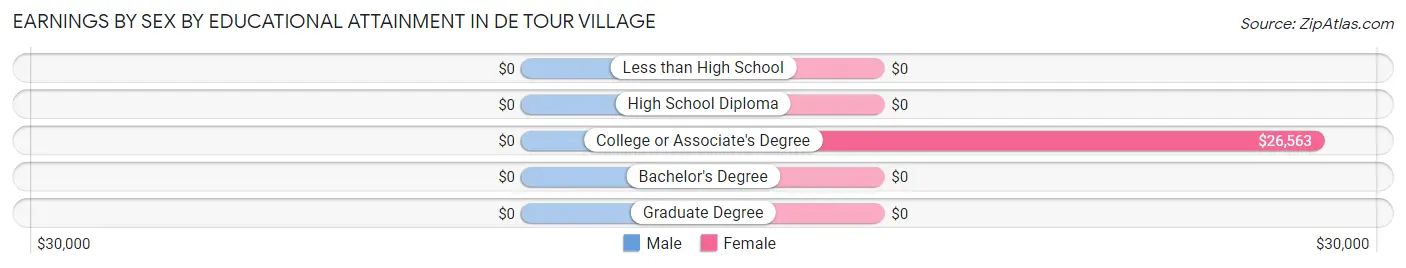
Earnings by Sex by Educational Attainment in De Tour Village
| Educational Attainment | Male Income | Female Income |
| Less than High School | - | - |
| High School Diploma | - | - |
| College or Associate's Degree | - | - |
| Bachelor's Degree | - | - |
| Graduate Degree | - | - |
| Total | $38,000 | $34,000 |
Family Income in De Tour Village
Family Income Brackets in De Tour Village
According to the De Tour Village family income data, there are 14 families falling into the $100,000 to $149,999 income range, which is the most common income bracket and makes up 29.8% of all families.
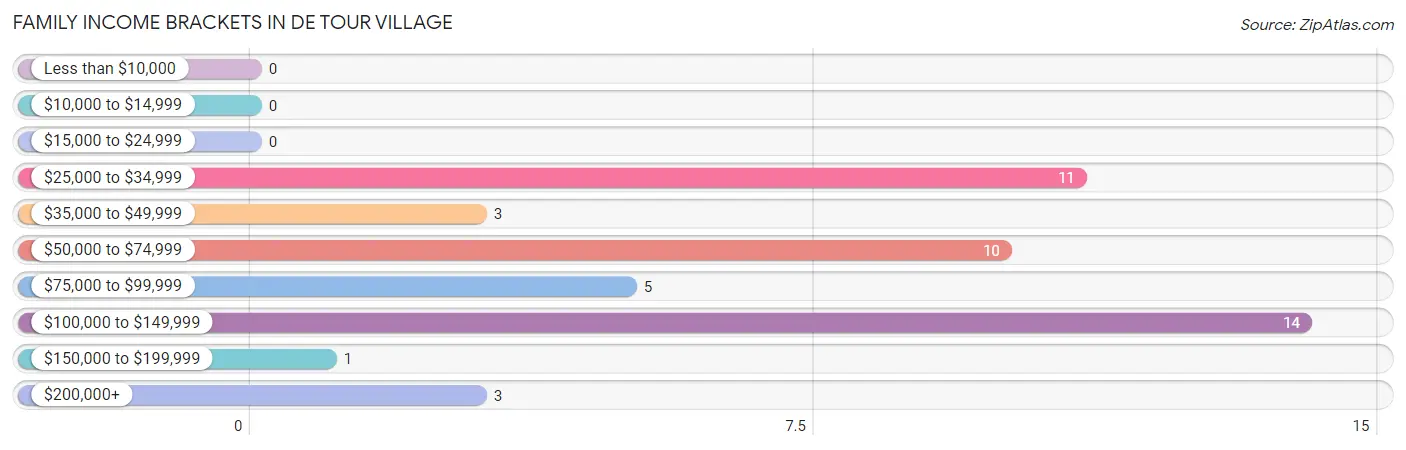
| Income Bracket | # Families | % Families |
| Less than $10,000 | 0 | 0.0% |
| $10,000 to $14,999 | 0 | 0.0% |
| $15,000 to $24,999 | 0 | 0.0% |
| $25,000 to $34,999 | 11 | 23.4% |
| $35,000 to $49,999 | 3 | 6.4% |
| $50,000 to $74,999 | 10 | 21.3% |
| $75,000 to $99,999 | 5 | 10.6% |
| $100,000 to $149,999 | 14 | 29.8% |
| $150,000 to $199,999 | 1 | 2.1% |
| $200,000+ | 3 | 6.4% |
Family Income by Famaliy Size in De Tour Village
2-person families (31 | 66.0%) account for the highest median family income in De Tour Village with $60,938 per family, while 2-person families (31 | 66.0%) have the highest median income of $30,469 per family member.
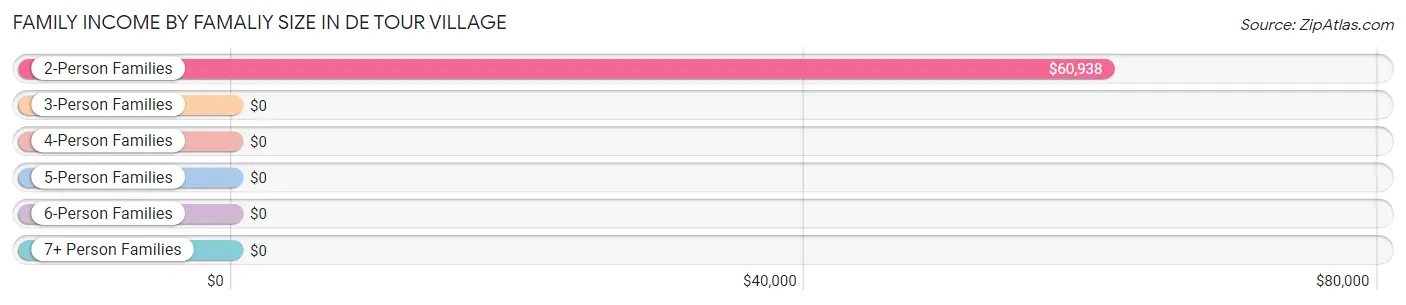
| Income Bracket | # Families | Median Income |
| 2-Person Families | 31 (66.0%) | $60,938 |
| 3-Person Families | 10 (21.3%) | $0 |
| 4-Person Families | 3 (6.4%) | $0 |
| 5-Person Families | 3 (6.4%) | $0 |
| 6-Person Families | 0 (0.0%) | $0 |
| 7+ Person Families | 0 (0.0%) | $0 |
| Total | 47 (100.0%) | $66,875 |
Family Income by Number of Earners in De Tour Village
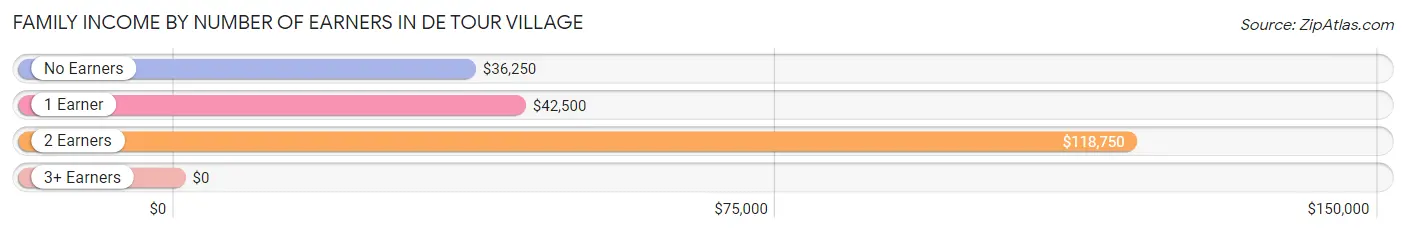
| Number of Earners | # Families | Median Income |
| No Earners | 14 (29.8%) | $36,250 |
| 1 Earner | 10 (21.3%) | $42,500 |
| 2 Earners | 23 (48.9%) | $118,750 |
| 3+ Earners | 0 (0.0%) | $0 |
| Total | 47 (100.0%) | $66,875 |
Household Income in De Tour Village
Household Income Brackets in De Tour Village
With 32 households falling in the category, the $50,000 to $74,999 income range is the most frequent in De Tour Village, accounting for 25.2% of all households. In contrast, only 1 households (0.8%) fall into the $150,000 to $199,999 income bracket, making it the least populous group.
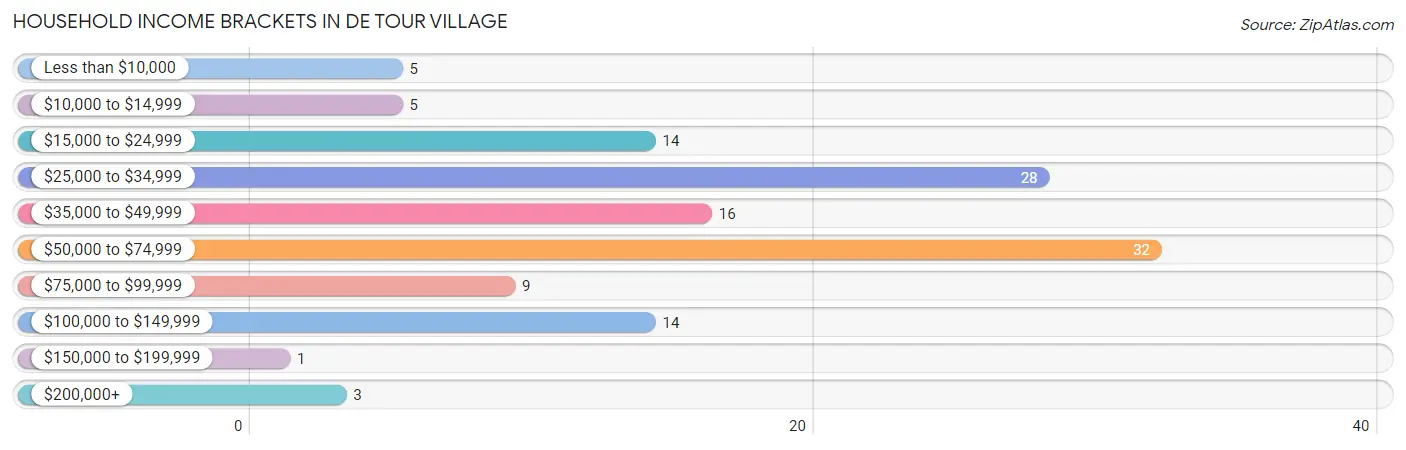
| Income Bracket | # Households | % Households |
| Less than $10,000 | 5 | 3.9% |
| $10,000 to $14,999 | 5 | 3.9% |
| $15,000 to $24,999 | 14 | 11.0% |
| $25,000 to $34,999 | 28 | 22.0% |
| $35,000 to $49,999 | 16 | 12.6% |
| $50,000 to $74,999 | 32 | 25.2% |
| $75,000 to $99,999 | 9 | 7.1% |
| $100,000 to $149,999 | 14 | 11.0% |
| $150,000 to $199,999 | 1 | 0.8% |
| $200,000+ | 3 | 2.4% |
Household Income by Householder Age in De Tour Village
The median household income in De Tour Village is $45,313, with the highest median household income of $64,000 found in the 45 to 64 years age bracket for the primary householder. A total of 22 households (17.3%) fall into this category.
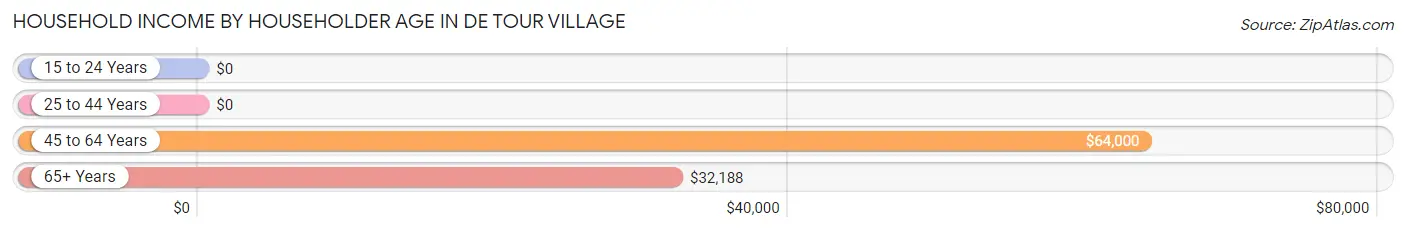
| Income Bracket | # Households | Median Income |
| 15 to 24 Years | 0 (0.0%) | $0 |
| 25 to 44 Years | 19 (15.0%) | $0 |
| 45 to 64 Years | 22 (17.3%) | $64,000 |
| 65+ Years | 86 (67.7%) | $32,188 |
| Total | 127 (100.0%) | $45,313 |
Poverty in De Tour Village
Income Below Poverty by Sex and Age in De Tour Village
With 10.6% poverty level for males and 1.8% for females among the residents of De Tour Village, 25 to 34 year old males and 55 to 64 year old females are the most vulnerable to poverty, with 7 males (50.0%) and 2 females (22.2%) in their respective age groups living below the poverty level.
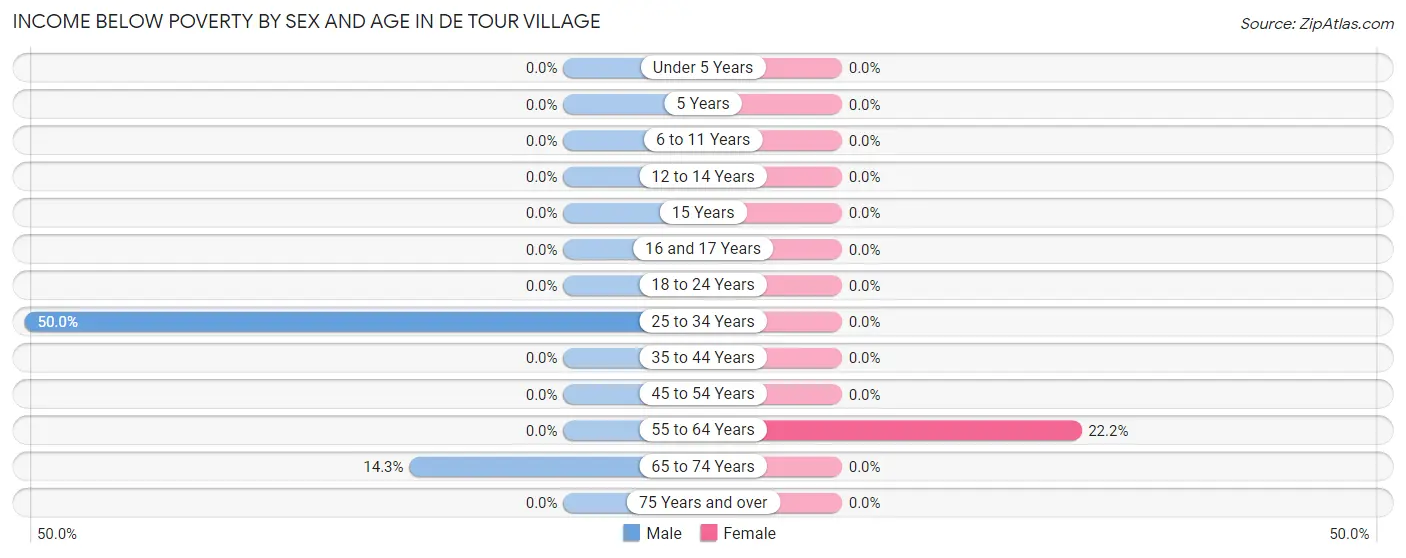
| Age Bracket | Male | Female |
| Under 5 Years | 0 (0.0%) | 0 (0.0%) |
| 5 Years | 0 (0.0%) | 0 (0.0%) |
| 6 to 11 Years | 0 (0.0%) | 0 (0.0%) |
| 12 to 14 Years | 0 (0.0%) | 0 (0.0%) |
| 15 Years | 0 (0.0%) | 0 (0.0%) |
| 16 and 17 Years | 0 (0.0%) | 0 (0.0%) |
| 18 to 24 Years | 0 (0.0%) | 0 (0.0%) |
| 25 to 34 Years | 7 (50.0%) | 0 (0.0%) |
| 35 to 44 Years | 0 (0.0%) | 0 (0.0%) |
| 45 to 54 Years | 0 (0.0%) | 0 (0.0%) |
| 55 to 64 Years | 0 (0.0%) | 2 (22.2%) |
| 65 to 74 Years | 5 (14.3%) | 0 (0.0%) |
| 75 Years and over | 0 (0.0%) | 0 (0.0%) |
| Total | 12 (10.6%) | 2 (1.8%) |
Income Above Poverty by Sex and Age in De Tour Village
According to the poverty statistics in De Tour Village, males aged under 5 years and females aged 6 to 11 years are the age groups that are most secure financially, with 100.0% of males and 100.0% of females in these age groups living above the poverty line.
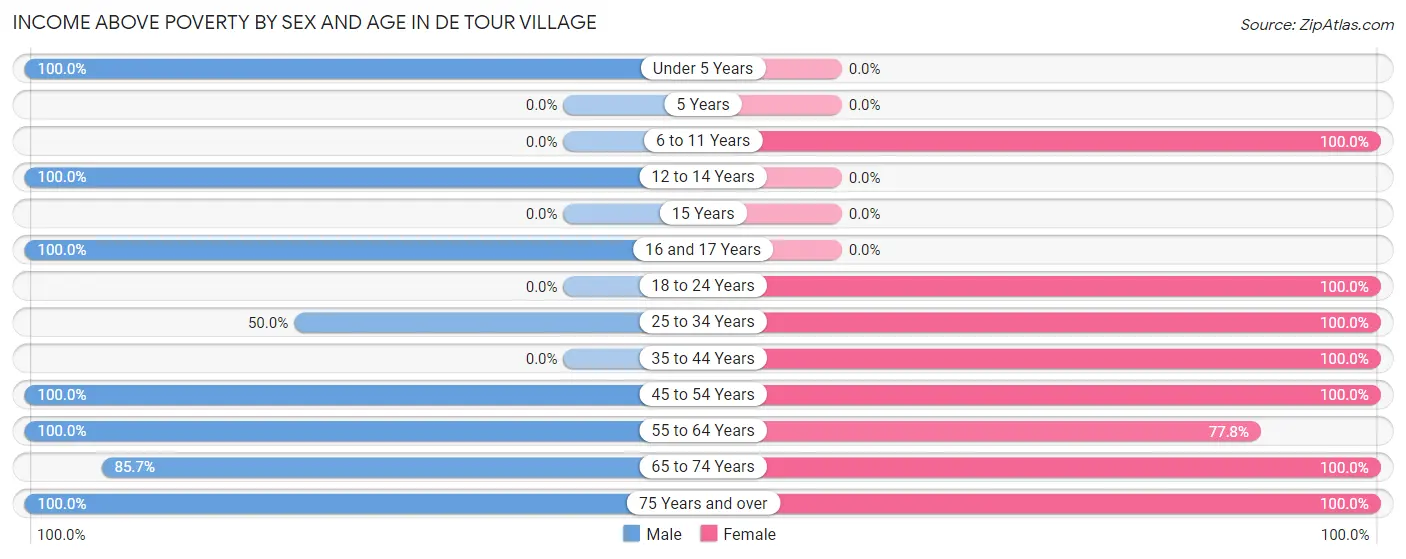
| Age Bracket | Male | Female |
| Under 5 Years | 6 (100.0%) | 0 (0.0%) |
| 5 Years | 0 (0.0%) | 0 (0.0%) |
| 6 to 11 Years | 0 (0.0%) | 10 (100.0%) |
| 12 to 14 Years | 3 (100.0%) | 0 (0.0%) |
| 15 Years | 0 (0.0%) | 0 (0.0%) |
| 16 and 17 Years | 3 (100.0%) | 0 (0.0%) |
| 18 to 24 Years | 0 (0.0%) | 5 (100.0%) |
| 25 to 34 Years | 7 (50.0%) | 4 (100.0%) |
| 35 to 44 Years | 0 (0.0%) | 5 (100.0%) |
| 45 to 54 Years | 22 (100.0%) | 21 (100.0%) |
| 55 to 64 Years | 9 (100.0%) | 7 (77.8%) |
| 65 to 74 Years | 30 (85.7%) | 37 (100.0%) |
| 75 Years and over | 21 (100.0%) | 22 (100.0%) |
| Total | 101 (89.4%) | 111 (98.2%) |
Income Below Poverty Among Married-Couple Families in De Tour Village
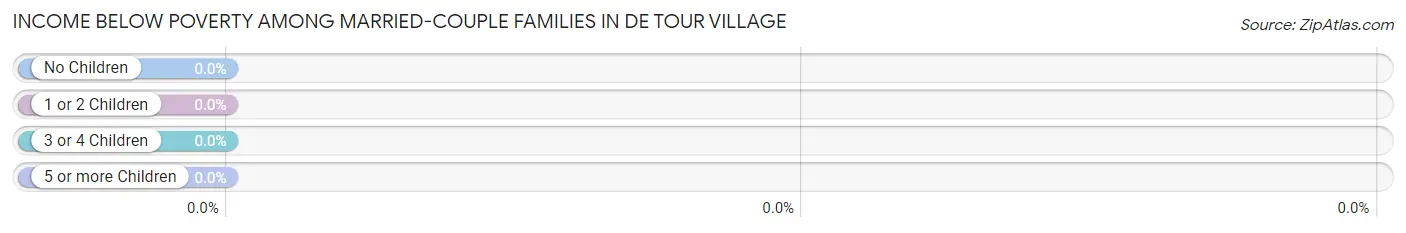
| Children | Above Poverty | Below Poverty |
| No Children | 31 (100.0%) | 0 (0.0%) |
| 1 or 2 Children | 9 (100.0%) | 0 (0.0%) |
| 3 or 4 Children | 3 (100.0%) | 0 (0.0%) |
| 5 or more Children | 0 (0.0%) | 0 (0.0%) |
| Total | 43 (100.0%) | 0 (0.0%) |
Income Below Poverty Among Single-Parent Households in De Tour Village
| Children | Single Father | Single Mother |
| No Children | 0 (0.0%) | 0 (0.0%) |
| 1 or 2 Children | 0 (0.0%) | 0 (0.0%) |
| 3 or 4 Children | 0 (0.0%) | 0 (0.0%) |
| 5 or more Children | 0 (0.0%) | 0 (0.0%) |
| Total | 0 (0.0%) | 0 (0.0%) |
Income Below Poverty Among Married-Couple vs Single-Parent Households in De Tour Village
| Children | Married-Couple Families | Single-Parent Households |
| No Children | 0 (0.0%) | 0 (0.0%) |
| 1 or 2 Children | 0 (0.0%) | 0 (0.0%) |
| 3 or 4 Children | 0 (0.0%) | 0 (0.0%) |
| 5 or more Children | 0 (0.0%) | 0 (0.0%) |
| Total | 0 (0.0%) | 0 (0.0%) |
Race in De Tour Village
The most populous races in De Tour Village are White / Caucasian (177 | 78.3%), Native / Alaskan (26 | 11.5%), and Two or more Races (20 | 8.8%).
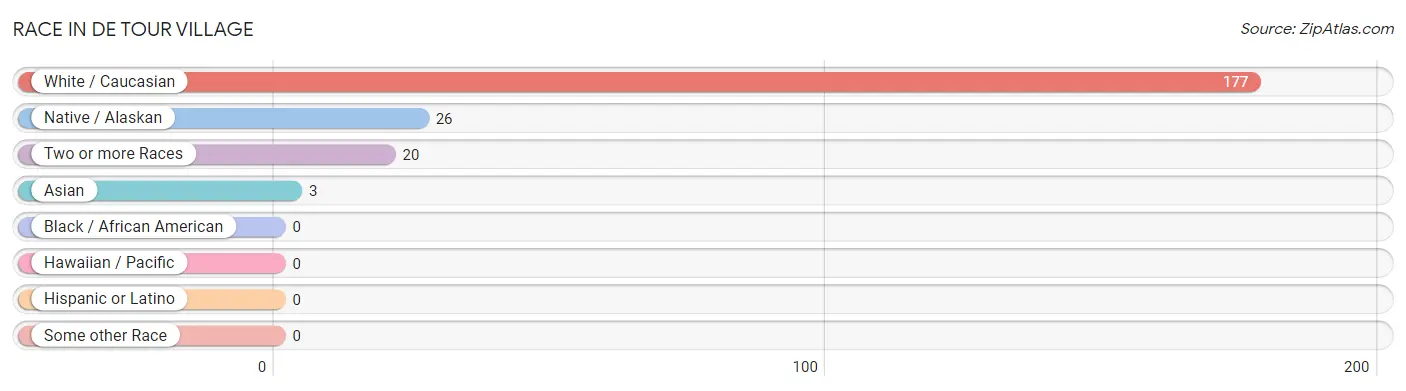
| Race | # Population | % Population |
| Asian | 3 | 1.3% |
| Black / African American | 0 | 0.0% |
| Hawaiian / Pacific | 0 | 0.0% |
| Hispanic or Latino | 0 | 0.0% |
| Native / Alaskan | 26 | 11.5% |
| White / Caucasian | 177 | 78.3% |
| Two or more Races | 20 | 8.8% |
| Some other Race | 0 | 0.0% |
| Total | 226 | 100.0% |
Ancestry in De Tour Village
The most populous ancestries reported in De Tour Village are German (38 | 16.8%), English (30 | 13.3%), Chippewa (26 | 11.5%), Irish (26 | 11.5%), and Polish (20 | 8.8%), together accounting for 61.9% of all De Tour Village residents.
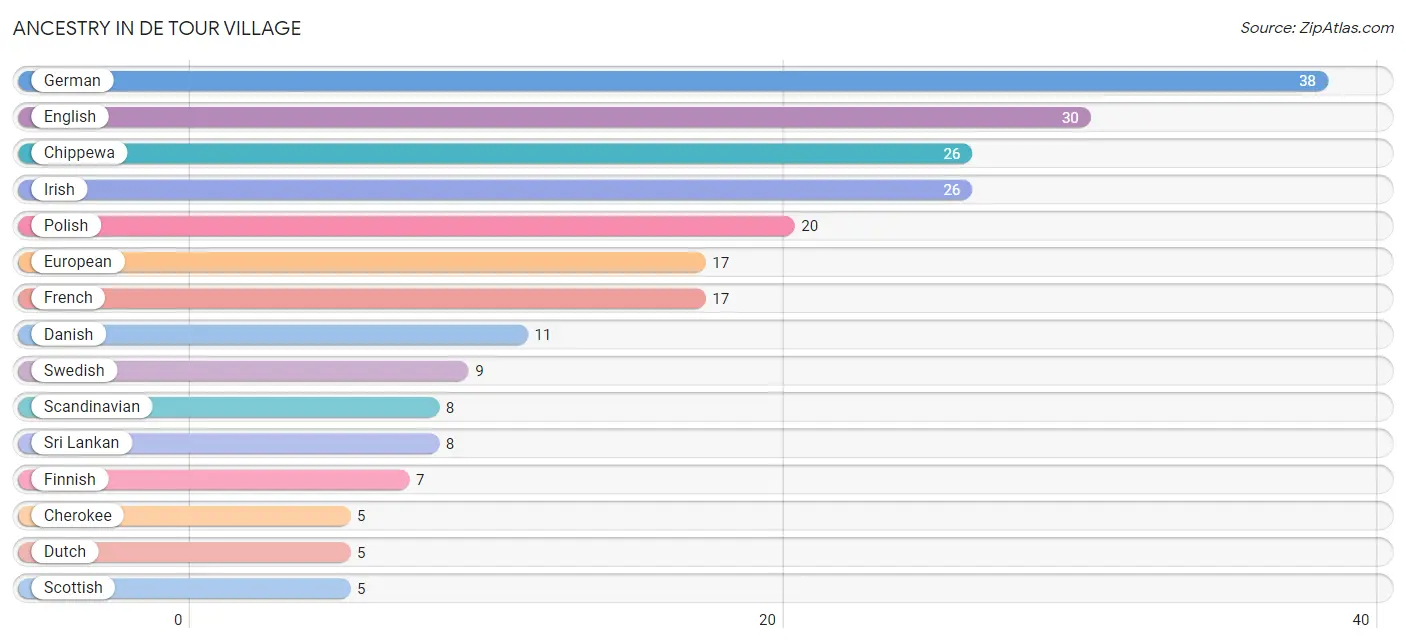
| Ancestry | # Population | % Population |
| American | 3 | 1.3% |
| Belgian | 2 | 0.9% |
| Cherokee | 5 | 2.2% |
| Chippewa | 26 | 11.5% |
| Danish | 11 | 4.9% |
| Dutch | 5 | 2.2% |
| English | 30 | 13.3% |
| European | 17 | 7.5% |
| Finnish | 7 | 3.1% |
| French | 17 | 7.5% |
| French Canadian | 2 | 0.9% |
| German | 38 | 16.8% |
| Hungarian | 3 | 1.3% |
| Irish | 26 | 11.5% |
| Italian | 2 | 0.9% |
| Norwegian | 1 | 0.4% |
| Polish | 20 | 8.8% |
| Russian | 3 | 1.3% |
| Scandinavian | 8 | 3.5% |
| Scotch-Irish | 3 | 1.3% |
| Scottish | 5 | 2.2% |
| Sri Lankan | 8 | 3.5% |
| Swedish | 9 | 4.0% | View All 23 Rows |
Immigrants in De Tour Village
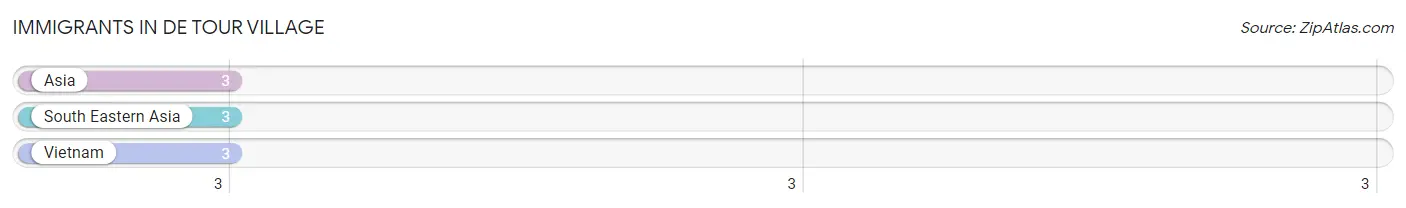
The most numerous immigrant groups reported in De Tour Village came from Asia (3 | 1.3%), South Eastern Asia (3 | 1.3%), and Vietnam (3 | 1.3%), together accounting for 4.0% of all De Tour Village residents.
| Immigration Origin | # Population | % Population |
| Asia | 3 | 1.3% |
| South Eastern Asia | 3 | 1.3% |
| Vietnam | 3 | 1.3% | View All 3 Rows |
Sex and Age in De Tour Village
Sex and Age in De Tour Village
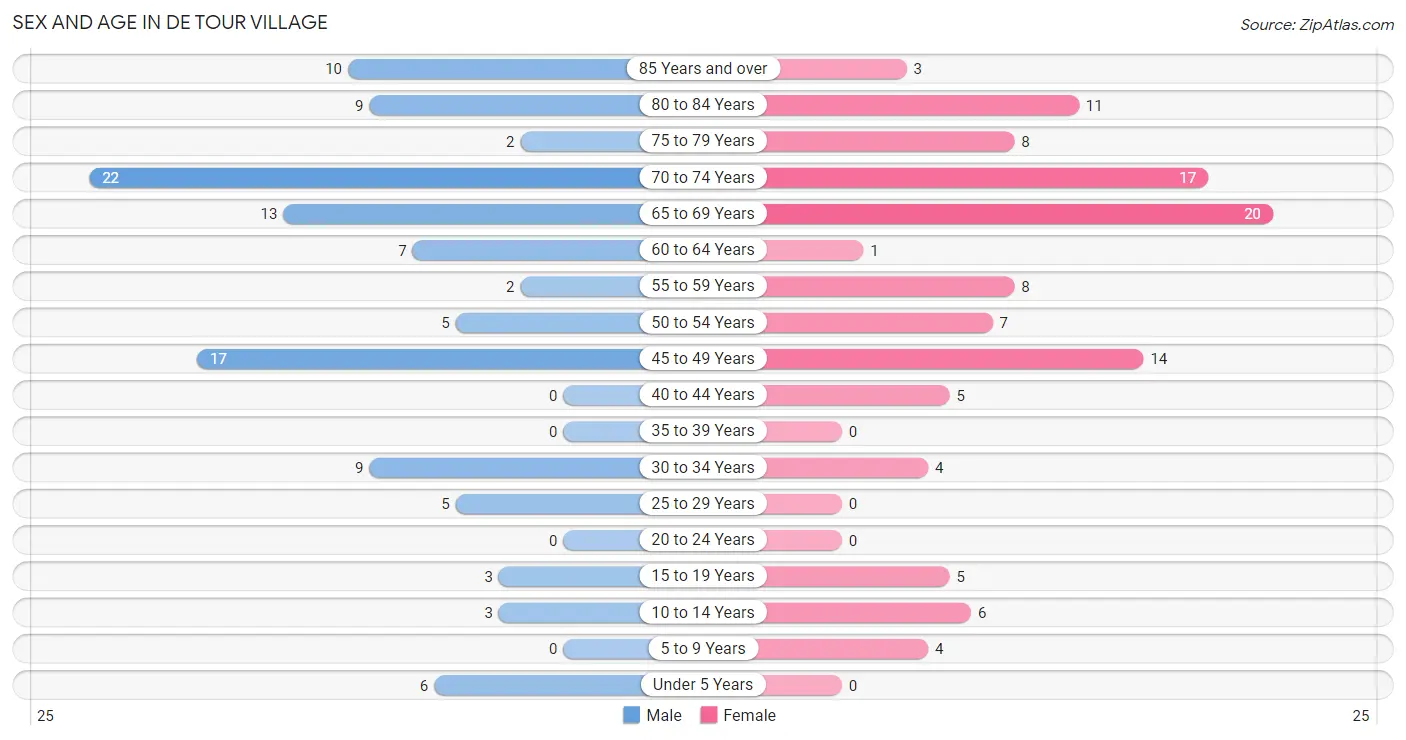
The most populous age groups in De Tour Village are 70 to 74 Years (22 | 19.5%) for men and 65 to 69 Years (20 | 17.7%) for women.
| Age Bracket | Male | Female |
| Under 5 Years | 6 (5.3%) | 0 (0.0%) |
| 5 to 9 Years | 0 (0.0%) | 4 (3.5%) |
| 10 to 14 Years | 3 (2.6%) | 6 (5.3%) |
| 15 to 19 Years | 3 (2.6%) | 5 (4.4%) |
| 20 to 24 Years | 0 (0.0%) | 0 (0.0%) |
| 25 to 29 Years | 5 (4.4%) | 0 (0.0%) |
| 30 to 34 Years | 9 (8.0%) | 4 (3.5%) |
| 35 to 39 Years | 0 (0.0%) | 0 (0.0%) |
| 40 to 44 Years | 0 (0.0%) | 5 (4.4%) |
| 45 to 49 Years | 17 (15.0%) | 14 (12.4%) |
| 50 to 54 Years | 5 (4.4%) | 7 (6.2%) |
| 55 to 59 Years | 2 (1.8%) | 8 (7.1%) |
| 60 to 64 Years | 7 (6.2%) | 1 (0.9%) |
| 65 to 69 Years | 13 (11.5%) | 20 (17.7%) |
| 70 to 74 Years | 22 (19.5%) | 17 (15.0%) |
| 75 to 79 Years | 2 (1.8%) | 8 (7.1%) |
| 80 to 84 Years | 9 (8.0%) | 11 (9.7%) |
| 85 Years and over | 10 (8.8%) | 3 (2.6%) |
| Total | 113 (100.0%) | 113 (100.0%) |
Families and Households in De Tour Village
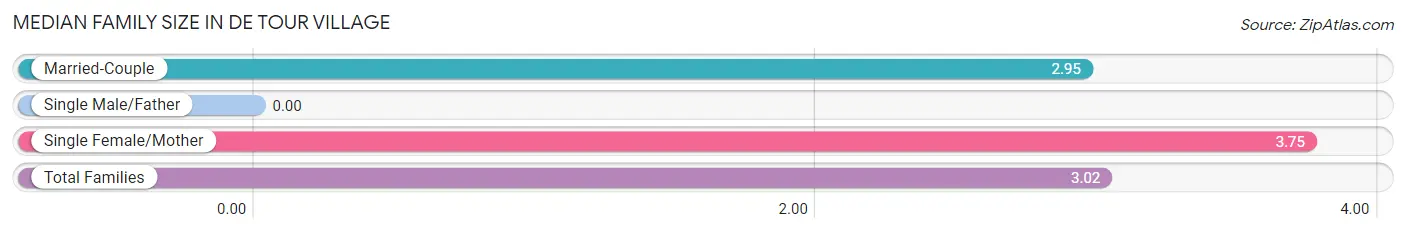
Median Family Size in De Tour Village
| Family Type | # Families | Family Size |
| Married-Couple | 43 (91.5%) | 2.95 |
| Single Male/Father | 0 (0.0%) | - |
| Single Female/Mother | 4 (8.5%) | 3.75 |
| Total Families | 47 (100.0%) | 3.02 |
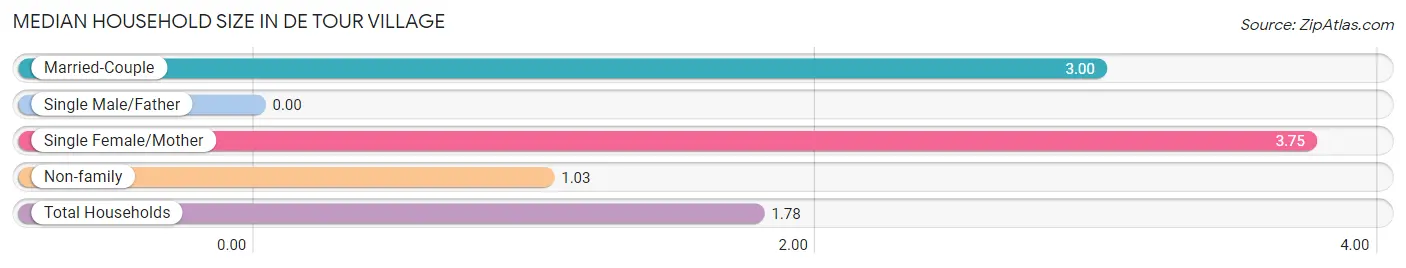
Median Household Size in De Tour Village
| Household Type | # Households | Household Size |
| Married-Couple | 43 (33.9%) | 3.00 |
| Single Male/Father | 0 (0.0%) | - |
| Single Female/Mother | 4 (3.2%) | 3.75 |
| Non-family | 80 (63.0%) | 1.03 |
| Total Households | 127 (100.0%) | 1.78 |
Household Size by Marriage Status in De Tour Village
Out of a total of 127 households in De Tour Village, 47 (37.0%) are family households, while 80 (63.0%) are nonfamily households. The most numerous type of family households are 2-person households, comprising 30, and the most common type of nonfamily households are 1-person households, comprising 78.
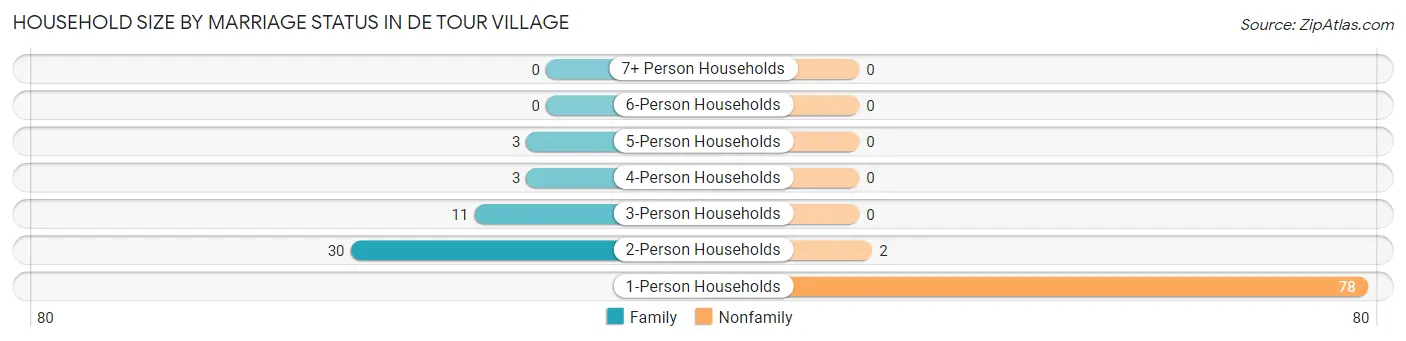
| Household Size | Family Households | Nonfamily Households |
| 1-Person Households | - | 78 (61.4%) |
| 2-Person Households | 30 (23.6%) | 2 (1.6%) |
| 3-Person Households | 11 (8.7%) | 0 (0.0%) |
| 4-Person Households | 3 (2.4%) | 0 (0.0%) |
| 5-Person Households | 3 (2.4%) | 0 (0.0%) |
| 6-Person Households | 0 (0.0%) | 0 (0.0%) |
| 7+ Person Households | 0 (0.0%) | 0 (0.0%) |
| Total | 47 (37.0%) | 80 (63.0%) |
Female Fertility in De Tour Village
Fertility by Age in De Tour Village
| Age Bracket | Women with Births | Births / 1,000 Women |
| 15 to 19 years | 0 (0.0%) | 0.0 |
| 20 to 34 years | 0 (0.0%) | 0.0 |
| 35 to 50 years | 0 (0.0%) | 0.0 |
| Total | 0 (0.0%) | 0.0 |
Fertility by Age by Marriage Status in De Tour Village
| Age Bracket | Married | Unmarried |
| 15 to 19 years | 0 (0.0%) | 0 (0.0%) |
| 20 to 34 years | 0 (0.0%) | 0 (0.0%) |
| 35 to 50 years | 0 (0.0%) | 0 (0.0%) |
| Total | 0 (0.0%) | 0 (0.0%) |
Fertility by Education in De Tour Village
| Educational Attainment | Women with Births | Births / 1,000 Women |
| Less than High School | 0 (0.0%) | 0.0 |
| High School Diploma | 0 (0.0%) | 0.0 |
| College or Associate's Degree | 0 (0.0%) | 0.0 |
| Bachelor's Degree | 0 (0.0%) | 0.0 |
| Graduate Degree | 0 (0.0%) | 0.0 |
| Total | 0 (0.0%) | 0.0 |
Fertility by Education by Marriage Status in De Tour Village
| Educational Attainment | Married | Unmarried |
| Less than High School | 0 (0.0%) | 0 (0.0%) |
| High School Diploma | 0 (0.0%) | 0 (0.0%) |
| College or Associate's Degree | 0 (0.0%) | 0 (0.0%) |
| Bachelor's Degree | 0 (0.0%) | 0 (0.0%) |
| Graduate Degree | 0 (0.0%) | 0 (0.0%) |
| Total | 0 (0.0%) | 0 (0.0%) |
Employment Characteristics in De Tour Village
Employment by Class of Employer in De Tour Village
Among the 73 employed individuals in De Tour Village, private company employees (42 | 57.5%), local government employees (12 | 16.4%), and self-employed (not incorporated) (6 | 8.2%) make up the most common classes of employment.
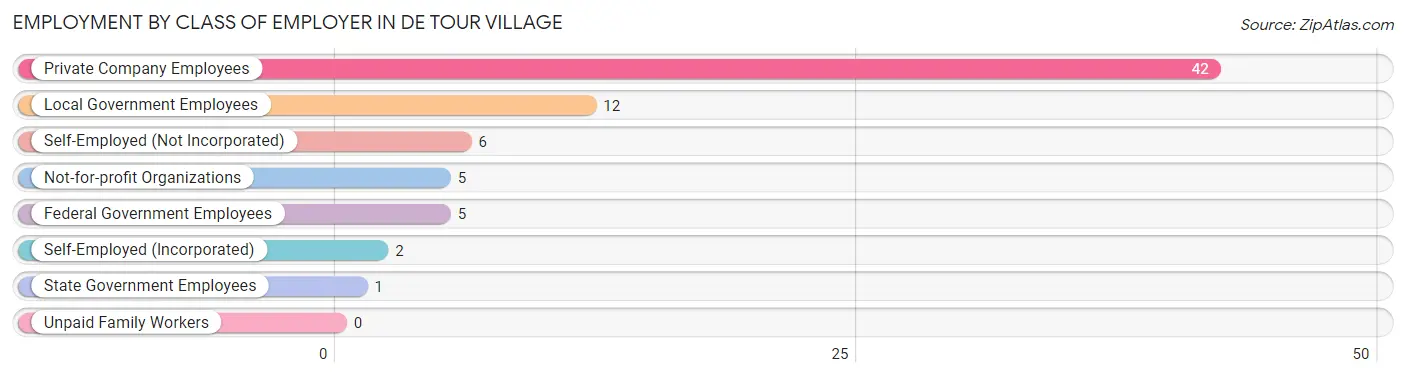
| Employer Class | # Employees | % Employees |
| Private Company Employees | 42 | 57.5% |
| Self-Employed (Incorporated) | 2 | 2.7% |
| Self-Employed (Not Incorporated) | 6 | 8.2% |
| Not-for-profit Organizations | 5 | 6.9% |
| Local Government Employees | 12 | 16.4% |
| State Government Employees | 1 | 1.4% |
| Federal Government Employees | 5 | 6.9% |
| Unpaid Family Workers | 0 | 0.0% |
| Total | 73 | 100.0% |
Employment Status by Age in De Tour Village
According to the labor force statistics for De Tour Village, out of the total population over 16 years of age (207), 36.7% or 76 individuals are in the labor force, with 3.9% or 3 of them unemployed. The age group with the highest labor force participation rate is 25 to 29 years, with 100.0% or 5 individuals in the labor force. Within the labor force, the 45 to 54 years age range has the highest percentage of unemployed individuals, with 8.1% or 3 of them being unemployed.
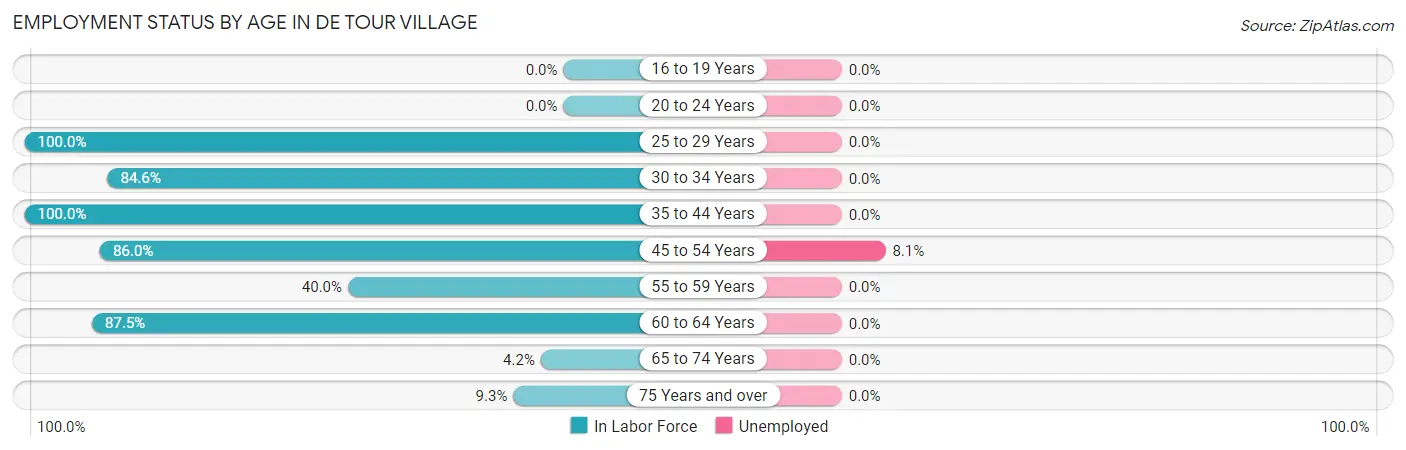
| Age Bracket | In Labor Force | Unemployed |
| 16 to 19 Years | 0 (0.0%) | 0 (0.0%) |
| 20 to 24 Years | 0 (0.0%) | 0 (0.0%) |
| 25 to 29 Years | 5 (100.0%) | 0 (0.0%) |
| 30 to 34 Years | 11 (84.6%) | 0 (0.0%) |
| 35 to 44 Years | 5 (100.0%) | 0 (0.0%) |
| 45 to 54 Years | 37 (86.0%) | 3 (8.1%) |
| 55 to 59 Years | 4 (40.0%) | 0 (0.0%) |
| 60 to 64 Years | 7 (87.5%) | 0 (0.0%) |
| 65 to 74 Years | 3 (4.2%) | 0 (0.0%) |
| 75 Years and over | 4 (9.3%) | 0 (0.0%) |
| Total | 76 (36.7%) | 3 (3.9%) |
Employment Status by Educational Attainment in De Tour Village
According to labor force statistics for De Tour Village, 82.1% of individuals (69) out of the total population between 25 and 64 years of age (84) are in the labor force, with 4.3% or 3 of them being unemployed. The group with the highest labor force participation rate are those with the educational attainment of less than high school, with 100.0% or 5 individuals in the labor force. Within the labor force, individuals with college / associate degree education have the highest percentage of unemployment, with 8.1% or 3 of them being unemployed.
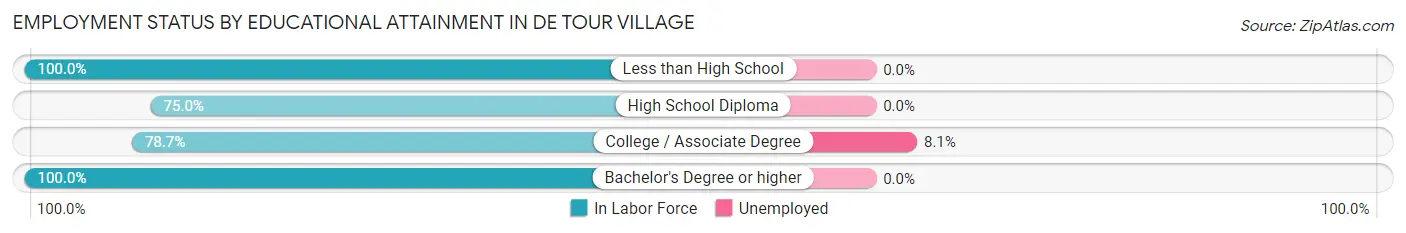
| Educational Attainment | In Labor Force | Unemployed |
| Less than High School | 5 (100.0%) | 0 (0.0%) |
| High School Diploma | 15 (75.0%) | 0 (0.0%) |
| College / Associate Degree | 37 (78.7%) | 4 (8.1%) |
| Bachelor's Degree or higher | 12 (100.0%) | 0 (0.0%) |
| Total | 69 (82.1%) | 4 (4.3%) |
Employment Occupations by Sex in De Tour Village
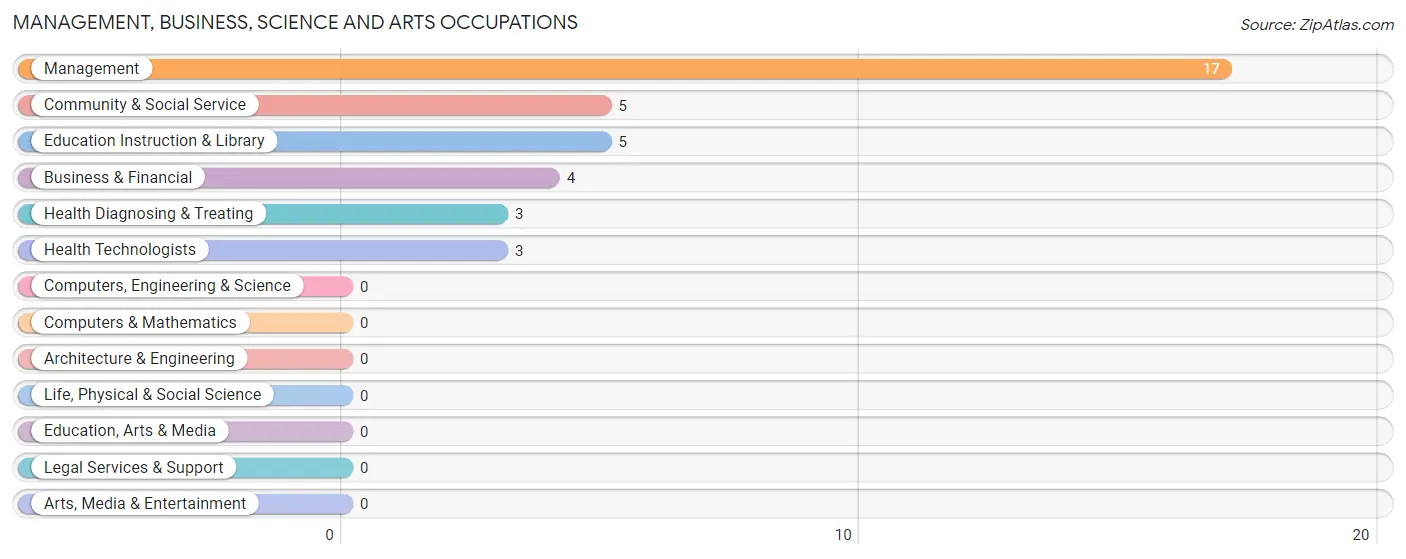
Management, Business, Science and Arts Occupations
The most common Management, Business, Science and Arts occupations in De Tour Village are Management (17 | 23.3%), Community & Social Service (5 | 6.9%), Education Instruction & Library (5 | 6.9%), Business & Financial (4 | 5.5%), and Health Diagnosing & Treating (3 | 4.1%).
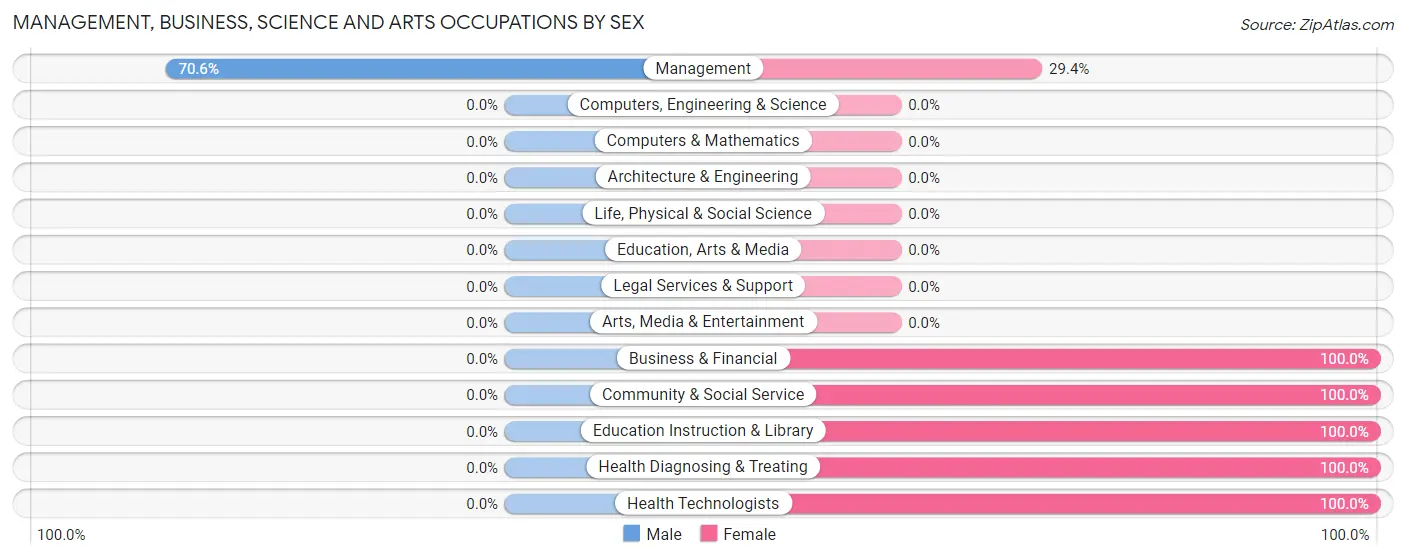
Management, Business, Science and Arts Occupations by Sex
| Occupation | Male | Female |
| Management | 12 (70.6%) | 5 (29.4%) |
| Business & Financial | 0 (0.0%) | 4 (100.0%) |
| Computers, Engineering & Science | 0 (0.0%) | 0 (0.0%) |
| Computers & Mathematics | 0 (0.0%) | 0 (0.0%) |
| Architecture & Engineering | 0 (0.0%) | 0 (0.0%) |
| Life, Physical & Social Science | 0 (0.0%) | 0 (0.0%) |
| Community & Social Service | 0 (0.0%) | 5 (100.0%) |
| Education, Arts & Media | 0 (0.0%) | 0 (0.0%) |
| Legal Services & Support | 0 (0.0%) | 0 (0.0%) |
| Education Instruction & Library | 0 (0.0%) | 5 (100.0%) |
| Arts, Media & Entertainment | 0 (0.0%) | 0 (0.0%) |
| Health Diagnosing & Treating | 0 (0.0%) | 3 (100.0%) |
| Health Technologists | 0 (0.0%) | 3 (100.0%) |
| Total (Category) | 12 (41.4%) | 17 (58.6%) |
| Total (Overall) | 44 (60.3%) | 29 (39.7%) |
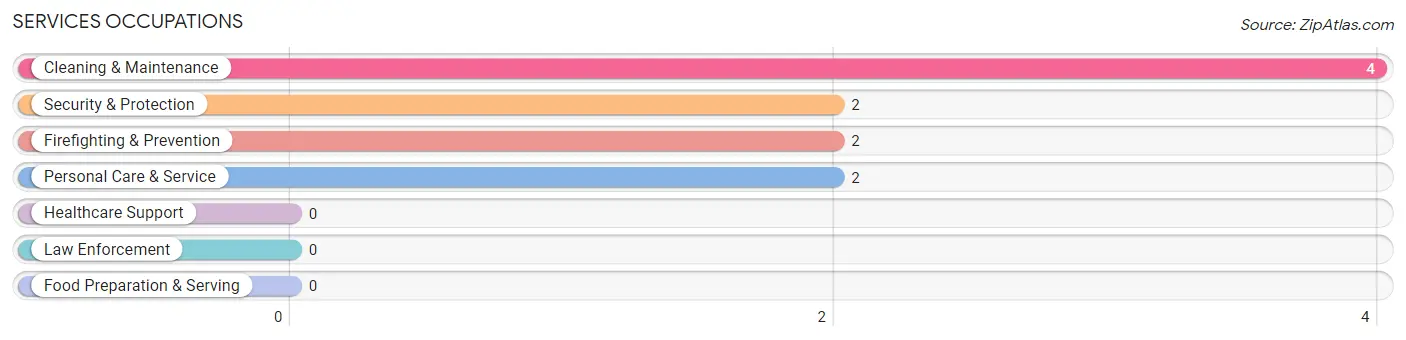
Services Occupations
The most common Services occupations in De Tour Village are Cleaning & Maintenance (4 | 5.5%), Security & Protection (2 | 2.7%), Firefighting & Prevention (2 | 2.7%), and Personal Care & Service (2 | 2.7%).
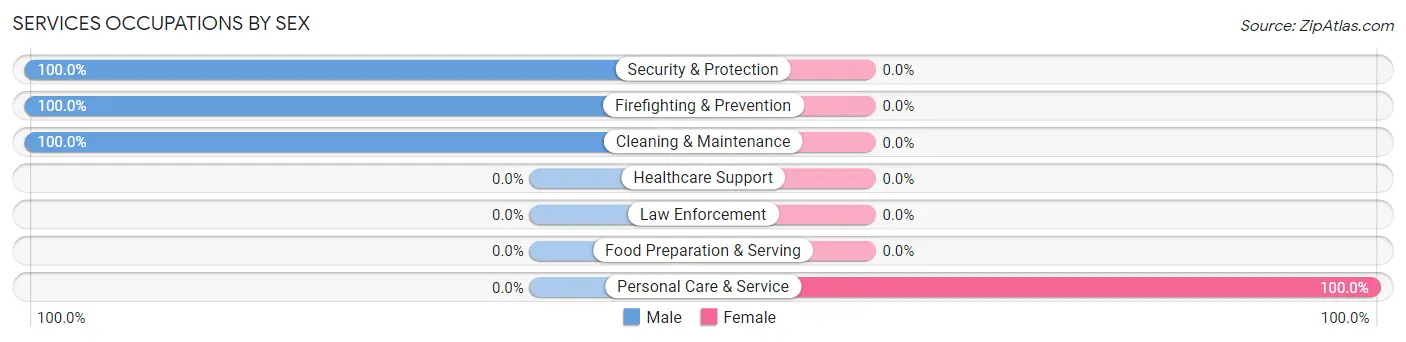
Services Occupations by Sex
| Occupation | Male | Female |
| Healthcare Support | 0 (0.0%) | 0 (0.0%) |
| Security & Protection | 2 (100.0%) | 0 (0.0%) |
| Firefighting & Prevention | 2 (100.0%) | 0 (0.0%) |
| Law Enforcement | 0 (0.0%) | 0 (0.0%) |
| Food Preparation & Serving | 0 (0.0%) | 0 (0.0%) |
| Cleaning & Maintenance | 4 (100.0%) | 0 (0.0%) |
| Personal Care & Service | 0 (0.0%) | 2 (100.0%) |
| Total (Category) | 6 (75.0%) | 2 (25.0%) |
| Total (Overall) | 44 (60.3%) | 29 (39.7%) |
Sales and Office Occupations
The most common Sales and Office occupations in De Tour Village are Office & Administration (6 | 8.2%), and Sales & Related (4 | 5.5%).
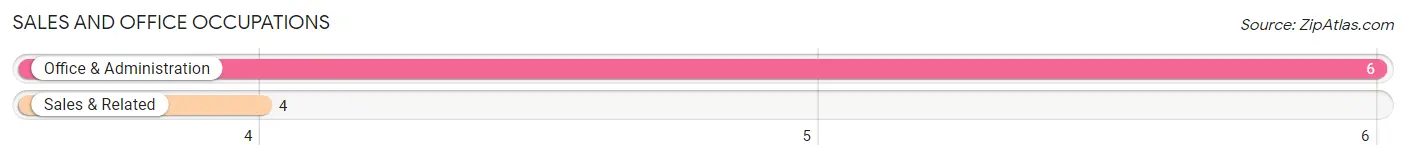
Sales and Office Occupations by Sex
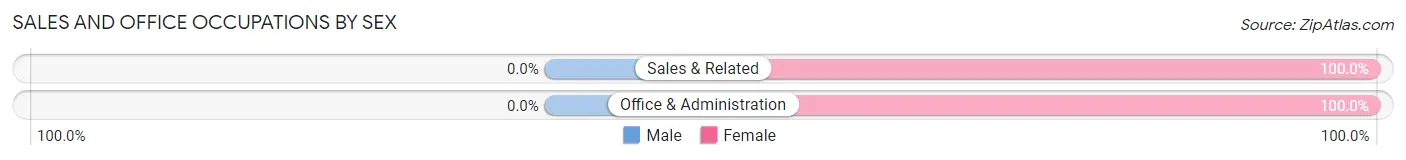
| Occupation | Male | Female |
| Sales & Related | 0 (0.0%) | 4 (100.0%) |
| Office & Administration | 0 (0.0%) | 6 (100.0%) |
| Total (Category) | 0 (0.0%) | 10 (100.0%) |
| Total (Overall) | 44 (60.3%) | 29 (39.7%) |
Natural Resources, Construction and Maintenance Occupations
The most common Natural Resources, Construction and Maintenance occupations in De Tour Village are Construction & Extraction (7 | 9.6%), and Installation, Maintenance & Repair (6 | 8.2%).
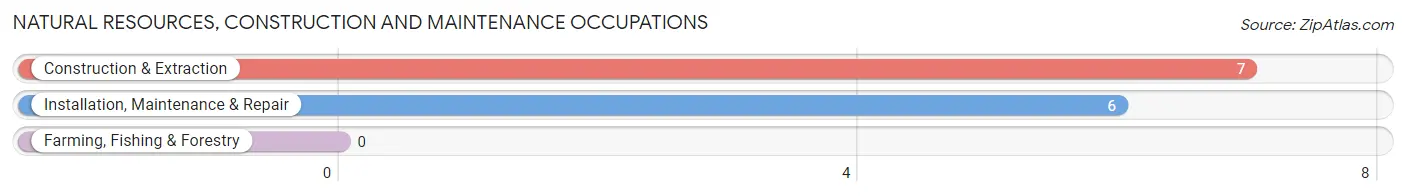
Natural Resources, Construction and Maintenance Occupations by Sex
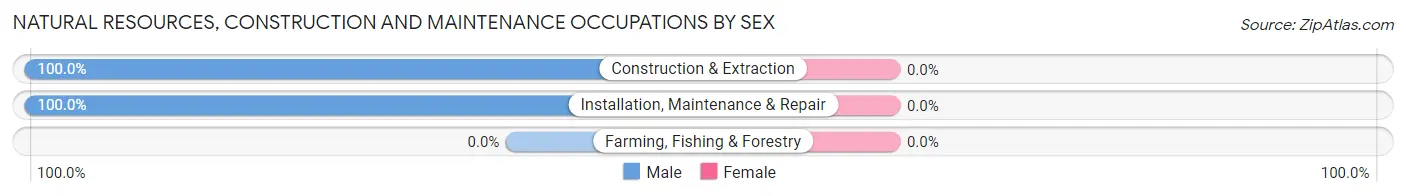
| Occupation | Male | Female |
| Farming, Fishing & Forestry | 0 (0.0%) | 0 (0.0%) |
| Construction & Extraction | 7 (100.0%) | 0 (0.0%) |
| Installation, Maintenance & Repair | 6 (100.0%) | 0 (0.0%) |
| Total (Category) | 13 (100.0%) | 0 (0.0%) |
| Total (Overall) | 44 (60.3%) | 29 (39.7%) |
Production, Transportation and Moving Occupations
The most common Production, Transportation and Moving occupations in De Tour Village are Production (6 | 8.2%), Material Moving (4 | 5.5%), and Transportation (3 | 4.1%).
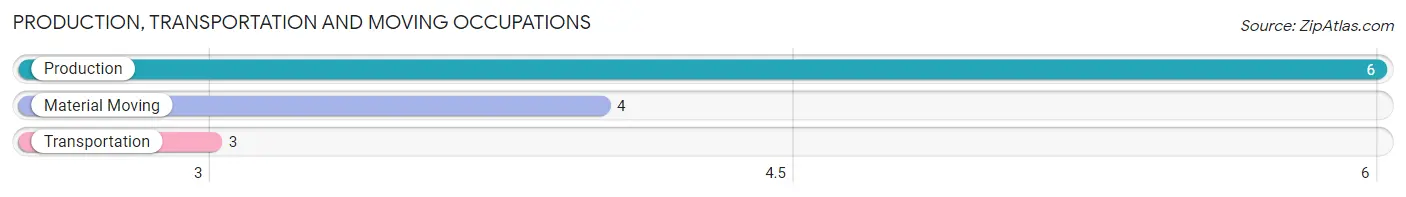
Production, Transportation and Moving Occupations by Sex
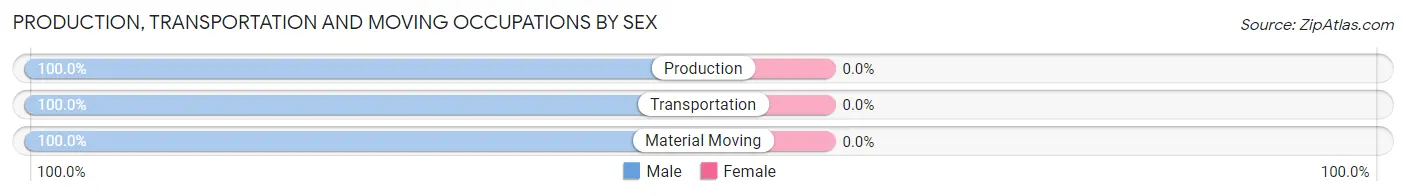
| Occupation | Male | Female |
| Production | 6 (100.0%) | 0 (0.0%) |
| Transportation | 3 (100.0%) | 0 (0.0%) |
| Material Moving | 4 (100.0%) | 0 (0.0%) |
| Total (Category) | 13 (100.0%) | 0 (0.0%) |
| Total (Overall) | 44 (60.3%) | 29 (39.7%) |
Employment Industries by Sex in De Tour Village
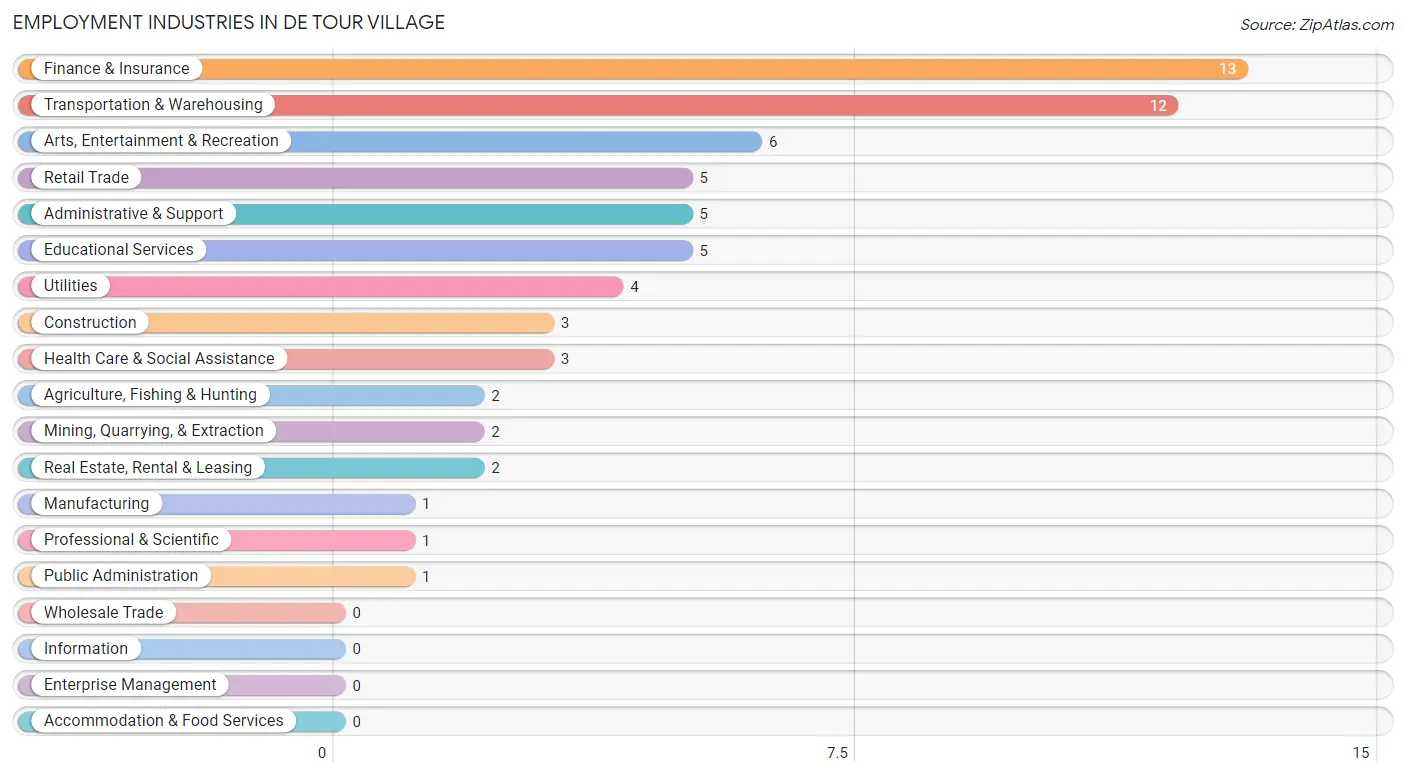
Employment Industries in De Tour Village
The major employment industries in De Tour Village include Finance & Insurance (13 | 17.8%), Transportation & Warehousing (12 | 16.4%), Arts, Entertainment & Recreation (6 | 8.2%), Retail Trade (5 | 6.9%), and Administrative & Support (5 | 6.9%).
Employment Industries by Sex in De Tour Village
The De Tour Village industries that see more men than women are Agriculture, Fishing & Hunting (100.0%), Mining, Quarrying, & Extraction (100.0%), and Construction (100.0%), whereas the industries that tend to have a higher number of women are Real Estate, Rental & Leasing (100.0%), Professional & Scientific (100.0%), and Educational Services (100.0%).

| Industry | Male | Female |
| Agriculture, Fishing & Hunting | 2 (100.0%) | 0 (0.0%) |
| Mining, Quarrying, & Extraction | 2 (100.0%) | 0 (0.0%) |
| Construction | 3 (100.0%) | 0 (0.0%) |
| Manufacturing | 1 (100.0%) | 0 (0.0%) |
| Wholesale Trade | 0 (0.0%) | 0 (0.0%) |
| Retail Trade | 3 (60.0%) | 2 (40.0%) |
| Transportation & Warehousing | 7 (58.3%) | 5 (41.7%) |
| Utilities | 4 (100.0%) | 0 (0.0%) |
| Information | 0 (0.0%) | 0 (0.0%) |
| Finance & Insurance | 5 (38.5%) | 8 (61.5%) |
| Real Estate, Rental & Leasing | 0 (0.0%) | 2 (100.0%) |
| Professional & Scientific | 0 (0.0%) | 1 (100.0%) |
| Enterprise Management | 0 (0.0%) | 0 (0.0%) |
| Administrative & Support | 5 (100.0%) | 0 (0.0%) |
| Educational Services | 0 (0.0%) | 5 (100.0%) |
| Health Care & Social Assistance | 0 (0.0%) | 3 (100.0%) |
| Arts, Entertainment & Recreation | 6 (100.0%) | 0 (0.0%) |
| Accommodation & Food Services | 0 (0.0%) | 0 (0.0%) |
| Public Administration | 0 (0.0%) | 1 (100.0%) |
| Total | 44 (60.3%) | 29 (39.7%) |
Education in De Tour Village
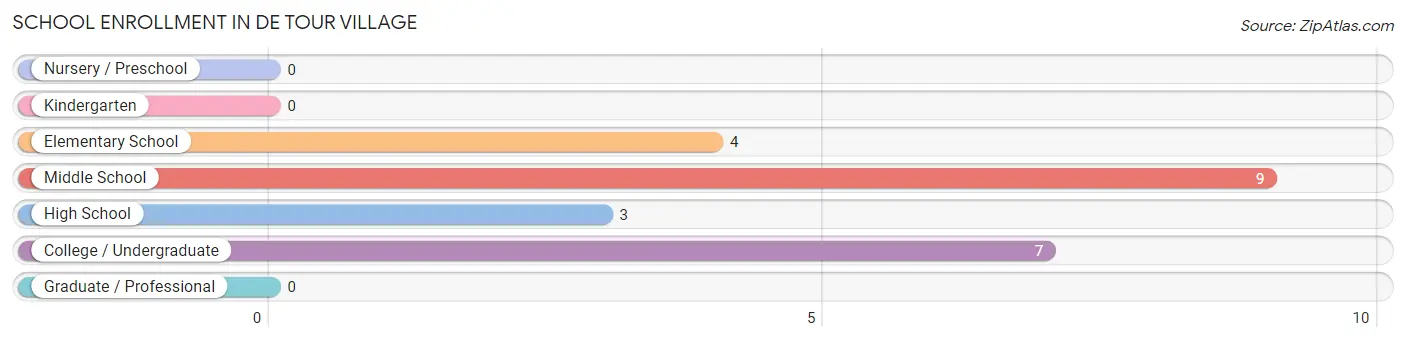
School Enrollment in De Tour Village
The most common levels of schooling among the 23 students in De Tour Village are middle school (9 | 39.1%), college / undergraduate (7 | 30.4%), and elementary school (4 | 17.4%).
| School Level | # Students | % Students |
| Nursery / Preschool | 0 | 0.0% |
| Kindergarten | 0 | 0.0% |
| Elementary School | 4 | 17.4% |
| Middle School | 9 | 39.1% |
| High School | 3 | 13.0% |
| College / Undergraduate | 7 | 30.4% |
| Graduate / Professional | 0 | 0.0% |
| Total | 23 | 100.0% |
School Enrollment by Age by Funding Source in De Tour Village
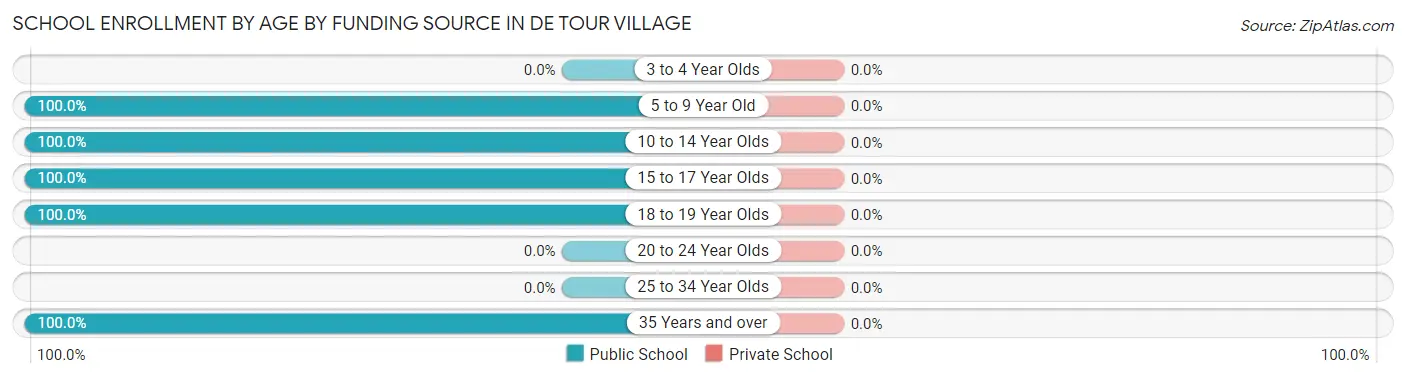
| Age Bracket | Public School | Private School |
| 3 to 4 Year Olds | 0 (0.0%) | 0 (0.0%) |
| 5 to 9 Year Old | 4 (100.0%) | 0 (0.0%) |
| 10 to 14 Year Olds | 9 (100.0%) | 0 (0.0%) |
| 15 to 17 Year Olds | 3 (100.0%) | 0 (0.0%) |
| 18 to 19 Year Olds | 5 (100.0%) | 0 (0.0%) |
| 20 to 24 Year Olds | 0 (0.0%) | 0 (0.0%) |
| 25 to 34 Year Olds | 0 (0.0%) | 0 (0.0%) |
| 35 Years and over | 2 (100.0%) | 0 (0.0%) |
| Total | 23 (100.0%) | 0 (0.0%) |
Educational Attainment by Field of Study in De Tour Village
Science & technology (20 | 38.5%), psychology (13 | 25.0%), education (11 | 21.1%), computers & mathematics (4 | 7.7%), and arts & humanities (2 | 3.8%) are the most common fields of study among 52 individuals in De Tour Village who have obtained a bachelor's degree or higher.
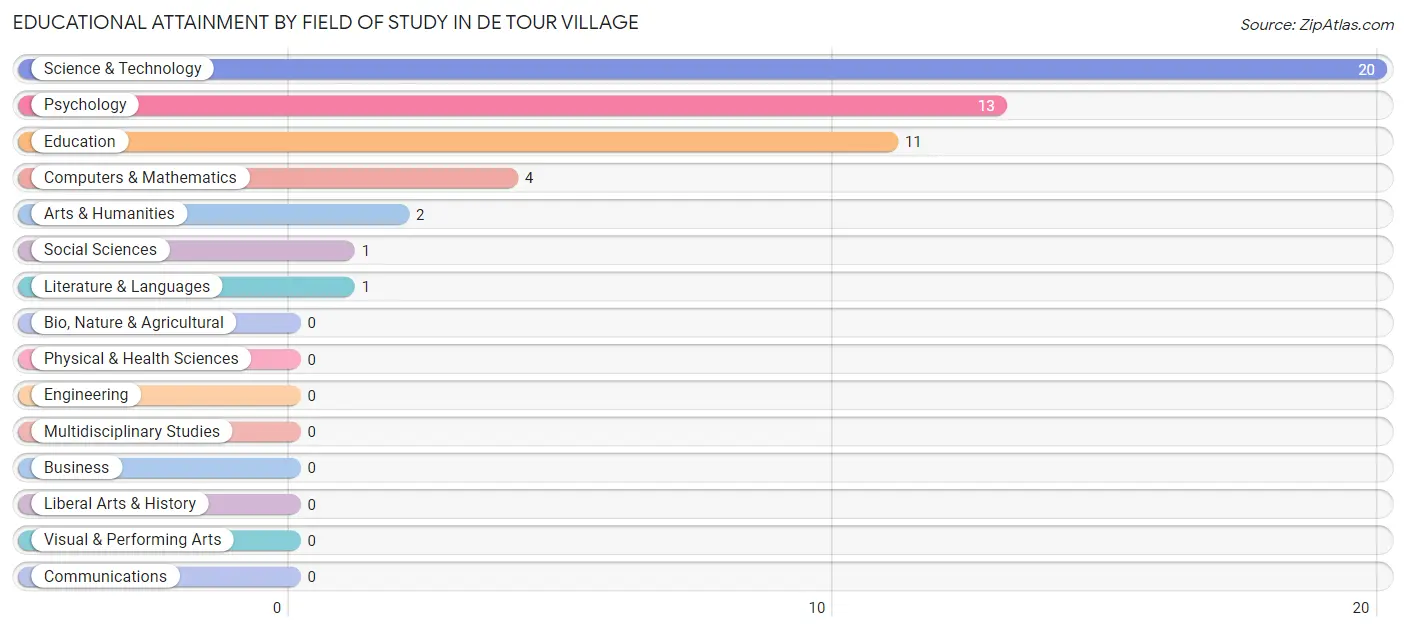
| Field of Study | # Graduates | % Graduates |
| Computers & Mathematics | 4 | 7.7% |
| Bio, Nature & Agricultural | 0 | 0.0% |
| Physical & Health Sciences | 0 | 0.0% |
| Psychology | 13 | 25.0% |
| Social Sciences | 1 | 1.9% |
| Engineering | 0 | 0.0% |
| Multidisciplinary Studies | 0 | 0.0% |
| Science & Technology | 20 | 38.5% |
| Business | 0 | 0.0% |
| Education | 11 | 21.1% |
| Literature & Languages | 1 | 1.9% |
| Liberal Arts & History | 0 | 0.0% |
| Visual & Performing Arts | 0 | 0.0% |
| Communications | 0 | 0.0% |
| Arts & Humanities | 2 | 3.8% |
| Total | 52 | 100.0% |
Transportation & Commute in De Tour Village
Vehicle Availability by Sex in De Tour Village
The most prevalent vehicle ownership categories in De Tour Village are males with 1 vehicle (21, accounting for 47.7%) and females with 1 vehicle (7, making up 72.4%).
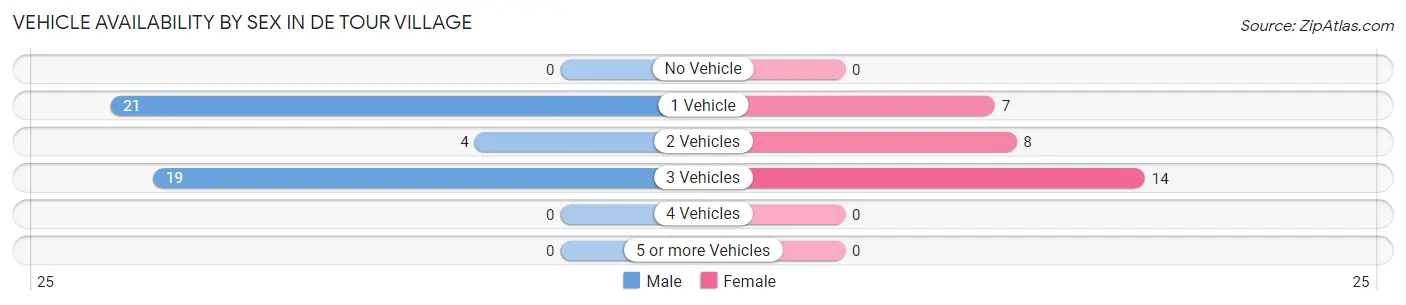
| Vehicles Available | Male | Female |
| No Vehicle | 0 (0.0%) | 0 (0.0%) |
| 1 Vehicle | 21 (47.7%) | 7 (24.1%) |
| 2 Vehicles | 4 (9.1%) | 8 (27.6%) |
| 3 Vehicles | 19 (43.2%) | 14 (48.3%) |
| 4 Vehicles | 0 (0.0%) | 0 (0.0%) |
| 5 or more Vehicles | 0 (0.0%) | 0 (0.0%) |
| Total | 44 (100.0%) | 29 (100.0%) |
Commute Time in De Tour Village
The most frequently occuring commute durations in De Tour Village are less than 5 minutes (32 commuters, 45.7%), 30 to 34 minutes (16 commuters, 22.9%), and 5 to 9 minutes (6 commuters, 8.6%).
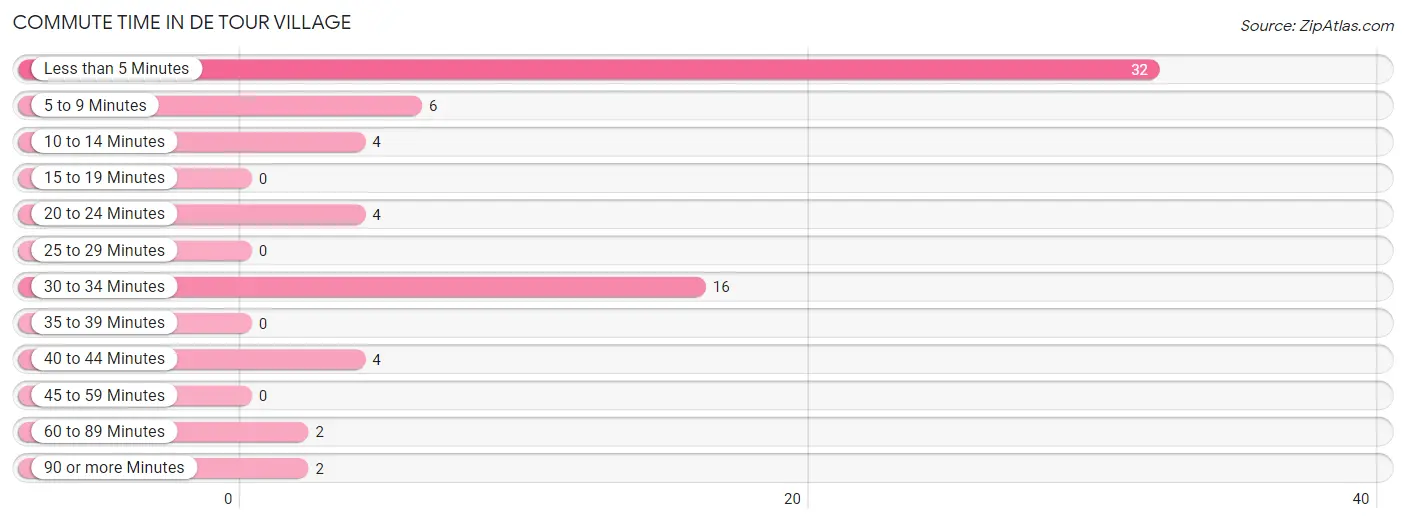
| Commute Time | # Commuters | % Commuters |
| Less than 5 Minutes | 32 | 45.7% |
| 5 to 9 Minutes | 6 | 8.6% |
| 10 to 14 Minutes | 4 | 5.7% |
| 15 to 19 Minutes | 0 | 0.0% |
| 20 to 24 Minutes | 4 | 5.7% |
| 25 to 29 Minutes | 0 | 0.0% |
| 30 to 34 Minutes | 16 | 22.9% |
| 35 to 39 Minutes | 0 | 0.0% |
| 40 to 44 Minutes | 4 | 5.7% |
| 45 to 59 Minutes | 0 | 0.0% |
| 60 to 89 Minutes | 2 | 2.9% |
| 90 or more Minutes | 2 | 2.9% |
Commute Time by Sex in De Tour Village
The most common commute times in De Tour Village are less than 5 minutes (22 commuters, 50.0%) for males and less than 5 minutes (10 commuters, 38.5%) for females.
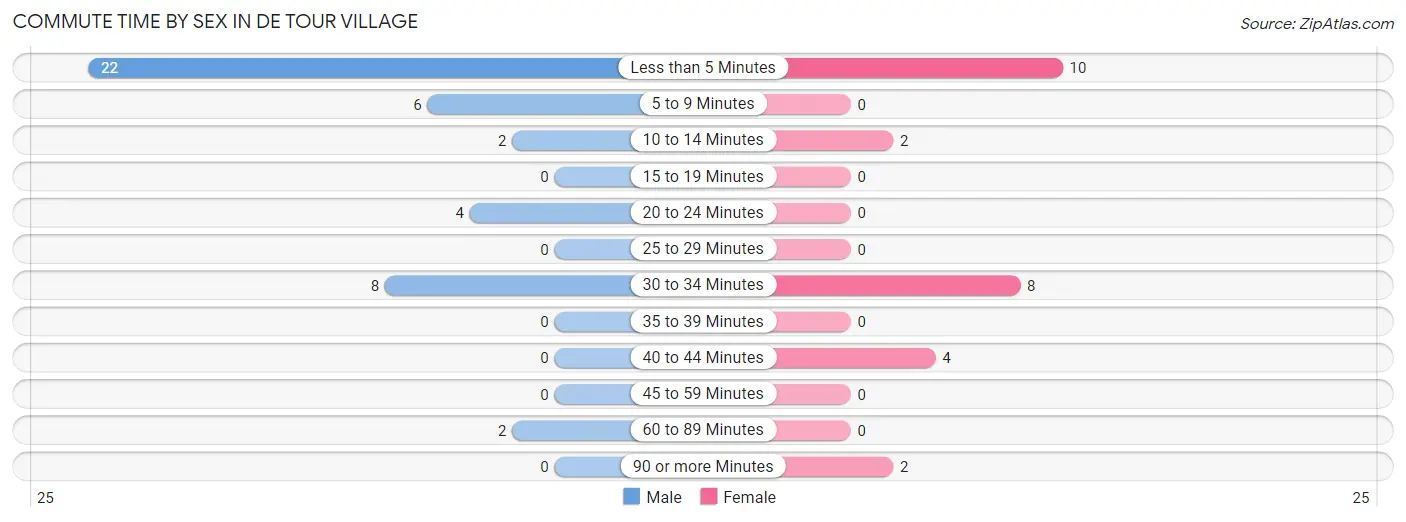
| Commute Time | Male | Female |
| Less than 5 Minutes | 22 (50.0%) | 10 (38.5%) |
| 5 to 9 Minutes | 6 (13.6%) | 0 (0.0%) |
| 10 to 14 Minutes | 2 (4.5%) | 2 (7.7%) |
| 15 to 19 Minutes | 0 (0.0%) | 0 (0.0%) |
| 20 to 24 Minutes | 4 (9.1%) | 0 (0.0%) |
| 25 to 29 Minutes | 0 (0.0%) | 0 (0.0%) |
| 30 to 34 Minutes | 8 (18.2%) | 8 (30.8%) |
| 35 to 39 Minutes | 0 (0.0%) | 0 (0.0%) |
| 40 to 44 Minutes | 0 (0.0%) | 4 (15.4%) |
| 45 to 59 Minutes | 0 (0.0%) | 0 (0.0%) |
| 60 to 89 Minutes | 2 (4.5%) | 0 (0.0%) |
| 90 or more Minutes | 0 (0.0%) | 2 (7.7%) |
Time of Departure to Work by Sex in De Tour Village
The most frequent times of departure to work in De Tour Village are 7:00 AM to 7:29 AM (16, 36.4%) for males and 7:30 AM to 7:59 AM (12, 46.2%) for females.
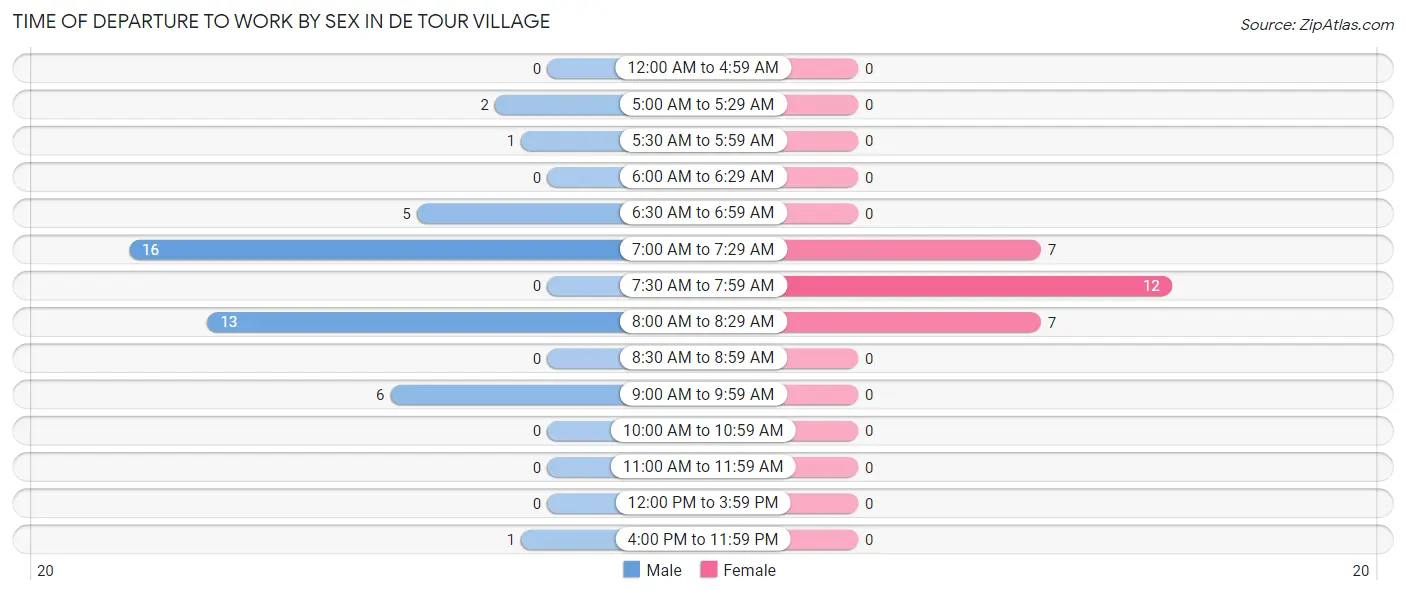
| Time of Departure | Male | Female |
| 12:00 AM to 4:59 AM | 0 (0.0%) | 0 (0.0%) |
| 5:00 AM to 5:29 AM | 2 (4.5%) | 0 (0.0%) |
| 5:30 AM to 5:59 AM | 1 (2.3%) | 0 (0.0%) |
| 6:00 AM to 6:29 AM | 0 (0.0%) | 0 (0.0%) |
| 6:30 AM to 6:59 AM | 5 (11.4%) | 0 (0.0%) |
| 7:00 AM to 7:29 AM | 16 (36.4%) | 7 (26.9%) |
| 7:30 AM to 7:59 AM | 0 (0.0%) | 12 (46.2%) |
| 8:00 AM to 8:29 AM | 13 (29.5%) | 7 (26.9%) |
| 8:30 AM to 8:59 AM | 0 (0.0%) | 0 (0.0%) |
| 9:00 AM to 9:59 AM | 6 (13.6%) | 0 (0.0%) |
| 10:00 AM to 10:59 AM | 0 (0.0%) | 0 (0.0%) |
| 11:00 AM to 11:59 AM | 0 (0.0%) | 0 (0.0%) |
| 12:00 PM to 3:59 PM | 0 (0.0%) | 0 (0.0%) |
| 4:00 PM to 11:59 PM | 1 (2.3%) | 0 (0.0%) |
| Total | 44 (100.0%) | 26 (100.0%) |
Housing Occupancy in De Tour Village
Occupancy by Ownership in De Tour Village
Of the total 127 dwellings in De Tour Village, owner-occupied units account for 122 (96.1%), while renter-occupied units make up 5 (3.9%).
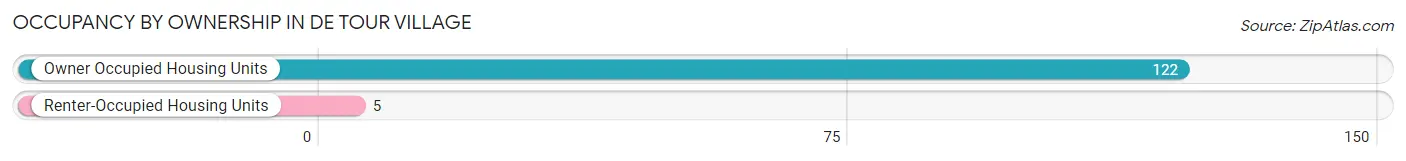
| Occupancy | # Housing Units | % Housing Units |
| Owner Occupied Housing Units | 122 | 96.1% |
| Renter-Occupied Housing Units | 5 | 3.9% |
| Total Occupied Housing Units | 127 | 100.0% |
Occupancy by Household Size in De Tour Village
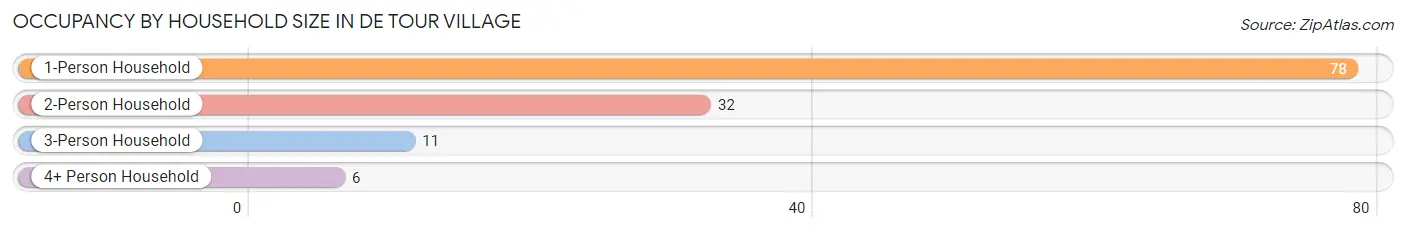
| Household Size | # Housing Units | % Housing Units |
| 1-Person Household | 78 | 61.4% |
| 2-Person Household | 32 | 25.2% |
| 3-Person Household | 11 | 8.7% |
| 4+ Person Household | 6 | 4.7% |
| Total Housing Units | 127 | 100.0% |
Occupancy by Ownership by Household Size in De Tour Village
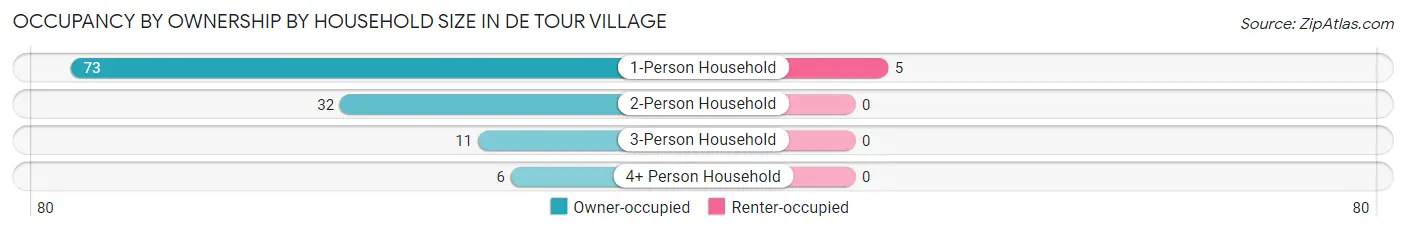
| Household Size | Owner-occupied | Renter-occupied |
| 1-Person Household | 73 (93.6%) | 5 (6.4%) |
| 2-Person Household | 32 (100.0%) | 0 (0.0%) |
| 3-Person Household | 11 (100.0%) | 0 (0.0%) |
| 4+ Person Household | 6 (100.0%) | 0 (0.0%) |
| Total Housing Units | 122 (96.1%) | 5 (3.9%) |
Occupancy by Educational Attainment in De Tour Village
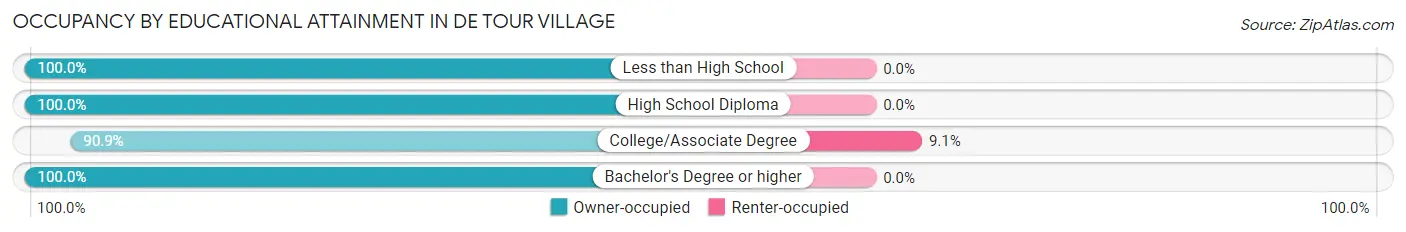
| Household Size | Owner-occupied | Renter-occupied |
| Less than High School | 5 (100.0%) | 0 (0.0%) |
| High School Diploma | 30 (100.0%) | 0 (0.0%) |
| College/Associate Degree | 50 (90.9%) | 5 (9.1%) |
| Bachelor's Degree or higher | 37 (100.0%) | 0 (0.0%) |
Occupancy by Age of Householder in De Tour Village
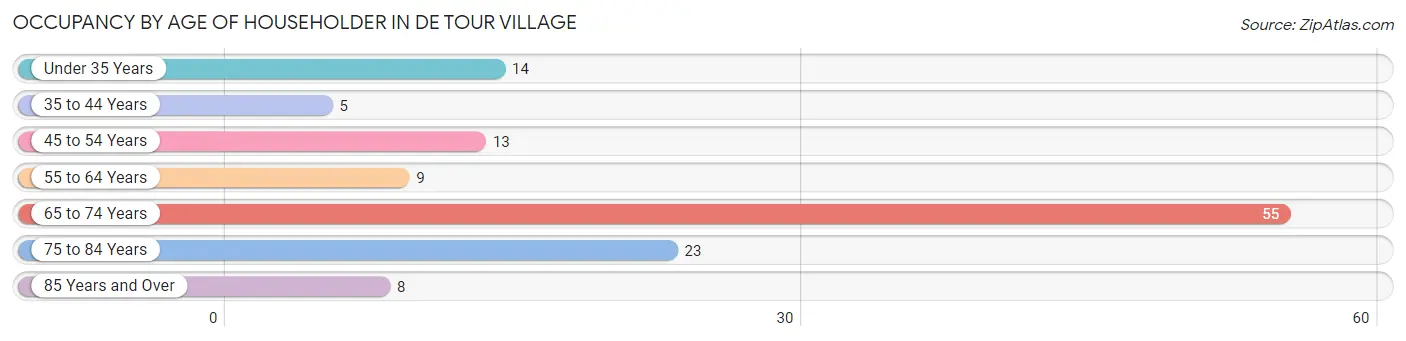
| Age Bracket | # Households | % Households |
| Under 35 Years | 14 | 11.0% |
| 35 to 44 Years | 5 | 3.9% |
| 45 to 54 Years | 13 | 10.2% |
| 55 to 64 Years | 9 | 7.1% |
| 65 to 74 Years | 55 | 43.3% |
| 75 to 84 Years | 23 | 18.1% |
| 85 Years and Over | 8 | 6.3% |
| Total | 127 | 100.0% |
Housing Finances in De Tour Village
Median Income by Occupancy in De Tour Village
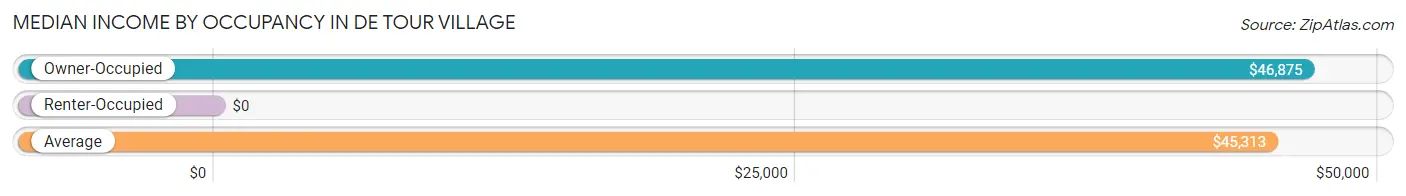
| Occupancy Type | # Households | Median Income |
| Owner-Occupied | 122 (96.1%) | $46,875 |
| Renter-Occupied | 5 (3.9%) | $0 |
| Average | 127 (100.0%) | $45,313 |
Occupancy by Householder Income Bracket in De Tour Village
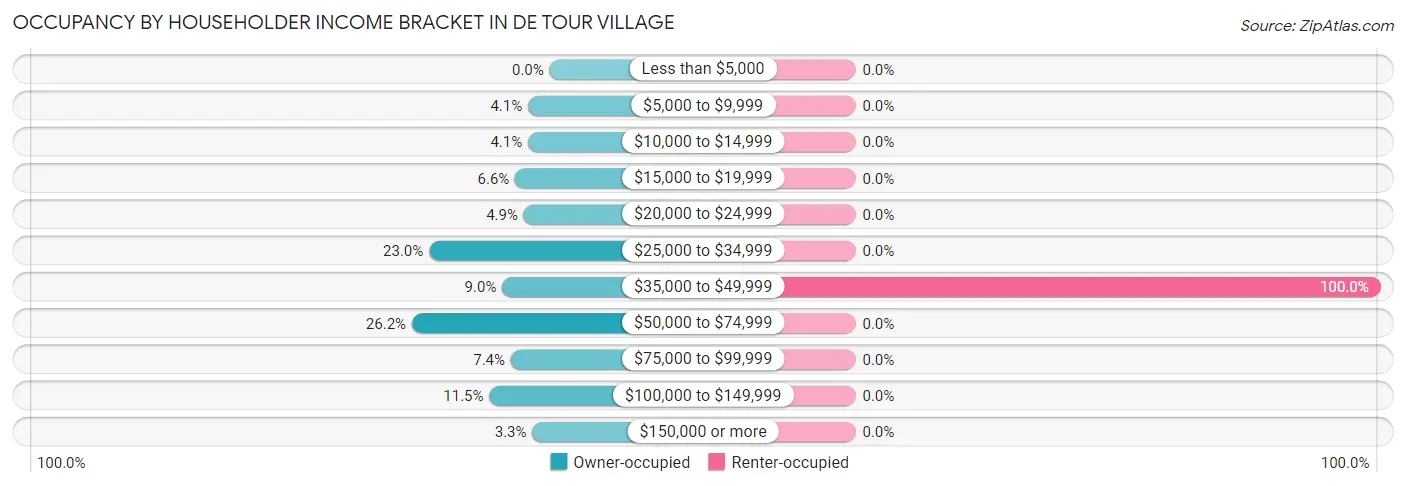
| Income Bracket | Owner-occupied | Renter-occupied |
| Less than $5,000 | 0 (0.0%) | 0 (0.0%) |
| $5,000 to $9,999 | 5 (4.1%) | 0 (0.0%) |
| $10,000 to $14,999 | 5 (4.1%) | 0 (0.0%) |
| $15,000 to $19,999 | 8 (6.6%) | 0 (0.0%) |
| $20,000 to $24,999 | 6 (4.9%) | 0 (0.0%) |
| $25,000 to $34,999 | 28 (23.0%) | 0 (0.0%) |
| $35,000 to $49,999 | 11 (9.0%) | 5 (100.0%) |
| $50,000 to $74,999 | 32 (26.2%) | 0 (0.0%) |
| $75,000 to $99,999 | 9 (7.4%) | 0 (0.0%) |
| $100,000 to $149,999 | 14 (11.5%) | 0 (0.0%) |
| $150,000 or more | 4 (3.3%) | 0 (0.0%) |
| Total | 122 (100.0%) | 5 (100.0%) |
Monthly Housing Cost Tiers in De Tour Village
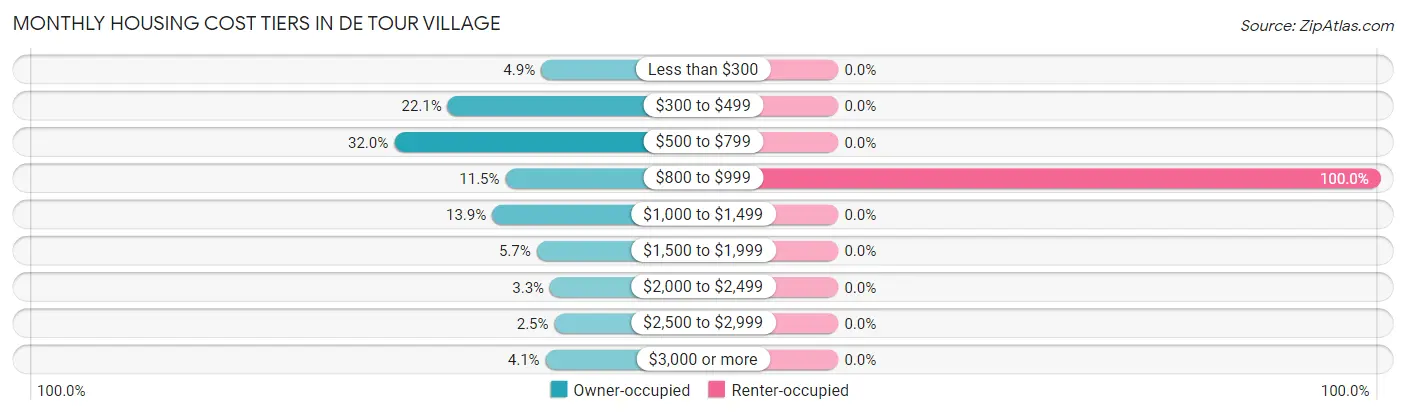
| Monthly Cost | Owner-occupied | Renter-occupied |
| Less than $300 | 6 (4.9%) | 0 (0.0%) |
| $300 to $499 | 27 (22.1%) | 0 (0.0%) |
| $500 to $799 | 39 (32.0%) | 0 (0.0%) |
| $800 to $999 | 14 (11.5%) | 5 (100.0%) |
| $1,000 to $1,499 | 17 (13.9%) | 0 (0.0%) |
| $1,500 to $1,999 | 7 (5.7%) | 0 (0.0%) |
| $2,000 to $2,499 | 4 (3.3%) | 0 (0.0%) |
| $2,500 to $2,999 | 3 (2.5%) | 0 (0.0%) |
| $3,000 or more | 5 (4.1%) | 0 (0.0%) |
| Total | 122 (100.0%) | 5 (100.0%) |
Physical Housing Characteristics in De Tour Village
Housing Structures in De Tour Village
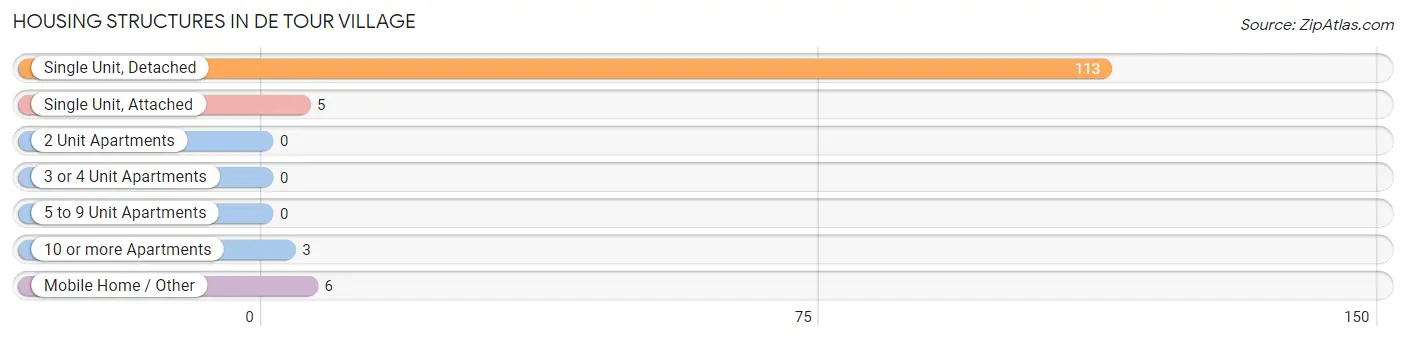
| Structure Type | # Housing Units | % Housing Units |
| Single Unit, Detached | 113 | 89.0% |
| Single Unit, Attached | 5 | 3.9% |
| 2 Unit Apartments | 0 | 0.0% |
| 3 or 4 Unit Apartments | 0 | 0.0% |
| 5 to 9 Unit Apartments | 0 | 0.0% |
| 10 or more Apartments | 3 | 2.4% |
| Mobile Home / Other | 6 | 4.7% |
| Total | 127 | 100.0% |
Housing Structures by Occupancy in De Tour Village
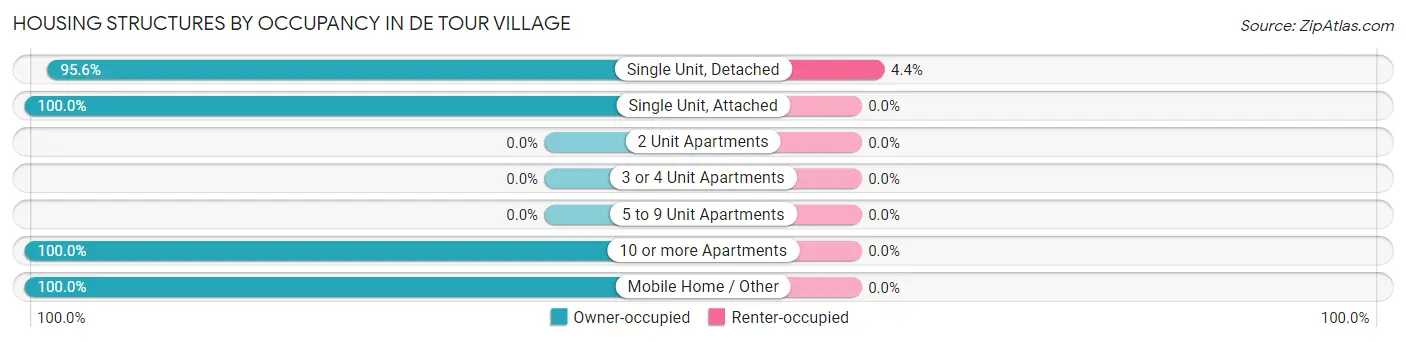
| Structure Type | Owner-occupied | Renter-occupied |
| Single Unit, Detached | 108 (95.6%) | 5 (4.4%) |
| Single Unit, Attached | 5 (100.0%) | 0 (0.0%) |
| 2 Unit Apartments | 0 (0.0%) | 0 (0.0%) |
| 3 or 4 Unit Apartments | 0 (0.0%) | 0 (0.0%) |
| 5 to 9 Unit Apartments | 0 (0.0%) | 0 (0.0%) |
| 10 or more Apartments | 3 (100.0%) | 0 (0.0%) |
| Mobile Home / Other | 6 (100.0%) | 0 (0.0%) |
| Total | 122 (96.1%) | 5 (3.9%) |
Housing Structures by Number of Rooms in De Tour Village
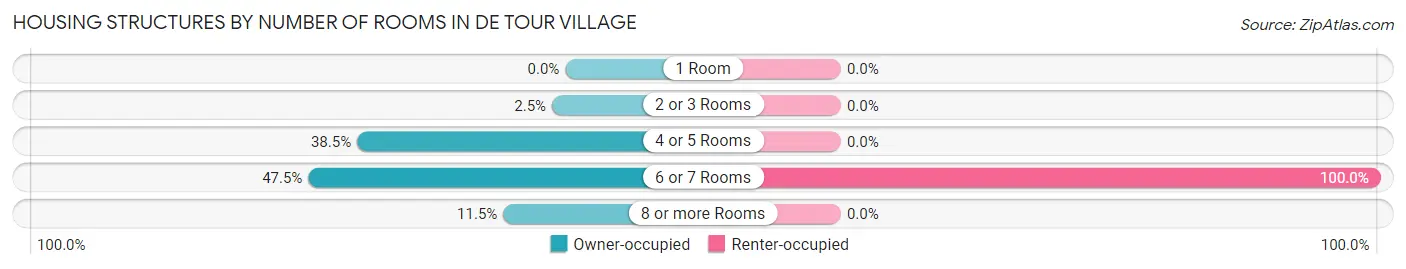
| Number of Rooms | Owner-occupied | Renter-occupied |
| 1 Room | 0 (0.0%) | 0 (0.0%) |
| 2 or 3 Rooms | 3 (2.5%) | 0 (0.0%) |
| 4 or 5 Rooms | 47 (38.5%) | 0 (0.0%) |
| 6 or 7 Rooms | 58 (47.5%) | 5 (100.0%) |
| 8 or more Rooms | 14 (11.5%) | 0 (0.0%) |
| Total | 122 (100.0%) | 5 (100.0%) |
Housing Structure by Heating Type in De Tour Village
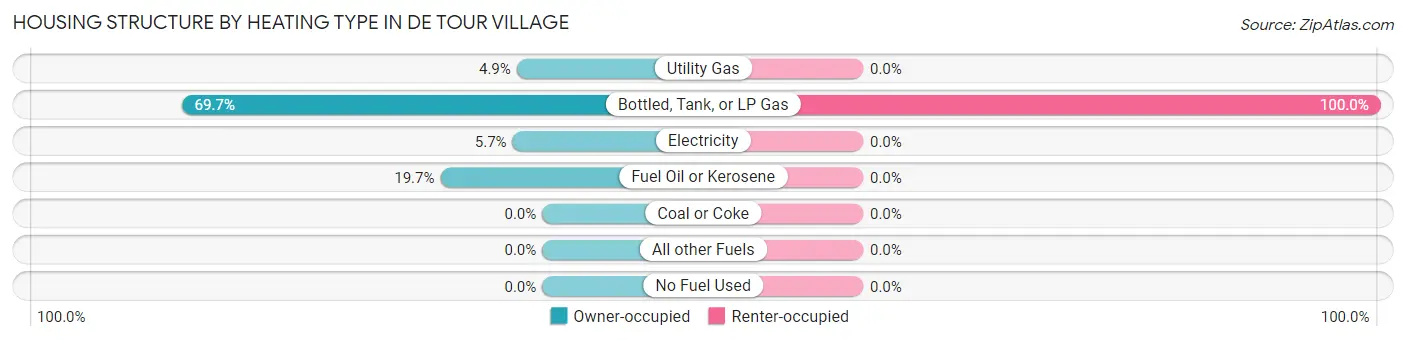
| Heating Type | Owner-occupied | Renter-occupied |
| Utility Gas | 6 (4.9%) | 0 (0.0%) |
| Bottled, Tank, or LP Gas | 85 (69.7%) | 5 (100.0%) |
| Electricity | 7 (5.7%) | 0 (0.0%) |
| Fuel Oil or Kerosene | 24 (19.7%) | 0 (0.0%) |
| Coal or Coke | 0 (0.0%) | 0 (0.0%) |
| All other Fuels | 0 (0.0%) | 0 (0.0%) |
| No Fuel Used | 0 (0.0%) | 0 (0.0%) |
| Total | 122 (100.0%) | 5 (100.0%) |
Household Vehicle Usage in De Tour Village
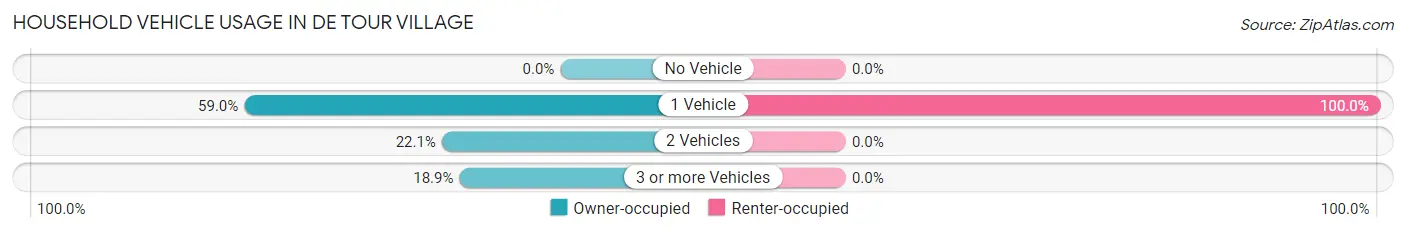
| Vehicles per Household | Owner-occupied | Renter-occupied |
| No Vehicle | 0 (0.0%) | 0 (0.0%) |
| 1 Vehicle | 72 (59.0%) | 5 (100.0%) |
| 2 Vehicles | 27 (22.1%) | 0 (0.0%) |
| 3 or more Vehicles | 23 (18.9%) | 0 (0.0%) |
| Total | 122 (100.0%) | 5 (100.0%) |
Real Estate & Mortgages in De Tour Village
Real Estate and Mortgage Overview in De Tour Village
| Characteristic | Without Mortgage | With Mortgage |
| Housing Units | 80 | 42 |
| Median Property Value | $136,100 | $141,700 |
| Median Household Income | $32,500 | $4 |
| Monthly Housing Costs | $541 | $5 |
| Real Estate Taxes | $1,650 | $0 |
Property Value by Mortgage Status in De Tour Village
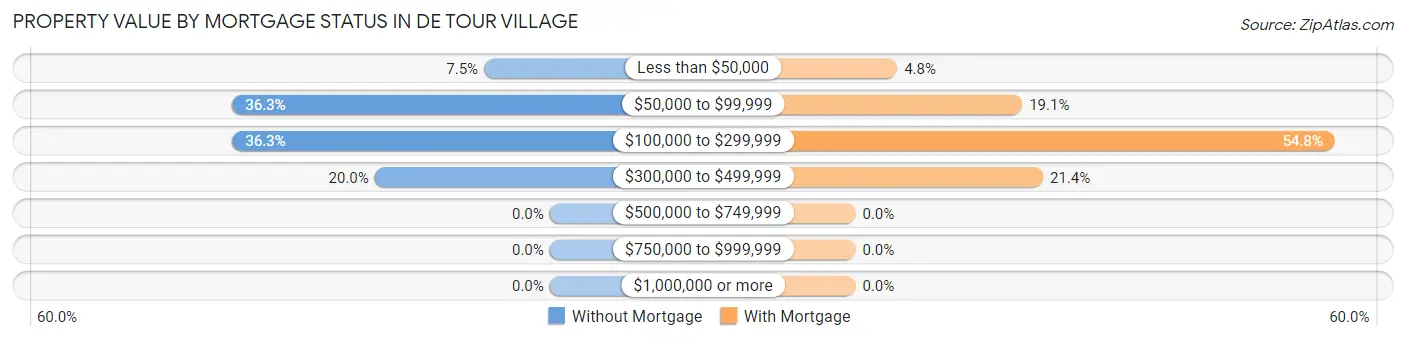
| Property Value | Without Mortgage | With Mortgage |
| Less than $50,000 | 6 (7.5%) | 2 (4.8%) |
| $50,000 to $99,999 | 29 (36.2%) | 8 (19.1%) |
| $100,000 to $299,999 | 29 (36.2%) | 23 (54.8%) |
| $300,000 to $499,999 | 16 (20.0%) | 9 (21.4%) |
| $500,000 to $749,999 | 0 (0.0%) | 0 (0.0%) |
| $750,000 to $999,999 | 0 (0.0%) | 0 (0.0%) |
| $1,000,000 or more | 0 (0.0%) | 0 (0.0%) |
| Total | 80 (100.0%) | 42 (100.0%) |
Household Income by Mortgage Status in De Tour Village
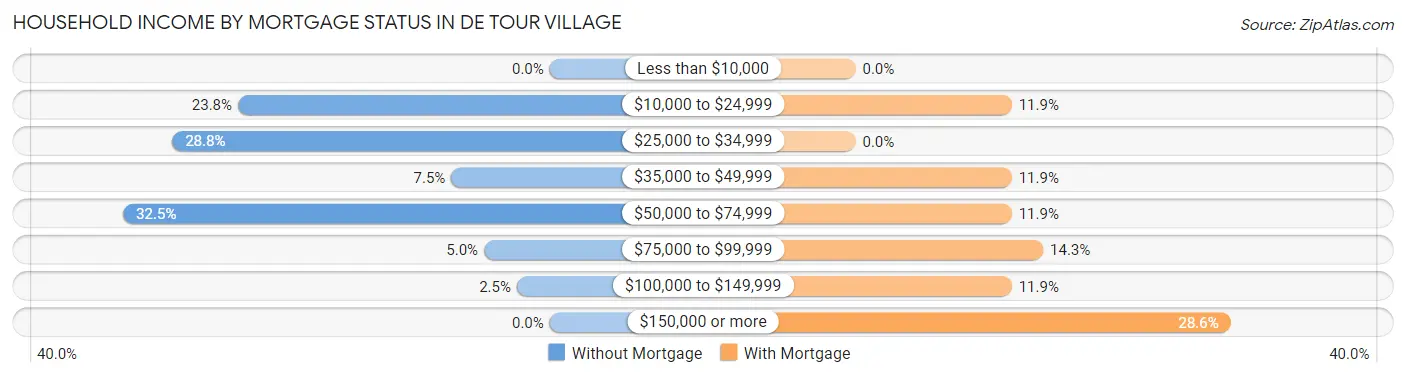
| Household Income | Without Mortgage | With Mortgage |
| Less than $10,000 | 0 (0.0%) | 0 (0.0%) |
| $10,000 to $24,999 | 19 (23.7%) | 5 (11.9%) |
| $25,000 to $34,999 | 23 (28.7%) | 0 (0.0%) |
| $35,000 to $49,999 | 6 (7.5%) | 5 (11.9%) |
| $50,000 to $74,999 | 26 (32.5%) | 5 (11.9%) |
| $75,000 to $99,999 | 4 (5.0%) | 6 (14.3%) |
| $100,000 to $149,999 | 2 (2.5%) | 5 (11.9%) |
| $150,000 or more | 0 (0.0%) | 12 (28.6%) |
| Total | 80 (100.0%) | 42 (100.0%) |
Property Value to Household Income Ratio in De Tour Village
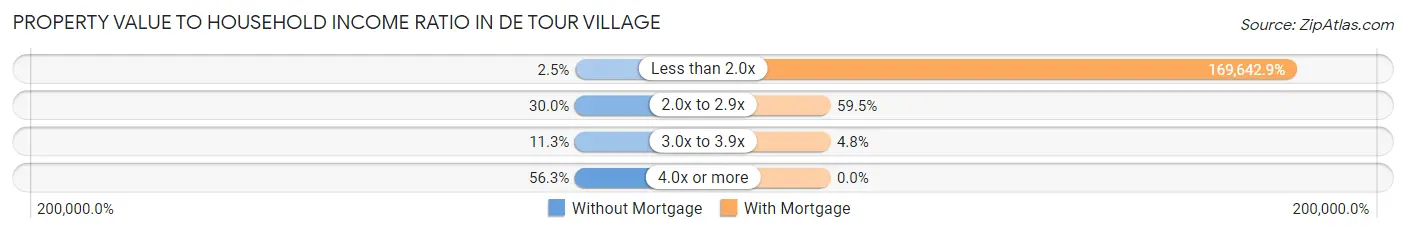
| Value-to-Income Ratio | Without Mortgage | With Mortgage |
| Less than 2.0x | 2 (2.5%) | 71,250 (169,642.9%) |
| 2.0x to 2.9x | 24 (30.0%) | 25 (59.5%) |
| 3.0x to 3.9x | 9 (11.3%) | 2 (4.8%) |
| 4.0x or more | 45 (56.2%) | 0 (0.0%) |
| Total | 80 (100.0%) | 42 (100.0%) |
Real Estate Taxes by Mortgage Status in De Tour Village
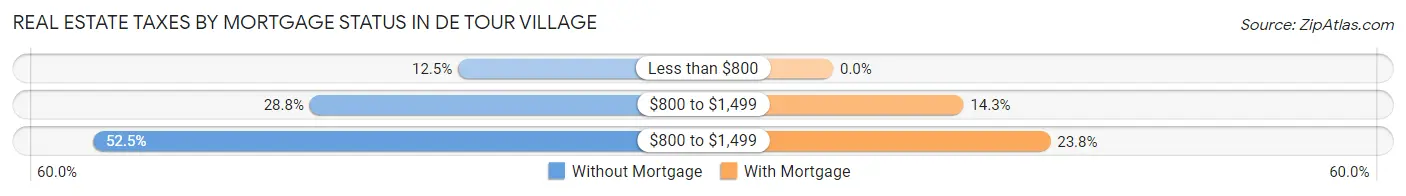
| Property Taxes | Without Mortgage | With Mortgage |
| Less than $800 | 10 (12.5%) | 0 (0.0%) |
| $800 to $1,499 | 23 (28.7%) | 6 (14.3%) |
| $800 to $1,499 | 42 (52.5%) | 10 (23.8%) |
| Total | 80 (100.0%) | 42 (100.0%) |
Health & Disability in De Tour Village
Health Insurance Coverage by Age in De Tour Village
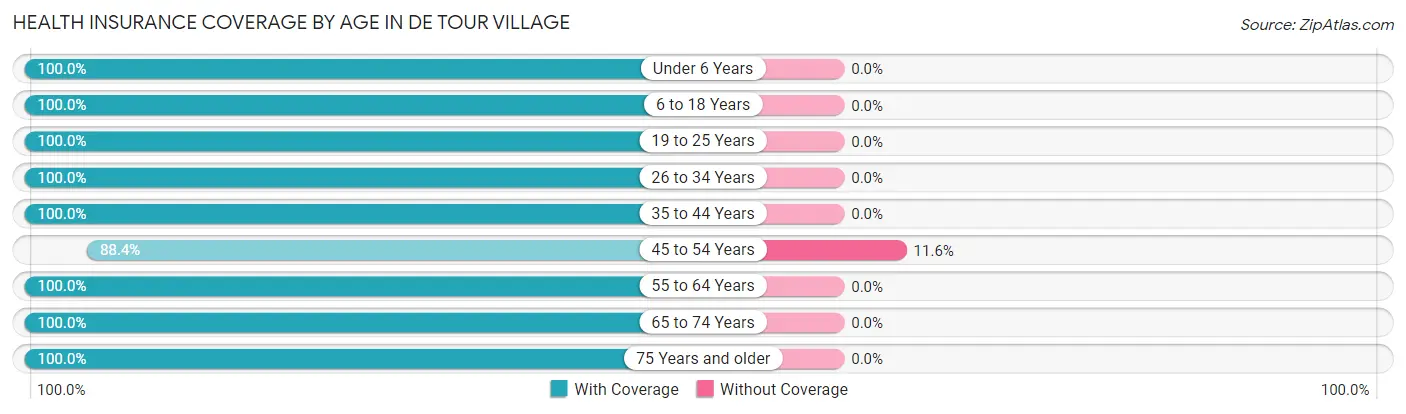
| Age Bracket | With Coverage | Without Coverage |
| Under 6 Years | 6 (100.0%) | 0 (0.0%) |
| 6 to 18 Years | 16 (100.0%) | 0 (0.0%) |
| 19 to 25 Years | 5 (100.0%) | 0 (0.0%) |
| 26 to 34 Years | 18 (100.0%) | 0 (0.0%) |
| 35 to 44 Years | 5 (100.0%) | 0 (0.0%) |
| 45 to 54 Years | 38 (88.4%) | 5 (11.6%) |
| 55 to 64 Years | 18 (100.0%) | 0 (0.0%) |
| 65 to 74 Years | 72 (100.0%) | 0 (0.0%) |
| 75 Years and older | 43 (100.0%) | 0 (0.0%) |
| Total | 221 (97.8%) | 5 (2.2%) |
Health Insurance Coverage by Citizenship Status in De Tour Village
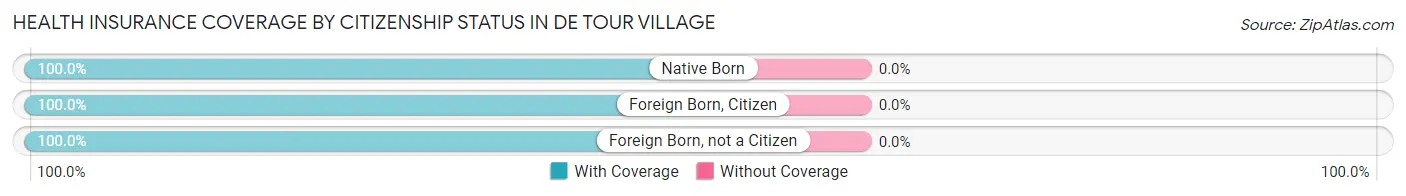
| Citizenship Status | With Coverage | Without Coverage |
| Native Born | 6 (100.0%) | 0 (0.0%) |
| Foreign Born, Citizen | 16 (100.0%) | 0 (0.0%) |
| Foreign Born, not a Citizen | 5 (100.0%) | 0 (0.0%) |
Health Insurance Coverage by Household Income in De Tour Village
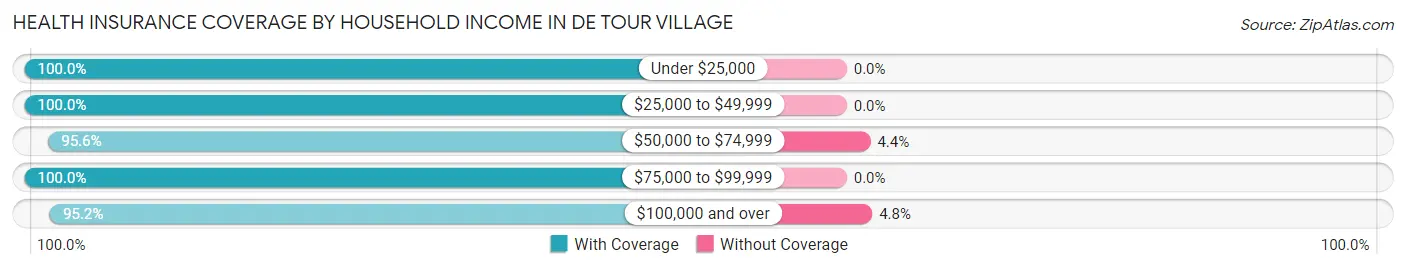
| Household Income | With Coverage | Without Coverage |
| Under $25,000 | 24 (100.0%) | 0 (0.0%) |
| $25,000 to $49,999 | 75 (100.0%) | 0 (0.0%) |
| $50,000 to $74,999 | 43 (95.6%) | 2 (4.4%) |
| $75,000 to $99,999 | 19 (100.0%) | 0 (0.0%) |
| $100,000 and over | 60 (95.2%) | 3 (4.8%) |
Public vs Private Health Insurance Coverage by Age in De Tour Village
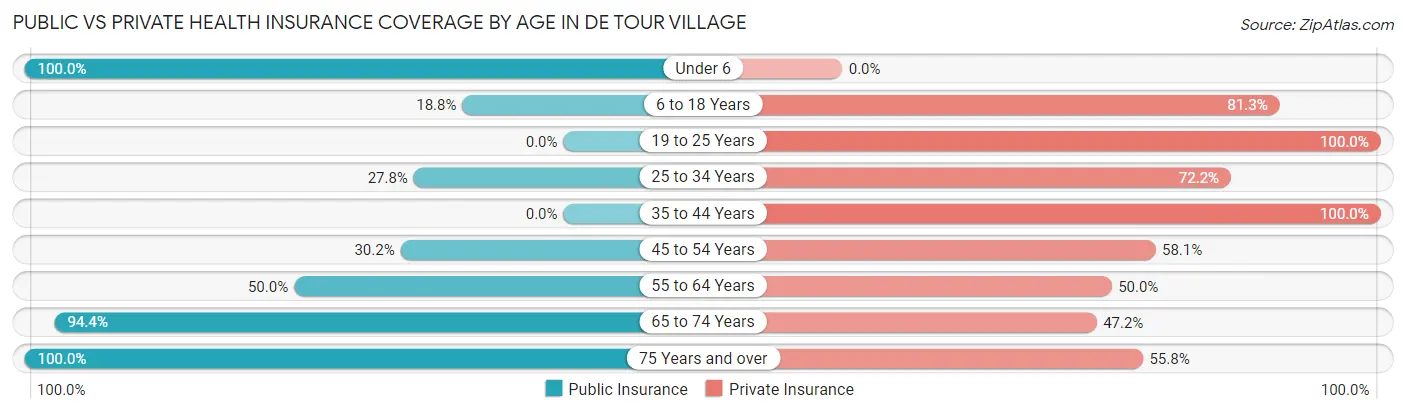
| Age Bracket | Public Insurance | Private Insurance |
| Under 6 | 6 (100.0%) | 0 (0.0%) |
| 6 to 18 Years | 3 (18.8%) | 13 (81.2%) |
| 19 to 25 Years | 0 (0.0%) | 5 (100.0%) |
| 25 to 34 Years | 5 (27.8%) | 13 (72.2%) |
| 35 to 44 Years | 0 (0.0%) | 5 (100.0%) |
| 45 to 54 Years | 13 (30.2%) | 25 (58.1%) |
| 55 to 64 Years | 9 (50.0%) | 9 (50.0%) |
| 65 to 74 Years | 68 (94.4%) | 34 (47.2%) |
| 75 Years and over | 43 (100.0%) | 24 (55.8%) |
| Total | 147 (65.0%) | 128 (56.6%) |
Disability Status by Sex by Age in De Tour Village
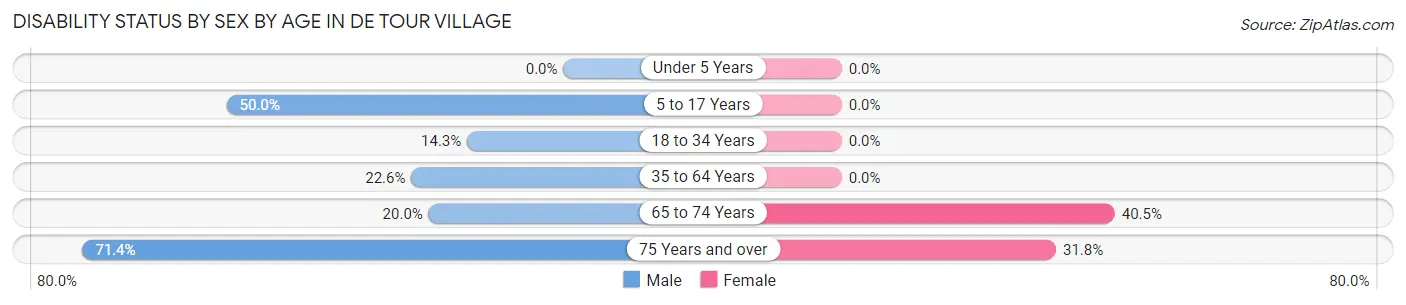
| Age Bracket | Male | Female |
| Under 5 Years | 0 (0.0%) | 0 (0.0%) |
| 5 to 17 Years | 3 (50.0%) | 0 (0.0%) |
| 18 to 34 Years | 2 (14.3%) | 0 (0.0%) |
| 35 to 64 Years | 7 (22.6%) | 0 (0.0%) |
| 65 to 74 Years | 7 (20.0%) | 15 (40.5%) |
| 75 Years and over | 15 (71.4%) | 7 (31.8%) |
Disability Class by Sex by Age in De Tour Village
Disability Class: Hearing Difficulty
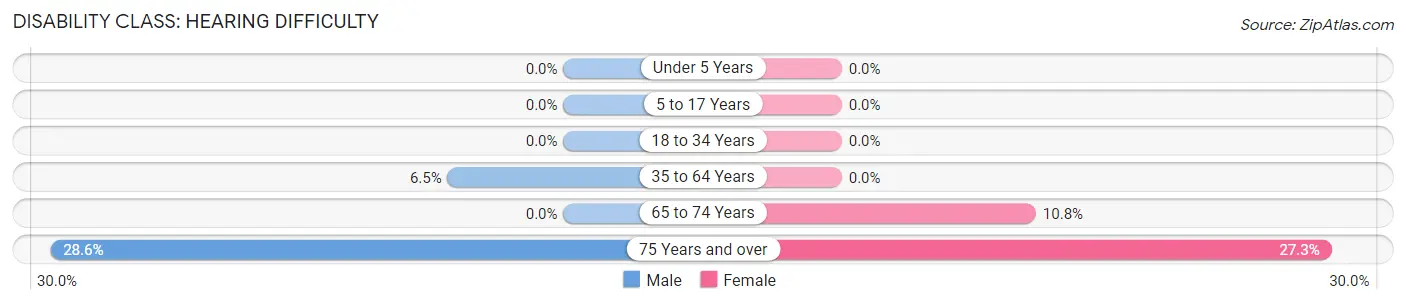
| Age Bracket | Male | Female |
| Under 5 Years | 0 (0.0%) | 0 (0.0%) |
| 5 to 17 Years | 0 (0.0%) | 0 (0.0%) |
| 18 to 34 Years | 0 (0.0%) | 0 (0.0%) |
| 35 to 64 Years | 2 (6.5%) | 0 (0.0%) |
| 65 to 74 Years | 0 (0.0%) | 4 (10.8%) |
| 75 Years and over | 6 (28.6%) | 6 (27.3%) |
Disability Class: Vision Difficulty
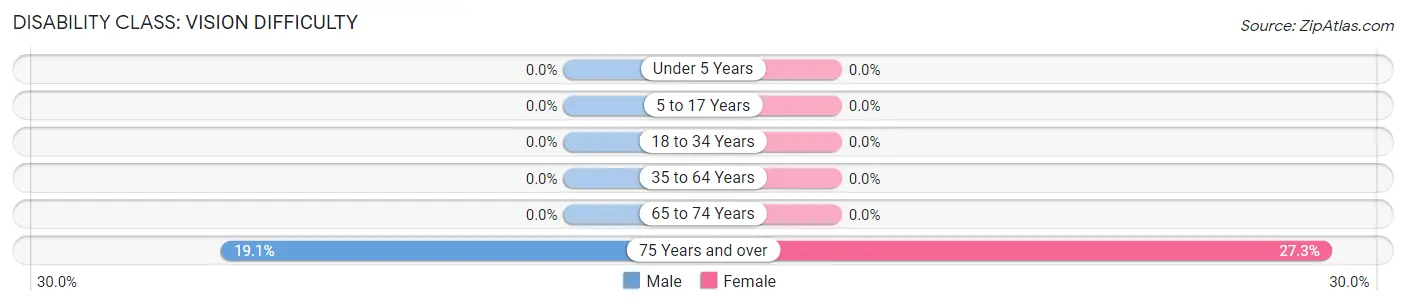
| Age Bracket | Male | Female |
| Under 5 Years | 0 (0.0%) | 0 (0.0%) |
| 5 to 17 Years | 0 (0.0%) | 0 (0.0%) |
| 18 to 34 Years | 0 (0.0%) | 0 (0.0%) |
| 35 to 64 Years | 0 (0.0%) | 0 (0.0%) |
| 65 to 74 Years | 0 (0.0%) | 0 (0.0%) |
| 75 Years and over | 4 (19.1%) | 6 (27.3%) |
Disability Class: Cognitive Difficulty
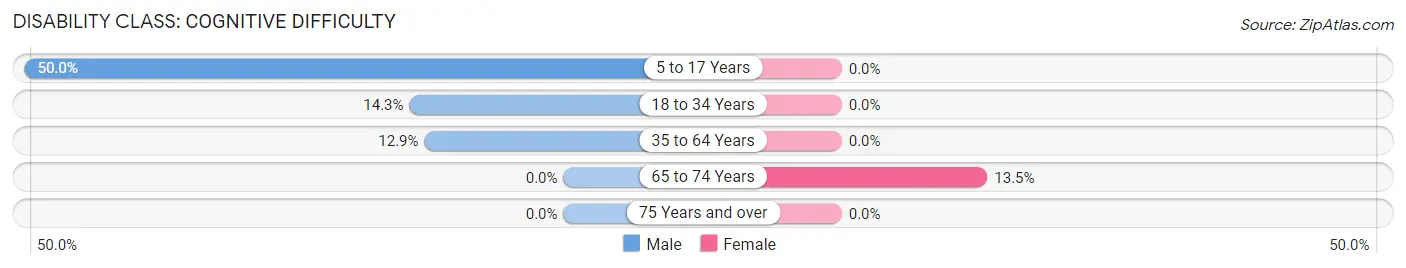
| Age Bracket | Male | Female |
| 5 to 17 Years | 3 (50.0%) | 0 (0.0%) |
| 18 to 34 Years | 2 (14.3%) | 0 (0.0%) |
| 35 to 64 Years | 4 (12.9%) | 0 (0.0%) |
| 65 to 74 Years | 0 (0.0%) | 5 (13.5%) |
| 75 Years and over | 0 (0.0%) | 0 (0.0%) |
Disability Class: Ambulatory Difficulty
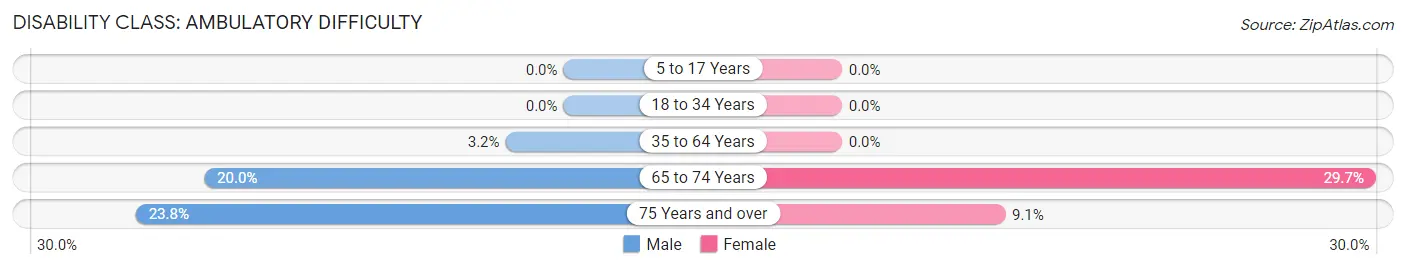
| Age Bracket | Male | Female |
| 5 to 17 Years | 0 (0.0%) | 0 (0.0%) |
| 18 to 34 Years | 0 (0.0%) | 0 (0.0%) |
| 35 to 64 Years | 1 (3.2%) | 0 (0.0%) |
| 65 to 74 Years | 7 (20.0%) | 11 (29.7%) |
| 75 Years and over | 5 (23.8%) | 2 (9.1%) |
Disability Class: Self-Care Difficulty
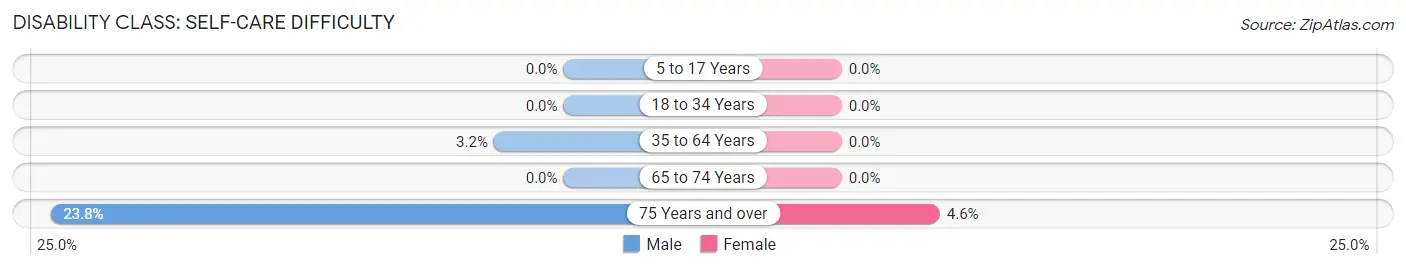
| Age Bracket | Male | Female |
| 5 to 17 Years | 0 (0.0%) | 0 (0.0%) |
| 18 to 34 Years | 0 (0.0%) | 0 (0.0%) |
| 35 to 64 Years | 1 (3.2%) | 0 (0.0%) |
| 65 to 74 Years | 0 (0.0%) | 0 (0.0%) |
| 75 Years and over | 5 (23.8%) | 1 (4.5%) |
Technology Access in De Tour Village
Computing Device Access in De Tour Village
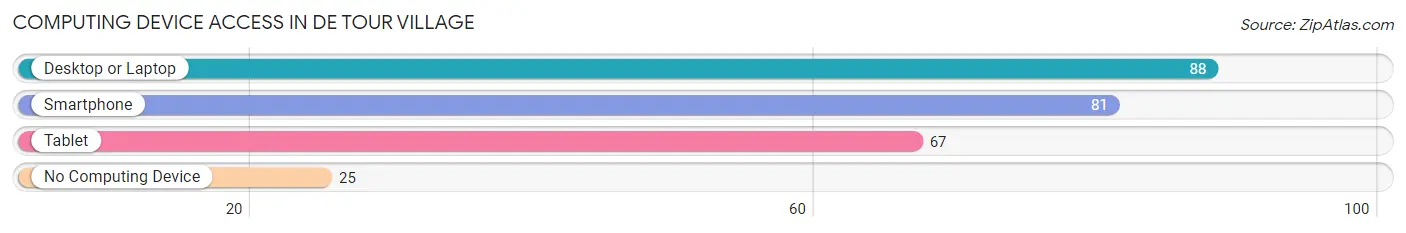
| Device Type | # Households | % Households |
| Desktop or Laptop | 88 | 69.3% |
| Smartphone | 81 | 63.8% |
| Tablet | 67 | 52.8% |
| No Computing Device | 25 | 19.7% |
| Total | 127 | 100.0% |
Internet Access in De Tour Village
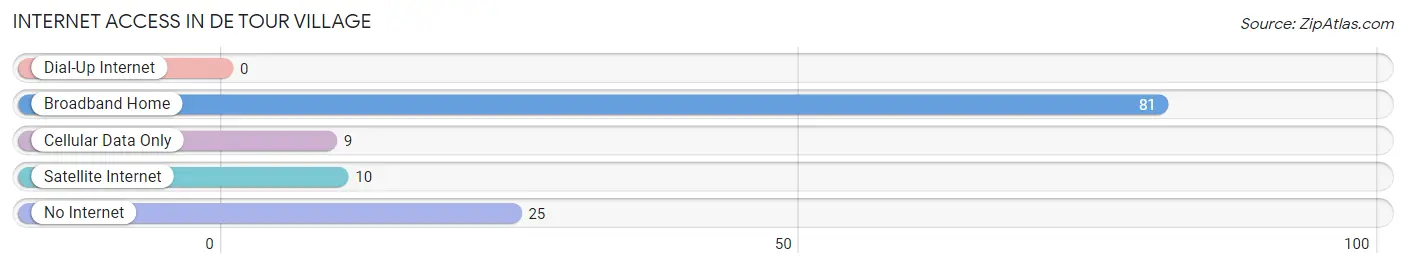
| Internet Type | # Households | % Households |
| Dial-Up Internet | 0 | 0.0% |
| Broadband Home | 81 | 63.8% |
| Cellular Data Only | 9 | 7.1% |
| Satellite Internet | 10 | 7.9% |
| No Internet | 25 | 19.7% |
| Total | 127 | 100.0% |
De Tour Village Summary
De Tour Village is a small village located in the Upper Peninsula of Michigan, United States. It is situated on the northern shore of Lake Huron, at the mouth of the St. Marys River. The village is the only incorporated municipality in Chippewa County, and is the easternmost settlement in Michigan.
History
The area around De Tour Village was first inhabited by the Ojibwe people, who used the area for fishing and hunting. The first European settlers arrived in the area in the early 19th century, and the village was founded in 1832. The village was named after the French explorer Antoine de la Mothe Cadillac, who explored the area in 1679.
The village was initially a fishing and trading post, and the local economy was based on the fur trade. In the late 19th century, the village became a popular tourist destination, and the local economy shifted to tourism. The village was incorporated in 1887.
Geography
De Tour Village is located in the Upper Peninsula of Michigan, at the mouth of the St. Marys River. The village is situated on the northern shore of Lake Huron, and is the easternmost settlement in Michigan. The village is surrounded by forests and lakes, and is a popular destination for outdoor recreation.
The village has a total area of 1.2 square miles, all of which is land. The village is located in the Eastern Time Zone, and has a humid continental climate, with cold winters and warm summers.
Economy
The economy of De Tour Village is largely based on tourism. The village is a popular destination for outdoor recreation, and is home to several resorts and campgrounds. The village also has a marina, which provides access to Lake Huron.
The village is also home to several small businesses, including restaurants, shops, and galleries. The village is also home to a small commercial fishing industry, which provides fresh fish to local restaurants and markets.
Demographics
As of the 2010 census, the population of De Tour Village was 518. The racial makeup of the village was 97.3% White, 0.4% African American, 0.4% Native American, 0.2% Asian, 0.2% from other races, and 1.5% from two or more races. Hispanic or Latino of any race were 1.2% of the population.
The median household income in De Tour Village was $37,500, and the median family income was $45,000. The per capita income for the village was $20,000. About 11.3% of families and 14.2% of the population were below the poverty line, including 18.2% of those under age 18 and 8.3% of those age 65 or over.
Common Questions
What is Per Capita Income in De Tour Village?
Per Capita income in De Tour Village is $33,909.
What is the Median Family Income in De Tour Village?
Median Family Income in De Tour Village is $66,875.
What is the Median Household income in De Tour Village?
Median Household Income in De Tour Village is $45,313.
What is Income or Wage Gap in De Tour Village?
Income or Wage Gap in De Tour Village is 10.5%.
Women in De Tour Village earn 89.5 cents for every dollar earned by a man.
What is Inequality or Gini Index in De Tour Village?
Inequality or Gini Index in De Tour Village is 0.39.
What is the Total Population of De Tour Village?
Total Population of De Tour Village is 226.
What is the Total Male Population of De Tour Village?
Total Male Population of De Tour Village is 113.
What is the Total Female Population of De Tour Village?
Total Female Population of De Tour Village is 113.
What is the Ratio of Males per 100 Females in De Tour Village?
There are 100.00 Males per 100 Females in De Tour Village.
What is the Ratio of Females per 100 Males in De Tour Village?
There are 100.00 Females per 100 Males in De Tour Village.
What is the Median Population Age in De Tour Village?
Median Population Age in De Tour Village is 66.1 Years.
What is the Average Family Size in De Tour Village
Average Family Size in De Tour Village is 3.0 People.
What is the Average Household Size in De Tour Village
Average Household Size in De Tour Village is 1.8 People.
How Large is the Labor Force in De Tour Village?
There are 76 People in the Labor Forcein in De Tour Village.
What is the Percentage of People in the Labor Force in De Tour Village?
36.7% of People are in the Labor Force in De Tour Village.
What is the Unemployment Rate in De Tour Village?
Unemployment Rate in De Tour Village is 3.9%.