Zip Codes with the Highest Percentage of Population Employed in Installation, Maintenance & Repair in Livonia, MI
RELATED REPORTS & OPTIONS
Installation, Maintenance & Repair
Livonia
Compare Zip Codes
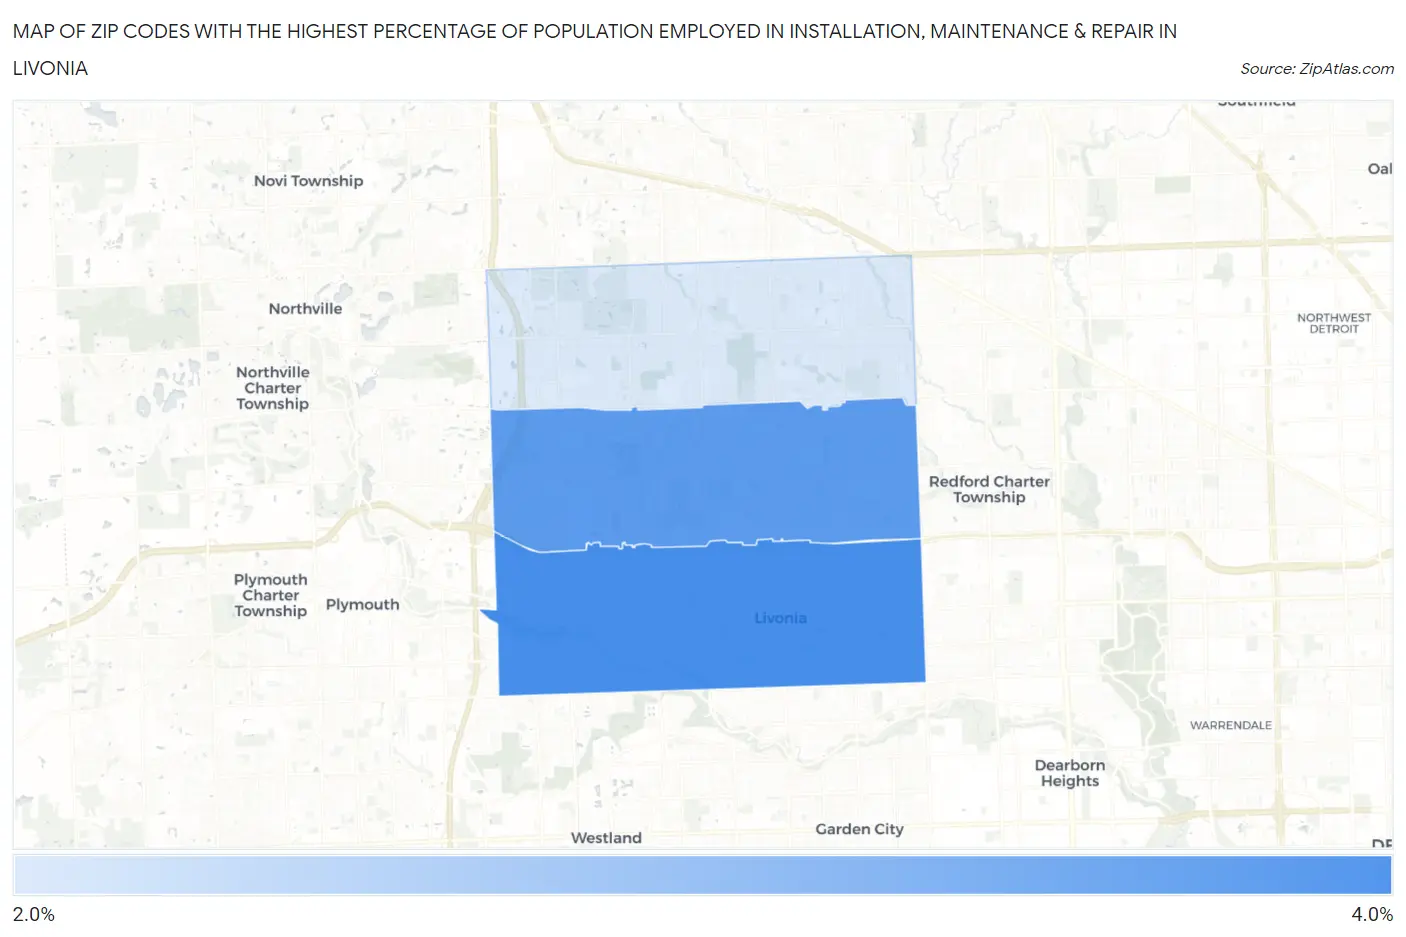
Map of Zip Codes with the Highest Percentage of Population Employed in Installation, Maintenance & Repair in Livonia
2.1%
3.5%
Zip Codes with the Highest Percentage of Population Employed in Installation, Maintenance & Repair in Livonia, MI
| Zip Code | % Employed | vs State | vs National | |
| 1. | 48150 | 3.5% | 3.1%(+0.358)#525 | 3.1%(+0.390)#14,810 |
| 2. | 48154 | 3.3% | 3.1%(+0.187)#563 | 3.1%(+0.219)#15,617 |
| 3. | 48152 | 2.1% | 3.1%(-1.02)#754 | 3.1%(-0.985)#21,624 |
1
Common Questions
What are the Top Zip Codes with the Highest Percentage of Population Employed in Installation, Maintenance & Repair in Livonia, MI?
Top Zip Codes with the Highest Percentage of Population Employed in Installation, Maintenance & Repair in Livonia, MI are:
What zip code has the Highest Percentage of Population Employed in Installation, Maintenance & Repair in Livonia, MI?
48150 has the Highest Percentage of Population Employed in Installation, Maintenance & Repair in Livonia, MI with 3.5%.
What is the Percentage of Population Employed in Installation, Maintenance & Repair in Livonia, MI?
Percentage of Population Employed in Installation, Maintenance & Repair in Livonia is 3.0%.
What is the Percentage of Population Employed in Installation, Maintenance & Repair in Michigan?
Percentage of Population Employed in Installation, Maintenance & Repair in Michigan is 3.1%.
What is the Percentage of Population Employed in Installation, Maintenance & Repair in the United States?
Percentage of Population Employed in Installation, Maintenance & Repair in the United States is 3.1%.