Zip Codes with the Highest Percentage of Population Employed in Installation, Maintenance & Repair in Battle Creek, MI
RELATED REPORTS & OPTIONS
Installation, Maintenance & Repair
Battle Creek
Compare Zip Codes
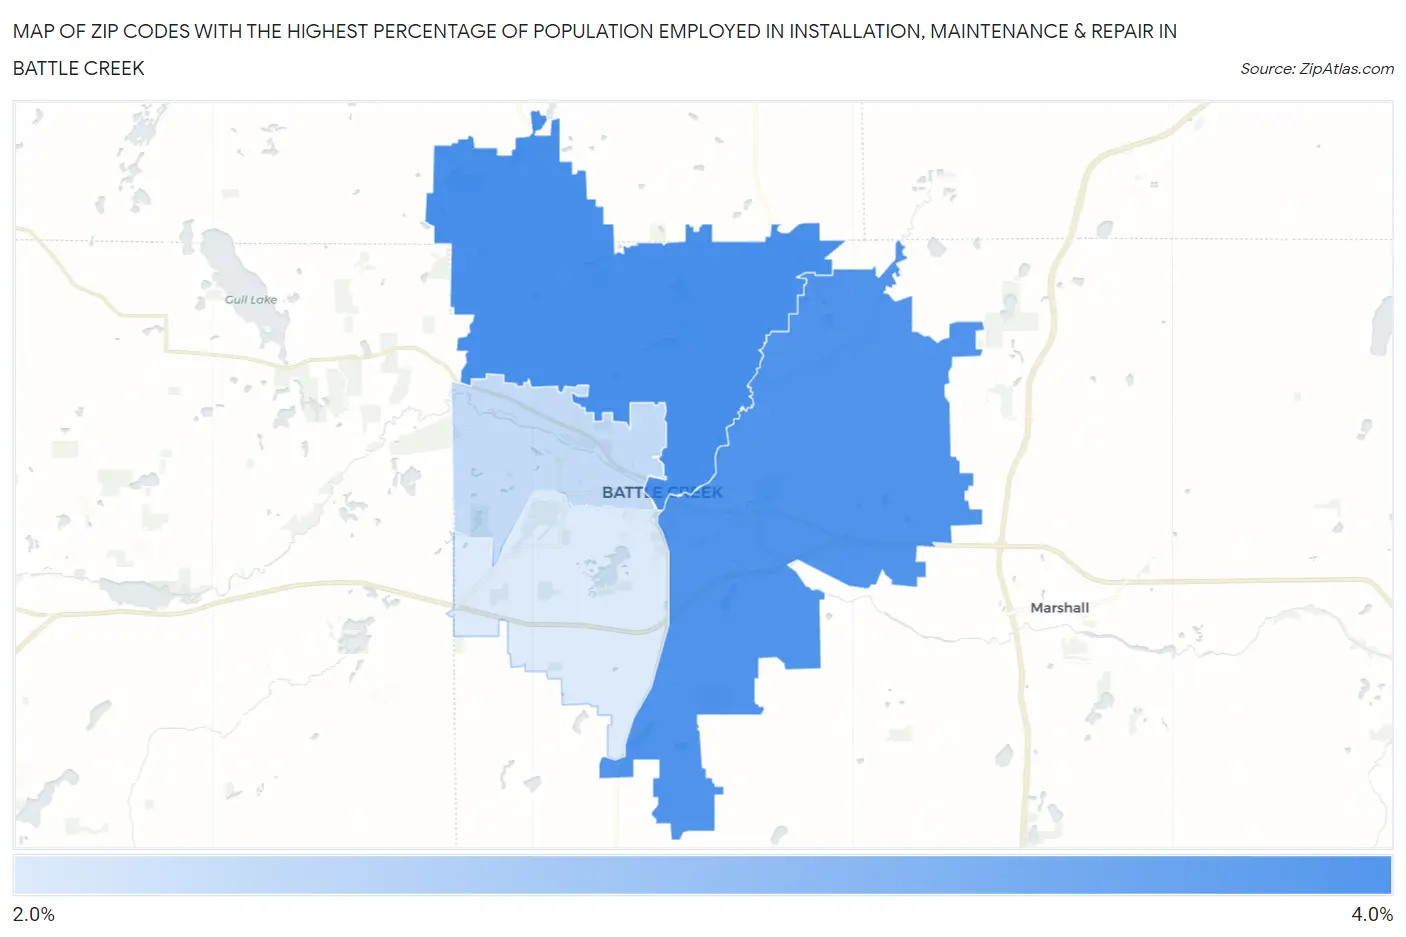
Map of Zip Codes with the Highest Percentage of Population Employed in Installation, Maintenance & Repair in Battle Creek
2.8%
3.7%
Zip Codes with the Highest Percentage of Population Employed in Installation, Maintenance & Repair in Battle Creek, MI
| Zip Code | % Employed | vs State | vs National | |
| 1. | 49017 | 3.7% | 3.1%(+0.627)#473 | 3.1%(+0.659)#13,562 |
| 2. | 49014 | 3.7% | 3.1%(+0.588)#481 | 3.1%(+0.620)#13,744 |
| 3. | 49037 | 2.9% | 3.1%(-0.159)#618 | 3.1%(-0.127)#17,289 |
| 4. | 49015 | 2.8% | 3.1%(-0.311)#645 | 3.1%(-0.280)#18,071 |
1
Common Questions
What are the Top 3 Zip Codes with the Highest Percentage of Population Employed in Installation, Maintenance & Repair in Battle Creek, MI?
Top 3 Zip Codes with the Highest Percentage of Population Employed in Installation, Maintenance & Repair in Battle Creek, MI are:
What zip code has the Highest Percentage of Population Employed in Installation, Maintenance & Repair in Battle Creek, MI?
49017 has the Highest Percentage of Population Employed in Installation, Maintenance & Repair in Battle Creek, MI with 3.7%.
What is the Percentage of Population Employed in Installation, Maintenance & Repair in Battle Creek, MI?
Percentage of Population Employed in Installation, Maintenance & Repair in Battle Creek is 2.6%.
What is the Percentage of Population Employed in Installation, Maintenance & Repair in Michigan?
Percentage of Population Employed in Installation, Maintenance & Repair in Michigan is 3.1%.
What is the Percentage of Population Employed in Installation, Maintenance & Repair in the United States?
Percentage of Population Employed in Installation, Maintenance & Repair in the United States is 3.1%.