Zip Codes with the Highest Percentage of Population Employed in Installation, Maintenance & Repair in Waterford, MI
RELATED REPORTS & OPTIONS
Installation, Maintenance & Repair
Waterford
Compare Zip Codes
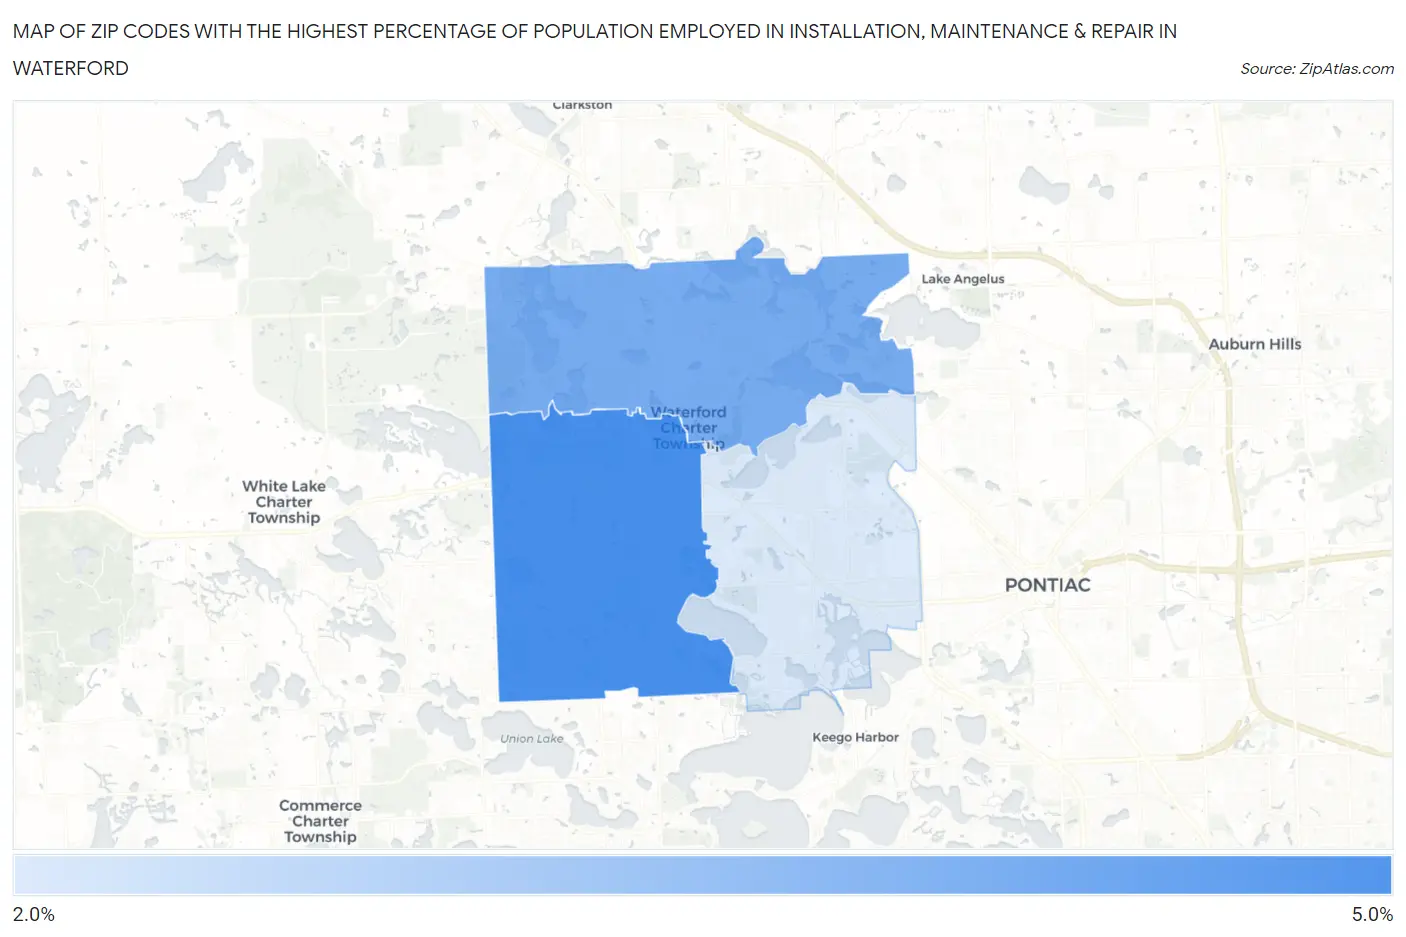
Map of Zip Codes with the Highest Percentage of Population Employed in Installation, Maintenance & Repair in Waterford
2.4%
4.3%
Zip Codes with the Highest Percentage of Population Employed in Installation, Maintenance & Repair in Waterford, MI
| Zip Code | % Employed | vs State | vs National | |
| 1. | 48327 | 4.3% | 3.1%(+1.23)#378 | 3.1%(+1.26)#11,029 |
| 2. | 48329 | 3.7% | 3.1%(+0.599)#479 | 3.1%(+0.631)#13,685 |
| 3. | 48328 | 2.4% | 3.1%(-0.725)#702 | 3.1%(-0.693)#20,195 |
1
Common Questions
What are the Top Zip Codes with the Highest Percentage of Population Employed in Installation, Maintenance & Repair in Waterford, MI?
Top Zip Codes with the Highest Percentage of Population Employed in Installation, Maintenance & Repair in Waterford, MI are:
What zip code has the Highest Percentage of Population Employed in Installation, Maintenance & Repair in Waterford, MI?
48327 has the Highest Percentage of Population Employed in Installation, Maintenance & Repair in Waterford, MI with 4.3%.
What is the Percentage of Population Employed in Installation, Maintenance & Repair in Michigan?
Percentage of Population Employed in Installation, Maintenance & Repair in Michigan is 3.1%.
What is the Percentage of Population Employed in Installation, Maintenance & Repair in the United States?
Percentage of Population Employed in Installation, Maintenance & Repair in the United States is 3.1%.