Robinwood, MD Map & Demographics
Robinwood Map
Robinwood Overview
$41,703
PER CAPITA INCOME
$99,833
AVG FAMILY INCOME
$84,904
AVG HOUSEHOLD INCOME
49.3%
WAGE / INCOME GAP [ % ]
50.7¢/ $1
WAGE / INCOME GAP [ $ ]
0.42
INEQUALITY / GINI INDEX
8,002
TOTAL POPULATION
3,575
MALE POPULATION
4,427
FEMALE POPULATION
80.75
MALES / 100 FEMALES
123.83
FEMALES / 100 MALES
37.5
MEDIAN AGE
3.2
AVG FAMILY SIZE
2.7
AVG HOUSEHOLD SIZE
4,219
LABOR FORCE [ PEOPLE ]
68.3%
PERCENT IN LABOR FORCE
3.5%
UNEMPLOYMENT RATE
Income in Robinwood
Income Overview in Robinwood
Per Capita Income in Robinwood is $41,703, while median incomes of families and households are $99,833 and $84,904 respectively.
| Characteristic | Number | Measure |
| Per Capita Income | 8,002 | $41,703 |
| Median Family Income | 1,996 | $99,833 |
| Mean Family Income | 1,996 | $120,141 |
| Median Household Income | 2,914 | $84,904 |
| Mean Household Income | 2,914 | $105,042 |
| Income Deficit | 1,996 | $0 |
| Wage / Income Gap (%) | 8,002 | 49.28% |
| Wage / Income Gap ($) | 8,002 | 50.72¢ per $1 |
| Gini / Inequality Index | 8,002 | 0.42 |
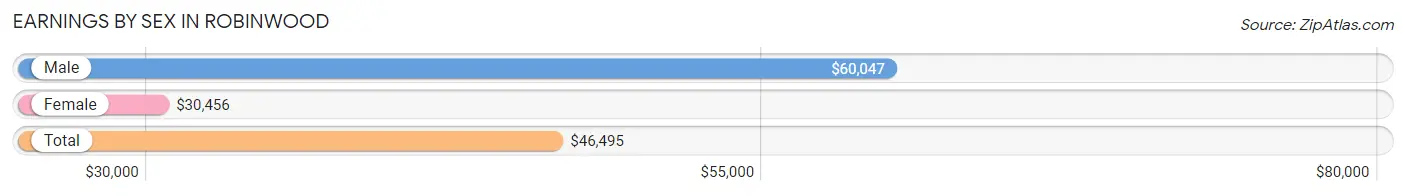
Earnings by Sex in Robinwood
Average Earnings in Robinwood are $46,495, $60,047 for men and $30,456 for women, a difference of 49.3%.
| Sex | Number | Average Earnings |
| Male | 2,024 (45.2%) | $60,047 |
| Female | 2,451 (54.8%) | $30,456 |
| Total | 4,475 (100.0%) | $46,495 |
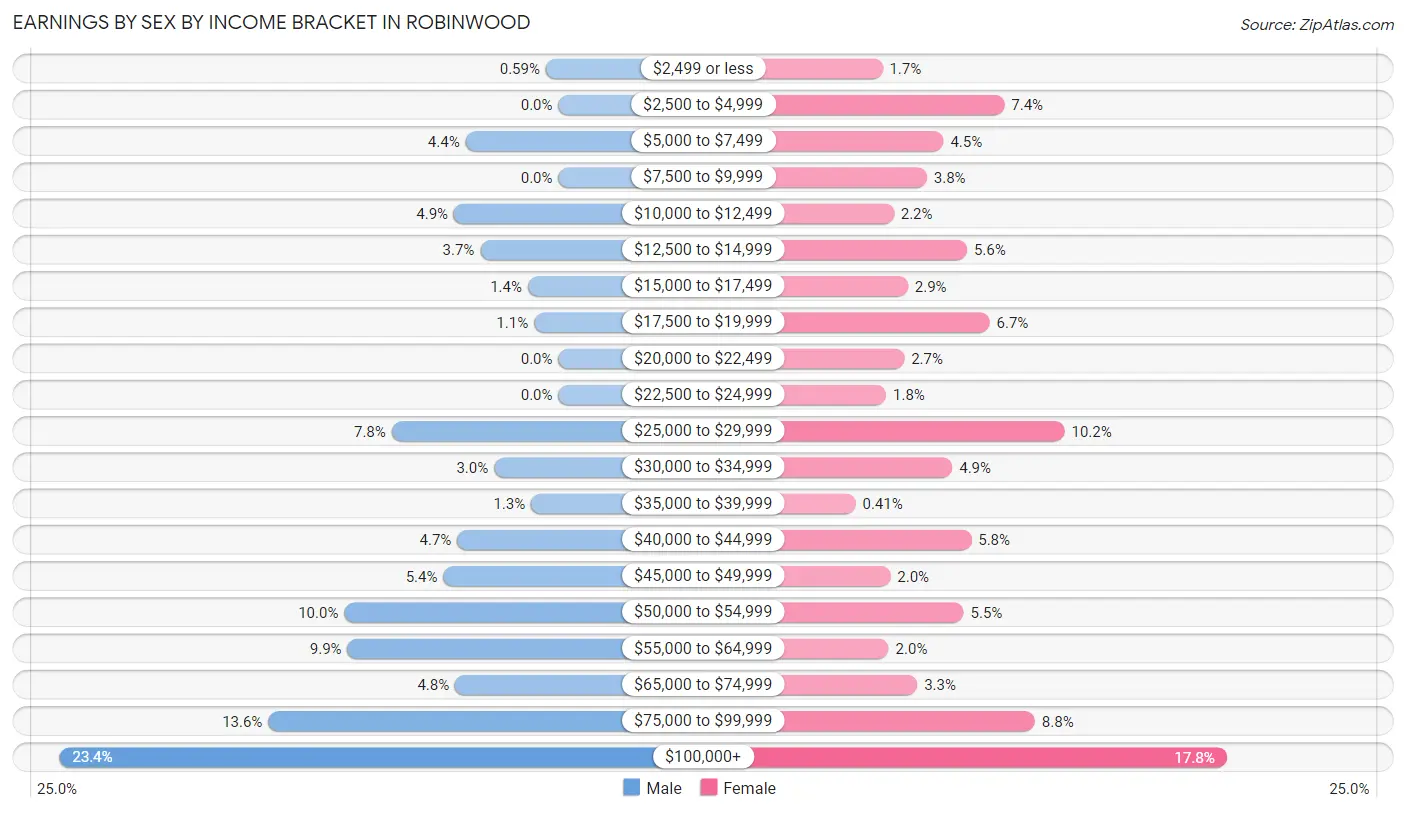
Earnings by Sex by Income Bracket in Robinwood
The most common earnings brackets in Robinwood are $100,000+ for men (473 | 23.4%) and $100,000+ for women (436 | 17.8%).
| Income | Male | Female |
| $2,499 or less | 12 (0.6%) | 41 (1.7%) |
| $2,500 to $4,999 | 0 (0.0%) | 181 (7.4%) |
| $5,000 to $7,499 | 88 (4.3%) | 111 (4.5%) |
| $7,500 to $9,999 | 0 (0.0%) | 92 (3.7%) |
| $10,000 to $12,499 | 99 (4.9%) | 54 (2.2%) |
| $12,500 to $14,999 | 74 (3.7%) | 138 (5.6%) |
| $15,000 to $17,499 | 29 (1.4%) | 70 (2.9%) |
| $17,500 to $19,999 | 23 (1.1%) | 164 (6.7%) |
| $20,000 to $22,499 | 0 (0.0%) | 66 (2.7%) |
| $22,500 to $24,999 | 0 (0.0%) | 45 (1.8%) |
| $25,000 to $29,999 | 158 (7.8%) | 250 (10.2%) |
| $30,000 to $34,999 | 61 (3.0%) | 121 (4.9%) |
| $35,000 to $39,999 | 26 (1.3%) | 10 (0.4%) |
| $40,000 to $44,999 | 96 (4.7%) | 143 (5.8%) |
| $45,000 to $49,999 | 109 (5.4%) | 50 (2.0%) |
| $50,000 to $54,999 | 203 (10.0%) | 134 (5.5%) |
| $55,000 to $64,999 | 200 (9.9%) | 48 (2.0%) |
| $65,000 to $74,999 | 98 (4.8%) | 81 (3.3%) |
| $75,000 to $99,999 | 275 (13.6%) | 216 (8.8%) |
| $100,000+ | 473 (23.4%) | 436 (17.8%) |
| Total | 2,024 (100.0%) | 2,451 (100.0%) |
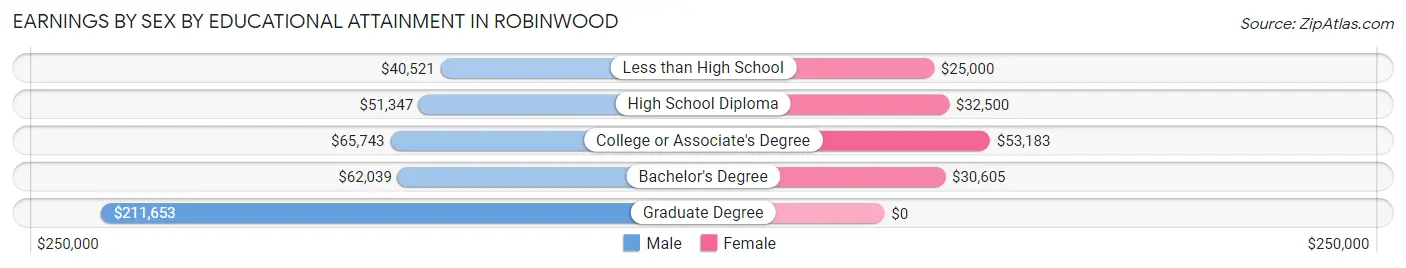
Earnings by Sex by Educational Attainment in Robinwood
Average earnings in Robinwood are $61,321 for men and $42,846 for women, a difference of 30.1%. Men with an educational attainment of graduate degree enjoy the highest average annual earnings of $211,653, while those with less than high school education earn the least with $40,521. Women with an educational attainment of college or associate's degree earn the most with the average annual earnings of $53,183, while those with less than high school education have the smallest earnings of $25,000.
| Educational Attainment | Male Income | Female Income |
| Less than High School | $40,521 | $25,000 |
| High School Diploma | $51,347 | $32,500 |
| College or Associate's Degree | $65,743 | $53,183 |
| Bachelor's Degree | $62,039 | $30,605 |
| Graduate Degree | $211,653 | $0 |
| Total | $61,321 | $42,846 |
Family Income in Robinwood
Family Income Brackets in Robinwood
According to the Robinwood family income data, there are 403 families falling into the $100,000 to $149,999 income range, which is the most common income bracket and makes up 20.2% of all families.
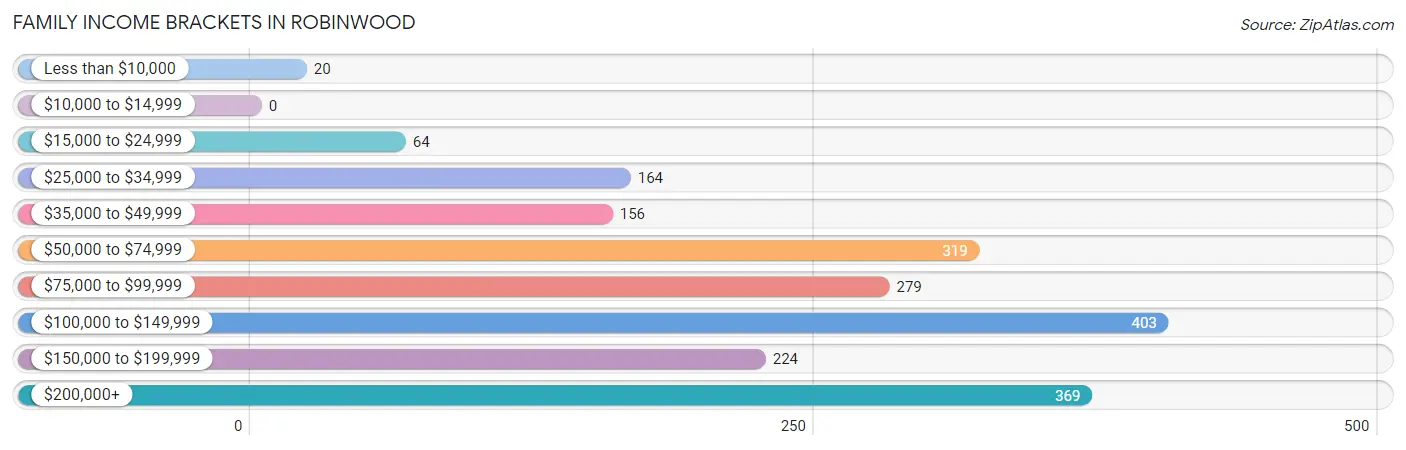
| Income Bracket | # Families | % Families |
| Less than $10,000 | 20 | 1.0% |
| $10,000 to $14,999 | 0 | 0.0% |
| $15,000 to $24,999 | 64 | 3.2% |
| $25,000 to $34,999 | 164 | 8.2% |
| $35,000 to $49,999 | 156 | 7.8% |
| $50,000 to $74,999 | 319 | 16.0% |
| $75,000 to $99,999 | 279 | 14.0% |
| $100,000 to $149,999 | 403 | 20.2% |
| $150,000 to $199,999 | 224 | 11.2% |
| $200,000+ | 369 | 18.5% |
Family Income by Famaliy Size in Robinwood
5-person families (141 | 7.1%) account for the highest median family income in Robinwood with $250,001 per family, while 5-person families (141 | 7.1%) have the highest median income of $50,000 per family member.
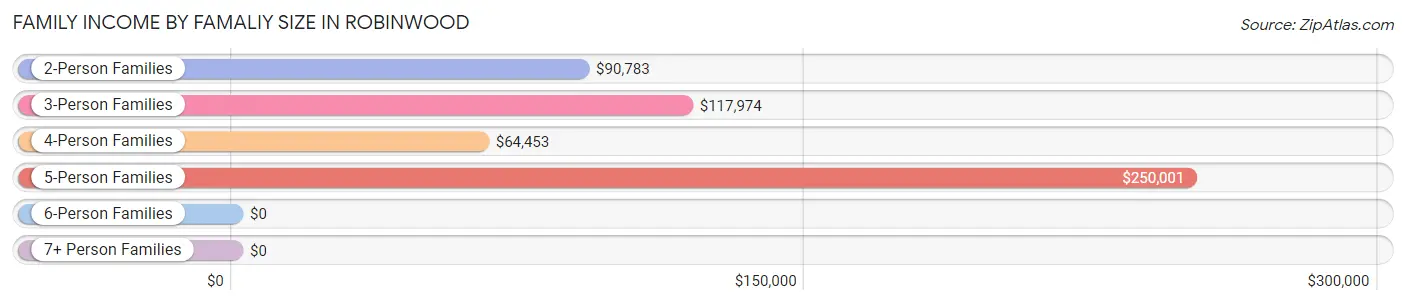
| Income Bracket | # Families | Median Income |
| 2-Person Families | 894 (44.8%) | $90,783 |
| 3-Person Families | 603 (30.2%) | $117,974 |
| 4-Person Families | 199 (10.0%) | $64,453 |
| 5-Person Families | 141 (7.1%) | $250,001 |
| 6-Person Families | 88 (4.4%) | $0 |
| 7+ Person Families | 71 (3.6%) | $0 |
| Total | 1,996 (100.0%) | $99,833 |
Family Income by Number of Earners in Robinwood
The median family income in Robinwood is $99,833, with families comprising 3+ earners (308) having the highest median family income of $241,607, while families with no earners (250) have the lowest median family income of $54,667, accounting for 15.4% and 12.5% of families, respectively.
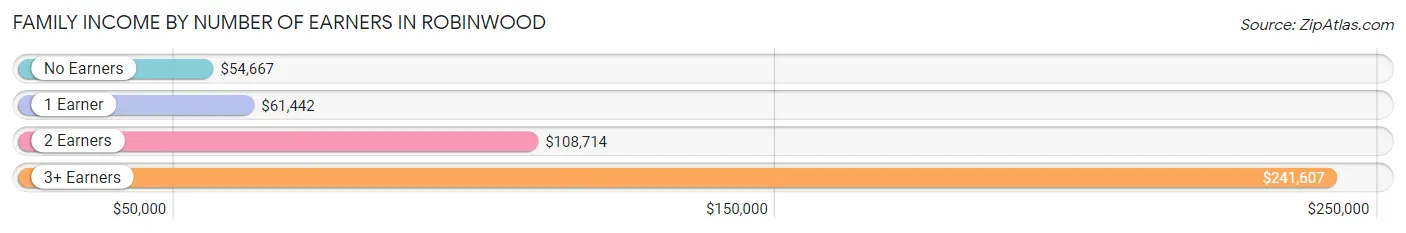
| Number of Earners | # Families | Median Income |
| No Earners | 250 (12.5%) | $54,667 |
| 1 Earner | 471 (23.6%) | $61,442 |
| 2 Earners | 967 (48.4%) | $108,714 |
| 3+ Earners | 308 (15.4%) | $241,607 |
| Total | 1,996 (100.0%) | $99,833 |
Household Income in Robinwood
Household Income Brackets in Robinwood
With 481 households falling in the category, the $100,000 to $149,999 income range is the most frequent in Robinwood, accounting for 16.5% of all households. In contrast, only 52 households (1.8%) fall into the $10,000 to $14,999 income bracket, making it the least populous group.
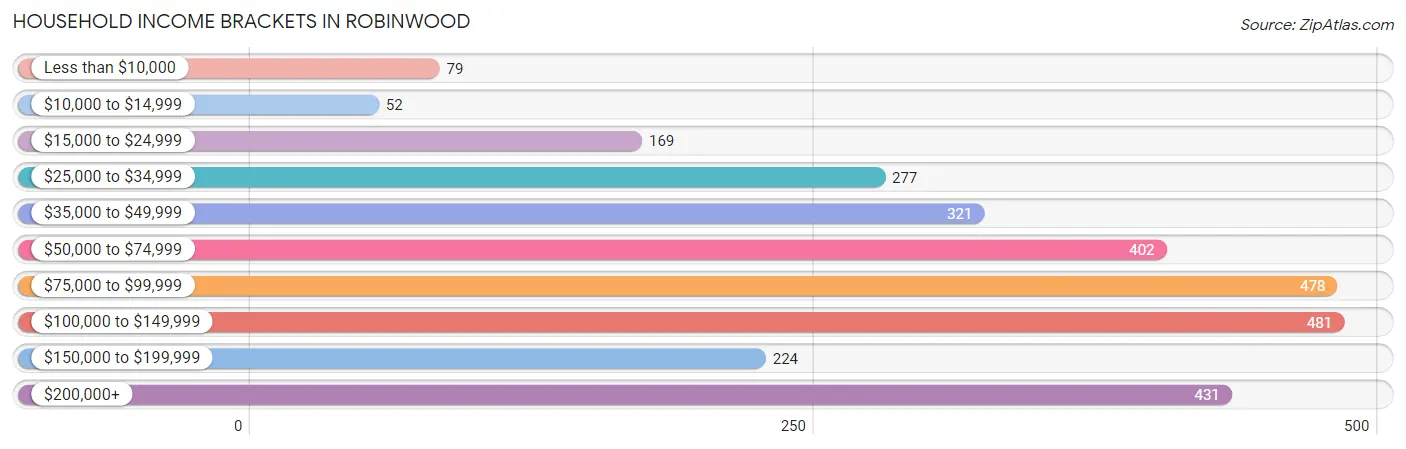
| Income Bracket | # Households | % Households |
| Less than $10,000 | 79 | 2.7% |
| $10,000 to $14,999 | 52 | 1.8% |
| $15,000 to $24,999 | 169 | 5.8% |
| $25,000 to $34,999 | 277 | 9.5% |
| $35,000 to $49,999 | 321 | 11.0% |
| $50,000 to $74,999 | 402 | 13.8% |
| $75,000 to $99,999 | 478 | 16.4% |
| $100,000 to $149,999 | 481 | 16.5% |
| $150,000 to $199,999 | 224 | 7.7% |
| $200,000+ | 431 | 14.8% |
Household Income by Householder Age in Robinwood
The median household income in Robinwood is $84,904, with the highest median household income of $95,242 found in the 45 to 64 years age bracket for the primary householder. A total of 932 households (32.0%) fall into this category. Meanwhile, the 15 to 24 years age bracket for the primary householder has the lowest median household income of $0, with 97 households (3.3%) in this group.
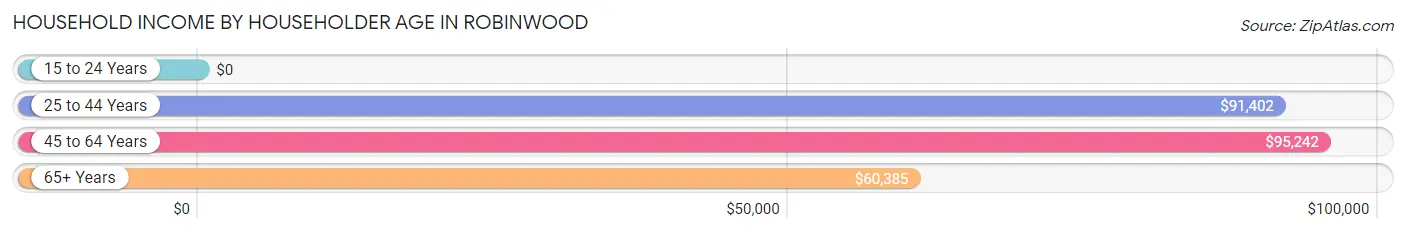
| Income Bracket | # Households | Median Income |
| 15 to 24 Years | 97 (3.3%) | $0 |
| 25 to 44 Years | 1,055 (36.2%) | $91,402 |
| 45 to 64 Years | 932 (32.0%) | $95,242 |
| 65+ Years | 830 (28.5%) | $60,385 |
| Total | 2,914 (100.0%) | $84,904 |
Poverty in Robinwood
Income Below Poverty by Sex and Age in Robinwood
With 9.8% poverty level for males and 5.9% for females among the residents of Robinwood, 6 to 11 year old males and 75 year old and over females are the most vulnerable to poverty, with 140 males (42.8%) and 63 females (13.5%) in their respective age groups living below the poverty level.
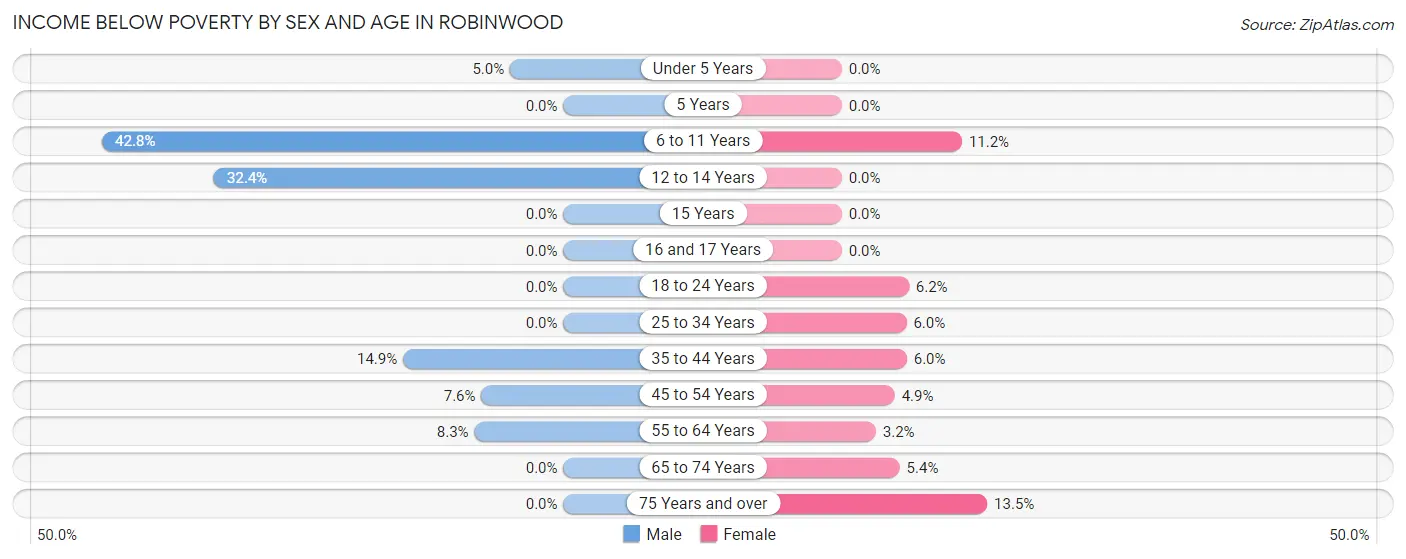
| Age Bracket | Male | Female |
| Under 5 Years | 26 (5.0%) | 0 (0.0%) |
| 5 Years | 0 (0.0%) | 0 (0.0%) |
| 6 to 11 Years | 140 (42.8%) | 32 (11.2%) |
| 12 to 14 Years | 36 (32.4%) | 0 (0.0%) |
| 15 Years | 0 (0.0%) | 0 (0.0%) |
| 16 and 17 Years | 0 (0.0%) | 0 (0.0%) |
| 18 to 24 Years | 0 (0.0%) | 28 (6.2%) |
| 25 to 34 Years | 0 (0.0%) | 46 (6.0%) |
| 35 to 44 Years | 79 (14.9%) | 33 (6.0%) |
| 45 to 54 Years | 30 (7.6%) | 24 (4.9%) |
| 55 to 64 Years | 34 (8.3%) | 17 (3.2%) |
| 65 to 74 Years | 0 (0.0%) | 16 (5.4%) |
| 75 Years and over | 0 (0.0%) | 63 (13.5%) |
| Total | 345 (9.8%) | 259 (5.9%) |
Income Above Poverty by Sex and Age in Robinwood
According to the poverty statistics in Robinwood, males aged 5 years and females aged under 5 years are the age groups that are most secure financially, with 100.0% of males and 100.0% of females in these age groups living above the poverty line.
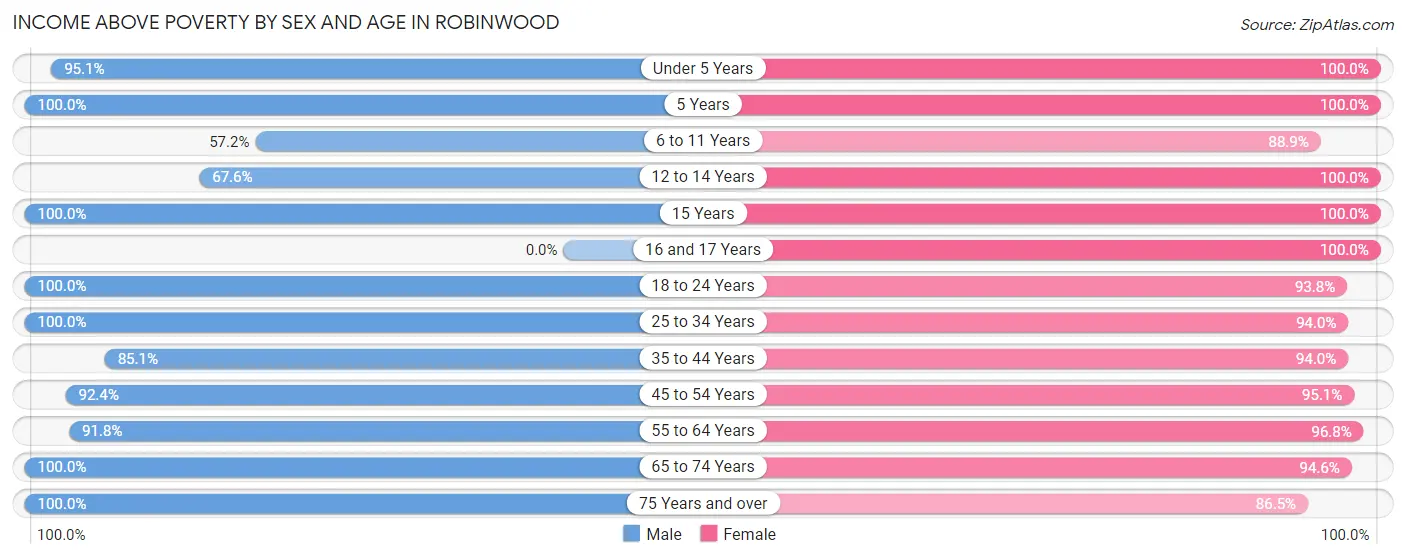
| Age Bracket | Male | Female |
| Under 5 Years | 499 (95.1%) | 297 (100.0%) |
| 5 Years | 13 (100.0%) | 11 (100.0%) |
| 6 to 11 Years | 187 (57.2%) | 255 (88.8%) |
| 12 to 14 Years | 75 (67.6%) | 94 (100.0%) |
| 15 Years | 113 (100.0%) | 34 (100.0%) |
| 16 and 17 Years | 0 (0.0%) | 101 (100.0%) |
| 18 to 24 Years | 54 (100.0%) | 422 (93.8%) |
| 25 to 34 Years | 593 (100.0%) | 721 (94.0%) |
| 35 to 44 Years | 452 (85.1%) | 514 (94.0%) |
| 45 to 54 Years | 364 (92.4%) | 465 (95.1%) |
| 55 to 64 Years | 378 (91.7%) | 521 (96.8%) |
| 65 to 74 Years | 296 (100.0%) | 282 (94.6%) |
| 75 Years and over | 161 (100.0%) | 404 (86.5%) |
| Total | 3,185 (90.2%) | 4,121 (94.1%) |
Income Below Poverty Among Married-Couple Families in Robinwood
The poverty statistics for married-couple families in Robinwood show that 4.3% or 55 of the total 1,279 families live below the poverty line. Families with 3 or 4 children have the highest poverty rate of 25.9%, comprising of 36 families. On the other hand, families with 1 or 2 children have the lowest poverty rate of 0.0%, which includes 0 families.
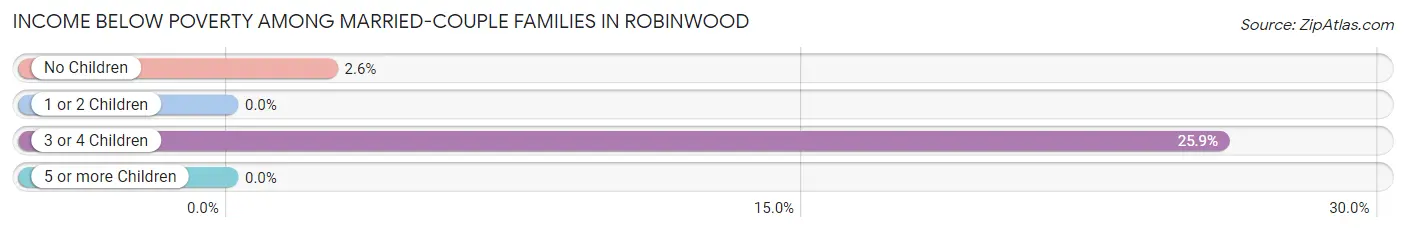
| Children | Above Poverty | Below Poverty |
| No Children | 713 (97.4%) | 19 (2.6%) |
| 1 or 2 Children | 396 (100.0%) | 0 (0.0%) |
| 3 or 4 Children | 103 (74.1%) | 36 (25.9%) |
| 5 or more Children | 12 (100.0%) | 0 (0.0%) |
| Total | 1,224 (95.7%) | 55 (4.3%) |
Income Below Poverty Among Single-Parent Households in Robinwood
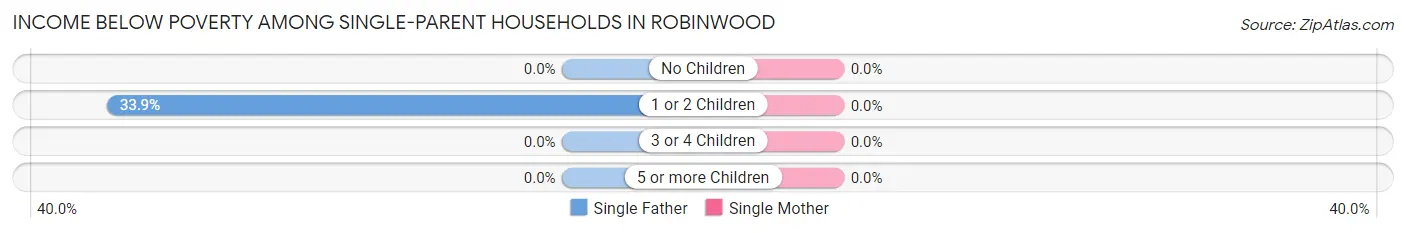
| Children | Single Father | Single Mother |
| No Children | 0 (0.0%) | 0 (0.0%) |
| 1 or 2 Children | 63 (33.9%) | 0 (0.0%) |
| 3 or 4 Children | 0 (0.0%) | 0 (0.0%) |
| 5 or more Children | 0 (0.0%) | 0 (0.0%) |
| Total | 63 (17.8%) | 0 (0.0%) |
Income Below Poverty Among Married-Couple vs Single-Parent Households in Robinwood
The poverty data for Robinwood shows that 55 of the married-couple family households (4.3%) and 63 of the single-parent households (8.8%) are living below the poverty level. Within the married-couple family households, those with 3 or 4 children have the highest poverty rate, with 36 households (25.9%) falling below the poverty line. Among the single-parent households, those with 1 or 2 children have the highest poverty rate, with 63 household (23.1%) living below poverty.
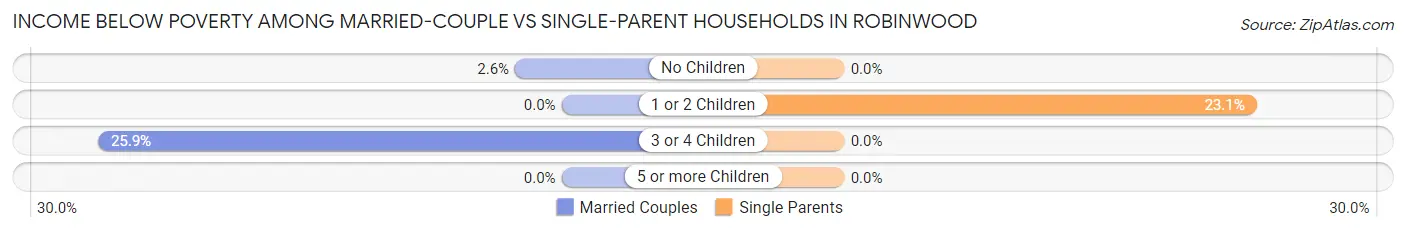
| Children | Married-Couple Families | Single-Parent Households |
| No Children | 19 (2.6%) | 0 (0.0%) |
| 1 or 2 Children | 0 (0.0%) | 63 (23.1%) |
| 3 or 4 Children | 36 (25.9%) | 0 (0.0%) |
| 5 or more Children | 0 (0.0%) | 0 (0.0%) |
| Total | 55 (4.3%) | 63 (8.8%) |
Race in Robinwood
The most populous races in Robinwood are White / Caucasian (5,326 | 66.6%), Hispanic or Latino (1,178 | 14.7%), and Two or more Races (1,091 | 13.6%).
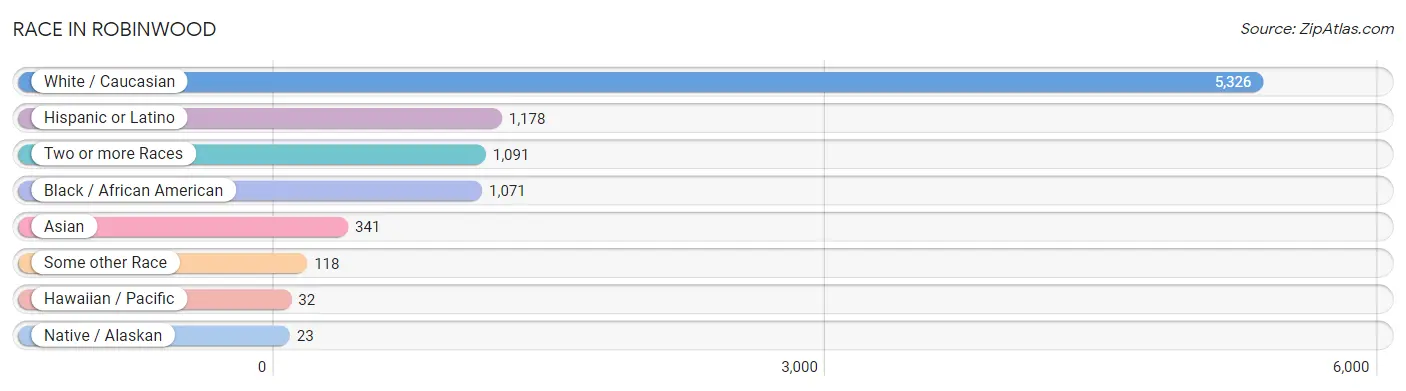
| Race | # Population | % Population |
| Asian | 341 | 4.3% |
| Black / African American | 1,071 | 13.4% |
| Hawaiian / Pacific | 32 | 0.4% |
| Hispanic or Latino | 1,178 | 14.7% |
| Native / Alaskan | 23 | 0.3% |
| White / Caucasian | 5,326 | 66.6% |
| Two or more Races | 1,091 | 13.6% |
| Some other Race | 118 | 1.5% |
| Total | 8,002 | 100.0% |
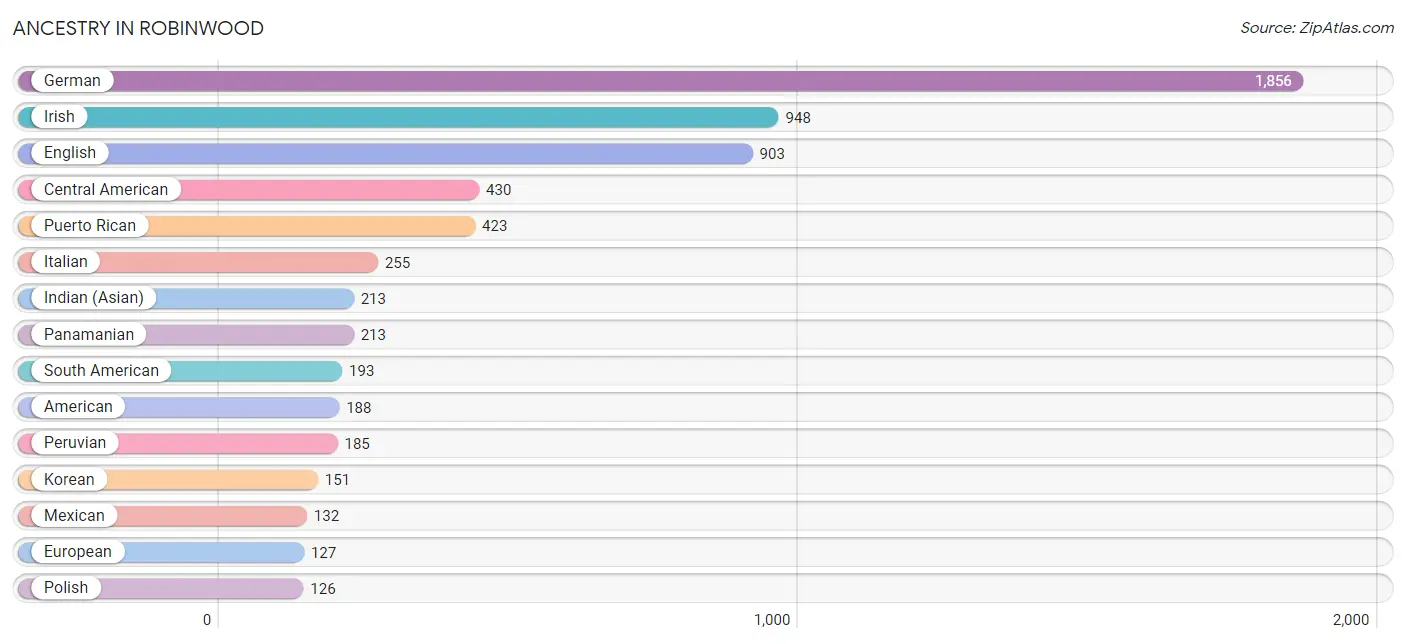
Ancestry in Robinwood
The most populous ancestries reported in Robinwood are German (1,856 | 23.2%), Irish (948 | 11.8%), English (903 | 11.3%), Central American (430 | 5.4%), and Puerto Rican (423 | 5.3%), together accounting for 57.0% of all Robinwood residents.
| Ancestry | # Population | % Population |
| African | 62 | 0.8% |
| American | 188 | 2.4% |
| Arab | 50 | 0.6% |
| Armenian | 11 | 0.1% |
| Austrian | 62 | 0.8% |
| Bermudan | 100 | 1.3% |
| British | 58 | 0.7% |
| Central American | 430 | 5.4% |
| Czechoslovakian | 105 | 1.3% |
| Dutch | 16 | 0.2% |
| Ecuadorian | 8 | 0.1% |
| English | 903 | 11.3% |
| European | 127 | 1.6% |
| French | 86 | 1.1% |
| German | 1,856 | 23.2% |
| Guatemalan | 62 | 0.8% |
| Honduran | 71 | 0.9% |
| Indian (Asian) | 213 | 2.7% |
| Irish | 948 | 11.8% |
| Italian | 255 | 3.2% |
| Korean | 151 | 1.9% |
| Mexican | 132 | 1.7% |
| Native Hawaiian | 32 | 0.4% |
| Nigerian | 47 | 0.6% |
| Norwegian | 72 | 0.9% |
| Panamanian | 213 | 2.7% |
| Pennsylvania German | 7 | 0.1% |
| Peruvian | 185 | 2.3% |
| Polish | 126 | 1.6% |
| Portuguese | 31 | 0.4% |
| Puerto Rican | 423 | 5.3% |
| Romanian | 47 | 0.6% |
| Russian | 20 | 0.3% |
| Salvadoran | 84 | 1.1% |
| Scandinavian | 48 | 0.6% |
| Scotch-Irish | 58 | 0.7% |
| Scottish | 41 | 0.5% |
| Slovak | 25 | 0.3% |
| South American | 193 | 2.4% |
| Subsaharan African | 109 | 1.4% |
| Swedish | 12 | 0.2% |
| Swiss | 29 | 0.4% |
| Thai | 97 | 1.2% |
| Welsh | 77 | 1.0% |
| West Indian | 25 | 0.3% | View All 45 Rows |
Immigrants in Robinwood
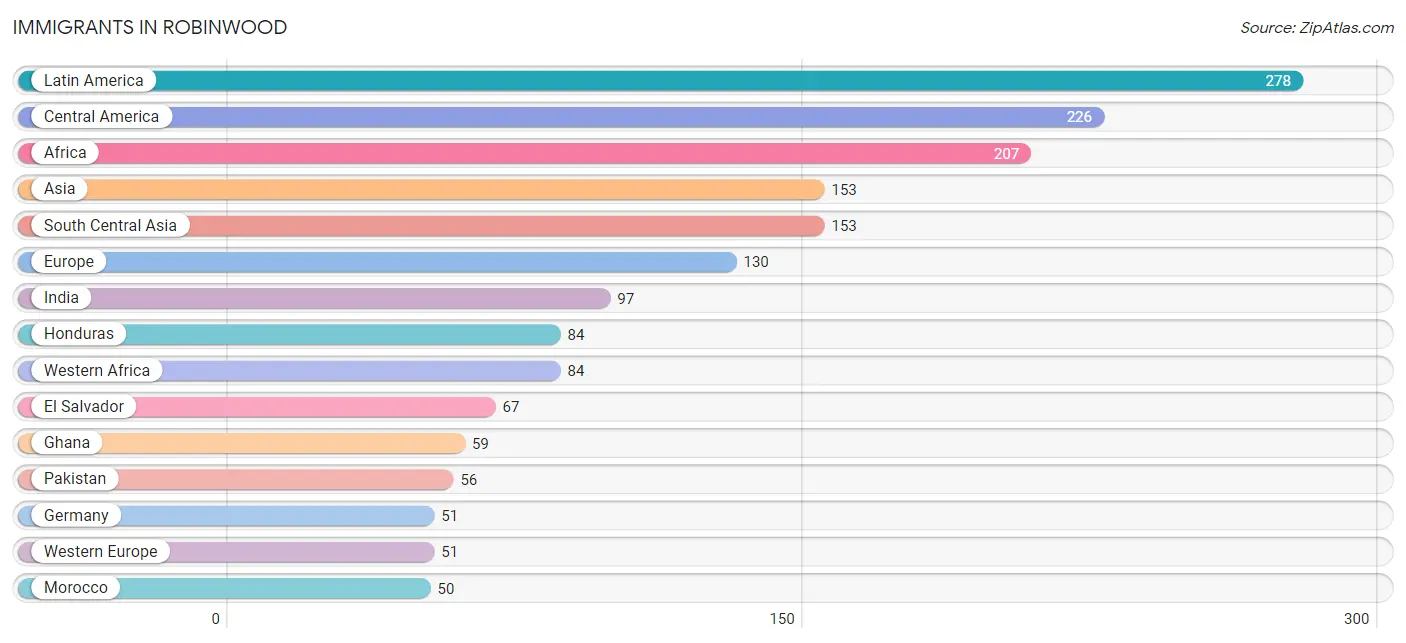
The most numerous immigrant groups reported in Robinwood came from Latin America (278 | 3.5%), Central America (226 | 2.8%), Africa (207 | 2.6%), Asia (153 | 1.9%), and South Central Asia (153 | 1.9%), together accounting for 12.7% of all Robinwood residents.
| Immigration Origin | # Population | % Population |
| Africa | 207 | 2.6% |
| Asia | 153 | 1.9% |
| Canada | 17 | 0.2% |
| Caribbean | 11 | 0.1% |
| Central America | 226 | 2.8% |
| Czechoslovakia | 32 | 0.4% |
| Dominican Republic | 11 | 0.1% |
| Eastern Africa | 30 | 0.4% |
| Eastern Europe | 32 | 0.4% |
| Ecuador | 8 | 0.1% |
| El Salvador | 67 | 0.8% |
| Europe | 130 | 1.6% |
| Germany | 51 | 0.6% |
| Ghana | 59 | 0.7% |
| Guatemala | 10 | 0.1% |
| Honduras | 84 | 1.1% |
| India | 97 | 1.2% |
| Latin America | 278 | 3.5% |
| Mexico | 33 | 0.4% |
| Morocco | 50 | 0.6% |
| Nigeria | 25 | 0.3% |
| Northern Africa | 50 | 0.6% |
| Northern Europe | 16 | 0.2% |
| Pakistan | 56 | 0.7% |
| Panama | 32 | 0.4% |
| Peru | 33 | 0.4% |
| Portugal | 31 | 0.4% |
| Scotland | 16 | 0.2% |
| South America | 41 | 0.5% |
| South Central Asia | 153 | 1.9% |
| Southern Europe | 31 | 0.4% |
| Western Africa | 84 | 1.1% |
| Western Europe | 51 | 0.6% | View All 33 Rows |
Sex and Age in Robinwood
Sex and Age in Robinwood
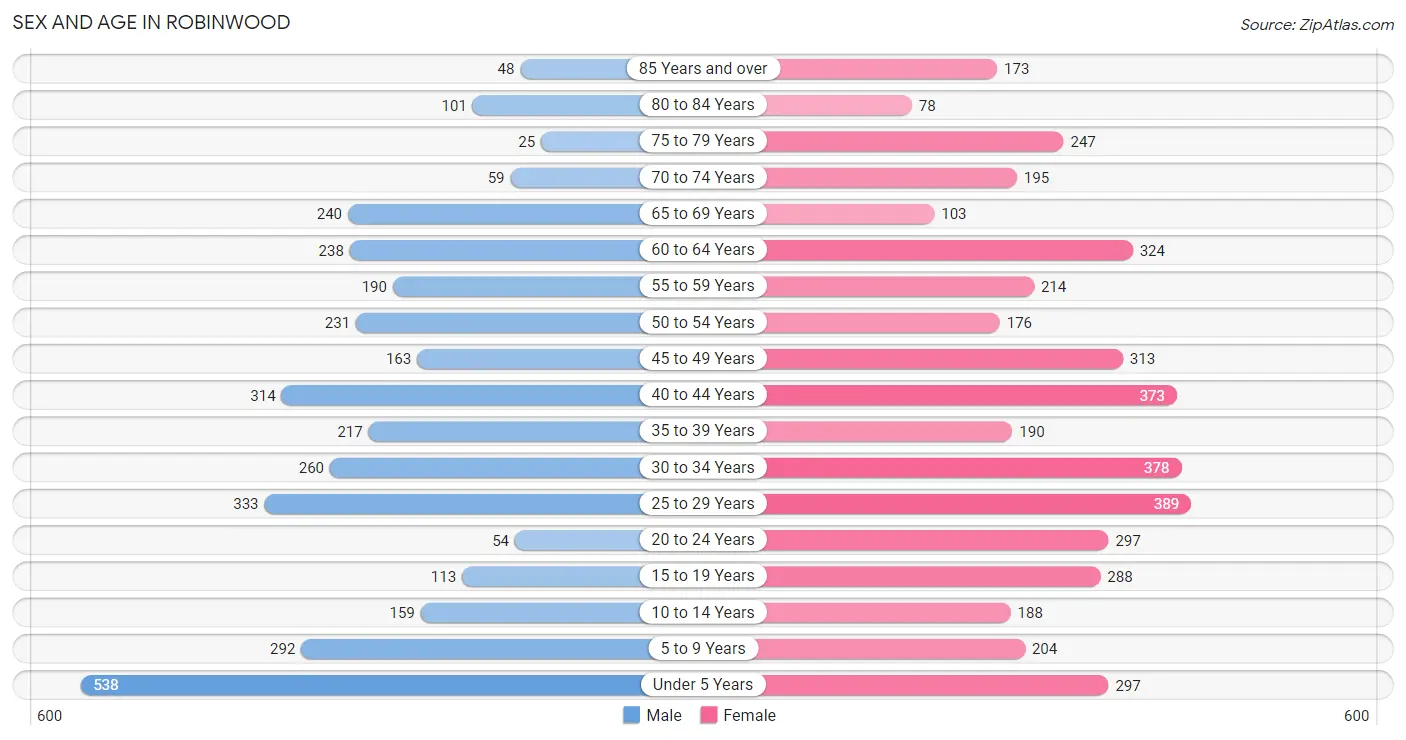
The most populous age groups in Robinwood are Under 5 Years (538 | 15.0%) for men and 25 to 29 Years (389 | 8.8%) for women.
| Age Bracket | Male | Female |
| Under 5 Years | 538 (15.0%) | 297 (6.7%) |
| 5 to 9 Years | 292 (8.2%) | 204 (4.6%) |
| 10 to 14 Years | 159 (4.4%) | 188 (4.3%) |
| 15 to 19 Years | 113 (3.2%) | 288 (6.5%) |
| 20 to 24 Years | 54 (1.5%) | 297 (6.7%) |
| 25 to 29 Years | 333 (9.3%) | 389 (8.8%) |
| 30 to 34 Years | 260 (7.3%) | 378 (8.5%) |
| 35 to 39 Years | 217 (6.1%) | 190 (4.3%) |
| 40 to 44 Years | 314 (8.8%) | 373 (8.4%) |
| 45 to 49 Years | 163 (4.6%) | 313 (7.1%) |
| 50 to 54 Years | 231 (6.5%) | 176 (4.0%) |
| 55 to 59 Years | 190 (5.3%) | 214 (4.8%) |
| 60 to 64 Years | 238 (6.7%) | 324 (7.3%) |
| 65 to 69 Years | 240 (6.7%) | 103 (2.3%) |
| 70 to 74 Years | 59 (1.7%) | 195 (4.4%) |
| 75 to 79 Years | 25 (0.7%) | 247 (5.6%) |
| 80 to 84 Years | 101 (2.8%) | 78 (1.8%) |
| 85 Years and over | 48 (1.3%) | 173 (3.9%) |
| Total | 3,575 (100.0%) | 4,427 (100.0%) |
Families and Households in Robinwood
Median Family Size in Robinwood
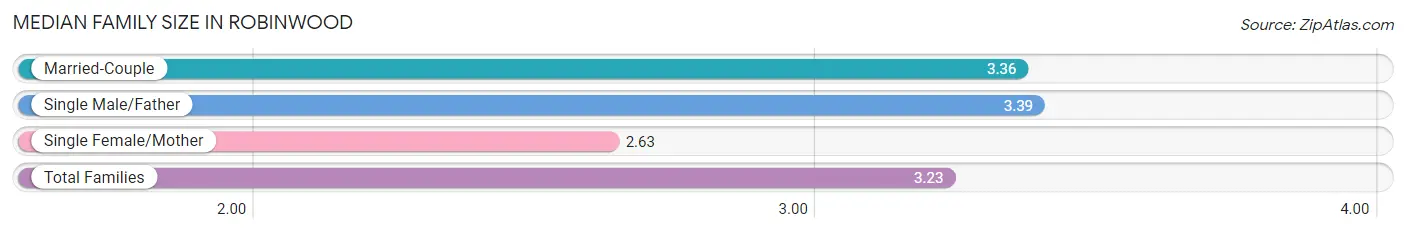
The median family size in Robinwood is 3.23 persons per family, with single male/father families (353 | 17.7%) accounting for the largest median family size of 3.39 persons per family. On the other hand, single female/mother families (364 | 18.2%) represent the smallest median family size with 2.63 persons per family.
| Family Type | # Families | Family Size |
| Married-Couple | 1,279 (64.1%) | 3.36 |
| Single Male/Father | 353 (17.7%) | 3.39 |
| Single Female/Mother | 364 (18.2%) | 2.63 |
| Total Families | 1,996 (100.0%) | 3.23 |
Median Household Size in Robinwood
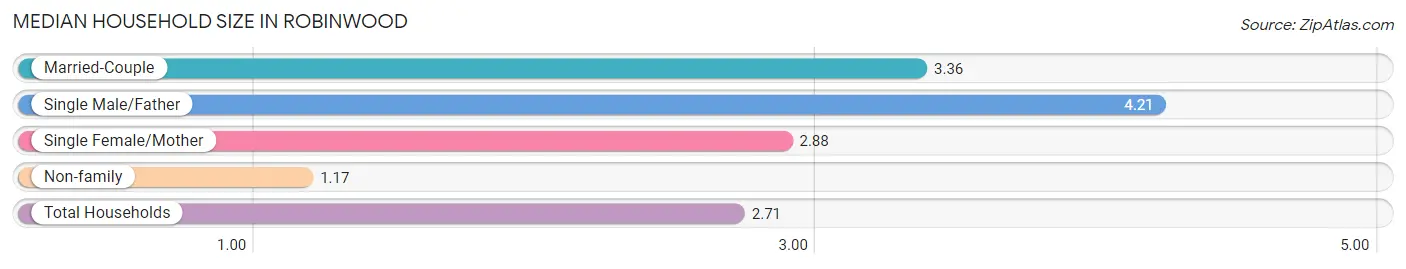
The median household size in Robinwood is 2.71 persons per household, with single male/father households (353 | 12.1%) accounting for the largest median household size of 4.21 persons per household. non-family households (918 | 31.5%) represent the smallest median household size with 1.17 persons per household.
| Household Type | # Households | Household Size |
| Married-Couple | 1,279 (43.9%) | 3.36 |
| Single Male/Father | 353 (12.1%) | 4.21 |
| Single Female/Mother | 364 (12.5%) | 2.88 |
| Non-family | 918 (31.5%) | 1.17 |
| Total Households | 2,914 (100.0%) | 2.71 |
Household Size by Marriage Status in Robinwood
Out of a total of 2,914 households in Robinwood, 1,996 (68.5%) are family households, while 918 (31.5%) are nonfamily households. The most numerous type of family households are 2-person households, comprising 845, and the most common type of nonfamily households are 1-person households, comprising 792.
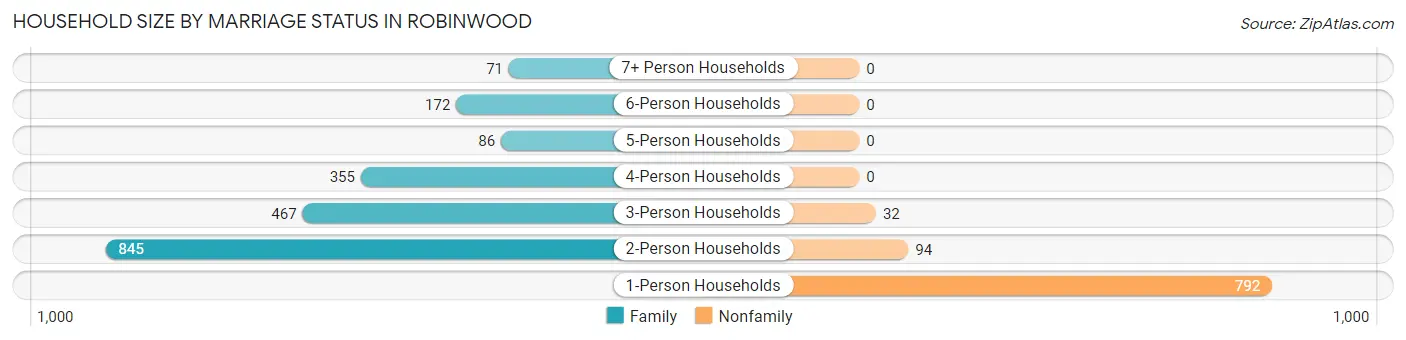
| Household Size | Family Households | Nonfamily Households |
| 1-Person Households | - | 792 (27.2%) |
| 2-Person Households | 845 (29.0%) | 94 (3.2%) |
| 3-Person Households | 467 (16.0%) | 32 (1.1%) |
| 4-Person Households | 355 (12.2%) | 0 (0.0%) |
| 5-Person Households | 86 (2.9%) | 0 (0.0%) |
| 6-Person Households | 172 (5.9%) | 0 (0.0%) |
| 7+ Person Households | 71 (2.4%) | 0 (0.0%) |
| Total | 1,996 (68.5%) | 918 (31.5%) |
Female Fertility in Robinwood
Fertility by Age in Robinwood
Average fertility rate in Robinwood is 65.0 births per 1,000 women. Women in the age bracket of 35 to 50 years have the highest fertility rate with 82.0 births per 1,000 women. Women in the age bracket of 35 to 50 years acount for 51.0% of all women with births.
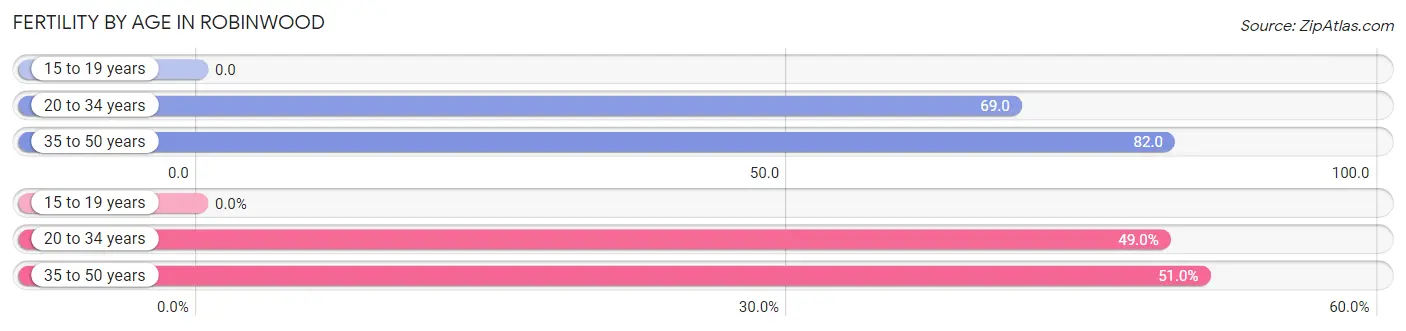
| Age Bracket | Women with Births | Births / 1,000 Women |
| 15 to 19 years | 0 (0.0%) | 0.0 |
| 20 to 34 years | 73 (49.0%) | 69.0 |
| 35 to 50 years | 76 (51.0%) | 82.0 |
| Total | 149 (100.0%) | 65.0 |
Fertility by Age by Marriage Status in Robinwood
82.6% of women with births (149) in Robinwood are married. The highest percentage of unmarried women with births falls into 20 to 34 years age bracket with 35.6% of them unmarried at the time of birth, while the lowest percentage of unmarried women with births belong to 35 to 50 years age bracket with 0.0% of them unmarried.
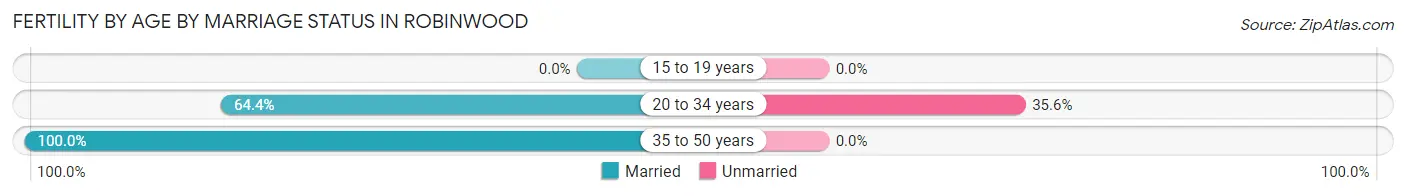
| Age Bracket | Married | Unmarried |
| 15 to 19 years | 0 (0.0%) | 0 (0.0%) |
| 20 to 34 years | 47 (64.4%) | 26 (35.6%) |
| 35 to 50 years | 76 (100.0%) | 0 (0.0%) |
| Total | 123 (82.6%) | 26 (17.4%) |
Fertility by Education in Robinwood
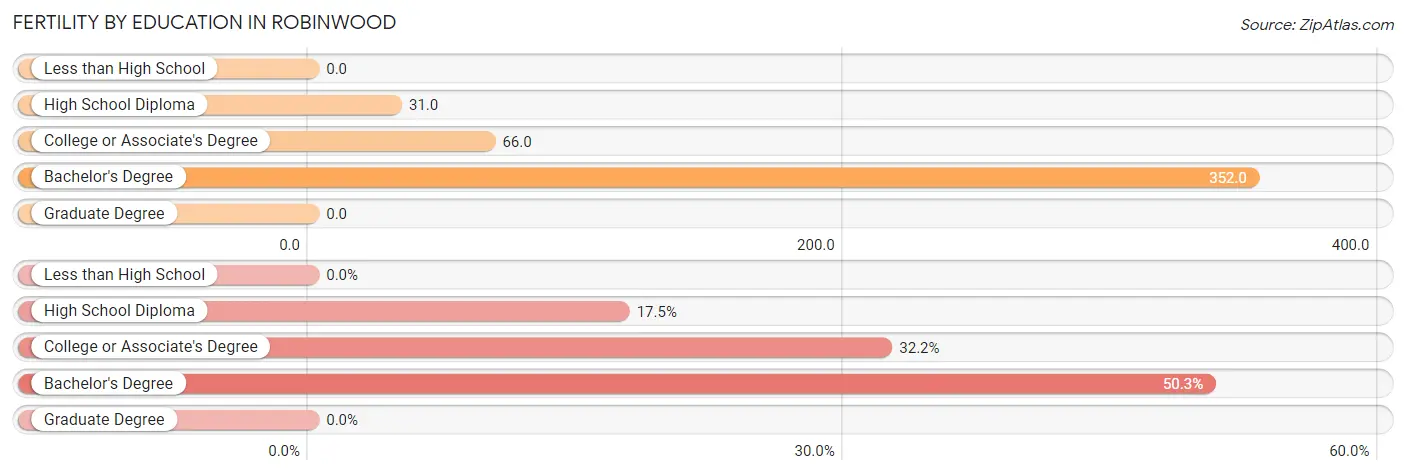
| Educational Attainment | Women with Births | Births / 1,000 Women |
| Less than High School | 0 (0.0%) | 0.0 |
| High School Diploma | 26 (17.4%) | 31.0 |
| College or Associate's Degree | 48 (32.2%) | 66.0 |
| Bachelor's Degree | 75 (50.3%) | 352.0 |
| Graduate Degree | 0 (0.0%) | 0.0 |
| Total | 149 (100.0%) | 65.0 |
Fertility by Education by Marriage Status in Robinwood
17.4% of women with births in Robinwood are unmarried. Women with the educational attainment of college or associate's degree are most likely to be married with 100.0% of them married at childbirth, while women with the educational attainment of high school diploma are least likely to be married with 100.0% of them unmarried at childbirth.
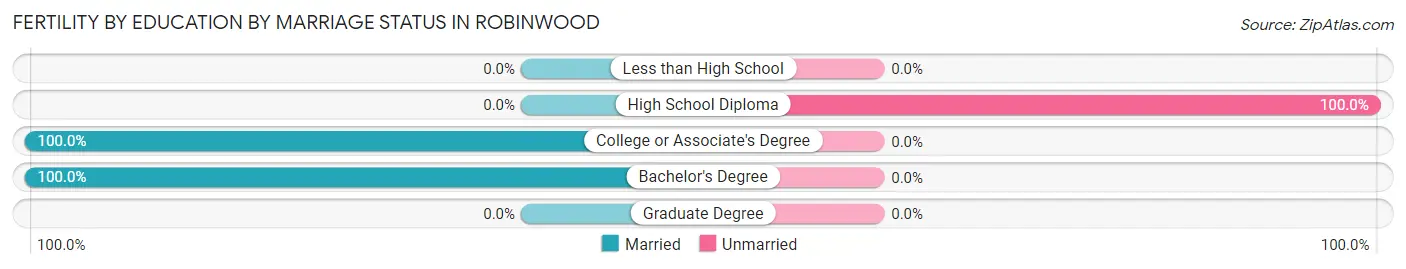
| Educational Attainment | Married | Unmarried |
| Less than High School | 0 (0.0%) | 0 (0.0%) |
| High School Diploma | 0 (0.0%) | 26 (100.0%) |
| College or Associate's Degree | 48 (100.0%) | 0 (0.0%) |
| Bachelor's Degree | 75 (100.0%) | 0 (0.0%) |
| Graduate Degree | 0 (0.0%) | 0 (0.0%) |
| Total | 123 (82.6%) | 26 (17.4%) |
Employment Characteristics in Robinwood
Employment by Class of Employer in Robinwood
Among the 3,990 employed individuals in Robinwood, private company employees (2,963 | 74.3%), self-employed (incorporated) (285 | 7.1%), and not-for-profit organizations (260 | 6.5%) make up the most common classes of employment.
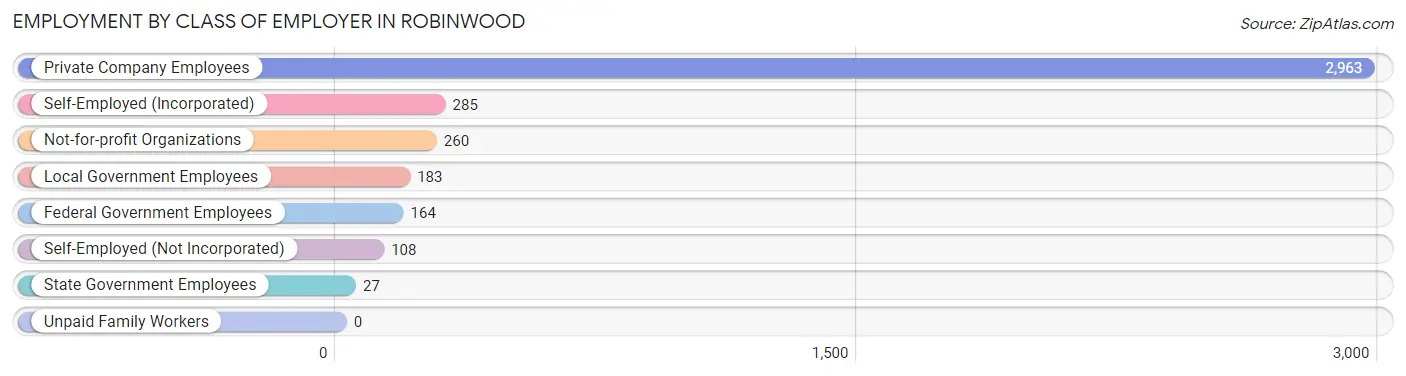
| Employer Class | # Employees | % Employees |
| Private Company Employees | 2,963 | 74.3% |
| Self-Employed (Incorporated) | 285 | 7.1% |
| Self-Employed (Not Incorporated) | 108 | 2.7% |
| Not-for-profit Organizations | 260 | 6.5% |
| Local Government Employees | 183 | 4.6% |
| State Government Employees | 27 | 0.7% |
| Federal Government Employees | 164 | 4.1% |
| Unpaid Family Workers | 0 | 0.0% |
| Total | 3,990 | 100.0% |
Employment Status by Age in Robinwood
According to the labor force statistics for Robinwood, out of the total population over 16 years of age (6,177), 68.3% or 4,219 individuals are in the labor force, with 3.5% or 148 of them unemployed. The age group with the highest labor force participation rate is 25 to 29 years, with 96.4% or 696 individuals in the labor force. Within the labor force, the 45 to 54 years age range has the highest percentage of unemployed individuals, with 9.5% or 77 of them being unemployed.
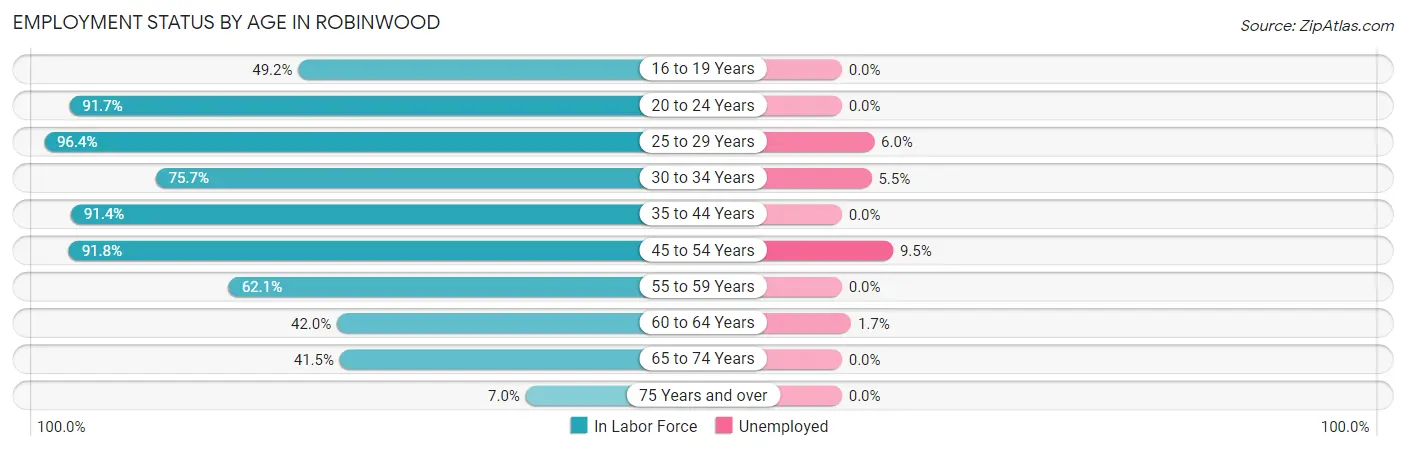
| Age Bracket | In Labor Force | Unemployed |
| 16 to 19 Years | 125 (49.2%) | 0 (0.0%) |
| 20 to 24 Years | 322 (91.7%) | 0 (0.0%) |
| 25 to 29 Years | 696 (96.4%) | 42 (6.0%) |
| 30 to 34 Years | 483 (75.7%) | 27 (5.5%) |
| 35 to 44 Years | 1,000 (91.4%) | 0 (0.0%) |
| 45 to 54 Years | 811 (91.8%) | 77 (9.5%) |
| 55 to 59 Years | 251 (62.1%) | 0 (0.0%) |
| 60 to 64 Years | 236 (42.0%) | 4 (1.7%) |
| 65 to 74 Years | 248 (41.5%) | 0 (0.0%) |
| 75 Years and over | 47 (7.0%) | 0 (0.0%) |
| Total | 4,219 (68.3%) | 148 (3.5%) |
Employment Status by Educational Attainment in Robinwood
According to labor force statistics for Robinwood, 80.8% of individuals (3,477) out of the total population between 25 and 64 years of age (4,303) are in the labor force, with 4.3% or 150 of them being unemployed. The group with the highest labor force participation rate are those with the educational attainment of college / associate degree, with 82.9% or 1,272 individuals in the labor force. Within the labor force, individuals with high school diploma education have the highest percentage of unemployment, with 9.2% or 103 of them being unemployed.
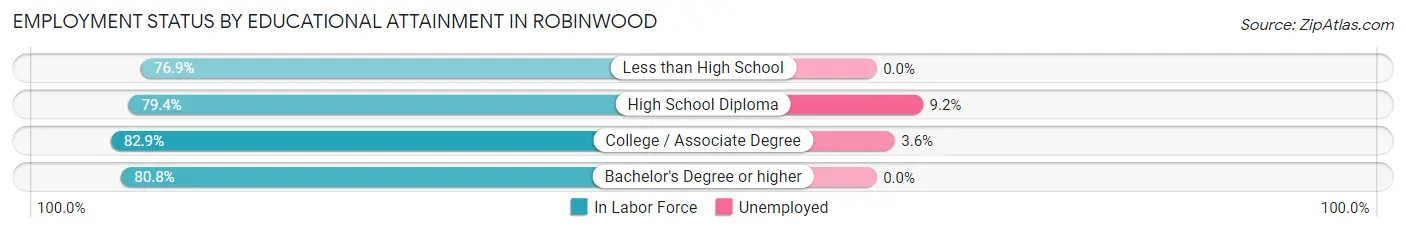
| Educational Attainment | In Labor Force | Unemployed |
| Less than High School | 257 (76.9%) | 0 (0.0%) |
| High School Diploma | 1,122 (79.4%) | 130 (9.2%) |
| College / Associate Degree | 1,272 (82.9%) | 55 (3.6%) |
| Bachelor's Degree or higher | 826 (80.8%) | 0 (0.0%) |
| Total | 3,477 (80.8%) | 185 (4.3%) |
Employment Occupations by Sex in Robinwood
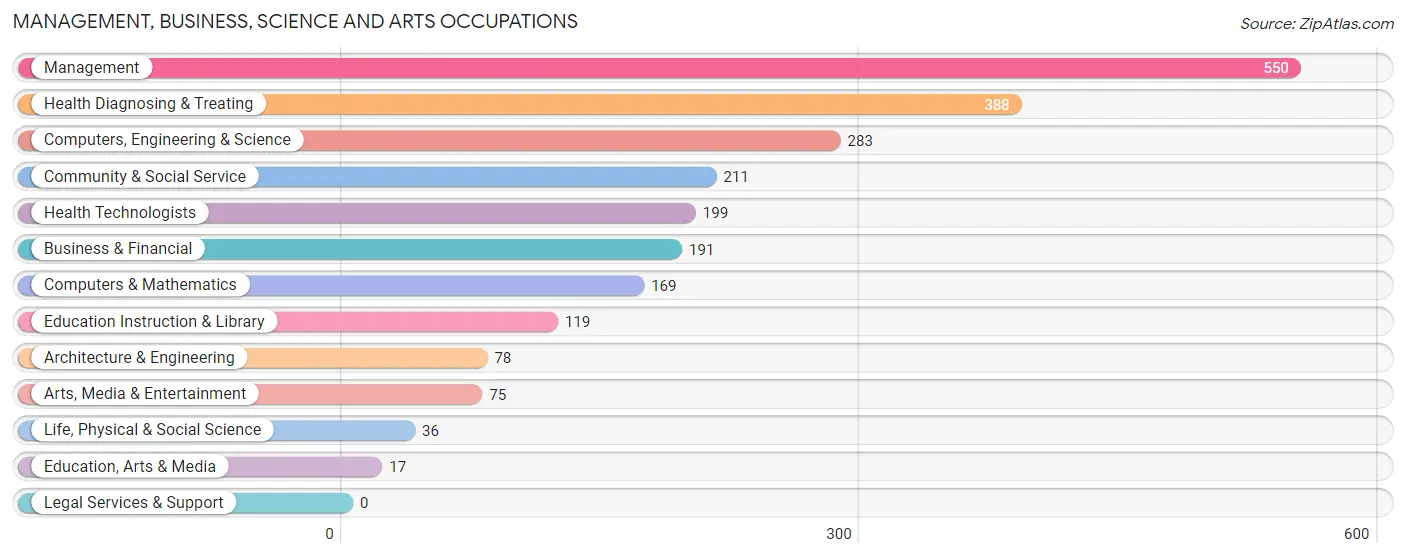
Management, Business, Science and Arts Occupations
The most common Management, Business, Science and Arts occupations in Robinwood are Management (550 | 13.6%), Health Diagnosing & Treating (388 | 9.6%), Computers, Engineering & Science (283 | 7.0%), Community & Social Service (211 | 5.2%), and Health Technologists (199 | 4.9%).
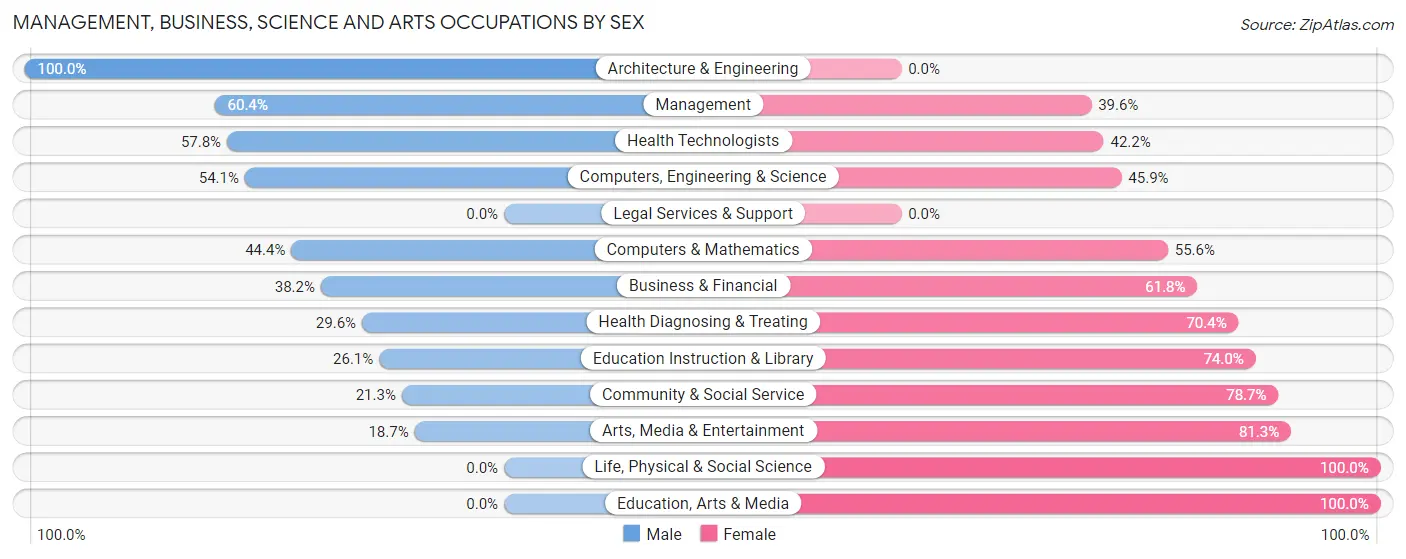
Management, Business, Science and Arts Occupations by Sex
Within the Management, Business, Science and Arts occupations in Robinwood, the most male-oriented occupations are Architecture & Engineering (100.0%), Management (60.4%), and Health Technologists (57.8%), while the most female-oriented occupations are Life, Physical & Social Science (100.0%), Education, Arts & Media (100.0%), and Arts, Media & Entertainment (81.3%).
| Occupation | Male | Female |
| Management | 332 (60.4%) | 218 (39.6%) |
| Business & Financial | 73 (38.2%) | 118 (61.8%) |
| Computers, Engineering & Science | 153 (54.1%) | 130 (45.9%) |
| Computers & Mathematics | 75 (44.4%) | 94 (55.6%) |
| Architecture & Engineering | 78 (100.0%) | 0 (0.0%) |
| Life, Physical & Social Science | 0 (0.0%) | 36 (100.0%) |
| Community & Social Service | 45 (21.3%) | 166 (78.7%) |
| Education, Arts & Media | 0 (0.0%) | 17 (100.0%) |
| Legal Services & Support | 0 (0.0%) | 0 (0.0%) |
| Education Instruction & Library | 31 (26.1%) | 88 (74.0%) |
| Arts, Media & Entertainment | 14 (18.7%) | 61 (81.3%) |
| Health Diagnosing & Treating | 115 (29.6%) | 273 (70.4%) |
| Health Technologists | 115 (57.8%) | 84 (42.2%) |
| Total (Category) | 718 (44.2%) | 905 (55.8%) |
| Total (Overall) | 1,848 (45.6%) | 2,208 (54.4%) |
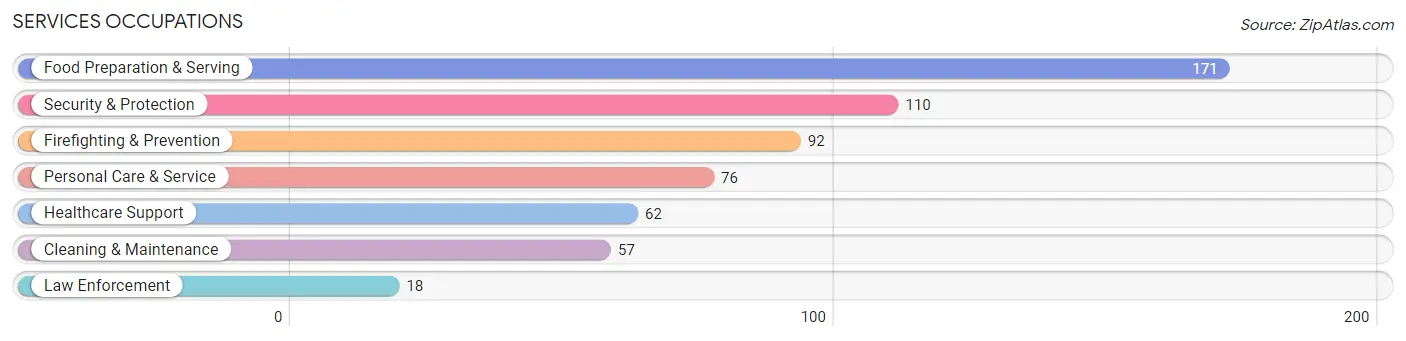
Services Occupations
The most common Services occupations in Robinwood are Food Preparation & Serving (171 | 4.2%), Security & Protection (110 | 2.7%), Firefighting & Prevention (92 | 2.3%), Personal Care & Service (76 | 1.9%), and Healthcare Support (62 | 1.5%).
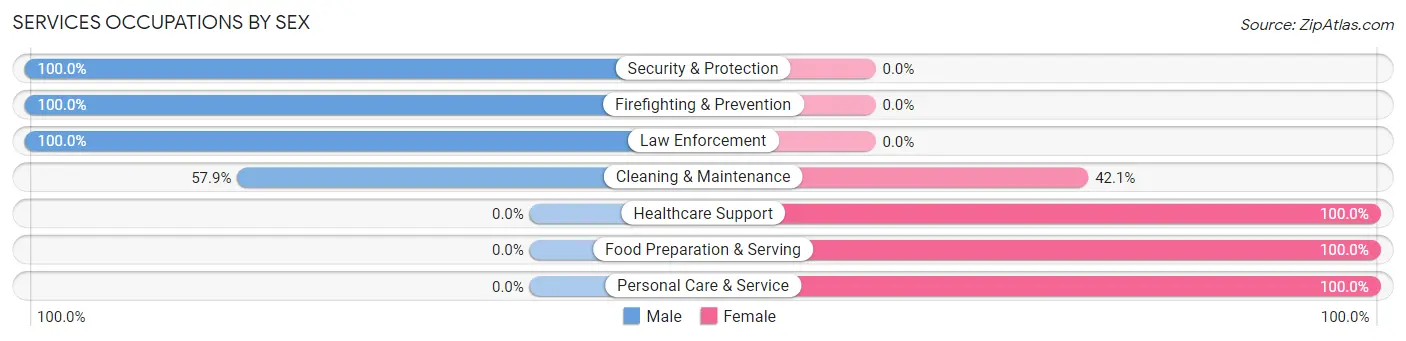
Services Occupations by Sex
Within the Services occupations in Robinwood, the most male-oriented occupations are Security & Protection (100.0%), Firefighting & Prevention (100.0%), and Law Enforcement (100.0%), while the most female-oriented occupations are Healthcare Support (100.0%), Food Preparation & Serving (100.0%), and Personal Care & Service (100.0%).
| Occupation | Male | Female |
| Healthcare Support | 0 (0.0%) | 62 (100.0%) |
| Security & Protection | 110 (100.0%) | 0 (0.0%) |
| Firefighting & Prevention | 92 (100.0%) | 0 (0.0%) |
| Law Enforcement | 18 (100.0%) | 0 (0.0%) |
| Food Preparation & Serving | 0 (0.0%) | 171 (100.0%) |
| Cleaning & Maintenance | 33 (57.9%) | 24 (42.1%) |
| Personal Care & Service | 0 (0.0%) | 76 (100.0%) |
| Total (Category) | 143 (30.0%) | 333 (70.0%) |
| Total (Overall) | 1,848 (45.6%) | 2,208 (54.4%) |
Sales and Office Occupations
The most common Sales and Office occupations in Robinwood are Office & Administration (480 | 11.8%), and Sales & Related (470 | 11.6%).
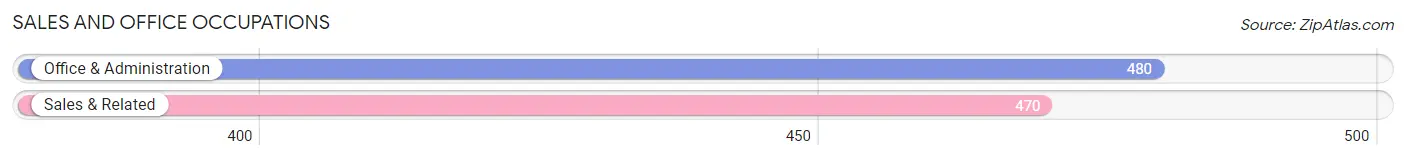
Sales and Office Occupations by Sex
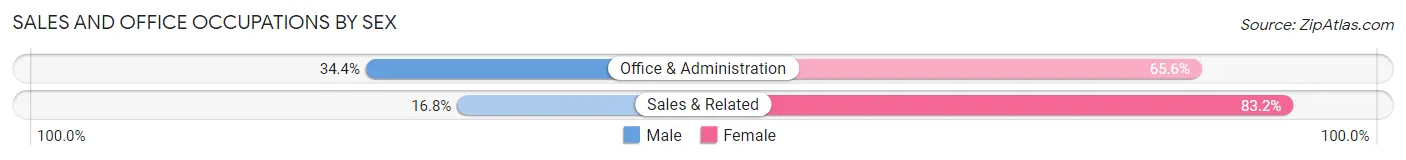
| Occupation | Male | Female |
| Sales & Related | 79 (16.8%) | 391 (83.2%) |
| Office & Administration | 165 (34.4%) | 315 (65.6%) |
| Total (Category) | 244 (25.7%) | 706 (74.3%) |
| Total (Overall) | 1,848 (45.6%) | 2,208 (54.4%) |
Natural Resources, Construction and Maintenance Occupations
The most common Natural Resources, Construction and Maintenance occupations in Robinwood are Construction & Extraction (313 | 7.7%), and Installation, Maintenance & Repair (118 | 2.9%).
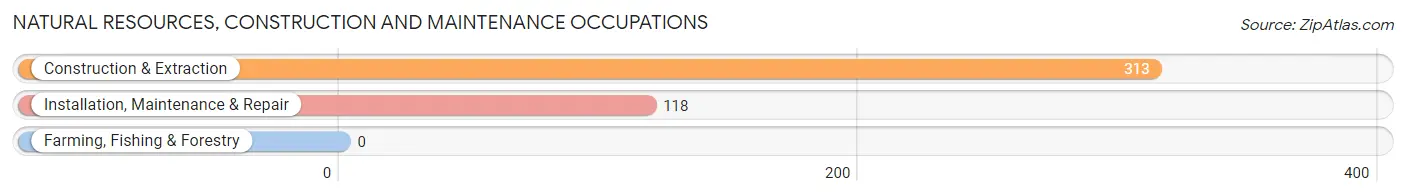
Natural Resources, Construction and Maintenance Occupations by Sex
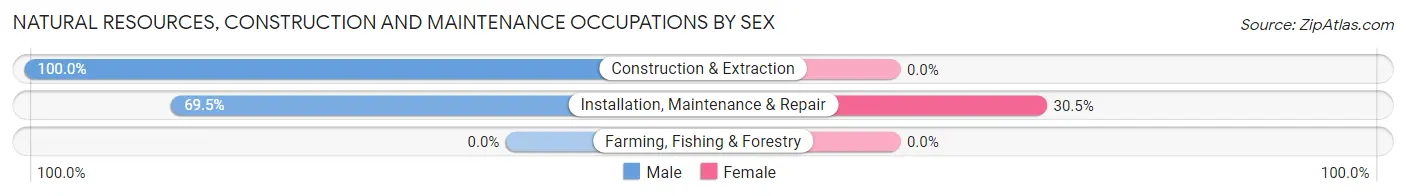
| Occupation | Male | Female |
| Farming, Fishing & Forestry | 0 (0.0%) | 0 (0.0%) |
| Construction & Extraction | 313 (100.0%) | 0 (0.0%) |
| Installation, Maintenance & Repair | 82 (69.5%) | 36 (30.5%) |
| Total (Category) | 395 (91.6%) | 36 (8.4%) |
| Total (Overall) | 1,848 (45.6%) | 2,208 (54.4%) |
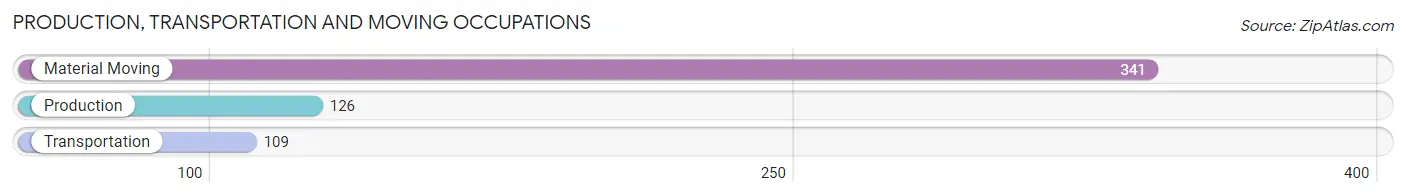
Production, Transportation and Moving Occupations
The most common Production, Transportation and Moving occupations in Robinwood are Material Moving (341 | 8.4%), Production (126 | 3.1%), and Transportation (109 | 2.7%).
Production, Transportation and Moving Occupations by Sex
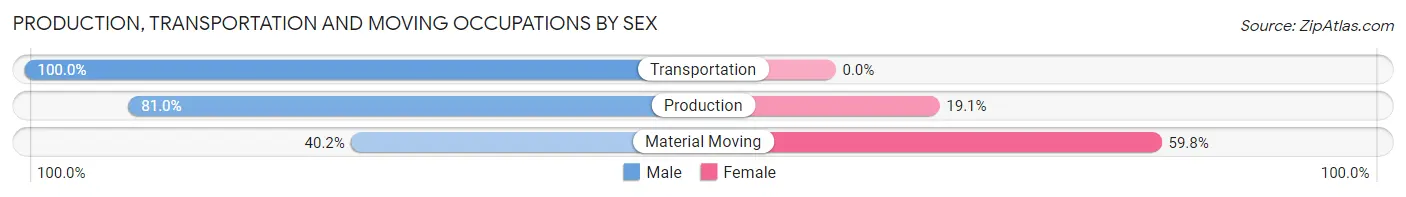
| Occupation | Male | Female |
| Production | 102 (80.9%) | 24 (19.1%) |
| Transportation | 109 (100.0%) | 0 (0.0%) |
| Material Moving | 137 (40.2%) | 204 (59.8%) |
| Total (Category) | 348 (60.4%) | 228 (39.6%) |
| Total (Overall) | 1,848 (45.6%) | 2,208 (54.4%) |
Employment Industries by Sex in Robinwood
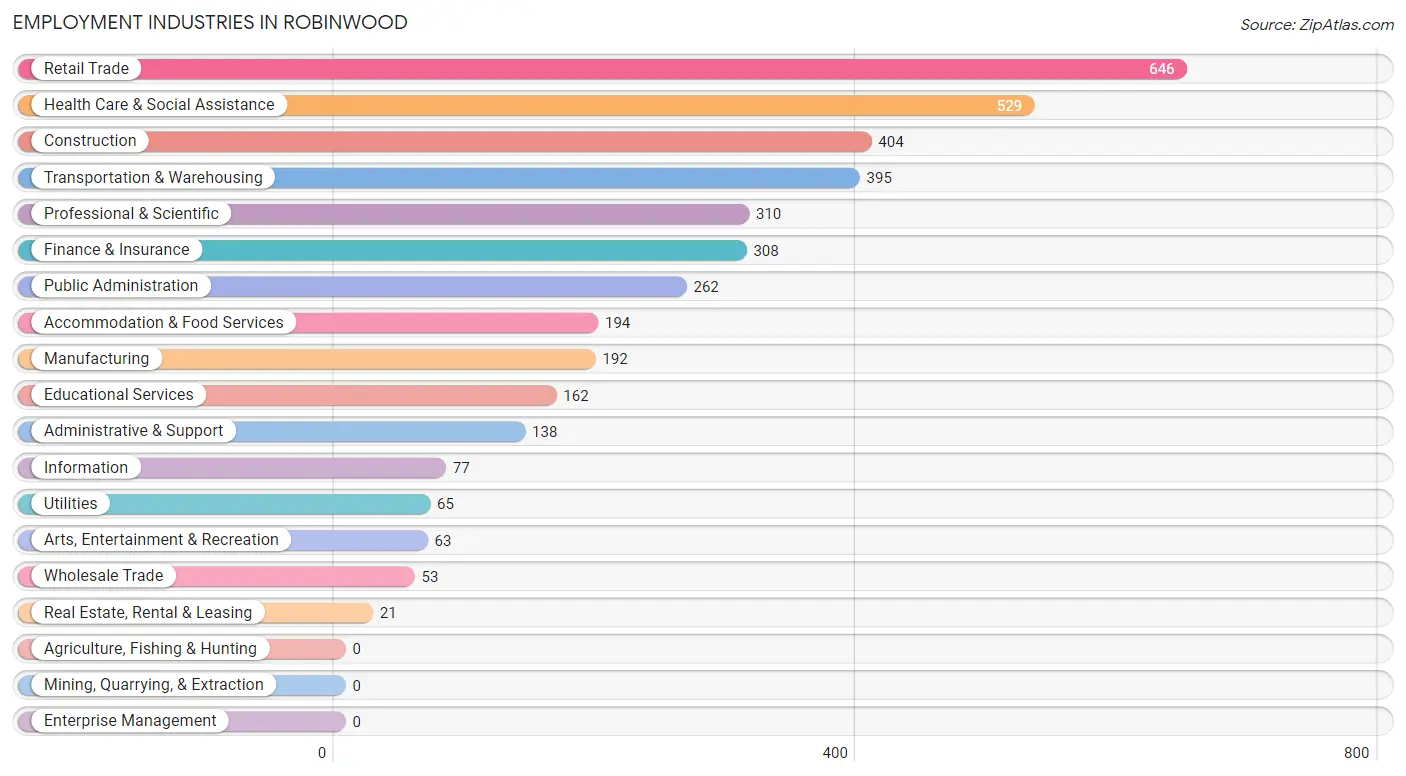
Employment Industries in Robinwood
The major employment industries in Robinwood include Retail Trade (646 | 15.9%), Health Care & Social Assistance (529 | 13.0%), Construction (404 | 10.0%), Transportation & Warehousing (395 | 9.7%), and Professional & Scientific (310 | 7.6%).
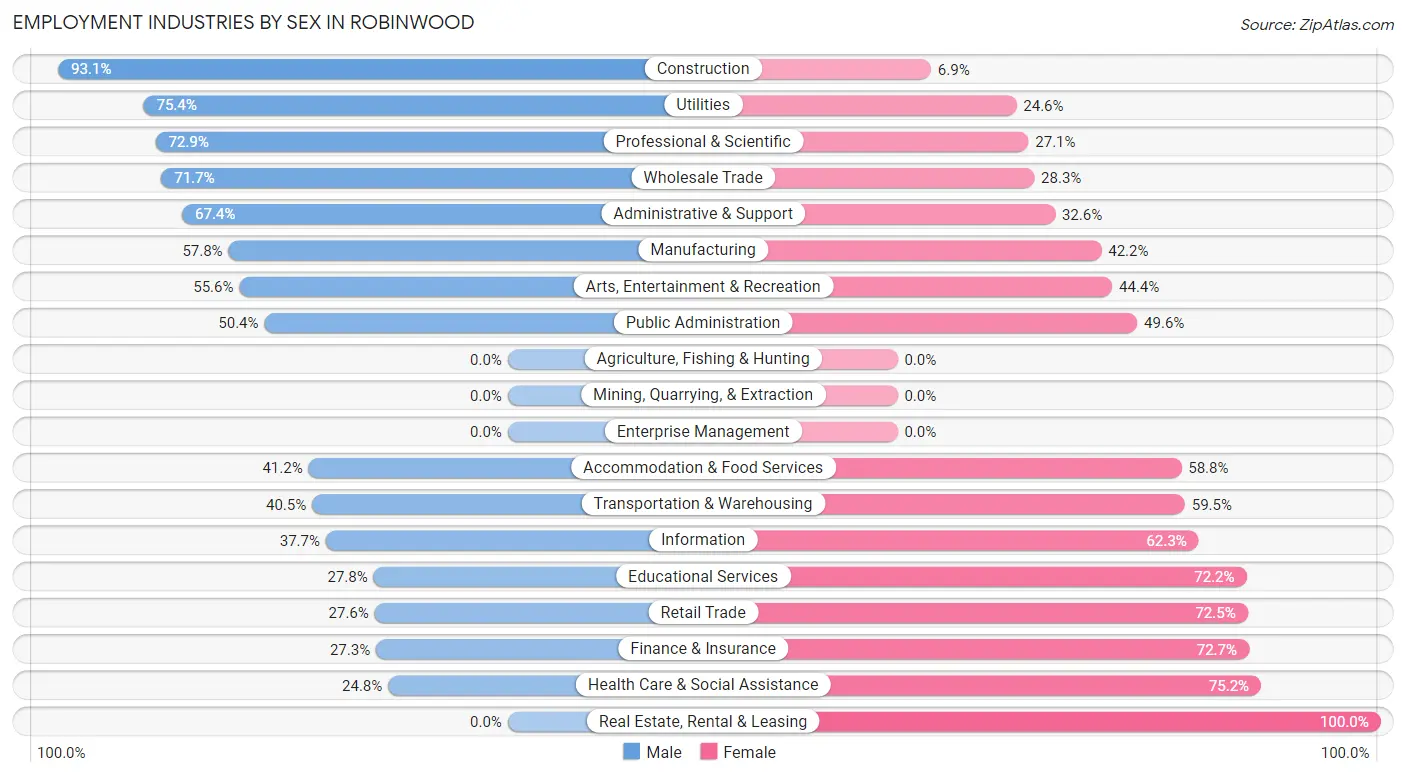
Employment Industries by Sex in Robinwood
The Robinwood industries that see more men than women are Construction (93.1%), Utilities (75.4%), and Professional & Scientific (72.9%), whereas the industries that tend to have a higher number of women are Real Estate, Rental & Leasing (100.0%), Health Care & Social Assistance (75.2%), and Finance & Insurance (72.7%).
| Industry | Male | Female |
| Agriculture, Fishing & Hunting | 0 (0.0%) | 0 (0.0%) |
| Mining, Quarrying, & Extraction | 0 (0.0%) | 0 (0.0%) |
| Construction | 376 (93.1%) | 28 (6.9%) |
| Manufacturing | 111 (57.8%) | 81 (42.2%) |
| Wholesale Trade | 38 (71.7%) | 15 (28.3%) |
| Retail Trade | 178 (27.6%) | 468 (72.5%) |
| Transportation & Warehousing | 160 (40.5%) | 235 (59.5%) |
| Utilities | 49 (75.4%) | 16 (24.6%) |
| Information | 29 (37.7%) | 48 (62.3%) |
| Finance & Insurance | 84 (27.3%) | 224 (72.7%) |
| Real Estate, Rental & Leasing | 0 (0.0%) | 21 (100.0%) |
| Professional & Scientific | 226 (72.9%) | 84 (27.1%) |
| Enterprise Management | 0 (0.0%) | 0 (0.0%) |
| Administrative & Support | 93 (67.4%) | 45 (32.6%) |
| Educational Services | 45 (27.8%) | 117 (72.2%) |
| Health Care & Social Assistance | 131 (24.8%) | 398 (75.2%) |
| Arts, Entertainment & Recreation | 35 (55.6%) | 28 (44.4%) |
| Accommodation & Food Services | 80 (41.2%) | 114 (58.8%) |
| Public Administration | 132 (50.4%) | 130 (49.6%) |
| Total | 1,848 (45.6%) | 2,208 (54.4%) |
Education in Robinwood
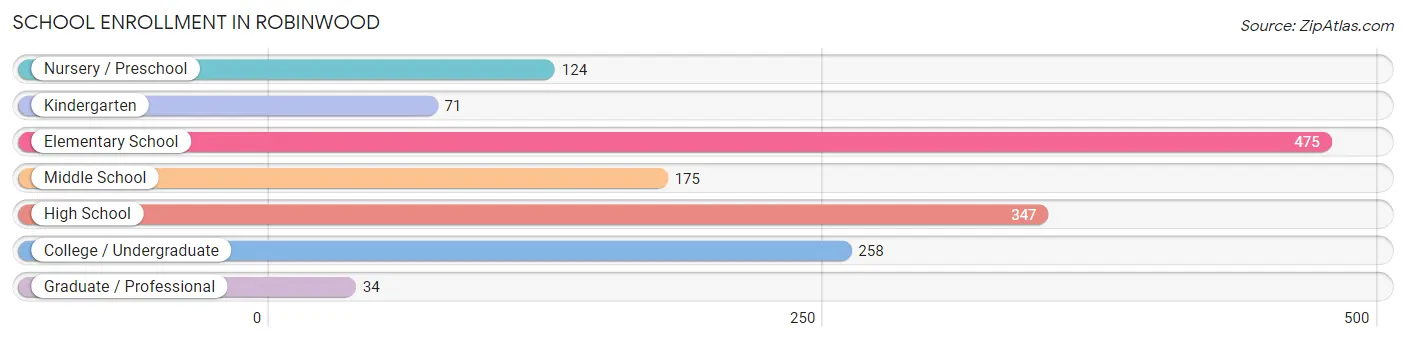
School Enrollment in Robinwood
The most common levels of schooling among the 1,484 students in Robinwood are elementary school (475 | 32.0%), high school (347 | 23.4%), and college / undergraduate (258 | 17.4%).
| School Level | # Students | % Students |
| Nursery / Preschool | 124 | 8.4% |
| Kindergarten | 71 | 4.8% |
| Elementary School | 475 | 32.0% |
| Middle School | 175 | 11.8% |
| High School | 347 | 23.4% |
| College / Undergraduate | 258 | 17.4% |
| Graduate / Professional | 34 | 2.3% |
| Total | 1,484 | 100.0% |
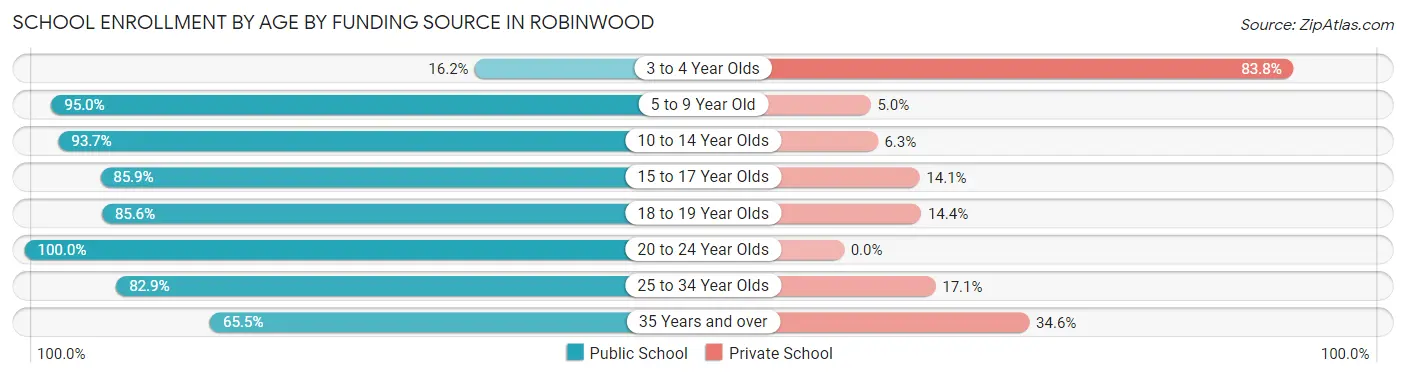
School Enrollment by Age by Funding Source in Robinwood
Out of a total of 1,484 students who are enrolled in schools in Robinwood, 234 (15.8%) attend a private institution, while the remaining 1,250 (84.2%) are enrolled in public schools. The age group of 3 to 4 year olds has the highest likelihood of being enrolled in private schools, with 93 (83.8% in the age bracket) enrolled. Conversely, the age group of 20 to 24 year olds has the lowest likelihood of being enrolled in a private school, with 30 (100.0% in the age bracket) attending a public institution.
| Age Bracket | Public School | Private School |
| 3 to 4 Year Olds | 18 (16.2%) | 93 (83.8%) |
| 5 to 9 Year Old | 457 (95.0%) | 24 (5.0%) |
| 10 to 14 Year Olds | 253 (93.7%) | 17 (6.3%) |
| 15 to 17 Year Olds | 213 (85.9%) | 35 (14.1%) |
| 18 to 19 Year Olds | 107 (85.6%) | 18 (14.4%) |
| 20 to 24 Year Olds | 30 (100.0%) | 0 (0.0%) |
| 25 to 34 Year Olds | 136 (82.9%) | 28 (17.1%) |
| 35 Years and over | 36 (65.4%) | 19 (34.5%) |
| Total | 1,250 (84.2%) | 234 (15.8%) |
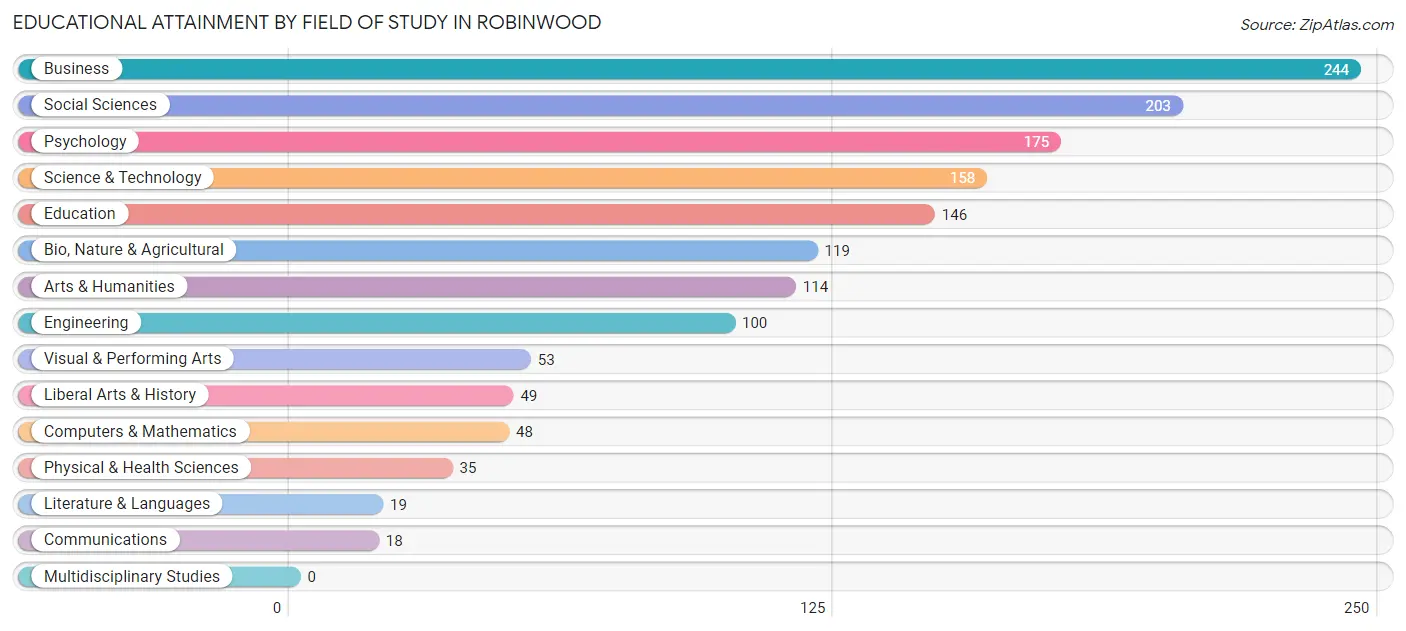
Educational Attainment by Field of Study in Robinwood
Business (244 | 16.5%), social sciences (203 | 13.7%), psychology (175 | 11.8%), science & technology (158 | 10.7%), and education (146 | 9.9%) are the most common fields of study among 1,481 individuals in Robinwood who have obtained a bachelor's degree or higher.
| Field of Study | # Graduates | % Graduates |
| Computers & Mathematics | 48 | 3.2% |
| Bio, Nature & Agricultural | 119 | 8.0% |
| Physical & Health Sciences | 35 | 2.4% |
| Psychology | 175 | 11.8% |
| Social Sciences | 203 | 13.7% |
| Engineering | 100 | 6.8% |
| Multidisciplinary Studies | 0 | 0.0% |
| Science & Technology | 158 | 10.7% |
| Business | 244 | 16.5% |
| Education | 146 | 9.9% |
| Literature & Languages | 19 | 1.3% |
| Liberal Arts & History | 49 | 3.3% |
| Visual & Performing Arts | 53 | 3.6% |
| Communications | 18 | 1.2% |
| Arts & Humanities | 114 | 7.7% |
| Total | 1,481 | 100.0% |
Transportation & Commute in Robinwood
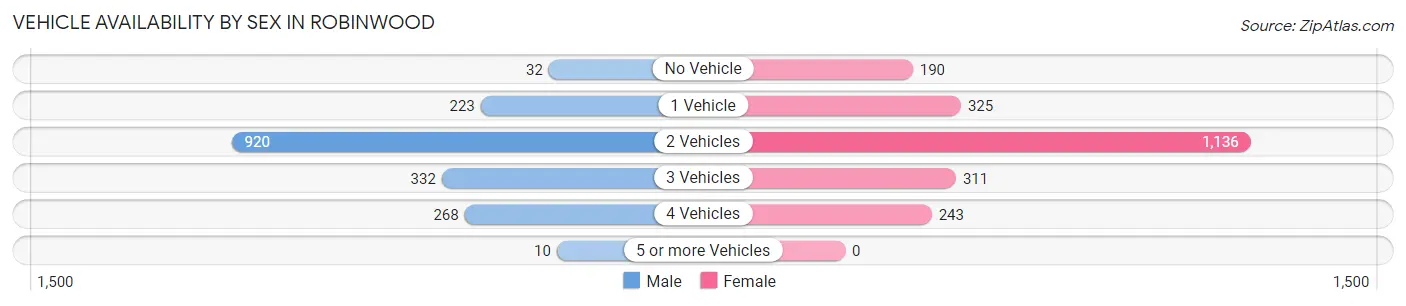
Vehicle Availability by Sex in Robinwood
The most prevalent vehicle ownership categories in Robinwood are males with 2 vehicles (920, accounting for 51.5%) and females with 2 vehicles (1,136, making up 41.7%).
| Vehicles Available | Male | Female |
| No Vehicle | 32 (1.8%) | 190 (8.6%) |
| 1 Vehicle | 223 (12.5%) | 325 (14.7%) |
| 2 Vehicles | 920 (51.5%) | 1,136 (51.5%) |
| 3 Vehicles | 332 (18.6%) | 311 (14.1%) |
| 4 Vehicles | 268 (15.0%) | 243 (11.0%) |
| 5 or more Vehicles | 10 (0.6%) | 0 (0.0%) |
| Total | 1,785 (100.0%) | 2,205 (100.0%) |
Commute Time in Robinwood
The most frequently occuring commute durations in Robinwood are 15 to 19 minutes (848 commuters, 24.3%), 10 to 14 minutes (628 commuters, 18.0%), and 60 to 89 minutes (456 commuters, 13.1%).
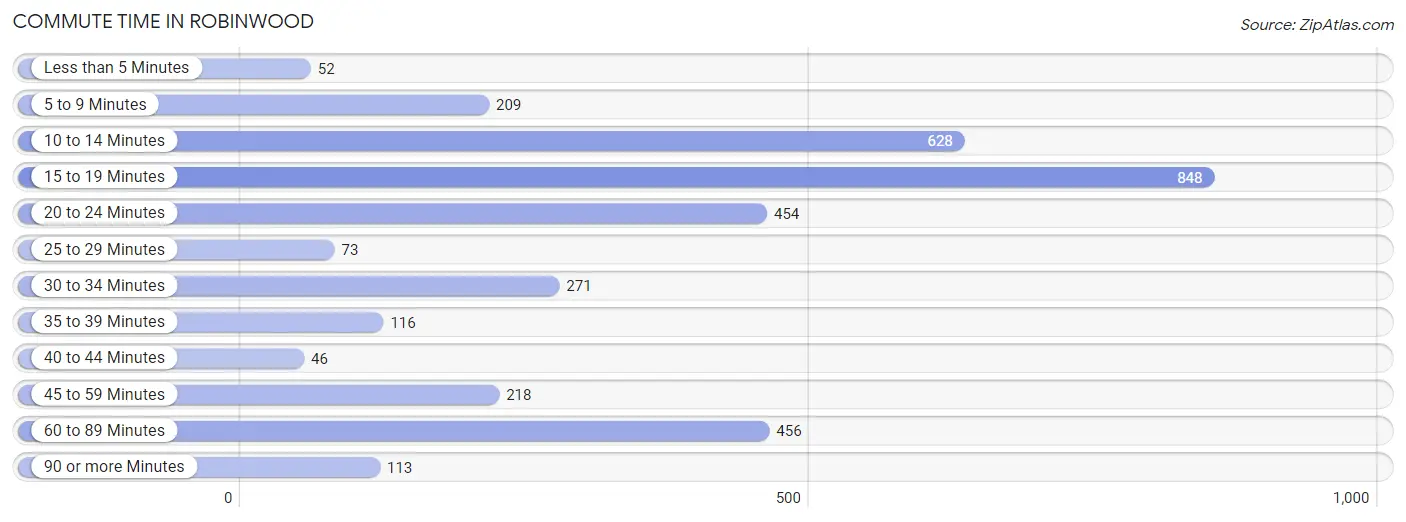
| Commute Time | # Commuters | % Commuters |
| Less than 5 Minutes | 52 | 1.5% |
| 5 to 9 Minutes | 209 | 6.0% |
| 10 to 14 Minutes | 628 | 18.0% |
| 15 to 19 Minutes | 848 | 24.3% |
| 20 to 24 Minutes | 454 | 13.0% |
| 25 to 29 Minutes | 73 | 2.1% |
| 30 to 34 Minutes | 271 | 7.8% |
| 35 to 39 Minutes | 116 | 3.3% |
| 40 to 44 Minutes | 46 | 1.3% |
| 45 to 59 Minutes | 218 | 6.3% |
| 60 to 89 Minutes | 456 | 13.1% |
| 90 or more Minutes | 113 | 3.2% |
Commute Time by Sex in Robinwood
The most common commute times in Robinwood are 60 to 89 minutes (294 commuters, 20.8%) for males and 15 to 19 minutes (643 commuters, 31.0%) for females.
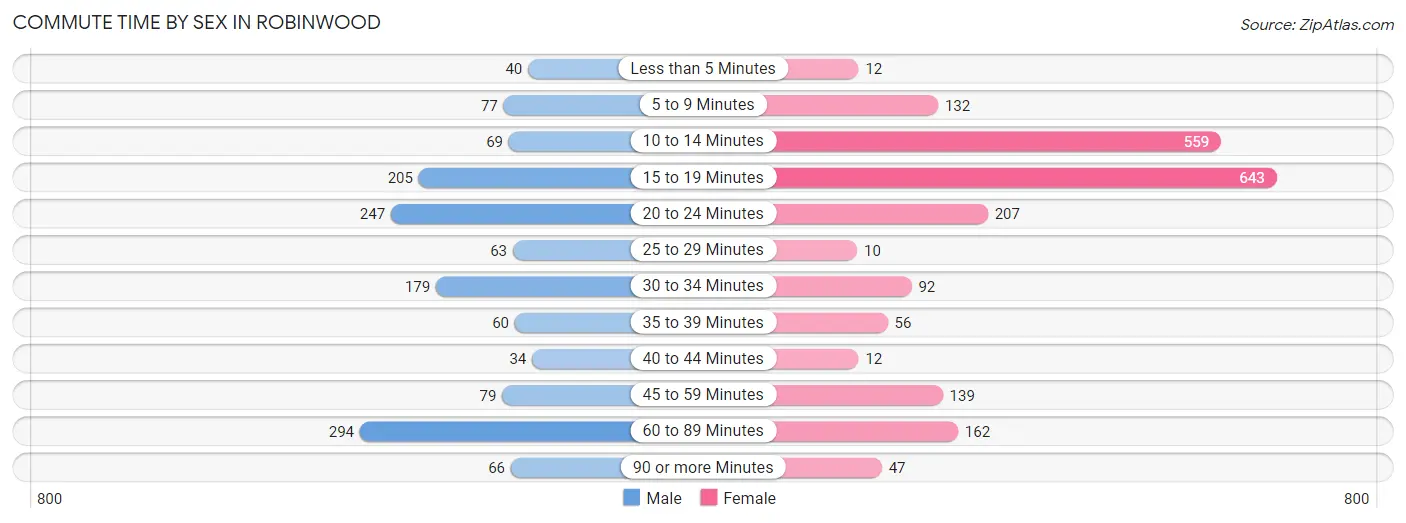
| Commute Time | Male | Female |
| Less than 5 Minutes | 40 (2.8%) | 12 (0.6%) |
| 5 to 9 Minutes | 77 (5.4%) | 132 (6.4%) |
| 10 to 14 Minutes | 69 (4.9%) | 559 (27.0%) |
| 15 to 19 Minutes | 205 (14.5%) | 643 (31.0%) |
| 20 to 24 Minutes | 247 (17.5%) | 207 (10.0%) |
| 25 to 29 Minutes | 63 (4.5%) | 10 (0.5%) |
| 30 to 34 Minutes | 179 (12.7%) | 92 (4.4%) |
| 35 to 39 Minutes | 60 (4.3%) | 56 (2.7%) |
| 40 to 44 Minutes | 34 (2.4%) | 12 (0.6%) |
| 45 to 59 Minutes | 79 (5.6%) | 139 (6.7%) |
| 60 to 89 Minutes | 294 (20.8%) | 162 (7.8%) |
| 90 or more Minutes | 66 (4.7%) | 47 (2.3%) |
Time of Departure to Work by Sex in Robinwood
The most frequent times of departure to work in Robinwood are 12:00 AM to 4:59 AM (234, 16.6%) for males and 12:00 PM to 3:59 PM (358, 17.3%) for females.
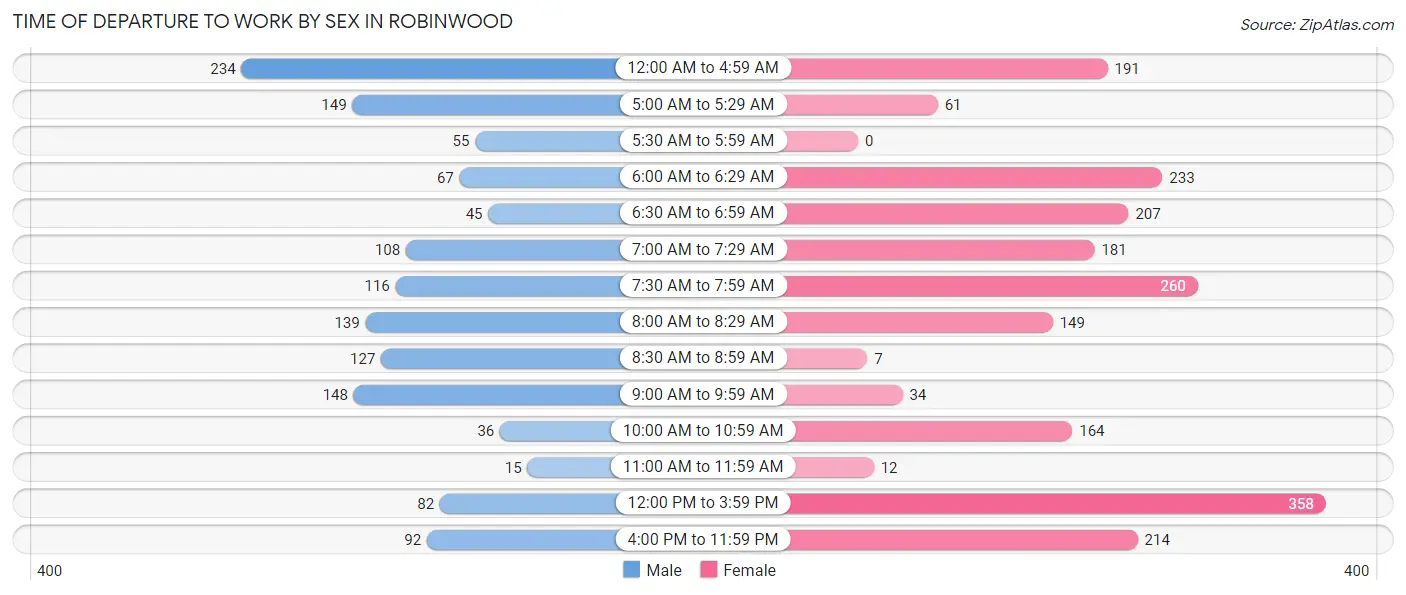
| Time of Departure | Male | Female |
| 12:00 AM to 4:59 AM | 234 (16.6%) | 191 (9.2%) |
| 5:00 AM to 5:29 AM | 149 (10.5%) | 61 (2.9%) |
| 5:30 AM to 5:59 AM | 55 (3.9%) | 0 (0.0%) |
| 6:00 AM to 6:29 AM | 67 (4.7%) | 233 (11.3%) |
| 6:30 AM to 6:59 AM | 45 (3.2%) | 207 (10.0%) |
| 7:00 AM to 7:29 AM | 108 (7.6%) | 181 (8.7%) |
| 7:30 AM to 7:59 AM | 116 (8.2%) | 260 (12.6%) |
| 8:00 AM to 8:29 AM | 139 (9.8%) | 149 (7.2%) |
| 8:30 AM to 8:59 AM | 127 (9.0%) | 7 (0.3%) |
| 9:00 AM to 9:59 AM | 148 (10.5%) | 34 (1.6%) |
| 10:00 AM to 10:59 AM | 36 (2.5%) | 164 (7.9%) |
| 11:00 AM to 11:59 AM | 15 (1.1%) | 12 (0.6%) |
| 12:00 PM to 3:59 PM | 82 (5.8%) | 358 (17.3%) |
| 4:00 PM to 11:59 PM | 92 (6.5%) | 214 (10.3%) |
| Total | 1,413 (100.0%) | 2,071 (100.0%) |
Housing Occupancy in Robinwood
Occupancy by Ownership in Robinwood
Of the total 2,914 dwellings in Robinwood, owner-occupied units account for 1,445 (49.6%), while renter-occupied units make up 1,469 (50.4%).
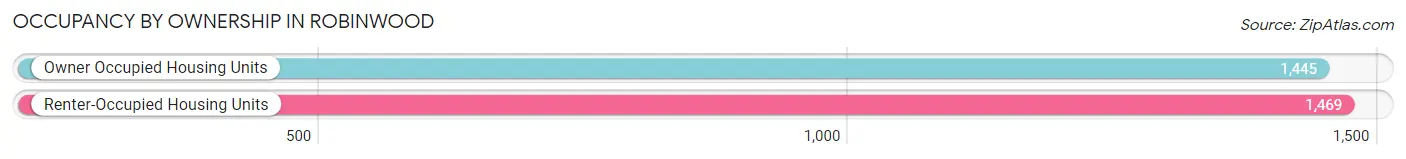
| Occupancy | # Housing Units | % Housing Units |
| Owner Occupied Housing Units | 1,445 | 49.6% |
| Renter-Occupied Housing Units | 1,469 | 50.4% |
| Total Occupied Housing Units | 2,914 | 100.0% |
Occupancy by Household Size in Robinwood
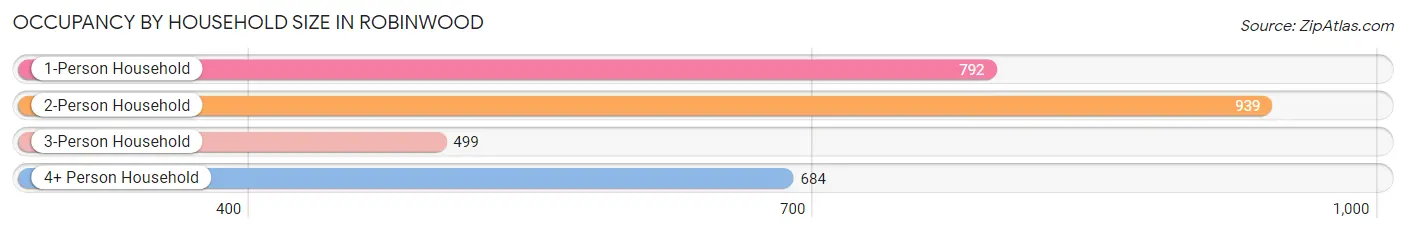
| Household Size | # Housing Units | % Housing Units |
| 1-Person Household | 792 | 27.2% |
| 2-Person Household | 939 | 32.2% |
| 3-Person Household | 499 | 17.1% |
| 4+ Person Household | 684 | 23.5% |
| Total Housing Units | 2,914 | 100.0% |
Occupancy by Ownership by Household Size in Robinwood
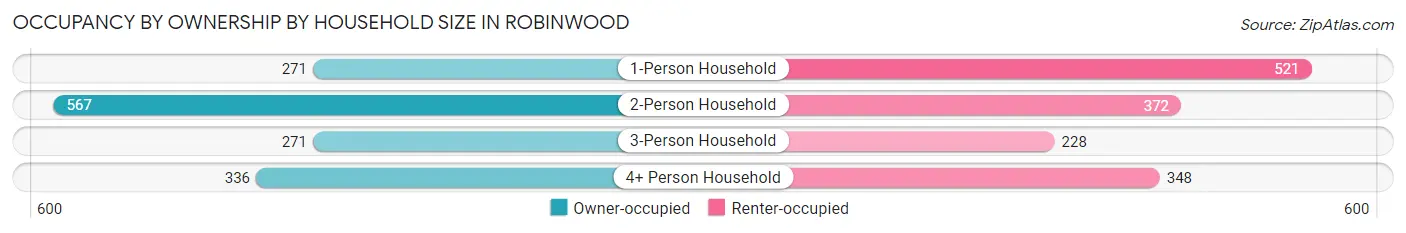
| Household Size | Owner-occupied | Renter-occupied |
| 1-Person Household | 271 (34.2%) | 521 (65.8%) |
| 2-Person Household | 567 (60.4%) | 372 (39.6%) |
| 3-Person Household | 271 (54.3%) | 228 (45.7%) |
| 4+ Person Household | 336 (49.1%) | 348 (50.9%) |
| Total Housing Units | 1,445 (49.6%) | 1,469 (50.4%) |
Occupancy by Educational Attainment in Robinwood
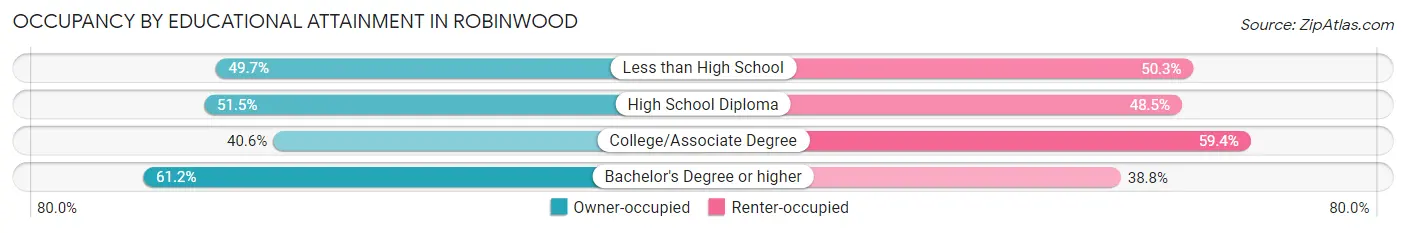
| Household Size | Owner-occupied | Renter-occupied |
| Less than High School | 82 (49.7%) | 83 (50.3%) |
| High School Diploma | 388 (51.5%) | 365 (48.5%) |
| College/Associate Degree | 486 (40.6%) | 711 (59.4%) |
| Bachelor's Degree or higher | 489 (61.2%) | 310 (38.8%) |
Occupancy by Age of Householder in Robinwood
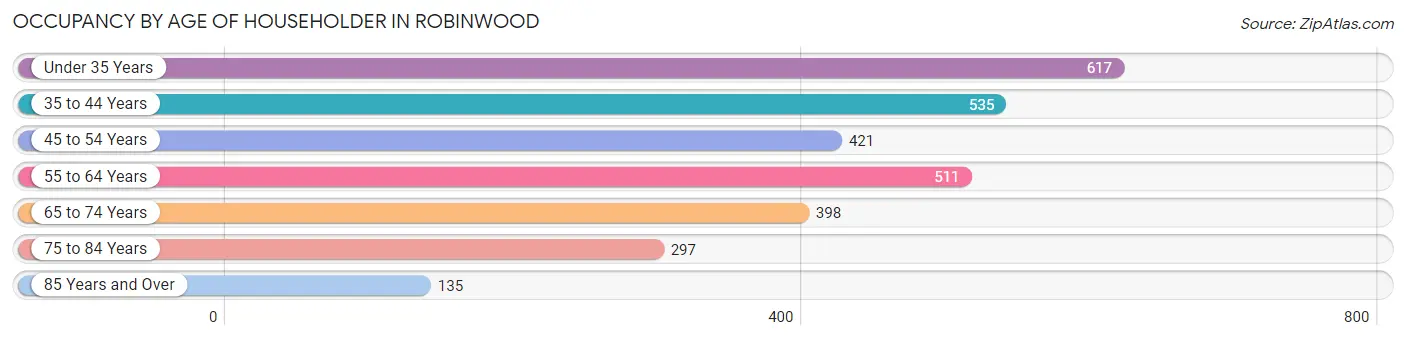
| Age Bracket | # Households | % Households |
| Under 35 Years | 617 | 21.2% |
| 35 to 44 Years | 535 | 18.4% |
| 45 to 54 Years | 421 | 14.4% |
| 55 to 64 Years | 511 | 17.5% |
| 65 to 74 Years | 398 | 13.7% |
| 75 to 84 Years | 297 | 10.2% |
| 85 Years and Over | 135 | 4.6% |
| Total | 2,914 | 100.0% |
Housing Finances in Robinwood
Median Income by Occupancy in Robinwood
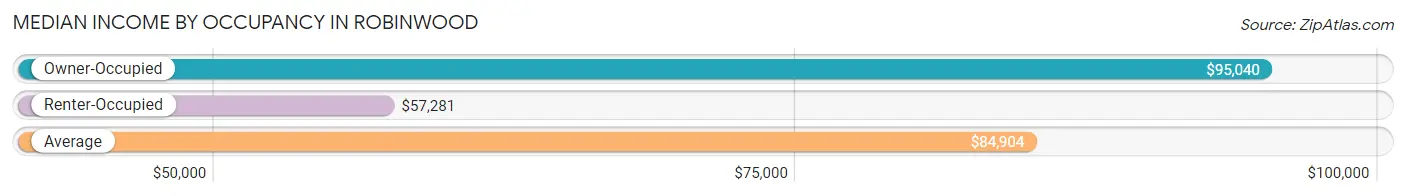
| Occupancy Type | # Households | Median Income |
| Owner-Occupied | 1,445 (49.6%) | $95,040 |
| Renter-Occupied | 1,469 (50.4%) | $57,281 |
| Average | 2,914 (100.0%) | $84,904 |
Occupancy by Householder Income Bracket in Robinwood
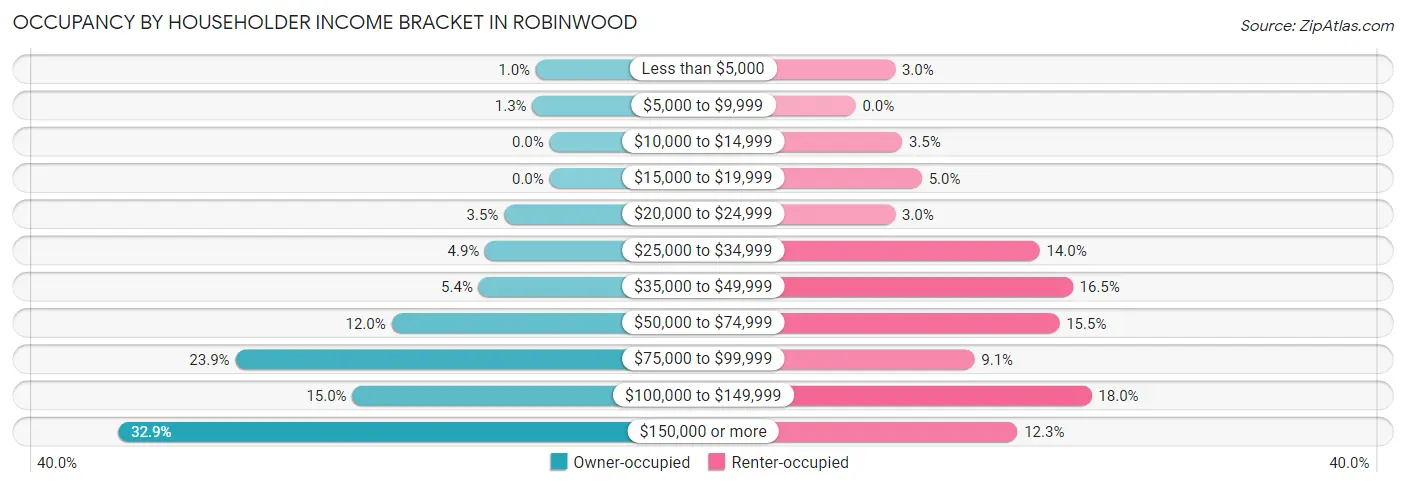
| Income Bracket | Owner-occupied | Renter-occupied |
| Less than $5,000 | 15 (1.0%) | 44 (3.0%) |
| $5,000 to $9,999 | 19 (1.3%) | 0 (0.0%) |
| $10,000 to $14,999 | 0 (0.0%) | 52 (3.5%) |
| $15,000 to $19,999 | 0 (0.0%) | 74 (5.0%) |
| $20,000 to $24,999 | 50 (3.5%) | 44 (3.0%) |
| $25,000 to $34,999 | 71 (4.9%) | 206 (14.0%) |
| $35,000 to $49,999 | 78 (5.4%) | 243 (16.5%) |
| $50,000 to $74,999 | 174 (12.0%) | 228 (15.5%) |
| $75,000 to $99,999 | 346 (23.9%) | 133 (9.0%) |
| $100,000 to $149,999 | 217 (15.0%) | 264 (18.0%) |
| $150,000 or more | 475 (32.9%) | 181 (12.3%) |
| Total | 1,445 (100.0%) | 1,469 (100.0%) |
Monthly Housing Cost Tiers in Robinwood
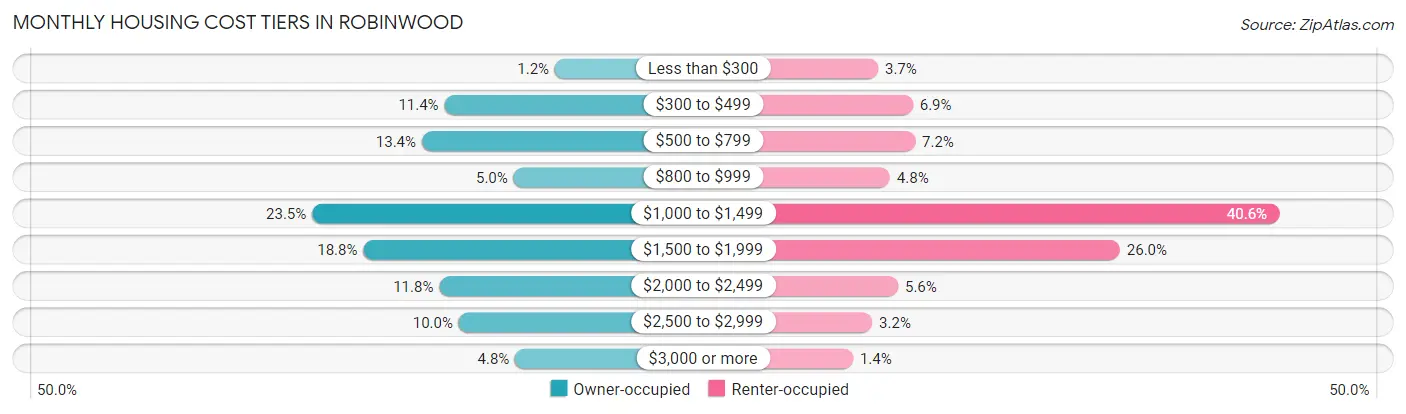
| Monthly Cost | Owner-occupied | Renter-occupied |
| Less than $300 | 17 (1.2%) | 55 (3.7%) |
| $300 to $499 | 164 (11.4%) | 102 (6.9%) |
| $500 to $799 | 194 (13.4%) | 105 (7.1%) |
| $800 to $999 | 72 (5.0%) | 71 (4.8%) |
| $1,000 to $1,499 | 340 (23.5%) | 597 (40.6%) |
| $1,500 to $1,999 | 272 (18.8%) | 382 (26.0%) |
| $2,000 to $2,499 | 171 (11.8%) | 82 (5.6%) |
| $2,500 to $2,999 | 145 (10.0%) | 47 (3.2%) |
| $3,000 or more | 70 (4.8%) | 21 (1.4%) |
| Total | 1,445 (100.0%) | 1,469 (100.0%) |
Physical Housing Characteristics in Robinwood
Housing Structures in Robinwood
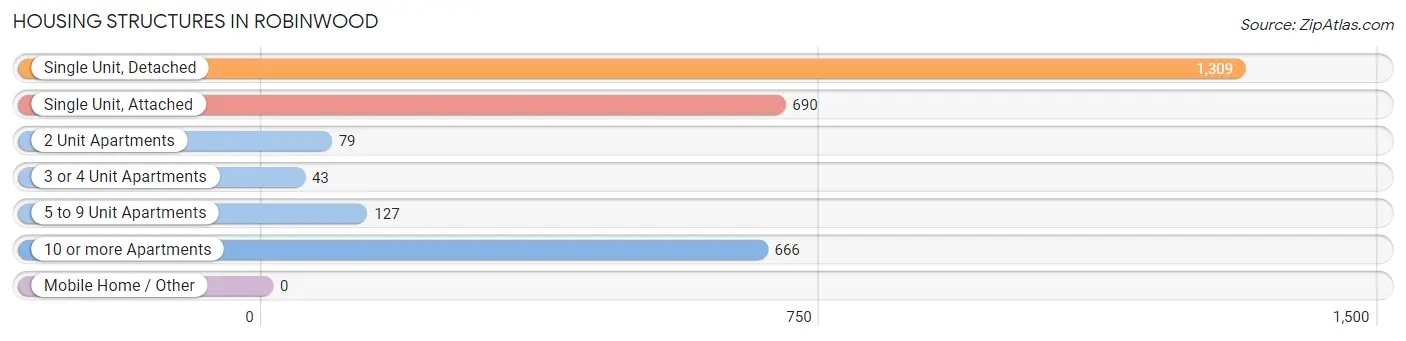
| Structure Type | # Housing Units | % Housing Units |
| Single Unit, Detached | 1,309 | 44.9% |
| Single Unit, Attached | 690 | 23.7% |
| 2 Unit Apartments | 79 | 2.7% |
| 3 or 4 Unit Apartments | 43 | 1.5% |
| 5 to 9 Unit Apartments | 127 | 4.4% |
| 10 or more Apartments | 666 | 22.9% |
| Mobile Home / Other | 0 | 0.0% |
| Total | 2,914 | 100.0% |
Housing Structures by Occupancy in Robinwood
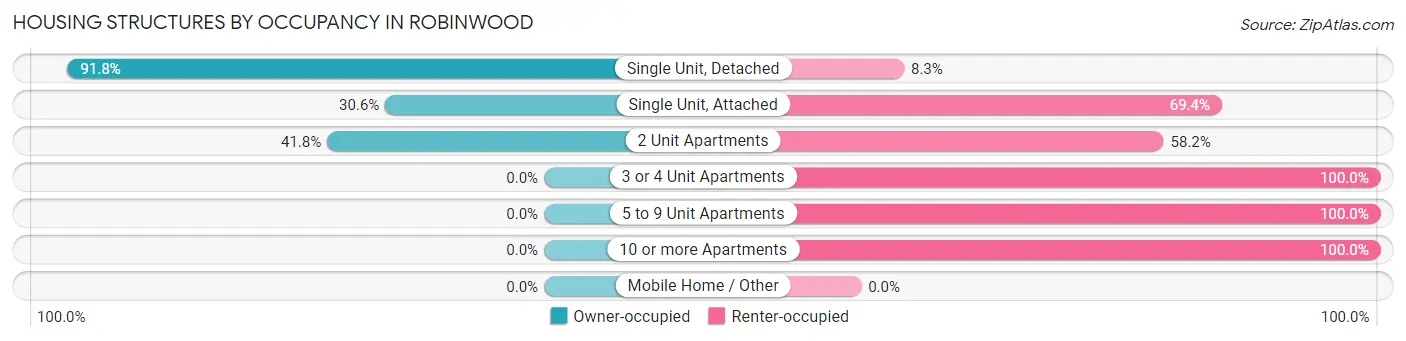
| Structure Type | Owner-occupied | Renter-occupied |
| Single Unit, Detached | 1,201 (91.7%) | 108 (8.3%) |
| Single Unit, Attached | 211 (30.6%) | 479 (69.4%) |
| 2 Unit Apartments | 33 (41.8%) | 46 (58.2%) |
| 3 or 4 Unit Apartments | 0 (0.0%) | 43 (100.0%) |
| 5 to 9 Unit Apartments | 0 (0.0%) | 127 (100.0%) |
| 10 or more Apartments | 0 (0.0%) | 666 (100.0%) |
| Mobile Home / Other | 0 (0.0%) | 0 (0.0%) |
| Total | 1,445 (49.6%) | 1,469 (50.4%) |
Housing Structures by Number of Rooms in Robinwood
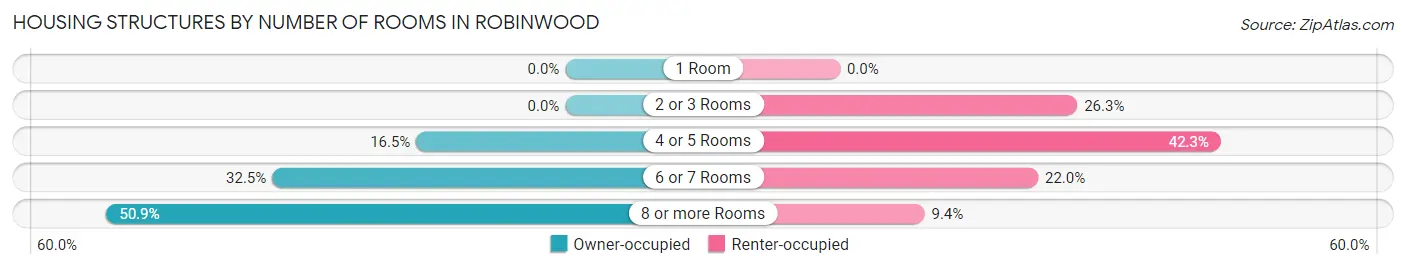
| Number of Rooms | Owner-occupied | Renter-occupied |
| 1 Room | 0 (0.0%) | 0 (0.0%) |
| 2 or 3 Rooms | 0 (0.0%) | 387 (26.3%) |
| 4 or 5 Rooms | 239 (16.5%) | 621 (42.3%) |
| 6 or 7 Rooms | 470 (32.5%) | 323 (22.0%) |
| 8 or more Rooms | 736 (50.9%) | 138 (9.4%) |
| Total | 1,445 (100.0%) | 1,469 (100.0%) |
Housing Structure by Heating Type in Robinwood
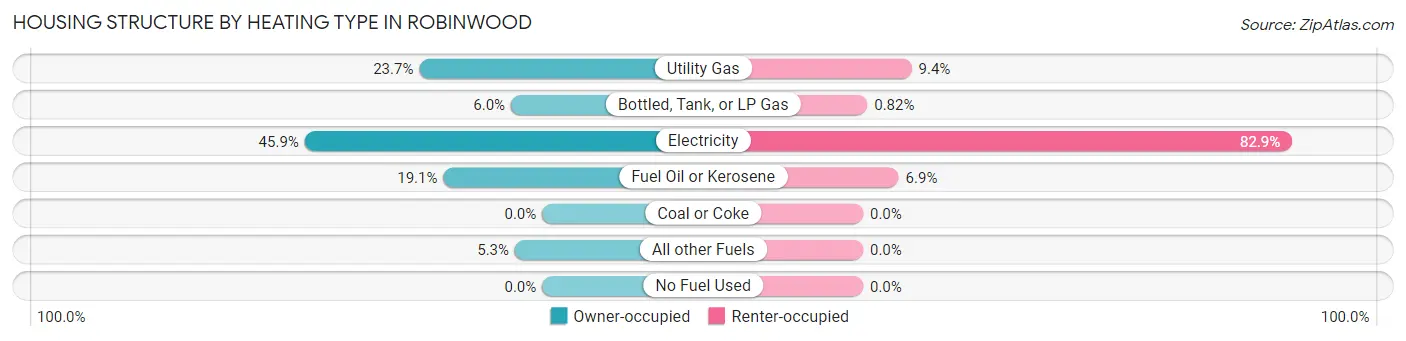
| Heating Type | Owner-occupied | Renter-occupied |
| Utility Gas | 343 (23.7%) | 138 (9.4%) |
| Bottled, Tank, or LP Gas | 87 (6.0%) | 12 (0.8%) |
| Electricity | 663 (45.9%) | 1,218 (82.9%) |
| Fuel Oil or Kerosene | 276 (19.1%) | 101 (6.9%) |
| Coal or Coke | 0 (0.0%) | 0 (0.0%) |
| All other Fuels | 76 (5.3%) | 0 (0.0%) |
| No Fuel Used | 0 (0.0%) | 0 (0.0%) |
| Total | 1,445 (100.0%) | 1,469 (100.0%) |
Household Vehicle Usage in Robinwood
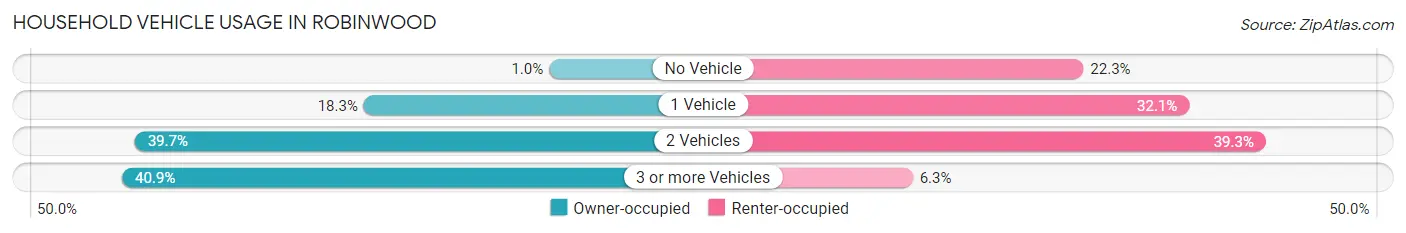
| Vehicles per Household | Owner-occupied | Renter-occupied |
| No Vehicle | 15 (1.0%) | 327 (22.3%) |
| 1 Vehicle | 265 (18.3%) | 472 (32.1%) |
| 2 Vehicles | 574 (39.7%) | 577 (39.3%) |
| 3 or more Vehicles | 591 (40.9%) | 93 (6.3%) |
| Total | 1,445 (100.0%) | 1,469 (100.0%) |
Real Estate & Mortgages in Robinwood
Real Estate and Mortgage Overview in Robinwood
| Characteristic | Without Mortgage | With Mortgage |
| Housing Units | 469 | 976 |
| Median Property Value | $341,100 | $292,700 |
| Median Household Income | $90,417 | $313 |
| Monthly Housing Costs | $597 | $70 |
| Real Estate Taxes | $3,109 | $84 |
Property Value by Mortgage Status in Robinwood
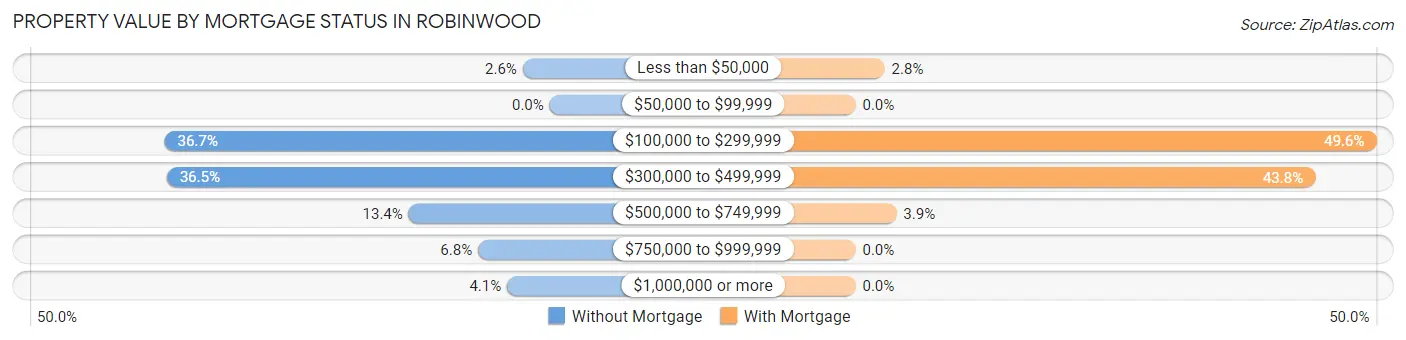
| Property Value | Without Mortgage | With Mortgage |
| Less than $50,000 | 12 (2.6%) | 27 (2.8%) |
| $50,000 to $99,999 | 0 (0.0%) | 0 (0.0%) |
| $100,000 to $299,999 | 172 (36.7%) | 484 (49.6%) |
| $300,000 to $499,999 | 171 (36.5%) | 427 (43.8%) |
| $500,000 to $749,999 | 63 (13.4%) | 38 (3.9%) |
| $750,000 to $999,999 | 32 (6.8%) | 0 (0.0%) |
| $1,000,000 or more | 19 (4.1%) | 0 (0.0%) |
| Total | 469 (100.0%) | 976 (100.0%) |
Household Income by Mortgage Status in Robinwood
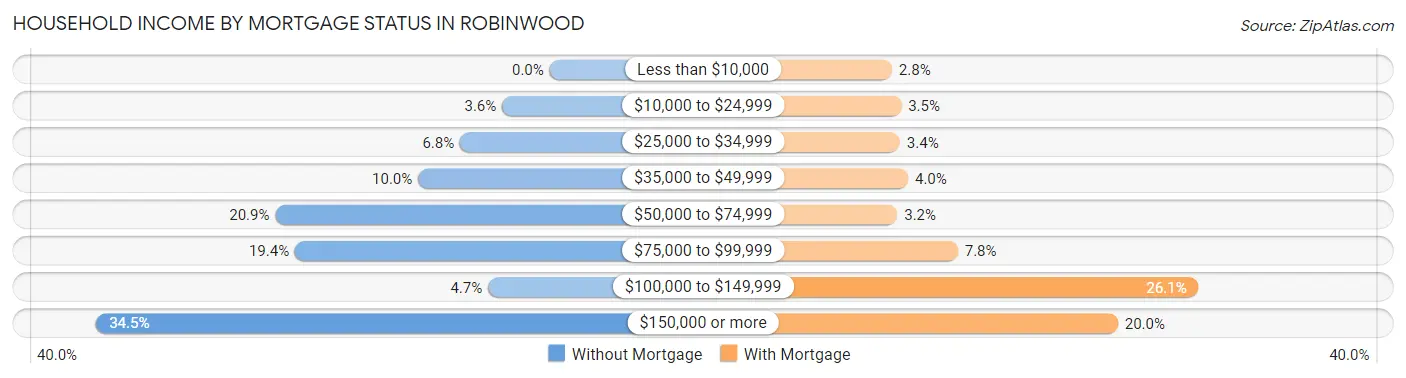
| Household Income | Without Mortgage | With Mortgage |
| Less than $10,000 | 0 (0.0%) | 27 (2.8%) |
| $10,000 to $24,999 | 17 (3.6%) | 34 (3.5%) |
| $25,000 to $34,999 | 32 (6.8%) | 33 (3.4%) |
| $35,000 to $49,999 | 47 (10.0%) | 39 (4.0%) |
| $50,000 to $74,999 | 98 (20.9%) | 31 (3.2%) |
| $75,000 to $99,999 | 91 (19.4%) | 76 (7.8%) |
| $100,000 to $149,999 | 22 (4.7%) | 255 (26.1%) |
| $150,000 or more | 162 (34.5%) | 195 (20.0%) |
| Total | 469 (100.0%) | 976 (100.0%) |
Property Value to Household Income Ratio in Robinwood
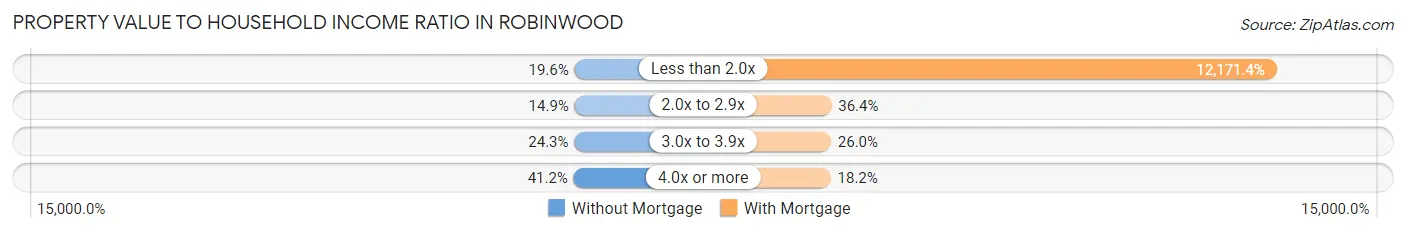
| Value-to-Income Ratio | Without Mortgage | With Mortgage |
| Less than 2.0x | 92 (19.6%) | 118,793 (12,171.4%) |
| 2.0x to 2.9x | 70 (14.9%) | 355 (36.4%) |
| 3.0x to 3.9x | 114 (24.3%) | 254 (26.0%) |
| 4.0x or more | 193 (41.1%) | 178 (18.2%) |
| Total | 469 (100.0%) | 976 (100.0%) |
Real Estate Taxes by Mortgage Status in Robinwood
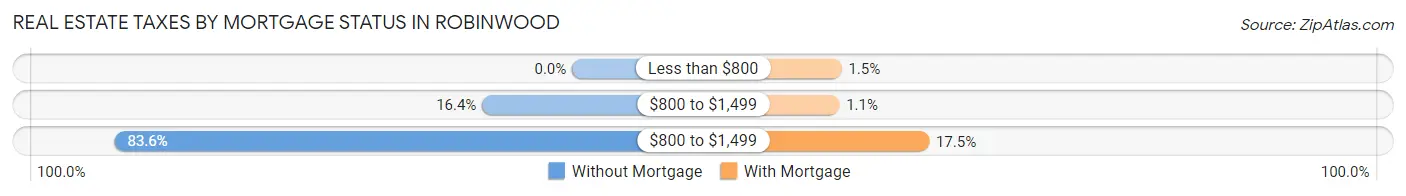
| Property Taxes | Without Mortgage | With Mortgage |
| Less than $800 | 0 (0.0%) | 15 (1.5%) |
| $800 to $1,499 | 77 (16.4%) | 11 (1.1%) |
| $800 to $1,499 | 392 (83.6%) | 171 (17.5%) |
| Total | 469 (100.0%) | 976 (100.0%) |
Health & Disability in Robinwood
Health Insurance Coverage by Age in Robinwood
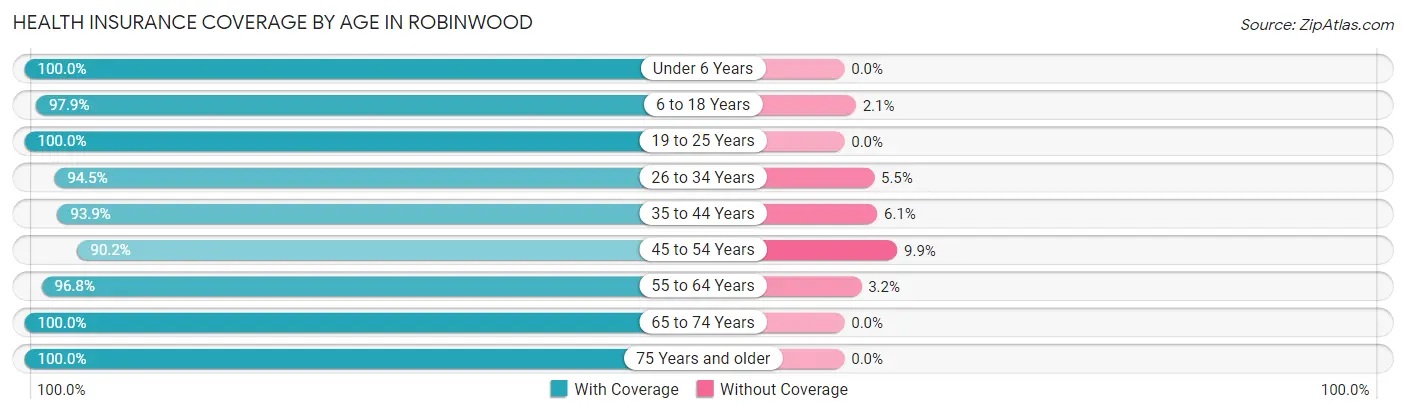
| Age Bracket | With Coverage | Without Coverage |
| Under 6 Years | 859 (100.0%) | 0 (0.0%) |
| 6 to 18 Years | 1,149 (97.9%) | 25 (2.1%) |
| 19 to 25 Years | 443 (100.0%) | 0 (0.0%) |
| 26 to 34 Years | 1,228 (94.5%) | 72 (5.5%) |
| 35 to 44 Years | 1,012 (93.9%) | 66 (6.1%) |
| 45 to 54 Years | 796 (90.1%) | 87 (9.9%) |
| 55 to 64 Years | 920 (96.8%) | 30 (3.2%) |
| 65 to 74 Years | 594 (100.0%) | 0 (0.0%) |
| 75 Years and older | 628 (100.0%) | 0 (0.0%) |
| Total | 7,629 (96.5%) | 280 (3.5%) |
Health Insurance Coverage by Citizenship Status in Robinwood
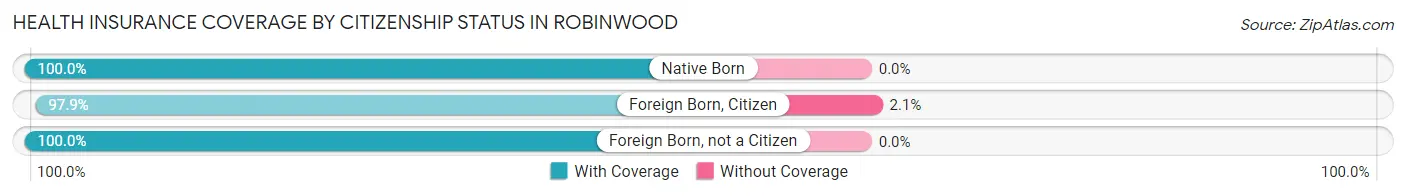
| Citizenship Status | With Coverage | Without Coverage |
| Native Born | 859 (100.0%) | 0 (0.0%) |
| Foreign Born, Citizen | 1,149 (97.9%) | 25 (2.1%) |
| Foreign Born, not a Citizen | 443 (100.0%) | 0 (0.0%) |
Health Insurance Coverage by Household Income in Robinwood
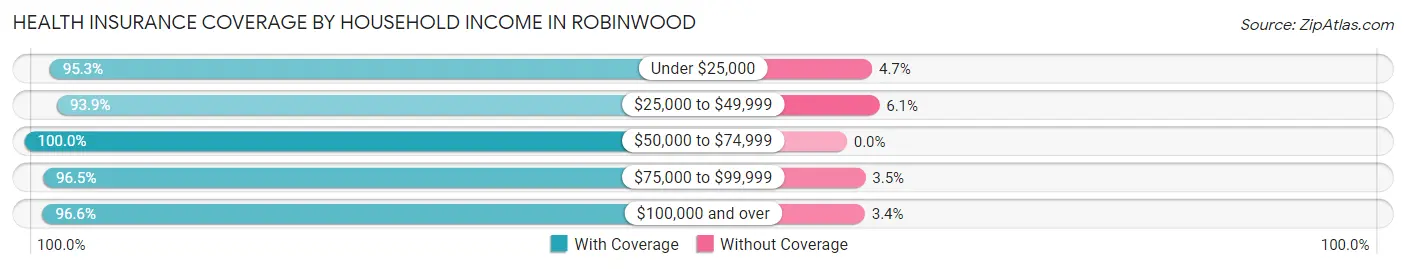
| Household Income | With Coverage | Without Coverage |
| Under $25,000 | 322 (95.3%) | 16 (4.7%) |
| $25,000 to $49,999 | 1,248 (93.9%) | 81 (6.1%) |
| $50,000 to $74,999 | 832 (100.0%) | 0 (0.0%) |
| $75,000 to $99,999 | 1,140 (96.5%) | 41 (3.5%) |
| $100,000 and over | 4,073 (96.6%) | 142 (3.4%) |
Public vs Private Health Insurance Coverage by Age in Robinwood
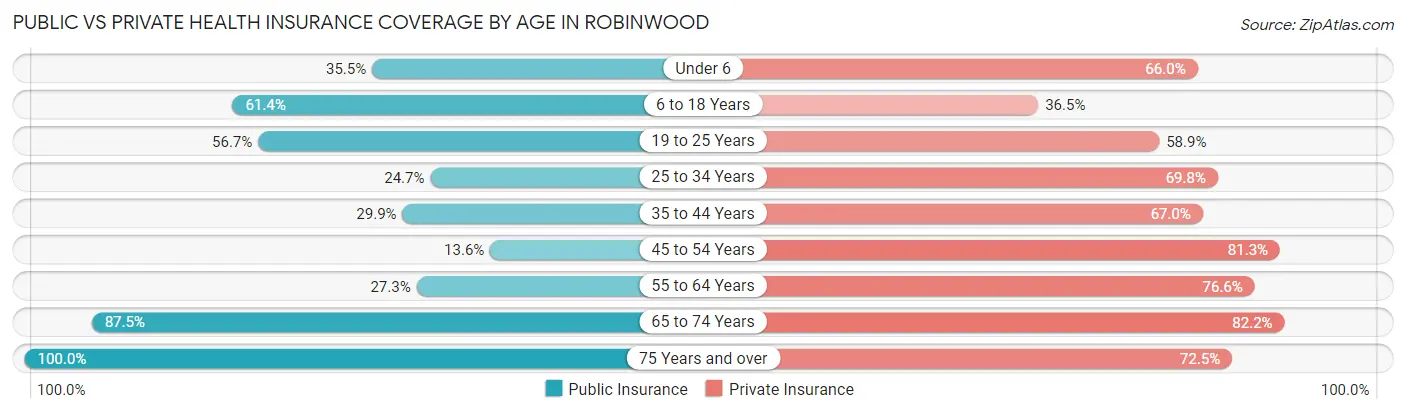
| Age Bracket | Public Insurance | Private Insurance |
| Under 6 | 305 (35.5%) | 567 (66.0%) |
| 6 to 18 Years | 721 (61.4%) | 428 (36.5%) |
| 19 to 25 Years | 251 (56.7%) | 261 (58.9%) |
| 25 to 34 Years | 321 (24.7%) | 907 (69.8%) |
| 35 to 44 Years | 322 (29.9%) | 722 (67.0%) |
| 45 to 54 Years | 120 (13.6%) | 718 (81.3%) |
| 55 to 64 Years | 259 (27.3%) | 728 (76.6%) |
| 65 to 74 Years | 520 (87.5%) | 488 (82.2%) |
| 75 Years and over | 628 (100.0%) | 455 (72.5%) |
| Total | 3,447 (43.6%) | 5,274 (66.7%) |
Disability Status by Sex by Age in Robinwood
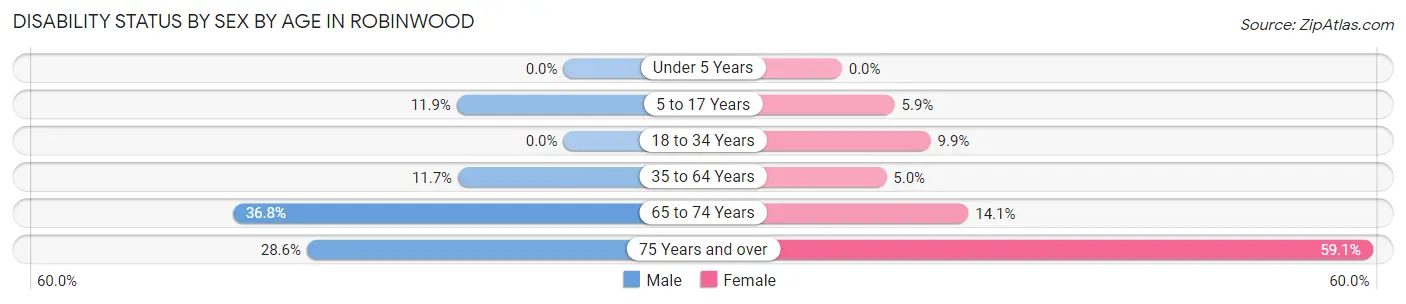
| Age Bracket | Male | Female |
| Under 5 Years | 0 (0.0%) | 0 (0.0%) |
| 5 to 17 Years | 67 (11.9%) | 31 (5.9%) |
| 18 to 34 Years | 0 (0.0%) | 119 (9.9%) |
| 35 to 64 Years | 157 (11.7%) | 78 (5.0%) |
| 65 to 74 Years | 109 (36.8%) | 42 (14.1%) |
| 75 Years and over | 46 (28.6%) | 276 (59.1%) |
Disability Class by Sex by Age in Robinwood
Disability Class: Hearing Difficulty
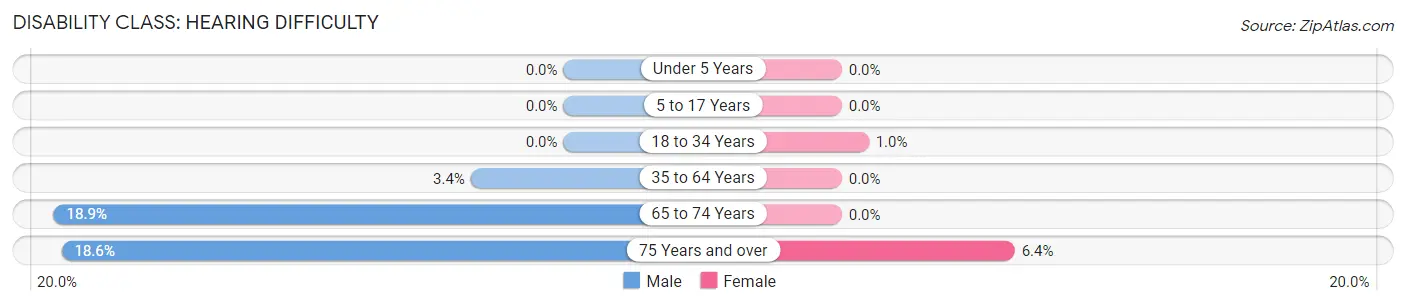
| Age Bracket | Male | Female |
| Under 5 Years | 0 (0.0%) | 0 (0.0%) |
| 5 to 17 Years | 0 (0.0%) | 0 (0.0%) |
| 18 to 34 Years | 0 (0.0%) | 12 (1.0%) |
| 35 to 64 Years | 46 (3.4%) | 0 (0.0%) |
| 65 to 74 Years | 56 (18.9%) | 0 (0.0%) |
| 75 Years and over | 30 (18.6%) | 30 (6.4%) |
Disability Class: Vision Difficulty
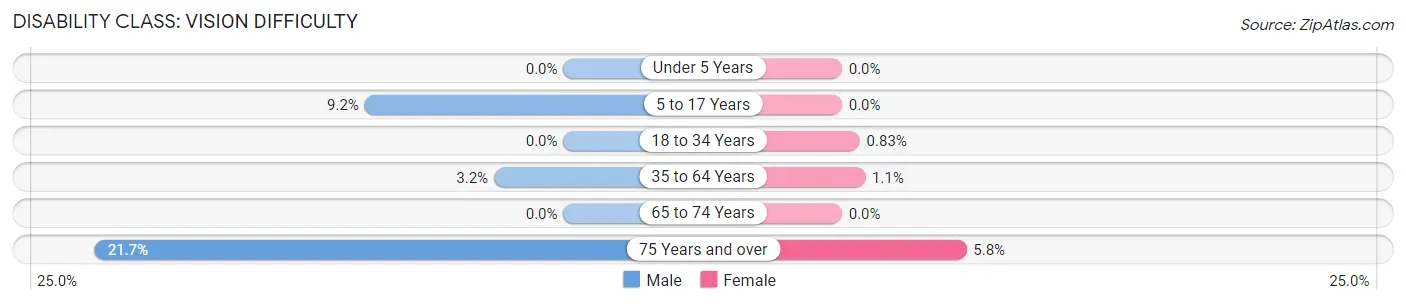
| Age Bracket | Male | Female |
| Under 5 Years | 0 (0.0%) | 0 (0.0%) |
| 5 to 17 Years | 52 (9.2%) | 0 (0.0%) |
| 18 to 34 Years | 0 (0.0%) | 10 (0.8%) |
| 35 to 64 Years | 43 (3.2%) | 17 (1.1%) |
| 65 to 74 Years | 0 (0.0%) | 0 (0.0%) |
| 75 Years and over | 35 (21.7%) | 27 (5.8%) |
Disability Class: Cognitive Difficulty
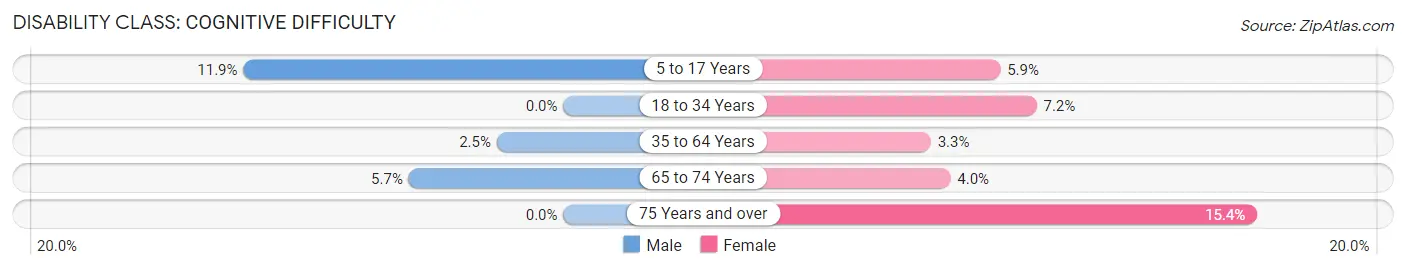
| Age Bracket | Male | Female |
| 5 to 17 Years | 67 (11.9%) | 31 (5.9%) |
| 18 to 34 Years | 0 (0.0%) | 87 (7.2%) |
| 35 to 64 Years | 33 (2.5%) | 52 (3.3%) |
| 65 to 74 Years | 17 (5.7%) | 12 (4.0%) |
| 75 Years and over | 0 (0.0%) | 72 (15.4%) |
Disability Class: Ambulatory Difficulty
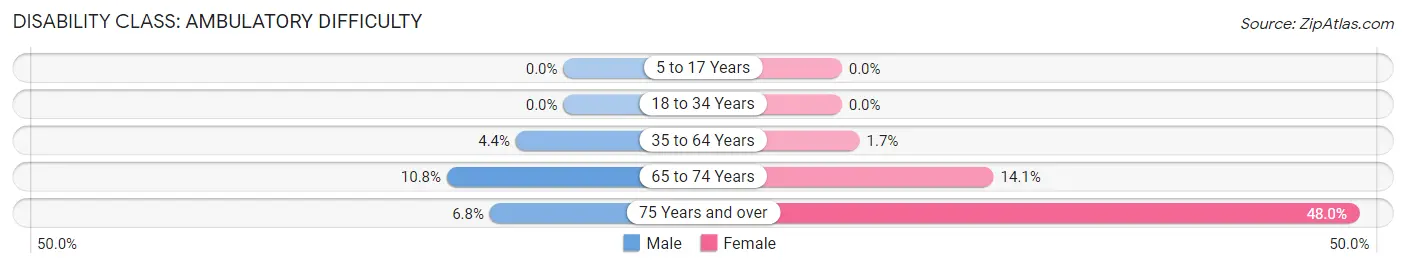
| Age Bracket | Male | Female |
| 5 to 17 Years | 0 (0.0%) | 0 (0.0%) |
| 18 to 34 Years | 0 (0.0%) | 0 (0.0%) |
| 35 to 64 Years | 59 (4.4%) | 26 (1.7%) |
| 65 to 74 Years | 32 (10.8%) | 42 (14.1%) |
| 75 Years and over | 11 (6.8%) | 224 (48.0%) |
Disability Class: Self-Care Difficulty
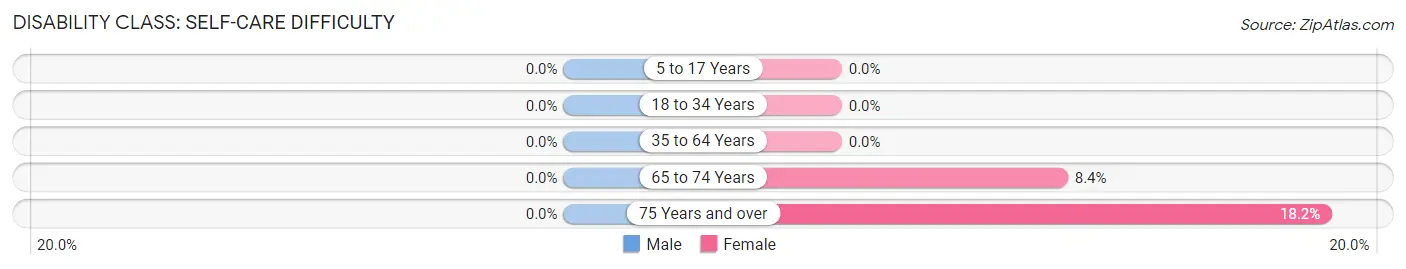
| Age Bracket | Male | Female |
| 5 to 17 Years | 0 (0.0%) | 0 (0.0%) |
| 18 to 34 Years | 0 (0.0%) | 0 (0.0%) |
| 35 to 64 Years | 0 (0.0%) | 0 (0.0%) |
| 65 to 74 Years | 0 (0.0%) | 25 (8.4%) |
| 75 Years and over | 0 (0.0%) | 85 (18.2%) |
Technology Access in Robinwood
Computing Device Access in Robinwood
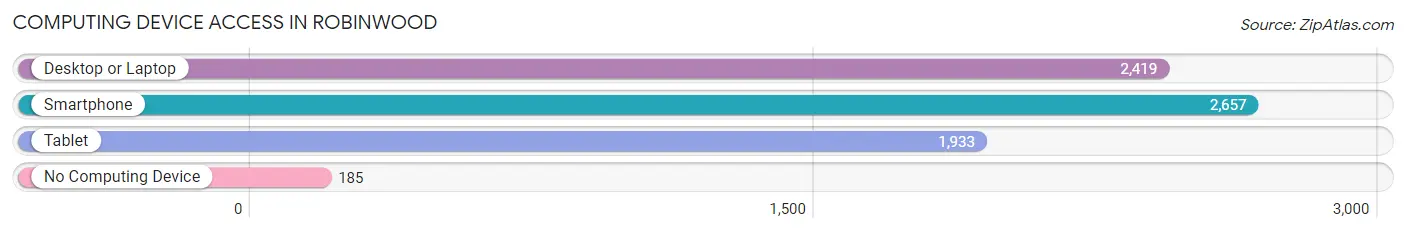
| Device Type | # Households | % Households |
| Desktop or Laptop | 2,419 | 83.0% |
| Smartphone | 2,657 | 91.2% |
| Tablet | 1,933 | 66.3% |
| No Computing Device | 185 | 6.4% |
| Total | 2,914 | 100.0% |
Internet Access in Robinwood
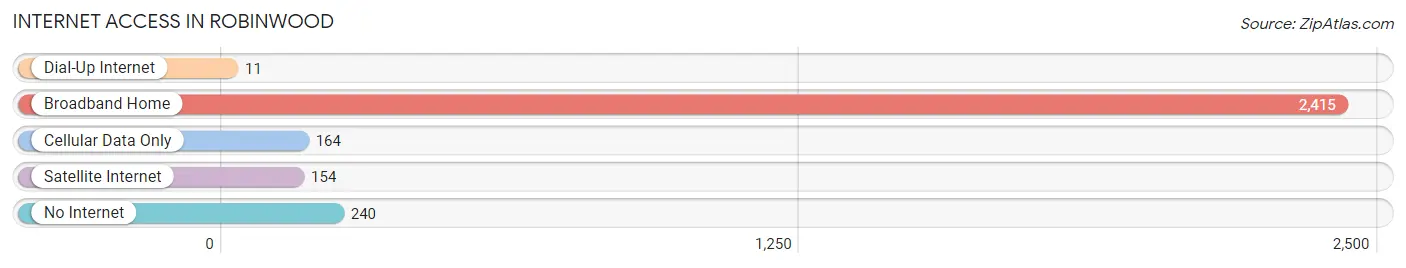
| Internet Type | # Households | % Households |
| Dial-Up Internet | 11 | 0.4% |
| Broadband Home | 2,415 | 82.9% |
| Cellular Data Only | 164 | 5.6% |
| Satellite Internet | 154 | 5.3% |
| No Internet | 240 | 8.2% |
| Total | 2,914 | 100.0% |
Robinwood Summary
Woodbine, Maryland is a small town located in Howard County, Maryland. It is situated in the western part of the county, just south of the Patuxent River. The town is bordered by the towns of Lisbon, Glenwood, and Clarksville. Woodbine is a rural community with a population of approximately 1,500 people.
The town of Woodbine was founded in 1872 by the Baltimore and Ohio Railroad. The railroad was looking for a place to build a station and chose the area because of its proximity to the Patuxent River. The town was named after the nearby Woodbine Plantation, which was owned by the prominent Maryland family of the same name.
The town of Woodbine is located in the Piedmont region of Maryland. The terrain is mostly rolling hills and valleys, with some flat areas. The climate is temperate, with hot summers and cold winters. The average annual temperature is around 55 degrees Fahrenheit.
The economy of Woodbine is largely based on agriculture. The town is home to several farms, including dairy, beef, and poultry farms. There are also several small businesses in the area, including a few restaurants, a grocery store, and a few other retail stores.
The population of Woodbine is predominantly white, with a small African American population. The median household income is around $50,000, and the median home value is around $200,000. The town is served by the Howard County Public School System.
Woodbine is a small, rural town with a rich history and a strong sense of community. It is a great place to live and raise a family, and it offers a peaceful, rural lifestyle. The town is close to major cities, such as Baltimore and Washington, D.C., and it is a great place to escape the hustle and bustle of city life.
Common Questions
What is Per Capita Income in Robinwood?
Per Capita income in Robinwood is $41,703.
What is the Median Family Income in Robinwood?
Median Family Income in Robinwood is $99,833.
What is the Median Household income in Robinwood?
Median Household Income in Robinwood is $84,904.
What is Income or Wage Gap in Robinwood?
Income or Wage Gap in Robinwood is 49.3%.
Women in Robinwood earn 50.7 cents for every dollar earned by a man.
What is Inequality or Gini Index in Robinwood?
Inequality or Gini Index in Robinwood is 0.42.
What is the Total Population of Robinwood?
Total Population of Robinwood is 8,002.
What is the Total Male Population of Robinwood?
Total Male Population of Robinwood is 3,575.
What is the Total Female Population of Robinwood?
Total Female Population of Robinwood is 4,427.
What is the Ratio of Males per 100 Females in Robinwood?
There are 80.75 Males per 100 Females in Robinwood.
What is the Ratio of Females per 100 Males in Robinwood?
There are 123.83 Females per 100 Males in Robinwood.
What is the Median Population Age in Robinwood?
Median Population Age in Robinwood is 37.5 Years.
What is the Average Family Size in Robinwood
Average Family Size in Robinwood is 3.2 People.
What is the Average Household Size in Robinwood
Average Household Size in Robinwood is 2.7 People.
How Large is the Labor Force in Robinwood?
There are 4,219 People in the Labor Forcein in Robinwood.
What is the Percentage of People in the Labor Force in Robinwood?
68.3% of People are in the Labor Force in Robinwood.
What is the Unemployment Rate in Robinwood?
Unemployment Rate in Robinwood is 3.5%.