Carlisle, KY Map & Demographics
Carlisle Map
Carlisle Overview
$25,702
PER CAPITA INCOME
$64,219
AVG FAMILY INCOME
$53,661
AVG HOUSEHOLD INCOME
46.6%
WAGE / INCOME GAP [ % ]
53.4¢/ $1
WAGE / INCOME GAP [ $ ]
0.43
INEQUALITY / GINI INDEX
2,627
TOTAL POPULATION
1,304
MALE POPULATION
1,323
FEMALE POPULATION
98.56
MALES / 100 FEMALES
101.46
FEMALES / 100 MALES
42.9
MEDIAN AGE
3.2
AVG FAMILY SIZE
2.5
AVG HOUSEHOLD SIZE
1,192
LABOR FORCE [ PEOPLE ]
56.0%
PERCENT IN LABOR FORCE
3.8%
UNEMPLOYMENT RATE
Carlisle Zip Codes
Carlisle Area Codes
Income in Carlisle
Income Overview in Carlisle
Per Capita Income in Carlisle is $25,702, while median incomes of families and households are $64,219 and $53,661 respectively.
| Characteristic | Number | Measure |
| Per Capita Income | 2,627 | $25,702 |
| Median Family Income | 609 | $64,219 |
| Mean Family Income | 609 | $67,608 |
| Median Household Income | 1,014 | $53,661 |
| Mean Household Income | 1,014 | $63,624 |
| Income Deficit | 609 | $0 |
| Wage / Income Gap (%) | 2,627 | 46.55% |
| Wage / Income Gap ($) | 2,627 | 53.45¢ per $1 |
| Gini / Inequality Index | 2,627 | 0.43 |
Earnings by Sex in Carlisle
Average Earnings in Carlisle are $30,088, $46,091 for men and $24,635 for women, a difference of 46.6%.
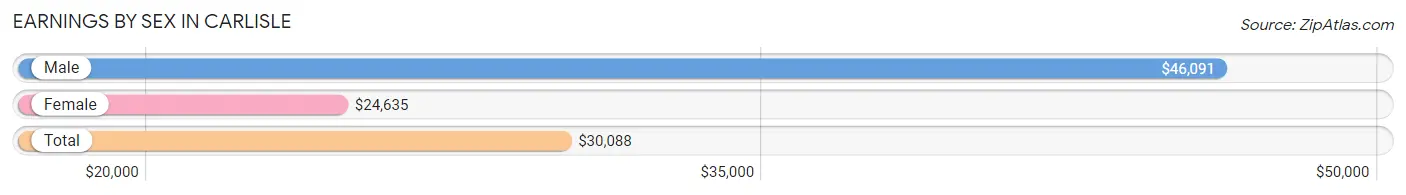
| Sex | Number | Average Earnings |
| Male | 687 (53.7%) | $46,091 |
| Female | 593 (46.3%) | $24,635 |
| Total | 1,280 (100.0%) | $30,088 |
Earnings by Sex by Income Bracket in Carlisle
The most common earnings brackets in Carlisle are $75,000 to $99,999 for men (150 | 21.8%) and $25,000 to $29,999 for women (118 | 19.9%).
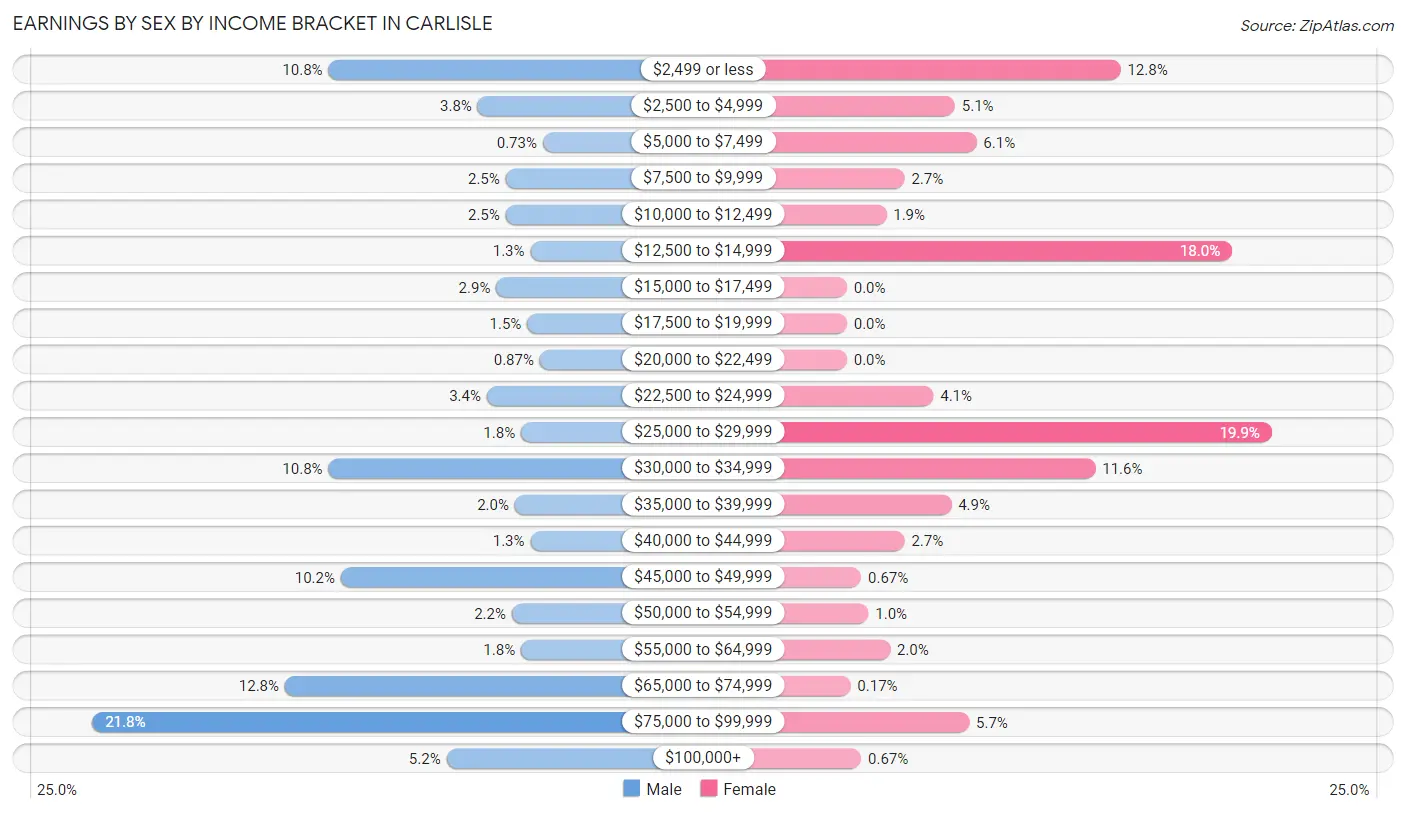
| Income | Male | Female |
| $2,499 or less | 74 (10.8%) | 76 (12.8%) |
| $2,500 to $4,999 | 26 (3.8%) | 30 (5.1%) |
| $5,000 to $7,499 | 5 (0.7%) | 36 (6.1%) |
| $7,500 to $9,999 | 17 (2.5%) | 16 (2.7%) |
| $10,000 to $12,499 | 17 (2.5%) | 11 (1.8%) |
| $12,500 to $14,999 | 9 (1.3%) | 107 (18.0%) |
| $15,000 to $17,499 | 20 (2.9%) | 0 (0.0%) |
| $17,500 to $19,999 | 10 (1.5%) | 0 (0.0%) |
| $20,000 to $22,499 | 6 (0.9%) | 0 (0.0%) |
| $22,500 to $24,999 | 23 (3.4%) | 24 (4.1%) |
| $25,000 to $29,999 | 12 (1.8%) | 118 (19.9%) |
| $30,000 to $34,999 | 74 (10.8%) | 69 (11.6%) |
| $35,000 to $39,999 | 14 (2.0%) | 29 (4.9%) |
| $40,000 to $44,999 | 9 (1.3%) | 16 (2.7%) |
| $45,000 to $49,999 | 70 (10.2%) | 4 (0.7%) |
| $50,000 to $54,999 | 15 (2.2%) | 6 (1.0%) |
| $55,000 to $64,999 | 12 (1.8%) | 12 (2.0%) |
| $65,000 to $74,999 | 88 (12.8%) | 1 (0.2%) |
| $75,000 to $99,999 | 150 (21.8%) | 34 (5.7%) |
| $100,000+ | 36 (5.2%) | 4 (0.7%) |
| Total | 687 (100.0%) | 593 (100.0%) |
Earnings by Sex by Educational Attainment in Carlisle
Average earnings in Carlisle are $53,583 for men and $25,391 for women, a difference of 52.6%. Men with an educational attainment of college or associate's degree enjoy the highest average annual earnings of $78,145, while those with bachelor's degree education earn the least with $16,458. Women with an educational attainment of graduate degree earn the most with the average annual earnings of $54,375, while those with high school diploma education have the smallest earnings of $14,424.
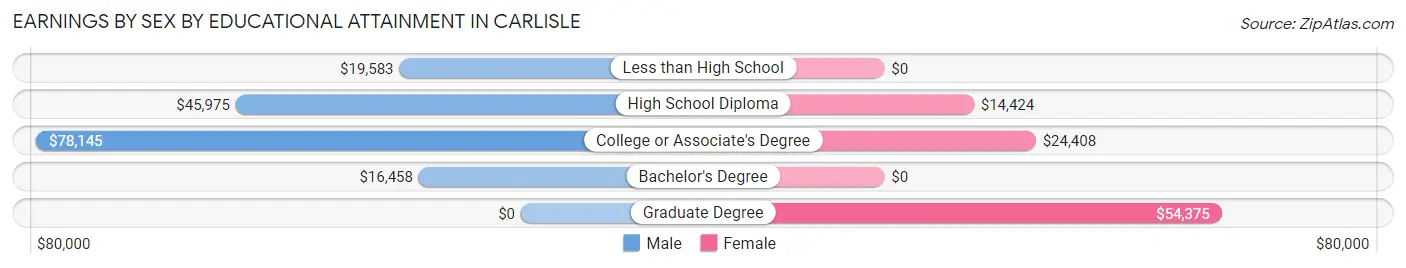
| Educational Attainment | Male Income | Female Income |
| Less than High School | $19,583 | $0 |
| High School Diploma | $45,975 | $14,424 |
| College or Associate's Degree | $78,145 | $24,408 |
| Bachelor's Degree | $16,458 | $0 |
| Graduate Degree | - | - |
| Total | $53,583 | $25,391 |
Family Income in Carlisle
Family Income Brackets in Carlisle
According to the Carlisle family income data, there are 187 families falling into the $75,000 to $99,999 income range, which is the most common income bracket and makes up 30.7% of all families. Conversely, the $200,000+ income bracket is the least frequent group with only 5 families (0.8%) belonging to this category.
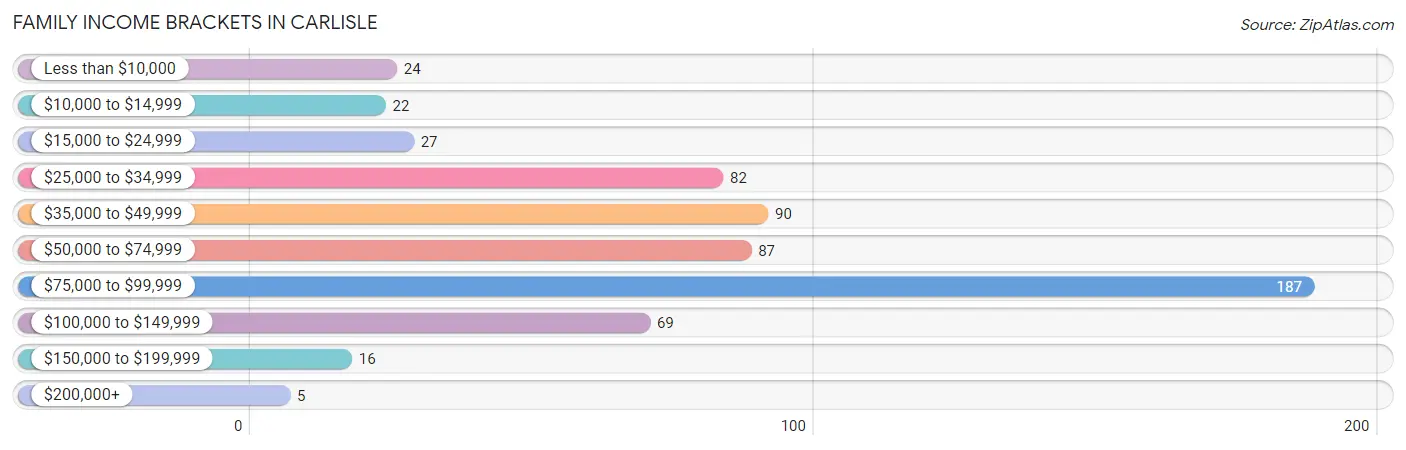
| Income Bracket | # Families | % Families |
| Less than $10,000 | 24 | 3.9% |
| $10,000 to $14,999 | 22 | 3.6% |
| $15,000 to $24,999 | 27 | 4.4% |
| $25,000 to $34,999 | 82 | 13.5% |
| $35,000 to $49,999 | 90 | 14.8% |
| $50,000 to $74,999 | 87 | 14.3% |
| $75,000 to $99,999 | 187 | 30.7% |
| $100,000 to $149,999 | 69 | 11.3% |
| $150,000 to $199,999 | 16 | 2.6% |
| $200,000+ | 5 | 0.8% |
Family Income by Famaliy Size in Carlisle
4-person families (107 | 17.6%) account for the highest median family income in Carlisle with $86,233 per family, while 2-person families (301 | 49.4%) have the highest median income of $37,582 per family member.
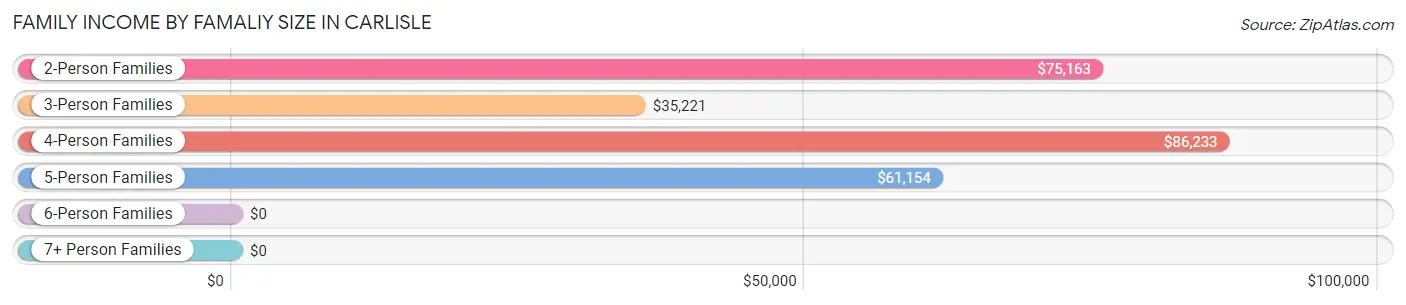
| Income Bracket | # Families | Median Income |
| 2-Person Families | 301 (49.4%) | $75,163 |
| 3-Person Families | 169 (27.8%) | $35,221 |
| 4-Person Families | 107 (17.6%) | $86,233 |
| 5-Person Families | 32 (5.2%) | $61,154 |
| 6-Person Families | 0 (0.0%) | $0 |
| 7+ Person Families | 0 (0.0%) | $0 |
| Total | 609 (100.0%) | $64,219 |
Family Income by Number of Earners in Carlisle
The median family income in Carlisle is $64,219, with families comprising 2 earners (192) having the highest median family income of $97,857, while families with no earners (130) have the lowest median family income of $38,000, accounting for 31.5% and 21.3% of families, respectively.
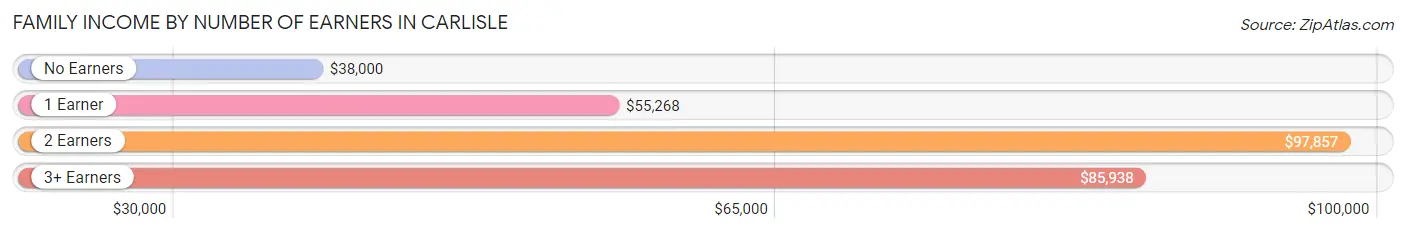
| Number of Earners | # Families | Median Income |
| No Earners | 130 (21.3%) | $38,000 |
| 1 Earner | 197 (32.4%) | $55,268 |
| 2 Earners | 192 (31.5%) | $97,857 |
| 3+ Earners | 90 (14.8%) | $85,938 |
| Total | 609 (100.0%) | $64,219 |
Household Income in Carlisle
Household Income Brackets in Carlisle
With 275 households falling in the category, the $75,000 to $99,999 income range is the most frequent in Carlisle, accounting for 27.1% of all households. In contrast, only 15 households (1.5%) fall into the $200,000+ income bracket, making it the least populous group.
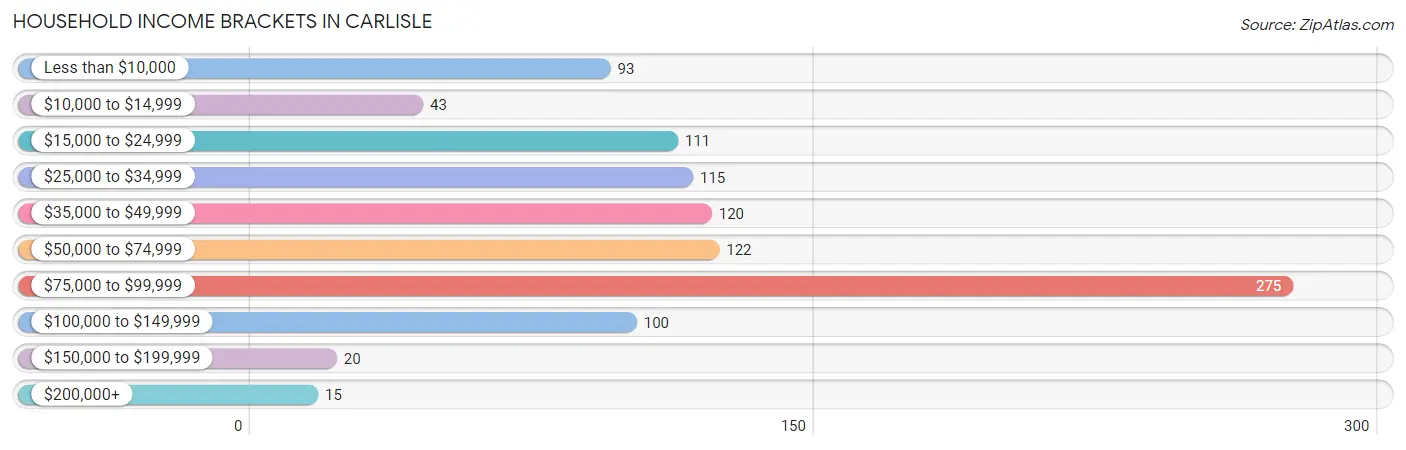
| Income Bracket | # Households | % Households |
| Less than $10,000 | 93 | 9.2% |
| $10,000 to $14,999 | 43 | 4.2% |
| $15,000 to $24,999 | 111 | 10.9% |
| $25,000 to $34,999 | 115 | 11.3% |
| $35,000 to $49,999 | 120 | 11.8% |
| $50,000 to $74,999 | 122 | 12.0% |
| $75,000 to $99,999 | 275 | 27.1% |
| $100,000 to $149,999 | 100 | 9.9% |
| $150,000 to $199,999 | 20 | 2.0% |
| $200,000+ | 15 | 1.5% |
Household Income by Householder Age in Carlisle
The median household income in Carlisle is $53,661, with the highest median household income of $75,139 found in the 45 to 64 years age bracket for the primary householder. A total of 471 households (46.5%) fall into this category. Meanwhile, the 15 to 24 years age bracket for the primary householder has the lowest median household income of $0, with 21 households (2.1%) in this group.
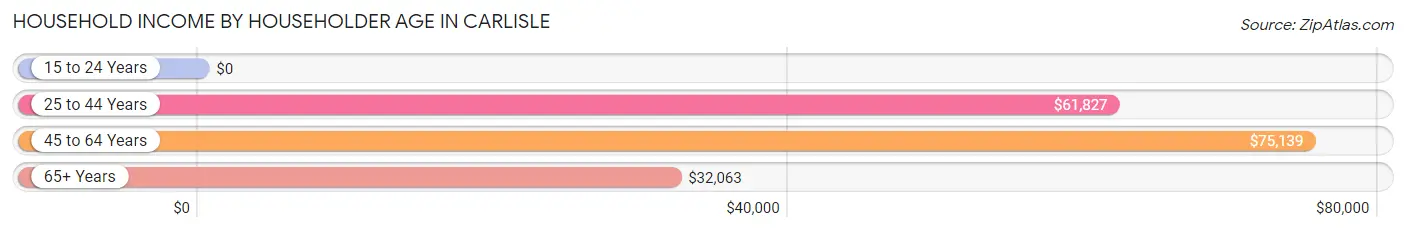
| Income Bracket | # Households | Median Income |
| 15 to 24 Years | 21 (2.1%) | $0 |
| 25 to 44 Years | 237 (23.4%) | $61,827 |
| 45 to 64 Years | 471 (46.5%) | $75,139 |
| 65+ Years | 285 (28.1%) | $32,063 |
| Total | 1,014 (100.0%) | $53,661 |
Poverty in Carlisle
Income Below Poverty by Sex and Age in Carlisle
With 16.3% poverty level for males and 19.1% for females among the residents of Carlisle, under 5 year old males and 65 to 74 year old females are the most vulnerable to poverty, with 36 males (65.4%) and 49 females (35.8%) in their respective age groups living below the poverty level.
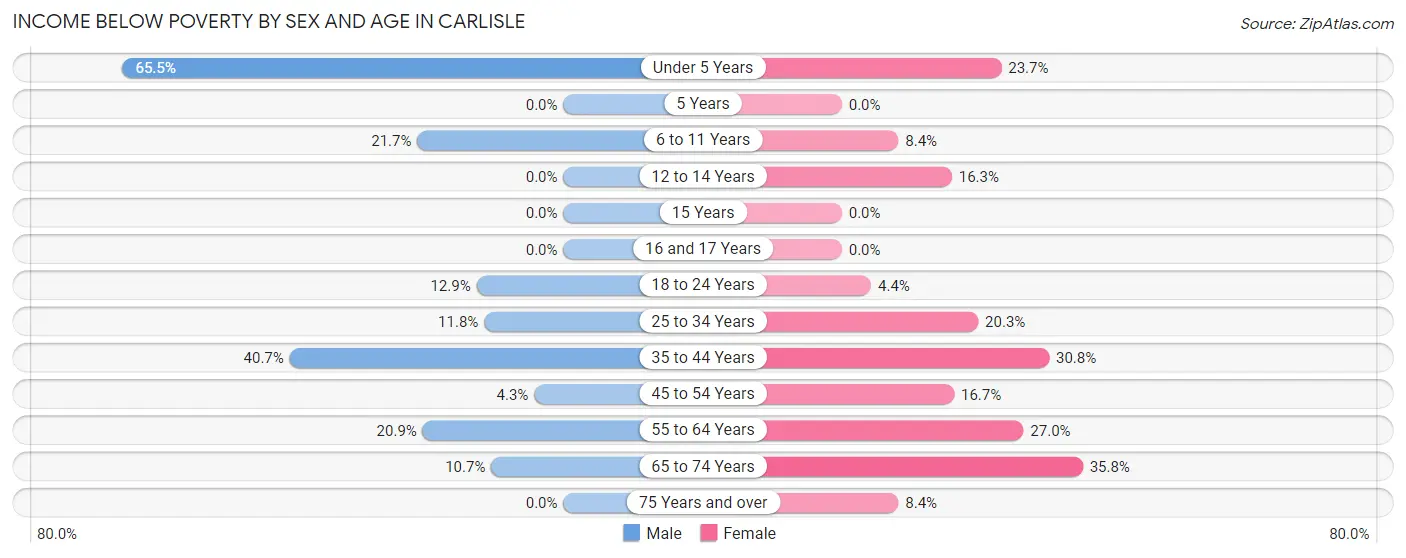
| Age Bracket | Male | Female |
| Under 5 Years | 36 (65.4%) | 9 (23.7%) |
| 5 Years | 0 (0.0%) | 0 (0.0%) |
| 6 to 11 Years | 18 (21.7%) | 11 (8.4%) |
| 12 to 14 Years | 0 (0.0%) | 8 (16.3%) |
| 15 Years | 0 (0.0%) | 0 (0.0%) |
| 16 and 17 Years | 0 (0.0%) | 0 (0.0%) |
| 18 to 24 Years | 20 (12.9%) | 4 (4.3%) |
| 25 to 34 Years | 18 (11.8%) | 33 (20.3%) |
| 35 to 44 Years | 63 (40.6%) | 40 (30.8%) |
| 45 to 54 Years | 10 (4.3%) | 35 (16.7%) |
| 55 to 64 Years | 33 (20.9%) | 41 (27.0%) |
| 65 to 74 Years | 9 (10.7%) | 49 (35.8%) |
| 75 Years and over | 0 (0.0%) | 10 (8.4%) |
| Total | 207 (16.3%) | 240 (19.1%) |
Income Above Poverty by Sex and Age in Carlisle
According to the poverty statistics in Carlisle, males aged 5 years and females aged 15 years are the age groups that are most secure financially, with 100.0% of males and 100.0% of females in these age groups living above the poverty line.
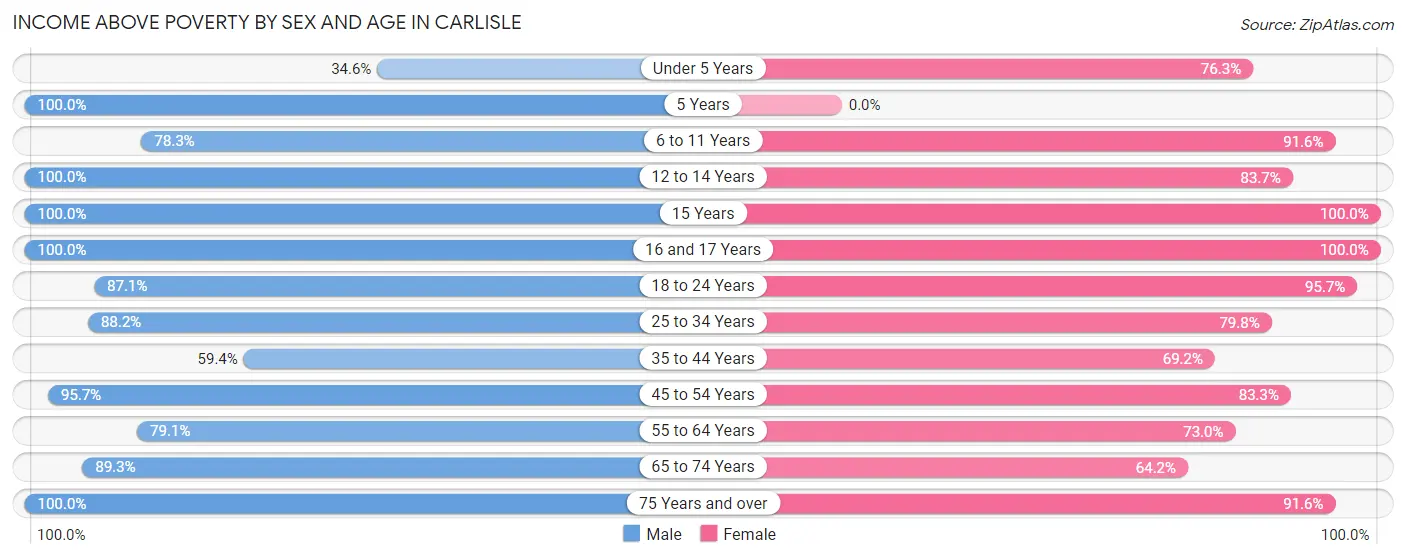
| Age Bracket | Male | Female |
| Under 5 Years | 19 (34.5%) | 29 (76.3%) |
| 5 Years | 1 (100.0%) | 0 (0.0%) |
| 6 to 11 Years | 65 (78.3%) | 120 (91.6%) |
| 12 to 14 Years | 85 (100.0%) | 41 (83.7%) |
| 15 Years | 33 (100.0%) | 23 (100.0%) |
| 16 and 17 Years | 4 (100.0%) | 10 (100.0%) |
| 18 to 24 Years | 135 (87.1%) | 88 (95.7%) |
| 25 to 34 Years | 135 (88.2%) | 130 (79.7%) |
| 35 to 44 Years | 92 (59.4%) | 90 (69.2%) |
| 45 to 54 Years | 221 (95.7%) | 175 (83.3%) |
| 55 to 64 Years | 125 (79.1%) | 111 (73.0%) |
| 65 to 74 Years | 75 (89.3%) | 88 (64.2%) |
| 75 Years and over | 70 (100.0%) | 109 (91.6%) |
| Total | 1,060 (83.7%) | 1,014 (80.9%) |
Income Below Poverty Among Married-Couple Families in Carlisle
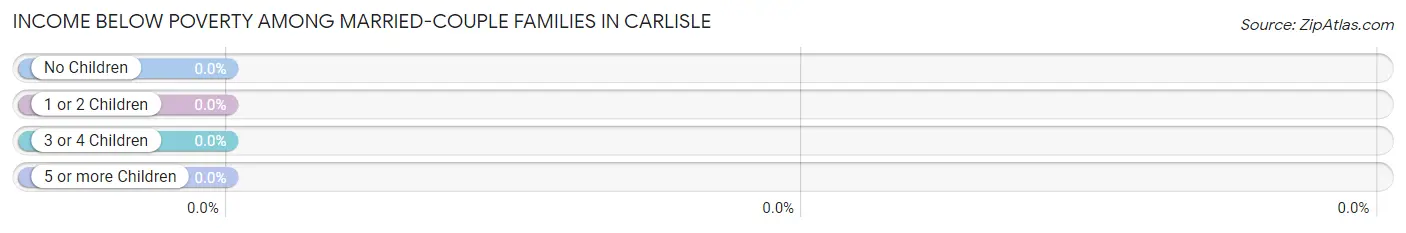
| Children | Above Poverty | Below Poverty |
| No Children | 191 (100.0%) | 0 (0.0%) |
| 1 or 2 Children | 167 (100.0%) | 0 (0.0%) |
| 3 or 4 Children | 9 (100.0%) | 0 (0.0%) |
| 5 or more Children | 0 (0.0%) | 0 (0.0%) |
| Total | 367 (100.0%) | 0 (0.0%) |
Income Below Poverty Among Single-Parent Households in Carlisle
According to the poverty data in Carlisle, 25.0% or 22 single-father households and 29.2% or 45 single-mother households are living below the poverty line. Among single-father households, those with 1 or 2 children have the highest poverty rate, with 10 households (58.8%) experiencing poverty. Likewise, among single-mother households, those with 3 or 4 children have the highest poverty rate, with 11 households (100.0%) falling below the poverty line.
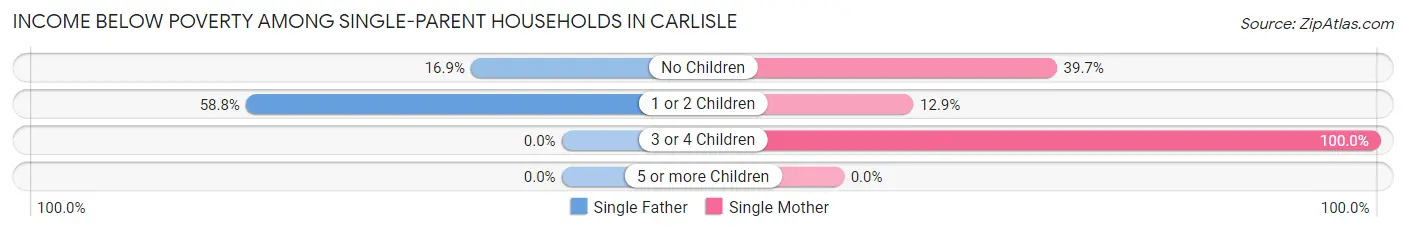
| Children | Single Father | Single Mother |
| No Children | 12 (16.9%) | 23 (39.7%) |
| 1 or 2 Children | 10 (58.8%) | 11 (12.9%) |
| 3 or 4 Children | 0 (0.0%) | 11 (100.0%) |
| 5 or more Children | 0 (0.0%) | 0 (0.0%) |
| Total | 22 (25.0%) | 45 (29.2%) |
Income Below Poverty Among Married-Couple vs Single-Parent Households in Carlisle
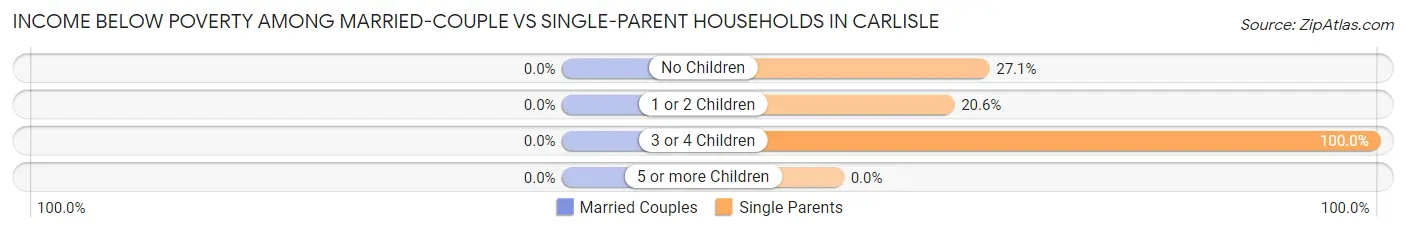
| Children | Married-Couple Families | Single-Parent Households |
| No Children | 0 (0.0%) | 35 (27.1%) |
| 1 or 2 Children | 0 (0.0%) | 21 (20.6%) |
| 3 or 4 Children | 0 (0.0%) | 11 (100.0%) |
| 5 or more Children | 0 (0.0%) | 0 (0.0%) |
| Total | 0 (0.0%) | 67 (27.7%) |
Race in Carlisle
The most populous races in Carlisle are White / Caucasian (2,456 | 93.5%), Two or more Races (116 | 4.4%), and Black / African American (55 | 2.1%).
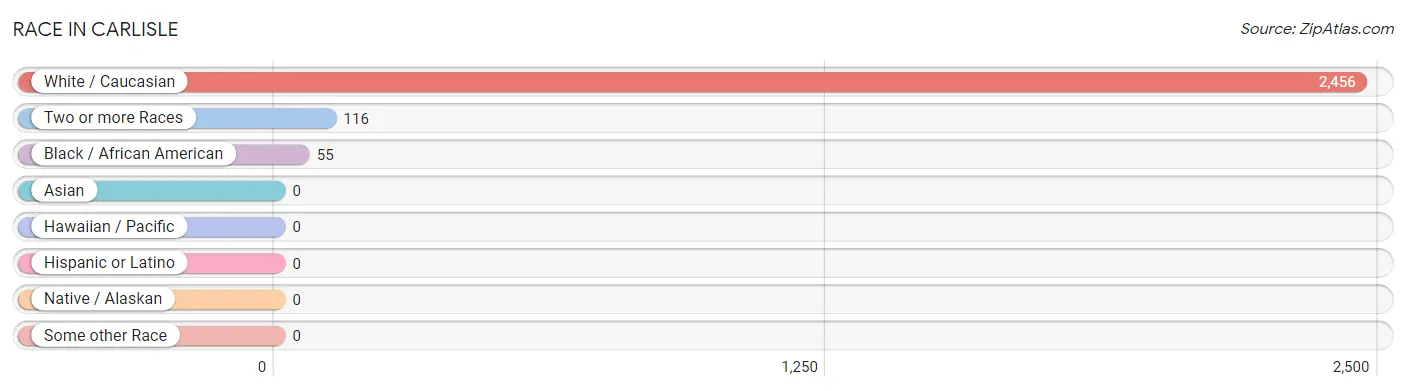
| Race | # Population | % Population |
| Asian | 0 | 0.0% |
| Black / African American | 55 | 2.1% |
| Hawaiian / Pacific | 0 | 0.0% |
| Hispanic or Latino | 0 | 0.0% |
| Native / Alaskan | 0 | 0.0% |
| White / Caucasian | 2,456 | 93.5% |
| Two or more Races | 116 | 4.4% |
| Some other Race | 0 | 0.0% |
| Total | 2,627 | 100.0% |
Ancestry in Carlisle
The most populous ancestries reported in Carlisle are American (1,031 | 39.3%), Irish (347 | 13.2%), English (269 | 10.2%), German (81 | 3.1%), and Dutch (59 | 2.2%), together accounting for 68.0% of all Carlisle residents.
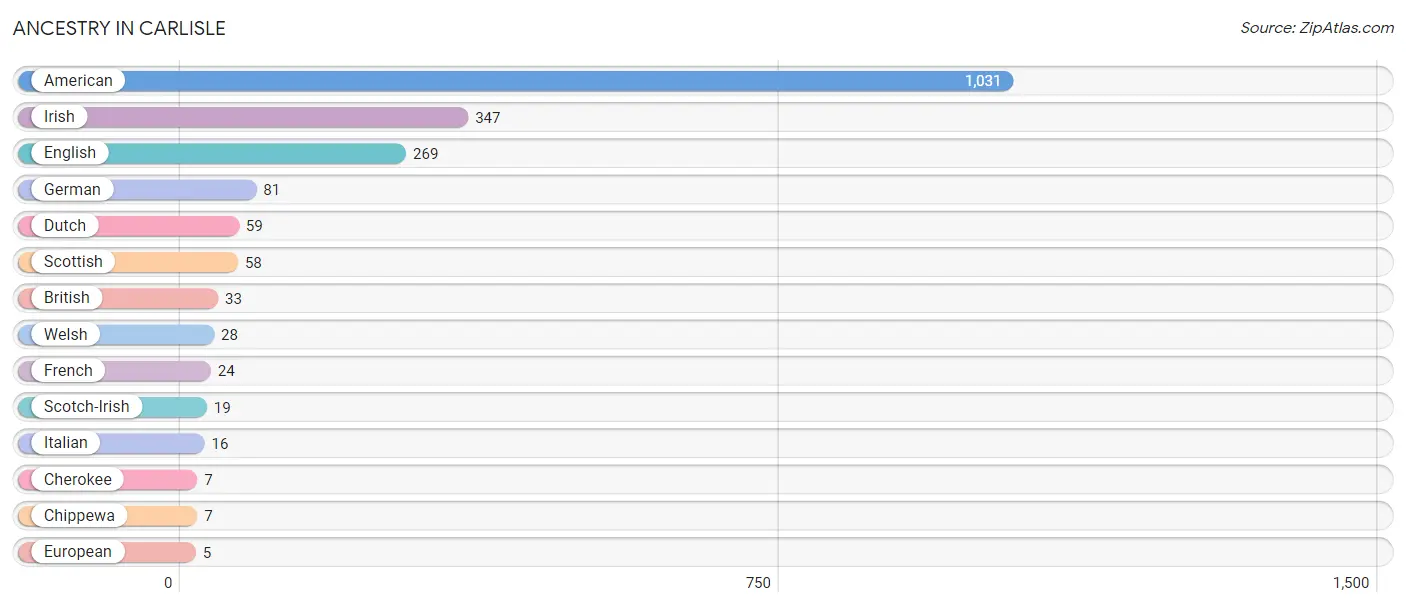
| Ancestry | # Population | % Population |
| American | 1,031 | 39.3% |
| British | 33 | 1.3% |
| Cherokee | 7 | 0.3% |
| Chippewa | 7 | 0.3% |
| Dutch | 59 | 2.2% |
| English | 269 | 10.2% |
| European | 5 | 0.2% |
| French | 24 | 0.9% |
| German | 81 | 3.1% |
| Irish | 347 | 13.2% |
| Italian | 16 | 0.6% |
| Scotch-Irish | 19 | 0.7% |
| Scottish | 58 | 2.2% |
| Welsh | 28 | 1.1% | View All 14 Rows |
Immigrants in Carlisle
The most numerous immigrant groups reported in Carlisle came from Africa (10 | 0.4%), Europe (3 | 0.1%), Germany (3 | 0.1%), and Western Europe (3 | 0.1%), together accounting for 0.7% of all Carlisle residents.
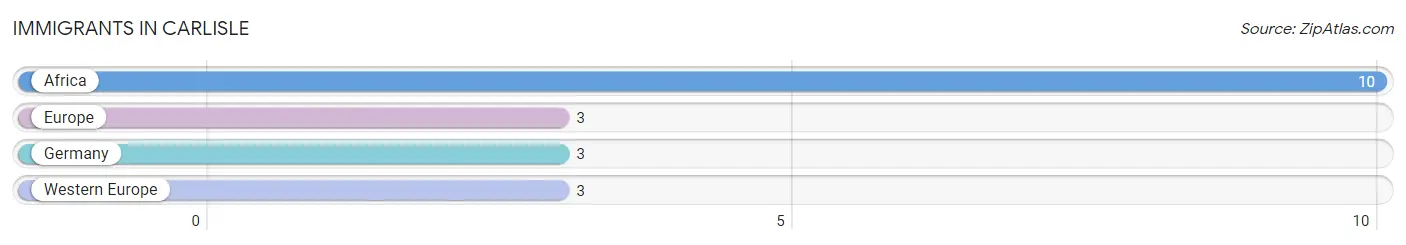
| Immigration Origin | # Population | % Population |
| Africa | 10 | 0.4% |
| Europe | 3 | 0.1% |
| Germany | 3 | 0.1% |
| Western Europe | 3 | 0.1% | View All 4 Rows |
Sex and Age in Carlisle
Sex and Age in Carlisle
The most populous age groups in Carlisle are 45 to 49 Years (122 | 9.4%) for men and 45 to 49 Years (133 | 10.1%) for women.
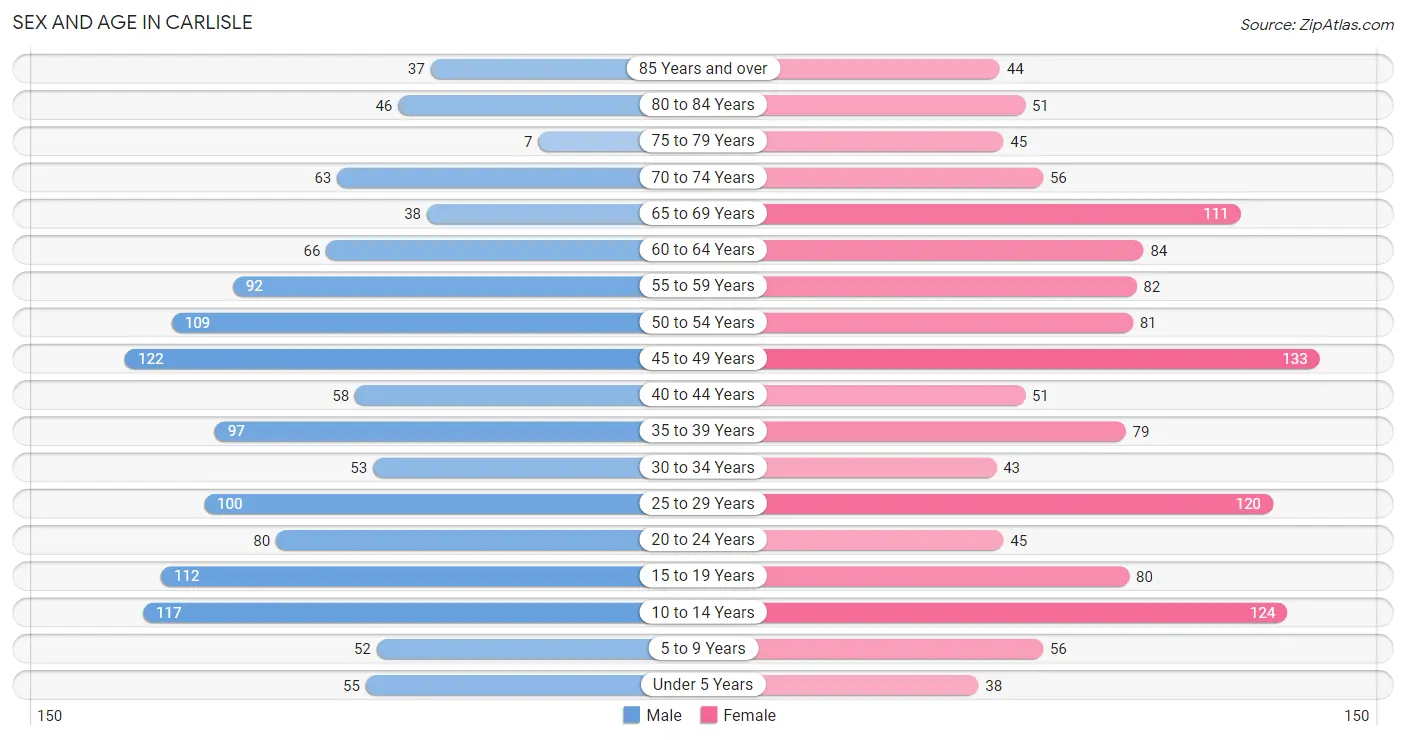
| Age Bracket | Male | Female |
| Under 5 Years | 55 (4.2%) | 38 (2.9%) |
| 5 to 9 Years | 52 (4.0%) | 56 (4.2%) |
| 10 to 14 Years | 117 (9.0%) | 124 (9.4%) |
| 15 to 19 Years | 112 (8.6%) | 80 (6.0%) |
| 20 to 24 Years | 80 (6.1%) | 45 (3.4%) |
| 25 to 29 Years | 100 (7.7%) | 120 (9.1%) |
| 30 to 34 Years | 53 (4.1%) | 43 (3.3%) |
| 35 to 39 Years | 97 (7.4%) | 79 (6.0%) |
| 40 to 44 Years | 58 (4.4%) | 51 (3.8%) |
| 45 to 49 Years | 122 (9.4%) | 133 (10.1%) |
| 50 to 54 Years | 109 (8.4%) | 81 (6.1%) |
| 55 to 59 Years | 92 (7.1%) | 82 (6.2%) |
| 60 to 64 Years | 66 (5.1%) | 84 (6.4%) |
| 65 to 69 Years | 38 (2.9%) | 111 (8.4%) |
| 70 to 74 Years | 63 (4.8%) | 56 (4.2%) |
| 75 to 79 Years | 7 (0.5%) | 45 (3.4%) |
| 80 to 84 Years | 46 (3.5%) | 51 (3.8%) |
| 85 Years and over | 37 (2.8%) | 44 (3.3%) |
| Total | 1,304 (100.0%) | 1,323 (100.0%) |
Families and Households in Carlisle
Median Family Size in Carlisle
The median family size in Carlisle is 3.18 persons per family, with single female/mother families (154 | 25.3%) accounting for the largest median family size of 3.69 persons per family. On the other hand, married-couple families (367 | 60.3%) represent the smallest median family size with 2.95 persons per family.
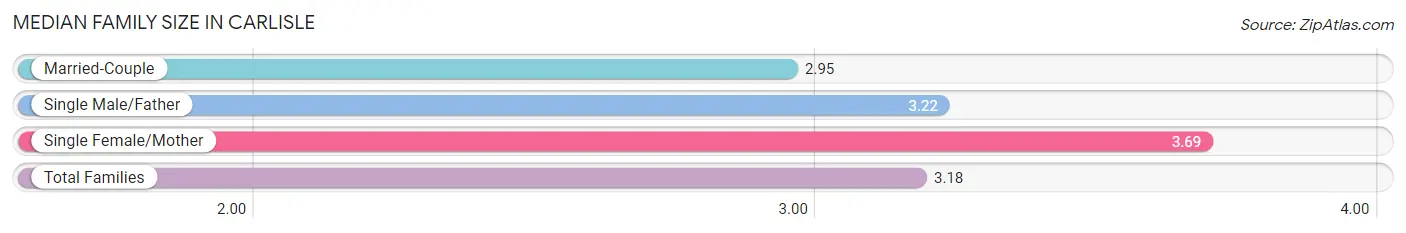
| Family Type | # Families | Family Size |
| Married-Couple | 367 (60.3%) | 2.95 |
| Single Male/Father | 88 (14.4%) | 3.22 |
| Single Female/Mother | 154 (25.3%) | 3.69 |
| Total Families | 609 (100.0%) | 3.18 |
Median Household Size in Carlisle
The median household size in Carlisle is 2.49 persons per household, with single female/mother households (154 | 15.2%) accounting for the largest median household size of 4.01 persons per household. non-family households (405 | 39.9%) represent the smallest median household size with 1.30 persons per household.
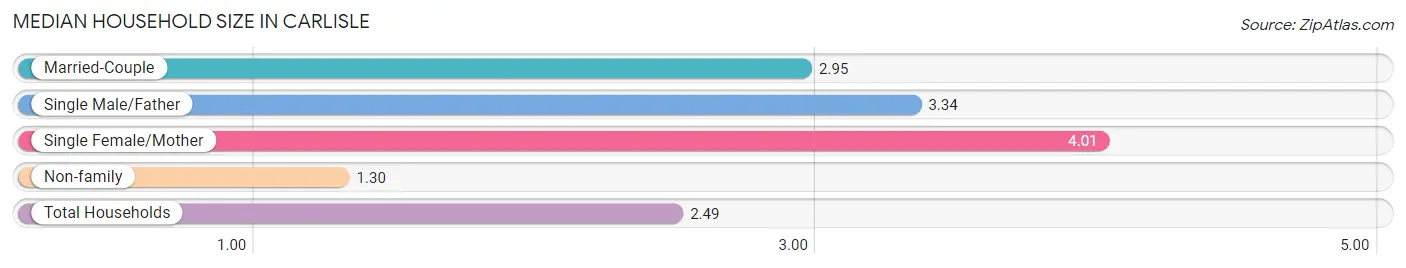
| Household Type | # Households | Household Size |
| Married-Couple | 367 (36.2%) | 2.95 |
| Single Male/Father | 88 (8.7%) | 3.34 |
| Single Female/Mother | 154 (15.2%) | 4.01 |
| Non-family | 405 (39.9%) | 1.30 |
| Total Households | 1,014 (100.0%) | 2.49 |
Household Size by Marriage Status in Carlisle
Out of a total of 1,014 households in Carlisle, 609 (60.1%) are family households, while 405 (39.9%) are nonfamily households. The most numerous type of family households are 2-person households, comprising 294, and the most common type of nonfamily households are 1-person households, comprising 305.
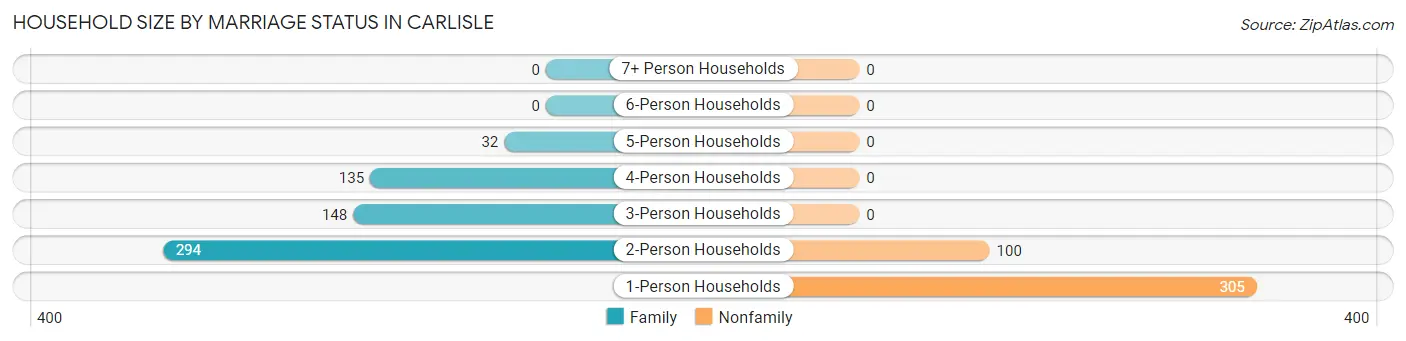
| Household Size | Family Households | Nonfamily Households |
| 1-Person Households | - | 305 (30.1%) |
| 2-Person Households | 294 (29.0%) | 100 (9.9%) |
| 3-Person Households | 148 (14.6%) | 0 (0.0%) |
| 4-Person Households | 135 (13.3%) | 0 (0.0%) |
| 5-Person Households | 32 (3.2%) | 0 (0.0%) |
| 6-Person Households | 0 (0.0%) | 0 (0.0%) |
| 7+ Person Households | 0 (0.0%) | 0 (0.0%) |
| Total | 609 (60.1%) | 405 (39.9%) |
Female Fertility in Carlisle
Fertility by Age in Carlisle
Average fertility rate in Carlisle is 48.0 births per 1,000 women. Women in the age bracket of 20 to 34 years have the highest fertility rate with 130.0 births per 1,000 women. Women in the age bracket of 20 to 34 years acount for 96.4% of all women with births.
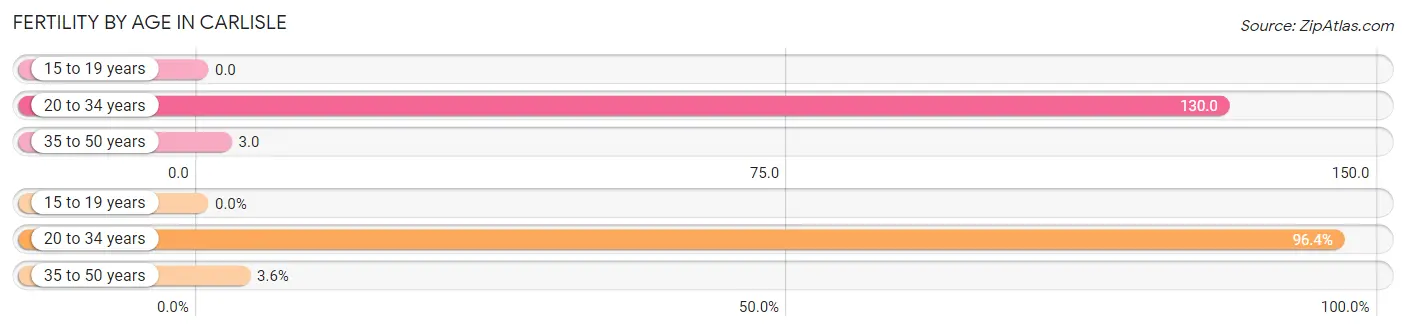
| Age Bracket | Women with Births | Births / 1,000 Women |
| 15 to 19 years | 0 (0.0%) | 0.0 |
| 20 to 34 years | 27 (96.4%) | 130.0 |
| 35 to 50 years | 1 (3.6%) | 3.0 |
| Total | 28 (100.0%) | 48.0 |
Fertility by Age by Marriage Status in Carlisle
60.7% of women with births (28) in Carlisle are married. The highest percentage of unmarried women with births falls into 20 to 34 years age bracket with 40.7% of them unmarried at the time of birth, while the lowest percentage of unmarried women with births belong to 35 to 50 years age bracket with 0.0% of them unmarried.
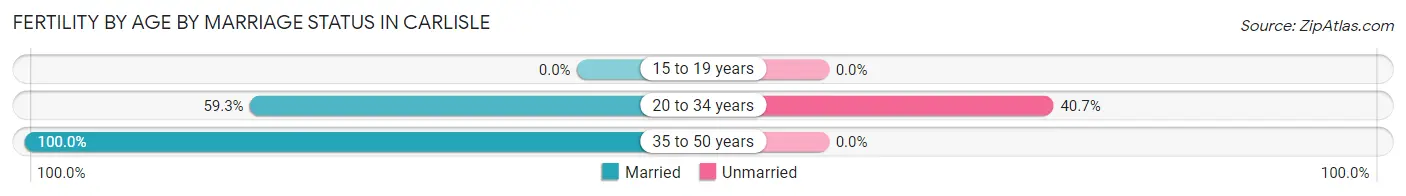
| Age Bracket | Married | Unmarried |
| 15 to 19 years | 0 (0.0%) | 0 (0.0%) |
| 20 to 34 years | 16 (59.3%) | 11 (40.7%) |
| 35 to 50 years | 1 (100.0%) | 0 (0.0%) |
| Total | 17 (60.7%) | 11 (39.3%) |
Fertility by Education in Carlisle
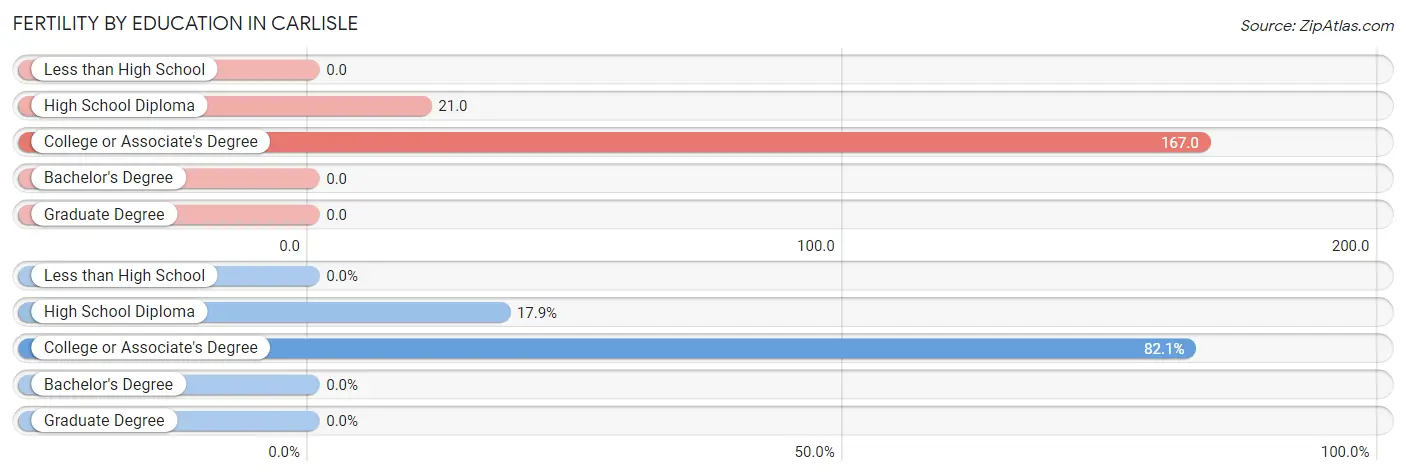
| Educational Attainment | Women with Births | Births / 1,000 Women |
| Less than High School | 0 (0.0%) | 0.0 |
| High School Diploma | 5 (17.9%) | 21.0 |
| College or Associate's Degree | 23 (82.1%) | 167.0 |
| Bachelor's Degree | 0 (0.0%) | 0.0 |
| Graduate Degree | 0 (0.0%) | 0.0 |
| Total | 28 (100.0%) | 48.0 |
Fertility by Education by Marriage Status in Carlisle
39.3% of women with births in Carlisle are unmarried. Women with the educational attainment of high school diploma are most likely to be married with 100.0% of them married at childbirth, while women with the educational attainment of college or associate's degree are least likely to be married with 47.8% of them unmarried at childbirth.
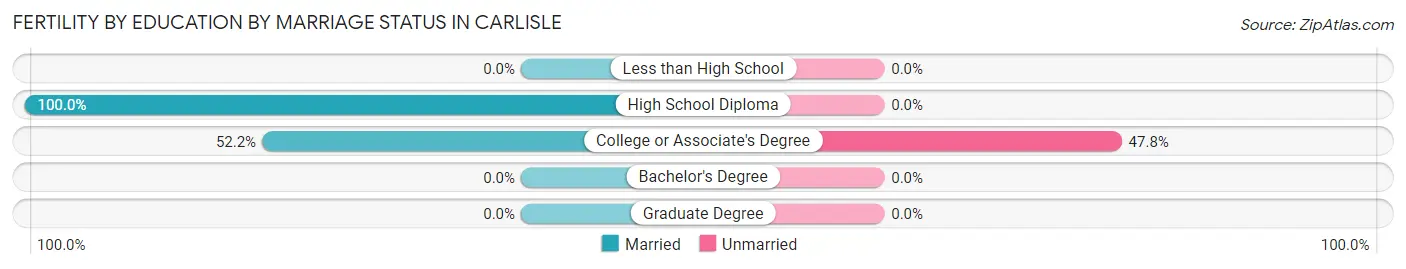
| Educational Attainment | Married | Unmarried |
| Less than High School | 0 (0.0%) | 0 (0.0%) |
| High School Diploma | 5 (100.0%) | 0 (0.0%) |
| College or Associate's Degree | 12 (52.2%) | 11 (47.8%) |
| Bachelor's Degree | 0 (0.0%) | 0 (0.0%) |
| Graduate Degree | 0 (0.0%) | 0 (0.0%) |
| Total | 17 (60.7%) | 11 (39.3%) |
Employment Characteristics in Carlisle
Employment by Class of Employer in Carlisle
Among the 1,138 employed individuals in Carlisle, private company employees (844 | 74.2%), self-employed (not incorporated) (99 | 8.7%), and self-employed (incorporated) (78 | 6.9%) make up the most common classes of employment.
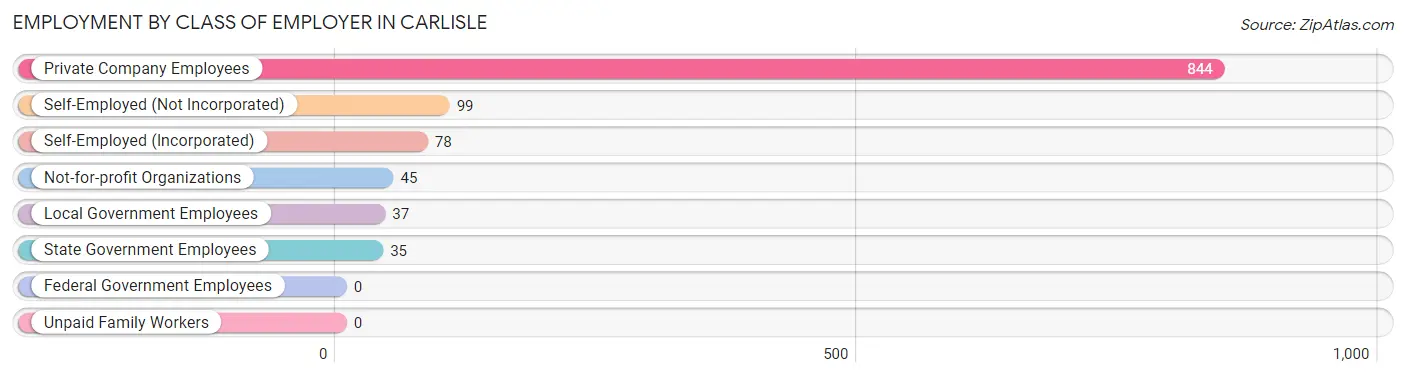
| Employer Class | # Employees | % Employees |
| Private Company Employees | 844 | 74.2% |
| Self-Employed (Incorporated) | 78 | 6.9% |
| Self-Employed (Not Incorporated) | 99 | 8.7% |
| Not-for-profit Organizations | 45 | 4.0% |
| Local Government Employees | 37 | 3.3% |
| State Government Employees | 35 | 3.1% |
| Federal Government Employees | 0 | 0.0% |
| Unpaid Family Workers | 0 | 0.0% |
| Total | 1,138 | 100.0% |
Employment Status by Age in Carlisle
According to the labor force statistics for Carlisle, out of the total population over 16 years of age (2,129), 56.0% or 1,192 individuals are in the labor force, with 3.8% or 45 of them unemployed. The age group with the highest labor force participation rate is 30 to 34 years, with 83.3% or 80 individuals in the labor force. Within the labor force, the 30 to 34 years age range has the highest percentage of unemployed individuals, with 27.5% or 22 of them being unemployed.
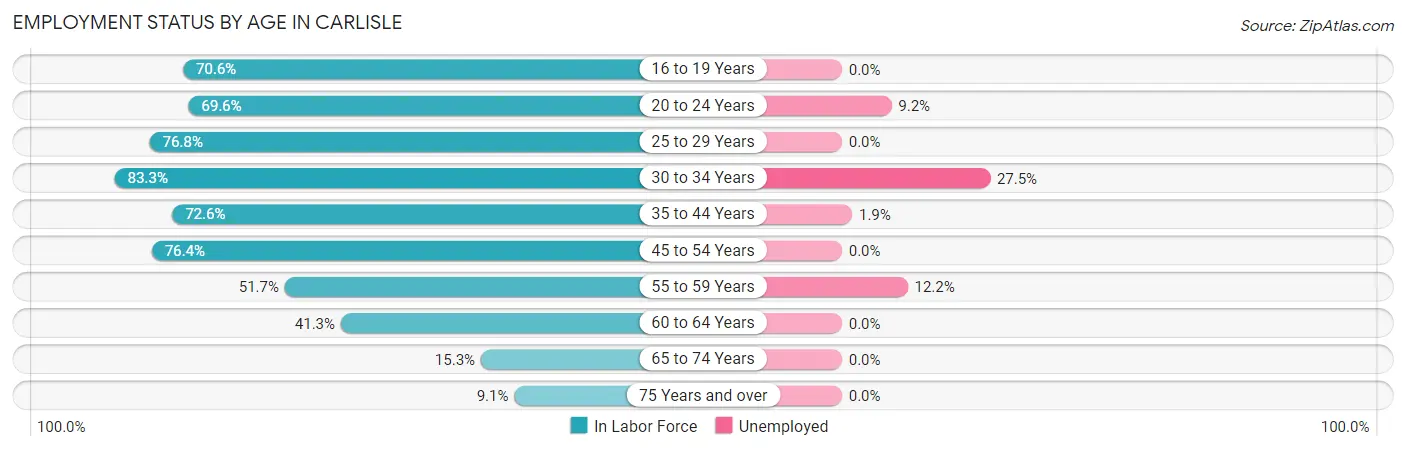
| Age Bracket | In Labor Force | Unemployed |
| 16 to 19 Years | 96 (70.6%) | 0 (0.0%) |
| 20 to 24 Years | 87 (69.6%) | 8 (9.2%) |
| 25 to 29 Years | 169 (76.8%) | 0 (0.0%) |
| 30 to 34 Years | 80 (83.3%) | 22 (27.5%) |
| 35 to 44 Years | 207 (72.6%) | 4 (1.9%) |
| 45 to 54 Years | 340 (76.4%) | 0 (0.0%) |
| 55 to 59 Years | 90 (51.7%) | 11 (12.2%) |
| 60 to 64 Years | 62 (41.3%) | 0 (0.0%) |
| 65 to 74 Years | 41 (15.3%) | 0 (0.0%) |
| 75 Years and over | 21 (9.1%) | 0 (0.0%) |
| Total | 1,192 (56.0%) | 45 (3.8%) |
Employment Status by Educational Attainment in Carlisle
According to labor force statistics for Carlisle, 69.2% of individuals (948) out of the total population between 25 and 64 years of age (1,370) are in the labor force, with 3.9% or 37 of them being unemployed. The group with the highest labor force participation rate are those with the educational attainment of bachelor's degree or higher, with 92.0% or 103 individuals in the labor force. Within the labor force, individuals with less than high school education have the highest percentage of unemployment, with 9.8% or 11 of them being unemployed.
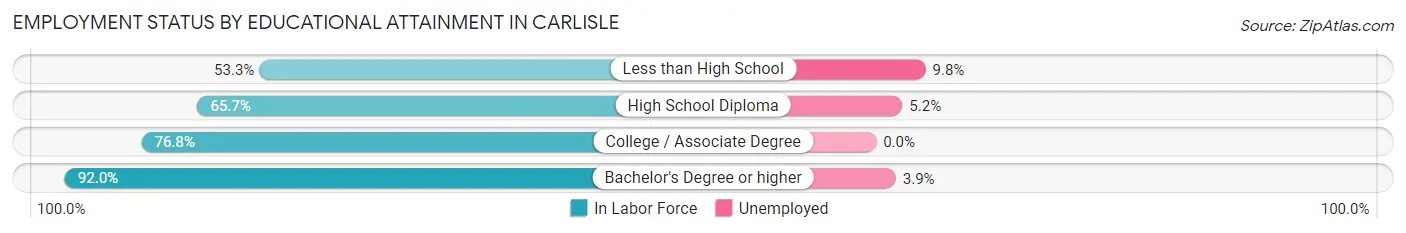
| Educational Attainment | In Labor Force | Unemployed |
| Less than High School | 112 (53.3%) | 21 (9.8%) |
| High School Diploma | 426 (65.7%) | 34 (5.2%) |
| College / Associate Degree | 307 (76.8%) | 0 (0.0%) |
| Bachelor's Degree or higher | 103 (92.0%) | 4 (3.9%) |
| Total | 948 (69.2%) | 53 (3.9%) |
Employment Occupations by Sex in Carlisle
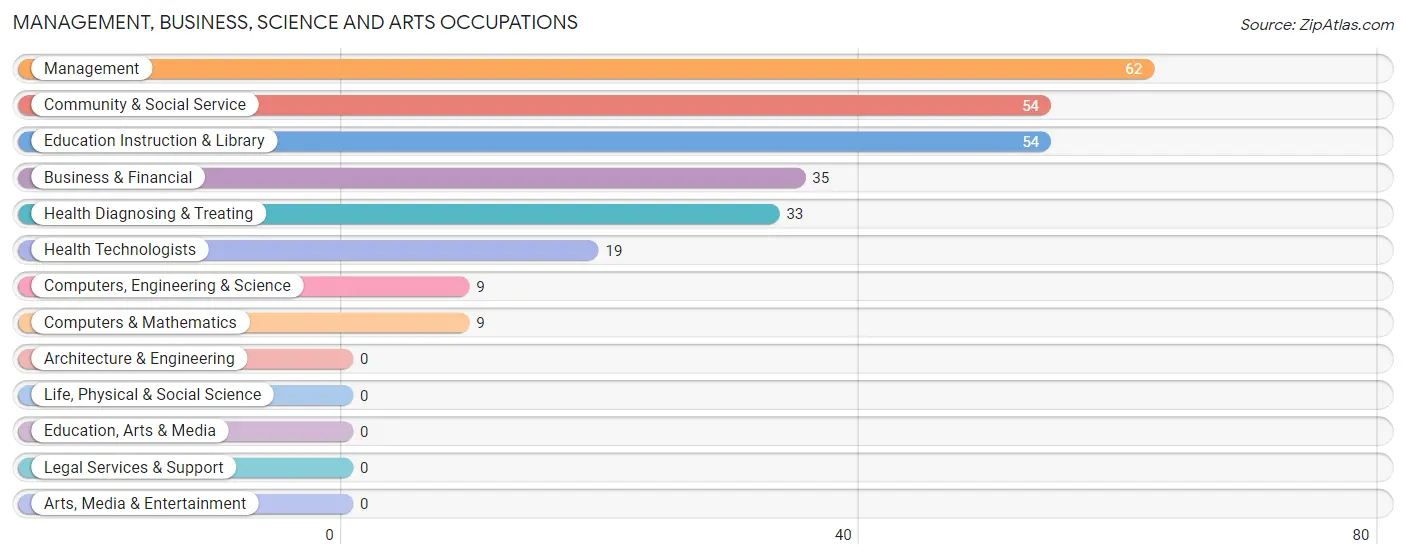
Management, Business, Science and Arts Occupations
The most common Management, Business, Science and Arts occupations in Carlisle are Management (62 | 5.4%), Community & Social Service (54 | 4.7%), Education Instruction & Library (54 | 4.7%), Business & Financial (35 | 3.0%), and Health Diagnosing & Treating (33 | 2.9%).
Management, Business, Science and Arts Occupations by Sex
Within the Management, Business, Science and Arts occupations in Carlisle, the most male-oriented occupations are Management (66.1%), Computers, Engineering & Science (44.4%), and Computers & Mathematics (44.4%), while the most female-oriented occupations are Health Diagnosing & Treating (100.0%), Health Technologists (100.0%), and Business & Financial (80.0%).
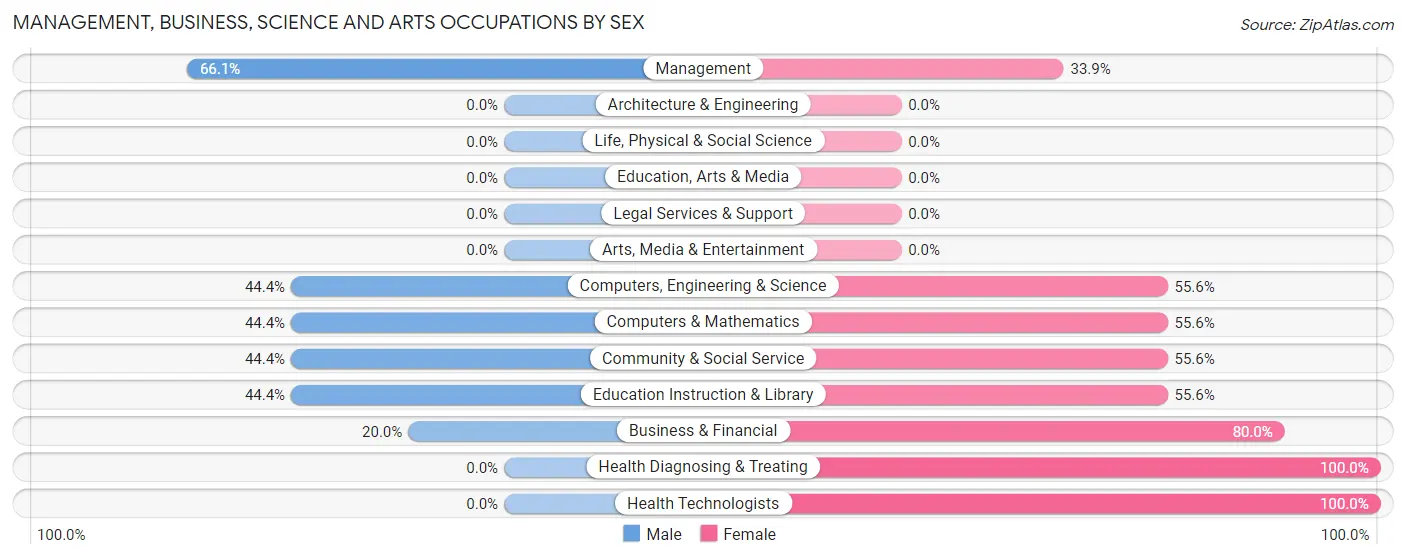
| Occupation | Male | Female |
| Management | 41 (66.1%) | 21 (33.9%) |
| Business & Financial | 7 (20.0%) | 28 (80.0%) |
| Computers, Engineering & Science | 4 (44.4%) | 5 (55.6%) |
| Computers & Mathematics | 4 (44.4%) | 5 (55.6%) |
| Architecture & Engineering | 0 (0.0%) | 0 (0.0%) |
| Life, Physical & Social Science | 0 (0.0%) | 0 (0.0%) |
| Community & Social Service | 24 (44.4%) | 30 (55.6%) |
| Education, Arts & Media | 0 (0.0%) | 0 (0.0%) |
| Legal Services & Support | 0 (0.0%) | 0 (0.0%) |
| Education Instruction & Library | 24 (44.4%) | 30 (55.6%) |
| Arts, Media & Entertainment | 0 (0.0%) | 0 (0.0%) |
| Health Diagnosing & Treating | 0 (0.0%) | 33 (100.0%) |
| Health Technologists | 0 (0.0%) | 19 (100.0%) |
| Total (Category) | 76 (39.4%) | 117 (60.6%) |
| Total (Overall) | 648 (56.5%) | 500 (43.5%) |
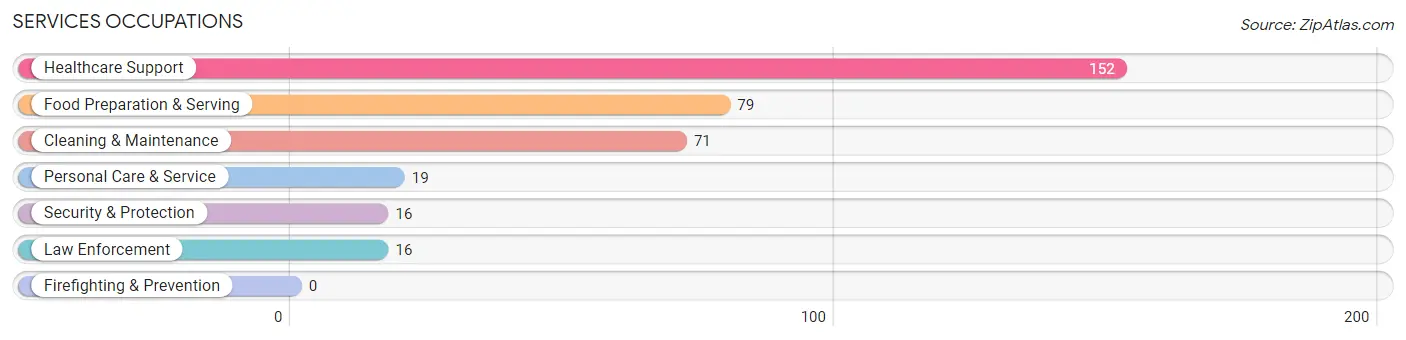
Services Occupations
The most common Services occupations in Carlisle are Healthcare Support (152 | 13.2%), Food Preparation & Serving (79 | 6.9%), Cleaning & Maintenance (71 | 6.2%), Personal Care & Service (19 | 1.7%), and Security & Protection (16 | 1.4%).
Services Occupations by Sex
Within the Services occupations in Carlisle, the most male-oriented occupations are Security & Protection (81.2%), Law Enforcement (81.2%), and Cleaning & Maintenance (70.4%), while the most female-oriented occupations are Healthcare Support (100.0%), Food Preparation & Serving (67.1%), and Personal Care & Service (52.6%).
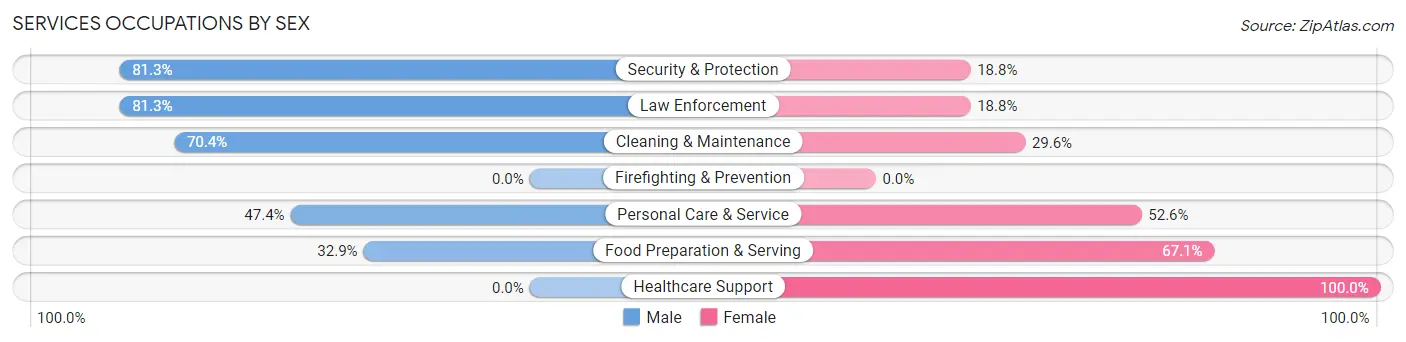
| Occupation | Male | Female |
| Healthcare Support | 0 (0.0%) | 152 (100.0%) |
| Security & Protection | 13 (81.2%) | 3 (18.8%) |
| Firefighting & Prevention | 0 (0.0%) | 0 (0.0%) |
| Law Enforcement | 13 (81.2%) | 3 (18.8%) |
| Food Preparation & Serving | 26 (32.9%) | 53 (67.1%) |
| Cleaning & Maintenance | 50 (70.4%) | 21 (29.6%) |
| Personal Care & Service | 9 (47.4%) | 10 (52.6%) |
| Total (Category) | 98 (29.1%) | 239 (70.9%) |
| Total (Overall) | 648 (56.5%) | 500 (43.5%) |
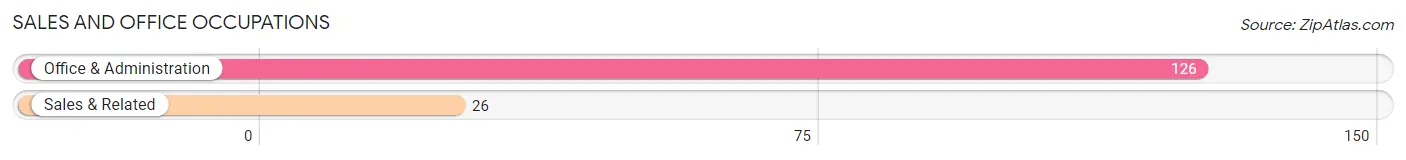
Sales and Office Occupations
The most common Sales and Office occupations in Carlisle are Office & Administration (126 | 11.0%), and Sales & Related (26 | 2.3%).
Sales and Office Occupations by Sex
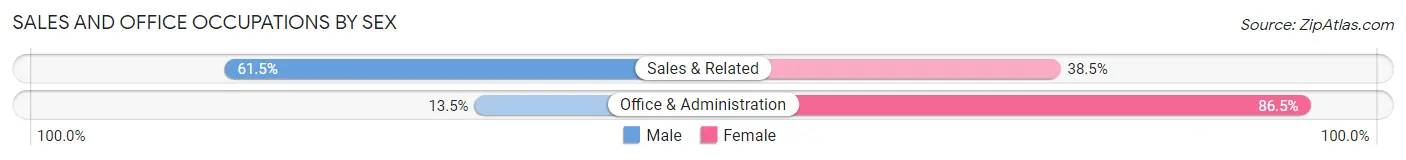
| Occupation | Male | Female |
| Sales & Related | 16 (61.5%) | 10 (38.5%) |
| Office & Administration | 17 (13.5%) | 109 (86.5%) |
| Total (Category) | 33 (21.7%) | 119 (78.3%) |
| Total (Overall) | 648 (56.5%) | 500 (43.5%) |
Natural Resources, Construction and Maintenance Occupations
The most common Natural Resources, Construction and Maintenance occupations in Carlisle are Construction & Extraction (140 | 12.2%), Installation, Maintenance & Repair (66 | 5.8%), and Farming, Fishing & Forestry (12 | 1.1%).

Natural Resources, Construction and Maintenance Occupations by Sex
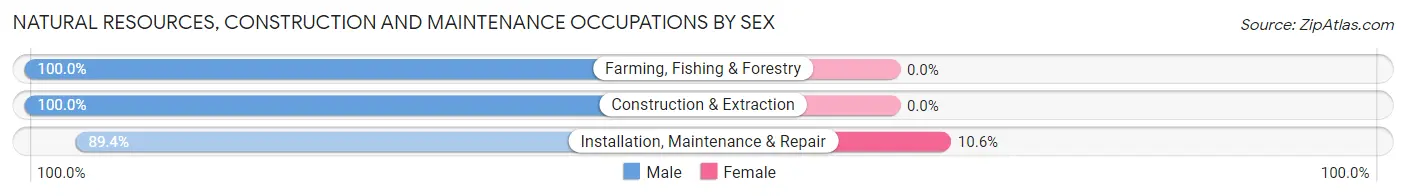
| Occupation | Male | Female |
| Farming, Fishing & Forestry | 12 (100.0%) | 0 (0.0%) |
| Construction & Extraction | 140 (100.0%) | 0 (0.0%) |
| Installation, Maintenance & Repair | 59 (89.4%) | 7 (10.6%) |
| Total (Category) | 211 (96.8%) | 7 (3.2%) |
| Total (Overall) | 648 (56.5%) | 500 (43.5%) |
Production, Transportation and Moving Occupations
The most common Production, Transportation and Moving occupations in Carlisle are Production (202 | 17.6%), Transportation (40 | 3.5%), and Material Moving (6 | 0.5%).
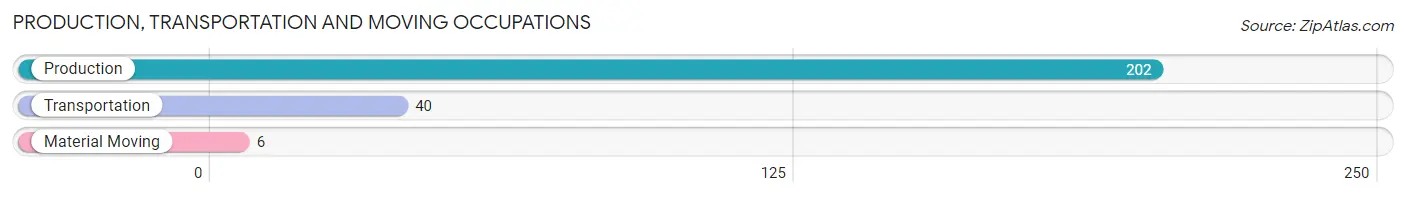
Production, Transportation and Moving Occupations by Sex
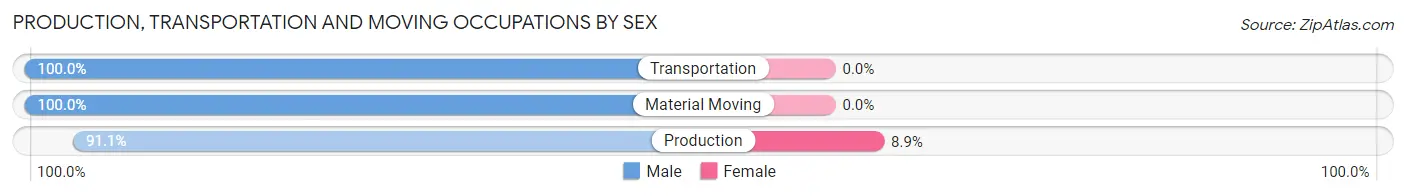
| Occupation | Male | Female |
| Production | 184 (91.1%) | 18 (8.9%) |
| Transportation | 40 (100.0%) | 0 (0.0%) |
| Material Moving | 6 (100.0%) | 0 (0.0%) |
| Total (Category) | 230 (92.7%) | 18 (7.3%) |
| Total (Overall) | 648 (56.5%) | 500 (43.5%) |
Employment Industries by Sex in Carlisle
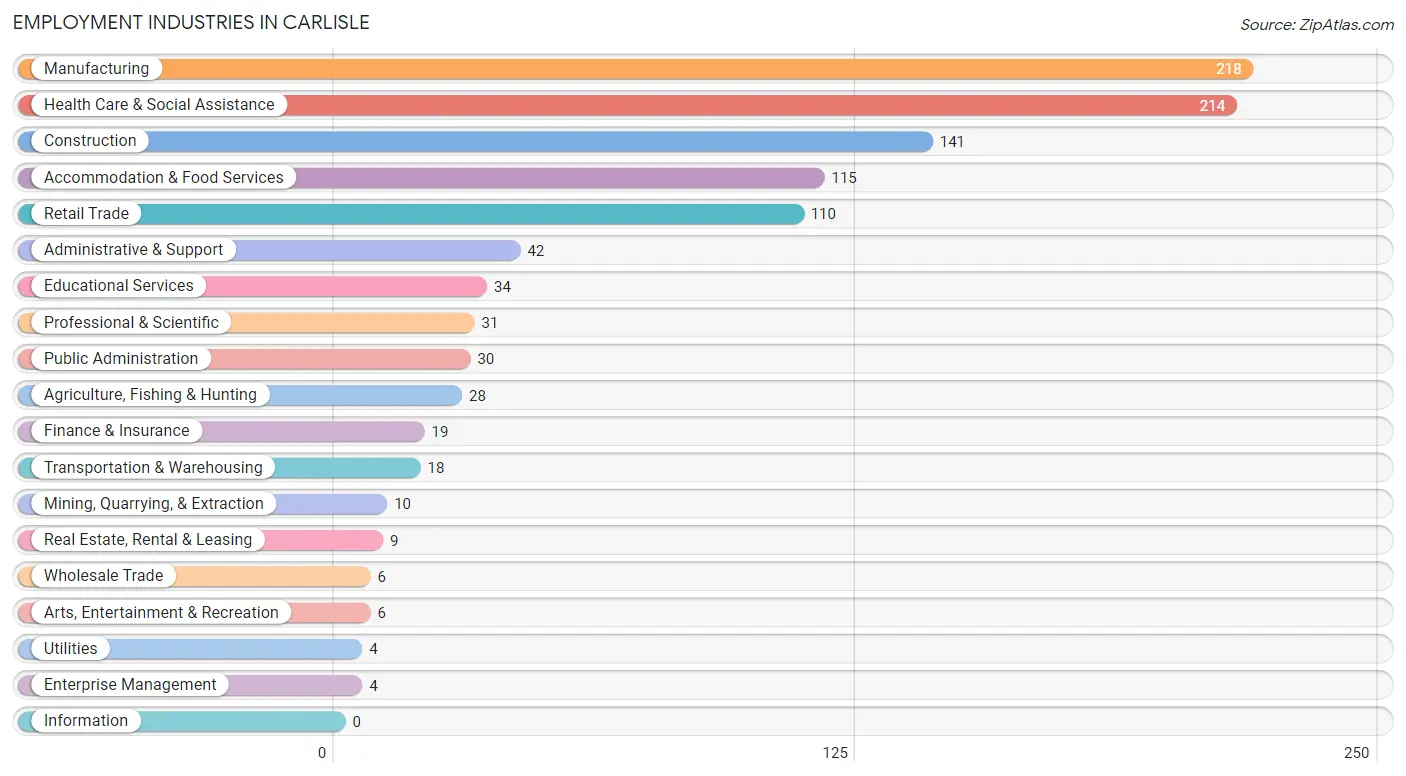
Employment Industries in Carlisle
The major employment industries in Carlisle include Manufacturing (218 | 19.0%), Health Care & Social Assistance (214 | 18.6%), Construction (141 | 12.3%), Accommodation & Food Services (115 | 10.0%), and Retail Trade (110 | 9.6%).
Employment Industries by Sex in Carlisle
The Carlisle industries that see more men than women are Mining, Quarrying, & Extraction (100.0%), Construction (100.0%), and Wholesale Trade (100.0%), whereas the industries that tend to have a higher number of women are Utilities (100.0%), Finance & Insurance (100.0%), and Enterprise Management (100.0%).
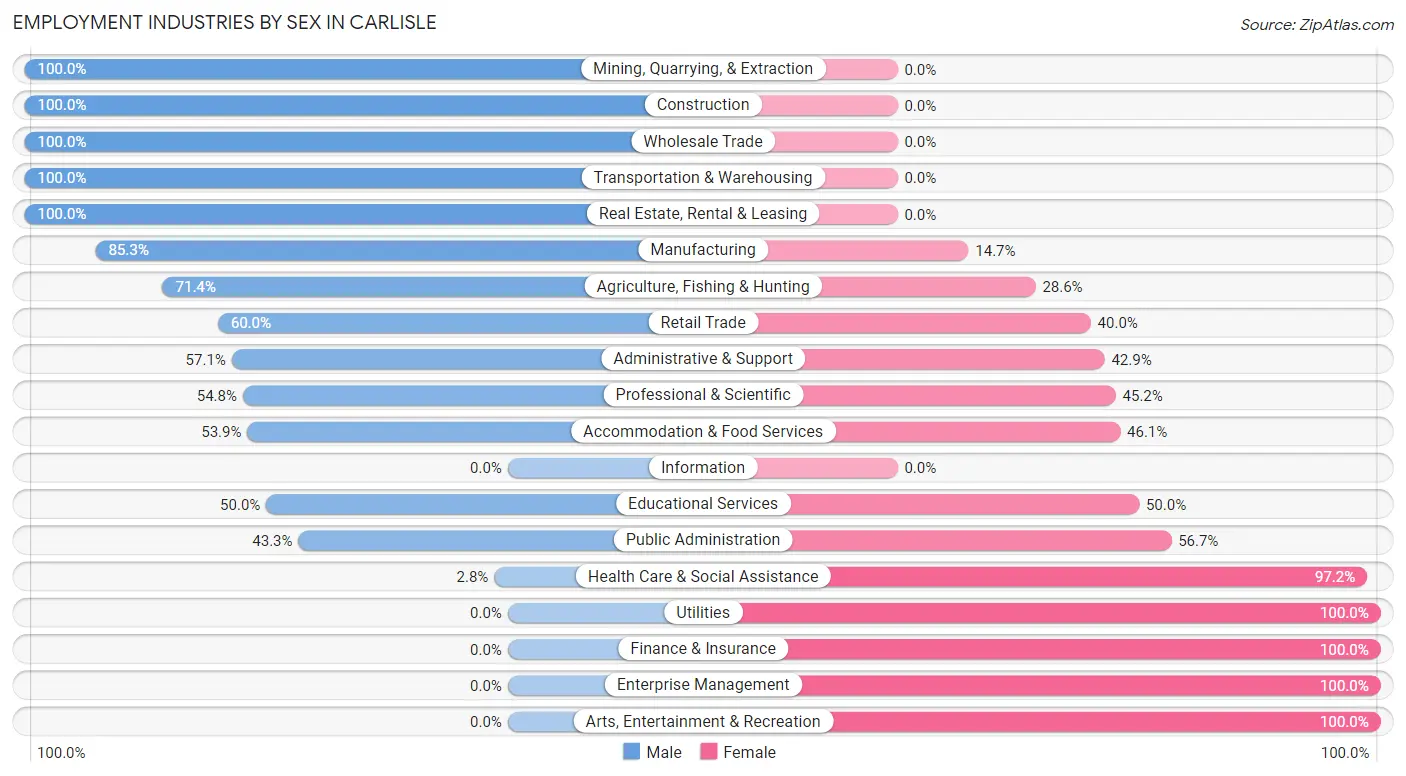
| Industry | Male | Female |
| Agriculture, Fishing & Hunting | 20 (71.4%) | 8 (28.6%) |
| Mining, Quarrying, & Extraction | 10 (100.0%) | 0 (0.0%) |
| Construction | 141 (100.0%) | 0 (0.0%) |
| Manufacturing | 186 (85.3%) | 32 (14.7%) |
| Wholesale Trade | 6 (100.0%) | 0 (0.0%) |
| Retail Trade | 66 (60.0%) | 44 (40.0%) |
| Transportation & Warehousing | 18 (100.0%) | 0 (0.0%) |
| Utilities | 0 (0.0%) | 4 (100.0%) |
| Information | 0 (0.0%) | 0 (0.0%) |
| Finance & Insurance | 0 (0.0%) | 19 (100.0%) |
| Real Estate, Rental & Leasing | 9 (100.0%) | 0 (0.0%) |
| Professional & Scientific | 17 (54.8%) | 14 (45.2%) |
| Enterprise Management | 0 (0.0%) | 4 (100.0%) |
| Administrative & Support | 24 (57.1%) | 18 (42.9%) |
| Educational Services | 17 (50.0%) | 17 (50.0%) |
| Health Care & Social Assistance | 6 (2.8%) | 208 (97.2%) |
| Arts, Entertainment & Recreation | 0 (0.0%) | 6 (100.0%) |
| Accommodation & Food Services | 62 (53.9%) | 53 (46.1%) |
| Public Administration | 13 (43.3%) | 17 (56.7%) |
| Total | 648 (56.5%) | 500 (43.5%) |
Education in Carlisle
School Enrollment in Carlisle
The most common levels of schooling among the 540 students in Carlisle are elementary school (180 | 33.3%), middle school (180 | 33.3%), and high school (87 | 16.1%).
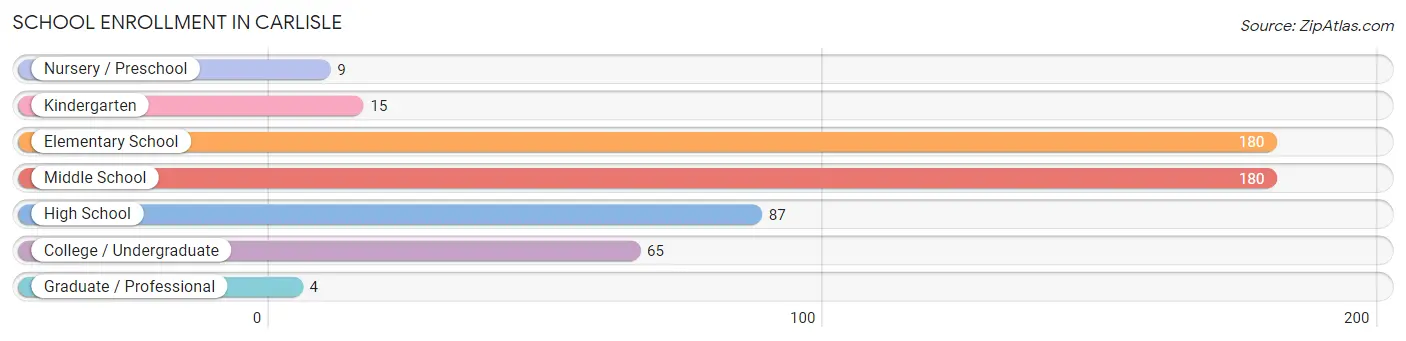
| School Level | # Students | % Students |
| Nursery / Preschool | 9 | 1.7% |
| Kindergarten | 15 | 2.8% |
| Elementary School | 180 | 33.3% |
| Middle School | 180 | 33.3% |
| High School | 87 | 16.1% |
| College / Undergraduate | 65 | 12.0% |
| Graduate / Professional | 4 | 0.7% |
| Total | 540 | 100.0% |
School Enrollment by Age by Funding Source in Carlisle
Out of a total of 540 students who are enrolled in schools in Carlisle, 12 (2.2%) attend a private institution, while the remaining 528 (97.8%) are enrolled in public schools. The age group of 5 to 9 year old has the highest likelihood of being enrolled in private schools, with 12 (11.1% in the age bracket) enrolled. Conversely, the age group of 3 to 4 year olds has the lowest likelihood of being enrolled in a private school, with 9 (100.0% in the age bracket) attending a public institution.
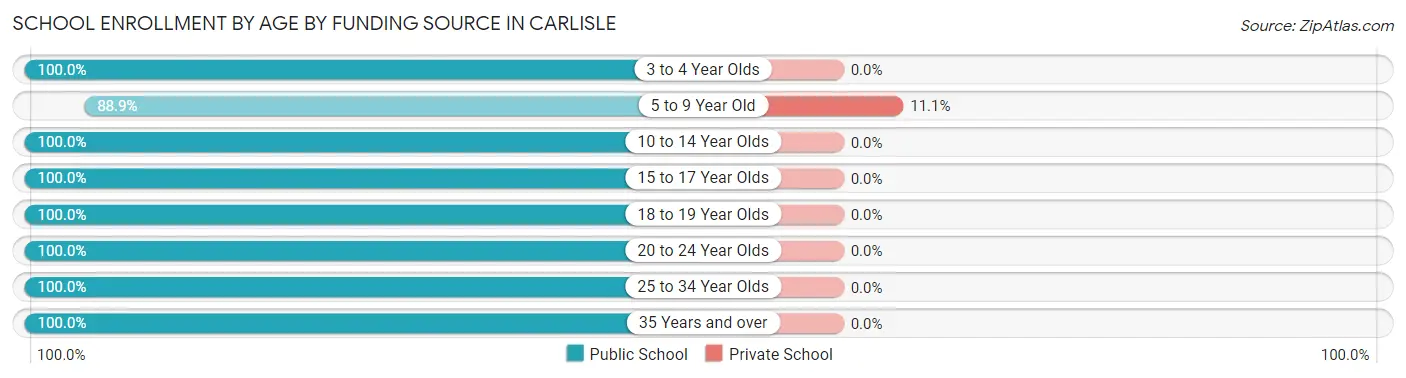
| Age Bracket | Public School | Private School |
| 3 to 4 Year Olds | 9 (100.0%) | 0 (0.0%) |
| 5 to 9 Year Old | 96 (88.9%) | 12 (11.1%) |
| 10 to 14 Year Olds | 241 (100.0%) | 0 (0.0%) |
| 15 to 17 Year Olds | 70 (100.0%) | 0 (0.0%) |
| 18 to 19 Year Olds | 92 (100.0%) | 0 (0.0%) |
| 20 to 24 Year Olds | 8 (100.0%) | 0 (0.0%) |
| 25 to 34 Year Olds | 8 (100.0%) | 0 (0.0%) |
| 35 Years and over | 4 (100.0%) | 0 (0.0%) |
| Total | 528 (97.8%) | 12 (2.2%) |
Educational Attainment by Field of Study in Carlisle
Education (91 | 58.0%), visual & performing arts (20 | 12.7%), social sciences (10 | 6.4%), business (8 | 5.1%), and computers & mathematics (6 | 3.8%) are the most common fields of study among 157 individuals in Carlisle who have obtained a bachelor's degree or higher.
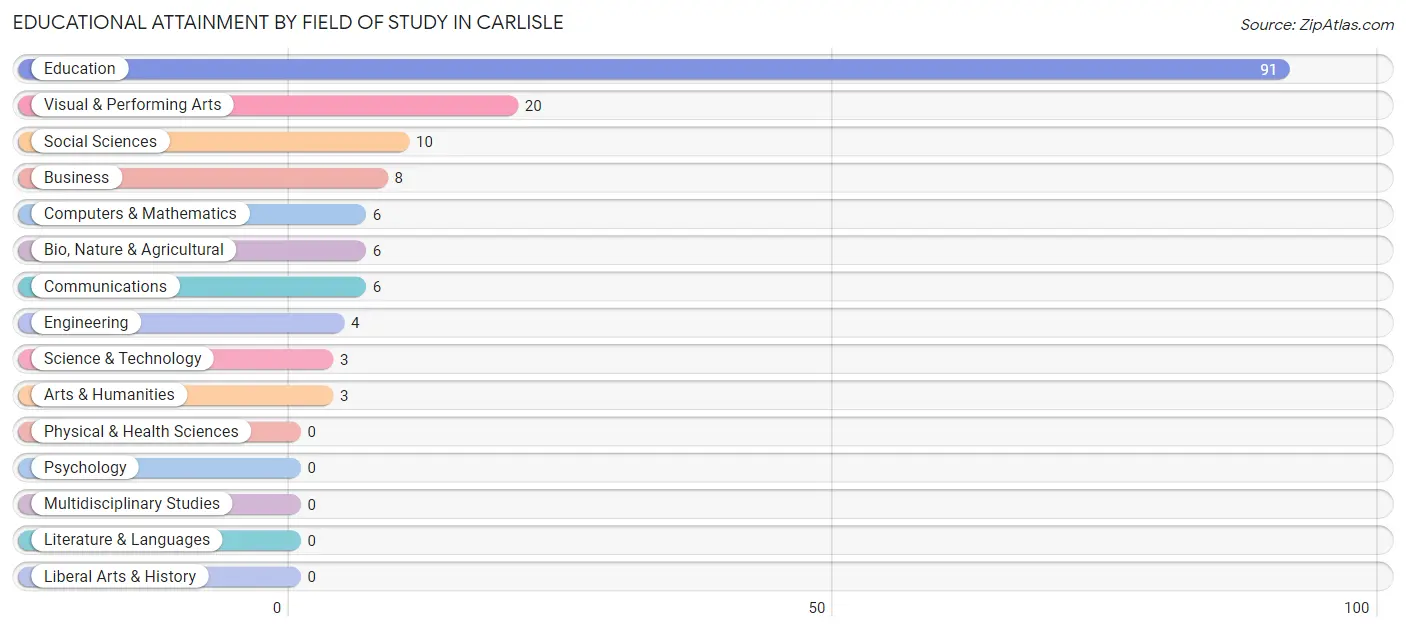
| Field of Study | # Graduates | % Graduates |
| Computers & Mathematics | 6 | 3.8% |
| Bio, Nature & Agricultural | 6 | 3.8% |
| Physical & Health Sciences | 0 | 0.0% |
| Psychology | 0 | 0.0% |
| Social Sciences | 10 | 6.4% |
| Engineering | 4 | 2.5% |
| Multidisciplinary Studies | 0 | 0.0% |
| Science & Technology | 3 | 1.9% |
| Business | 8 | 5.1% |
| Education | 91 | 58.0% |
| Literature & Languages | 0 | 0.0% |
| Liberal Arts & History | 0 | 0.0% |
| Visual & Performing Arts | 20 | 12.7% |
| Communications | 6 | 3.8% |
| Arts & Humanities | 3 | 1.9% |
| Total | 157 | 100.0% |
Transportation & Commute in Carlisle
Vehicle Availability by Sex in Carlisle
The most prevalent vehicle ownership categories in Carlisle are males with 2 vehicles (301, accounting for 46.7%) and females with 2 vehicles (138, making up 60.9%).
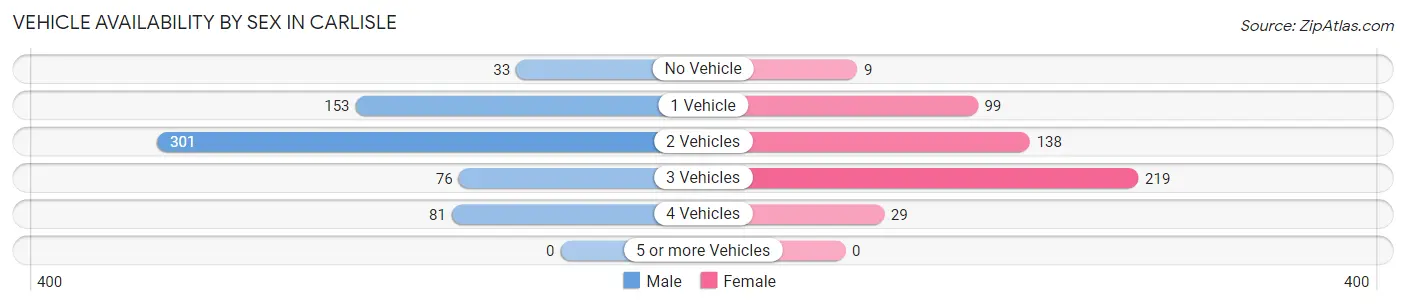
| Vehicles Available | Male | Female |
| No Vehicle | 33 (5.1%) | 9 (1.8%) |
| 1 Vehicle | 153 (23.8%) | 99 (20.0%) |
| 2 Vehicles | 301 (46.7%) | 138 (27.9%) |
| 3 Vehicles | 76 (11.8%) | 219 (44.3%) |
| 4 Vehicles | 81 (12.6%) | 29 (5.9%) |
| 5 or more Vehicles | 0 (0.0%) | 0 (0.0%) |
| Total | 644 (100.0%) | 494 (100.0%) |
Commute Time in Carlisle
The most frequently occuring commute durations in Carlisle are 60 to 89 minutes (293 commuters, 27.2%), 30 to 34 minutes (191 commuters, 17.7%), and 5 to 9 minutes (122 commuters, 11.3%).
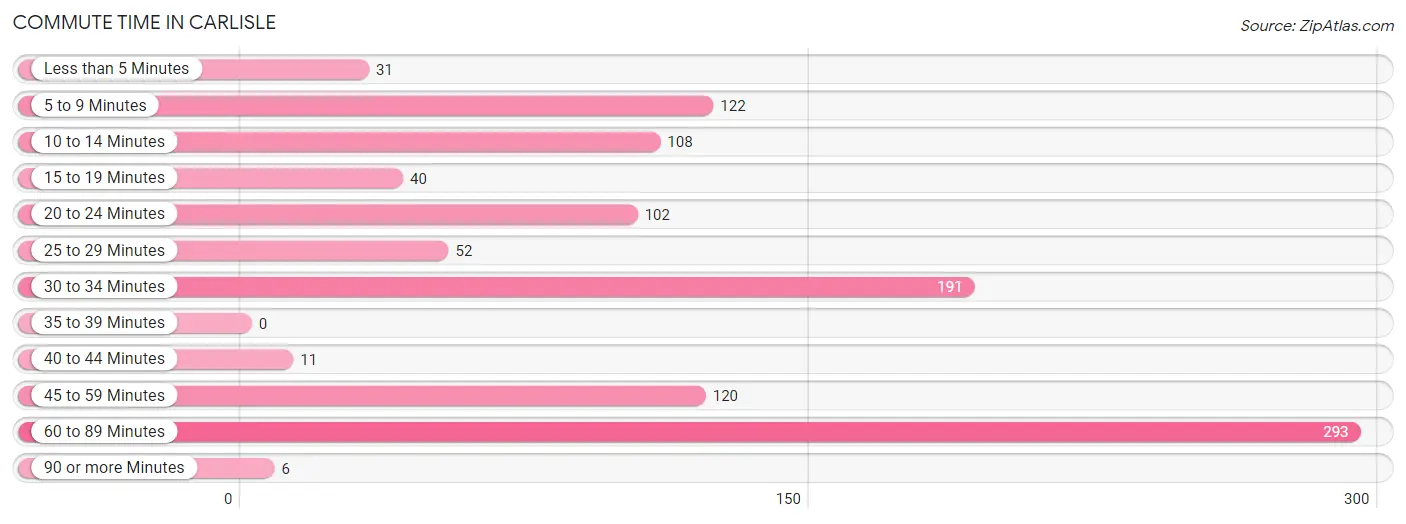
| Commute Time | # Commuters | % Commuters |
| Less than 5 Minutes | 31 | 2.9% |
| 5 to 9 Minutes | 122 | 11.3% |
| 10 to 14 Minutes | 108 | 10.0% |
| 15 to 19 Minutes | 40 | 3.7% |
| 20 to 24 Minutes | 102 | 9.5% |
| 25 to 29 Minutes | 52 | 4.8% |
| 30 to 34 Minutes | 191 | 17.7% |
| 35 to 39 Minutes | 0 | 0.0% |
| 40 to 44 Minutes | 11 | 1.0% |
| 45 to 59 Minutes | 120 | 11.2% |
| 60 to 89 Minutes | 293 | 27.2% |
| 90 or more Minutes | 6 | 0.6% |
Commute Time by Sex in Carlisle
The most common commute times in Carlisle are 30 to 34 minutes (160 commuters, 25.5%) for males and 60 to 89 minutes (155 commuters, 34.5%) for females.
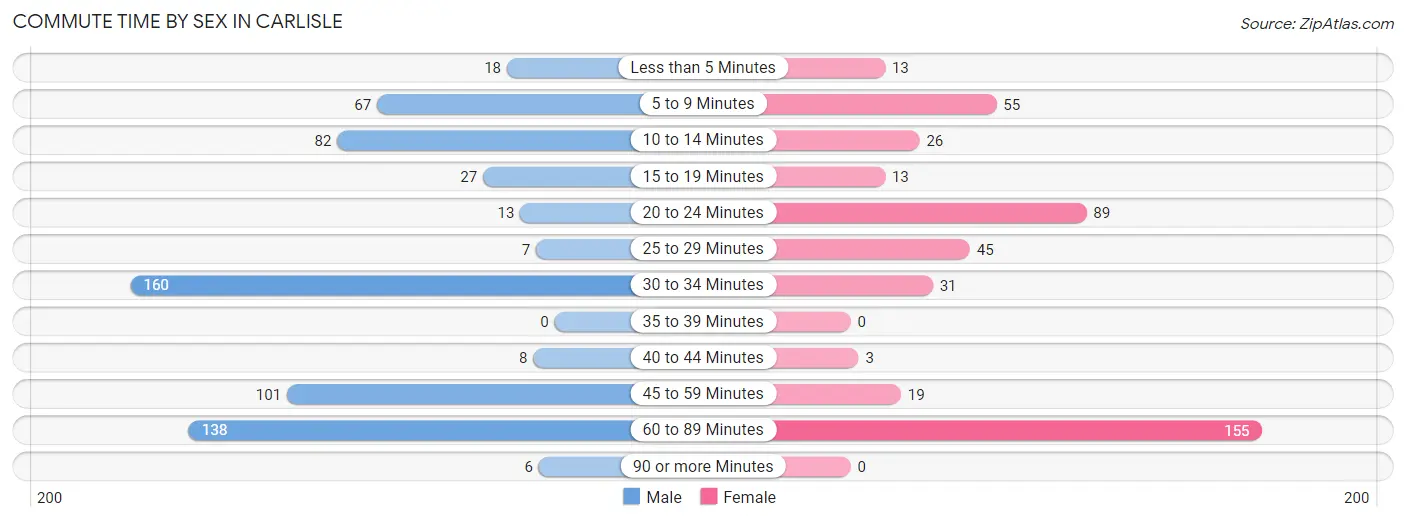
| Commute Time | Male | Female |
| Less than 5 Minutes | 18 (2.9%) | 13 (2.9%) |
| 5 to 9 Minutes | 67 (10.7%) | 55 (12.2%) |
| 10 to 14 Minutes | 82 (13.1%) | 26 (5.8%) |
| 15 to 19 Minutes | 27 (4.3%) | 13 (2.9%) |
| 20 to 24 Minutes | 13 (2.1%) | 89 (19.8%) |
| 25 to 29 Minutes | 7 (1.1%) | 45 (10.0%) |
| 30 to 34 Minutes | 160 (25.5%) | 31 (6.9%) |
| 35 to 39 Minutes | 0 (0.0%) | 0 (0.0%) |
| 40 to 44 Minutes | 8 (1.3%) | 3 (0.7%) |
| 45 to 59 Minutes | 101 (16.1%) | 19 (4.2%) |
| 60 to 89 Minutes | 138 (22.0%) | 155 (34.5%) |
| 90 or more Minutes | 6 (1.0%) | 0 (0.0%) |
Time of Departure to Work by Sex in Carlisle
The most frequent times of departure to work in Carlisle are 7:00 AM to 7:29 AM (187, 29.8%) for males and 7:00 AM to 7:29 AM (155, 34.5%) for females.
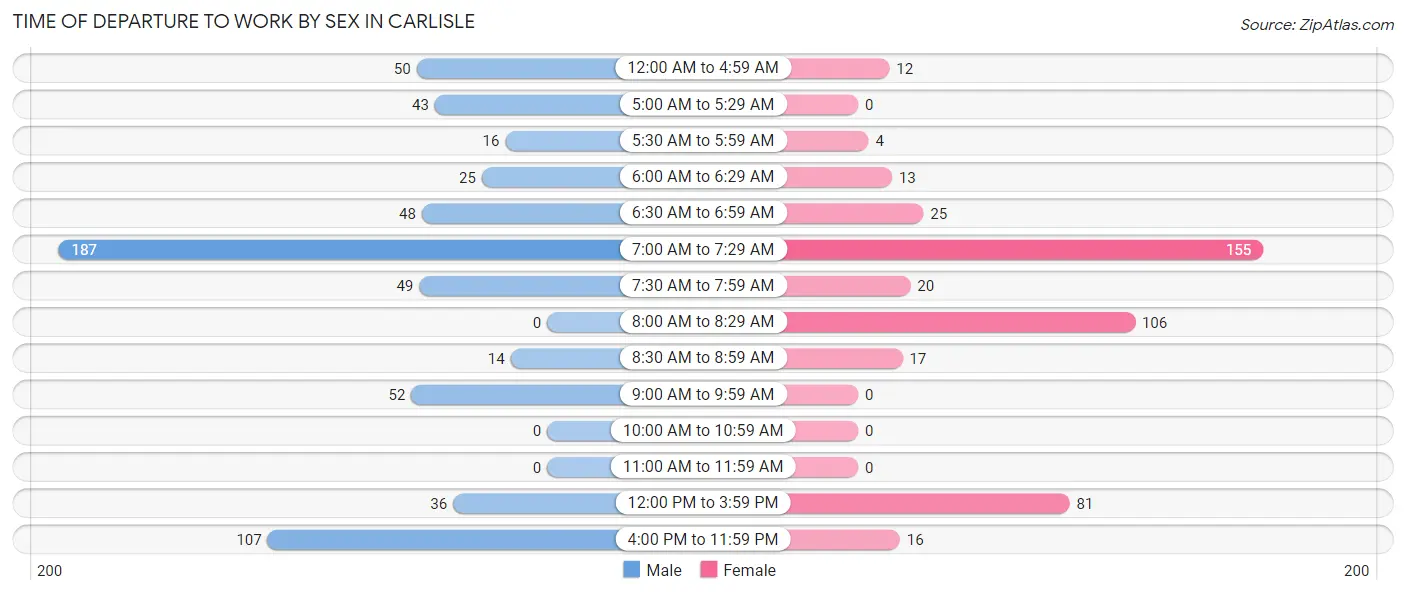
| Time of Departure | Male | Female |
| 12:00 AM to 4:59 AM | 50 (8.0%) | 12 (2.7%) |
| 5:00 AM to 5:29 AM | 43 (6.9%) | 0 (0.0%) |
| 5:30 AM to 5:59 AM | 16 (2.5%) | 4 (0.9%) |
| 6:00 AM to 6:29 AM | 25 (4.0%) | 13 (2.9%) |
| 6:30 AM to 6:59 AM | 48 (7.7%) | 25 (5.6%) |
| 7:00 AM to 7:29 AM | 187 (29.8%) | 155 (34.5%) |
| 7:30 AM to 7:59 AM | 49 (7.8%) | 20 (4.4%) |
| 8:00 AM to 8:29 AM | 0 (0.0%) | 106 (23.6%) |
| 8:30 AM to 8:59 AM | 14 (2.2%) | 17 (3.8%) |
| 9:00 AM to 9:59 AM | 52 (8.3%) | 0 (0.0%) |
| 10:00 AM to 10:59 AM | 0 (0.0%) | 0 (0.0%) |
| 11:00 AM to 11:59 AM | 0 (0.0%) | 0 (0.0%) |
| 12:00 PM to 3:59 PM | 36 (5.7%) | 81 (18.0%) |
| 4:00 PM to 11:59 PM | 107 (17.1%) | 16 (3.6%) |
| Total | 627 (100.0%) | 449 (100.0%) |
Housing Occupancy in Carlisle
Occupancy by Ownership in Carlisle
Of the total 1,014 dwellings in Carlisle, owner-occupied units account for 580 (57.2%), while renter-occupied units make up 434 (42.8%).
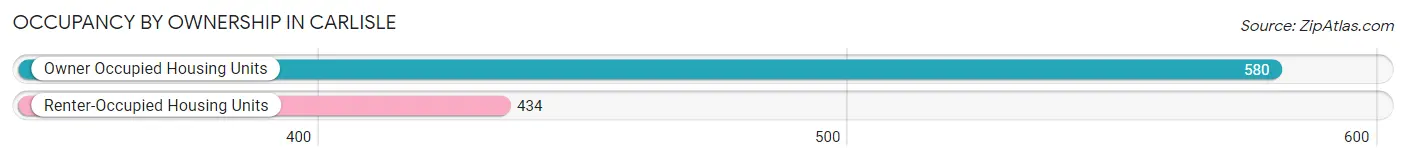
| Occupancy | # Housing Units | % Housing Units |
| Owner Occupied Housing Units | 580 | 57.2% |
| Renter-Occupied Housing Units | 434 | 42.8% |
| Total Occupied Housing Units | 1,014 | 100.0% |
Occupancy by Household Size in Carlisle
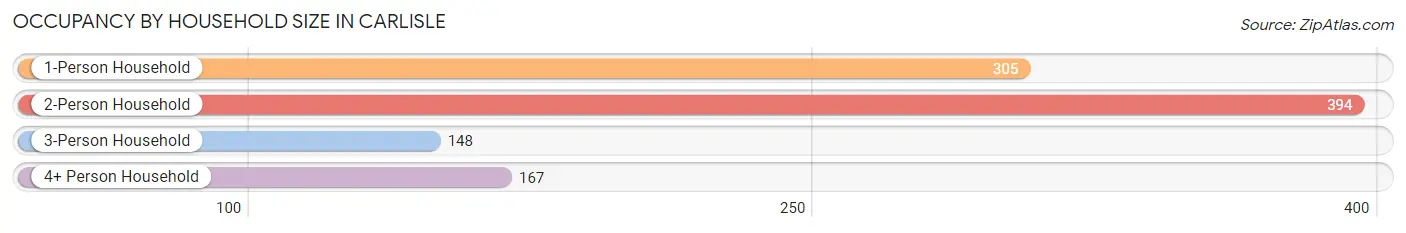
| Household Size | # Housing Units | % Housing Units |
| 1-Person Household | 305 | 30.1% |
| 2-Person Household | 394 | 38.9% |
| 3-Person Household | 148 | 14.6% |
| 4+ Person Household | 167 | 16.5% |
| Total Housing Units | 1,014 | 100.0% |
Occupancy by Ownership by Household Size in Carlisle
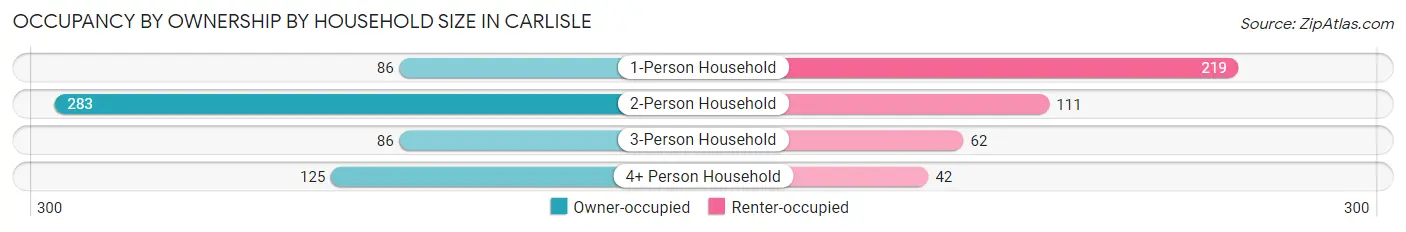
| Household Size | Owner-occupied | Renter-occupied |
| 1-Person Household | 86 (28.2%) | 219 (71.8%) |
| 2-Person Household | 283 (71.8%) | 111 (28.2%) |
| 3-Person Household | 86 (58.1%) | 62 (41.9%) |
| 4+ Person Household | 125 (74.9%) | 42 (25.2%) |
| Total Housing Units | 580 (57.2%) | 434 (42.8%) |
Occupancy by Educational Attainment in Carlisle
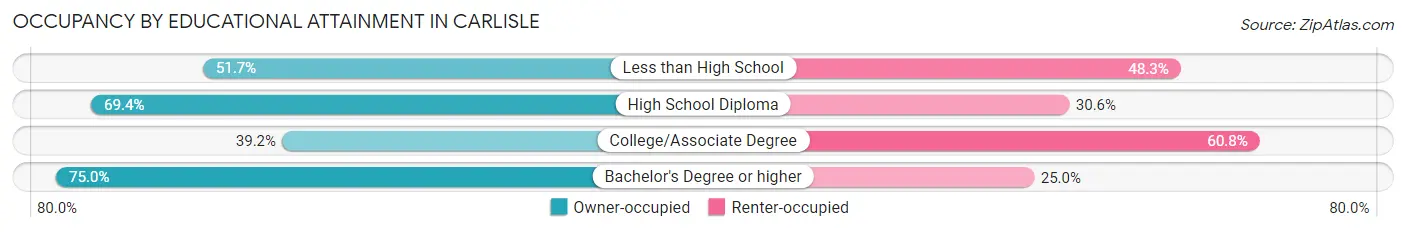
| Household Size | Owner-occupied | Renter-occupied |
| Less than High School | 45 (51.7%) | 42 (48.3%) |
| High School Diploma | 325 (69.4%) | 143 (30.6%) |
| College/Associate Degree | 147 (39.2%) | 228 (60.8%) |
| Bachelor's Degree or higher | 63 (75.0%) | 21 (25.0%) |
Occupancy by Age of Householder in Carlisle
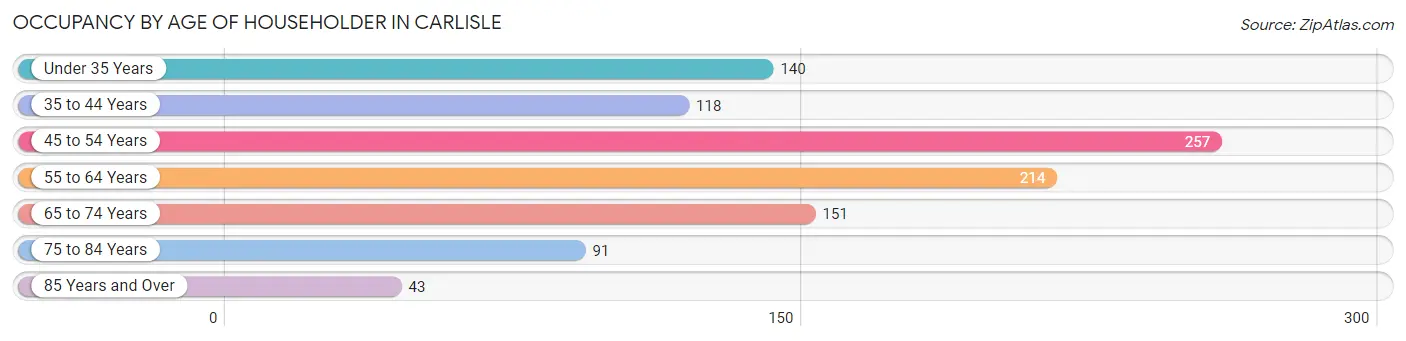
| Age Bracket | # Households | % Households |
| Under 35 Years | 140 | 13.8% |
| 35 to 44 Years | 118 | 11.6% |
| 45 to 54 Years | 257 | 25.4% |
| 55 to 64 Years | 214 | 21.1% |
| 65 to 74 Years | 151 | 14.9% |
| 75 to 84 Years | 91 | 9.0% |
| 85 Years and Over | 43 | 4.2% |
| Total | 1,014 | 100.0% |
Housing Finances in Carlisle
Median Income by Occupancy in Carlisle
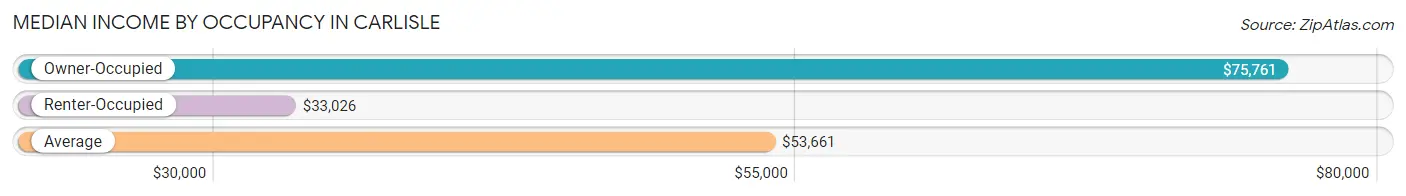
| Occupancy Type | # Households | Median Income |
| Owner-Occupied | 580 (57.2%) | $75,761 |
| Renter-Occupied | 434 (42.8%) | $33,026 |
| Average | 1,014 (100.0%) | $53,661 |
Occupancy by Householder Income Bracket in Carlisle
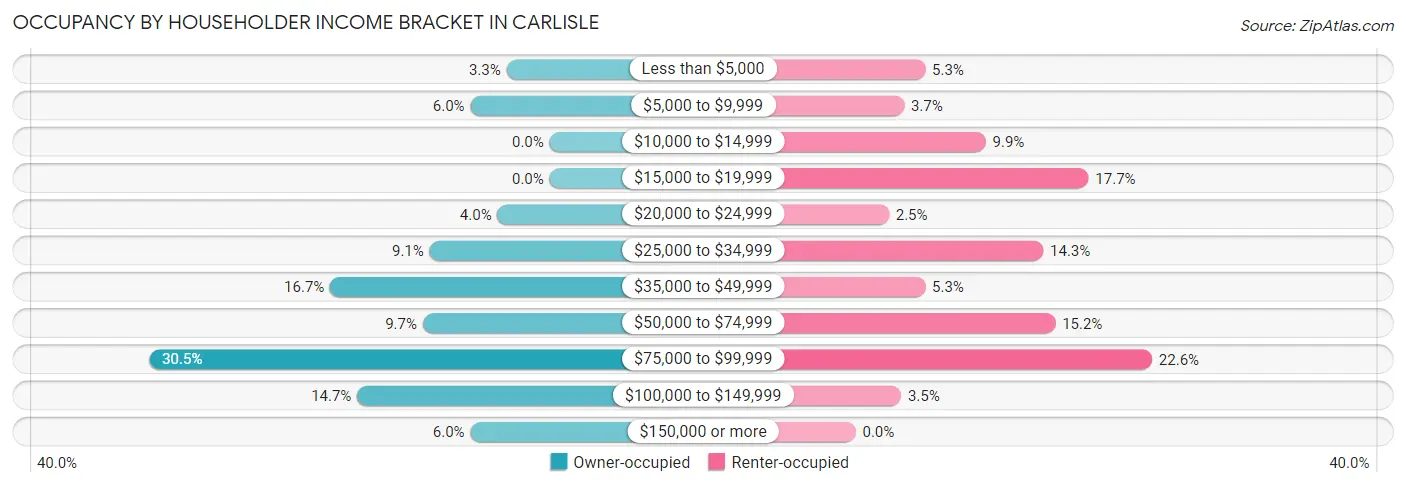
| Income Bracket | Owner-occupied | Renter-occupied |
| Less than $5,000 | 19 (3.3%) | 23 (5.3%) |
| $5,000 to $9,999 | 35 (6.0%) | 16 (3.7%) |
| $10,000 to $14,999 | 0 (0.0%) | 43 (9.9%) |
| $15,000 to $19,999 | 0 (0.0%) | 77 (17.7%) |
| $20,000 to $24,999 | 23 (4.0%) | 11 (2.5%) |
| $25,000 to $34,999 | 53 (9.1%) | 62 (14.3%) |
| $35,000 to $49,999 | 97 (16.7%) | 23 (5.3%) |
| $50,000 to $74,999 | 56 (9.7%) | 66 (15.2%) |
| $75,000 to $99,999 | 177 (30.5%) | 98 (22.6%) |
| $100,000 to $149,999 | 85 (14.7%) | 15 (3.5%) |
| $150,000 or more | 35 (6.0%) | 0 (0.0%) |
| Total | 580 (100.0%) | 434 (100.0%) |
Monthly Housing Cost Tiers in Carlisle
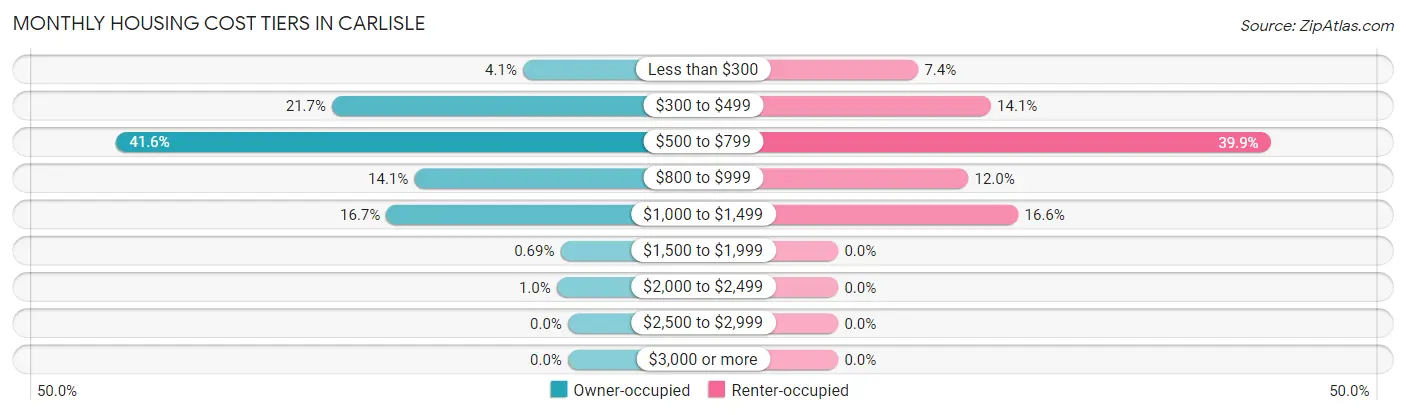
| Monthly Cost | Owner-occupied | Renter-occupied |
| Less than $300 | 24 (4.1%) | 32 (7.4%) |
| $300 to $499 | 126 (21.7%) | 61 (14.1%) |
| $500 to $799 | 241 (41.5%) | 173 (39.9%) |
| $800 to $999 | 82 (14.1%) | 52 (12.0%) |
| $1,000 to $1,499 | 97 (16.7%) | 72 (16.6%) |
| $1,500 to $1,999 | 4 (0.7%) | 0 (0.0%) |
| $2,000 to $2,499 | 6 (1.0%) | 0 (0.0%) |
| $2,500 to $2,999 | 0 (0.0%) | 0 (0.0%) |
| $3,000 or more | 0 (0.0%) | 0 (0.0%) |
| Total | 580 (100.0%) | 434 (100.0%) |
Physical Housing Characteristics in Carlisle
Housing Structures in Carlisle
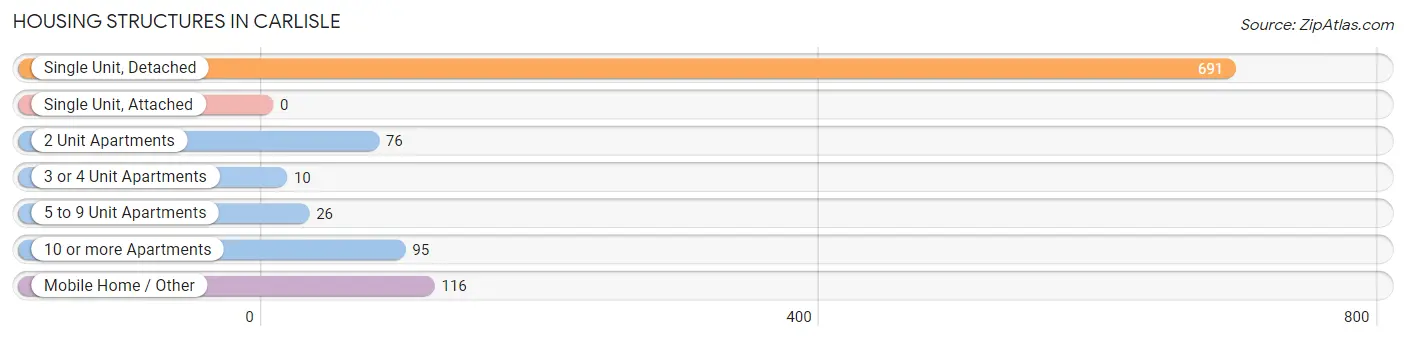
| Structure Type | # Housing Units | % Housing Units |
| Single Unit, Detached | 691 | 68.1% |
| Single Unit, Attached | 0 | 0.0% |
| 2 Unit Apartments | 76 | 7.5% |
| 3 or 4 Unit Apartments | 10 | 1.0% |
| 5 to 9 Unit Apartments | 26 | 2.6% |
| 10 or more Apartments | 95 | 9.4% |
| Mobile Home / Other | 116 | 11.4% |
| Total | 1,014 | 100.0% |
Housing Structures by Occupancy in Carlisle
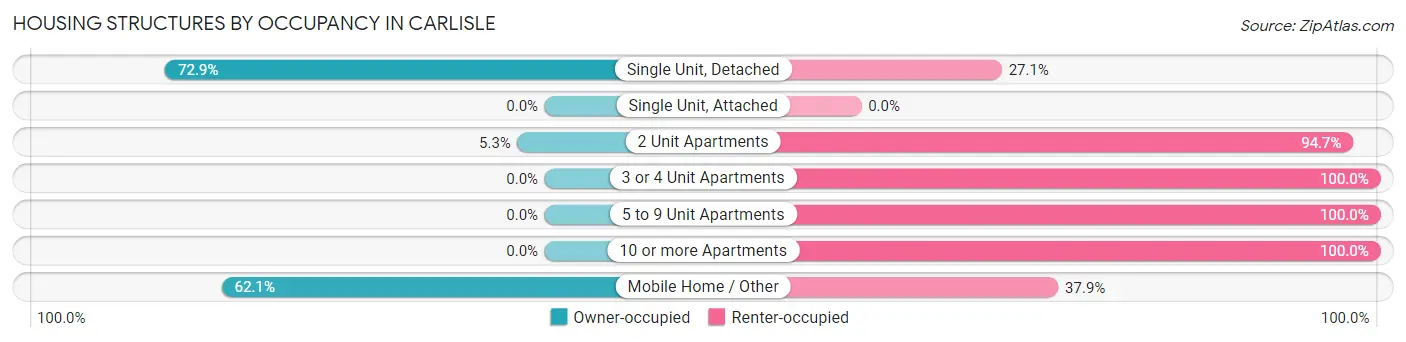
| Structure Type | Owner-occupied | Renter-occupied |
| Single Unit, Detached | 504 (72.9%) | 187 (27.1%) |
| Single Unit, Attached | 0 (0.0%) | 0 (0.0%) |
| 2 Unit Apartments | 4 (5.3%) | 72 (94.7%) |
| 3 or 4 Unit Apartments | 0 (0.0%) | 10 (100.0%) |
| 5 to 9 Unit Apartments | 0 (0.0%) | 26 (100.0%) |
| 10 or more Apartments | 0 (0.0%) | 95 (100.0%) |
| Mobile Home / Other | 72 (62.1%) | 44 (37.9%) |
| Total | 580 (57.2%) | 434 (42.8%) |
Housing Structures by Number of Rooms in Carlisle
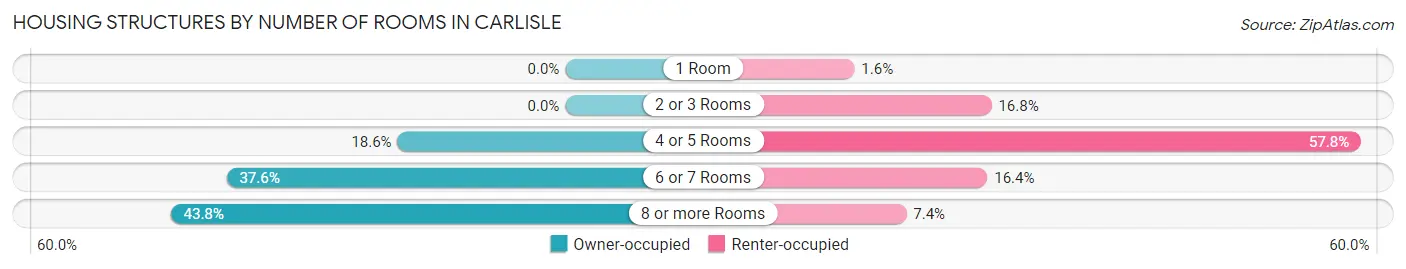
| Number of Rooms | Owner-occupied | Renter-occupied |
| 1 Room | 0 (0.0%) | 7 (1.6%) |
| 2 or 3 Rooms | 0 (0.0%) | 73 (16.8%) |
| 4 or 5 Rooms | 108 (18.6%) | 251 (57.8%) |
| 6 or 7 Rooms | 218 (37.6%) | 71 (16.4%) |
| 8 or more Rooms | 254 (43.8%) | 32 (7.4%) |
| Total | 580 (100.0%) | 434 (100.0%) |
Housing Structure by Heating Type in Carlisle
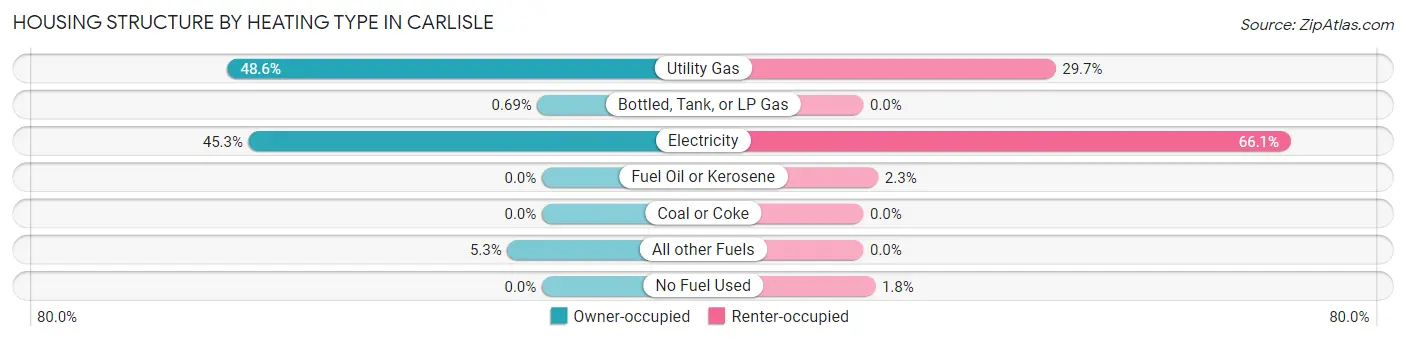
| Heating Type | Owner-occupied | Renter-occupied |
| Utility Gas | 282 (48.6%) | 129 (29.7%) |
| Bottled, Tank, or LP Gas | 4 (0.7%) | 0 (0.0%) |
| Electricity | 263 (45.3%) | 287 (66.1%) |
| Fuel Oil or Kerosene | 0 (0.0%) | 10 (2.3%) |
| Coal or Coke | 0 (0.0%) | 0 (0.0%) |
| All other Fuels | 31 (5.3%) | 0 (0.0%) |
| No Fuel Used | 0 (0.0%) | 8 (1.8%) |
| Total | 580 (100.0%) | 434 (100.0%) |
Household Vehicle Usage in Carlisle
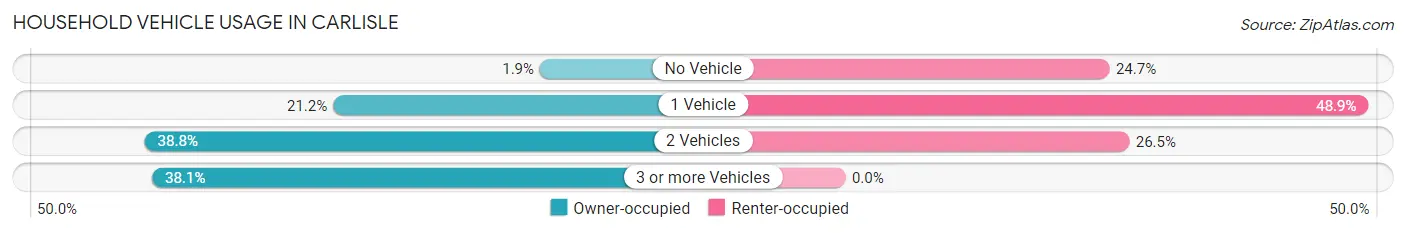
| Vehicles per Household | Owner-occupied | Renter-occupied |
| No Vehicle | 11 (1.9%) | 107 (24.6%) |
| 1 Vehicle | 123 (21.2%) | 212 (48.8%) |
| 2 Vehicles | 225 (38.8%) | 115 (26.5%) |
| 3 or more Vehicles | 221 (38.1%) | 0 (0.0%) |
| Total | 580 (100.0%) | 434 (100.0%) |
Real Estate & Mortgages in Carlisle
Real Estate and Mortgage Overview in Carlisle
| Characteristic | Without Mortgage | With Mortgage |
| Housing Units | 343 | 237 |
| Median Property Value | $110,500 | $92,000 |
| Median Household Income | $66,964 | $20 |
| Monthly Housing Costs | $516 | $0 |
| Real Estate Taxes | $791 | $11 |
Property Value by Mortgage Status in Carlisle
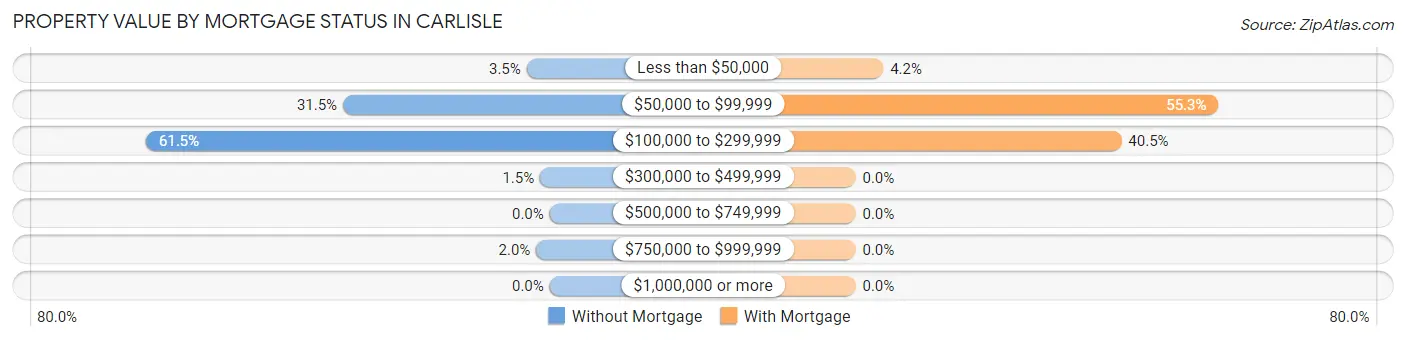
| Property Value | Without Mortgage | With Mortgage |
| Less than $50,000 | 12 (3.5%) | 10 (4.2%) |
| $50,000 to $99,999 | 108 (31.5%) | 131 (55.3%) |
| $100,000 to $299,999 | 211 (61.5%) | 96 (40.5%) |
| $300,000 to $499,999 | 5 (1.5%) | 0 (0.0%) |
| $500,000 to $749,999 | 0 (0.0%) | 0 (0.0%) |
| $750,000 to $999,999 | 7 (2.0%) | 0 (0.0%) |
| $1,000,000 or more | 0 (0.0%) | 0 (0.0%) |
| Total | 343 (100.0%) | 237 (100.0%) |
Household Income by Mortgage Status in Carlisle
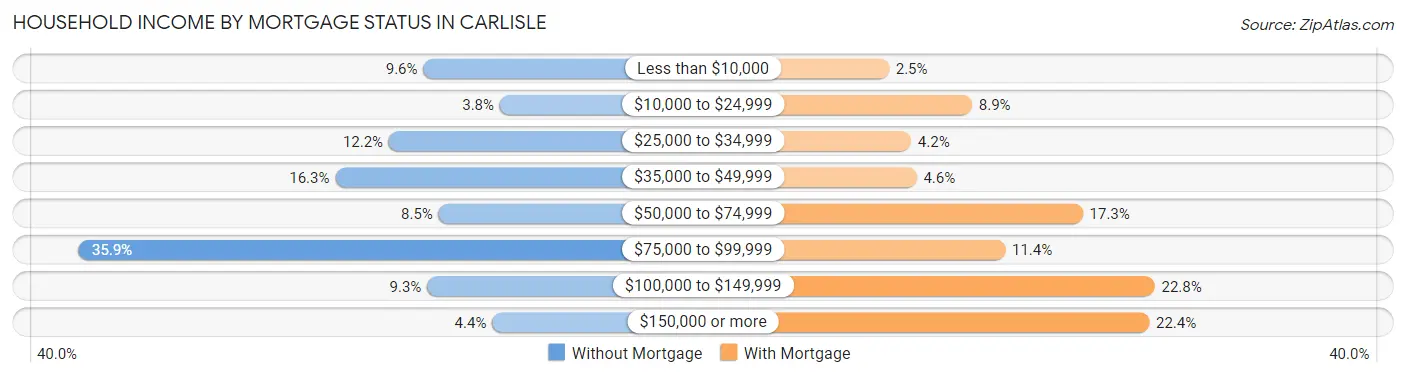
| Household Income | Without Mortgage | With Mortgage |
| Less than $10,000 | 33 (9.6%) | 6 (2.5%) |
| $10,000 to $24,999 | 13 (3.8%) | 21 (8.9%) |
| $25,000 to $34,999 | 42 (12.2%) | 10 (4.2%) |
| $35,000 to $49,999 | 56 (16.3%) | 11 (4.6%) |
| $50,000 to $74,999 | 29 (8.5%) | 41 (17.3%) |
| $75,000 to $99,999 | 123 (35.9%) | 27 (11.4%) |
| $100,000 to $149,999 | 32 (9.3%) | 54 (22.8%) |
| $150,000 or more | 15 (4.4%) | 53 (22.4%) |
| Total | 343 (100.0%) | 237 (100.0%) |
Property Value to Household Income Ratio in Carlisle
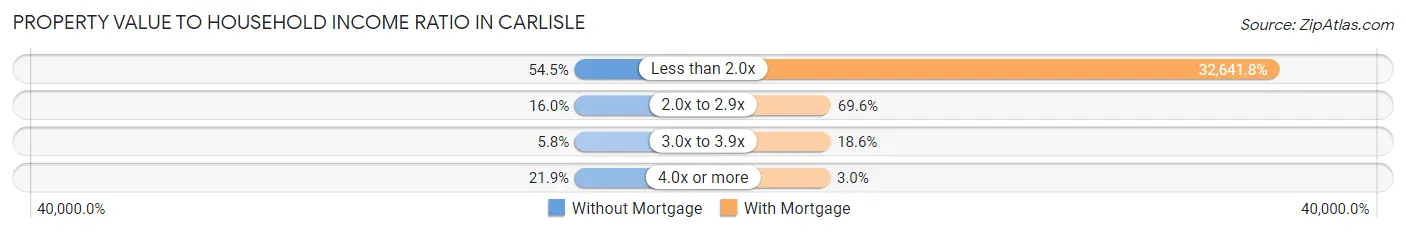
| Value-to-Income Ratio | Without Mortgage | With Mortgage |
| Less than 2.0x | 187 (54.5%) | 77,361 (32,641.8%) |
| 2.0x to 2.9x | 55 (16.0%) | 165 (69.6%) |
| 3.0x to 3.9x | 20 (5.8%) | 44 (18.6%) |
| 4.0x or more | 75 (21.9%) | 7 (2.9%) |
| Total | 343 (100.0%) | 237 (100.0%) |
Real Estate Taxes by Mortgage Status in Carlisle
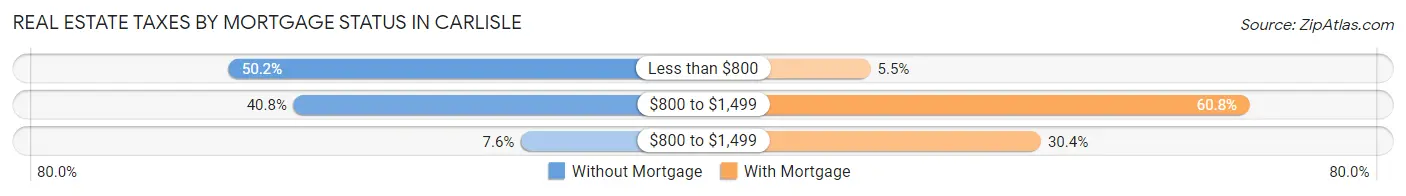
| Property Taxes | Without Mortgage | With Mortgage |
| Less than $800 | 172 (50.1%) | 13 (5.5%) |
| $800 to $1,499 | 140 (40.8%) | 144 (60.8%) |
| $800 to $1,499 | 26 (7.6%) | 72 (30.4%) |
| Total | 343 (100.0%) | 237 (100.0%) |
Health & Disability in Carlisle
Health Insurance Coverage by Age in Carlisle
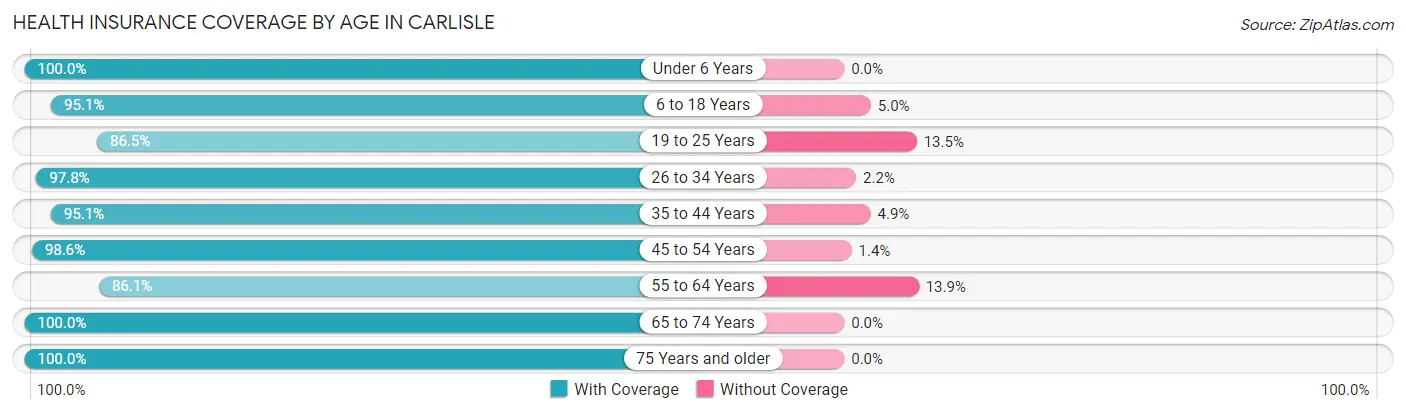
| Age Bracket | With Coverage | Without Coverage |
| Under 6 Years | 94 (100.0%) | 0 (0.0%) |
| 6 to 18 Years | 499 (95.1%) | 26 (5.0%) |
| 19 to 25 Years | 160 (86.5%) | 25 (13.5%) |
| 26 to 34 Years | 265 (97.8%) | 6 (2.2%) |
| 35 to 44 Years | 271 (95.1%) | 14 (4.9%) |
| 45 to 54 Years | 435 (98.6%) | 6 (1.4%) |
| 55 to 64 Years | 267 (86.1%) | 43 (13.9%) |
| 65 to 74 Years | 221 (100.0%) | 0 (0.0%) |
| 75 Years and older | 189 (100.0%) | 0 (0.0%) |
| Total | 2,401 (95.2%) | 120 (4.8%) |
Health Insurance Coverage by Citizenship Status in Carlisle
| Citizenship Status | With Coverage | Without Coverage |
| Native Born | 94 (100.0%) | 0 (0.0%) |
| Foreign Born, Citizen | 499 (95.1%) | 26 (5.0%) |
| Foreign Born, not a Citizen | 160 (86.5%) | 25 (13.5%) |
Health Insurance Coverage by Household Income in Carlisle
| Household Income | With Coverage | Without Coverage |
| Under $25,000 | 426 (88.7%) | 54 (11.3%) |
| $25,000 to $49,999 | 610 (99.0%) | 6 (1.0%) |
| $50,000 to $74,999 | 358 (94.0%) | 23 (6.0%) |
| $75,000 to $99,999 | 503 (93.1%) | 37 (6.9%) |
| $100,000 and over | 504 (100.0%) | 0 (0.0%) |
Public vs Private Health Insurance Coverage by Age in Carlisle
| Age Bracket | Public Insurance | Private Insurance |
| Under 6 | 74 (78.7%) | 20 (21.3%) |
| 6 to 18 Years | 389 (74.1%) | 162 (30.9%) |
| 19 to 25 Years | 79 (42.7%) | 116 (62.7%) |
| 25 to 34 Years | 144 (53.1%) | 128 (47.2%) |
| 35 to 44 Years | 187 (65.6%) | 119 (41.7%) |
| 45 to 54 Years | 80 (18.1%) | 355 (80.5%) |
| 55 to 64 Years | 135 (43.5%) | 196 (63.2%) |
| 65 to 74 Years | 217 (98.2%) | 133 (60.2%) |
| 75 Years and over | 186 (98.4%) | 144 (76.2%) |
| Total | 1,491 (59.1%) | 1,373 (54.5%) |
Disability Status by Sex by Age in Carlisle
| Age Bracket | Male | Female |
| Under 5 Years | 0 (0.0%) | 0 (0.0%) |
| 5 to 17 Years | 80 (38.8%) | 46 (21.6%) |
| 18 to 34 Years | 38 (12.3%) | 35 (13.7%) |
| 35 to 64 Years | 104 (19.1%) | 120 (24.4%) |
| 65 to 74 Years | 15 (17.9%) | 76 (55.5%) |
| 75 Years and over | 62 (88.6%) | 93 (78.1%) |
Disability Class by Sex by Age in Carlisle
Disability Class: Hearing Difficulty
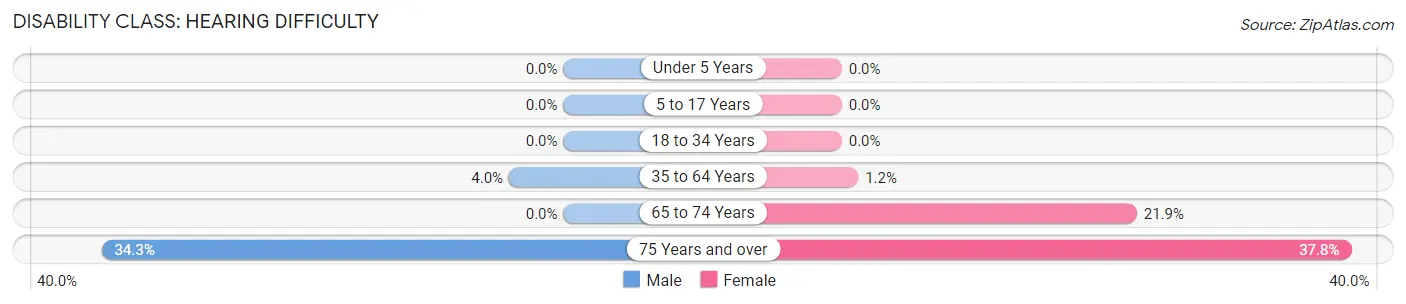
| Age Bracket | Male | Female |
| Under 5 Years | 0 (0.0%) | 0 (0.0%) |
| 5 to 17 Years | 0 (0.0%) | 0 (0.0%) |
| 18 to 34 Years | 0 (0.0%) | 0 (0.0%) |
| 35 to 64 Years | 22 (4.0%) | 6 (1.2%) |
| 65 to 74 Years | 0 (0.0%) | 30 (21.9%) |
| 75 Years and over | 24 (34.3%) | 45 (37.8%) |
Disability Class: Vision Difficulty
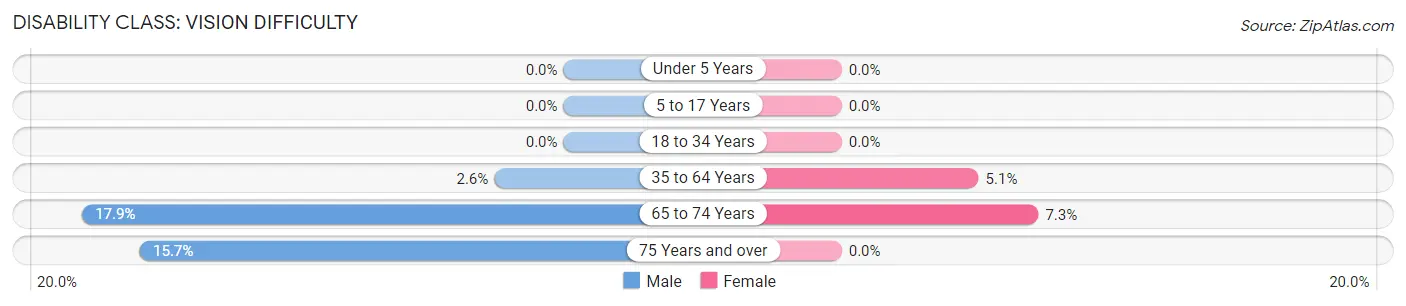
| Age Bracket | Male | Female |
| Under 5 Years | 0 (0.0%) | 0 (0.0%) |
| 5 to 17 Years | 0 (0.0%) | 0 (0.0%) |
| 18 to 34 Years | 0 (0.0%) | 0 (0.0%) |
| 35 to 64 Years | 14 (2.6%) | 25 (5.1%) |
| 65 to 74 Years | 15 (17.9%) | 10 (7.3%) |
| 75 Years and over | 11 (15.7%) | 0 (0.0%) |
Disability Class: Cognitive Difficulty
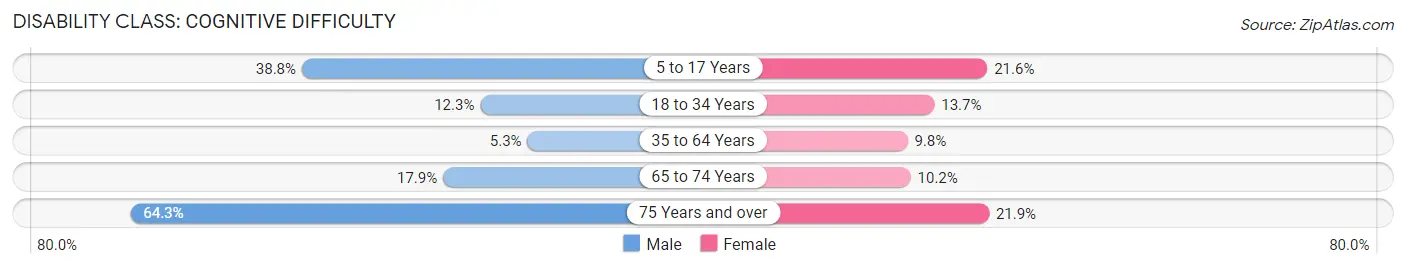
| Age Bracket | Male | Female |
| 5 to 17 Years | 80 (38.8%) | 46 (21.6%) |
| 18 to 34 Years | 38 (12.3%) | 35 (13.7%) |
| 35 to 64 Years | 29 (5.3%) | 48 (9.8%) |
| 65 to 74 Years | 15 (17.9%) | 14 (10.2%) |
| 75 Years and over | 45 (64.3%) | 26 (21.8%) |
Disability Class: Ambulatory Difficulty
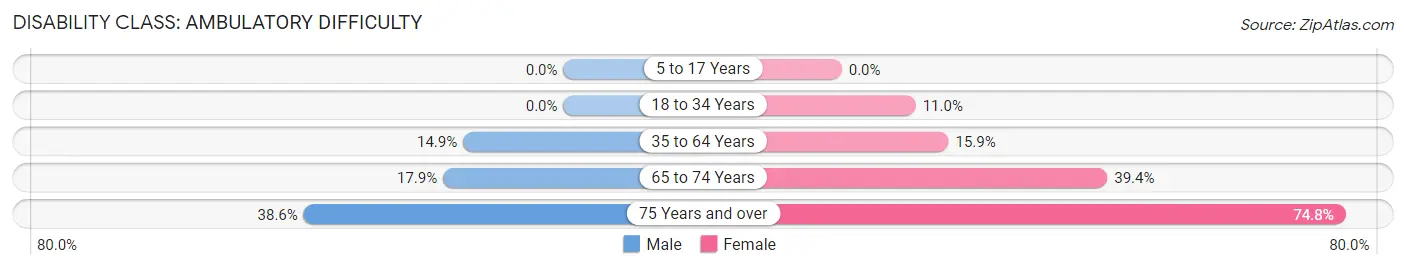
| Age Bracket | Male | Female |
| 5 to 17 Years | 0 (0.0%) | 0 (0.0%) |
| 18 to 34 Years | 0 (0.0%) | 28 (11.0%) |
| 35 to 64 Years | 81 (14.9%) | 78 (15.9%) |
| 65 to 74 Years | 15 (17.9%) | 54 (39.4%) |
| 75 Years and over | 27 (38.6%) | 89 (74.8%) |
Disability Class: Self-Care Difficulty
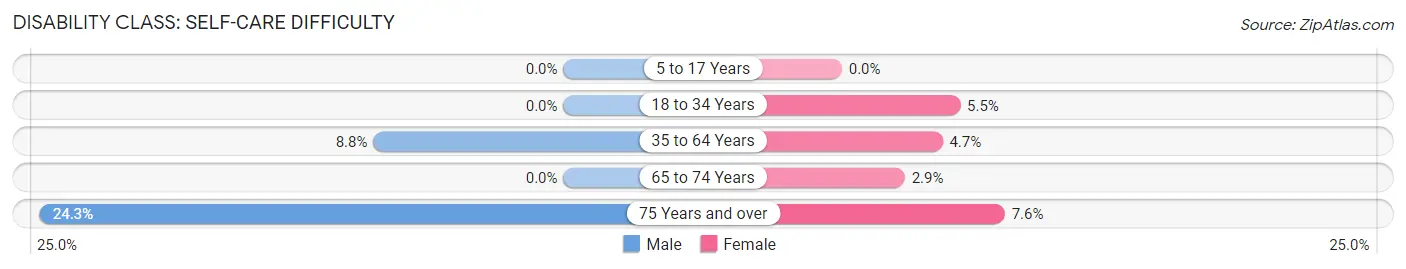
| Age Bracket | Male | Female |
| 5 to 17 Years | 0 (0.0%) | 0 (0.0%) |
| 18 to 34 Years | 0 (0.0%) | 14 (5.5%) |
| 35 to 64 Years | 48 (8.8%) | 23 (4.7%) |
| 65 to 74 Years | 0 (0.0%) | 4 (2.9%) |
| 75 Years and over | 17 (24.3%) | 9 (7.6%) |
Technology Access in Carlisle
Computing Device Access in Carlisle
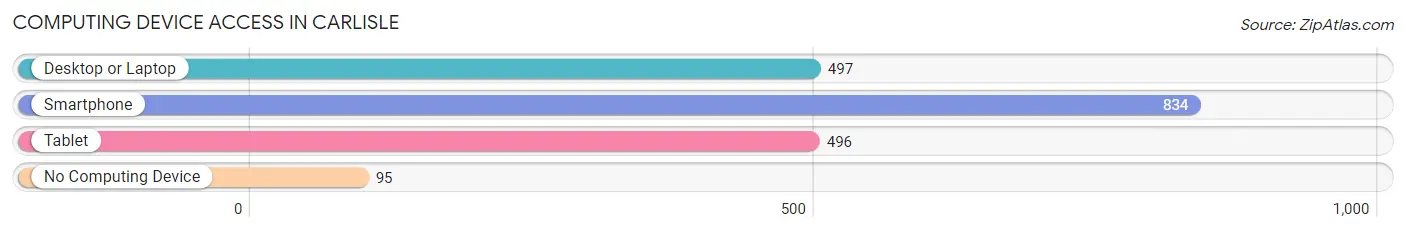
| Device Type | # Households | % Households |
| Desktop or Laptop | 497 | 49.0% |
| Smartphone | 834 | 82.3% |
| Tablet | 496 | 48.9% |
| No Computing Device | 95 | 9.4% |
| Total | 1,014 | 100.0% |
Internet Access in Carlisle
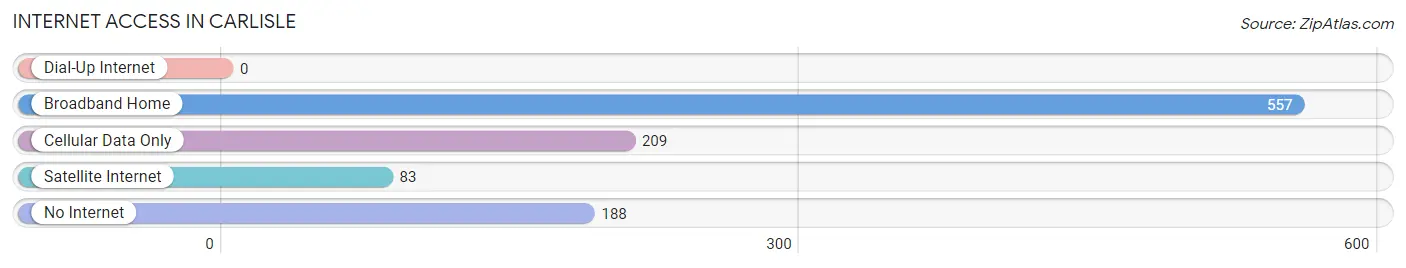
| Internet Type | # Households | % Households |
| Dial-Up Internet | 0 | 0.0% |
| Broadband Home | 557 | 54.9% |
| Cellular Data Only | 209 | 20.6% |
| Satellite Internet | 83 | 8.2% |
| No Internet | 188 | 18.5% |
| Total | 1,014 | 100.0% |
Carlisle Summary
Carlisle, Kentucky is a small city located in Nicholas County, Kentucky. It is situated on the banks of the Kentucky River, and is the county seat of Nicholas County. The city has a population of 1,845 as of the 2010 census, and is part of the Lexington-Fayette Metropolitan Statistical Area.
History
The area that is now Carlisle was first settled in 1790 by William and Mary Carlisle, who were among the first settlers in the area. The town was officially established in 1817, and was named after the Carlisles. The town was incorporated in 1837, and was the county seat of Nicholas County.
In the early 19th century, Carlisle was a thriving river port, and was a major stop on the Kentucky River. The town was also a major stop on the Louisville and Nashville Railroad, which ran through the town.
In the late 19th century, Carlisle was a major center for the tobacco industry, and was home to several tobacco warehouses. The town was also home to several distilleries, and was a major producer of whiskey.
Geography
Carlisle is located in Nicholas County, Kentucky, and is situated on the banks of the Kentucky River. The city has a total area of 1.2 square miles, all of which is land. The city is located in the Central Kentucky region, and is about 40 miles east of Lexington.
The climate in Carlisle is humid subtropical, with hot, humid summers and mild winters. The average annual temperature is around 60 degrees Fahrenheit, and the average annual precipitation is around 45 inches.
Economy
The economy of Carlisle is largely based on agriculture and manufacturing. The city is home to several tobacco warehouses, and is a major producer of tobacco products. The city is also home to several distilleries, and is a major producer of whiskey.
The city is also home to several small businesses, including restaurants, retail stores, and service providers. The city is also home to several industrial parks, which are home to a variety of manufacturing companies.
Demographics
As of the 2010 census, the population of Carlisle was 1,845. The racial makeup of the city was 95.3% White, 2.2% African American, 0.3% Native American, 0.2% Asian, 0.1% Pacific Islander, 0.7% from other races, and 1.3% from two or more races. Hispanic or Latino of any race were 1.7% of the population.
The median income for a household in Carlisle was $31,250, and the median income for a family was $37,500. The per capita income for the city was $17,845. About 17.2% of the population was below the poverty line.
Common Questions
What is Per Capita Income in Carlisle?
Per Capita income in Carlisle is $25,702.
What is the Median Family Income in Carlisle?
Median Family Income in Carlisle is $64,219.
What is the Median Household income in Carlisle?
Median Household Income in Carlisle is $53,661.
What is Income or Wage Gap in Carlisle?
Income or Wage Gap in Carlisle is 46.6%.
Women in Carlisle earn 53.4 cents for every dollar earned by a man.
What is Inequality or Gini Index in Carlisle?
Inequality or Gini Index in Carlisle is 0.43.
What is the Total Population of Carlisle?
Total Population of Carlisle is 2,627.
What is the Total Male Population of Carlisle?
Total Male Population of Carlisle is 1,304.
What is the Total Female Population of Carlisle?
Total Female Population of Carlisle is 1,323.
What is the Ratio of Males per 100 Females in Carlisle?
There are 98.56 Males per 100 Females in Carlisle.
What is the Ratio of Females per 100 Males in Carlisle?
There are 101.46 Females per 100 Males in Carlisle.
What is the Median Population Age in Carlisle?
Median Population Age in Carlisle is 42.9 Years.
What is the Average Family Size in Carlisle
Average Family Size in Carlisle is 3.2 People.
What is the Average Household Size in Carlisle
Average Household Size in Carlisle is 2.5 People.
How Large is the Labor Force in Carlisle?
There are 1,192 People in the Labor Forcein in Carlisle.
What is the Percentage of People in the Labor Force in Carlisle?
56.0% of People are in the Labor Force in Carlisle.
What is the Unemployment Rate in Carlisle?
Unemployment Rate in Carlisle is 3.8%.