Richlawn, KY Map & Demographics
Richlawn Map
Richlawn Overview
$69,102
PER CAPITA INCOME
$127,917
AVG FAMILY INCOME
$114,000
AVG HOUSEHOLD INCOME
28.3%
WAGE / INCOME GAP [ % ]
71.7¢/ $1
WAGE / INCOME GAP [ $ ]
0.36
INEQUALITY / GINI INDEX
361
TOTAL POPULATION
197
MALE POPULATION
164
FEMALE POPULATION
120.12
MALES / 100 FEMALES
83.25
FEMALES / 100 MALES
40.7
MEDIAN AGE
2.6
AVG FAMILY SIZE
2.0
AVG HOUSEHOLD SIZE
226
LABOR FORCE [ PEOPLE ]
75.3%
PERCENT IN LABOR FORCE
2.7%
UNEMPLOYMENT RATE
Richlawn Area Codes
Income in Richlawn
Income Overview in Richlawn
Per Capita Income in Richlawn is $69,102, while median incomes of families and households are $127,917 and $114,000 respectively.
| Characteristic | Number | Measure |
| Per Capita Income | 361 | $69,102 |
| Median Family Income | 103 | $127,917 |
| Mean Family Income | 103 | $160,926 |
| Median Household Income | 180 | $114,000 |
| Mean Household Income | 180 | $136,757 |
| Income Deficit | 103 | $0 |
| Wage / Income Gap (%) | 361 | 28.26% |
| Wage / Income Gap ($) | 361 | 71.74¢ per $1 |
| Gini / Inequality Index | 361 | 0.36 |
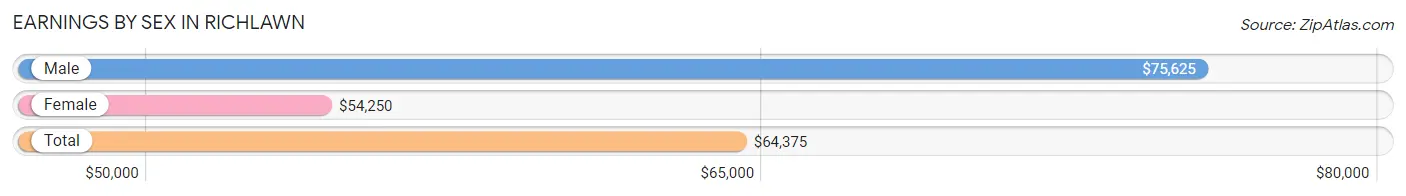
Earnings by Sex in Richlawn
Average Earnings in Richlawn are $64,375, $75,625 for men and $54,250 for women, a difference of 28.3%.
| Sex | Number | Average Earnings |
| Male | 139 (58.9%) | $75,625 |
| Female | 97 (41.1%) | $54,250 |
| Total | 236 (100.0%) | $64,375 |
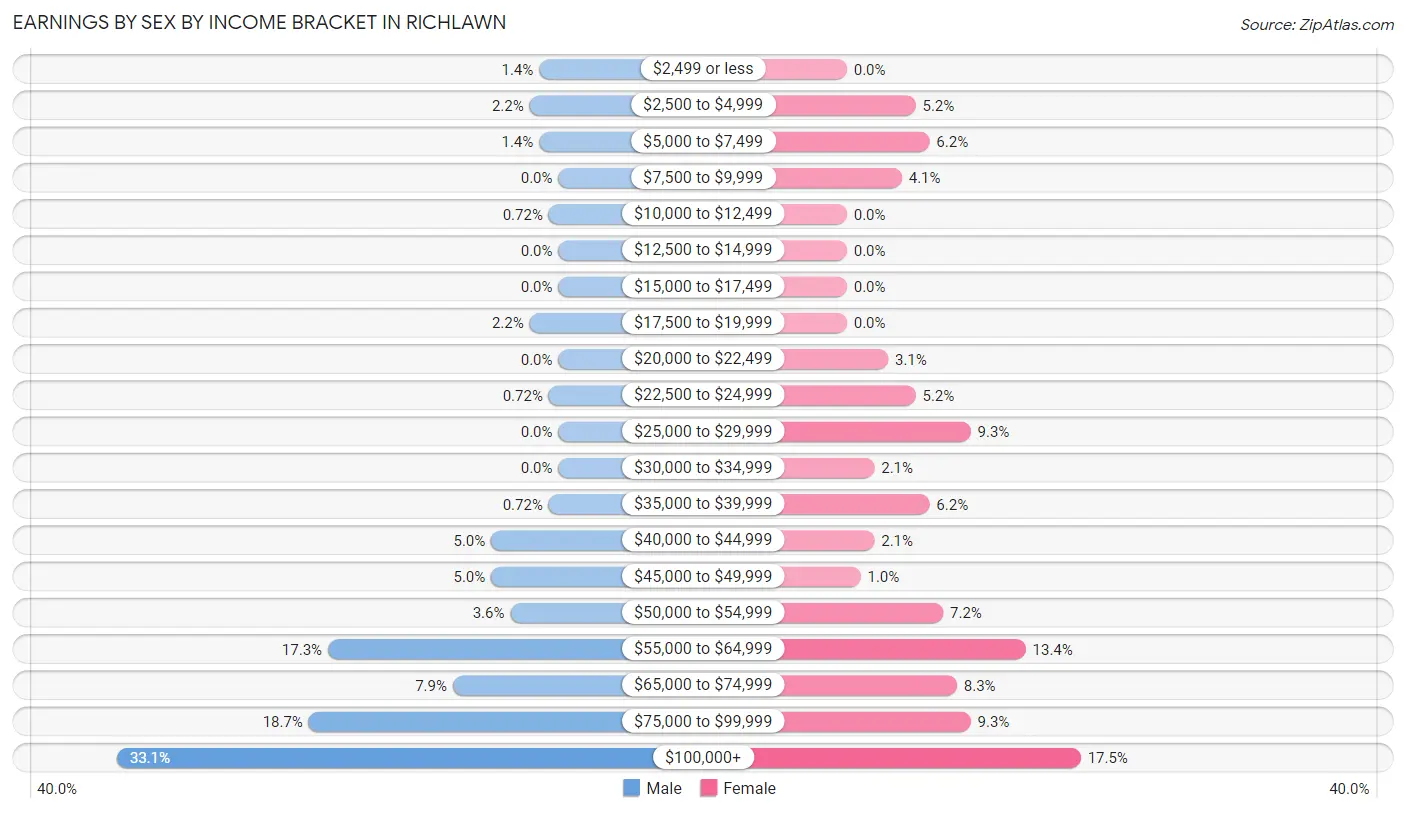
Earnings by Sex by Income Bracket in Richlawn
The most common earnings brackets in Richlawn are $100,000+ for men (46 | 33.1%) and $100,000+ for women (17 | 17.5%).
| Income | Male | Female |
| $2,499 or less | 2 (1.4%) | 0 (0.0%) |
| $2,500 to $4,999 | 3 (2.2%) | 5 (5.1%) |
| $5,000 to $7,499 | 2 (1.4%) | 6 (6.2%) |
| $7,500 to $9,999 | 0 (0.0%) | 4 (4.1%) |
| $10,000 to $12,499 | 1 (0.7%) | 0 (0.0%) |
| $12,500 to $14,999 | 0 (0.0%) | 0 (0.0%) |
| $15,000 to $17,499 | 0 (0.0%) | 0 (0.0%) |
| $17,500 to $19,999 | 3 (2.2%) | 0 (0.0%) |
| $20,000 to $22,499 | 0 (0.0%) | 3 (3.1%) |
| $22,500 to $24,999 | 1 (0.7%) | 5 (5.1%) |
| $25,000 to $29,999 | 0 (0.0%) | 9 (9.3%) |
| $30,000 to $34,999 | 0 (0.0%) | 2 (2.1%) |
| $35,000 to $39,999 | 1 (0.7%) | 6 (6.2%) |
| $40,000 to $44,999 | 7 (5.0%) | 2 (2.1%) |
| $45,000 to $49,999 | 7 (5.0%) | 1 (1.0%) |
| $50,000 to $54,999 | 5 (3.6%) | 7 (7.2%) |
| $55,000 to $64,999 | 24 (17.3%) | 13 (13.4%) |
| $65,000 to $74,999 | 11 (7.9%) | 8 (8.3%) |
| $75,000 to $99,999 | 26 (18.7%) | 9 (9.3%) |
| $100,000+ | 46 (33.1%) | 17 (17.5%) |
| Total | 139 (100.0%) | 97 (100.0%) |
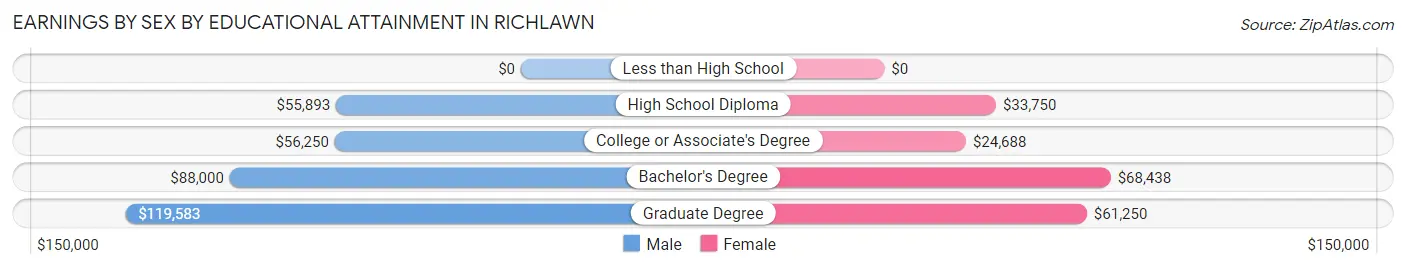
Earnings by Sex by Educational Attainment in Richlawn
Average earnings in Richlawn are $76,250 for men and $55,156 for women, a difference of 27.7%. Men with an educational attainment of graduate degree enjoy the highest average annual earnings of $119,583, while those with high school diploma education earn the least with $55,893. Women with an educational attainment of bachelor's degree earn the most with the average annual earnings of $68,438, while those with college or associate's degree education have the smallest earnings of $24,688.
| Educational Attainment | Male Income | Female Income |
| Less than High School | - | - |
| High School Diploma | $55,893 | $33,750 |
| College or Associate's Degree | $56,250 | $24,688 |
| Bachelor's Degree | $88,000 | $68,438 |
| Graduate Degree | $119,583 | $61,250 |
| Total | $76,250 | $55,156 |
Family Income in Richlawn
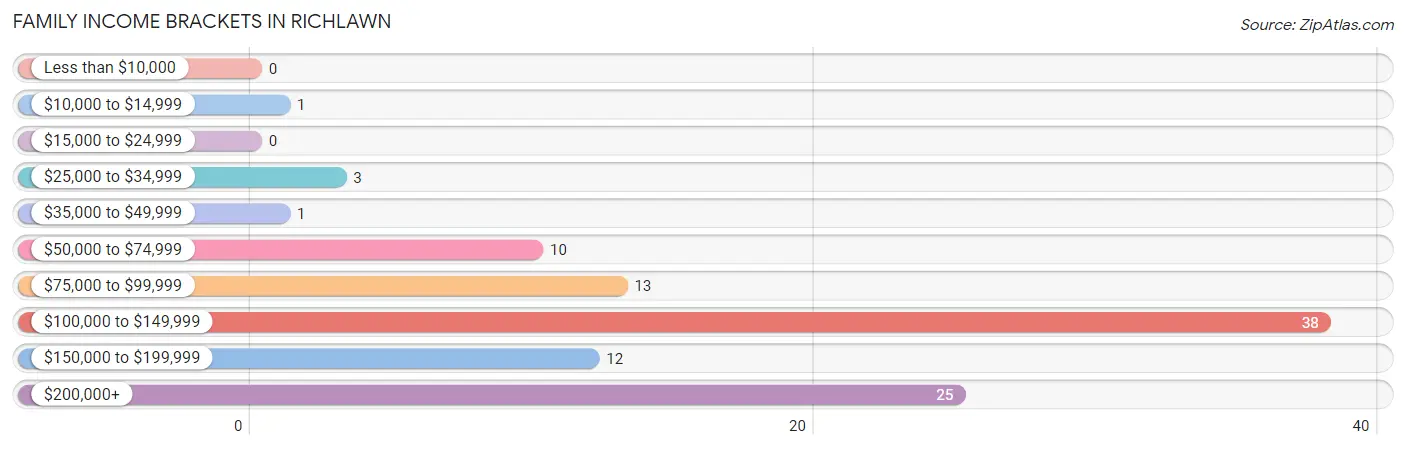
Family Income Brackets in Richlawn
According to the Richlawn family income data, there are 38 families falling into the $100,000 to $149,999 income range, which is the most common income bracket and makes up 36.9% of all families.
| Income Bracket | # Families | % Families |
| Less than $10,000 | 0 | 0.0% |
| $10,000 to $14,999 | 1 | 1.0% |
| $15,000 to $24,999 | 0 | 0.0% |
| $25,000 to $34,999 | 3 | 2.9% |
| $35,000 to $49,999 | 1 | 1.0% |
| $50,000 to $74,999 | 10 | 9.7% |
| $75,000 to $99,999 | 13 | 12.6% |
| $100,000 to $149,999 | 38 | 36.9% |
| $150,000 to $199,999 | 12 | 11.7% |
| $200,000+ | 25 | 24.3% |
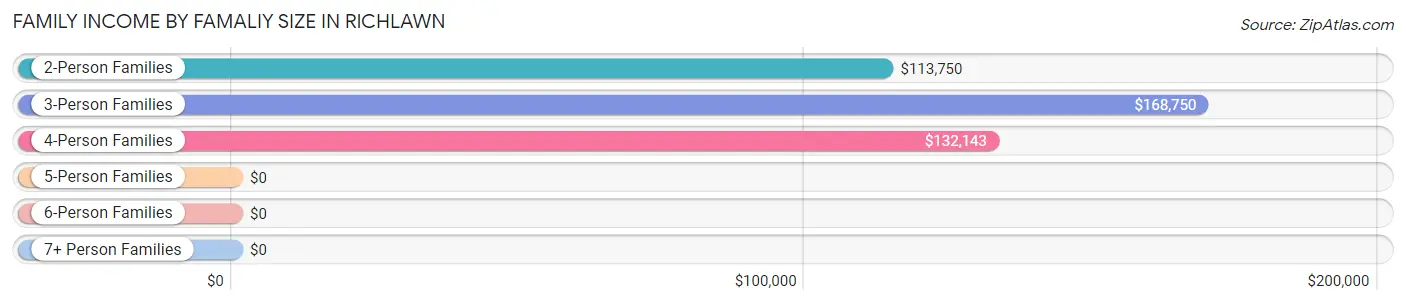
Family Income by Famaliy Size in Richlawn
3-person families (21 | 20.4%) account for the highest median family income in Richlawn with $168,750 per family, while 2-person families (61 | 59.2%) have the highest median income of $56,875 per family member.
| Income Bracket | # Families | Median Income |
| 2-Person Families | 61 (59.2%) | $113,750 |
| 3-Person Families | 21 (20.4%) | $168,750 |
| 4-Person Families | 18 (17.5%) | $132,143 |
| 5-Person Families | 3 (2.9%) | $0 |
| 6-Person Families | 0 (0.0%) | $0 |
| 7+ Person Families | 0 (0.0%) | $0 |
| Total | 103 (100.0%) | $127,917 |
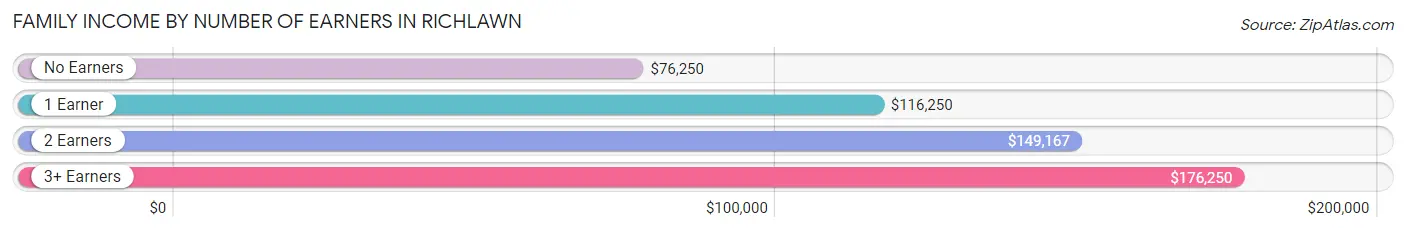
Family Income by Number of Earners in Richlawn
The median family income in Richlawn is $127,917, with families comprising 3+ earners (6) having the highest median family income of $176,250, while families with no earners (20) have the lowest median family income of $76,250, accounting for 5.8% and 19.4% of families, respectively.
| Number of Earners | # Families | Median Income |
| No Earners | 20 (19.4%) | $76,250 |
| 1 Earner | 15 (14.6%) | $116,250 |
| 2 Earners | 62 (60.2%) | $149,167 |
| 3+ Earners | 6 (5.8%) | $176,250 |
| Total | 103 (100.0%) | $127,917 |
Household Income in Richlawn
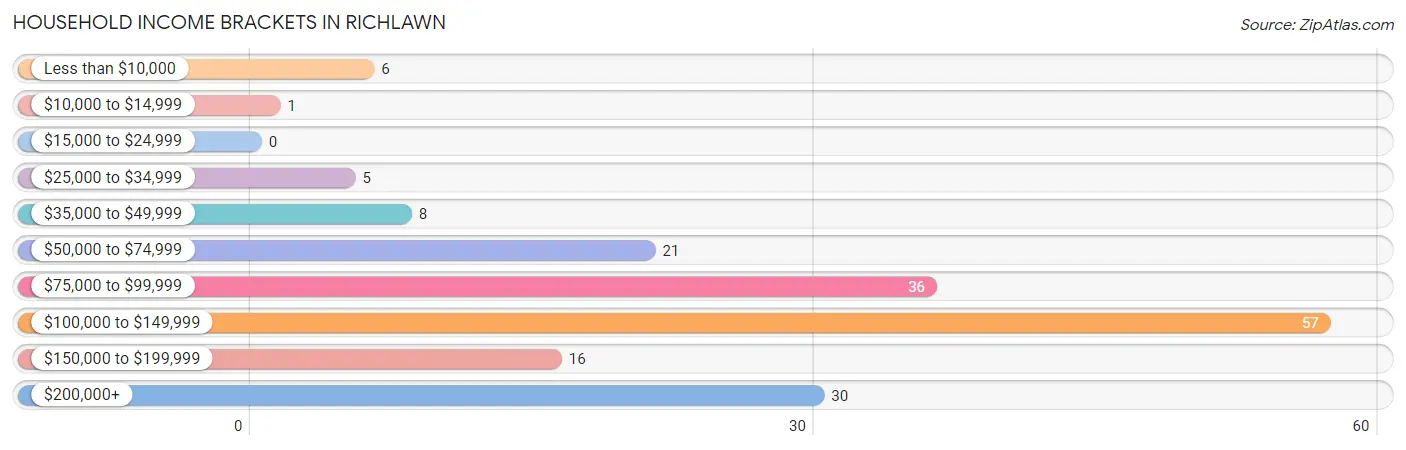
Household Income Brackets in Richlawn
With 57 households falling in the category, the $100,000 to $149,999 income range is the most frequent in Richlawn, accounting for 31.7% of all households.
| Income Bracket | # Households | % Households |
| Less than $10,000 | 6 | 3.3% |
| $10,000 to $14,999 | 1 | 0.6% |
| $15,000 to $24,999 | 0 | 0.0% |
| $25,000 to $34,999 | 5 | 2.8% |
| $35,000 to $49,999 | 8 | 4.4% |
| $50,000 to $74,999 | 21 | 11.7% |
| $75,000 to $99,999 | 36 | 20.0% |
| $100,000 to $149,999 | 57 | 31.7% |
| $150,000 to $199,999 | 16 | 8.9% |
| $200,000+ | 30 | 16.7% |
Household Income by Householder Age in Richlawn
The median household income in Richlawn is $114,000, with the highest median household income of $131,429 found in the 25 to 44 years age bracket for the primary householder. A total of 78 households (43.3%) fall into this category. Meanwhile, the 15 to 24 years age bracket for the primary householder has the lowest median household income of $0, with 1 households (0.6%) in this group.
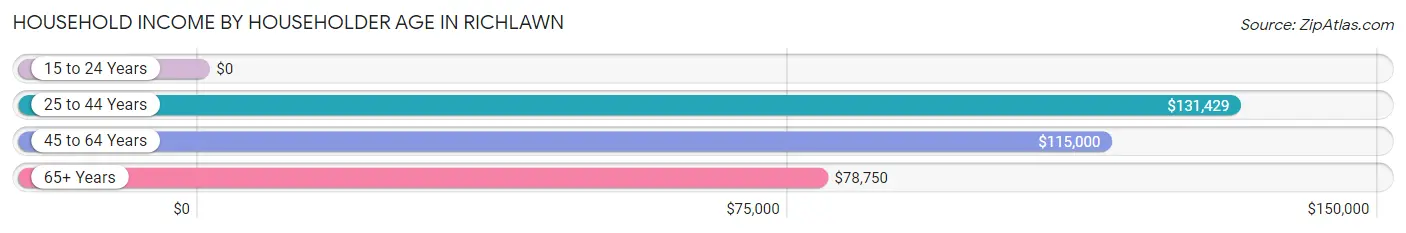
| Income Bracket | # Households | Median Income |
| 15 to 24 Years | 1 (0.6%) | $0 |
| 25 to 44 Years | 78 (43.3%) | $131,429 |
| 45 to 64 Years | 54 (30.0%) | $115,000 |
| 65+ Years | 47 (26.1%) | $78,750 |
| Total | 180 (100.0%) | $114,000 |
Poverty in Richlawn
Income Below Poverty by Sex and Age in Richlawn
With 3.0% poverty level for males and 2.4% for females among the residents of Richlawn, 35 to 44 year old males and 75 year old and over females are the most vulnerable to poverty, with 3 males (10.3%) and 1 females (7.7%) in their respective age groups living below the poverty level.
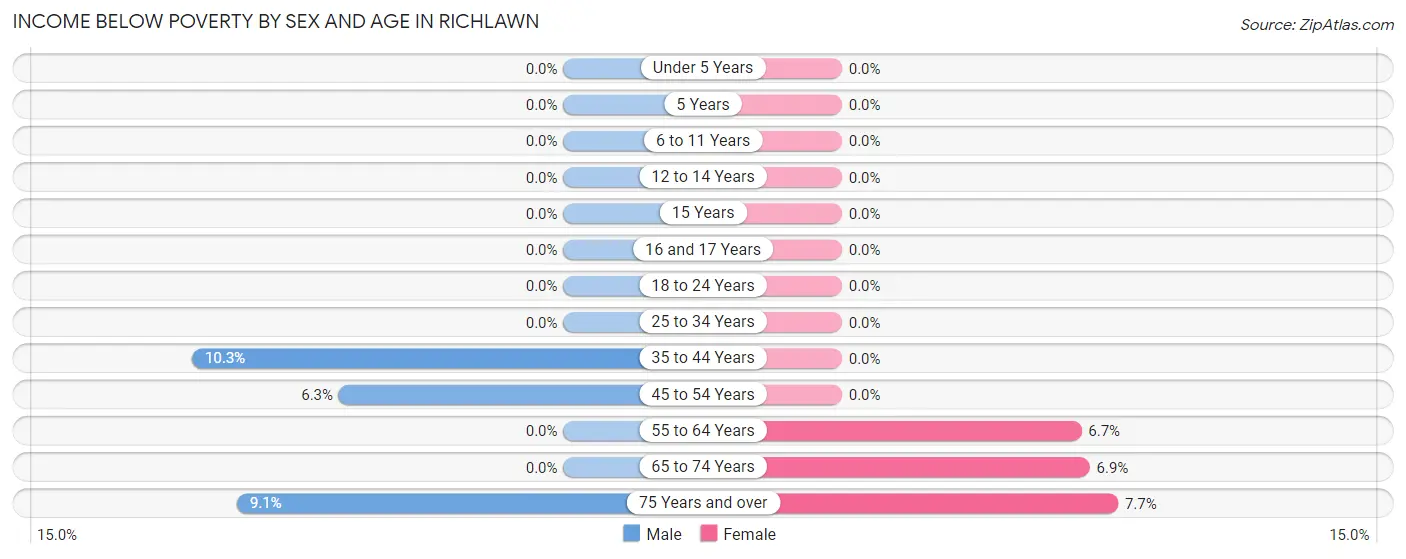
| Age Bracket | Male | Female |
| Under 5 Years | 0 (0.0%) | 0 (0.0%) |
| 5 Years | 0 (0.0%) | 0 (0.0%) |
| 6 to 11 Years | 0 (0.0%) | 0 (0.0%) |
| 12 to 14 Years | 0 (0.0%) | 0 (0.0%) |
| 15 Years | 0 (0.0%) | 0 (0.0%) |
| 16 and 17 Years | 0 (0.0%) | 0 (0.0%) |
| 18 to 24 Years | 0 (0.0%) | 0 (0.0%) |
| 25 to 34 Years | 0 (0.0%) | 0 (0.0%) |
| 35 to 44 Years | 3 (10.3%) | 0 (0.0%) |
| 45 to 54 Years | 2 (6.2%) | 0 (0.0%) |
| 55 to 64 Years | 0 (0.0%) | 1 (6.7%) |
| 65 to 74 Years | 0 (0.0%) | 2 (6.9%) |
| 75 Years and over | 1 (9.1%) | 1 (7.7%) |
| Total | 6 (3.0%) | 4 (2.4%) |
Income Above Poverty by Sex and Age in Richlawn
According to the poverty statistics in Richlawn, males aged under 5 years and females aged under 5 years are the age groups that are most secure financially, with 100.0% of males and 100.0% of females in these age groups living above the poverty line.
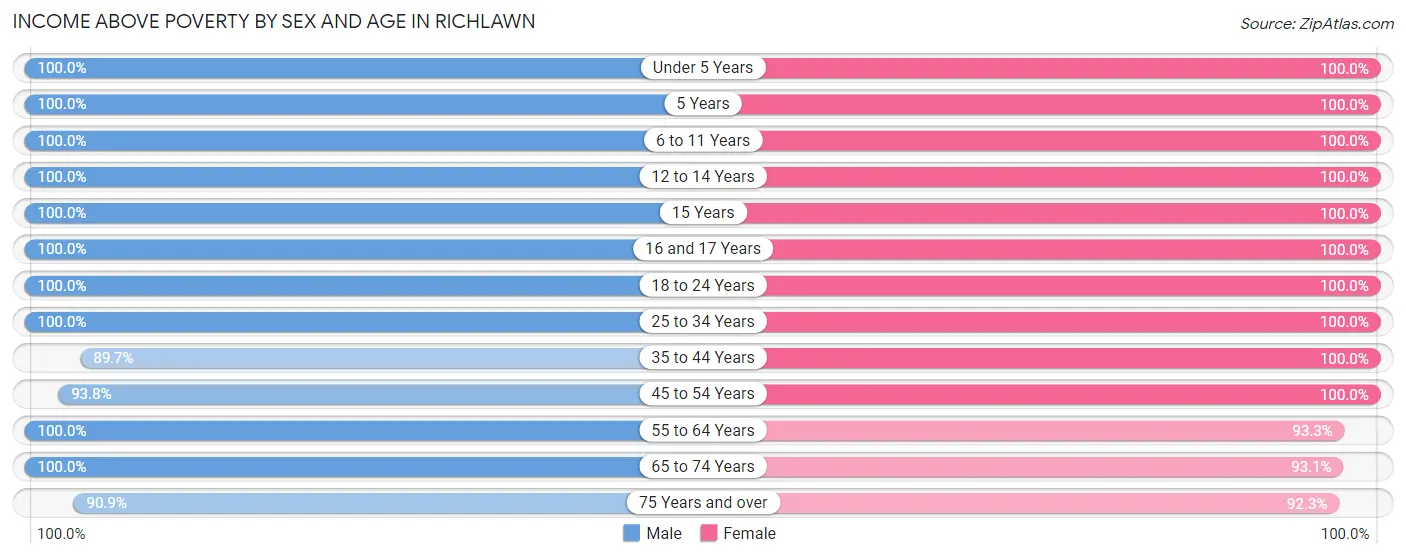
| Age Bracket | Male | Female |
| Under 5 Years | 22 (100.0%) | 15 (100.0%) |
| 5 Years | 2 (100.0%) | 1 (100.0%) |
| 6 to 11 Years | 4 (100.0%) | 7 (100.0%) |
| 12 to 14 Years | 3 (100.0%) | 3 (100.0%) |
| 15 Years | 2 (100.0%) | 2 (100.0%) |
| 16 and 17 Years | 1 (100.0%) | 1 (100.0%) |
| 18 to 24 Years | 4 (100.0%) | 5 (100.0%) |
| 25 to 34 Years | 46 (100.0%) | 32 (100.0%) |
| 35 to 44 Years | 26 (89.7%) | 26 (100.0%) |
| 45 to 54 Years | 30 (93.8%) | 15 (100.0%) |
| 55 to 64 Years | 23 (100.0%) | 14 (93.3%) |
| 65 to 74 Years | 18 (100.0%) | 27 (93.1%) |
| 75 Years and over | 10 (90.9%) | 12 (92.3%) |
| Total | 191 (97.0%) | 160 (97.6%) |
Income Below Poverty Among Married-Couple Families in Richlawn
The poverty statistics for married-couple families in Richlawn show that 1.2% or 1 of the total 86 families live below the poverty line. Families with no children have the highest poverty rate of 1.8%, comprising of 1 families. On the other hand, families with 1 or 2 children have the lowest poverty rate of 0.0%, which includes 0 families.
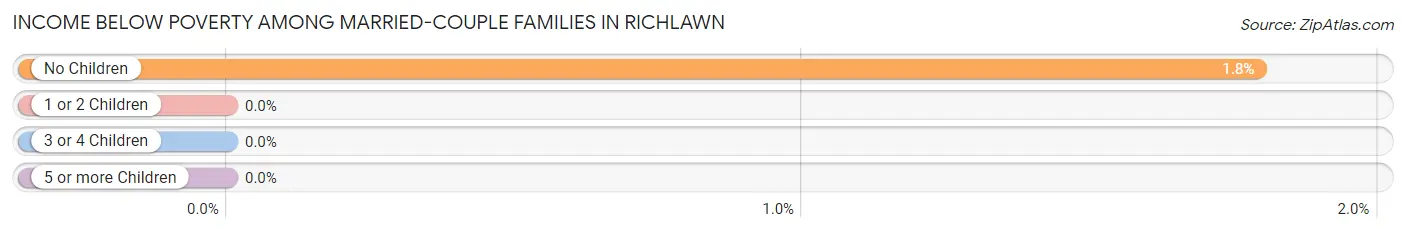
| Children | Above Poverty | Below Poverty |
| No Children | 55 (98.2%) | 1 (1.8%) |
| 1 or 2 Children | 29 (100.0%) | 0 (0.0%) |
| 3 or 4 Children | 1 (100.0%) | 0 (0.0%) |
| 5 or more Children | 0 (0.0%) | 0 (0.0%) |
| Total | 85 (98.8%) | 1 (1.2%) |
Income Below Poverty Among Single-Parent Households in Richlawn
| Children | Single Father | Single Mother |
| No Children | 0 (0.0%) | 0 (0.0%) |
| 1 or 2 Children | 0 (0.0%) | 0 (0.0%) |
| 3 or 4 Children | 0 (0.0%) | 0 (0.0%) |
| 5 or more Children | 0 (0.0%) | 0 (0.0%) |
| Total | 0 (0.0%) | 0 (0.0%) |
Income Below Poverty Among Married-Couple vs Single-Parent Households in Richlawn
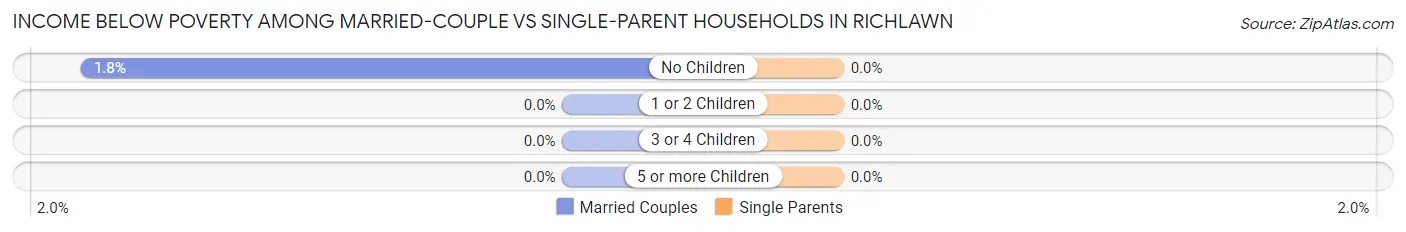
| Children | Married-Couple Families | Single-Parent Households |
| No Children | 1 (1.8%) | 0 (0.0%) |
| 1 or 2 Children | 0 (0.0%) | 0 (0.0%) |
| 3 or 4 Children | 0 (0.0%) | 0 (0.0%) |
| 5 or more Children | 0 (0.0%) | 0 (0.0%) |
| Total | 1 (1.2%) | 0 (0.0%) |
Race in Richlawn
The most populous races in Richlawn are White / Caucasian (355 | 98.3%), Two or more Races (4 | 1.1%), and Hispanic or Latino (2 | 0.5%).
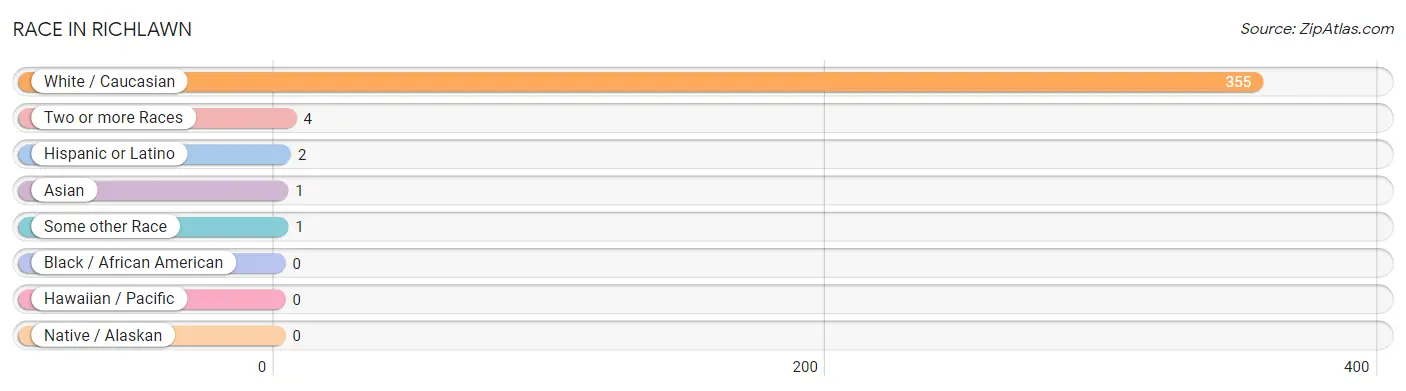
| Race | # Population | % Population |
| Asian | 1 | 0.3% |
| Black / African American | 0 | 0.0% |
| Hawaiian / Pacific | 0 | 0.0% |
| Hispanic or Latino | 2 | 0.5% |
| Native / Alaskan | 0 | 0.0% |
| White / Caucasian | 355 | 98.3% |
| Two or more Races | 4 | 1.1% |
| Some other Race | 1 | 0.3% |
| Total | 361 | 100.0% |
Ancestry in Richlawn
The most populous ancestries reported in Richlawn are German (114 | 31.6%), Irish (83 | 23.0%), English (76 | 21.0%), American (30 | 8.3%), and Italian (24 | 6.7%), together accounting for 90.6% of all Richlawn residents.
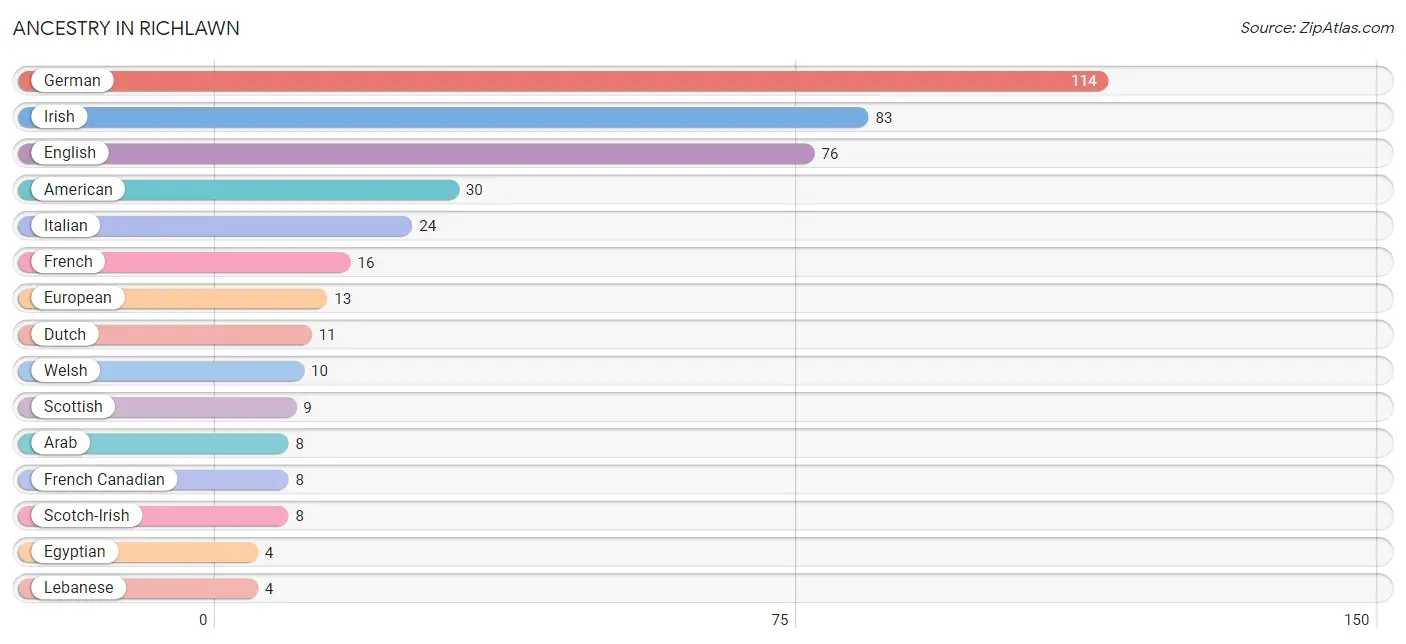
| Ancestry | # Population | % Population |
| American | 30 | 8.3% |
| Arab | 8 | 2.2% |
| Austrian | 2 | 0.5% |
| Celtic | 2 | 0.5% |
| Dutch | 11 | 3.0% |
| Egyptian | 4 | 1.1% |
| English | 76 | 21.0% |
| European | 13 | 3.6% |
| French | 16 | 4.4% |
| French Canadian | 8 | 2.2% |
| German | 114 | 31.6% |
| Greek | 3 | 0.8% |
| Hungarian | 3 | 0.8% |
| Indian (Asian) | 1 | 0.3% |
| Irish | 83 | 23.0% |
| Italian | 24 | 6.7% |
| Korean | 1 | 0.3% |
| Lebanese | 4 | 1.1% |
| Mexican | 2 | 0.5% |
| Polish | 4 | 1.1% |
| Russian | 3 | 0.8% |
| Scotch-Irish | 8 | 2.2% |
| Scottish | 9 | 2.5% |
| Swedish | 3 | 0.8% |
| Welsh | 10 | 2.8% | View All 25 Rows |
Immigrants in Richlawn
The most numerous immigrant groups reported in Richlawn came from Europe (6 | 1.7%), Northern Europe (6 | 1.7%), Ireland (5 | 1.4%), Canada (2 | 0.5%), and Asia (1 | 0.3%), together accounting for 5.5% of all Richlawn residents.
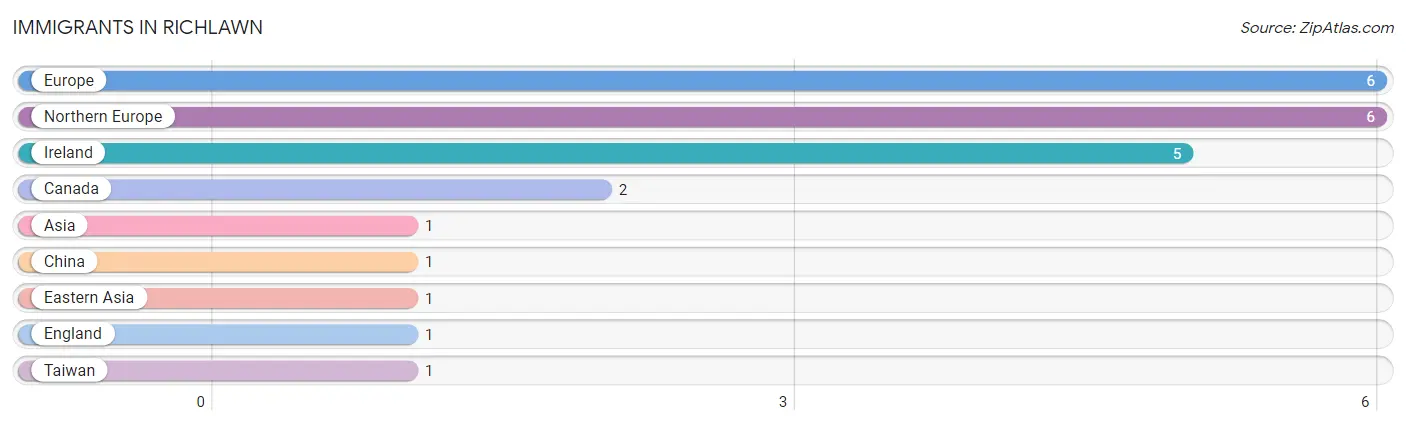
| Immigration Origin | # Population | % Population |
| Asia | 1 | 0.3% |
| Canada | 2 | 0.5% |
| China | 1 | 0.3% |
| Eastern Asia | 1 | 0.3% |
| England | 1 | 0.3% |
| Europe | 6 | 1.7% |
| Ireland | 5 | 1.4% |
| Northern Europe | 6 | 1.7% |
| Taiwan | 1 | 0.3% | View All 9 Rows |
Sex and Age in Richlawn
Sex and Age in Richlawn
The most populous age groups in Richlawn are 30 to 34 Years (28 | 14.2%) for men and 30 to 34 Years (19 | 11.6%) for women.
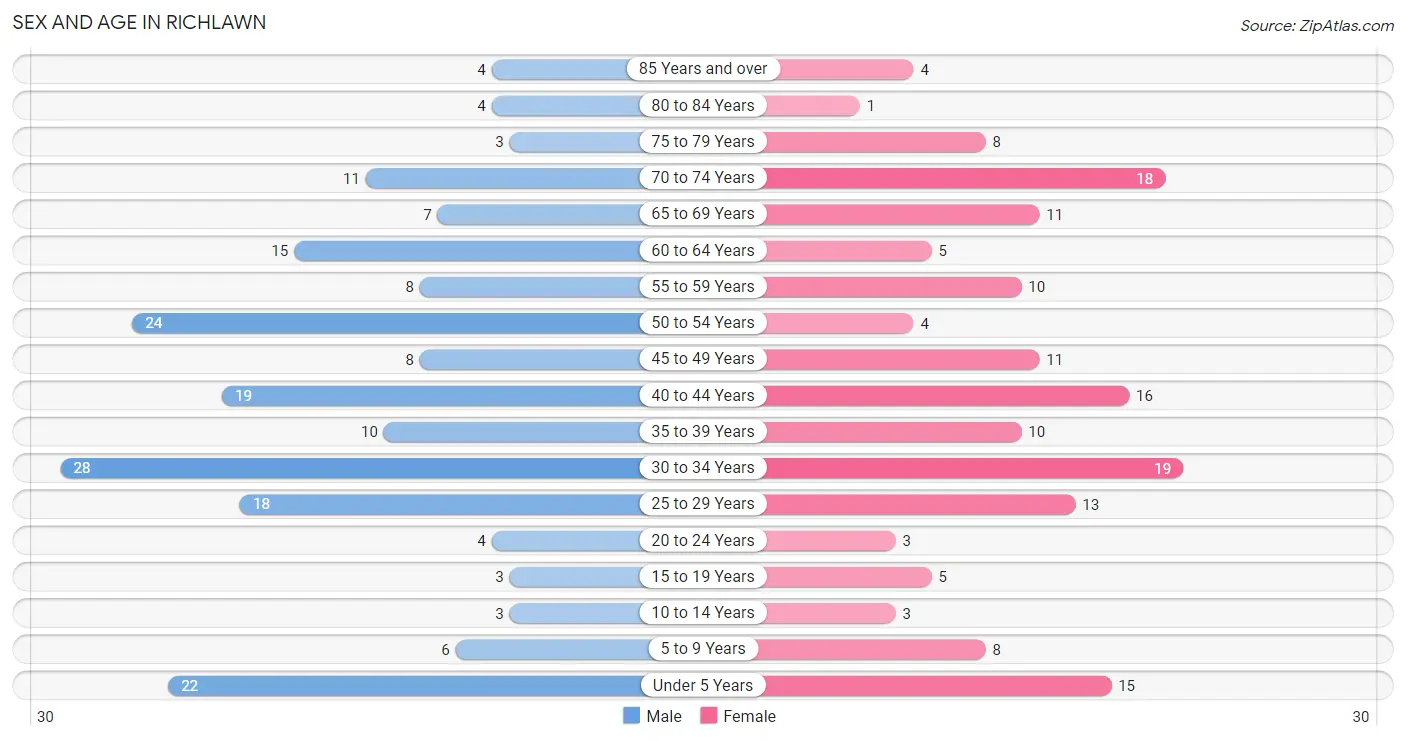
| Age Bracket | Male | Female |
| Under 5 Years | 22 (11.2%) | 15 (9.1%) |
| 5 to 9 Years | 6 (3.0%) | 8 (4.9%) |
| 10 to 14 Years | 3 (1.5%) | 3 (1.8%) |
| 15 to 19 Years | 3 (1.5%) | 5 (3.0%) |
| 20 to 24 Years | 4 (2.0%) | 3 (1.8%) |
| 25 to 29 Years | 18 (9.1%) | 13 (7.9%) |
| 30 to 34 Years | 28 (14.2%) | 19 (11.6%) |
| 35 to 39 Years | 10 (5.1%) | 10 (6.1%) |
| 40 to 44 Years | 19 (9.6%) | 16 (9.8%) |
| 45 to 49 Years | 8 (4.1%) | 11 (6.7%) |
| 50 to 54 Years | 24 (12.2%) | 4 (2.4%) |
| 55 to 59 Years | 8 (4.1%) | 10 (6.1%) |
| 60 to 64 Years | 15 (7.6%) | 5 (3.0%) |
| 65 to 69 Years | 7 (3.5%) | 11 (6.7%) |
| 70 to 74 Years | 11 (5.6%) | 18 (11.0%) |
| 75 to 79 Years | 3 (1.5%) | 8 (4.9%) |
| 80 to 84 Years | 4 (2.0%) | 1 (0.6%) |
| 85 Years and over | 4 (2.0%) | 4 (2.4%) |
| Total | 197 (100.0%) | 164 (100.0%) |
Families and Households in Richlawn
Median Family Size in Richlawn
The median family size in Richlawn is 2.60 persons per family, with single male/father families (9 | 8.7%) accounting for the largest median family size of 2.78 persons per family. On the other hand, single female/mother families (8 | 7.8%) represent the smallest median family size with 2.00 persons per family.
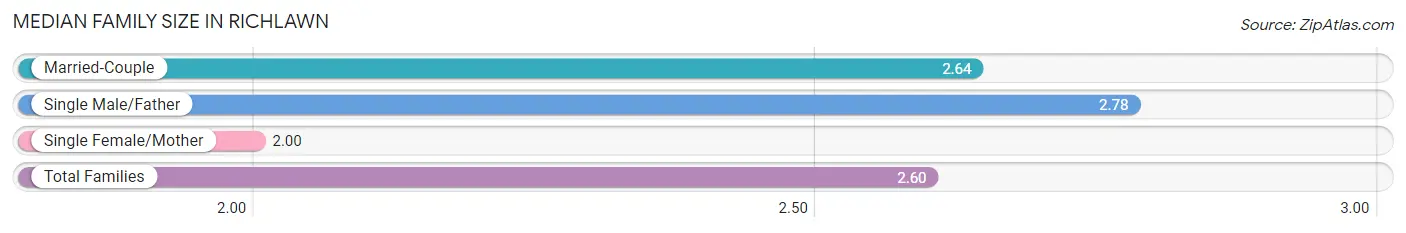
| Family Type | # Families | Family Size |
| Married-Couple | 86 (83.5%) | 2.64 |
| Single Male/Father | 9 (8.7%) | 2.78 |
| Single Female/Mother | 8 (7.8%) | 2.00 |
| Total Families | 103 (100.0%) | 2.60 |
Median Household Size in Richlawn
The median household size in Richlawn is 2.01 persons per household, with single male/father households (9 | 5.0%) accounting for the largest median household size of 3 persons per household. non-family households (77 | 42.8%) represent the smallest median household size with 1.18 persons per household.
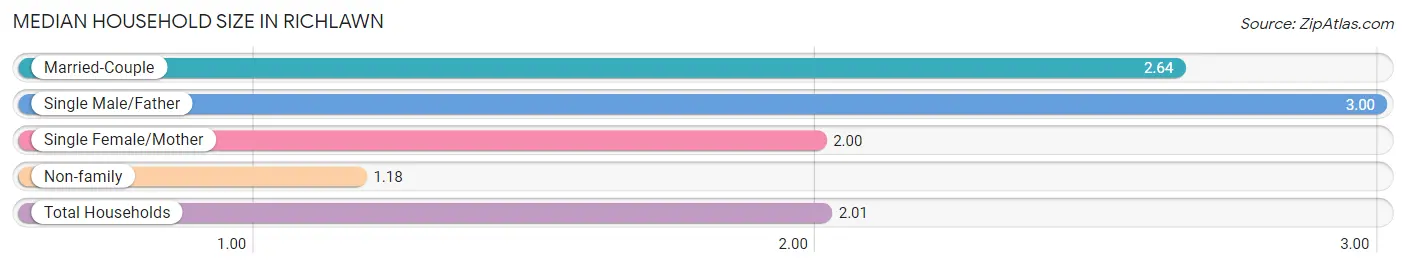
| Household Type | # Households | Household Size |
| Married-Couple | 86 (47.8%) | 2.64 |
| Single Male/Father | 9 (5.0%) | 3.00 |
| Single Female/Mother | 8 (4.4%) | 2.00 |
| Non-family | 77 (42.8%) | 1.18 |
| Total Households | 180 (100.0%) | 2.01 |
Household Size by Marriage Status in Richlawn
Out of a total of 180 households in Richlawn, 103 (57.2%) are family households, while 77 (42.8%) are nonfamily households. The most numerous type of family households are 2-person households, comprising 59, and the most common type of nonfamily households are 1-person households, comprising 64.
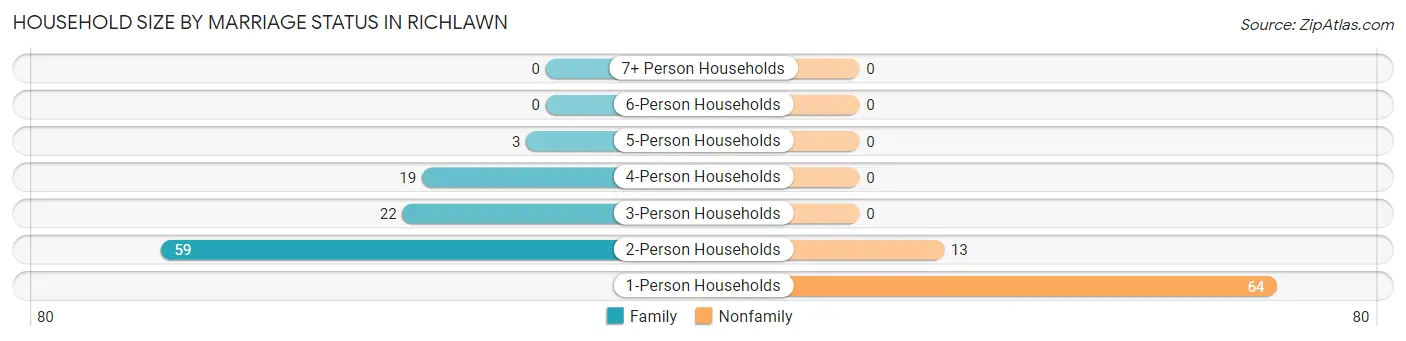
| Household Size | Family Households | Nonfamily Households |
| 1-Person Households | - | 64 (35.6%) |
| 2-Person Households | 59 (32.8%) | 13 (7.2%) |
| 3-Person Households | 22 (12.2%) | 0 (0.0%) |
| 4-Person Households | 19 (10.6%) | 0 (0.0%) |
| 5-Person Households | 3 (1.7%) | 0 (0.0%) |
| 6-Person Households | 0 (0.0%) | 0 (0.0%) |
| 7+ Person Households | 0 (0.0%) | 0 (0.0%) |
| Total | 103 (57.2%) | 77 (42.8%) |
Female Fertility in Richlawn
Fertility by Age in Richlawn
Average fertility rate in Richlawn is 177.0 births per 1,000 women. Women in the age bracket of 20 to 34 years have the highest fertility rate with 200.0 births per 1,000 women. Women in the age bracket of 20 to 34 years acount for 50.0% of all women with births.
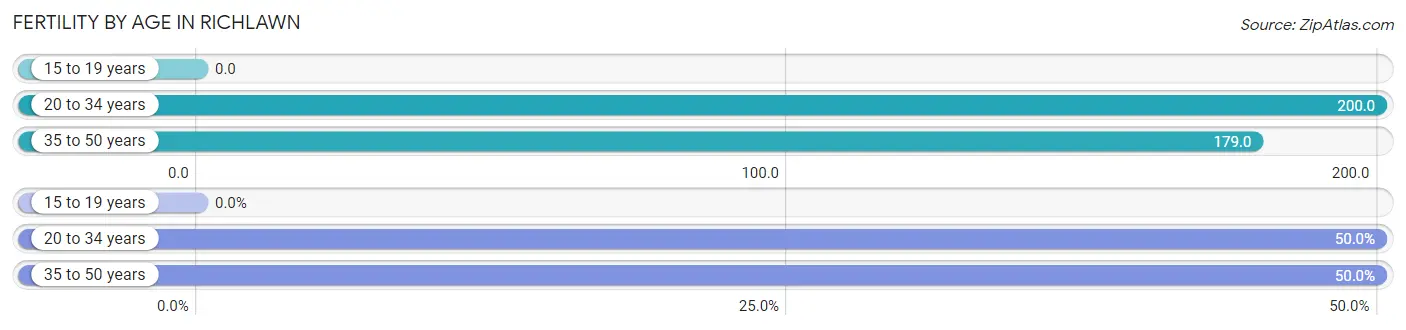
| Age Bracket | Women with Births | Births / 1,000 Women |
| 15 to 19 years | 0 (0.0%) | 0.0 |
| 20 to 34 years | 7 (50.0%) | 200.0 |
| 35 to 50 years | 7 (50.0%) | 179.0 |
| Total | 14 (100.0%) | 177.0 |
Fertility by Age by Marriage Status in Richlawn
92.9% of women with births (14) in Richlawn are married. The highest percentage of unmarried women with births falls into 35 to 50 years age bracket with 14.3% of them unmarried at the time of birth, while the lowest percentage of unmarried women with births belong to 20 to 34 years age bracket with 0.0% of them unmarried.
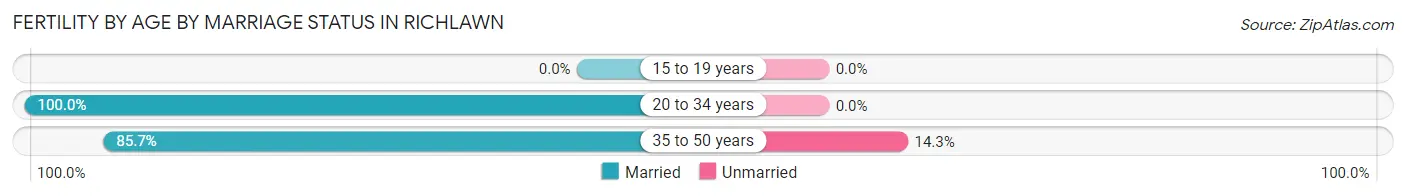
| Age Bracket | Married | Unmarried |
| 15 to 19 years | 0 (0.0%) | 0 (0.0%) |
| 20 to 34 years | 7 (100.0%) | 0 (0.0%) |
| 35 to 50 years | 6 (85.7%) | 1 (14.3%) |
| Total | 13 (92.9%) | 1 (7.1%) |
Fertility by Education in Richlawn
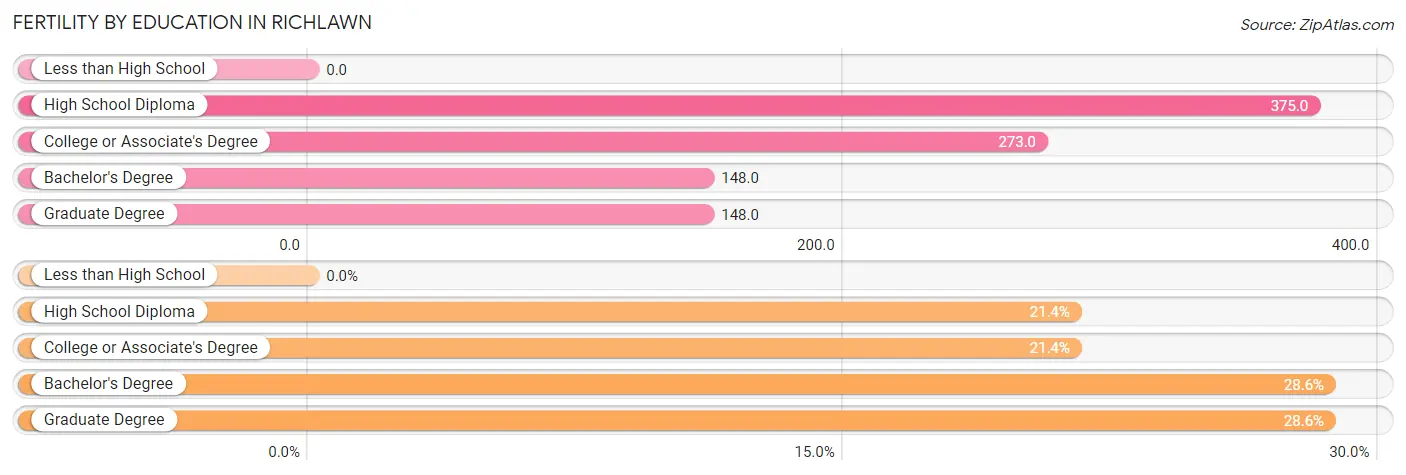
| Educational Attainment | Women with Births | Births / 1,000 Women |
| Less than High School | 0 (0.0%) | 0.0 |
| High School Diploma | 3 (21.4%) | 375.0 |
| College or Associate's Degree | 3 (21.4%) | 273.0 |
| Bachelor's Degree | 4 (28.6%) | 148.0 |
| Graduate Degree | 4 (28.6%) | 148.0 |
| Total | 14 (100.0%) | 177.0 |
Fertility by Education by Marriage Status in Richlawn
7.1% of women with births in Richlawn are unmarried. Women with the educational attainment of high school diploma are most likely to be married with 100.0% of them married at childbirth, while women with the educational attainment of college or associate's degree are least likely to be married with 33.3% of them unmarried at childbirth.
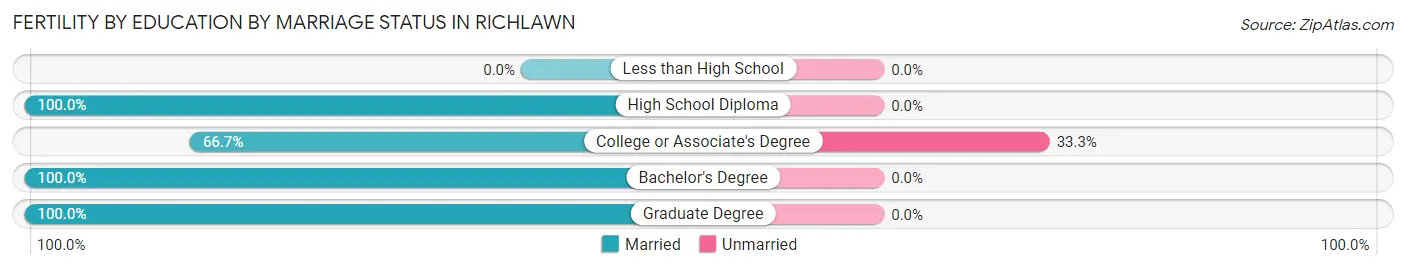
| Educational Attainment | Married | Unmarried |
| Less than High School | 0 (0.0%) | 0 (0.0%) |
| High School Diploma | 3 (100.0%) | 0 (0.0%) |
| College or Associate's Degree | 2 (66.7%) | 1 (33.3%) |
| Bachelor's Degree | 4 (100.0%) | 0 (0.0%) |
| Graduate Degree | 4 (100.0%) | 0 (0.0%) |
| Total | 13 (92.9%) | 1 (7.1%) |
Employment Characteristics in Richlawn
Employment by Class of Employer in Richlawn
Among the 219 employed individuals in Richlawn, private company employees (155 | 70.8%), self-employed (incorporated) (18 | 8.2%), and not-for-profit organizations (16 | 7.3%) make up the most common classes of employment.
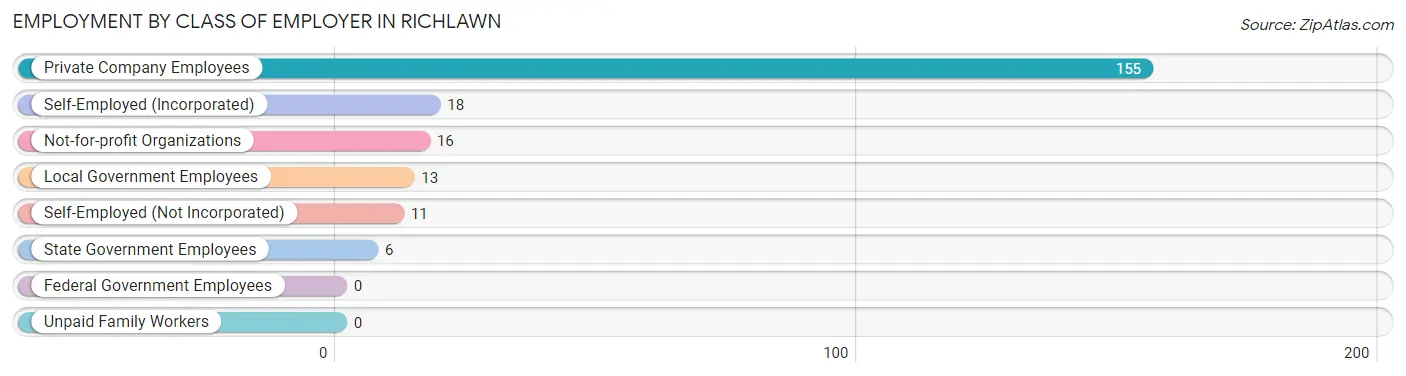
| Employer Class | # Employees | % Employees |
| Private Company Employees | 155 | 70.8% |
| Self-Employed (Incorporated) | 18 | 8.2% |
| Self-Employed (Not Incorporated) | 11 | 5.0% |
| Not-for-profit Organizations | 16 | 7.3% |
| Local Government Employees | 13 | 5.9% |
| State Government Employees | 6 | 2.7% |
| Federal Government Employees | 0 | 0.0% |
| Unpaid Family Workers | 0 | 0.0% |
| Total | 219 | 100.0% |
Employment Status by Age in Richlawn
According to the labor force statistics for Richlawn, out of the total population over 16 years of age (300), 75.3% or 226 individuals are in the labor force, with 2.7% or 6 of them unemployed. The age group with the highest labor force participation rate is 60 to 64 years, with 100.0% or 20 individuals in the labor force. Within the labor force, the 60 to 64 years age range has the highest percentage of unemployed individuals, with 10.0% or 2 of them being unemployed.
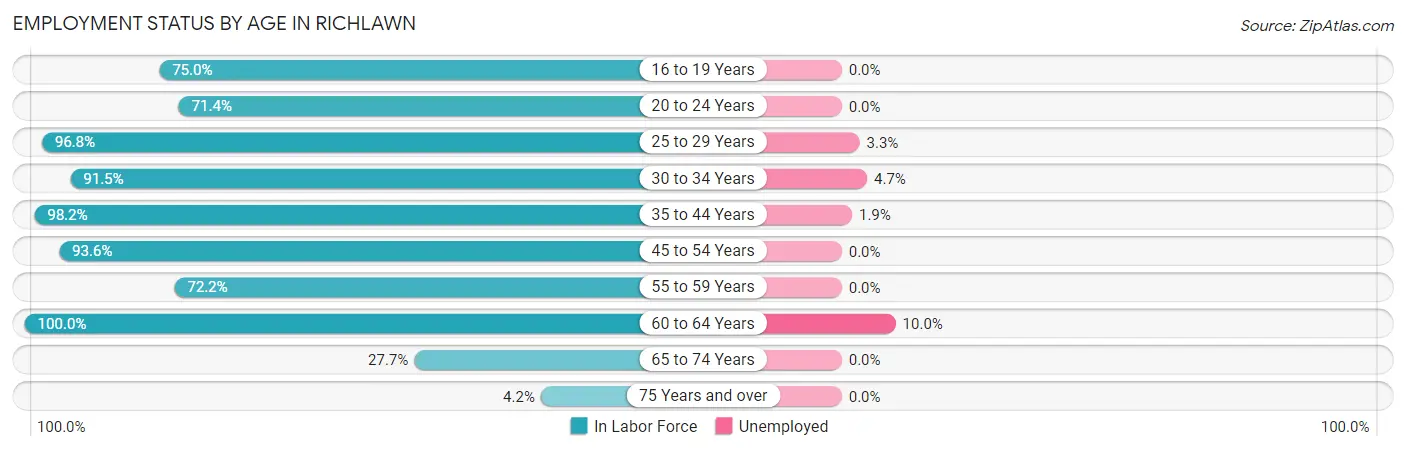
| Age Bracket | In Labor Force | Unemployed |
| 16 to 19 Years | 3 (75.0%) | 0 (0.0%) |
| 20 to 24 Years | 5 (71.4%) | 0 (0.0%) |
| 25 to 29 Years | 30 (96.8%) | 1 (3.3%) |
| 30 to 34 Years | 43 (91.5%) | 2 (4.7%) |
| 35 to 44 Years | 54 (98.2%) | 1 (1.9%) |
| 45 to 54 Years | 44 (93.6%) | 0 (0.0%) |
| 55 to 59 Years | 13 (72.2%) | 0 (0.0%) |
| 60 to 64 Years | 20 (100.0%) | 2 (10.0%) |
| 65 to 74 Years | 13 (27.7%) | 0 (0.0%) |
| 75 Years and over | 1 (4.2%) | 0 (0.0%) |
| Total | 226 (75.3%) | 6 (2.7%) |
Employment Status by Educational Attainment in Richlawn
According to labor force statistics for Richlawn, 93.6% of individuals (204) out of the total population between 25 and 64 years of age (218) are in the labor force, with 2.9% or 6 of them being unemployed. The group with the highest labor force participation rate are those with the educational attainment of bachelor's degree or higher, with 98.6% or 137 individuals in the labor force. Within the labor force, individuals with high school diploma education have the highest percentage of unemployment, with 4.5% or 1 of them being unemployed.
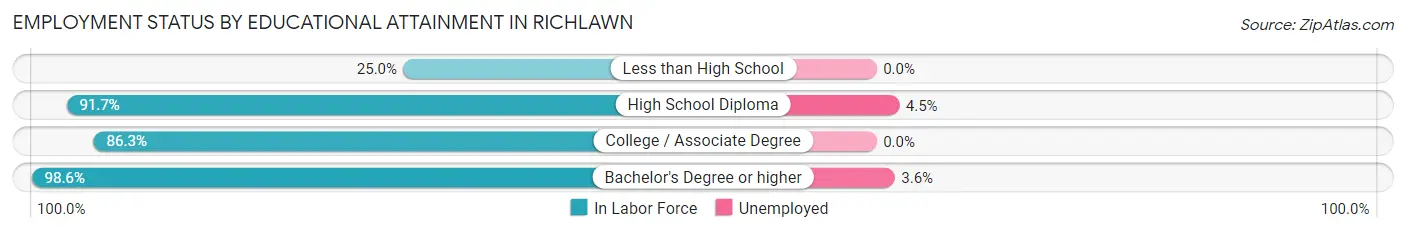
| Educational Attainment | In Labor Force | Unemployed |
| Less than High School | 1 (25.0%) | 0 (0.0%) |
| High School Diploma | 22 (91.7%) | 1 (4.5%) |
| College / Associate Degree | 44 (86.3%) | 0 (0.0%) |
| Bachelor's Degree or higher | 137 (98.6%) | 5 (3.6%) |
| Total | 204 (93.6%) | 6 (2.9%) |
Employment Occupations by Sex in Richlawn
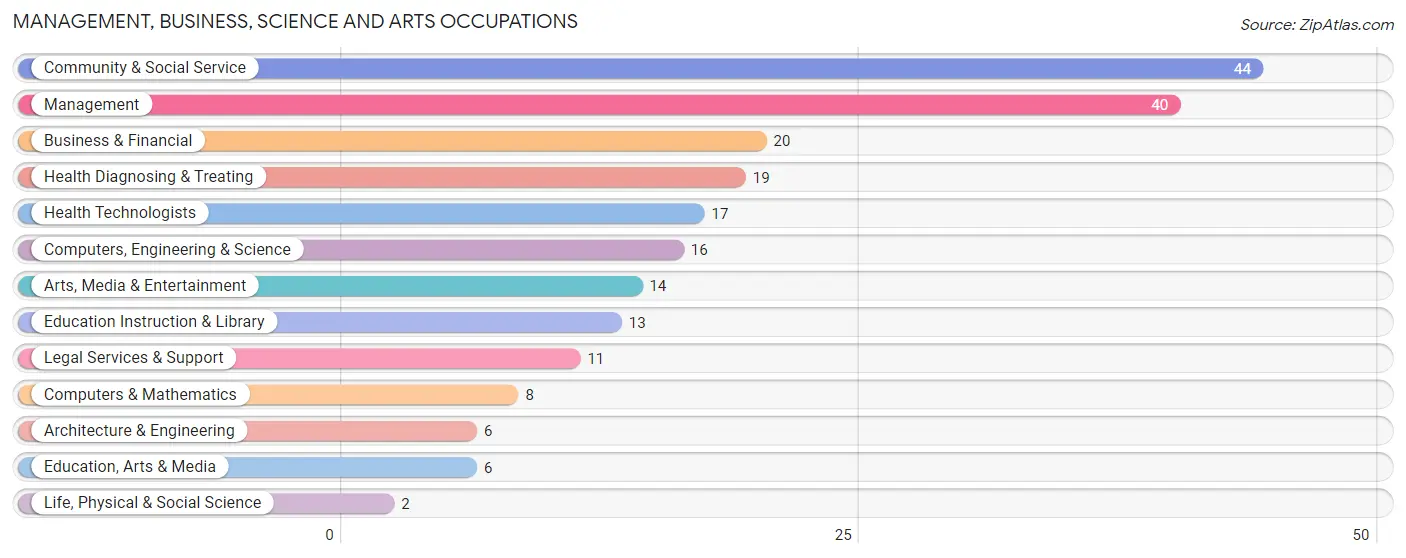
Management, Business, Science and Arts Occupations
The most common Management, Business, Science and Arts occupations in Richlawn are Community & Social Service (44 | 20.0%), Management (40 | 18.2%), Business & Financial (20 | 9.1%), Health Diagnosing & Treating (19 | 8.6%), and Health Technologists (17 | 7.7%).
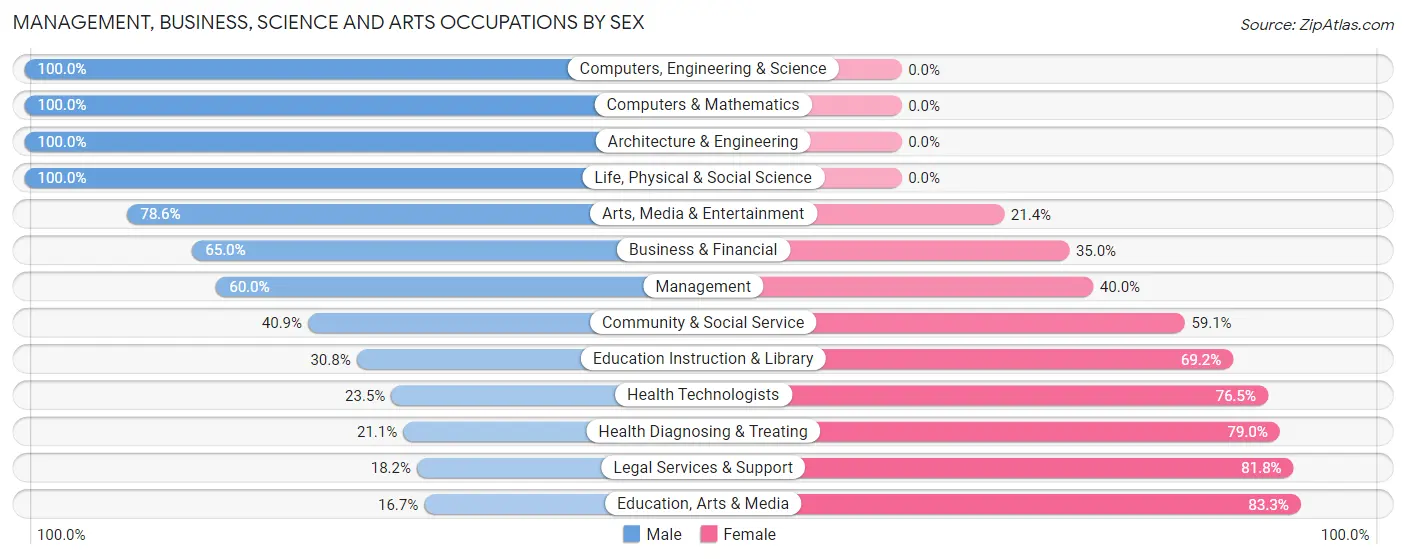
Management, Business, Science and Arts Occupations by Sex
Within the Management, Business, Science and Arts occupations in Richlawn, the most male-oriented occupations are Computers, Engineering & Science (100.0%), Computers & Mathematics (100.0%), and Architecture & Engineering (100.0%), while the most female-oriented occupations are Education, Arts & Media (83.3%), Legal Services & Support (81.8%), and Health Diagnosing & Treating (78.9%).
| Occupation | Male | Female |
| Management | 24 (60.0%) | 16 (40.0%) |
| Business & Financial | 13 (65.0%) | 7 (35.0%) |
| Computers, Engineering & Science | 16 (100.0%) | 0 (0.0%) |
| Computers & Mathematics | 8 (100.0%) | 0 (0.0%) |
| Architecture & Engineering | 6 (100.0%) | 0 (0.0%) |
| Life, Physical & Social Science | 2 (100.0%) | 0 (0.0%) |
| Community & Social Service | 18 (40.9%) | 26 (59.1%) |
| Education, Arts & Media | 1 (16.7%) | 5 (83.3%) |
| Legal Services & Support | 2 (18.2%) | 9 (81.8%) |
| Education Instruction & Library | 4 (30.8%) | 9 (69.2%) |
| Arts, Media & Entertainment | 11 (78.6%) | 3 (21.4%) |
| Health Diagnosing & Treating | 4 (21.0%) | 15 (78.9%) |
| Health Technologists | 4 (23.5%) | 13 (76.5%) |
| Total (Category) | 75 (54.0%) | 64 (46.0%) |
| Total (Overall) | 132 (60.0%) | 88 (40.0%) |
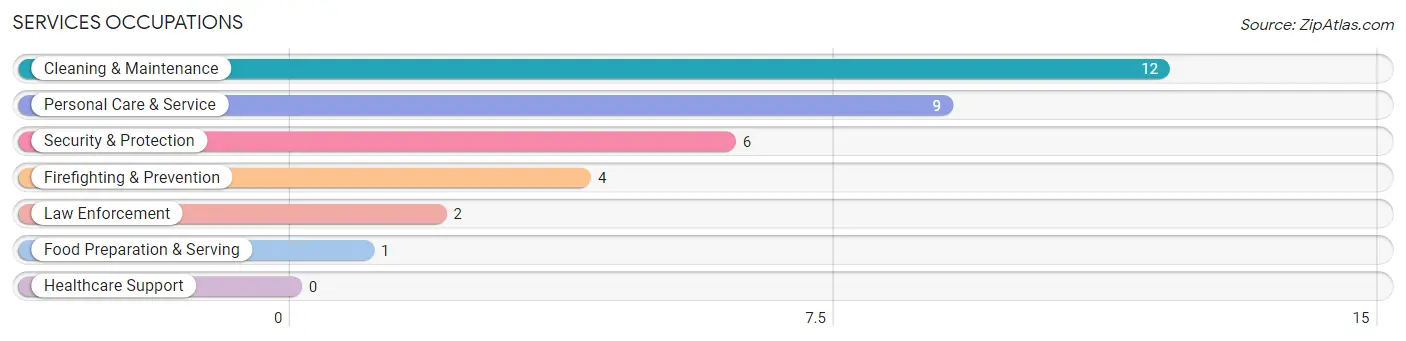
Services Occupations
The most common Services occupations in Richlawn are Cleaning & Maintenance (12 | 5.4%), Personal Care & Service (9 | 4.1%), Security & Protection (6 | 2.7%), Firefighting & Prevention (4 | 1.8%), and Law Enforcement (2 | 0.9%).
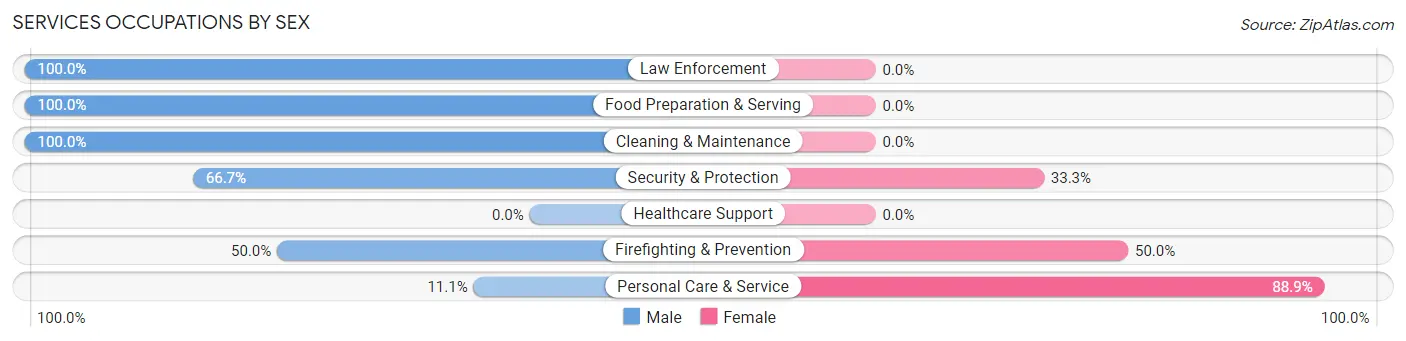
Services Occupations by Sex
Within the Services occupations in Richlawn, the most male-oriented occupations are Law Enforcement (100.0%), Food Preparation & Serving (100.0%), and Cleaning & Maintenance (100.0%), while the most female-oriented occupations are Personal Care & Service (88.9%), Firefighting & Prevention (50.0%), and Security & Protection (33.3%).
| Occupation | Male | Female |
| Healthcare Support | 0 (0.0%) | 0 (0.0%) |
| Security & Protection | 4 (66.7%) | 2 (33.3%) |
| Firefighting & Prevention | 2 (50.0%) | 2 (50.0%) |
| Law Enforcement | 2 (100.0%) | 0 (0.0%) |
| Food Preparation & Serving | 1 (100.0%) | 0 (0.0%) |
| Cleaning & Maintenance | 12 (100.0%) | 0 (0.0%) |
| Personal Care & Service | 1 (11.1%) | 8 (88.9%) |
| Total (Category) | 18 (64.3%) | 10 (35.7%) |
| Total (Overall) | 132 (60.0%) | 88 (40.0%) |
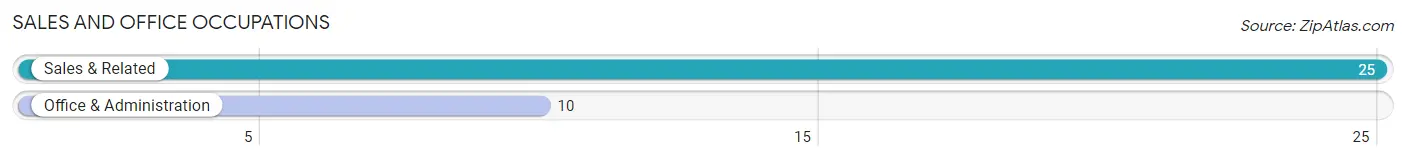
Sales and Office Occupations
The most common Sales and Office occupations in Richlawn are Sales & Related (25 | 11.4%), and Office & Administration (10 | 4.5%).
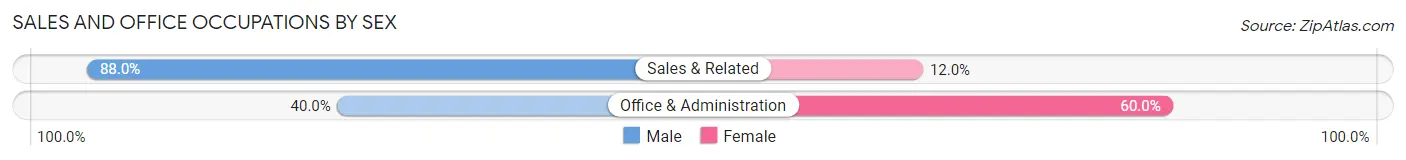
Sales and Office Occupations by Sex
| Occupation | Male | Female |
| Sales & Related | 22 (88.0%) | 3 (12.0%) |
| Office & Administration | 4 (40.0%) | 6 (60.0%) |
| Total (Category) | 26 (74.3%) | 9 (25.7%) |
| Total (Overall) | 132 (60.0%) | 88 (40.0%) |
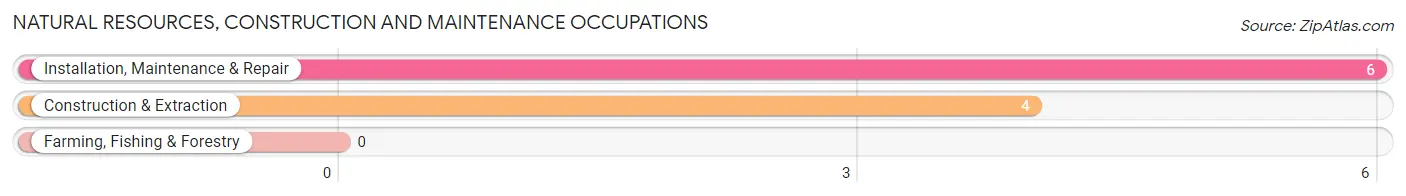
Natural Resources, Construction and Maintenance Occupations
The most common Natural Resources, Construction and Maintenance occupations in Richlawn are Installation, Maintenance & Repair (6 | 2.7%), and Construction & Extraction (4 | 1.8%).
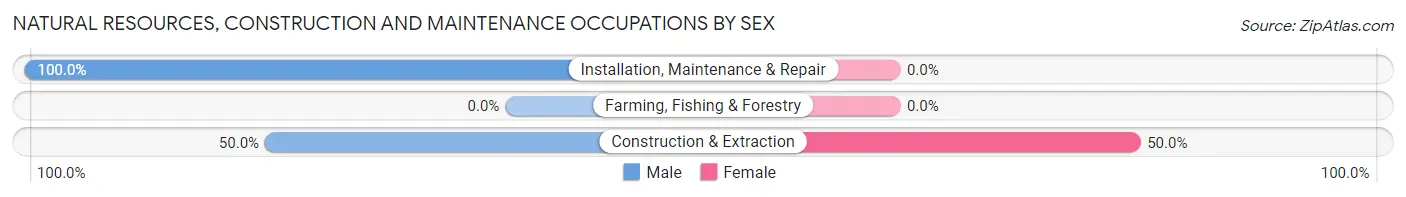
Natural Resources, Construction and Maintenance Occupations by Sex
| Occupation | Male | Female |
| Farming, Fishing & Forestry | 0 (0.0%) | 0 (0.0%) |
| Construction & Extraction | 2 (50.0%) | 2 (50.0%) |
| Installation, Maintenance & Repair | 6 (100.0%) | 0 (0.0%) |
| Total (Category) | 8 (80.0%) | 2 (20.0%) |
| Total (Overall) | 132 (60.0%) | 88 (40.0%) |
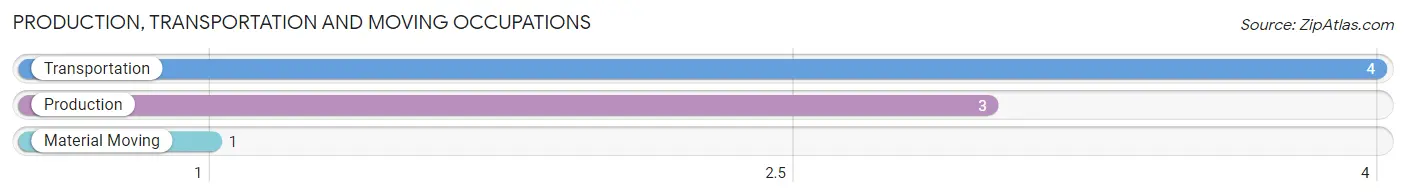
Production, Transportation and Moving Occupations
The most common Production, Transportation and Moving occupations in Richlawn are Transportation (4 | 1.8%), Production (3 | 1.4%), and Material Moving (1 | 0.4%).
Production, Transportation and Moving Occupations by Sex
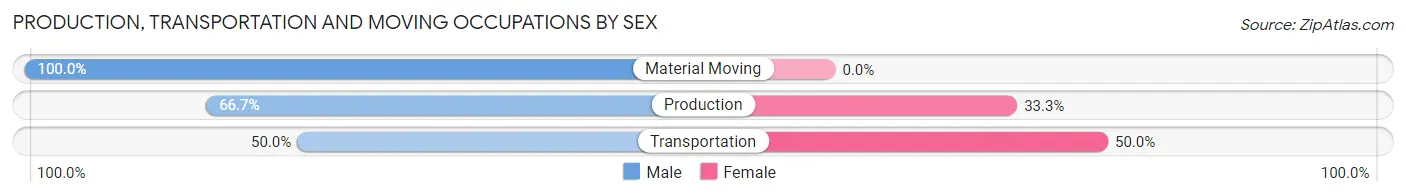
| Occupation | Male | Female |
| Production | 2 (66.7%) | 1 (33.3%) |
| Transportation | 2 (50.0%) | 2 (50.0%) |
| Material Moving | 1 (100.0%) | 0 (0.0%) |
| Total (Category) | 5 (62.5%) | 3 (37.5%) |
| Total (Overall) | 132 (60.0%) | 88 (40.0%) |
Employment Industries by Sex in Richlawn
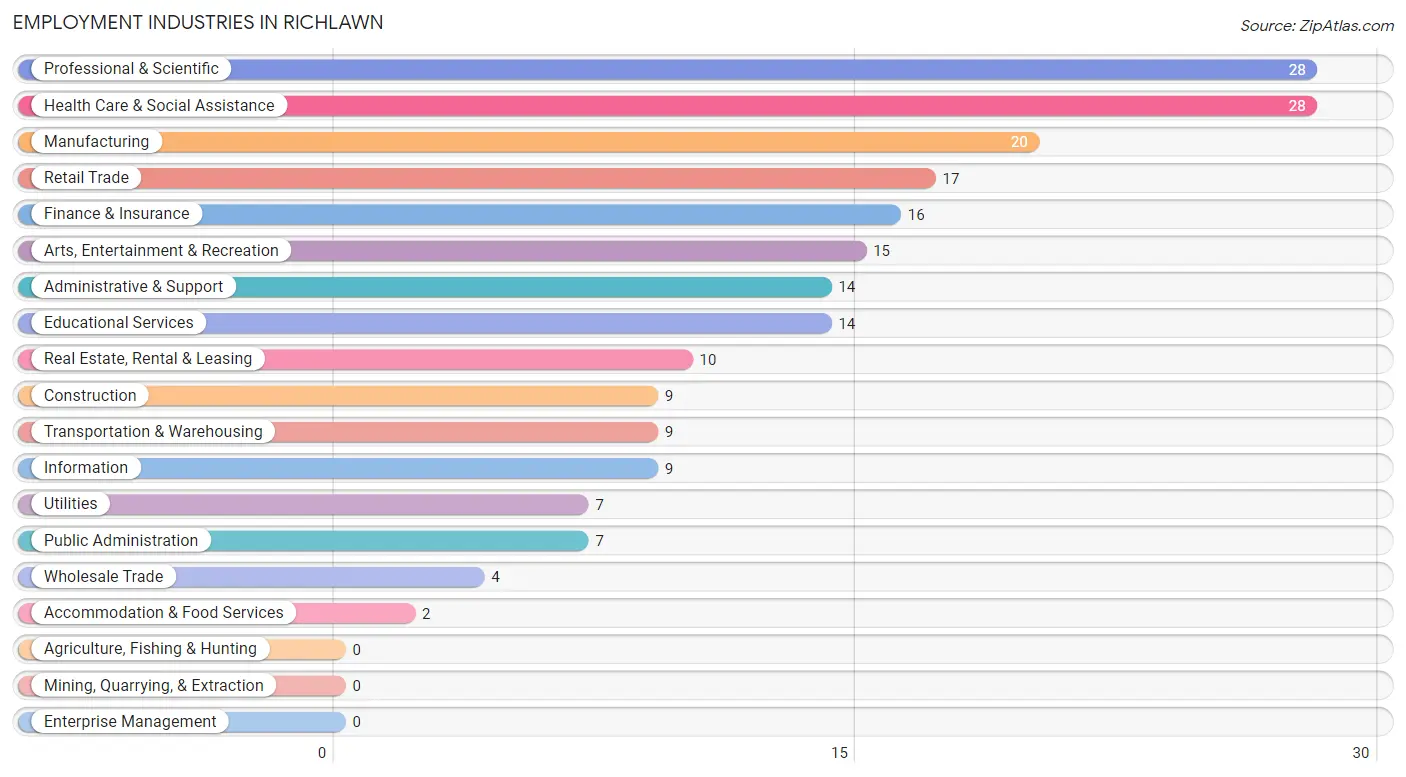
Employment Industries in Richlawn
The major employment industries in Richlawn include Professional & Scientific (28 | 12.7%), Health Care & Social Assistance (28 | 12.7%), Manufacturing (20 | 9.1%), Retail Trade (17 | 7.7%), and Finance & Insurance (16 | 7.3%).
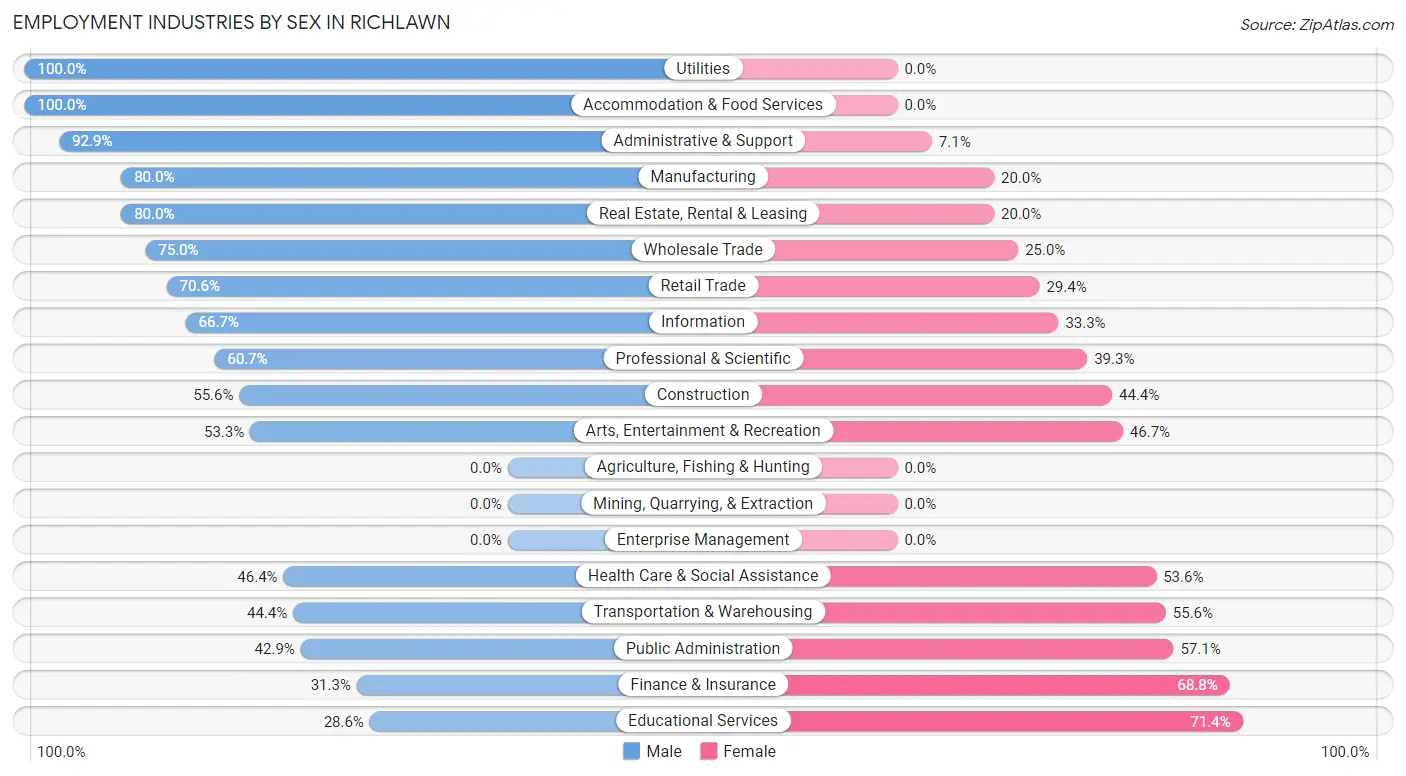
Employment Industries by Sex in Richlawn
The Richlawn industries that see more men than women are Utilities (100.0%), Accommodation & Food Services (100.0%), and Administrative & Support (92.9%), whereas the industries that tend to have a higher number of women are Educational Services (71.4%), Finance & Insurance (68.8%), and Public Administration (57.1%).
| Industry | Male | Female |
| Agriculture, Fishing & Hunting | 0 (0.0%) | 0 (0.0%) |
| Mining, Quarrying, & Extraction | 0 (0.0%) | 0 (0.0%) |
| Construction | 5 (55.6%) | 4 (44.4%) |
| Manufacturing | 16 (80.0%) | 4 (20.0%) |
| Wholesale Trade | 3 (75.0%) | 1 (25.0%) |
| Retail Trade | 12 (70.6%) | 5 (29.4%) |
| Transportation & Warehousing | 4 (44.4%) | 5 (55.6%) |
| Utilities | 7 (100.0%) | 0 (0.0%) |
| Information | 6 (66.7%) | 3 (33.3%) |
| Finance & Insurance | 5 (31.2%) | 11 (68.8%) |
| Real Estate, Rental & Leasing | 8 (80.0%) | 2 (20.0%) |
| Professional & Scientific | 17 (60.7%) | 11 (39.3%) |
| Enterprise Management | 0 (0.0%) | 0 (0.0%) |
| Administrative & Support | 13 (92.9%) | 1 (7.1%) |
| Educational Services | 4 (28.6%) | 10 (71.4%) |
| Health Care & Social Assistance | 13 (46.4%) | 15 (53.6%) |
| Arts, Entertainment & Recreation | 8 (53.3%) | 7 (46.7%) |
| Accommodation & Food Services | 2 (100.0%) | 0 (0.0%) |
| Public Administration | 3 (42.9%) | 4 (57.1%) |
| Total | 132 (60.0%) | 88 (40.0%) |
Education in Richlawn
School Enrollment in Richlawn
The most common levels of schooling among the 49 students in Richlawn are nursery / preschool (13 | 26.5%), high school (8 | 16.3%), and elementary school (7 | 14.3%).
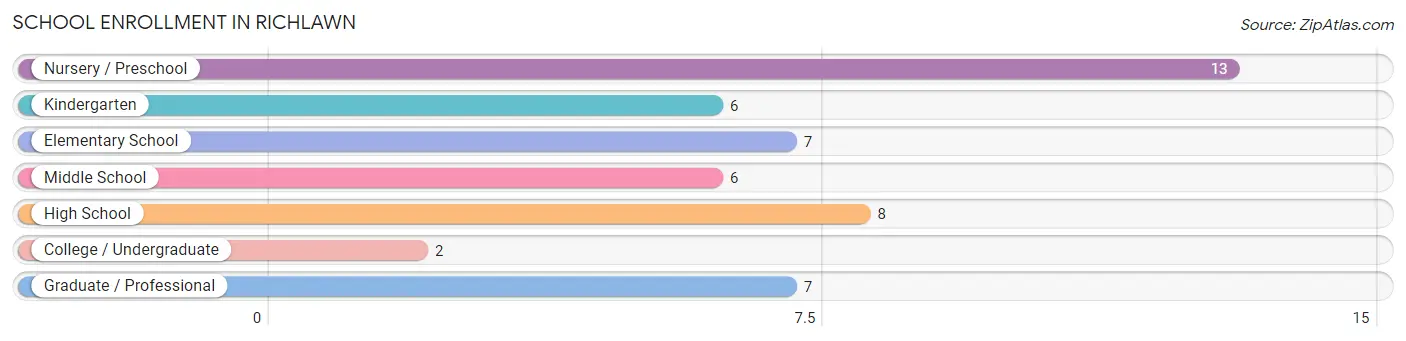
| School Level | # Students | % Students |
| Nursery / Preschool | 13 | 26.5% |
| Kindergarten | 6 | 12.2% |
| Elementary School | 7 | 14.3% |
| Middle School | 6 | 12.2% |
| High School | 8 | 16.3% |
| College / Undergraduate | 2 | 4.1% |
| Graduate / Professional | 7 | 14.3% |
| Total | 49 | 100.0% |
School Enrollment by Age by Funding Source in Richlawn
Out of a total of 49 students who are enrolled in schools in Richlawn, 27 (55.1%) attend a private institution, while the remaining 22 (44.9%) are enrolled in public schools. The age group of 18 to 19 year olds has the highest likelihood of being enrolled in private schools, with 2 (100.0% in the age bracket) enrolled. Conversely, the age group of 25 to 34 year olds has the lowest likelihood of being enrolled in a private school, with 5 (100.0% in the age bracket) attending a public institution.
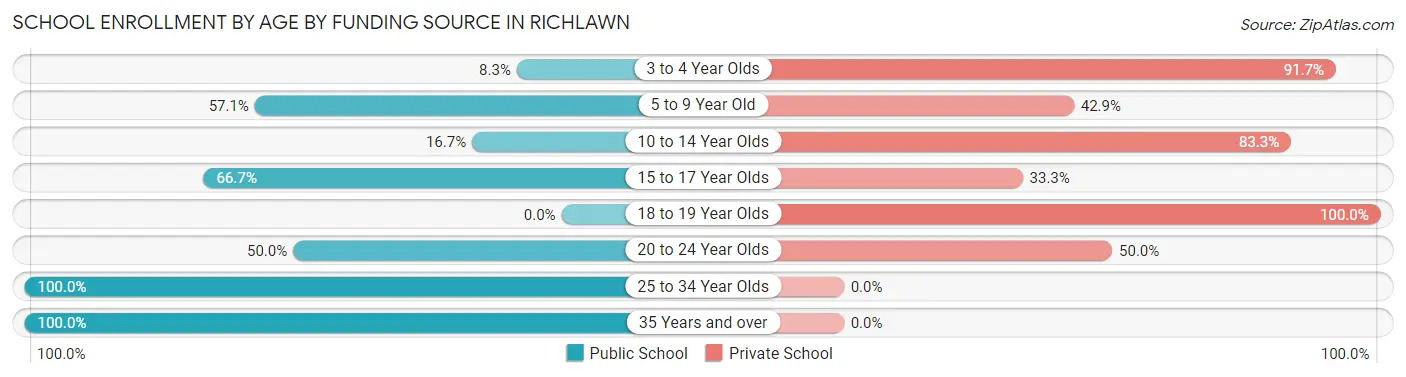
| Age Bracket | Public School | Private School |
| 3 to 4 Year Olds | 1 (8.3%) | 11 (91.7%) |
| 5 to 9 Year Old | 8 (57.1%) | 6 (42.9%) |
| 10 to 14 Year Olds | 1 (16.7%) | 5 (83.3%) |
| 15 to 17 Year Olds | 4 (66.7%) | 2 (33.3%) |
| 18 to 19 Year Olds | 0 (0.0%) | 2 (100.0%) |
| 20 to 24 Year Olds | 1 (50.0%) | 1 (50.0%) |
| 25 to 34 Year Olds | 5 (100.0%) | 0 (0.0%) |
| 35 Years and over | 2 (100.0%) | 0 (0.0%) |
| Total | 22 (44.9%) | 27 (55.1%) |
Educational Attainment by Field of Study in Richlawn
Business (30 | 14.5%), social sciences (22 | 10.6%), bio, nature & agricultural (20 | 9.7%), science & technology (20 | 9.7%), and education (18 | 8.7%) are the most common fields of study among 207 individuals in Richlawn who have obtained a bachelor's degree or higher.
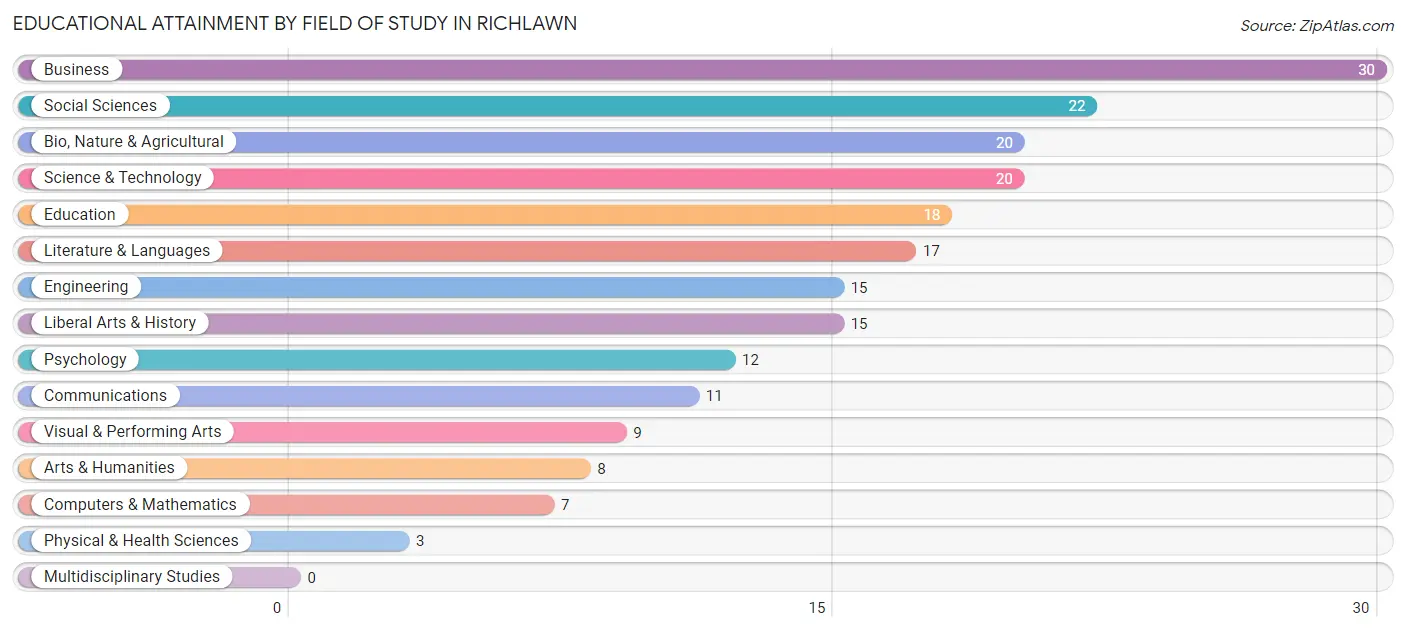
| Field of Study | # Graduates | % Graduates |
| Computers & Mathematics | 7 | 3.4% |
| Bio, Nature & Agricultural | 20 | 9.7% |
| Physical & Health Sciences | 3 | 1.5% |
| Psychology | 12 | 5.8% |
| Social Sciences | 22 | 10.6% |
| Engineering | 15 | 7.2% |
| Multidisciplinary Studies | 0 | 0.0% |
| Science & Technology | 20 | 9.7% |
| Business | 30 | 14.5% |
| Education | 18 | 8.7% |
| Literature & Languages | 17 | 8.2% |
| Liberal Arts & History | 15 | 7.2% |
| Visual & Performing Arts | 9 | 4.3% |
| Communications | 11 | 5.3% |
| Arts & Humanities | 8 | 3.9% |
| Total | 207 | 100.0% |
Transportation & Commute in Richlawn
Vehicle Availability by Sex in Richlawn
The most prevalent vehicle ownership categories in Richlawn are males with 2 vehicles (64, accounting for 48.8%) and females with 2 vehicles (48, making up 72.7%).
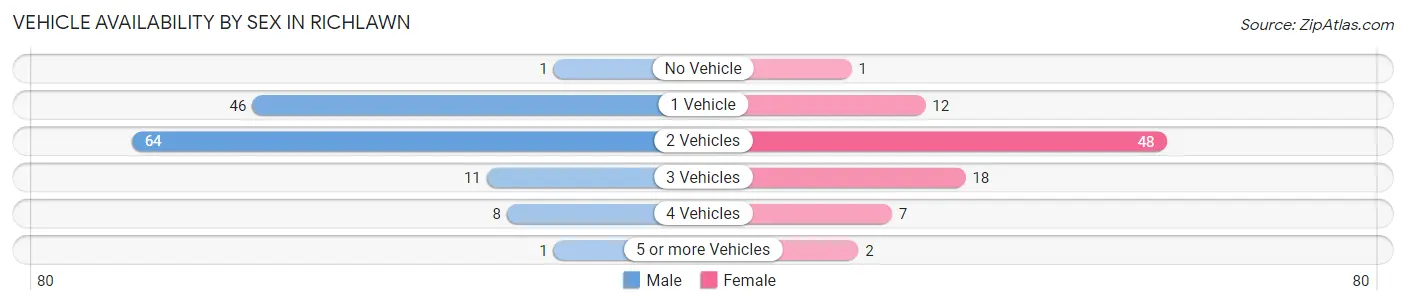
| Vehicles Available | Male | Female |
| No Vehicle | 1 (0.8%) | 1 (1.1%) |
| 1 Vehicle | 46 (35.1%) | 12 (13.6%) |
| 2 Vehicles | 64 (48.8%) | 48 (54.5%) |
| 3 Vehicles | 11 (8.4%) | 18 (20.4%) |
| 4 Vehicles | 8 (6.1%) | 7 (8.0%) |
| 5 or more Vehicles | 1 (0.8%) | 2 (2.3%) |
| Total | 131 (100.0%) | 88 (100.0%) |
Commute Time in Richlawn
The most frequently occuring commute durations in Richlawn are 15 to 19 minutes (43 commuters, 23.4%), 20 to 24 minutes (37 commuters, 20.1%), and 5 to 9 minutes (30 commuters, 16.3%).
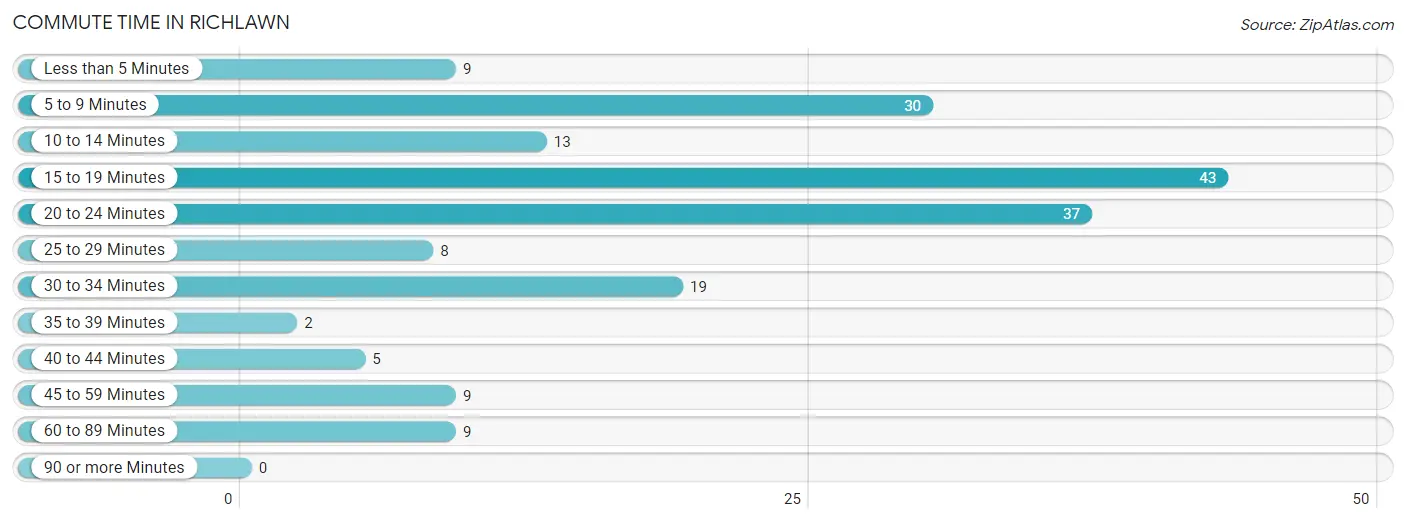
| Commute Time | # Commuters | % Commuters |
| Less than 5 Minutes | 9 | 4.9% |
| 5 to 9 Minutes | 30 | 16.3% |
| 10 to 14 Minutes | 13 | 7.1% |
| 15 to 19 Minutes | 43 | 23.4% |
| 20 to 24 Minutes | 37 | 20.1% |
| 25 to 29 Minutes | 8 | 4.3% |
| 30 to 34 Minutes | 19 | 10.3% |
| 35 to 39 Minutes | 2 | 1.1% |
| 40 to 44 Minutes | 5 | 2.7% |
| 45 to 59 Minutes | 9 | 4.9% |
| 60 to 89 Minutes | 9 | 4.9% |
| 90 or more Minutes | 0 | 0.0% |
Commute Time by Sex in Richlawn
The most common commute times in Richlawn are 20 to 24 minutes (25 commuters, 23.4%) for males and 15 to 19 minutes (27 commuters, 35.1%) for females.
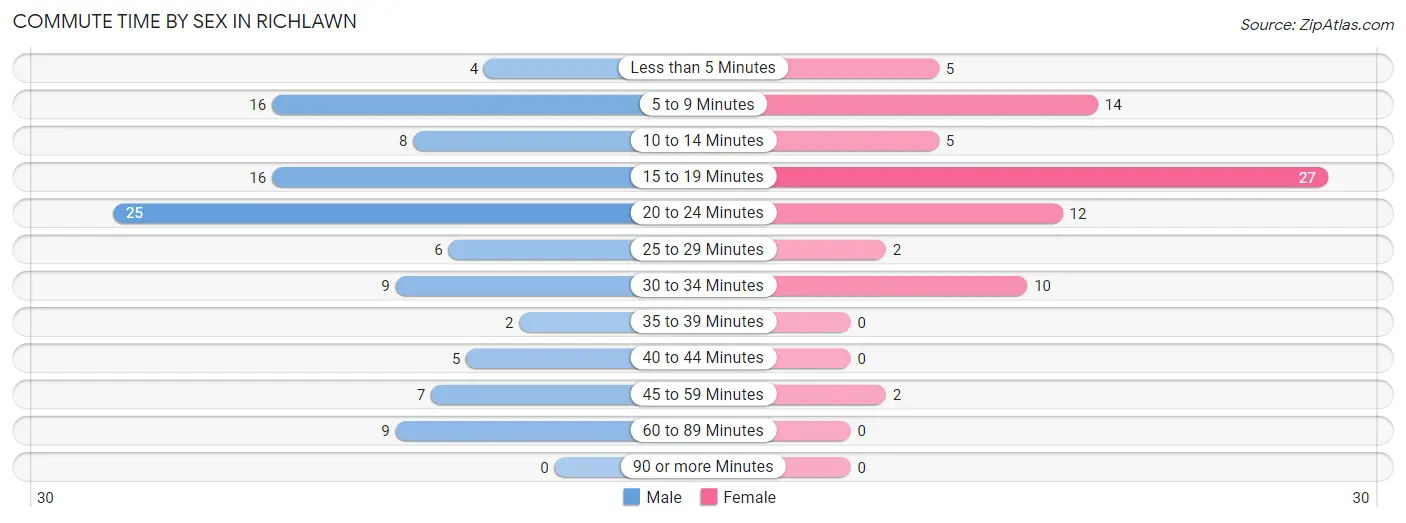
| Commute Time | Male | Female |
| Less than 5 Minutes | 4 (3.7%) | 5 (6.5%) |
| 5 to 9 Minutes | 16 (14.9%) | 14 (18.2%) |
| 10 to 14 Minutes | 8 (7.5%) | 5 (6.5%) |
| 15 to 19 Minutes | 16 (14.9%) | 27 (35.1%) |
| 20 to 24 Minutes | 25 (23.4%) | 12 (15.6%) |
| 25 to 29 Minutes | 6 (5.6%) | 2 (2.6%) |
| 30 to 34 Minutes | 9 (8.4%) | 10 (13.0%) |
| 35 to 39 Minutes | 2 (1.9%) | 0 (0.0%) |
| 40 to 44 Minutes | 5 (4.7%) | 0 (0.0%) |
| 45 to 59 Minutes | 7 (6.5%) | 2 (2.6%) |
| 60 to 89 Minutes | 9 (8.4%) | 0 (0.0%) |
| 90 or more Minutes | 0 (0.0%) | 0 (0.0%) |
Time of Departure to Work by Sex in Richlawn
The most frequent times of departure to work in Richlawn are 8:00 AM to 8:29 AM (38, 35.5%) for males and 8:00 AM to 8:29 AM (17, 22.1%) for females.
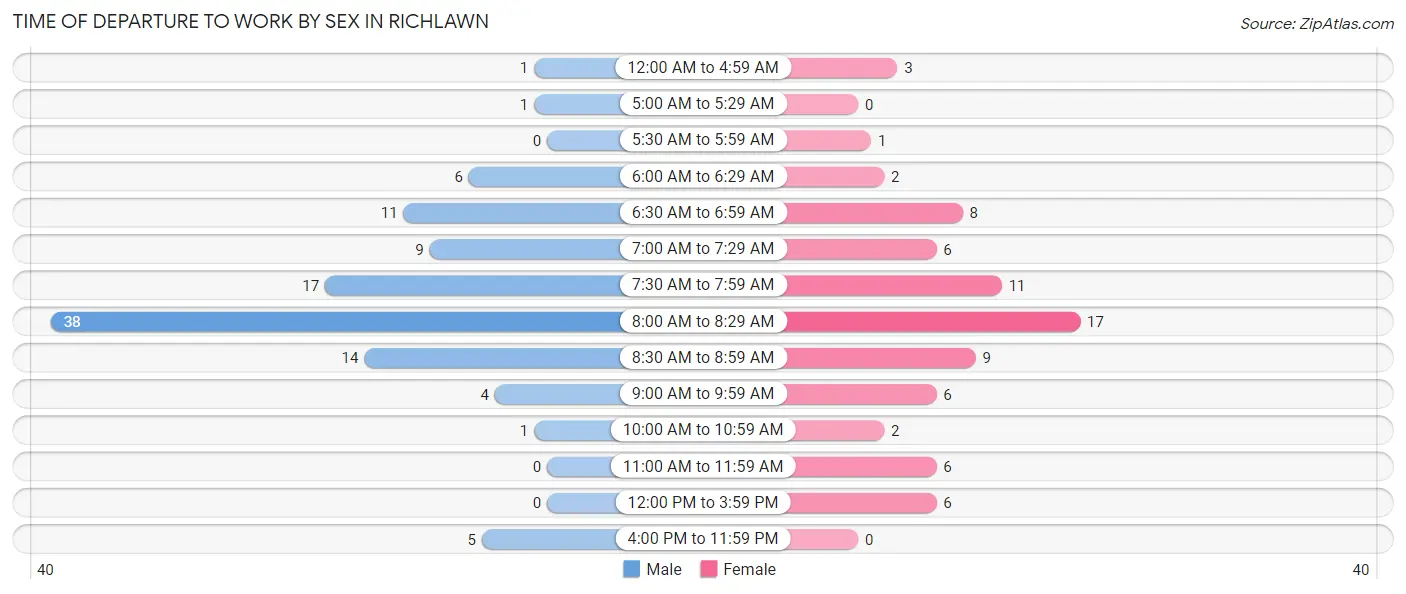
| Time of Departure | Male | Female |
| 12:00 AM to 4:59 AM | 1 (0.9%) | 3 (3.9%) |
| 5:00 AM to 5:29 AM | 1 (0.9%) | 0 (0.0%) |
| 5:30 AM to 5:59 AM | 0 (0.0%) | 1 (1.3%) |
| 6:00 AM to 6:29 AM | 6 (5.6%) | 2 (2.6%) |
| 6:30 AM to 6:59 AM | 11 (10.3%) | 8 (10.4%) |
| 7:00 AM to 7:29 AM | 9 (8.4%) | 6 (7.8%) |
| 7:30 AM to 7:59 AM | 17 (15.9%) | 11 (14.3%) |
| 8:00 AM to 8:29 AM | 38 (35.5%) | 17 (22.1%) |
| 8:30 AM to 8:59 AM | 14 (13.1%) | 9 (11.7%) |
| 9:00 AM to 9:59 AM | 4 (3.7%) | 6 (7.8%) |
| 10:00 AM to 10:59 AM | 1 (0.9%) | 2 (2.6%) |
| 11:00 AM to 11:59 AM | 0 (0.0%) | 6 (7.8%) |
| 12:00 PM to 3:59 PM | 0 (0.0%) | 6 (7.8%) |
| 4:00 PM to 11:59 PM | 5 (4.7%) | 0 (0.0%) |
| Total | 107 (100.0%) | 77 (100.0%) |
Housing Occupancy in Richlawn
Occupancy by Ownership in Richlawn
Of the total 180 dwellings in Richlawn, owner-occupied units account for 159 (88.3%), while renter-occupied units make up 21 (11.7%).
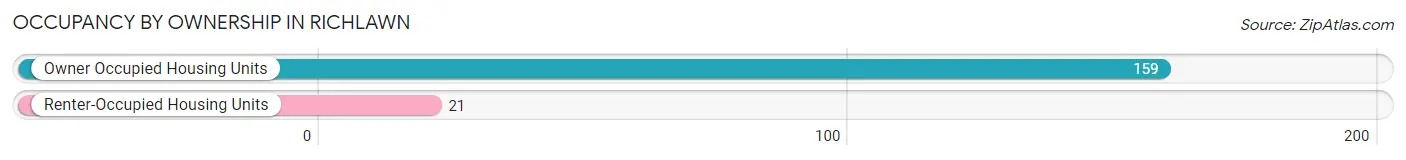
| Occupancy | # Housing Units | % Housing Units |
| Owner Occupied Housing Units | 159 | 88.3% |
| Renter-Occupied Housing Units | 21 | 11.7% |
| Total Occupied Housing Units | 180 | 100.0% |
Occupancy by Household Size in Richlawn
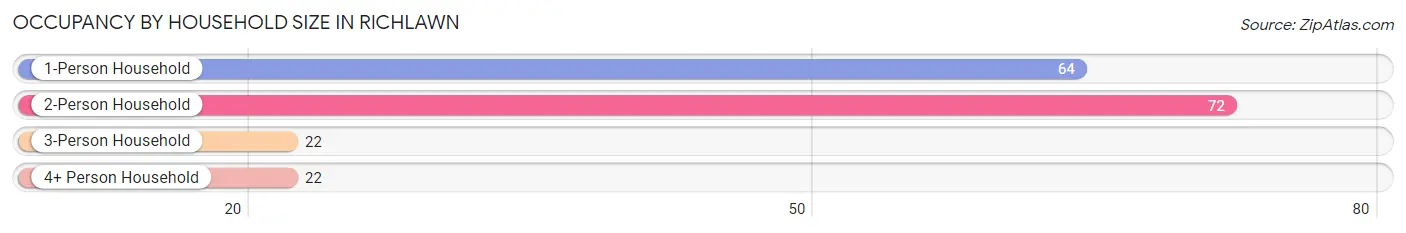
| Household Size | # Housing Units | % Housing Units |
| 1-Person Household | 64 | 35.6% |
| 2-Person Household | 72 | 40.0% |
| 3-Person Household | 22 | 12.2% |
| 4+ Person Household | 22 | 12.2% |
| Total Housing Units | 180 | 100.0% |
Occupancy by Ownership by Household Size in Richlawn
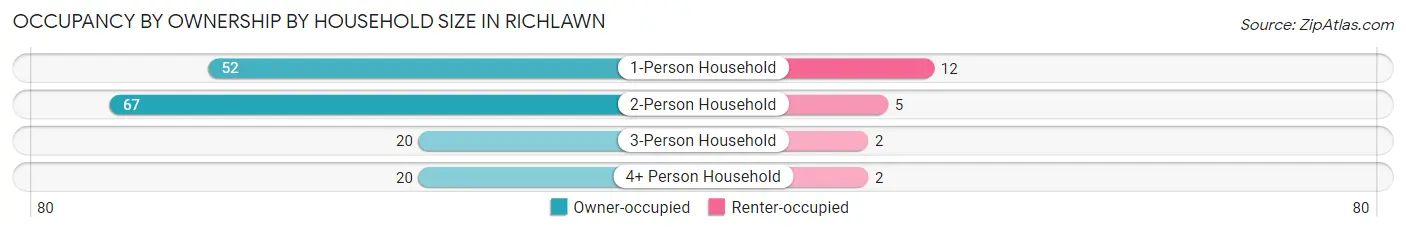
| Household Size | Owner-occupied | Renter-occupied |
| 1-Person Household | 52 (81.2%) | 12 (18.8%) |
| 2-Person Household | 67 (93.1%) | 5 (6.9%) |
| 3-Person Household | 20 (90.9%) | 2 (9.1%) |
| 4+ Person Household | 20 (90.9%) | 2 (9.1%) |
| Total Housing Units | 159 (88.3%) | 21 (11.7%) |
Occupancy by Educational Attainment in Richlawn
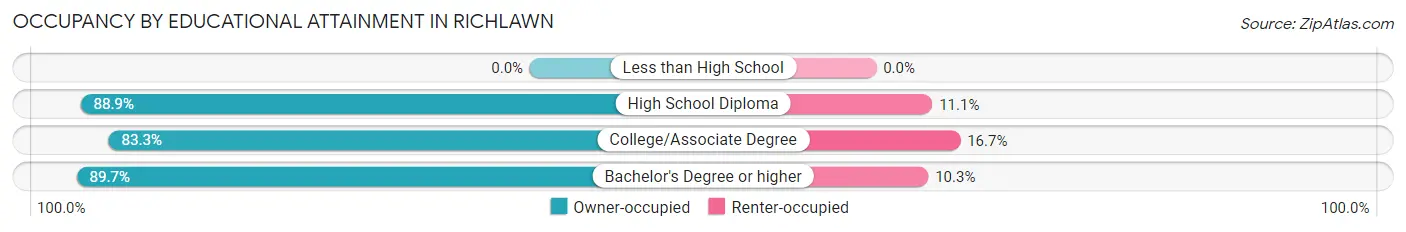
| Household Size | Owner-occupied | Renter-occupied |
| Less than High School | 0 (0.0%) | 0 (0.0%) |
| High School Diploma | 16 (88.9%) | 2 (11.1%) |
| College/Associate Degree | 30 (83.3%) | 6 (16.7%) |
| Bachelor's Degree or higher | 113 (89.7%) | 13 (10.3%) |
Occupancy by Age of Householder in Richlawn
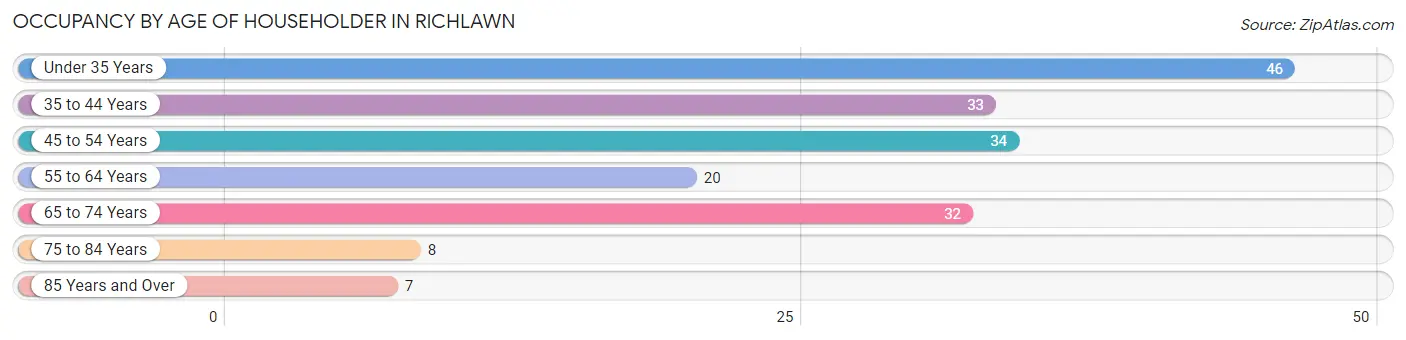
| Age Bracket | # Households | % Households |
| Under 35 Years | 46 | 25.6% |
| 35 to 44 Years | 33 | 18.3% |
| 45 to 54 Years | 34 | 18.9% |
| 55 to 64 Years | 20 | 11.1% |
| 65 to 74 Years | 32 | 17.8% |
| 75 to 84 Years | 8 | 4.4% |
| 85 Years and Over | 7 | 3.9% |
| Total | 180 | 100.0% |
Housing Finances in Richlawn
Median Income by Occupancy in Richlawn
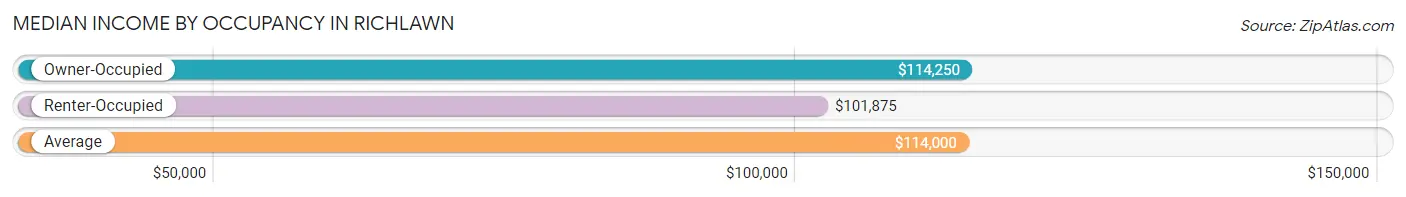
| Occupancy Type | # Households | Median Income |
| Owner-Occupied | 159 (88.3%) | $114,250 |
| Renter-Occupied | 21 (11.7%) | $101,875 |
| Average | 180 (100.0%) | $114,000 |
Occupancy by Householder Income Bracket in Richlawn
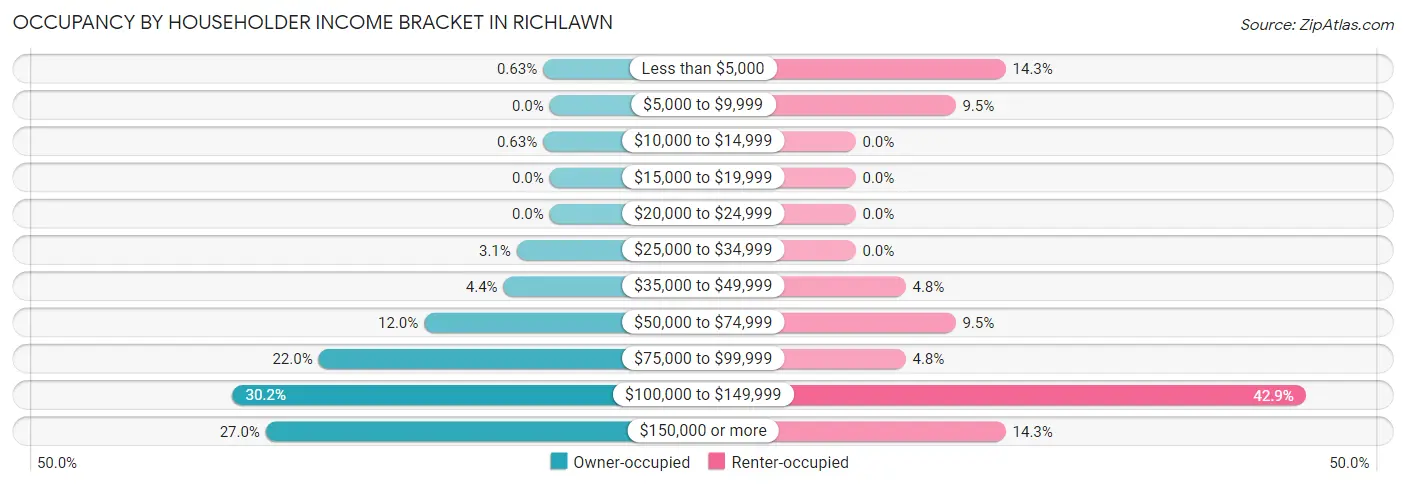
| Income Bracket | Owner-occupied | Renter-occupied |
| Less than $5,000 | 1 (0.6%) | 3 (14.3%) |
| $5,000 to $9,999 | 0 (0.0%) | 2 (9.5%) |
| $10,000 to $14,999 | 1 (0.6%) | 0 (0.0%) |
| $15,000 to $19,999 | 0 (0.0%) | 0 (0.0%) |
| $20,000 to $24,999 | 0 (0.0%) | 0 (0.0%) |
| $25,000 to $34,999 | 5 (3.1%) | 0 (0.0%) |
| $35,000 to $49,999 | 7 (4.4%) | 1 (4.8%) |
| $50,000 to $74,999 | 19 (11.9%) | 2 (9.5%) |
| $75,000 to $99,999 | 35 (22.0%) | 1 (4.8%) |
| $100,000 to $149,999 | 48 (30.2%) | 9 (42.9%) |
| $150,000 or more | 43 (27.0%) | 3 (14.3%) |
| Total | 159 (100.0%) | 21 (100.0%) |
Monthly Housing Cost Tiers in Richlawn
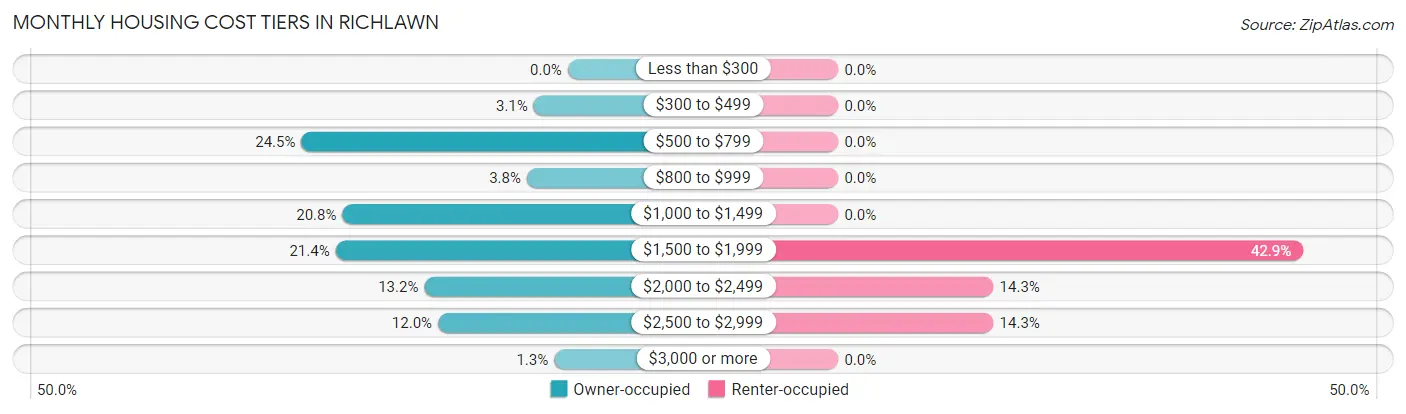
| Monthly Cost | Owner-occupied | Renter-occupied |
| Less than $300 | 0 (0.0%) | 0 (0.0%) |
| $300 to $499 | 5 (3.1%) | 0 (0.0%) |
| $500 to $799 | 39 (24.5%) | 0 (0.0%) |
| $800 to $999 | 6 (3.8%) | 0 (0.0%) |
| $1,000 to $1,499 | 33 (20.7%) | 0 (0.0%) |
| $1,500 to $1,999 | 34 (21.4%) | 9 (42.9%) |
| $2,000 to $2,499 | 21 (13.2%) | 3 (14.3%) |
| $2,500 to $2,999 | 19 (11.9%) | 3 (14.3%) |
| $3,000 or more | 2 (1.3%) | 0 (0.0%) |
| Total | 159 (100.0%) | 21 (100.0%) |
Physical Housing Characteristics in Richlawn
Housing Structures in Richlawn
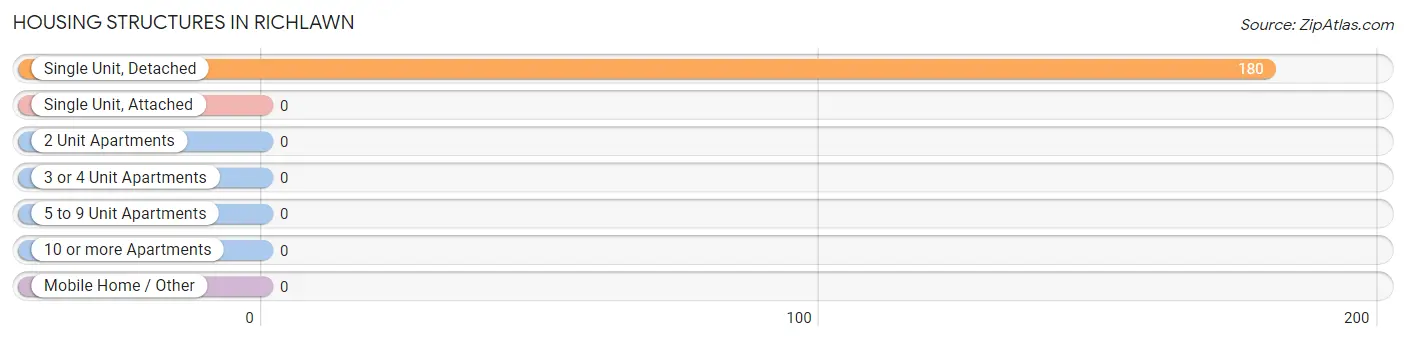
| Structure Type | # Housing Units | % Housing Units |
| Single Unit, Detached | 180 | 100.0% |
| Single Unit, Attached | 0 | 0.0% |
| 2 Unit Apartments | 0 | 0.0% |
| 3 or 4 Unit Apartments | 0 | 0.0% |
| 5 to 9 Unit Apartments | 0 | 0.0% |
| 10 or more Apartments | 0 | 0.0% |
| Mobile Home / Other | 0 | 0.0% |
| Total | 180 | 100.0% |
Housing Structures by Occupancy in Richlawn
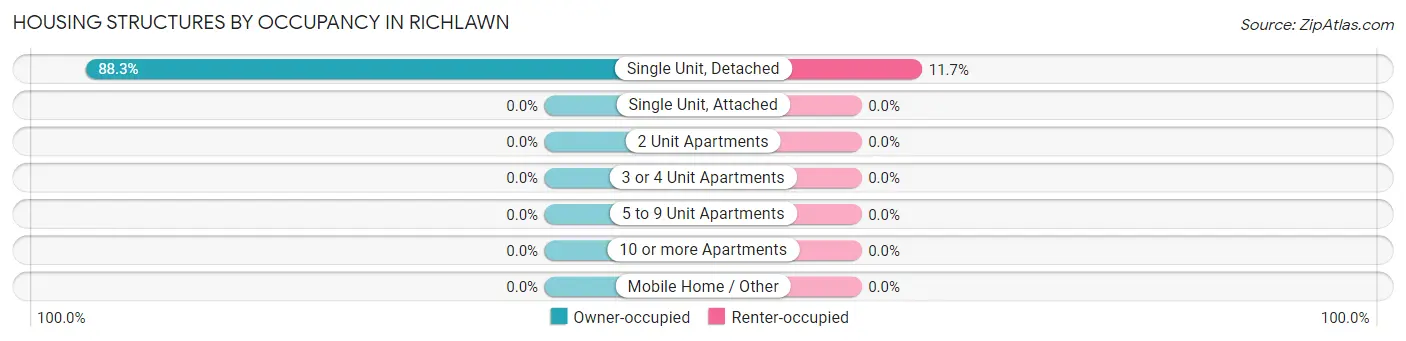
| Structure Type | Owner-occupied | Renter-occupied |
| Single Unit, Detached | 159 (88.3%) | 21 (11.7%) |
| Single Unit, Attached | 0 (0.0%) | 0 (0.0%) |
| 2 Unit Apartments | 0 (0.0%) | 0 (0.0%) |
| 3 or 4 Unit Apartments | 0 (0.0%) | 0 (0.0%) |
| 5 to 9 Unit Apartments | 0 (0.0%) | 0 (0.0%) |
| 10 or more Apartments | 0 (0.0%) | 0 (0.0%) |
| Mobile Home / Other | 0 (0.0%) | 0 (0.0%) |
| Total | 159 (88.3%) | 21 (11.7%) |
Housing Structures by Number of Rooms in Richlawn
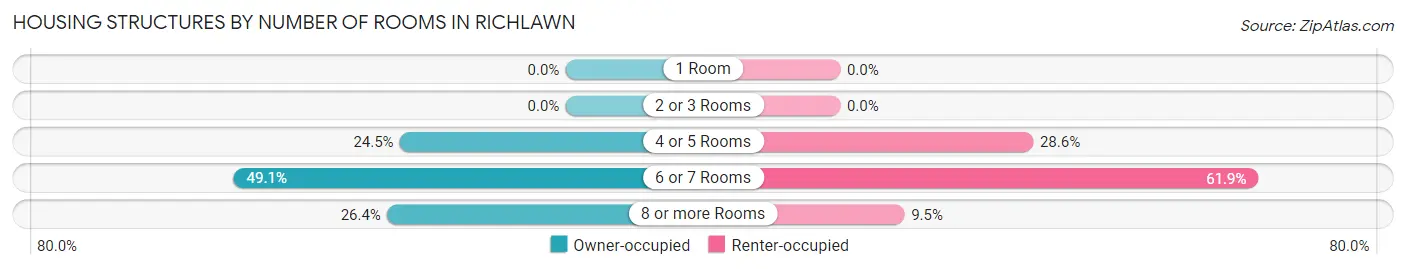
| Number of Rooms | Owner-occupied | Renter-occupied |
| 1 Room | 0 (0.0%) | 0 (0.0%) |
| 2 or 3 Rooms | 0 (0.0%) | 0 (0.0%) |
| 4 or 5 Rooms | 39 (24.5%) | 6 (28.6%) |
| 6 or 7 Rooms | 78 (49.1%) | 13 (61.9%) |
| 8 or more Rooms | 42 (26.4%) | 2 (9.5%) |
| Total | 159 (100.0%) | 21 (100.0%) |
Housing Structure by Heating Type in Richlawn
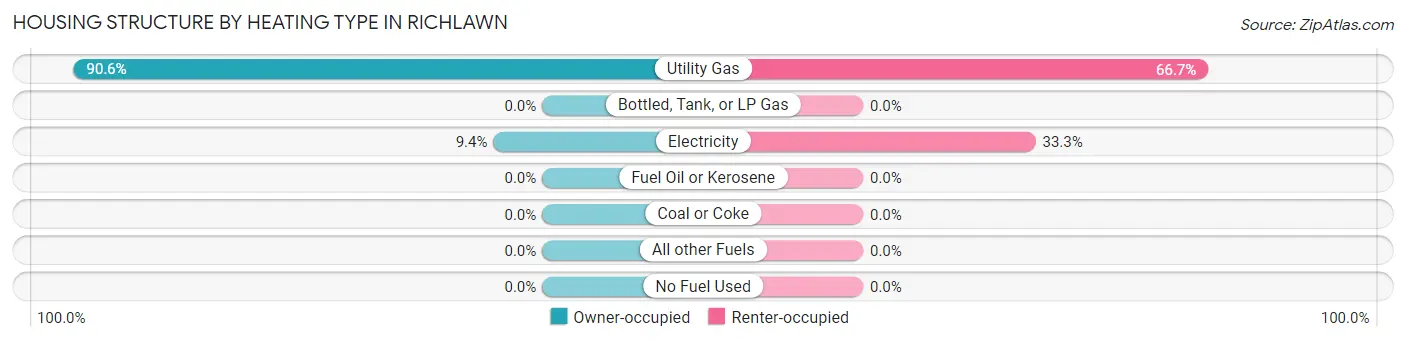
| Heating Type | Owner-occupied | Renter-occupied |
| Utility Gas | 144 (90.6%) | 14 (66.7%) |
| Bottled, Tank, or LP Gas | 0 (0.0%) | 0 (0.0%) |
| Electricity | 15 (9.4%) | 7 (33.3%) |
| Fuel Oil or Kerosene | 0 (0.0%) | 0 (0.0%) |
| Coal or Coke | 0 (0.0%) | 0 (0.0%) |
| All other Fuels | 0 (0.0%) | 0 (0.0%) |
| No Fuel Used | 0 (0.0%) | 0 (0.0%) |
| Total | 159 (100.0%) | 21 (100.0%) |
Household Vehicle Usage in Richlawn
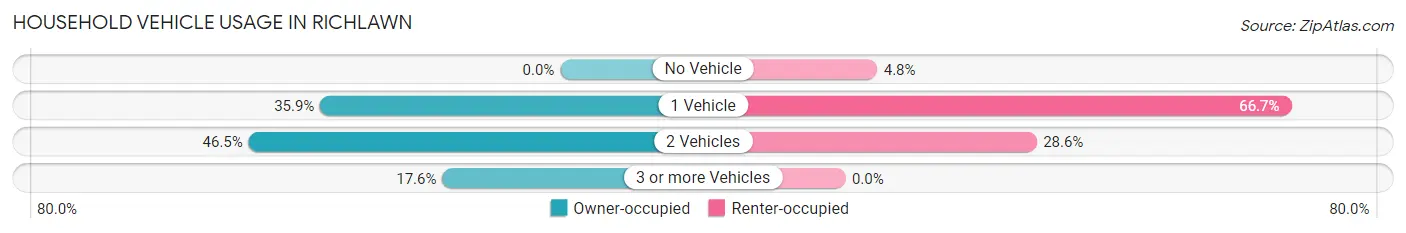
| Vehicles per Household | Owner-occupied | Renter-occupied |
| No Vehicle | 0 (0.0%) | 1 (4.8%) |
| 1 Vehicle | 57 (35.8%) | 14 (66.7%) |
| 2 Vehicles | 74 (46.5%) | 6 (28.6%) |
| 3 or more Vehicles | 28 (17.6%) | 0 (0.0%) |
| Total | 159 (100.0%) | 21 (100.0%) |
Real Estate & Mortgages in Richlawn
Real Estate and Mortgage Overview in Richlawn
| Characteristic | Without Mortgage | With Mortgage |
| Housing Units | 52 | 107 |
| Median Property Value | $385,700 | $364,600 |
| Median Household Income | $92,083 | $35 |
| Monthly Housing Costs | $650 | $2 |
| Real Estate Taxes | $2,375 | $0 |
Property Value by Mortgage Status in Richlawn
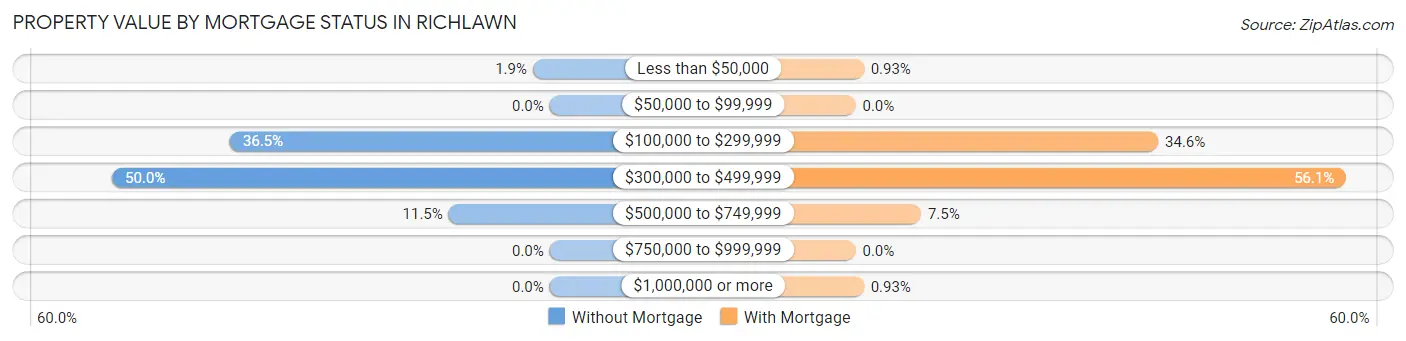
| Property Value | Without Mortgage | With Mortgage |
| Less than $50,000 | 1 (1.9%) | 1 (0.9%) |
| $50,000 to $99,999 | 0 (0.0%) | 0 (0.0%) |
| $100,000 to $299,999 | 19 (36.5%) | 37 (34.6%) |
| $300,000 to $499,999 | 26 (50.0%) | 60 (56.1%) |
| $500,000 to $749,999 | 6 (11.5%) | 8 (7.5%) |
| $750,000 to $999,999 | 0 (0.0%) | 0 (0.0%) |
| $1,000,000 or more | 0 (0.0%) | 1 (0.9%) |
| Total | 52 (100.0%) | 107 (100.0%) |
Household Income by Mortgage Status in Richlawn
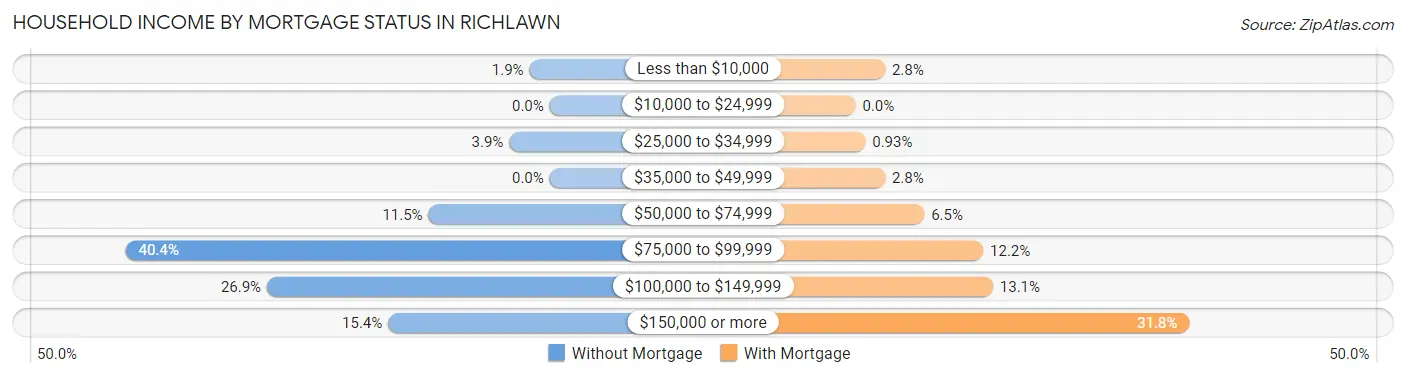
| Household Income | Without Mortgage | With Mortgage |
| Less than $10,000 | 1 (1.9%) | 3 (2.8%) |
| $10,000 to $24,999 | 0 (0.0%) | 0 (0.0%) |
| $25,000 to $34,999 | 2 (3.8%) | 1 (0.9%) |
| $35,000 to $49,999 | 0 (0.0%) | 3 (2.8%) |
| $50,000 to $74,999 | 6 (11.5%) | 7 (6.5%) |
| $75,000 to $99,999 | 21 (40.4%) | 13 (12.1%) |
| $100,000 to $149,999 | 14 (26.9%) | 14 (13.1%) |
| $150,000 or more | 8 (15.4%) | 34 (31.8%) |
| Total | 52 (100.0%) | 107 (100.0%) |
Property Value to Household Income Ratio in Richlawn
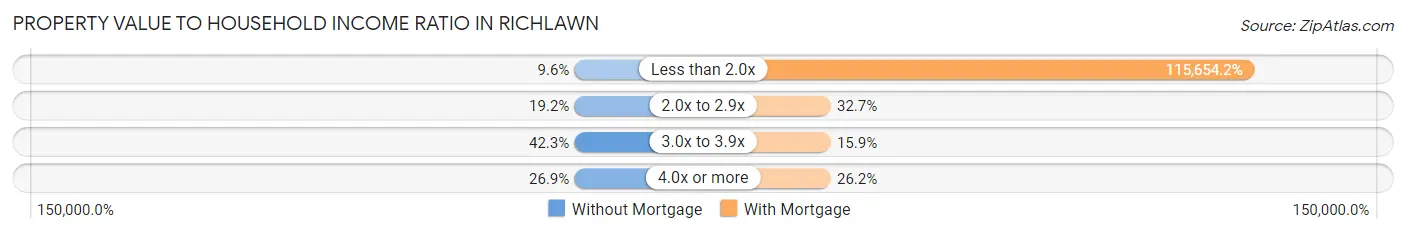
| Value-to-Income Ratio | Without Mortgage | With Mortgage |
| Less than 2.0x | 5 (9.6%) | 123,750 (115,654.2%) |
| 2.0x to 2.9x | 10 (19.2%) | 35 (32.7%) |
| 3.0x to 3.9x | 22 (42.3%) | 17 (15.9%) |
| 4.0x or more | 14 (26.9%) | 28 (26.2%) |
| Total | 52 (100.0%) | 107 (100.0%) |
Real Estate Taxes by Mortgage Status in Richlawn
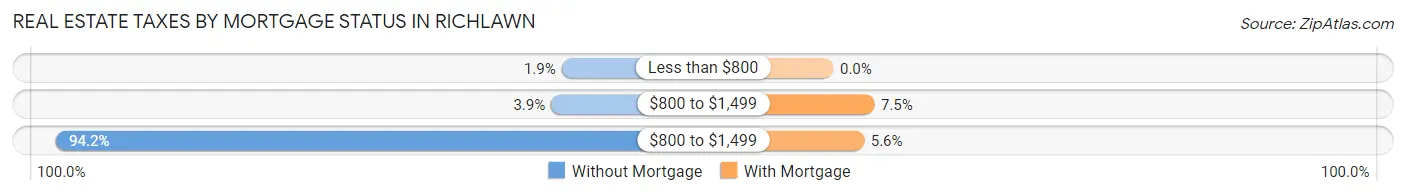
| Property Taxes | Without Mortgage | With Mortgage |
| Less than $800 | 1 (1.9%) | 0 (0.0%) |
| $800 to $1,499 | 2 (3.8%) | 8 (7.5%) |
| $800 to $1,499 | 49 (94.2%) | 6 (5.6%) |
| Total | 52 (100.0%) | 107 (100.0%) |
Health & Disability in Richlawn
Health Insurance Coverage by Age in Richlawn
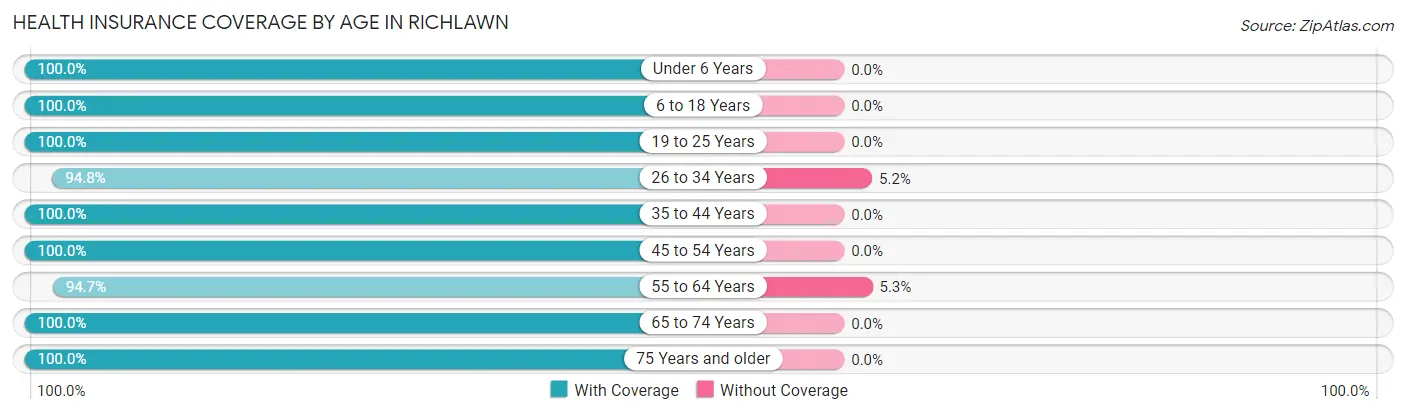
| Age Bracket | With Coverage | Without Coverage |
| Under 6 Years | 40 (100.0%) | 0 (0.0%) |
| 6 to 18 Years | 25 (100.0%) | 0 (0.0%) |
| 19 to 25 Years | 8 (100.0%) | 0 (0.0%) |
| 26 to 34 Years | 73 (94.8%) | 4 (5.2%) |
| 35 to 44 Years | 55 (100.0%) | 0 (0.0%) |
| 45 to 54 Years | 47 (100.0%) | 0 (0.0%) |
| 55 to 64 Years | 36 (94.7%) | 2 (5.3%) |
| 65 to 74 Years | 47 (100.0%) | 0 (0.0%) |
| 75 Years and older | 24 (100.0%) | 0 (0.0%) |
| Total | 355 (98.3%) | 6 (1.7%) |
Health Insurance Coverage by Citizenship Status in Richlawn
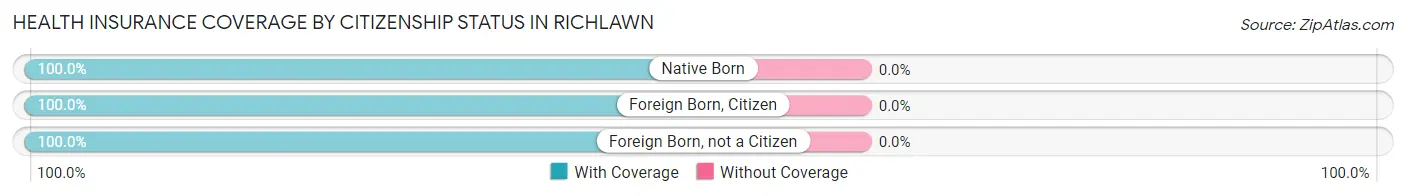
| Citizenship Status | With Coverage | Without Coverage |
| Native Born | 40 (100.0%) | 0 (0.0%) |
| Foreign Born, Citizen | 25 (100.0%) | 0 (0.0%) |
| Foreign Born, not a Citizen | 8 (100.0%) | 0 (0.0%) |
Health Insurance Coverage by Household Income in Richlawn
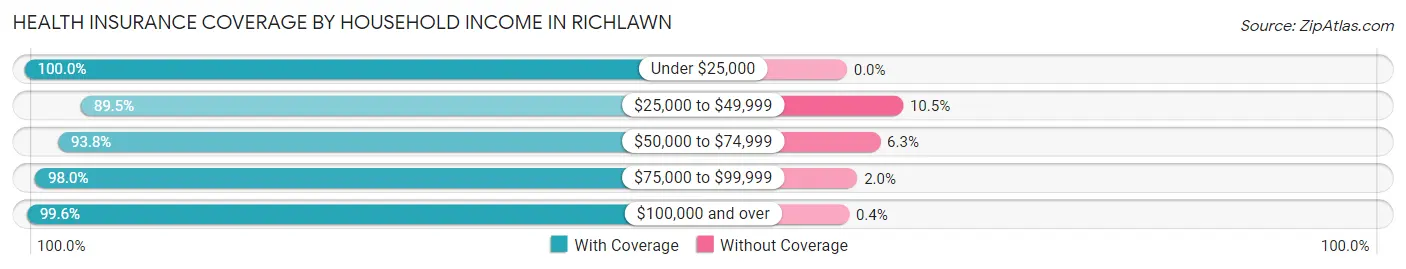
| Household Income | With Coverage | Without Coverage |
| Under $25,000 | 10 (100.0%) | 0 (0.0%) |
| $25,000 to $49,999 | 17 (89.5%) | 2 (10.5%) |
| $50,000 to $74,999 | 30 (93.8%) | 2 (6.2%) |
| $75,000 to $99,999 | 50 (98.0%) | 1 (2.0%) |
| $100,000 and over | 248 (99.6%) | 1 (0.4%) |
Public vs Private Health Insurance Coverage by Age in Richlawn
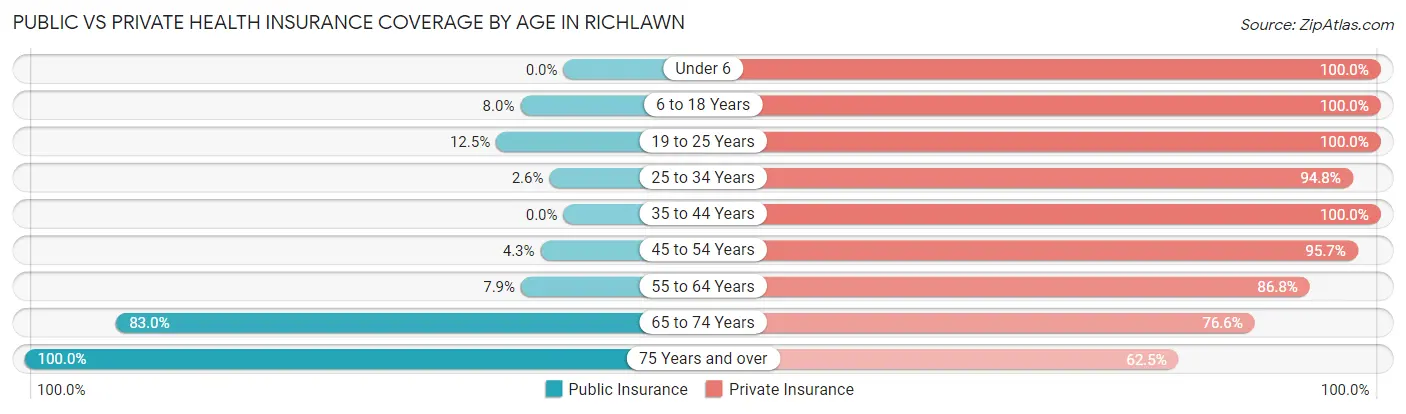
| Age Bracket | Public Insurance | Private Insurance |
| Under 6 | 0 (0.0%) | 40 (100.0%) |
| 6 to 18 Years | 2 (8.0%) | 25 (100.0%) |
| 19 to 25 Years | 1 (12.5%) | 8 (100.0%) |
| 25 to 34 Years | 2 (2.6%) | 73 (94.8%) |
| 35 to 44 Years | 0 (0.0%) | 55 (100.0%) |
| 45 to 54 Years | 2 (4.3%) | 45 (95.7%) |
| 55 to 64 Years | 3 (7.9%) | 33 (86.8%) |
| 65 to 74 Years | 39 (83.0%) | 36 (76.6%) |
| 75 Years and over | 24 (100.0%) | 15 (62.5%) |
| Total | 73 (20.2%) | 330 (91.4%) |
Disability Status by Sex by Age in Richlawn
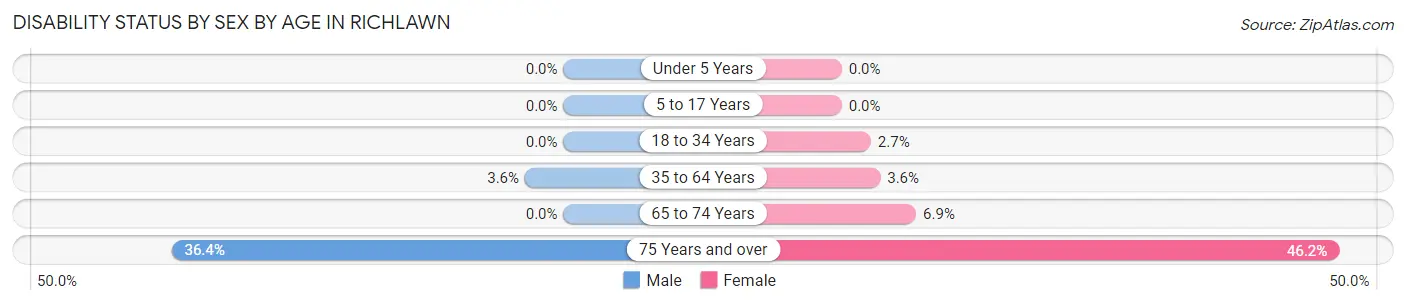
| Age Bracket | Male | Female |
| Under 5 Years | 0 (0.0%) | 0 (0.0%) |
| 5 to 17 Years | 0 (0.0%) | 0 (0.0%) |
| 18 to 34 Years | 0 (0.0%) | 1 (2.7%) |
| 35 to 64 Years | 3 (3.6%) | 2 (3.6%) |
| 65 to 74 Years | 0 (0.0%) | 2 (6.9%) |
| 75 Years and over | 4 (36.4%) | 6 (46.2%) |
Disability Class by Sex by Age in Richlawn
Disability Class: Hearing Difficulty
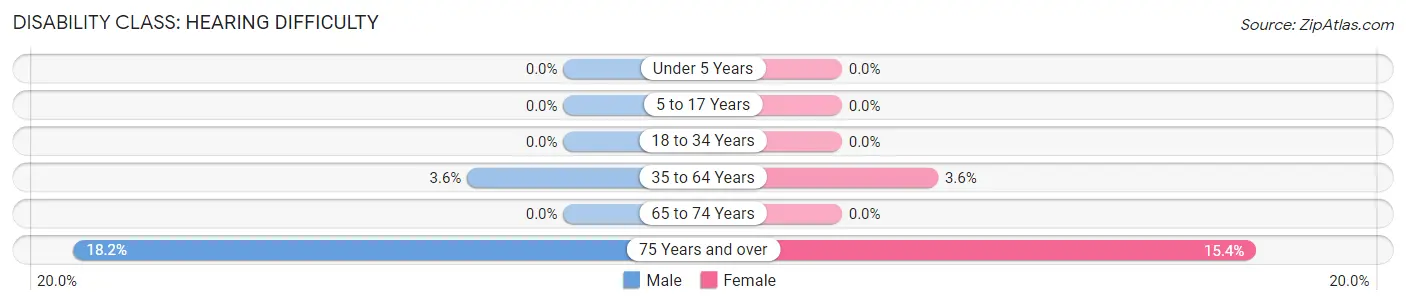
| Age Bracket | Male | Female |
| Under 5 Years | 0 (0.0%) | 0 (0.0%) |
| 5 to 17 Years | 0 (0.0%) | 0 (0.0%) |
| 18 to 34 Years | 0 (0.0%) | 0 (0.0%) |
| 35 to 64 Years | 3 (3.6%) | 2 (3.6%) |
| 65 to 74 Years | 0 (0.0%) | 0 (0.0%) |
| 75 Years and over | 2 (18.2%) | 2 (15.4%) |
Disability Class: Vision Difficulty
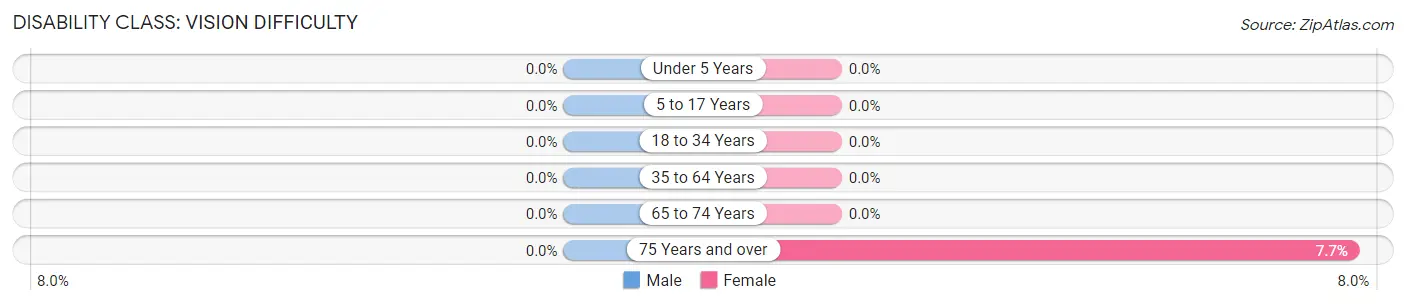
| Age Bracket | Male | Female |
| Under 5 Years | 0 (0.0%) | 0 (0.0%) |
| 5 to 17 Years | 0 (0.0%) | 0 (0.0%) |
| 18 to 34 Years | 0 (0.0%) | 0 (0.0%) |
| 35 to 64 Years | 0 (0.0%) | 0 (0.0%) |
| 65 to 74 Years | 0 (0.0%) | 0 (0.0%) |
| 75 Years and over | 0 (0.0%) | 1 (7.7%) |
Disability Class: Cognitive Difficulty
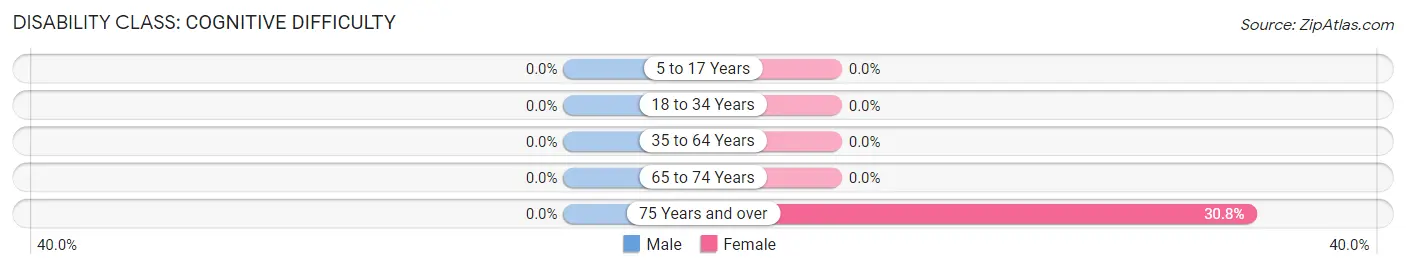
| Age Bracket | Male | Female |
| 5 to 17 Years | 0 (0.0%) | 0 (0.0%) |
| 18 to 34 Years | 0 (0.0%) | 0 (0.0%) |
| 35 to 64 Years | 0 (0.0%) | 0 (0.0%) |
| 65 to 74 Years | 0 (0.0%) | 0 (0.0%) |
| 75 Years and over | 0 (0.0%) | 4 (30.8%) |
Disability Class: Ambulatory Difficulty
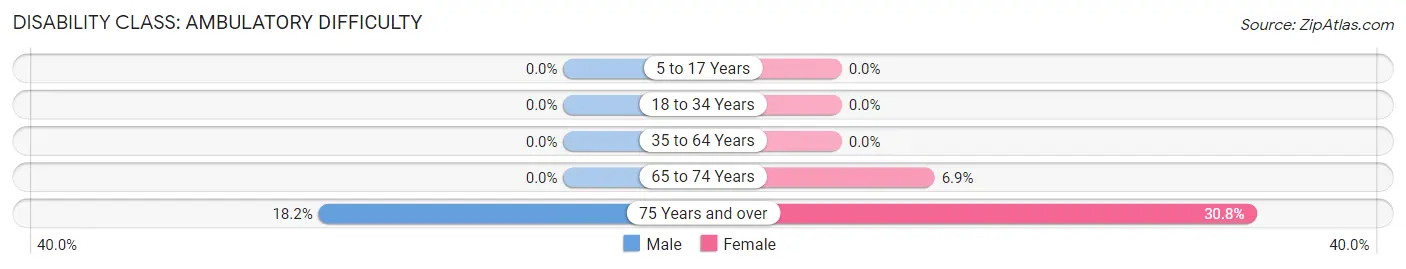
| Age Bracket | Male | Female |
| 5 to 17 Years | 0 (0.0%) | 0 (0.0%) |
| 18 to 34 Years | 0 (0.0%) | 0 (0.0%) |
| 35 to 64 Years | 0 (0.0%) | 0 (0.0%) |
| 65 to 74 Years | 0 (0.0%) | 2 (6.9%) |
| 75 Years and over | 2 (18.2%) | 4 (30.8%) |
Disability Class: Self-Care Difficulty
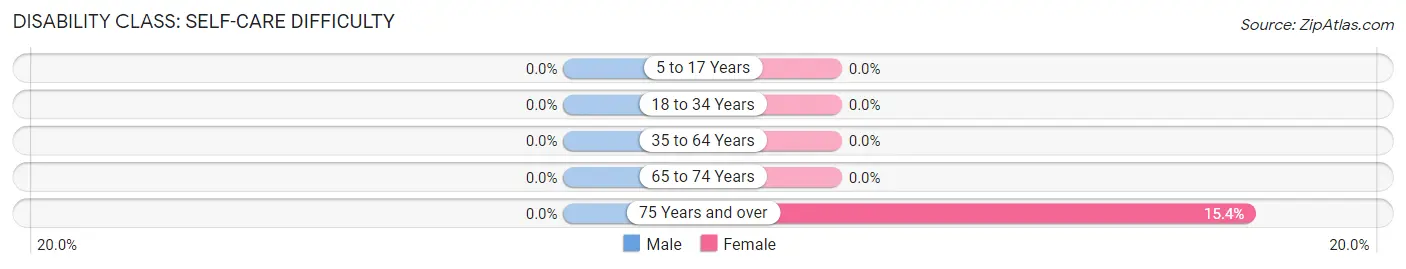
| Age Bracket | Male | Female |
| 5 to 17 Years | 0 (0.0%) | 0 (0.0%) |
| 18 to 34 Years | 0 (0.0%) | 0 (0.0%) |
| 35 to 64 Years | 0 (0.0%) | 0 (0.0%) |
| 65 to 74 Years | 0 (0.0%) | 0 (0.0%) |
| 75 Years and over | 0 (0.0%) | 2 (15.4%) |
Technology Access in Richlawn
Computing Device Access in Richlawn
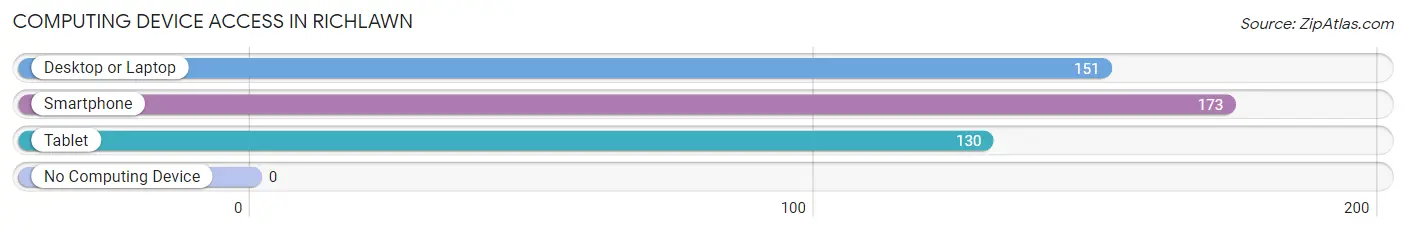
| Device Type | # Households | % Households |
| Desktop or Laptop | 151 | 83.9% |
| Smartphone | 173 | 96.1% |
| Tablet | 130 | 72.2% |
| No Computing Device | 0 | 0.0% |
| Total | 180 | 100.0% |
Internet Access in Richlawn
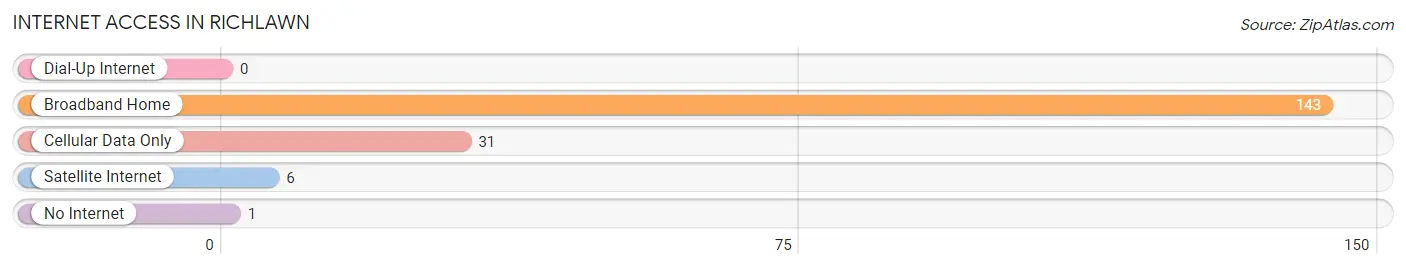
| Internet Type | # Households | % Households |
| Dial-Up Internet | 0 | 0.0% |
| Broadband Home | 143 | 79.4% |
| Cellular Data Only | 31 | 17.2% |
| Satellite Internet | 6 | 3.3% |
| No Internet | 1 | 0.6% |
| Total | 180 | 100.0% |
Richlawn Summary
Richlawn, Kentucky is a small unincorporated community located in the western part of the state, in the county of Warren. It is situated on the banks of the Green River, and is home to a population of just over 500 people. Richlawn is a rural community, and is known for its agricultural and industrial heritage.
History
Richlawn was first settled in the early 1800s by a group of settlers from Virginia. The community was originally known as “Richland”, and was named after the rich soil in the area. The town was officially incorporated in 1820, and the name was changed to Richlawn.
In the late 1800s, Richlawn became a hub for the tobacco industry. The town was home to several tobacco warehouses, and the tobacco industry provided many jobs for the local residents. The tobacco industry also helped to bring in new businesses and services to the area.
In the early 1900s, Richlawn became a center for the coal mining industry. The coal mines provided jobs for many of the local residents, and the coal industry helped to bring in new businesses and services to the area.
Geography
Richlawn is located in the western part of Warren County, Kentucky. It is situated on the banks of the Green River, and is bordered by the towns of Bowling Green, Smiths Grove, and Woodburn. The town is located approximately 25 miles south of Bowling Green, and is about an hour and a half drive from Nashville, Tennessee.
The town of Richlawn is situated in a rural area, and is surrounded by rolling hills and farmland. The town is home to several small lakes, and is known for its scenic beauty.
Economy
Richlawn’s economy is largely based on agriculture and industry. The town is home to several tobacco warehouses, and the tobacco industry provides many jobs for the local residents. The town is also home to several coal mines, and the coal industry provides jobs for many of the local residents.
In addition to agriculture and industry, Richlawn is home to several small businesses. These businesses include restaurants, retail stores, and other services. The town is also home to several churches, and is known for its strong sense of community.
Demographics
As of the 2010 census, Richlawn had a population of 514 people. The racial makeup of the town was 97.3% White, 0.6% African American, 0.2% Native American, 0.2% Asian, 0.2% from other races, and 1.6% from two or more races. Hispanic or Latino of any race were 0.8% of the population.
The median income for a household in Richlawn was $37,500, and the median income for a family was $41,250. The per capita income for the town was $17,845. About 11.2% of families and 13.2% of the population were below the poverty line, including 16.7% of those under age 18 and 8.3% of those age 65 or over.
Common Questions
What is Per Capita Income in Richlawn?
Per Capita income in Richlawn is $69,102.
What is the Median Family Income in Richlawn?
Median Family Income in Richlawn is $127,917.
What is the Median Household income in Richlawn?
Median Household Income in Richlawn is $114,000.
What is Income or Wage Gap in Richlawn?
Income or Wage Gap in Richlawn is 28.3%.
Women in Richlawn earn 71.7 cents for every dollar earned by a man.
What is Inequality or Gini Index in Richlawn?
Inequality or Gini Index in Richlawn is 0.36.
What is the Total Population of Richlawn?
Total Population of Richlawn is 361.
What is the Total Male Population of Richlawn?
Total Male Population of Richlawn is 197.
What is the Total Female Population of Richlawn?
Total Female Population of Richlawn is 164.
What is the Ratio of Males per 100 Females in Richlawn?
There are 120.12 Males per 100 Females in Richlawn.
What is the Ratio of Females per 100 Males in Richlawn?
There are 83.25 Females per 100 Males in Richlawn.
What is the Median Population Age in Richlawn?
Median Population Age in Richlawn is 40.7 Years.
What is the Average Family Size in Richlawn
Average Family Size in Richlawn is 2.6 People.
What is the Average Household Size in Richlawn
Average Household Size in Richlawn is 2.0 People.
How Large is the Labor Force in Richlawn?
There are 226 People in the Labor Forcein in Richlawn.
What is the Percentage of People in the Labor Force in Richlawn?
75.3% of People are in the Labor Force in Richlawn.
What is the Unemployment Rate in Richlawn?
Unemployment Rate in Richlawn is 2.7%.