Orchard Grass Hills, KY Map & Demographics
Orchard Grass Hills Map
Orchard Grass Hills Overview
$39,043
PER CAPITA INCOME
$102,083
AVG FAMILY INCOME
$97,969
AVG HOUSEHOLD INCOME
29.0%
WAGE / INCOME GAP [ % ]
71.0¢/ $1
WAGE / INCOME GAP [ $ ]
0.32
INEQUALITY / GINI INDEX
1,937
TOTAL POPULATION
940
MALE POPULATION
997
FEMALE POPULATION
94.28
MALES / 100 FEMALES
106.06
FEMALES / 100 MALES
30.7
MEDIAN AGE
3.4
AVG FAMILY SIZE
3.0
AVG HOUSEHOLD SIZE
1,040
LABOR FORCE [ PEOPLE ]
78.5%
PERCENT IN LABOR FORCE
2.7%
UNEMPLOYMENT RATE
Orchard Grass Hills Area Codes
Income in Orchard Grass Hills
Income Overview in Orchard Grass Hills
Per Capita Income in Orchard Grass Hills is $39,043, while median incomes of families and households are $102,083 and $97,969 respectively.
| Characteristic | Number | Measure |
| Per Capita Income | 1,937 | $39,043 |
| Median Family Income | 541 | $102,083 |
| Mean Family Income | 541 | $117,664 |
| Median Household Income | 641 | $97,969 |
| Mean Household Income | 641 | $110,808 |
| Income Deficit | 541 | $0 |
| Wage / Income Gap (%) | 1,937 | 28.97% |
| Wage / Income Gap ($) | 1,937 | 71.03¢ per $1 |
| Gini / Inequality Index | 1,937 | 0.32 |
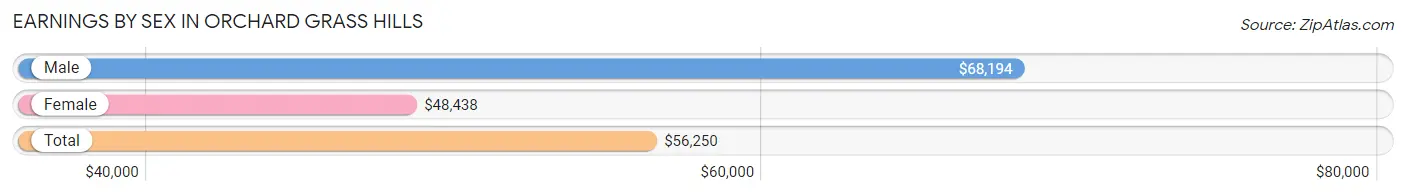
Earnings by Sex in Orchard Grass Hills
Average Earnings in Orchard Grass Hills are $56,250, $68,194 for men and $48,438 for women, a difference of 29.0%.
| Sex | Number | Average Earnings |
| Male | 581 (54.7%) | $68,194 |
| Female | 482 (45.3%) | $48,438 |
| Total | 1,063 (100.0%) | $56,250 |
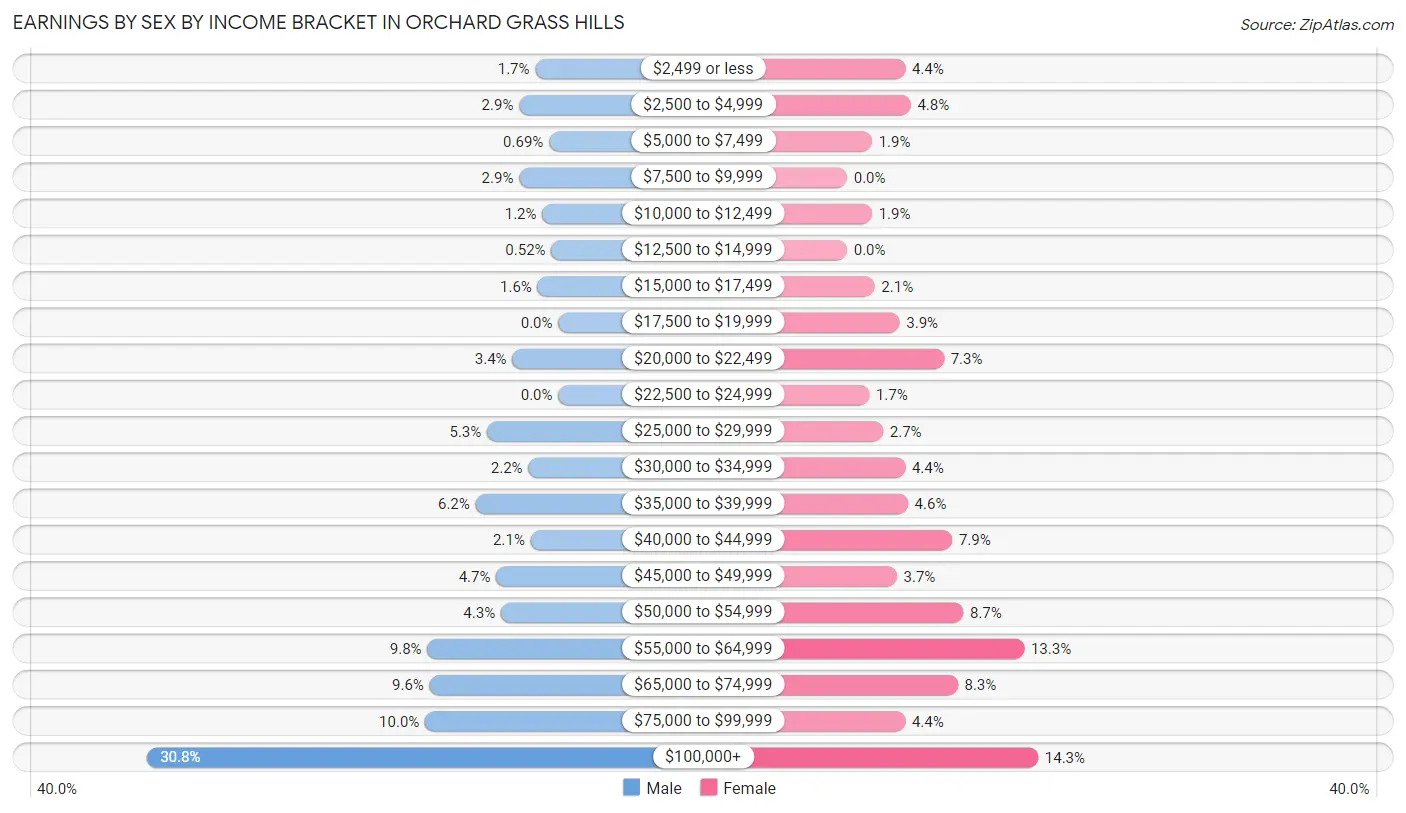
Earnings by Sex by Income Bracket in Orchard Grass Hills
The most common earnings brackets in Orchard Grass Hills are $100,000+ for men (179 | 30.8%) and $100,000+ for women (69 | 14.3%).
| Income | Male | Female |
| $2,499 or less | 10 (1.7%) | 21 (4.4%) |
| $2,500 to $4,999 | 17 (2.9%) | 23 (4.8%) |
| $5,000 to $7,499 | 4 (0.7%) | 9 (1.9%) |
| $7,500 to $9,999 | 17 (2.9%) | 0 (0.0%) |
| $10,000 to $12,499 | 7 (1.2%) | 9 (1.9%) |
| $12,500 to $14,999 | 3 (0.5%) | 0 (0.0%) |
| $15,000 to $17,499 | 9 (1.5%) | 10 (2.1%) |
| $17,500 to $19,999 | 0 (0.0%) | 19 (3.9%) |
| $20,000 to $22,499 | 20 (3.4%) | 35 (7.3%) |
| $22,500 to $24,999 | 0 (0.0%) | 8 (1.7%) |
| $25,000 to $29,999 | 31 (5.3%) | 13 (2.7%) |
| $30,000 to $34,999 | 13 (2.2%) | 21 (4.4%) |
| $35,000 to $39,999 | 36 (6.2%) | 22 (4.6%) |
| $40,000 to $44,999 | 12 (2.1%) | 38 (7.9%) |
| $45,000 to $49,999 | 27 (4.6%) | 18 (3.7%) |
| $50,000 to $54,999 | 25 (4.3%) | 42 (8.7%) |
| $55,000 to $64,999 | 57 (9.8%) | 64 (13.3%) |
| $65,000 to $74,999 | 56 (9.6%) | 40 (8.3%) |
| $75,000 to $99,999 | 58 (10.0%) | 21 (4.4%) |
| $100,000+ | 179 (30.8%) | 69 (14.3%) |
| Total | 581 (100.0%) | 482 (100.0%) |
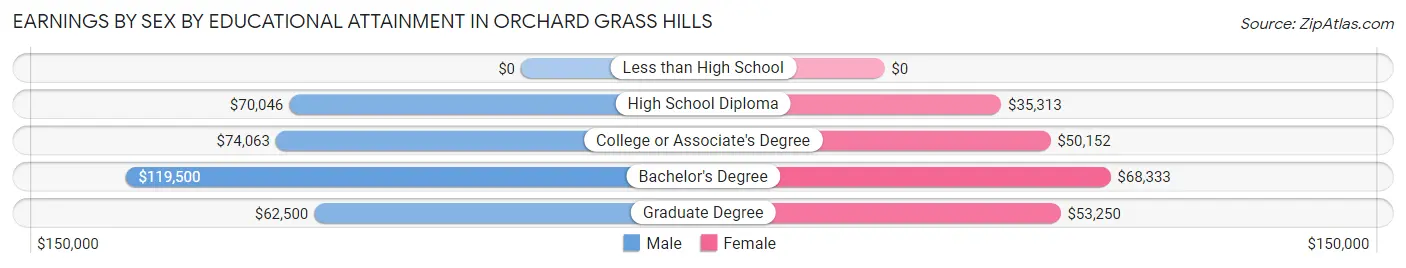
Earnings by Sex by Educational Attainment in Orchard Grass Hills
Average earnings in Orchard Grass Hills are $72,885 for men and $51,318 for women, a difference of 29.6%. Men with an educational attainment of bachelor's degree enjoy the highest average annual earnings of $119,500, while those with graduate degree education earn the least with $62,500. Women with an educational attainment of bachelor's degree earn the most with the average annual earnings of $68,333, while those with high school diploma education have the smallest earnings of $35,313.
| Educational Attainment | Male Income | Female Income |
| Less than High School | - | - |
| High School Diploma | $70,046 | $35,313 |
| College or Associate's Degree | $74,063 | $50,152 |
| Bachelor's Degree | $119,500 | $68,333 |
| Graduate Degree | $62,500 | $53,250 |
| Total | $72,885 | $51,318 |
Family Income in Orchard Grass Hills
Family Income Brackets in Orchard Grass Hills
According to the Orchard Grass Hills family income data, there are 143 families falling into the $100,000 to $149,999 income range, which is the most common income bracket and makes up 26.4% of all families.
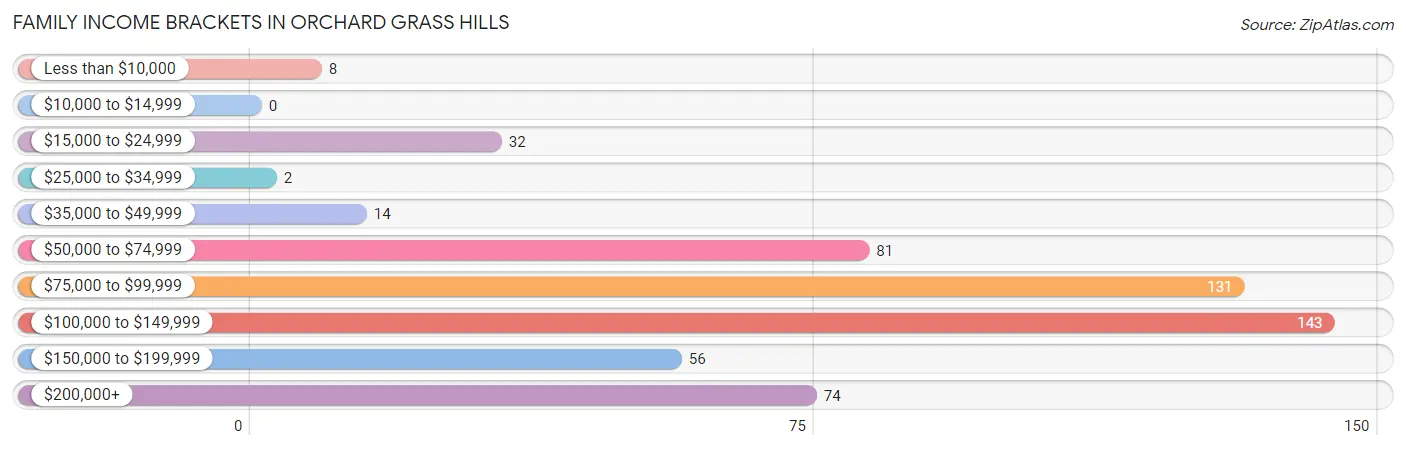
| Income Bracket | # Families | % Families |
| Less than $10,000 | 8 | 1.5% |
| $10,000 to $14,999 | 0 | 0.0% |
| $15,000 to $24,999 | 32 | 5.9% |
| $25,000 to $34,999 | 2 | 0.4% |
| $35,000 to $49,999 | 14 | 2.6% |
| $50,000 to $74,999 | 81 | 15.0% |
| $75,000 to $99,999 | 131 | 24.2% |
| $100,000 to $149,999 | 143 | 26.4% |
| $150,000 to $199,999 | 56 | 10.4% |
| $200,000+ | 74 | 13.7% |
Family Income by Famaliy Size in Orchard Grass Hills
3-person families (160 | 29.6%) account for the highest median family income in Orchard Grass Hills with $138,182 per family, while 3-person families (160 | 29.6%) have the highest median income of $46,061 per family member.
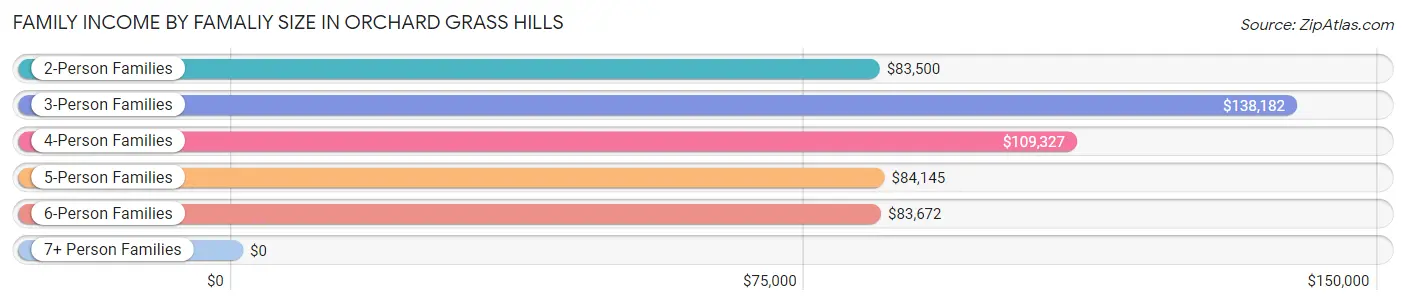
| Income Bracket | # Families | Median Income |
| 2-Person Families | 108 (20.0%) | $83,500 |
| 3-Person Families | 160 (29.6%) | $138,182 |
| 4-Person Families | 187 (34.6%) | $109,327 |
| 5-Person Families | 49 (9.1%) | $84,145 |
| 6-Person Families | 27 (5.0%) | $83,672 |
| 7+ Person Families | 10 (1.8%) | $0 |
| Total | 541 (100.0%) | $102,083 |
Family Income by Number of Earners in Orchard Grass Hills
The median family income in Orchard Grass Hills is $102,083, with families comprising 3+ earners (80) having the highest median family income of $126,250, while families with no earners (24) have the lowest median family income of $51,250, accounting for 14.8% and 4.4% of families, respectively.
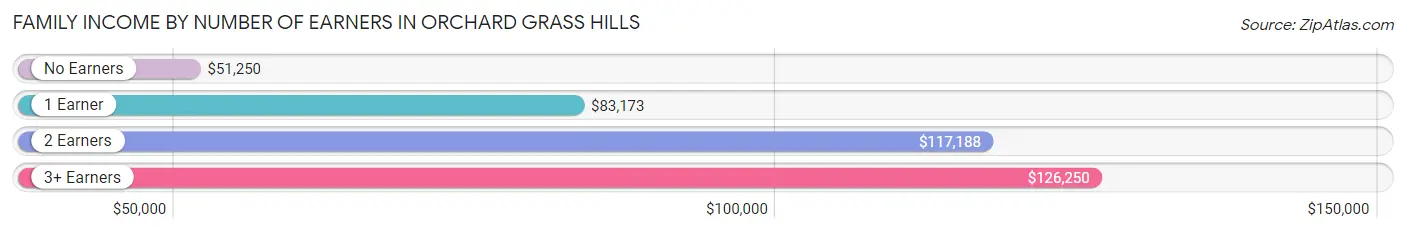
| Number of Earners | # Families | Median Income |
| No Earners | 24 (4.4%) | $51,250 |
| 1 Earner | 201 (37.1%) | $83,173 |
| 2 Earners | 236 (43.6%) | $117,188 |
| 3+ Earners | 80 (14.8%) | $126,250 |
| Total | 541 (100.0%) | $102,083 |
Household Income in Orchard Grass Hills
Household Income Brackets in Orchard Grass Hills
With 168 households falling in the category, the $100,000 to $149,999 income range is the most frequent in Orchard Grass Hills, accounting for 26.2% of all households.
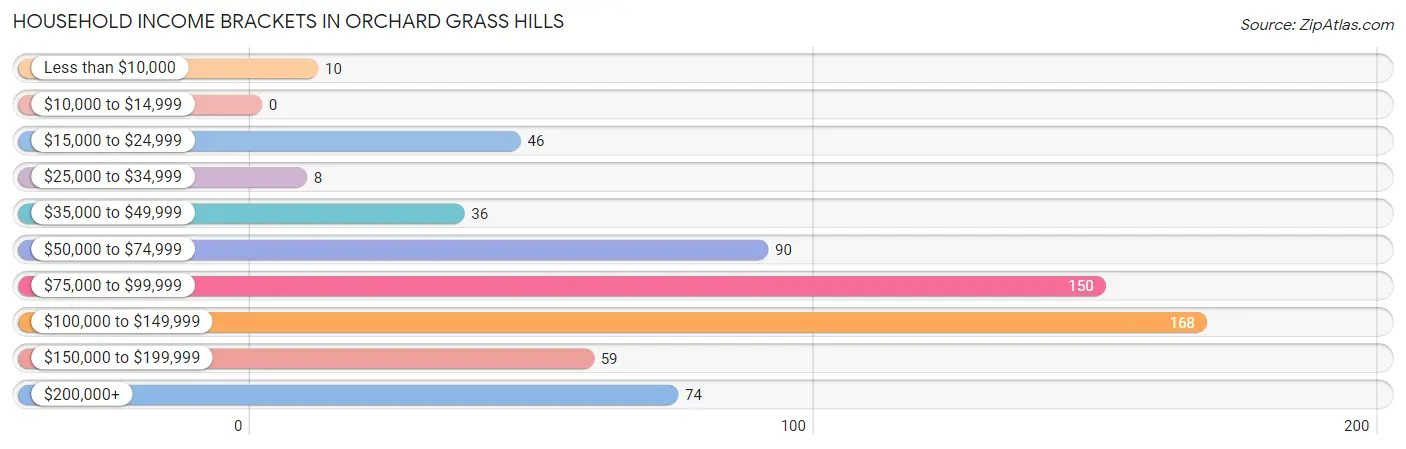
| Income Bracket | # Households | % Households |
| Less than $10,000 | 10 | 1.6% |
| $10,000 to $14,999 | 0 | 0.0% |
| $15,000 to $24,999 | 46 | 7.2% |
| $25,000 to $34,999 | 8 | 1.2% |
| $35,000 to $49,999 | 36 | 5.6% |
| $50,000 to $74,999 | 90 | 14.0% |
| $75,000 to $99,999 | 150 | 23.4% |
| $100,000 to $149,999 | 168 | 26.2% |
| $150,000 to $199,999 | 59 | 9.2% |
| $200,000+ | 74 | 11.5% |
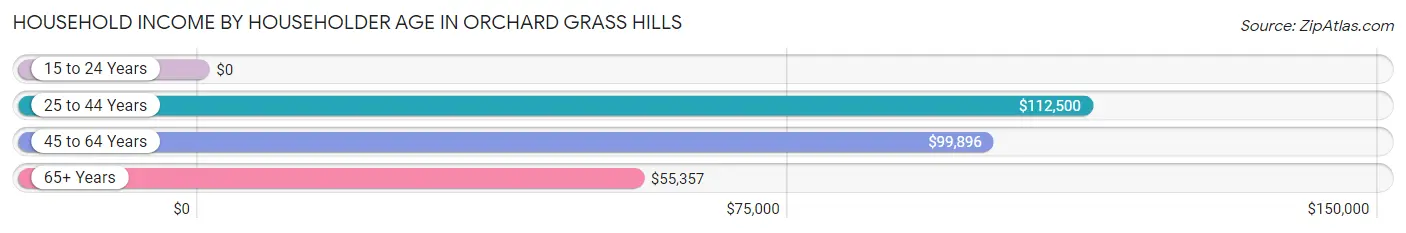
Household Income by Householder Age in Orchard Grass Hills
The median household income in Orchard Grass Hills is $97,969, with the highest median household income of $112,500 found in the 25 to 44 years age bracket for the primary householder. A total of 288 households (44.9%) fall into this category. Meanwhile, the 15 to 24 years age bracket for the primary householder has the lowest median household income of $0, with 27 households (4.2%) in this group.
| Income Bracket | # Households | Median Income |
| 15 to 24 Years | 27 (4.2%) | $0 |
| 25 to 44 Years | 288 (44.9%) | $112,500 |
| 45 to 64 Years | 250 (39.0%) | $99,896 |
| 65+ Years | 76 (11.9%) | $55,357 |
| Total | 641 (100.0%) | $97,969 |
Poverty in Orchard Grass Hills
Income Below Poverty by Sex and Age in Orchard Grass Hills
With 5.6% poverty level for males and 10.5% for females among the residents of Orchard Grass Hills, under 5 year old males and under 5 year old females are the most vulnerable to poverty, with 17 males (44.7%) and 53 females (43.8%) in their respective age groups living below the poverty level.
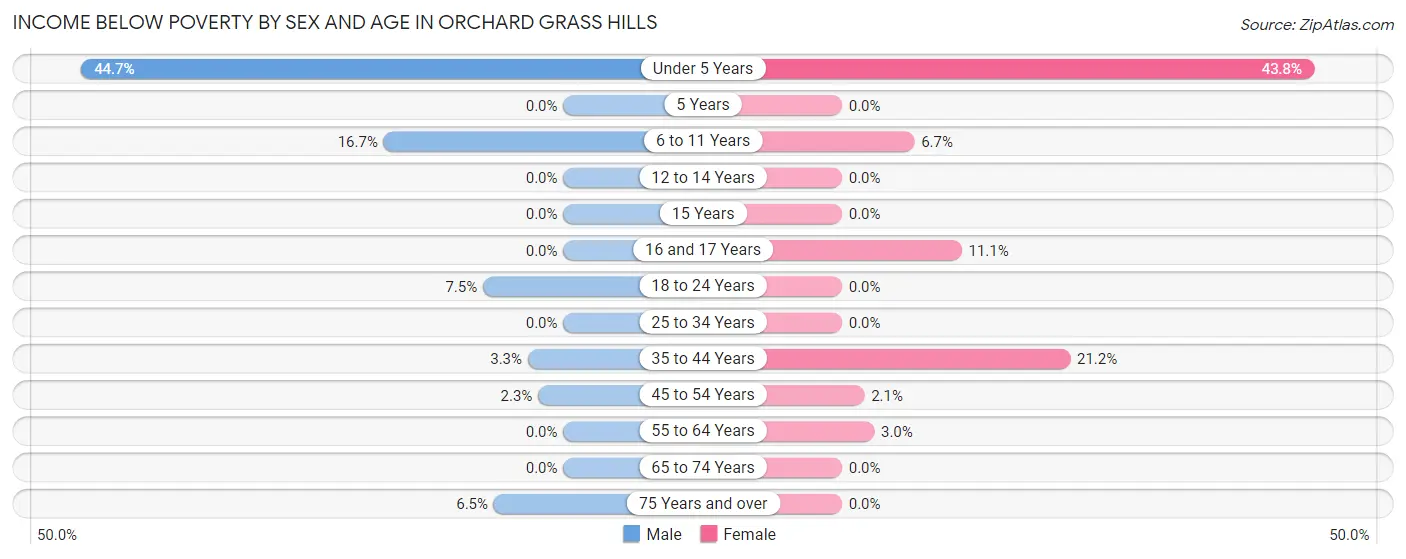
| Age Bracket | Male | Female |
| Under 5 Years | 17 (44.7%) | 53 (43.8%) |
| 5 Years | 0 (0.0%) | 0 (0.0%) |
| 6 to 11 Years | 19 (16.7%) | 8 (6.7%) |
| 12 to 14 Years | 0 (0.0%) | 0 (0.0%) |
| 15 Years | 0 (0.0%) | 0 (0.0%) |
| 16 and 17 Years | 0 (0.0%) | 3 (11.1%) |
| 18 to 24 Years | 7 (7.4%) | 0 (0.0%) |
| 25 to 34 Years | 0 (0.0%) | 0 (0.0%) |
| 35 to 44 Years | 5 (3.3%) | 36 (21.2%) |
| 45 to 54 Years | 3 (2.3%) | 3 (2.1%) |
| 55 to 64 Years | 0 (0.0%) | 2 (3.0%) |
| 65 to 74 Years | 0 (0.0%) | 0 (0.0%) |
| 75 Years and over | 2 (6.5%) | 0 (0.0%) |
| Total | 53 (5.6%) | 105 (10.5%) |
Income Above Poverty by Sex and Age in Orchard Grass Hills
According to the poverty statistics in Orchard Grass Hills, males aged 5 years and females aged 5 years are the age groups that are most secure financially, with 100.0% of males and 100.0% of females in these age groups living above the poverty line.
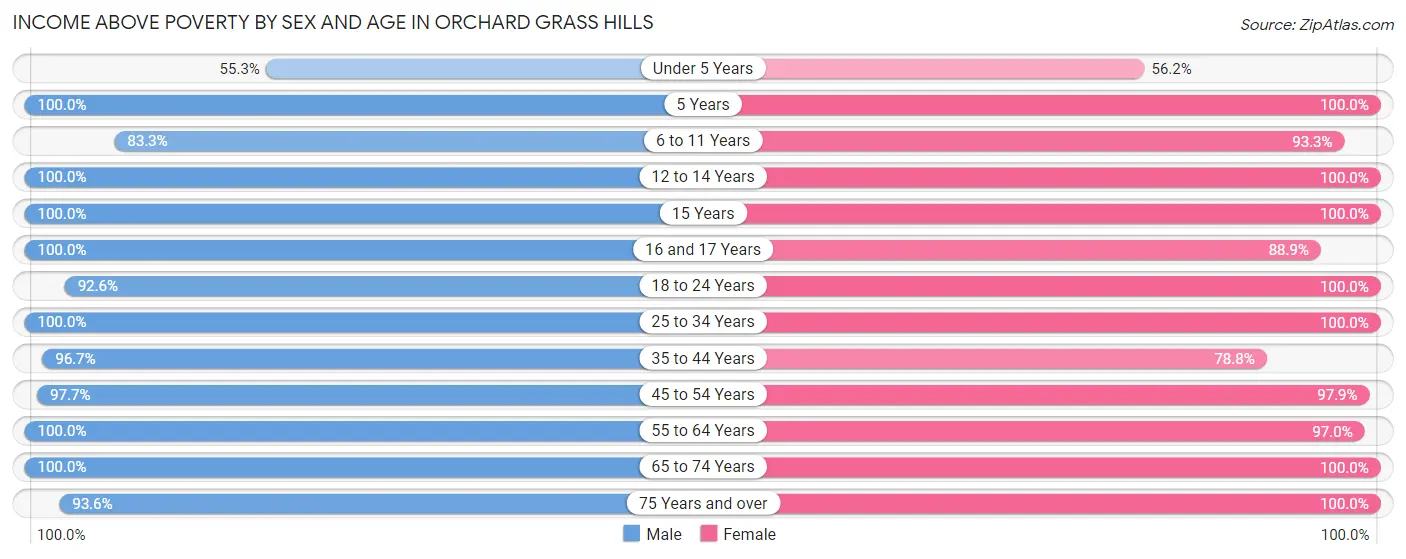
| Age Bracket | Male | Female |
| Under 5 Years | 21 (55.3%) | 68 (56.2%) |
| 5 Years | 15 (100.0%) | 55 (100.0%) |
| 6 to 11 Years | 95 (83.3%) | 111 (93.3%) |
| 12 to 14 Years | 62 (100.0%) | 50 (100.0%) |
| 15 Years | 33 (100.0%) | 5 (100.0%) |
| 16 and 17 Years | 18 (100.0%) | 24 (88.9%) |
| 18 to 24 Years | 87 (92.5%) | 47 (100.0%) |
| 25 to 34 Years | 157 (100.0%) | 125 (100.0%) |
| 35 to 44 Years | 147 (96.7%) | 134 (78.8%) |
| 45 to 54 Years | 125 (97.7%) | 141 (97.9%) |
| 55 to 64 Years | 79 (100.0%) | 65 (97.0%) |
| 65 to 74 Years | 19 (100.0%) | 36 (100.0%) |
| 75 Years and over | 29 (93.5%) | 31 (100.0%) |
| Total | 887 (94.4%) | 892 (89.5%) |
Income Below Poverty Among Married-Couple Families in Orchard Grass Hills
The poverty statistics for married-couple families in Orchard Grass Hills show that 2.0% or 8 of the total 405 families live below the poverty line. Families with 3 or 4 children have the highest poverty rate of 9.6%, comprising of 5 families. On the other hand, families with no children have the lowest poverty rate of 0.0%, which includes 0 families.
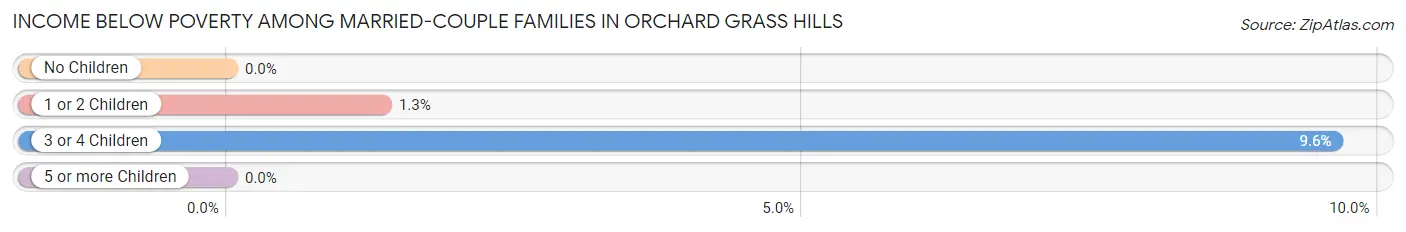
| Children | Above Poverty | Below Poverty |
| No Children | 119 (100.0%) | 0 (0.0%) |
| 1 or 2 Children | 221 (98.7%) | 3 (1.3%) |
| 3 or 4 Children | 47 (90.4%) | 5 (9.6%) |
| 5 or more Children | 10 (100.0%) | 0 (0.0%) |
| Total | 397 (98.0%) | 8 (2.0%) |
Income Below Poverty Among Single-Parent Households in Orchard Grass Hills
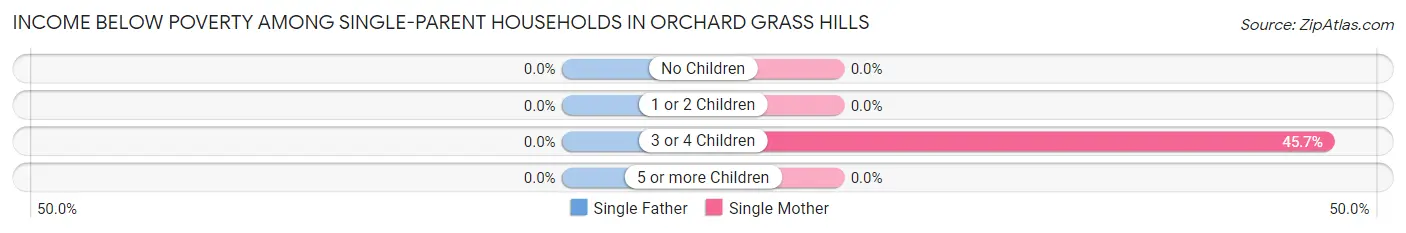
| Children | Single Father | Single Mother |
| No Children | 0 (0.0%) | 0 (0.0%) |
| 1 or 2 Children | 0 (0.0%) | 0 (0.0%) |
| 3 or 4 Children | 0 (0.0%) | 32 (45.7%) |
| 5 or more Children | 0 (0.0%) | 0 (0.0%) |
| Total | 0 (0.0%) | 32 (30.5%) |
Income Below Poverty Among Married-Couple vs Single-Parent Households in Orchard Grass Hills
The poverty data for Orchard Grass Hills shows that 8 of the married-couple family households (2.0%) and 32 of the single-parent households (23.5%) are living below the poverty level. Within the married-couple family households, those with 3 or 4 children have the highest poverty rate, with 5 households (9.6%) falling below the poverty line. Among the single-parent households, those with 3 or 4 children have the highest poverty rate, with 32 household (38.1%) living below poverty.
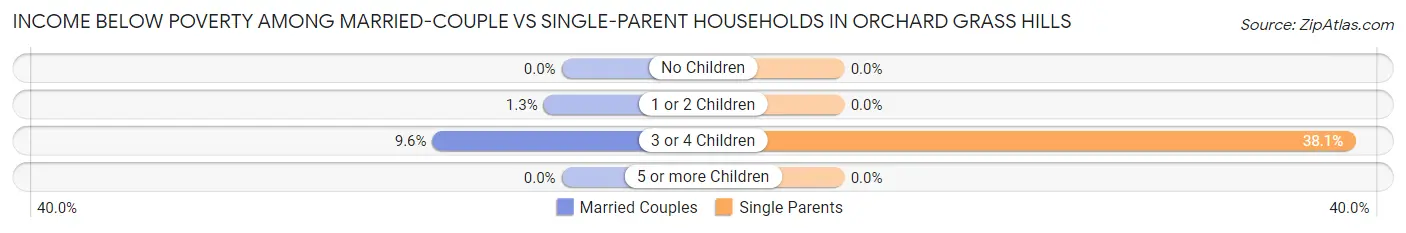
| Children | Married-Couple Families | Single-Parent Households |
| No Children | 0 (0.0%) | 0 (0.0%) |
| 1 or 2 Children | 3 (1.3%) | 0 (0.0%) |
| 3 or 4 Children | 5 (9.6%) | 32 (38.1%) |
| 5 or more Children | 0 (0.0%) | 0 (0.0%) |
| Total | 8 (2.0%) | 32 (23.5%) |
Race in Orchard Grass Hills
The most populous races in Orchard Grass Hills are White / Caucasian (1,719 | 88.7%), Two or more Races (132 | 6.8%), and Hispanic or Latino (66 | 3.4%).
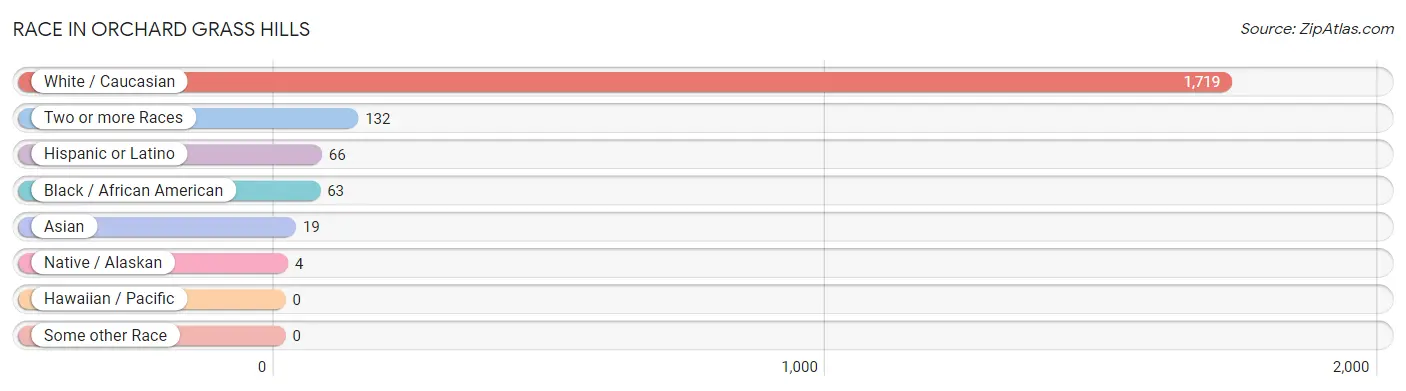
| Race | # Population | % Population |
| Asian | 19 | 1.0% |
| Black / African American | 63 | 3.3% |
| Hawaiian / Pacific | 0 | 0.0% |
| Hispanic or Latino | 66 | 3.4% |
| Native / Alaskan | 4 | 0.2% |
| White / Caucasian | 1,719 | 88.7% |
| Two or more Races | 132 | 6.8% |
| Some other Race | 0 | 0.0% |
| Total | 1,937 | 100.0% |
Ancestry in Orchard Grass Hills
The most populous ancestries reported in Orchard Grass Hills are German (460 | 23.7%), Irish (340 | 17.5%), English (253 | 13.1%), American (212 | 10.9%), and Polish (86 | 4.4%), together accounting for 69.7% of all Orchard Grass Hills residents.
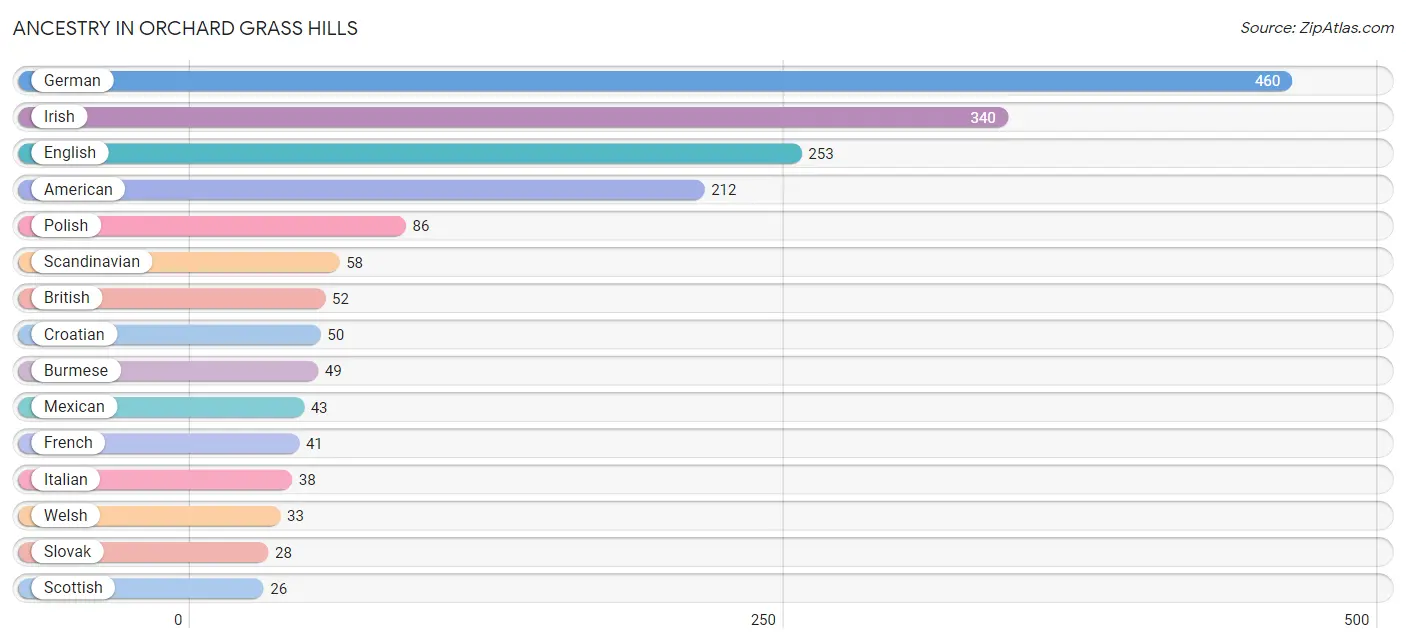
| Ancestry | # Population | % Population |
| American | 212 | 10.9% |
| Australian | 4 | 0.2% |
| Bhutanese | 3 | 0.2% |
| Blackfeet | 3 | 0.2% |
| British | 52 | 2.7% |
| Burmese | 49 | 2.5% |
| Canadian | 20 | 1.0% |
| Central American | 23 | 1.2% |
| Cherokee | 3 | 0.2% |
| Croatian | 50 | 2.6% |
| Czechoslovakian | 4 | 0.2% |
| Dutch | 23 | 1.2% |
| Eastern European | 14 | 0.7% |
| English | 253 | 13.1% |
| European | 9 | 0.5% |
| French | 41 | 2.1% |
| German | 460 | 23.7% |
| Honduran | 23 | 1.2% |
| Hungarian | 9 | 0.5% |
| Indian (Asian) | 8 | 0.4% |
| Irish | 340 | 17.5% |
| Italian | 38 | 2.0% |
| Korean | 4 | 0.2% |
| Lithuanian | 3 | 0.2% |
| Mexican | 43 | 2.2% |
| Norwegian | 19 | 1.0% |
| Polish | 86 | 4.4% |
| Portuguese | 2 | 0.1% |
| Scandinavian | 58 | 3.0% |
| Scotch-Irish | 20 | 1.0% |
| Scottish | 26 | 1.3% |
| Slovak | 28 | 1.5% |
| Slovene | 3 | 0.2% |
| Swedish | 14 | 0.7% |
| Swiss | 6 | 0.3% |
| Welsh | 33 | 1.7% | View All 36 Rows |
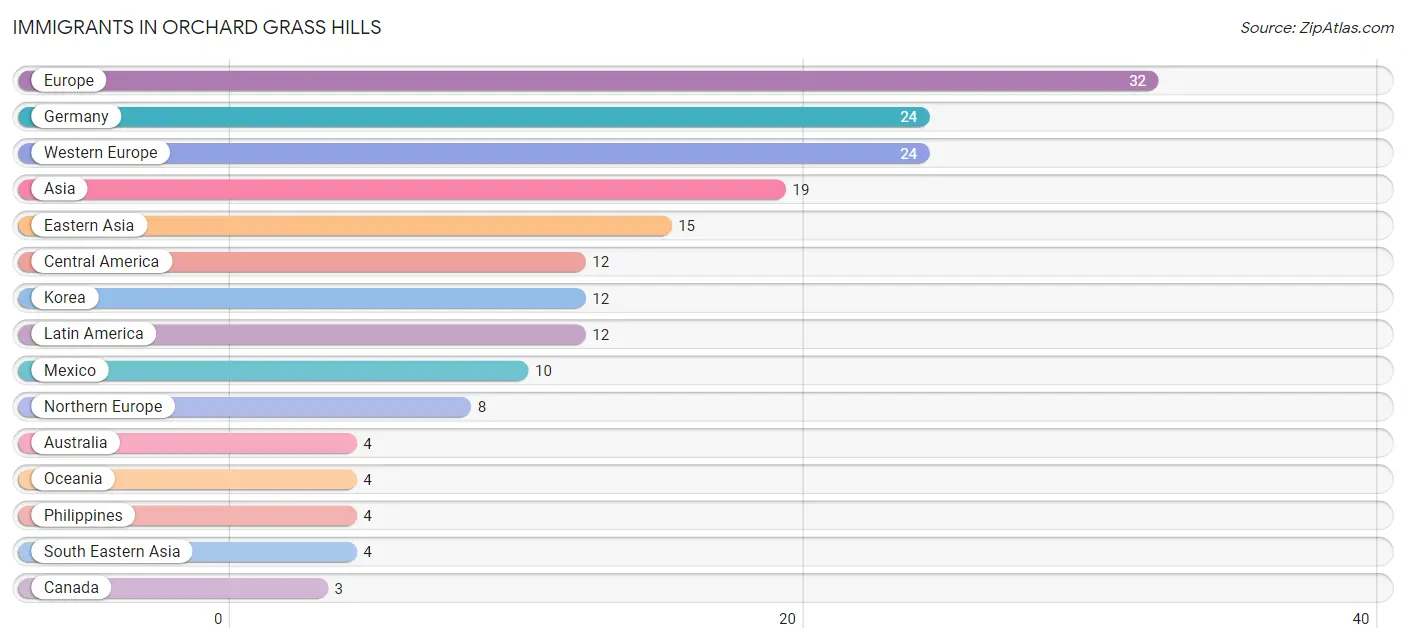
Immigrants in Orchard Grass Hills
The most numerous immigrant groups reported in Orchard Grass Hills came from Europe (32 | 1.7%), Germany (24 | 1.2%), Western Europe (24 | 1.2%), Asia (19 | 1.0%), and Eastern Asia (15 | 0.8%), together accounting for 5.9% of all Orchard Grass Hills residents.
| Immigration Origin | # Population | % Population |
| Asia | 19 | 1.0% |
| Australia | 4 | 0.2% |
| Canada | 3 | 0.2% |
| Central America | 12 | 0.6% |
| Eastern Asia | 15 | 0.8% |
| England | 2 | 0.1% |
| Europe | 32 | 1.7% |
| Germany | 24 | 1.2% |
| Honduras | 2 | 0.1% |
| Japan | 3 | 0.2% |
| Korea | 12 | 0.6% |
| Latin America | 12 | 0.6% |
| Mexico | 10 | 0.5% |
| Northern Europe | 8 | 0.4% |
| Oceania | 4 | 0.2% |
| Philippines | 4 | 0.2% |
| South Eastern Asia | 4 | 0.2% |
| Western Europe | 24 | 1.2% | View All 18 Rows |
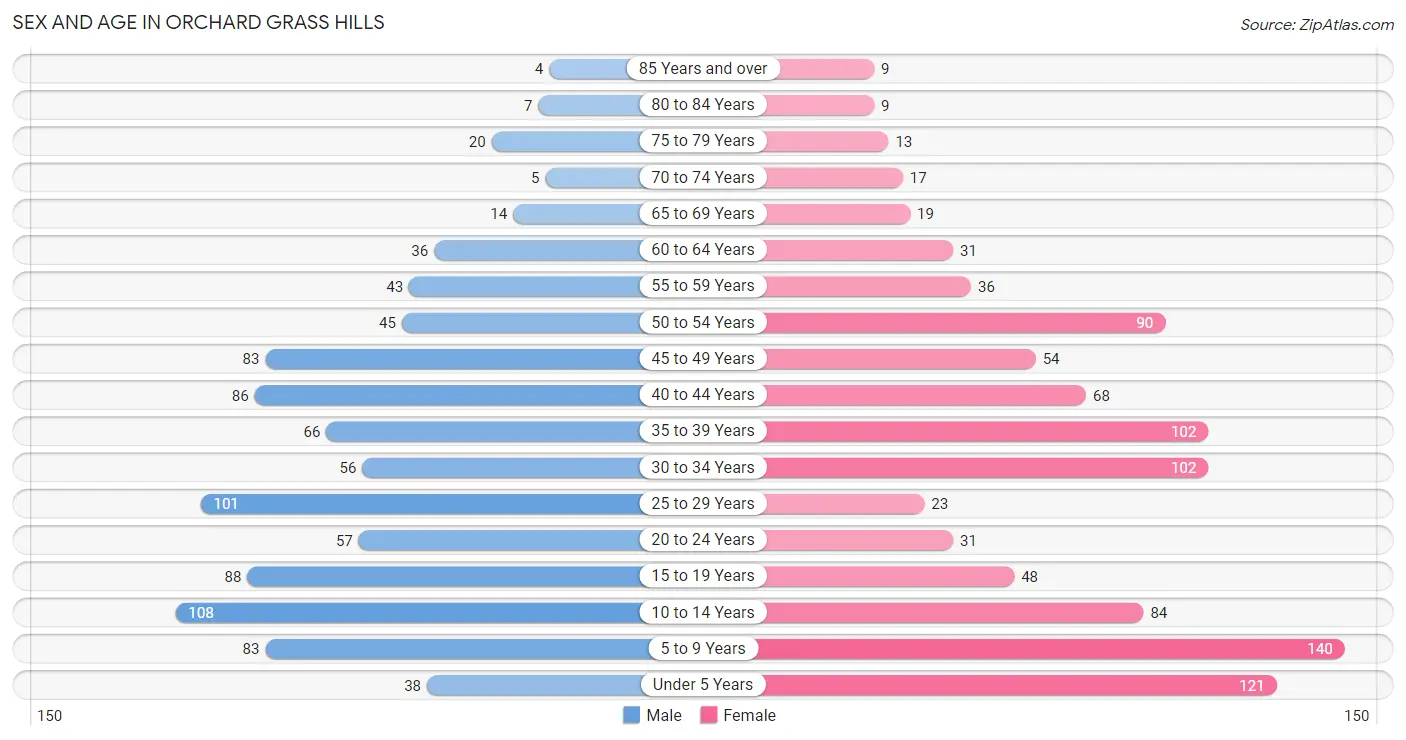
Sex and Age in Orchard Grass Hills
Sex and Age in Orchard Grass Hills
The most populous age groups in Orchard Grass Hills are 10 to 14 Years (108 | 11.5%) for men and 5 to 9 Years (140 | 14.0%) for women.
| Age Bracket | Male | Female |
| Under 5 Years | 38 (4.0%) | 121 (12.1%) |
| 5 to 9 Years | 83 (8.8%) | 140 (14.0%) |
| 10 to 14 Years | 108 (11.5%) | 84 (8.4%) |
| 15 to 19 Years | 88 (9.4%) | 48 (4.8%) |
| 20 to 24 Years | 57 (6.1%) | 31 (3.1%) |
| 25 to 29 Years | 101 (10.7%) | 23 (2.3%) |
| 30 to 34 Years | 56 (6.0%) | 102 (10.2%) |
| 35 to 39 Years | 66 (7.0%) | 102 (10.2%) |
| 40 to 44 Years | 86 (9.1%) | 68 (6.8%) |
| 45 to 49 Years | 83 (8.8%) | 54 (5.4%) |
| 50 to 54 Years | 45 (4.8%) | 90 (9.0%) |
| 55 to 59 Years | 43 (4.6%) | 36 (3.6%) |
| 60 to 64 Years | 36 (3.8%) | 31 (3.1%) |
| 65 to 69 Years | 14 (1.5%) | 19 (1.9%) |
| 70 to 74 Years | 5 (0.5%) | 17 (1.7%) |
| 75 to 79 Years | 20 (2.1%) | 13 (1.3%) |
| 80 to 84 Years | 7 (0.7%) | 9 (0.9%) |
| 85 Years and over | 4 (0.4%) | 9 (0.9%) |
| Total | 940 (100.0%) | 997 (100.0%) |
Families and Households in Orchard Grass Hills
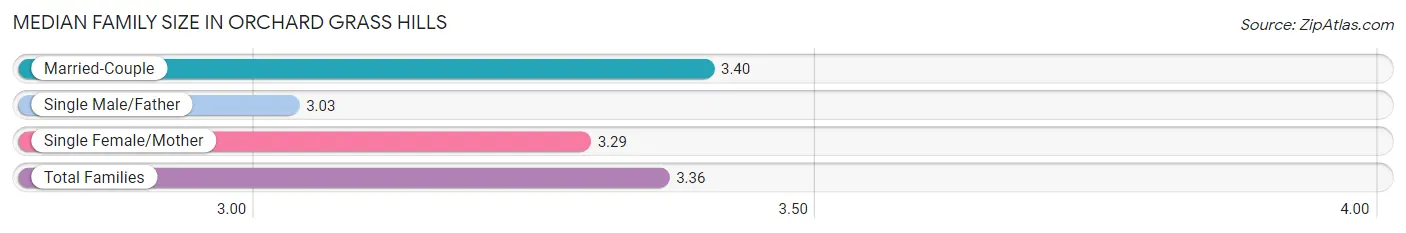
Median Family Size in Orchard Grass Hills
The median family size in Orchard Grass Hills is 3.36 persons per family, with married-couple families (405 | 74.9%) accounting for the largest median family size of 3.4 persons per family. On the other hand, single male/father families (31 | 5.7%) represent the smallest median family size with 3.03 persons per family.
| Family Type | # Families | Family Size |
| Married-Couple | 405 (74.9%) | 3.40 |
| Single Male/Father | 31 (5.7%) | 3.03 |
| Single Female/Mother | 105 (19.4%) | 3.29 |
| Total Families | 541 (100.0%) | 3.36 |
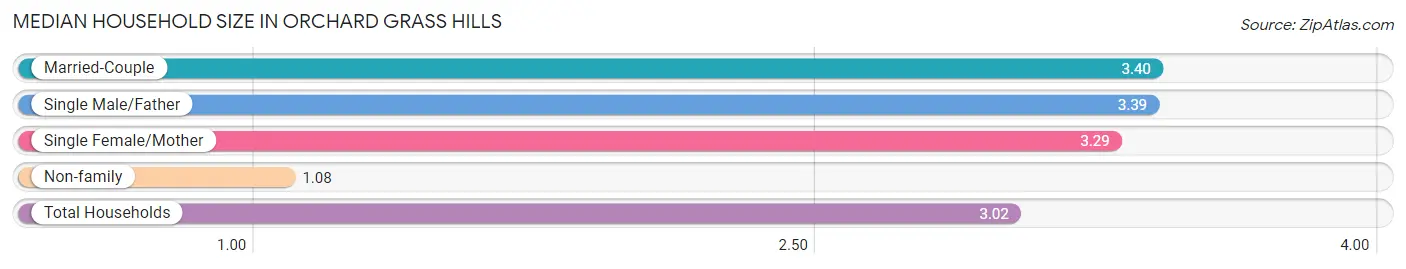
Median Household Size in Orchard Grass Hills
The median household size in Orchard Grass Hills is 3.02 persons per household, with married-couple households (405 | 63.2%) accounting for the largest median household size of 3.4 persons per household. non-family households (100 | 15.6%) represent the smallest median household size with 1.08 persons per household.
| Household Type | # Households | Household Size |
| Married-Couple | 405 (63.2%) | 3.40 |
| Single Male/Father | 31 (4.8%) | 3.39 |
| Single Female/Mother | 105 (16.4%) | 3.29 |
| Non-family | 100 (15.6%) | 1.08 |
| Total Households | 641 (100.0%) | 3.02 |
Household Size by Marriage Status in Orchard Grass Hills
Out of a total of 641 households in Orchard Grass Hills, 541 (84.4%) are family households, while 100 (15.6%) are nonfamily households. The most numerous type of family households are 4-person households, comprising 179, and the most common type of nonfamily households are 1-person households, comprising 93.
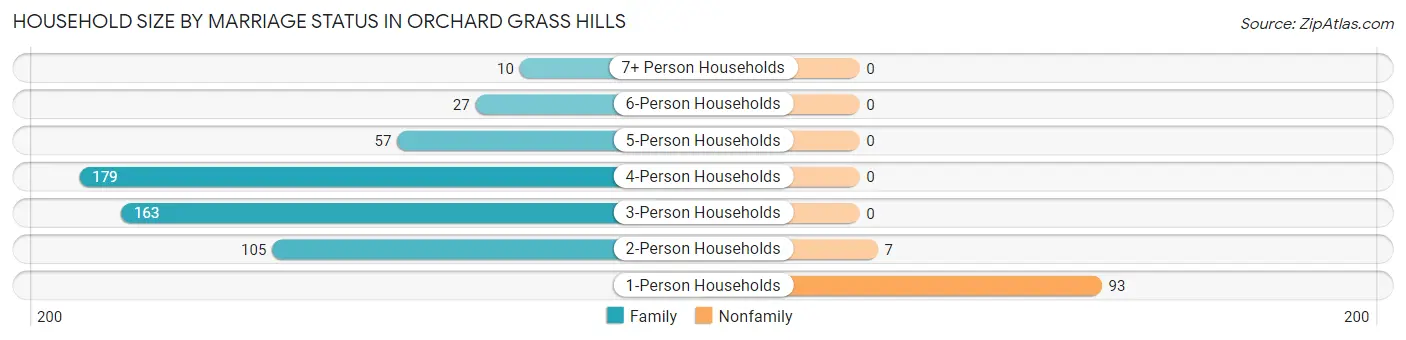
| Household Size | Family Households | Nonfamily Households |
| 1-Person Households | - | 93 (14.5%) |
| 2-Person Households | 105 (16.4%) | 7 (1.1%) |
| 3-Person Households | 163 (25.4%) | 0 (0.0%) |
| 4-Person Households | 179 (27.9%) | 0 (0.0%) |
| 5-Person Households | 57 (8.9%) | 0 (0.0%) |
| 6-Person Households | 27 (4.2%) | 0 (0.0%) |
| 7+ Person Households | 10 (1.6%) | 0 (0.0%) |
| Total | 541 (84.4%) | 100 (15.6%) |
Female Fertility in Orchard Grass Hills
Fertility by Age in Orchard Grass Hills
Average fertility rate in Orchard Grass Hills is 114.0 births per 1,000 women. Women in the age bracket of 20 to 34 years have the highest fertility rate with 321.0 births per 1,000 women. Women in the age bracket of 20 to 34 years acount for 100.0% of all women with births.
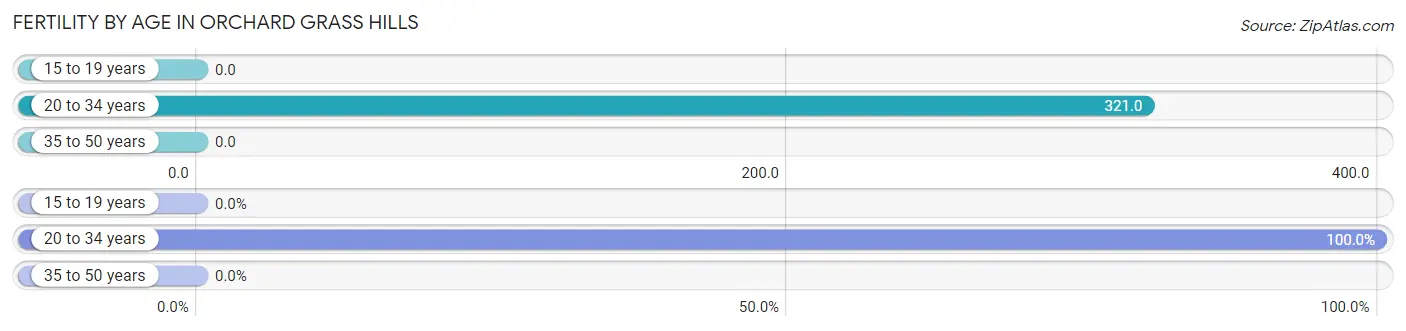
| Age Bracket | Women with Births | Births / 1,000 Women |
| 15 to 19 years | 0 (0.0%) | 0.0 |
| 20 to 34 years | 50 (100.0%) | 321.0 |
| 35 to 50 years | 0 (0.0%) | 0.0 |
| Total | 50 (100.0%) | 114.0 |
Fertility by Age by Marriage Status in Orchard Grass Hills
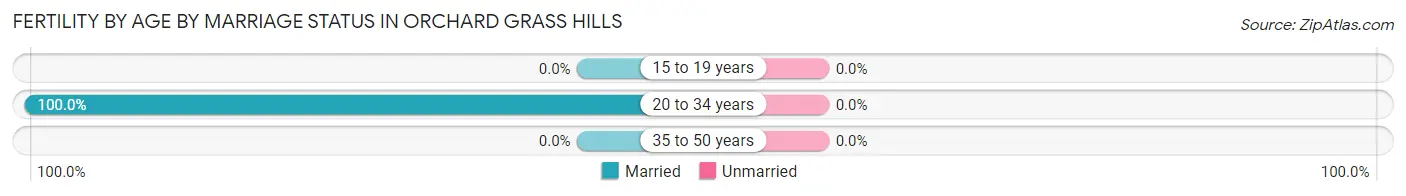
| Age Bracket | Married | Unmarried |
| 15 to 19 years | 0 (0.0%) | 0 (0.0%) |
| 20 to 34 years | 50 (100.0%) | 0 (0.0%) |
| 35 to 50 years | 0 (0.0%) | 0 (0.0%) |
| Total | 50 (100.0%) | 0 (0.0%) |
Fertility by Education in Orchard Grass Hills
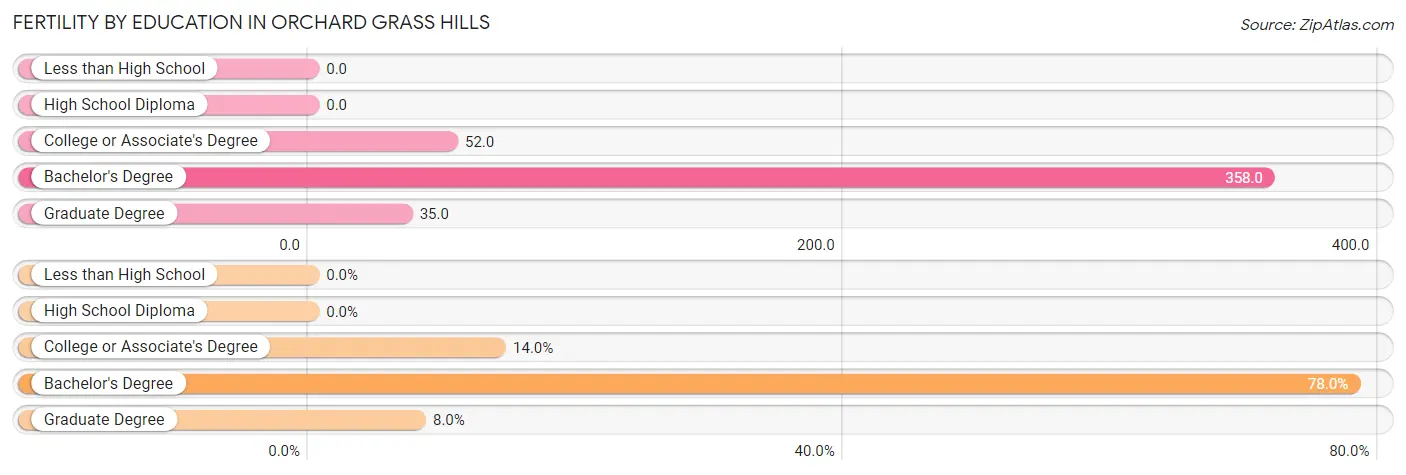
| Educational Attainment | Women with Births | Births / 1,000 Women |
| Less than High School | 0 (0.0%) | 0.0 |
| High School Diploma | 0 (0.0%) | 0.0 |
| College or Associate's Degree | 7 (14.0%) | 52.0 |
| Bachelor's Degree | 39 (78.0%) | 358.0 |
| Graduate Degree | 4 (8.0%) | 35.0 |
| Total | 50 (100.0%) | 114.0 |
Fertility by Education by Marriage Status in Orchard Grass Hills
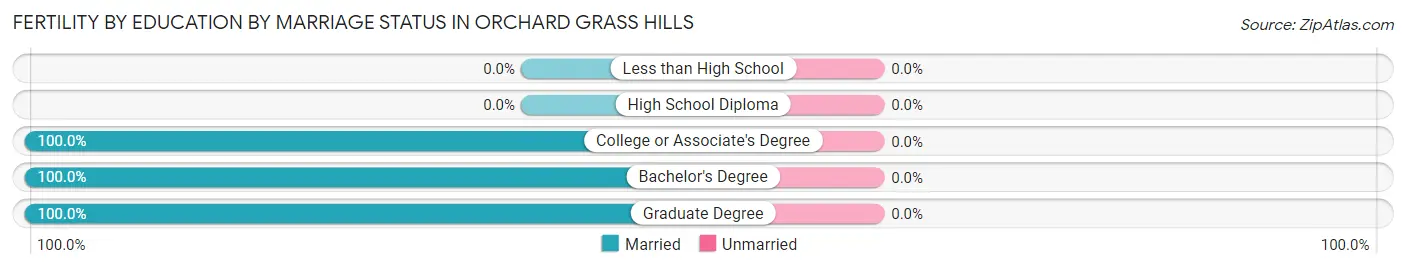
| Educational Attainment | Married | Unmarried |
| Less than High School | 0 (0.0%) | 0 (0.0%) |
| High School Diploma | 0 (0.0%) | 0 (0.0%) |
| College or Associate's Degree | 7 (100.0%) | 0 (0.0%) |
| Bachelor's Degree | 39 (100.0%) | 0 (0.0%) |
| Graduate Degree | 4 (100.0%) | 0 (0.0%) |
| Total | 50 (100.0%) | 0 (0.0%) |
Employment Characteristics in Orchard Grass Hills
Employment by Class of Employer in Orchard Grass Hills
Among the 1,010 employed individuals in Orchard Grass Hills, private company employees (786 | 77.8%), not-for-profit organizations (91 | 9.0%), and self-employed (not incorporated) (63 | 6.2%) make up the most common classes of employment.
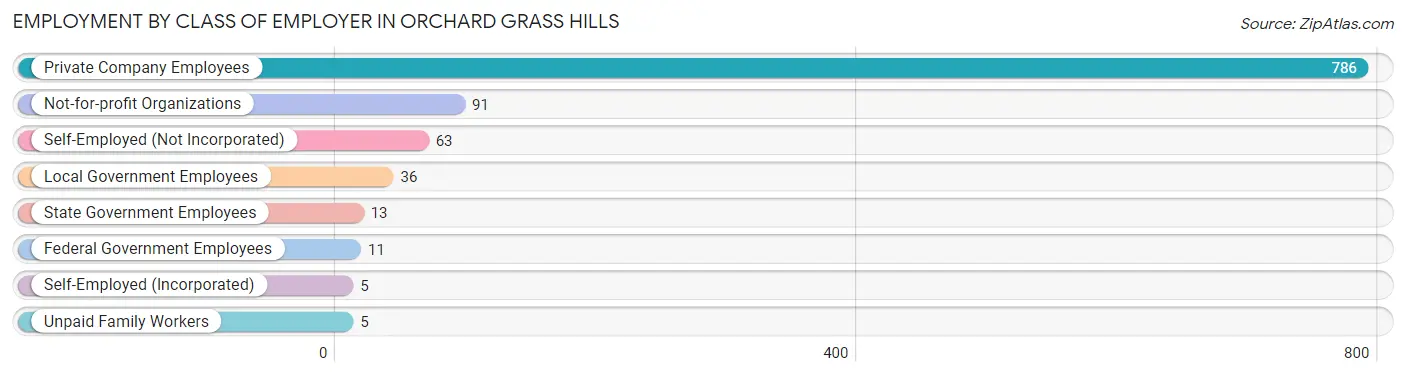
| Employer Class | # Employees | % Employees |
| Private Company Employees | 786 | 77.8% |
| Self-Employed (Incorporated) | 5 | 0.5% |
| Self-Employed (Not Incorporated) | 63 | 6.2% |
| Not-for-profit Organizations | 91 | 9.0% |
| Local Government Employees | 36 | 3.6% |
| State Government Employees | 13 | 1.3% |
| Federal Government Employees | 11 | 1.1% |
| Unpaid Family Workers | 5 | 0.5% |
| Total | 1,010 | 100.0% |
Employment Status by Age in Orchard Grass Hills
According to the labor force statistics for Orchard Grass Hills, out of the total population over 16 years of age (1,325), 78.5% or 1,040 individuals are in the labor force, with 2.7% or 28 of them unemployed. The age group with the highest labor force participation rate is 45 to 54 years, with 99.3% or 270 individuals in the labor force. Within the labor force, the 16 to 19 years age range has the highest percentage of unemployed individuals, with 25.9% or 15 of them being unemployed.
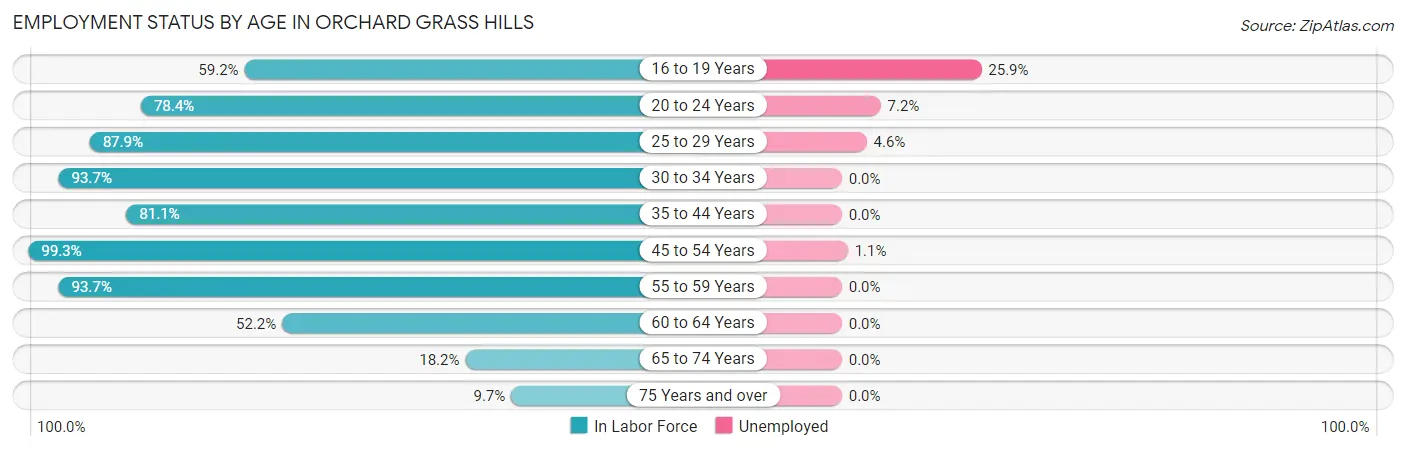
| Age Bracket | In Labor Force | Unemployed |
| 16 to 19 Years | 58 (59.2%) | 15 (25.9%) |
| 20 to 24 Years | 69 (78.4%) | 5 (7.2%) |
| 25 to 29 Years | 109 (87.9%) | 5 (4.6%) |
| 30 to 34 Years | 148 (93.7%) | 0 (0.0%) |
| 35 to 44 Years | 261 (81.1%) | 0 (0.0%) |
| 45 to 54 Years | 270 (99.3%) | 3 (1.1%) |
| 55 to 59 Years | 74 (93.7%) | 0 (0.0%) |
| 60 to 64 Years | 35 (52.2%) | 0 (0.0%) |
| 65 to 74 Years | 10 (18.2%) | 0 (0.0%) |
| 75 Years and over | 6 (9.7%) | 0 (0.0%) |
| Total | 1,040 (78.5%) | 28 (2.7%) |
Employment Status by Educational Attainment in Orchard Grass Hills
According to labor force statistics for Orchard Grass Hills, 87.8% of individuals (897) out of the total population between 25 and 64 years of age (1,022) are in the labor force, with 0.9% or 8 of them being unemployed. The group with the highest labor force participation rate are those with the educational attainment of less than high school, with 100.0% or 10 individuals in the labor force. Within the labor force, individuals with bachelor's degree or higher education have the highest percentage of unemployment, with 1.8% or 8 of them being unemployed.
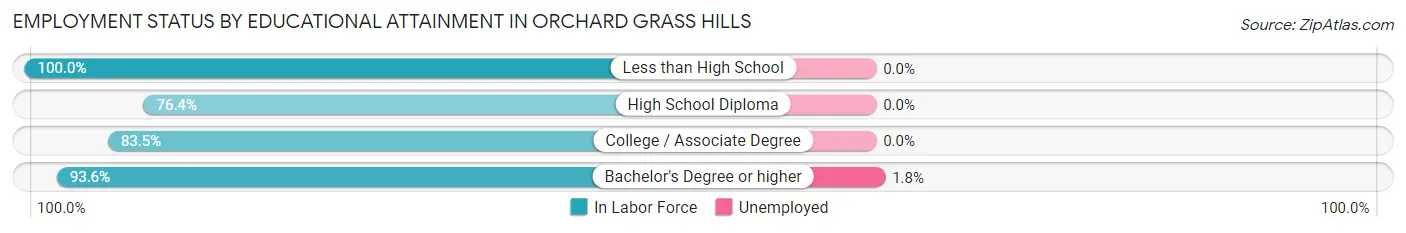
| Educational Attainment | In Labor Force | Unemployed |
| Less than High School | 10 (100.0%) | 0 (0.0%) |
| High School Diploma | 81 (76.4%) | 0 (0.0%) |
| College / Associate Degree | 349 (83.5%) | 0 (0.0%) |
| Bachelor's Degree or higher | 457 (93.6%) | 9 (1.8%) |
| Total | 897 (87.8%) | 9 (0.9%) |
Employment Occupations by Sex in Orchard Grass Hills
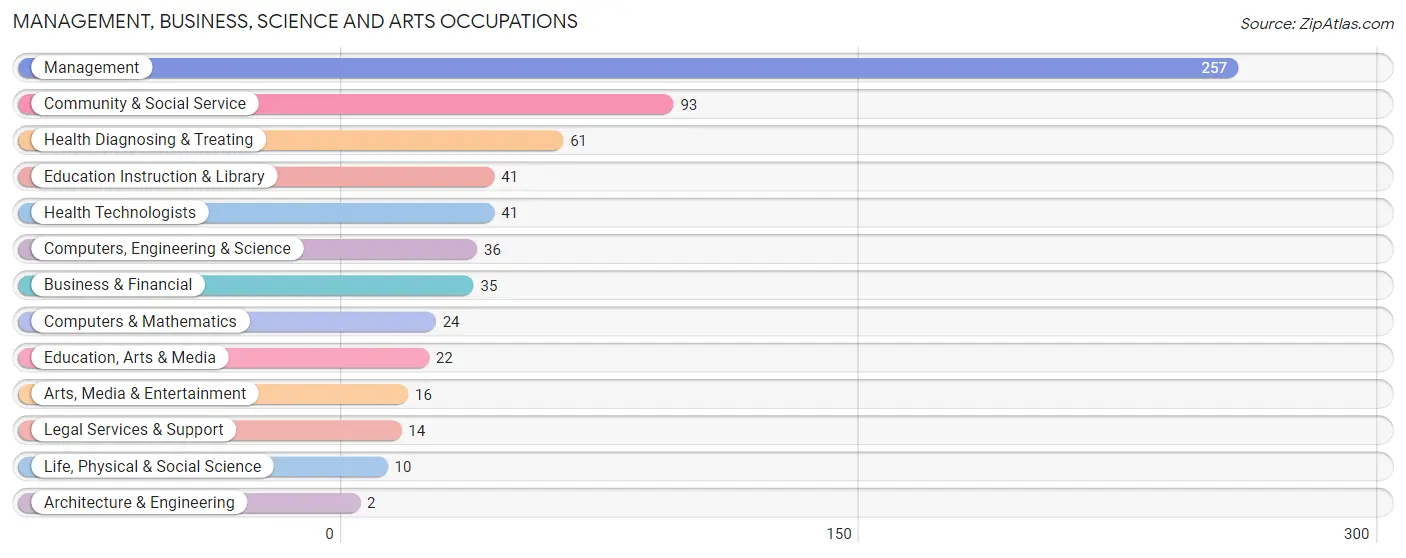
Management, Business, Science and Arts Occupations
The most common Management, Business, Science and Arts occupations in Orchard Grass Hills are Management (257 | 25.4%), Community & Social Service (93 | 9.2%), Health Diagnosing & Treating (61 | 6.0%), Education Instruction & Library (41 | 4.1%), and Health Technologists (41 | 4.1%).
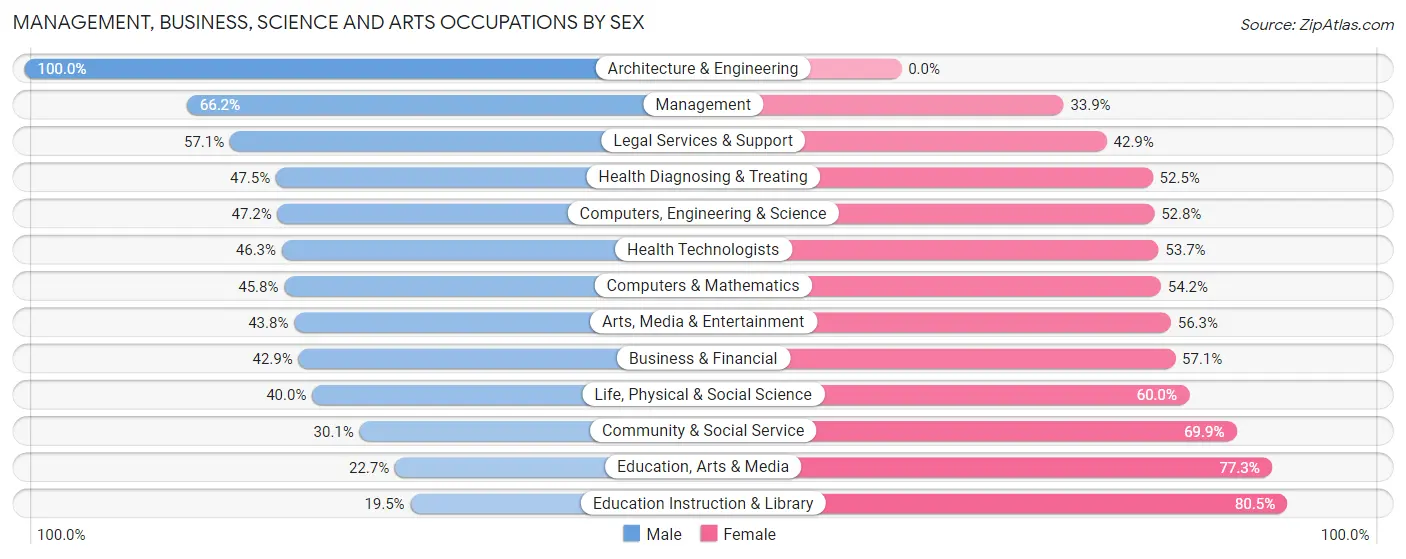
Management, Business, Science and Arts Occupations by Sex
Within the Management, Business, Science and Arts occupations in Orchard Grass Hills, the most male-oriented occupations are Architecture & Engineering (100.0%), Management (66.1%), and Legal Services & Support (57.1%), while the most female-oriented occupations are Education Instruction & Library (80.5%), Education, Arts & Media (77.3%), and Community & Social Service (69.9%).
| Occupation | Male | Female |
| Management | 170 (66.1%) | 87 (33.9%) |
| Business & Financial | 15 (42.9%) | 20 (57.1%) |
| Computers, Engineering & Science | 17 (47.2%) | 19 (52.8%) |
| Computers & Mathematics | 11 (45.8%) | 13 (54.2%) |
| Architecture & Engineering | 2 (100.0%) | 0 (0.0%) |
| Life, Physical & Social Science | 4 (40.0%) | 6 (60.0%) |
| Community & Social Service | 28 (30.1%) | 65 (69.9%) |
| Education, Arts & Media | 5 (22.7%) | 17 (77.3%) |
| Legal Services & Support | 8 (57.1%) | 6 (42.9%) |
| Education Instruction & Library | 8 (19.5%) | 33 (80.5%) |
| Arts, Media & Entertainment | 7 (43.8%) | 9 (56.2%) |
| Health Diagnosing & Treating | 29 (47.5%) | 32 (52.5%) |
| Health Technologists | 19 (46.3%) | 22 (53.7%) |
| Total (Category) | 259 (53.7%) | 223 (46.3%) |
| Total (Overall) | 566 (55.9%) | 446 (44.1%) |
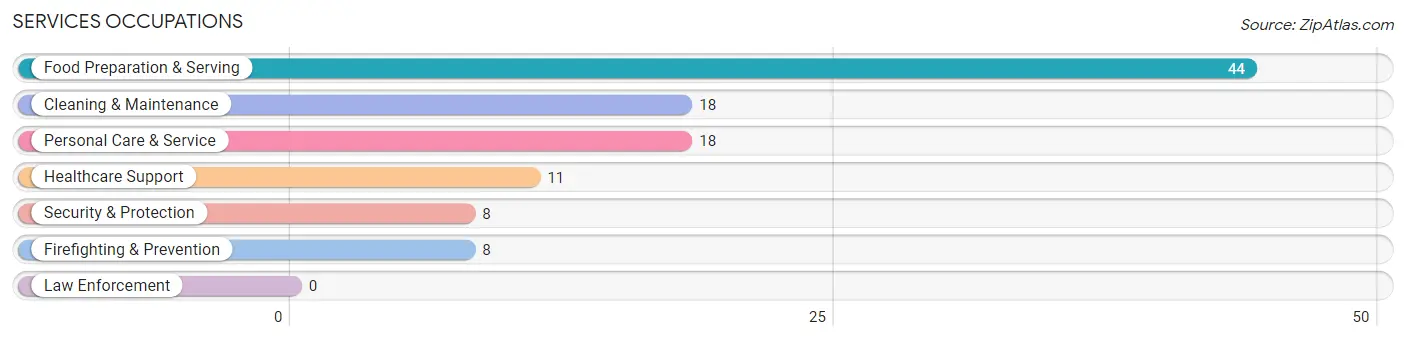
Services Occupations
The most common Services occupations in Orchard Grass Hills are Food Preparation & Serving (44 | 4.3%), Cleaning & Maintenance (18 | 1.8%), Personal Care & Service (18 | 1.8%), Healthcare Support (11 | 1.1%), and Security & Protection (8 | 0.8%).
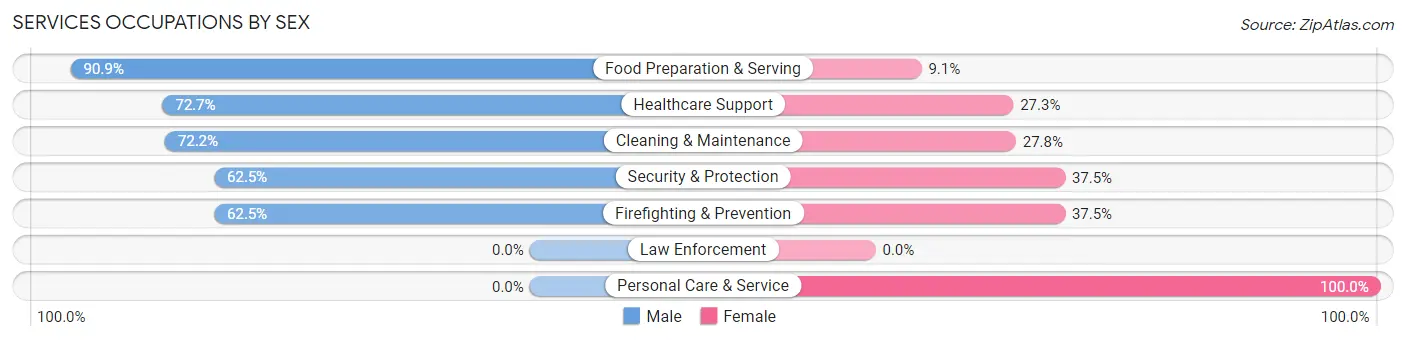
Services Occupations by Sex
Within the Services occupations in Orchard Grass Hills, the most male-oriented occupations are Food Preparation & Serving (90.9%), Healthcare Support (72.7%), and Cleaning & Maintenance (72.2%), while the most female-oriented occupations are Personal Care & Service (100.0%), Security & Protection (37.5%), and Firefighting & Prevention (37.5%).
| Occupation | Male | Female |
| Healthcare Support | 8 (72.7%) | 3 (27.3%) |
| Security & Protection | 5 (62.5%) | 3 (37.5%) |
| Firefighting & Prevention | 5 (62.5%) | 3 (37.5%) |
| Law Enforcement | 0 (0.0%) | 0 (0.0%) |
| Food Preparation & Serving | 40 (90.9%) | 4 (9.1%) |
| Cleaning & Maintenance | 13 (72.2%) | 5 (27.8%) |
| Personal Care & Service | 0 (0.0%) | 18 (100.0%) |
| Total (Category) | 66 (66.7%) | 33 (33.3%) |
| Total (Overall) | 566 (55.9%) | 446 (44.1%) |
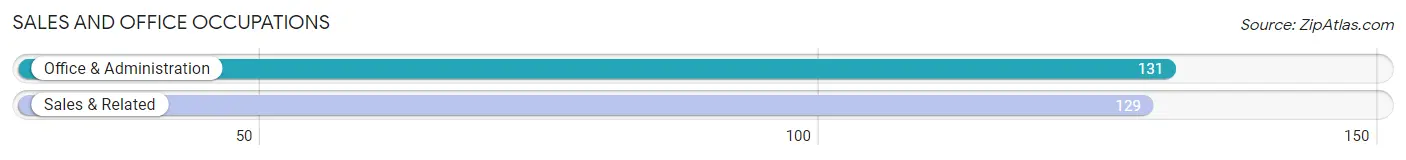
Sales and Office Occupations
The most common Sales and Office occupations in Orchard Grass Hills are Office & Administration (131 | 12.9%), and Sales & Related (129 | 12.8%).
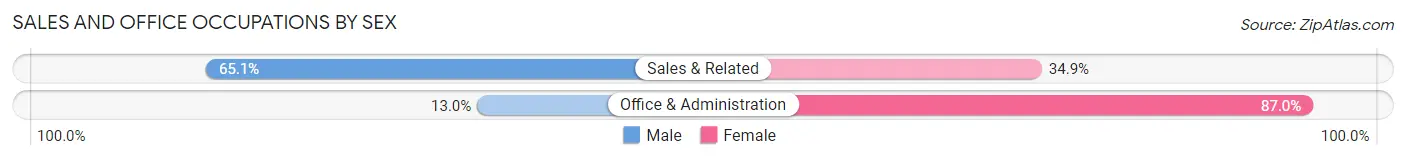
Sales and Office Occupations by Sex
| Occupation | Male | Female |
| Sales & Related | 84 (65.1%) | 45 (34.9%) |
| Office & Administration | 17 (13.0%) | 114 (87.0%) |
| Total (Category) | 101 (38.9%) | 159 (61.2%) |
| Total (Overall) | 566 (55.9%) | 446 (44.1%) |
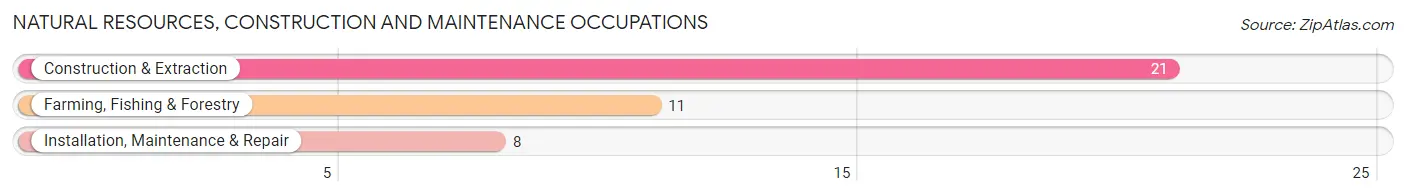
Natural Resources, Construction and Maintenance Occupations
The most common Natural Resources, Construction and Maintenance occupations in Orchard Grass Hills are Construction & Extraction (21 | 2.1%), Farming, Fishing & Forestry (11 | 1.1%), and Installation, Maintenance & Repair (8 | 0.8%).
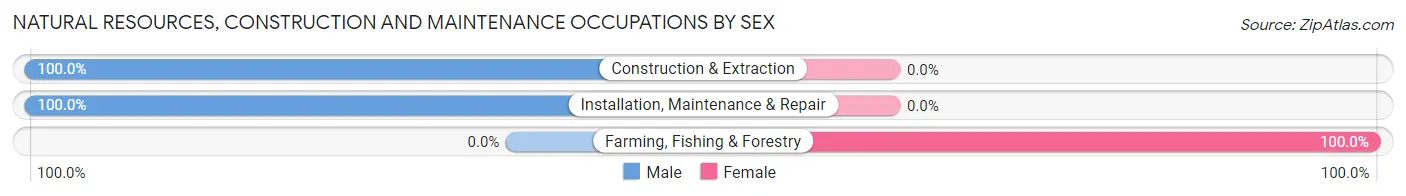
Natural Resources, Construction and Maintenance Occupations by Sex
| Occupation | Male | Female |
| Farming, Fishing & Forestry | 0 (0.0%) | 11 (100.0%) |
| Construction & Extraction | 21 (100.0%) | 0 (0.0%) |
| Installation, Maintenance & Repair | 8 (100.0%) | 0 (0.0%) |
| Total (Category) | 29 (72.5%) | 11 (27.5%) |
| Total (Overall) | 566 (55.9%) | 446 (44.1%) |
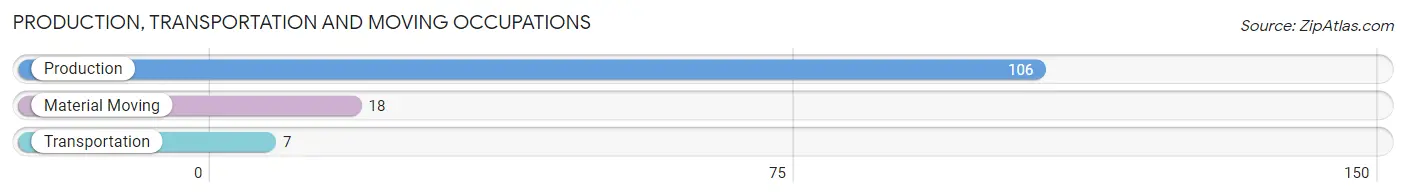
Production, Transportation and Moving Occupations
The most common Production, Transportation and Moving occupations in Orchard Grass Hills are Production (106 | 10.5%), Material Moving (18 | 1.8%), and Transportation (7 | 0.7%).
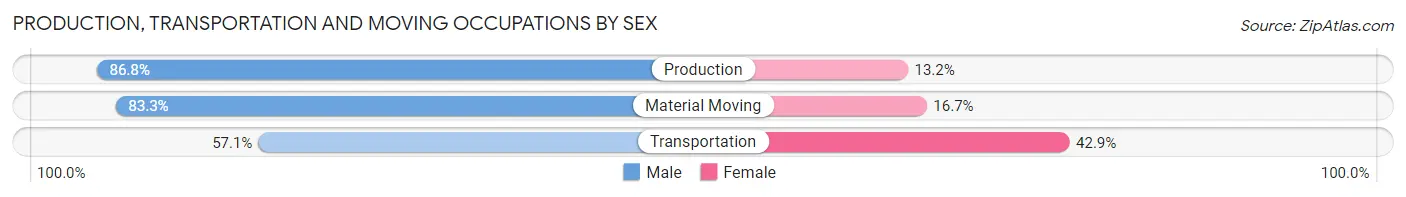
Production, Transportation and Moving Occupations by Sex
| Occupation | Male | Female |
| Production | 92 (86.8%) | 14 (13.2%) |
| Transportation | 4 (57.1%) | 3 (42.9%) |
| Material Moving | 15 (83.3%) | 3 (16.7%) |
| Total (Category) | 111 (84.7%) | 20 (15.3%) |
| Total (Overall) | 566 (55.9%) | 446 (44.1%) |
Employment Industries by Sex in Orchard Grass Hills
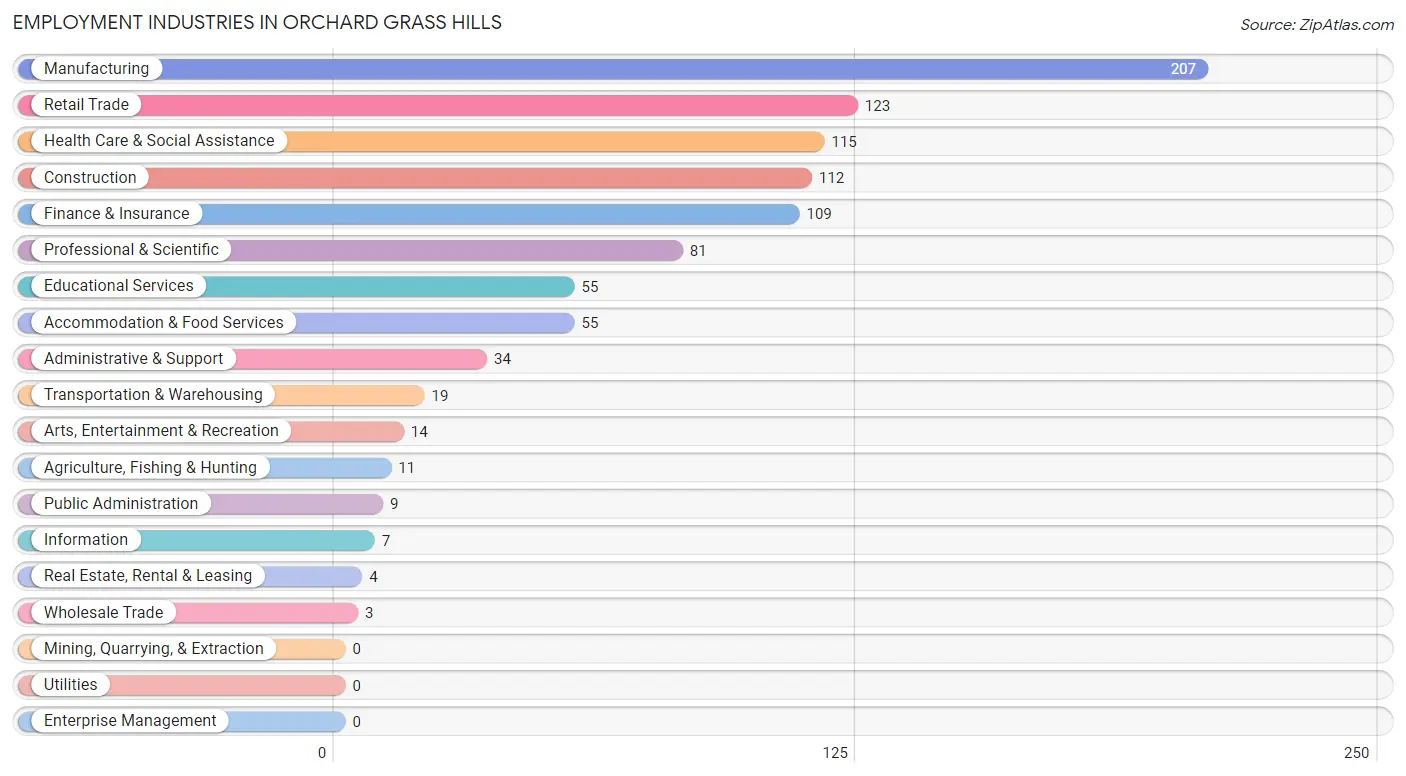
Employment Industries in Orchard Grass Hills
The major employment industries in Orchard Grass Hills include Manufacturing (207 | 20.4%), Retail Trade (123 | 12.1%), Health Care & Social Assistance (115 | 11.4%), Construction (112 | 11.1%), and Finance & Insurance (109 | 10.8%).
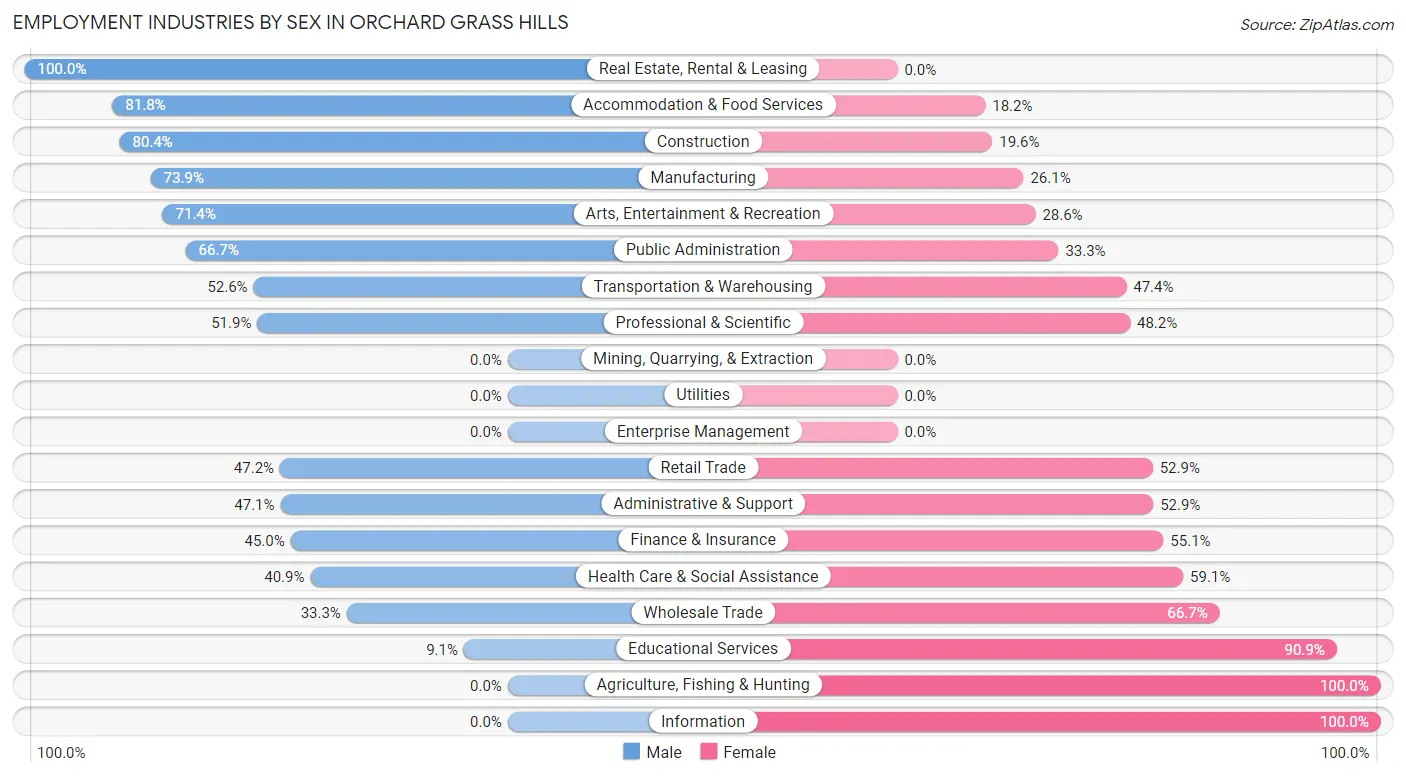
Employment Industries by Sex in Orchard Grass Hills
The Orchard Grass Hills industries that see more men than women are Real Estate, Rental & Leasing (100.0%), Accommodation & Food Services (81.8%), and Construction (80.4%), whereas the industries that tend to have a higher number of women are Agriculture, Fishing & Hunting (100.0%), Information (100.0%), and Educational Services (90.9%).
| Industry | Male | Female |
| Agriculture, Fishing & Hunting | 0 (0.0%) | 11 (100.0%) |
| Mining, Quarrying, & Extraction | 0 (0.0%) | 0 (0.0%) |
| Construction | 90 (80.4%) | 22 (19.6%) |
| Manufacturing | 153 (73.9%) | 54 (26.1%) |
| Wholesale Trade | 1 (33.3%) | 2 (66.7%) |
| Retail Trade | 58 (47.1%) | 65 (52.8%) |
| Transportation & Warehousing | 10 (52.6%) | 9 (47.4%) |
| Utilities | 0 (0.0%) | 0 (0.0%) |
| Information | 0 (0.0%) | 7 (100.0%) |
| Finance & Insurance | 49 (45.0%) | 60 (55.0%) |
| Real Estate, Rental & Leasing | 4 (100.0%) | 0 (0.0%) |
| Professional & Scientific | 42 (51.8%) | 39 (48.1%) |
| Enterprise Management | 0 (0.0%) | 0 (0.0%) |
| Administrative & Support | 16 (47.1%) | 18 (52.9%) |
| Educational Services | 5 (9.1%) | 50 (90.9%) |
| Health Care & Social Assistance | 47 (40.9%) | 68 (59.1%) |
| Arts, Entertainment & Recreation | 10 (71.4%) | 4 (28.6%) |
| Accommodation & Food Services | 45 (81.8%) | 10 (18.2%) |
| Public Administration | 6 (66.7%) | 3 (33.3%) |
| Total | 566 (55.9%) | 446 (44.1%) |
Education in Orchard Grass Hills
School Enrollment in Orchard Grass Hills
The most common levels of schooling among the 551 students in Orchard Grass Hills are middle school (153 | 27.8%), elementary school (130 | 23.6%), and high school (102 | 18.5%).
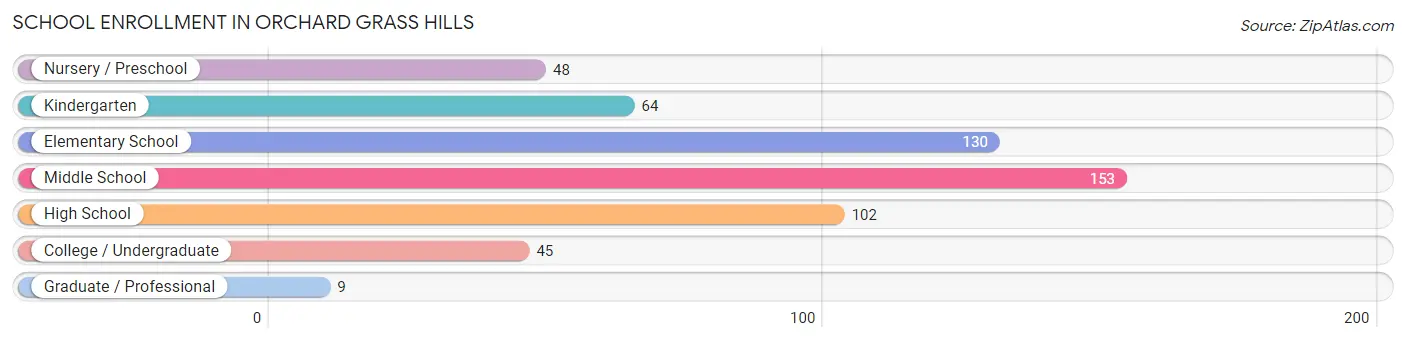
| School Level | # Students | % Students |
| Nursery / Preschool | 48 | 8.7% |
| Kindergarten | 64 | 11.6% |
| Elementary School | 130 | 23.6% |
| Middle School | 153 | 27.8% |
| High School | 102 | 18.5% |
| College / Undergraduate | 45 | 8.2% |
| Graduate / Professional | 9 | 1.6% |
| Total | 551 | 100.0% |
School Enrollment by Age by Funding Source in Orchard Grass Hills
Out of a total of 551 students who are enrolled in schools in Orchard Grass Hills, 46 (8.3%) attend a private institution, while the remaining 505 (91.7%) are enrolled in public schools. The age group of 20 to 24 year olds has the highest likelihood of being enrolled in private schools, with 12 (100.0% in the age bracket) enrolled. Conversely, the age group of 15 to 17 year olds has the lowest likelihood of being enrolled in a private school, with 80 (100.0% in the age bracket) attending a public institution.
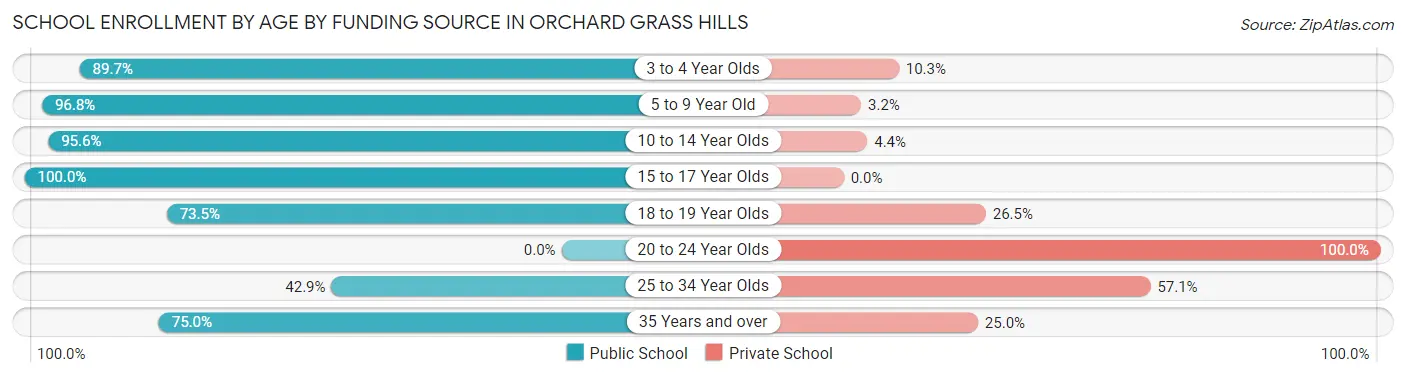
| Age Bracket | Public School | Private School |
| 3 to 4 Year Olds | 35 (89.7%) | 4 (10.3%) |
| 5 to 9 Year Old | 179 (96.8%) | 6 (3.2%) |
| 10 to 14 Year Olds | 174 (95.6%) | 8 (4.4%) |
| 15 to 17 Year Olds | 80 (100.0%) | 0 (0.0%) |
| 18 to 19 Year Olds | 25 (73.5%) | 9 (26.5%) |
| 20 to 24 Year Olds | 0 (0.0%) | 12 (100.0%) |
| 25 to 34 Year Olds | 3 (42.9%) | 4 (57.1%) |
| 35 Years and over | 9 (75.0%) | 3 (25.0%) |
| Total | 505 (91.7%) | 46 (8.3%) |
Educational Attainment by Field of Study in Orchard Grass Hills
Business (123 | 20.9%), bio, nature & agricultural (86 | 14.6%), science & technology (61 | 10.4%), liberal arts & history (55 | 9.4%), and psychology (50 | 8.5%) are the most common fields of study among 587 individuals in Orchard Grass Hills who have obtained a bachelor's degree or higher.
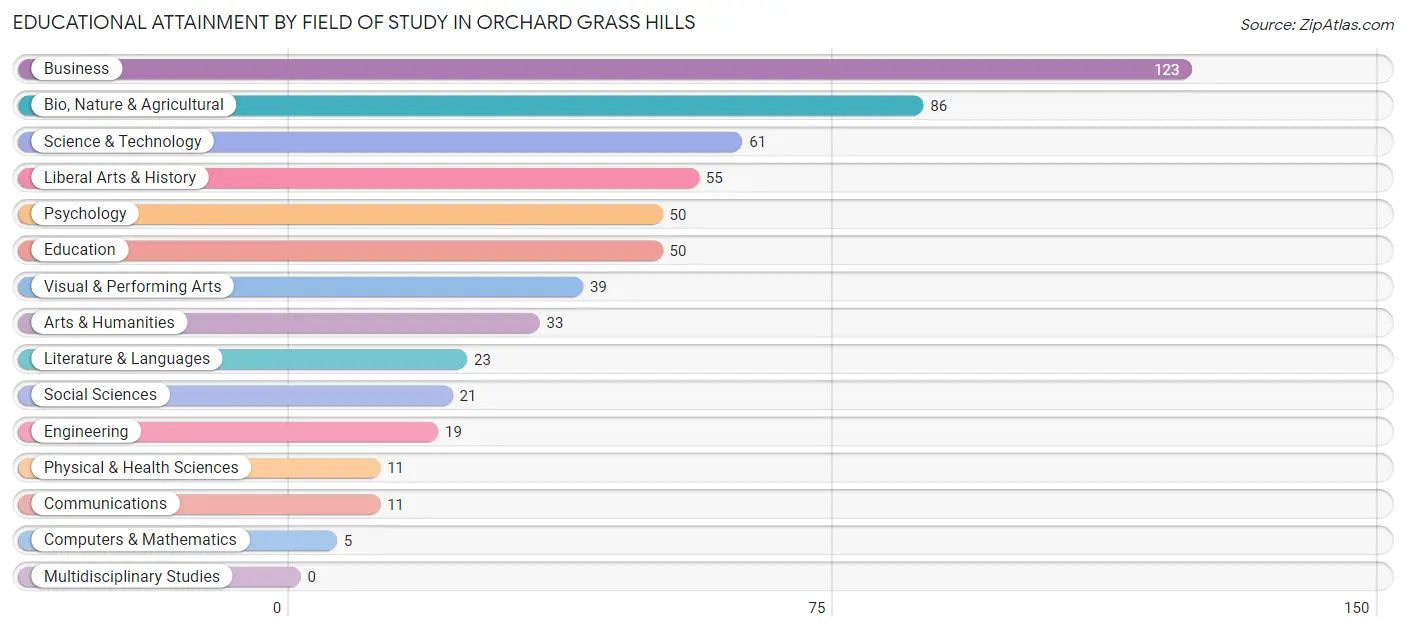
| Field of Study | # Graduates | % Graduates |
| Computers & Mathematics | 5 | 0.9% |
| Bio, Nature & Agricultural | 86 | 14.6% |
| Physical & Health Sciences | 11 | 1.9% |
| Psychology | 50 | 8.5% |
| Social Sciences | 21 | 3.6% |
| Engineering | 19 | 3.2% |
| Multidisciplinary Studies | 0 | 0.0% |
| Science & Technology | 61 | 10.4% |
| Business | 123 | 20.9% |
| Education | 50 | 8.5% |
| Literature & Languages | 23 | 3.9% |
| Liberal Arts & History | 55 | 9.4% |
| Visual & Performing Arts | 39 | 6.6% |
| Communications | 11 | 1.9% |
| Arts & Humanities | 33 | 5.6% |
| Total | 587 | 100.0% |
Transportation & Commute in Orchard Grass Hills
Vehicle Availability by Sex in Orchard Grass Hills
The most prevalent vehicle ownership categories in Orchard Grass Hills are males with 2 vehicles (341, accounting for 60.3%) and females with 2 vehicles (215, making up 76.8%).
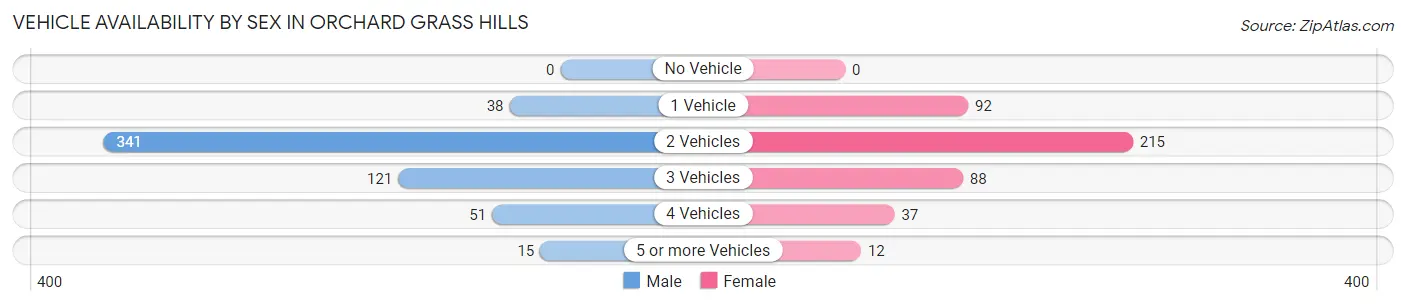
| Vehicles Available | Male | Female |
| No Vehicle | 0 (0.0%) | 0 (0.0%) |
| 1 Vehicle | 38 (6.7%) | 92 (20.7%) |
| 2 Vehicles | 341 (60.3%) | 215 (48.4%) |
| 3 Vehicles | 121 (21.4%) | 88 (19.8%) |
| 4 Vehicles | 51 (9.0%) | 37 (8.3%) |
| 5 or more Vehicles | 15 (2.6%) | 12 (2.7%) |
| Total | 566 (100.0%) | 444 (100.0%) |
Commute Time in Orchard Grass Hills
The most frequently occuring commute durations in Orchard Grass Hills are 20 to 24 minutes (183 commuters, 20.9%), 5 to 9 minutes (153 commuters, 17.5%), and 25 to 29 minutes (110 commuters, 12.6%).
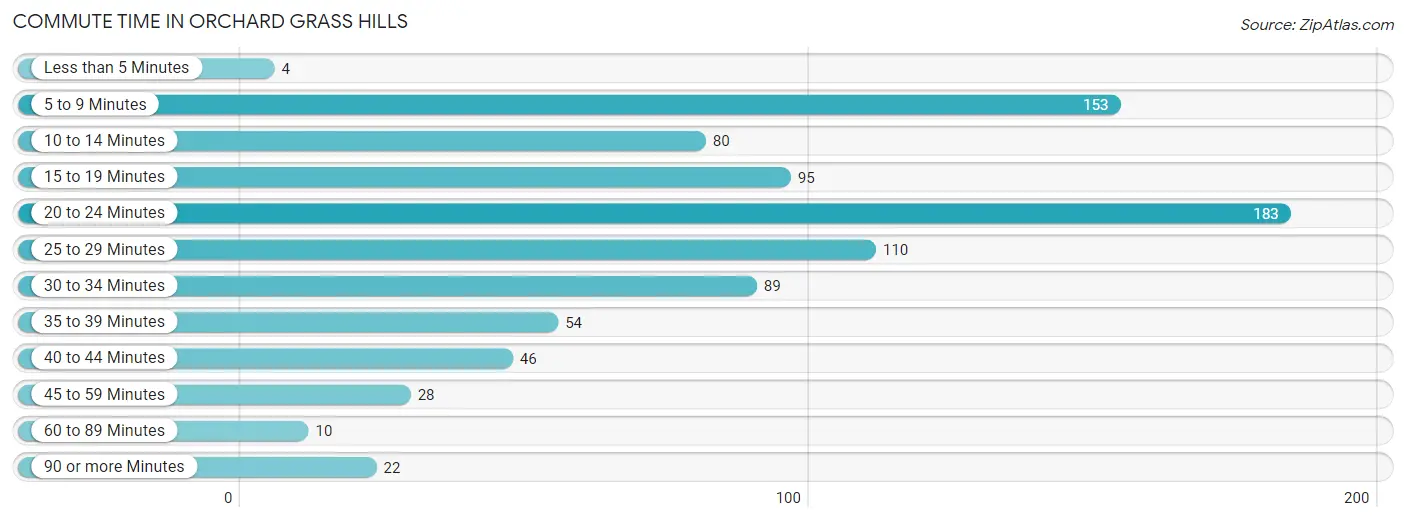
| Commute Time | # Commuters | % Commuters |
| Less than 5 Minutes | 4 | 0.5% |
| 5 to 9 Minutes | 153 | 17.5% |
| 10 to 14 Minutes | 80 | 9.1% |
| 15 to 19 Minutes | 95 | 10.9% |
| 20 to 24 Minutes | 183 | 20.9% |
| 25 to 29 Minutes | 110 | 12.6% |
| 30 to 34 Minutes | 89 | 10.2% |
| 35 to 39 Minutes | 54 | 6.2% |
| 40 to 44 Minutes | 46 | 5.3% |
| 45 to 59 Minutes | 28 | 3.2% |
| 60 to 89 Minutes | 10 | 1.1% |
| 90 or more Minutes | 22 | 2.5% |
Commute Time by Sex in Orchard Grass Hills
The most common commute times in Orchard Grass Hills are 5 to 9 minutes (124 commuters, 24.1%) for males and 20 to 24 minutes (90 commuters, 25.0%) for females.
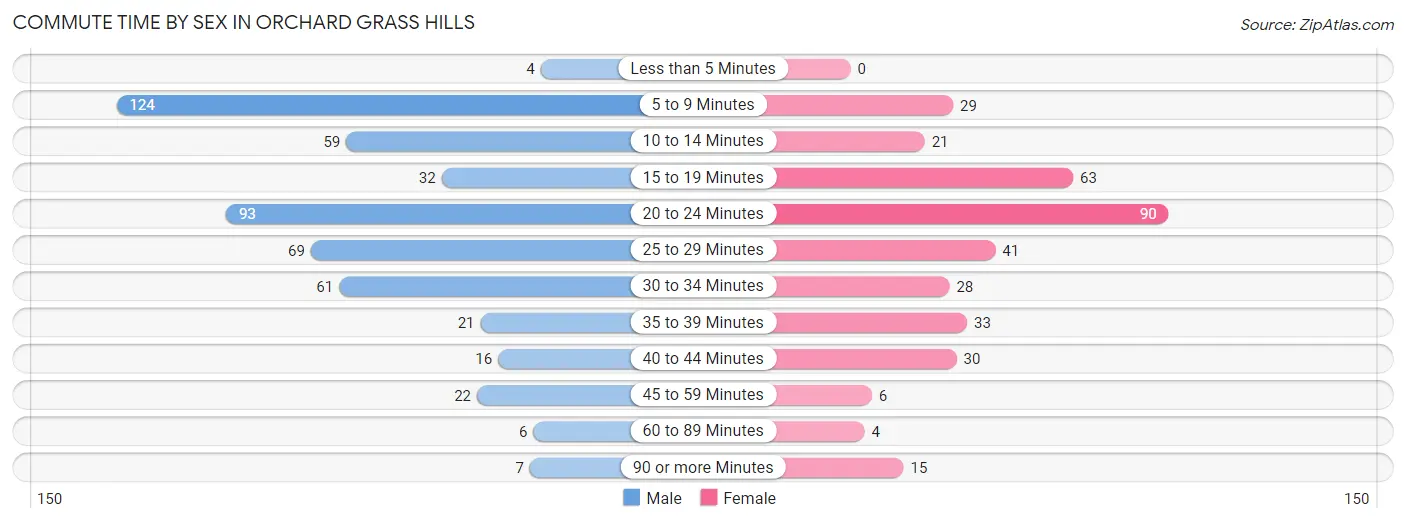
| Commute Time | Male | Female |
| Less than 5 Minutes | 4 (0.8%) | 0 (0.0%) |
| 5 to 9 Minutes | 124 (24.1%) | 29 (8.1%) |
| 10 to 14 Minutes | 59 (11.5%) | 21 (5.8%) |
| 15 to 19 Minutes | 32 (6.2%) | 63 (17.5%) |
| 20 to 24 Minutes | 93 (18.1%) | 90 (25.0%) |
| 25 to 29 Minutes | 69 (13.4%) | 41 (11.4%) |
| 30 to 34 Minutes | 61 (11.9%) | 28 (7.8%) |
| 35 to 39 Minutes | 21 (4.1%) | 33 (9.2%) |
| 40 to 44 Minutes | 16 (3.1%) | 30 (8.3%) |
| 45 to 59 Minutes | 22 (4.3%) | 6 (1.7%) |
| 60 to 89 Minutes | 6 (1.2%) | 4 (1.1%) |
| 90 or more Minutes | 7 (1.4%) | 15 (4.2%) |
Time of Departure to Work by Sex in Orchard Grass Hills
The most frequent times of departure to work in Orchard Grass Hills are 4:00 PM to 11:59 PM (82, 16.0%) for males and 7:00 AM to 7:29 AM (70, 19.4%) for females.
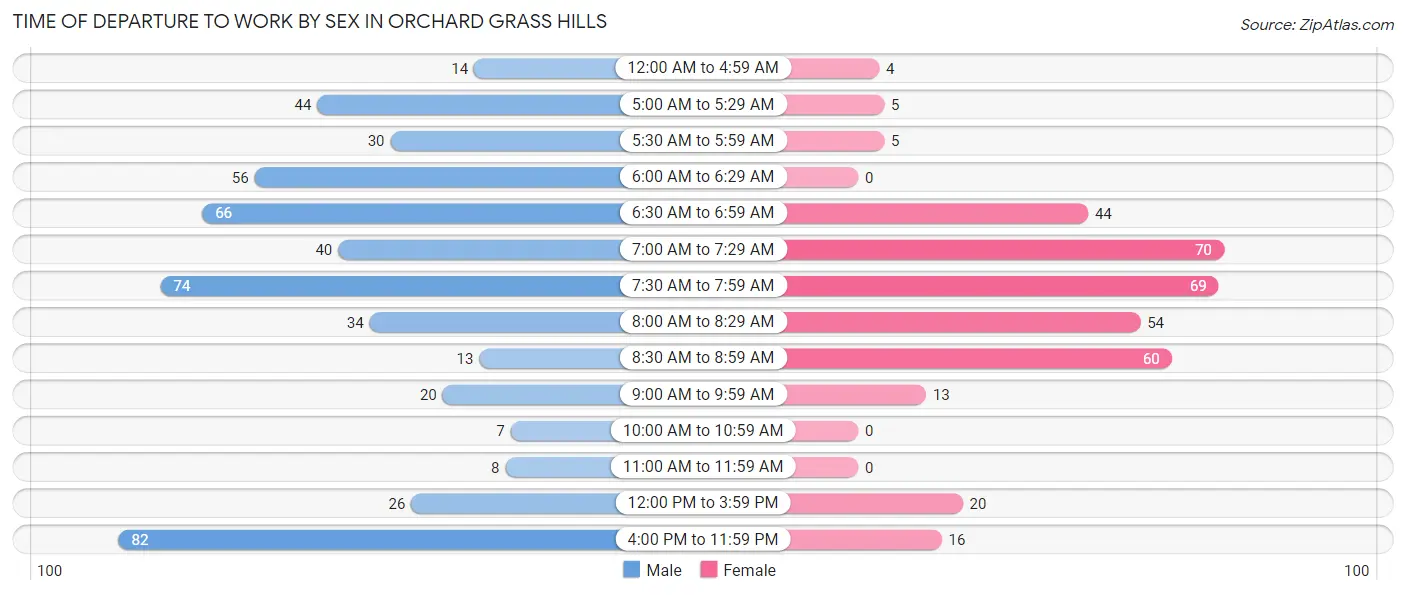
| Time of Departure | Male | Female |
| 12:00 AM to 4:59 AM | 14 (2.7%) | 4 (1.1%) |
| 5:00 AM to 5:29 AM | 44 (8.6%) | 5 (1.4%) |
| 5:30 AM to 5:59 AM | 30 (5.8%) | 5 (1.4%) |
| 6:00 AM to 6:29 AM | 56 (10.9%) | 0 (0.0%) |
| 6:30 AM to 6:59 AM | 66 (12.8%) | 44 (12.2%) |
| 7:00 AM to 7:29 AM | 40 (7.8%) | 70 (19.4%) |
| 7:30 AM to 7:59 AM | 74 (14.4%) | 69 (19.2%) |
| 8:00 AM to 8:29 AM | 34 (6.6%) | 54 (15.0%) |
| 8:30 AM to 8:59 AM | 13 (2.5%) | 60 (16.7%) |
| 9:00 AM to 9:59 AM | 20 (3.9%) | 13 (3.6%) |
| 10:00 AM to 10:59 AM | 7 (1.4%) | 0 (0.0%) |
| 11:00 AM to 11:59 AM | 8 (1.6%) | 0 (0.0%) |
| 12:00 PM to 3:59 PM | 26 (5.1%) | 20 (5.6%) |
| 4:00 PM to 11:59 PM | 82 (16.0%) | 16 (4.4%) |
| Total | 514 (100.0%) | 360 (100.0%) |
Housing Occupancy in Orchard Grass Hills
Occupancy by Ownership in Orchard Grass Hills
Of the total 641 dwellings in Orchard Grass Hills, owner-occupied units account for 497 (77.5%), while renter-occupied units make up 144 (22.5%).
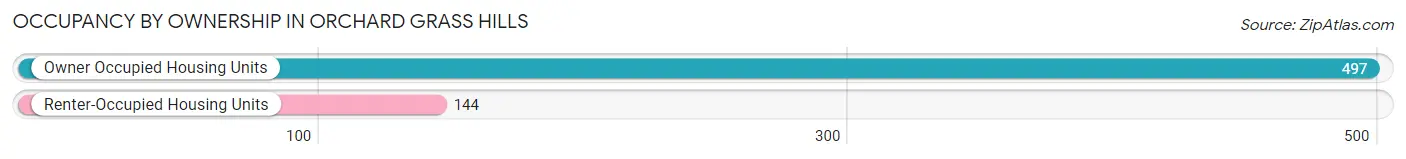
| Occupancy | # Housing Units | % Housing Units |
| Owner Occupied Housing Units | 497 | 77.5% |
| Renter-Occupied Housing Units | 144 | 22.5% |
| Total Occupied Housing Units | 641 | 100.0% |
Occupancy by Household Size in Orchard Grass Hills
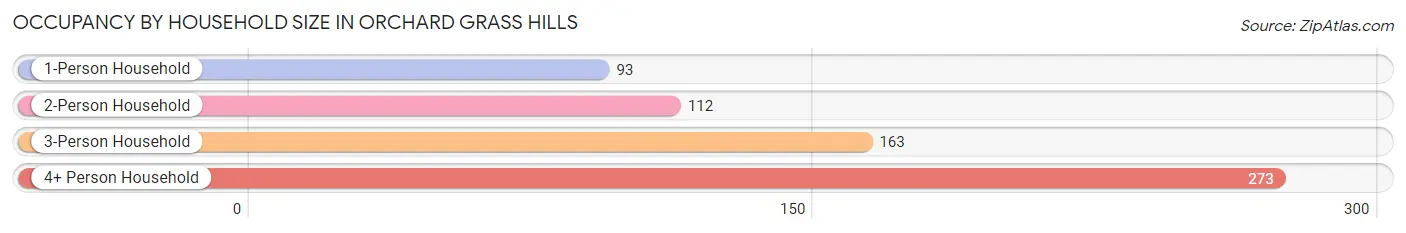
| Household Size | # Housing Units | % Housing Units |
| 1-Person Household | 93 | 14.5% |
| 2-Person Household | 112 | 17.5% |
| 3-Person Household | 163 | 25.4% |
| 4+ Person Household | 273 | 42.6% |
| Total Housing Units | 641 | 100.0% |
Occupancy by Ownership by Household Size in Orchard Grass Hills
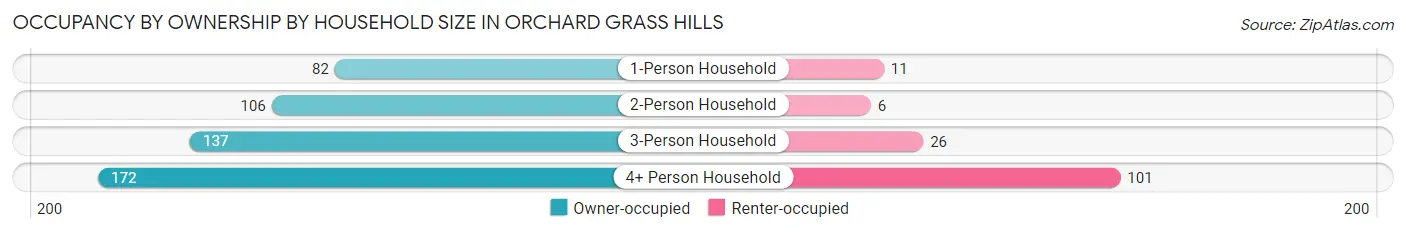
| Household Size | Owner-occupied | Renter-occupied |
| 1-Person Household | 82 (88.2%) | 11 (11.8%) |
| 2-Person Household | 106 (94.6%) | 6 (5.4%) |
| 3-Person Household | 137 (84.1%) | 26 (16.0%) |
| 4+ Person Household | 172 (63.0%) | 101 (37.0%) |
| Total Housing Units | 497 (77.5%) | 144 (22.5%) |
Occupancy by Educational Attainment in Orchard Grass Hills
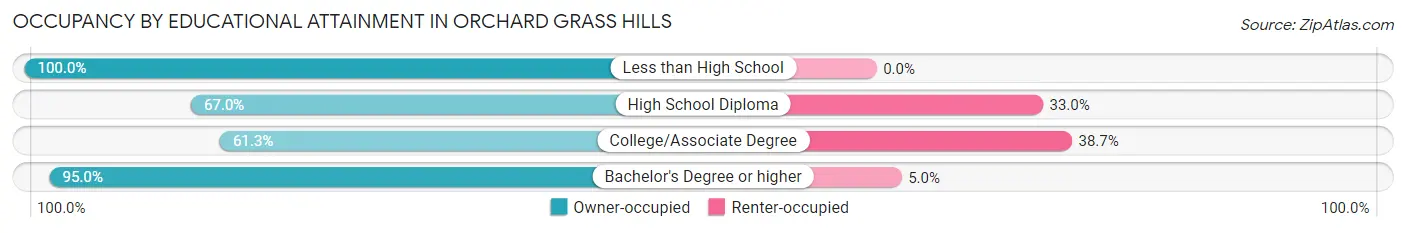
| Household Size | Owner-occupied | Renter-occupied |
| Less than High School | 9 (100.0%) | 0 (0.0%) |
| High School Diploma | 65 (67.0%) | 32 (33.0%) |
| College/Associate Degree | 155 (61.3%) | 98 (38.7%) |
| Bachelor's Degree or higher | 268 (95.0%) | 14 (5.0%) |
Occupancy by Age of Householder in Orchard Grass Hills
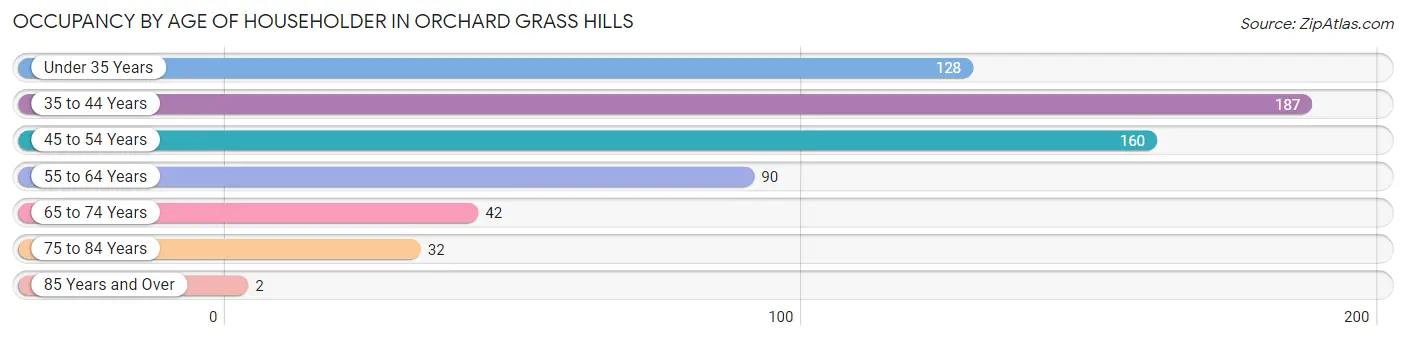
| Age Bracket | # Households | % Households |
| Under 35 Years | 128 | 20.0% |
| 35 to 44 Years | 187 | 29.2% |
| 45 to 54 Years | 160 | 25.0% |
| 55 to 64 Years | 90 | 14.0% |
| 65 to 74 Years | 42 | 6.6% |
| 75 to 84 Years | 32 | 5.0% |
| 85 Years and Over | 2 | 0.3% |
| Total | 641 | 100.0% |
Housing Finances in Orchard Grass Hills
Median Income by Occupancy in Orchard Grass Hills
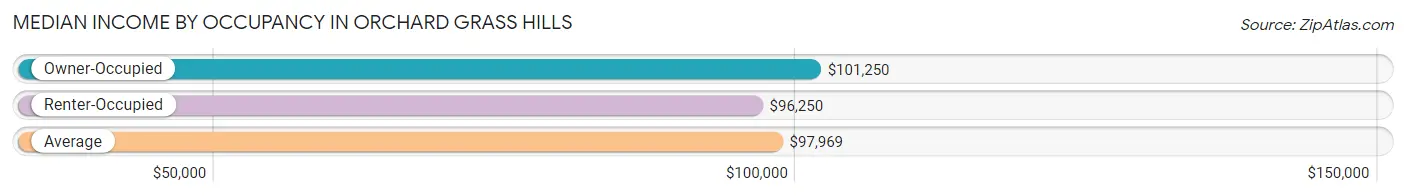
| Occupancy Type | # Households | Median Income |
| Owner-Occupied | 497 (77.5%) | $101,250 |
| Renter-Occupied | 144 (22.5%) | $96,250 |
| Average | 641 (100.0%) | $97,969 |
Occupancy by Householder Income Bracket in Orchard Grass Hills
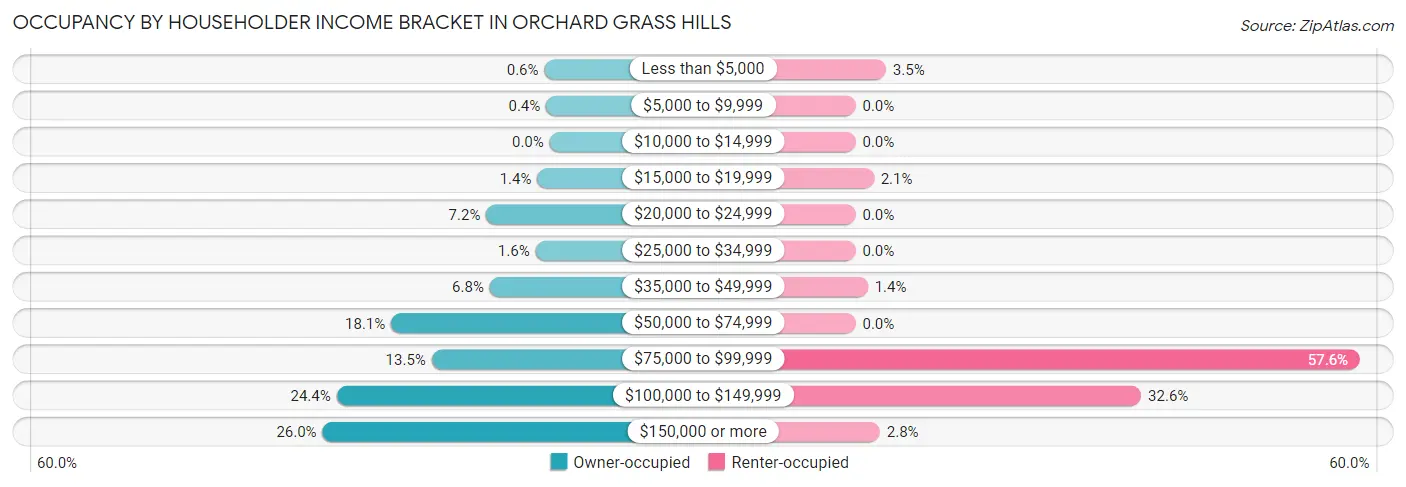
| Income Bracket | Owner-occupied | Renter-occupied |
| Less than $5,000 | 3 (0.6%) | 5 (3.5%) |
| $5,000 to $9,999 | 2 (0.4%) | 0 (0.0%) |
| $10,000 to $14,999 | 0 (0.0%) | 0 (0.0%) |
| $15,000 to $19,999 | 7 (1.4%) | 3 (2.1%) |
| $20,000 to $24,999 | 36 (7.2%) | 0 (0.0%) |
| $25,000 to $34,999 | 8 (1.6%) | 0 (0.0%) |
| $35,000 to $49,999 | 34 (6.8%) | 2 (1.4%) |
| $50,000 to $74,999 | 90 (18.1%) | 0 (0.0%) |
| $75,000 to $99,999 | 67 (13.5%) | 83 (57.6%) |
| $100,000 to $149,999 | 121 (24.3%) | 47 (32.6%) |
| $150,000 or more | 129 (26.0%) | 4 (2.8%) |
| Total | 497 (100.0%) | 144 (100.0%) |
Monthly Housing Cost Tiers in Orchard Grass Hills
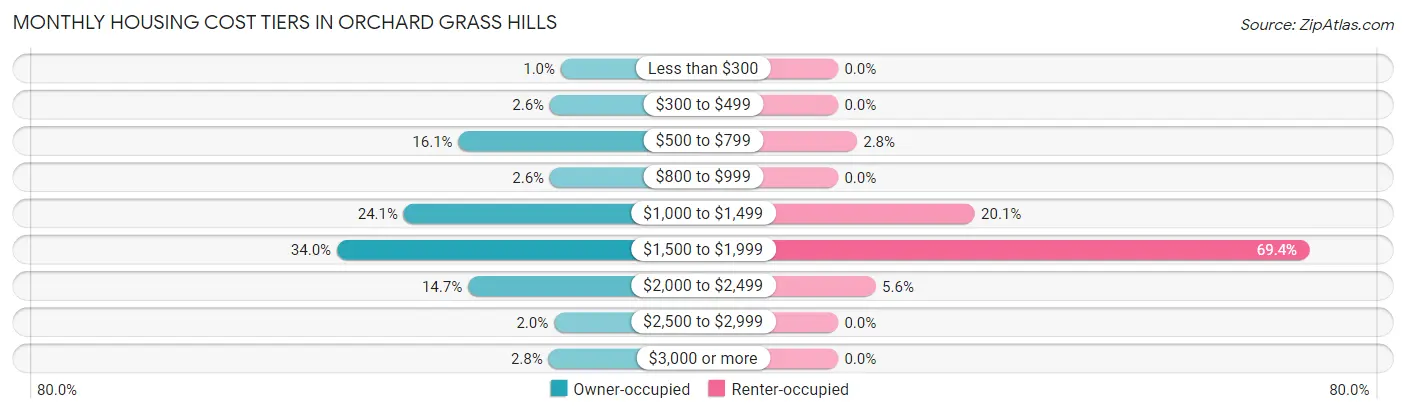
| Monthly Cost | Owner-occupied | Renter-occupied |
| Less than $300 | 5 (1.0%) | 0 (0.0%) |
| $300 to $499 | 13 (2.6%) | 0 (0.0%) |
| $500 to $799 | 80 (16.1%) | 4 (2.8%) |
| $800 to $999 | 13 (2.6%) | 0 (0.0%) |
| $1,000 to $1,499 | 120 (24.1%) | 29 (20.1%) |
| $1,500 to $1,999 | 169 (34.0%) | 100 (69.4%) |
| $2,000 to $2,499 | 73 (14.7%) | 8 (5.6%) |
| $2,500 to $2,999 | 10 (2.0%) | 0 (0.0%) |
| $3,000 or more | 14 (2.8%) | 0 (0.0%) |
| Total | 497 (100.0%) | 144 (100.0%) |
Physical Housing Characteristics in Orchard Grass Hills
Housing Structures in Orchard Grass Hills
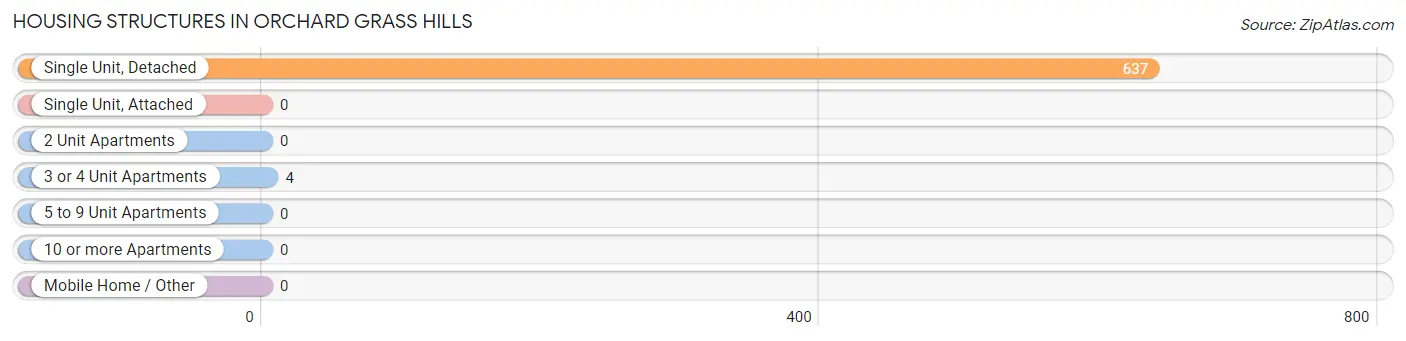
| Structure Type | # Housing Units | % Housing Units |
| Single Unit, Detached | 637 | 99.4% |
| Single Unit, Attached | 0 | 0.0% |
| 2 Unit Apartments | 0 | 0.0% |
| 3 or 4 Unit Apartments | 4 | 0.6% |
| 5 to 9 Unit Apartments | 0 | 0.0% |
| 10 or more Apartments | 0 | 0.0% |
| Mobile Home / Other | 0 | 0.0% |
| Total | 641 | 100.0% |
Housing Structures by Occupancy in Orchard Grass Hills
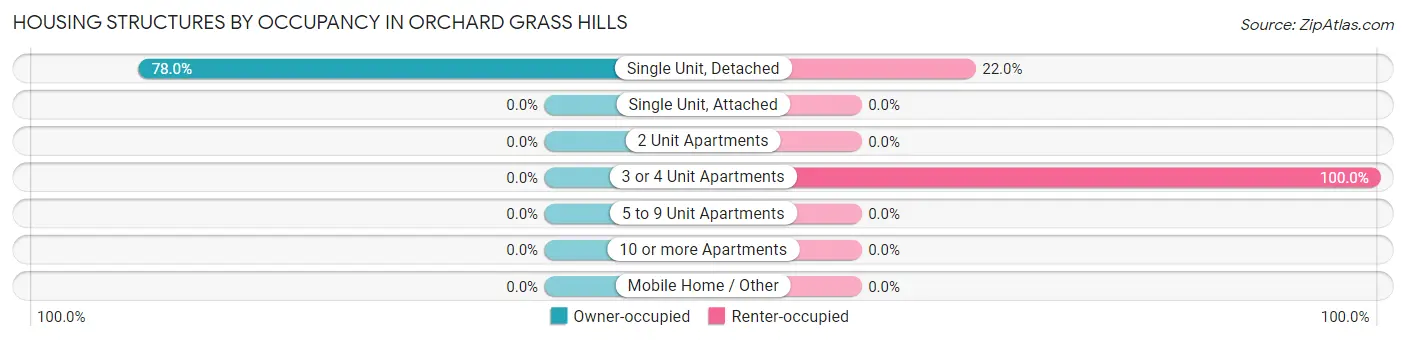
| Structure Type | Owner-occupied | Renter-occupied |
| Single Unit, Detached | 497 (78.0%) | 140 (22.0%) |
| Single Unit, Attached | 0 (0.0%) | 0 (0.0%) |
| 2 Unit Apartments | 0 (0.0%) | 0 (0.0%) |
| 3 or 4 Unit Apartments | 0 (0.0%) | 4 (100.0%) |
| 5 to 9 Unit Apartments | 0 (0.0%) | 0 (0.0%) |
| 10 or more Apartments | 0 (0.0%) | 0 (0.0%) |
| Mobile Home / Other | 0 (0.0%) | 0 (0.0%) |
| Total | 497 (77.5%) | 144 (22.5%) |
Housing Structures by Number of Rooms in Orchard Grass Hills
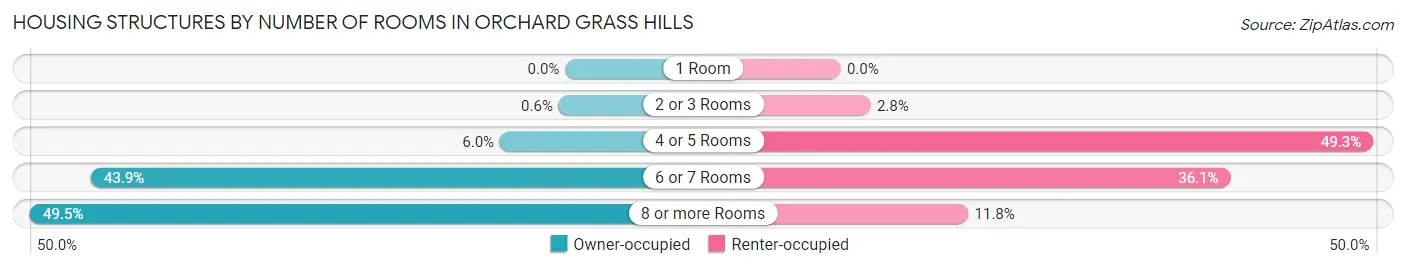
| Number of Rooms | Owner-occupied | Renter-occupied |
| 1 Room | 0 (0.0%) | 0 (0.0%) |
| 2 or 3 Rooms | 3 (0.6%) | 4 (2.8%) |
| 4 or 5 Rooms | 30 (6.0%) | 71 (49.3%) |
| 6 or 7 Rooms | 218 (43.9%) | 52 (36.1%) |
| 8 or more Rooms | 246 (49.5%) | 17 (11.8%) |
| Total | 497 (100.0%) | 144 (100.0%) |
Housing Structure by Heating Type in Orchard Grass Hills
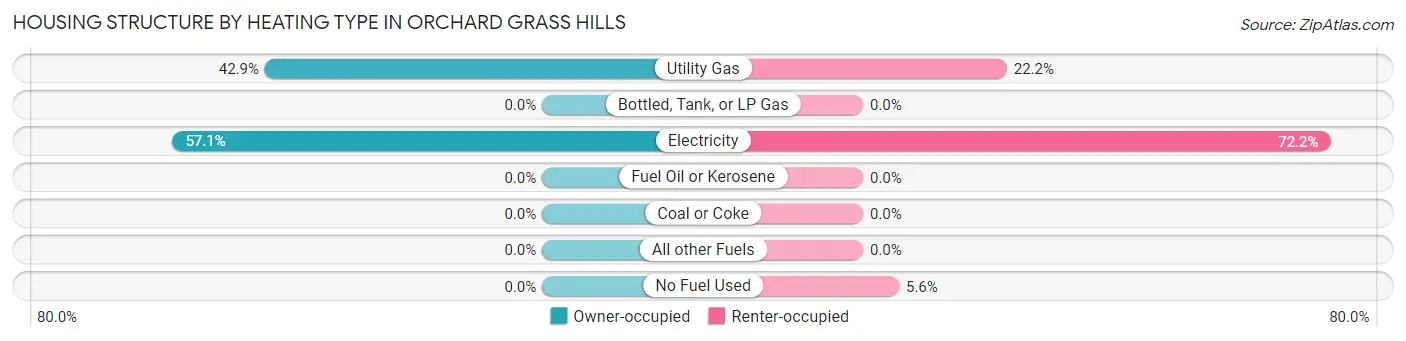
| Heating Type | Owner-occupied | Renter-occupied |
| Utility Gas | 213 (42.9%) | 32 (22.2%) |
| Bottled, Tank, or LP Gas | 0 (0.0%) | 0 (0.0%) |
| Electricity | 284 (57.1%) | 104 (72.2%) |
| Fuel Oil or Kerosene | 0 (0.0%) | 0 (0.0%) |
| Coal or Coke | 0 (0.0%) | 0 (0.0%) |
| All other Fuels | 0 (0.0%) | 0 (0.0%) |
| No Fuel Used | 0 (0.0%) | 8 (5.6%) |
| Total | 497 (100.0%) | 144 (100.0%) |
Household Vehicle Usage in Orchard Grass Hills
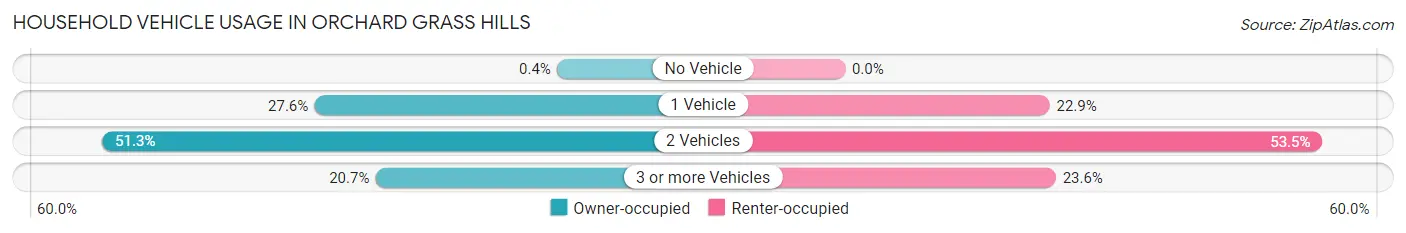
| Vehicles per Household | Owner-occupied | Renter-occupied |
| No Vehicle | 2 (0.4%) | 0 (0.0%) |
| 1 Vehicle | 137 (27.6%) | 33 (22.9%) |
| 2 Vehicles | 255 (51.3%) | 77 (53.5%) |
| 3 or more Vehicles | 103 (20.7%) | 34 (23.6%) |
| Total | 497 (100.0%) | 144 (100.0%) |
Real Estate & Mortgages in Orchard Grass Hills
Real Estate and Mortgage Overview in Orchard Grass Hills
| Characteristic | Without Mortgage | With Mortgage |
| Housing Units | 96 | 401 |
| Median Property Value | $195,500 | $267,300 |
| Median Household Income | $59,333 | $120 |
| Monthly Housing Costs | $626 | $14 |
| Real Estate Taxes | $2,511 | $0 |
Property Value by Mortgage Status in Orchard Grass Hills
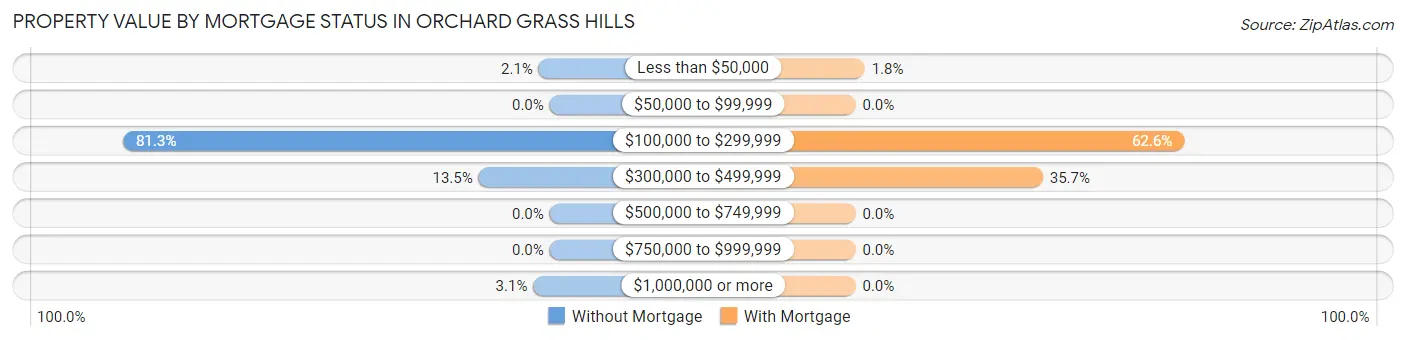
| Property Value | Without Mortgage | With Mortgage |
| Less than $50,000 | 2 (2.1%) | 7 (1.8%) |
| $50,000 to $99,999 | 0 (0.0%) | 0 (0.0%) |
| $100,000 to $299,999 | 78 (81.2%) | 251 (62.6%) |
| $300,000 to $499,999 | 13 (13.5%) | 143 (35.7%) |
| $500,000 to $749,999 | 0 (0.0%) | 0 (0.0%) |
| $750,000 to $999,999 | 0 (0.0%) | 0 (0.0%) |
| $1,000,000 or more | 3 (3.1%) | 0 (0.0%) |
| Total | 96 (100.0%) | 401 (100.0%) |
Household Income by Mortgage Status in Orchard Grass Hills
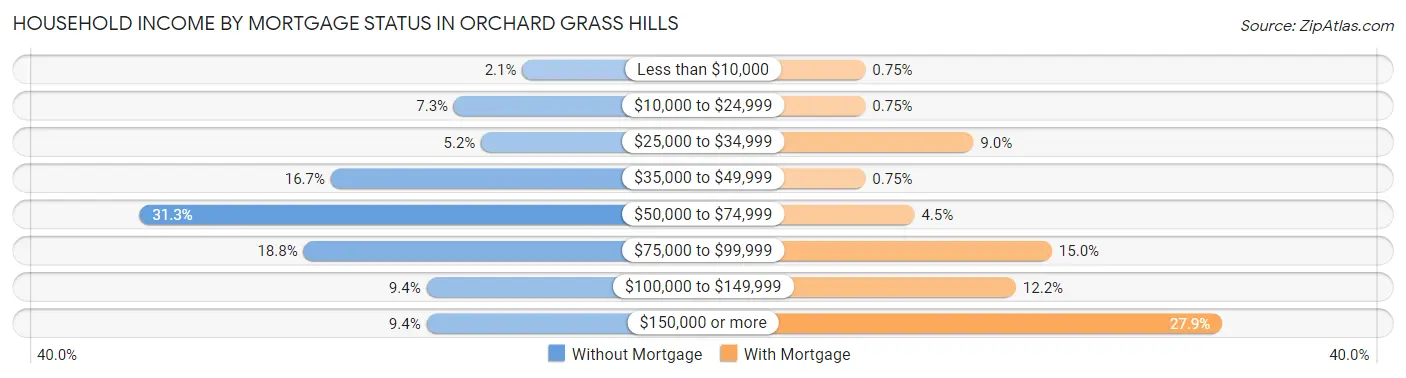
| Household Income | Without Mortgage | With Mortgage |
| Less than $10,000 | 2 (2.1%) | 3 (0.7%) |
| $10,000 to $24,999 | 7 (7.3%) | 3 (0.7%) |
| $25,000 to $34,999 | 5 (5.2%) | 36 (9.0%) |
| $35,000 to $49,999 | 16 (16.7%) | 3 (0.7%) |
| $50,000 to $74,999 | 30 (31.2%) | 18 (4.5%) |
| $75,000 to $99,999 | 18 (18.8%) | 60 (15.0%) |
| $100,000 to $149,999 | 9 (9.4%) | 49 (12.2%) |
| $150,000 or more | 9 (9.4%) | 112 (27.9%) |
| Total | 96 (100.0%) | 401 (100.0%) |
Property Value to Household Income Ratio in Orchard Grass Hills
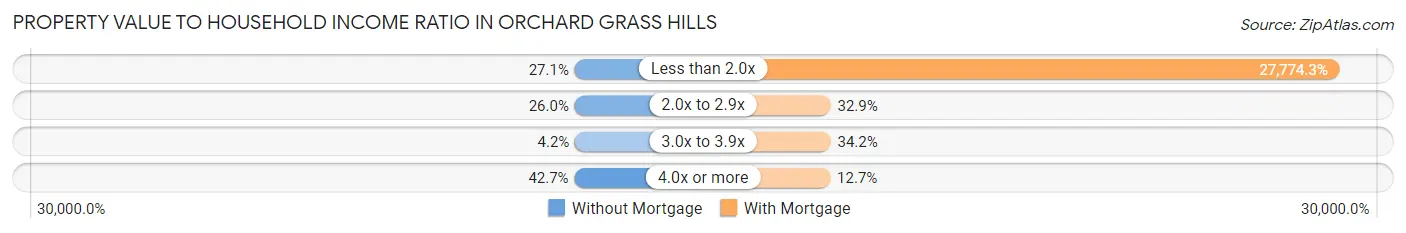
| Value-to-Income Ratio | Without Mortgage | With Mortgage |
| Less than 2.0x | 26 (27.1%) | 111,375 (27,774.3%) |
| 2.0x to 2.9x | 25 (26.0%) | 132 (32.9%) |
| 3.0x to 3.9x | 4 (4.2%) | 137 (34.2%) |
| 4.0x or more | 41 (42.7%) | 51 (12.7%) |
| Total | 96 (100.0%) | 401 (100.0%) |
Real Estate Taxes by Mortgage Status in Orchard Grass Hills
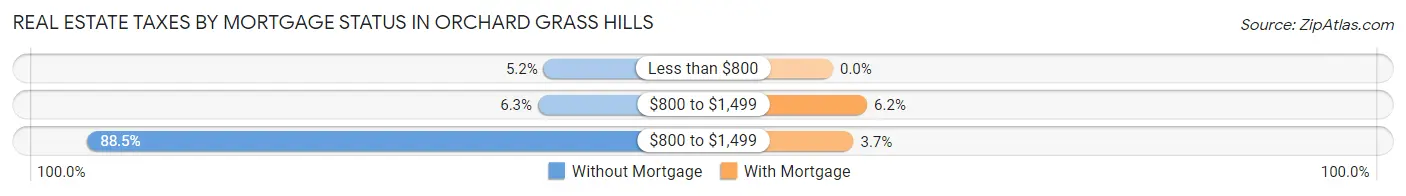
| Property Taxes | Without Mortgage | With Mortgage |
| Less than $800 | 5 (5.2%) | 0 (0.0%) |
| $800 to $1,499 | 6 (6.2%) | 25 (6.2%) |
| $800 to $1,499 | 85 (88.5%) | 15 (3.7%) |
| Total | 96 (100.0%) | 401 (100.0%) |
Health & Disability in Orchard Grass Hills
Health Insurance Coverage by Age in Orchard Grass Hills
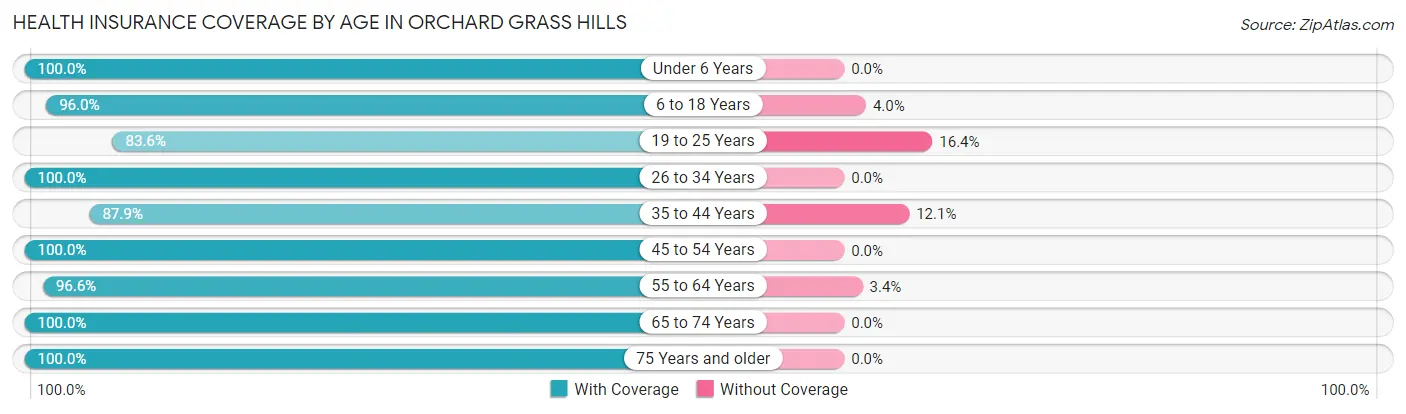
| Age Bracket | With Coverage | Without Coverage |
| Under 6 Years | 229 (100.0%) | 0 (0.0%) |
| 6 to 18 Years | 427 (96.0%) | 18 (4.0%) |
| 19 to 25 Years | 112 (83.6%) | 22 (16.4%) |
| 26 to 34 Years | 272 (100.0%) | 0 (0.0%) |
| 35 to 44 Years | 283 (87.9%) | 39 (12.1%) |
| 45 to 54 Years | 272 (100.0%) | 0 (0.0%) |
| 55 to 64 Years | 141 (96.6%) | 5 (3.4%) |
| 65 to 74 Years | 55 (100.0%) | 0 (0.0%) |
| 75 Years and older | 62 (100.0%) | 0 (0.0%) |
| Total | 1,853 (95.7%) | 84 (4.3%) |
Health Insurance Coverage by Citizenship Status in Orchard Grass Hills
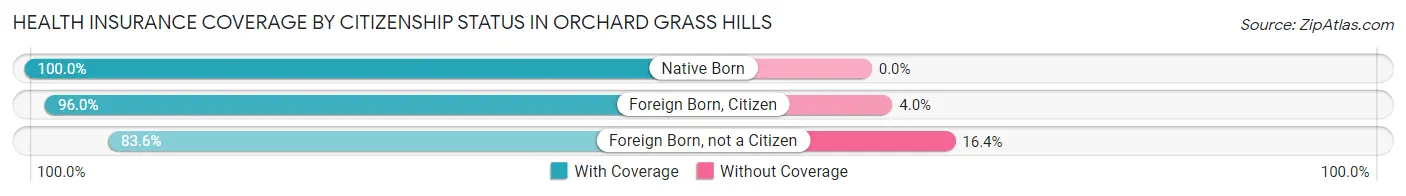
| Citizenship Status | With Coverage | Without Coverage |
| Native Born | 229 (100.0%) | 0 (0.0%) |
| Foreign Born, Citizen | 427 (96.0%) | 18 (4.0%) |
| Foreign Born, not a Citizen | 112 (83.6%) | 22 (16.4%) |
Health Insurance Coverage by Household Income in Orchard Grass Hills
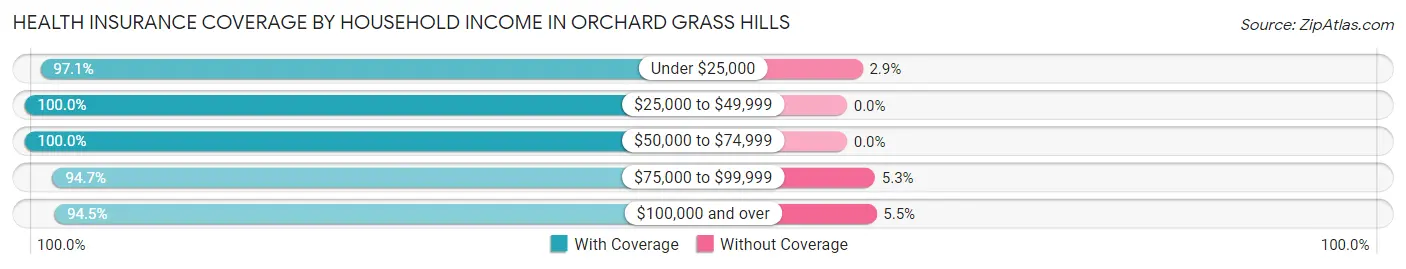
| Household Income | With Coverage | Without Coverage |
| Under $25,000 | 165 (97.1%) | 5 (2.9%) |
| $25,000 to $49,999 | 96 (100.0%) | 0 (0.0%) |
| $50,000 to $74,999 | 221 (100.0%) | 0 (0.0%) |
| $75,000 to $99,999 | 432 (94.7%) | 24 (5.3%) |
| $100,000 and over | 939 (94.5%) | 55 (5.5%) |
Public vs Private Health Insurance Coverage by Age in Orchard Grass Hills
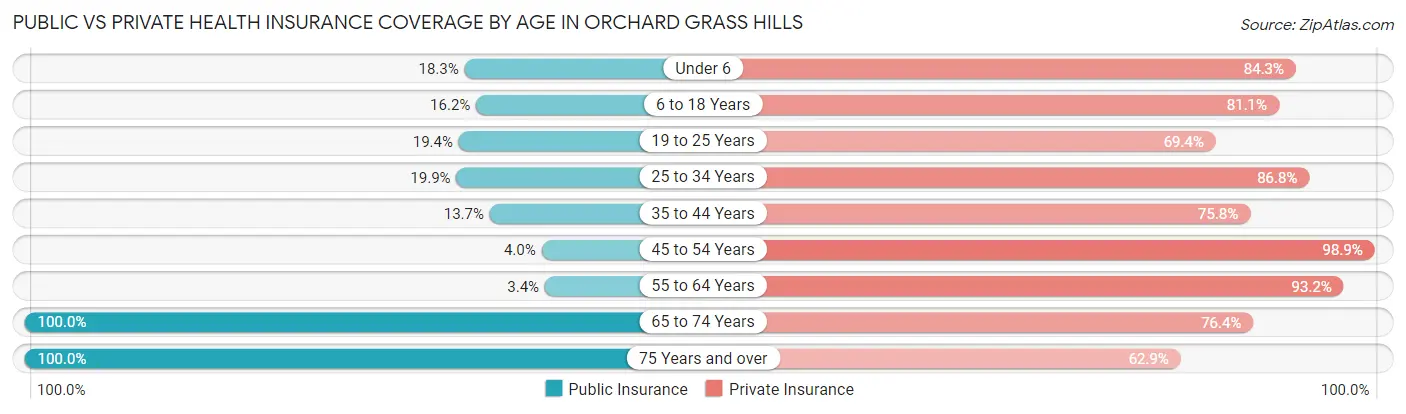
| Age Bracket | Public Insurance | Private Insurance |
| Under 6 | 42 (18.3%) | 193 (84.3%) |
| 6 to 18 Years | 72 (16.2%) | 361 (81.1%) |
| 19 to 25 Years | 26 (19.4%) | 93 (69.4%) |
| 25 to 34 Years | 54 (19.9%) | 236 (86.8%) |
| 35 to 44 Years | 44 (13.7%) | 244 (75.8%) |
| 45 to 54 Years | 11 (4.0%) | 269 (98.9%) |
| 55 to 64 Years | 5 (3.4%) | 136 (93.1%) |
| 65 to 74 Years | 55 (100.0%) | 42 (76.4%) |
| 75 Years and over | 62 (100.0%) | 39 (62.9%) |
| Total | 371 (19.2%) | 1,613 (83.3%) |
Disability Status by Sex by Age in Orchard Grass Hills
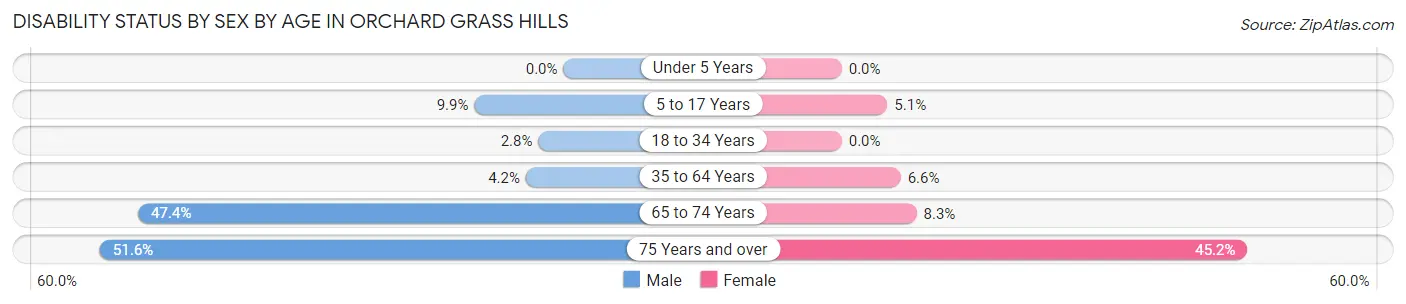
| Age Bracket | Male | Female |
| Under 5 Years | 0 (0.0%) | 0 (0.0%) |
| 5 to 17 Years | 24 (9.9%) | 13 (5.1%) |
| 18 to 34 Years | 7 (2.8%) | 0 (0.0%) |
| 35 to 64 Years | 15 (4.2%) | 25 (6.6%) |
| 65 to 74 Years | 9 (47.4%) | 3 (8.3%) |
| 75 Years and over | 16 (51.6%) | 14 (45.2%) |
Disability Class by Sex by Age in Orchard Grass Hills
Disability Class: Hearing Difficulty
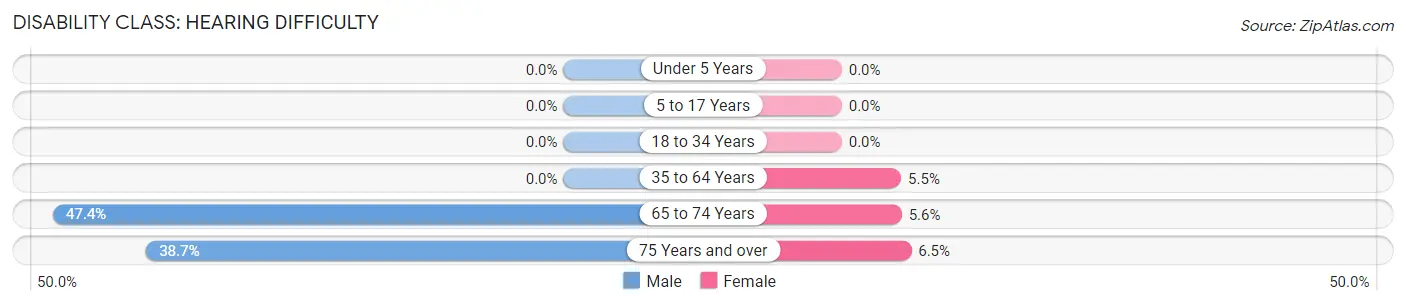
| Age Bracket | Male | Female |
| Under 5 Years | 0 (0.0%) | 0 (0.0%) |
| 5 to 17 Years | 0 (0.0%) | 0 (0.0%) |
| 18 to 34 Years | 0 (0.0%) | 0 (0.0%) |
| 35 to 64 Years | 0 (0.0%) | 21 (5.5%) |
| 65 to 74 Years | 9 (47.4%) | 2 (5.6%) |
| 75 Years and over | 12 (38.7%) | 2 (6.5%) |
Disability Class: Vision Difficulty
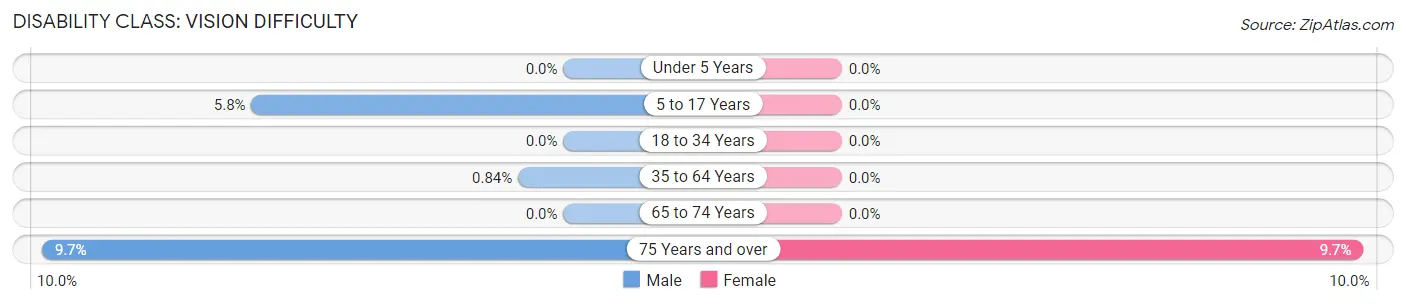
| Age Bracket | Male | Female |
| Under 5 Years | 0 (0.0%) | 0 (0.0%) |
| 5 to 17 Years | 14 (5.8%) | 0 (0.0%) |
| 18 to 34 Years | 0 (0.0%) | 0 (0.0%) |
| 35 to 64 Years | 3 (0.8%) | 0 (0.0%) |
| 65 to 74 Years | 0 (0.0%) | 0 (0.0%) |
| 75 Years and over | 3 (9.7%) | 3 (9.7%) |
Disability Class: Cognitive Difficulty
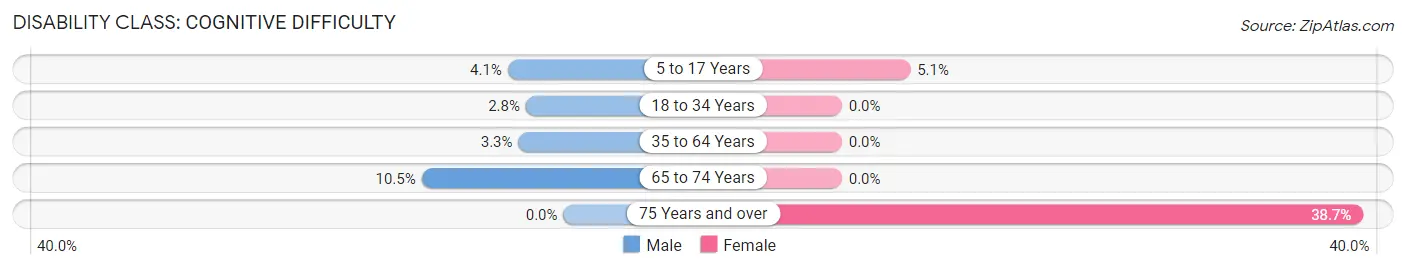
| Age Bracket | Male | Female |
| 5 to 17 Years | 10 (4.1%) | 13 (5.1%) |
| 18 to 34 Years | 7 (2.8%) | 0 (0.0%) |
| 35 to 64 Years | 12 (3.3%) | 0 (0.0%) |
| 65 to 74 Years | 2 (10.5%) | 0 (0.0%) |
| 75 Years and over | 0 (0.0%) | 12 (38.7%) |
Disability Class: Ambulatory Difficulty
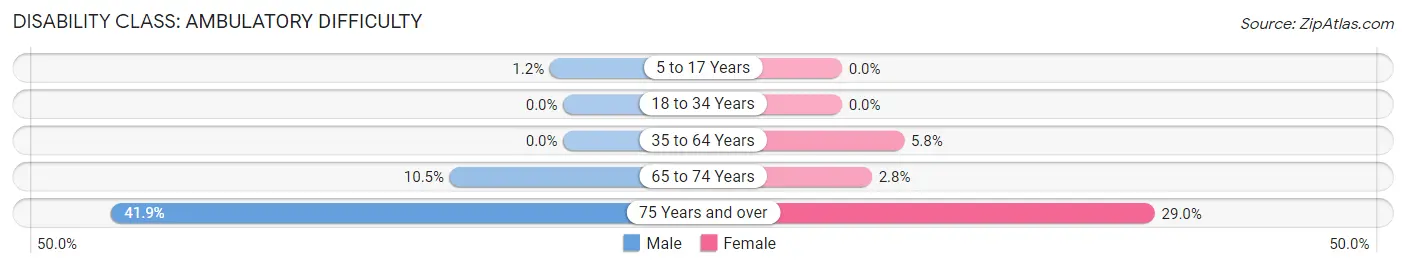
| Age Bracket | Male | Female |
| 5 to 17 Years | 3 (1.2%) | 0 (0.0%) |
| 18 to 34 Years | 0 (0.0%) | 0 (0.0%) |
| 35 to 64 Years | 0 (0.0%) | 22 (5.8%) |
| 65 to 74 Years | 2 (10.5%) | 1 (2.8%) |
| 75 Years and over | 13 (41.9%) | 9 (29.0%) |
Disability Class: Self-Care Difficulty
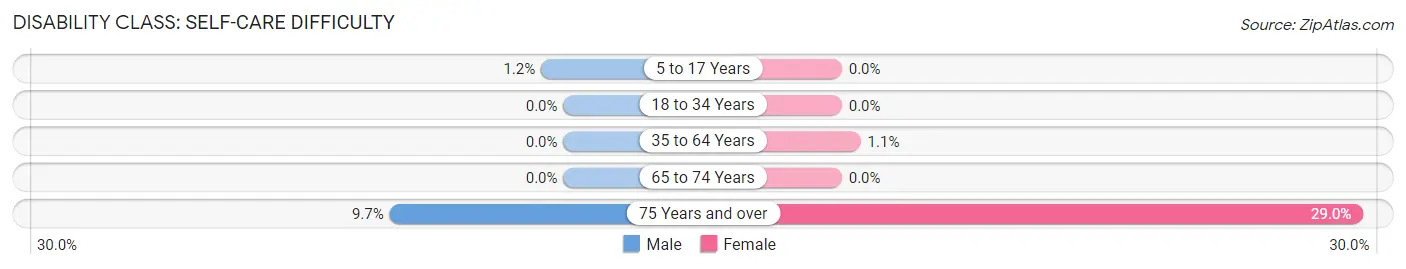
| Age Bracket | Male | Female |
| 5 to 17 Years | 3 (1.2%) | 0 (0.0%) |
| 18 to 34 Years | 0 (0.0%) | 0 (0.0%) |
| 35 to 64 Years | 0 (0.0%) | 4 (1.1%) |
| 65 to 74 Years | 0 (0.0%) | 0 (0.0%) |
| 75 Years and over | 3 (9.7%) | 9 (29.0%) |
Technology Access in Orchard Grass Hills
Computing Device Access in Orchard Grass Hills
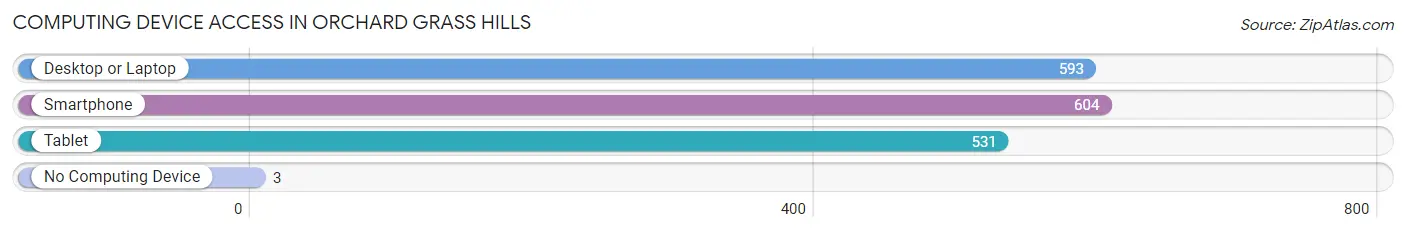
| Device Type | # Households | % Households |
| Desktop or Laptop | 593 | 92.5% |
| Smartphone | 604 | 94.2% |
| Tablet | 531 | 82.8% |
| No Computing Device | 3 | 0.5% |
| Total | 641 | 100.0% |
Internet Access in Orchard Grass Hills
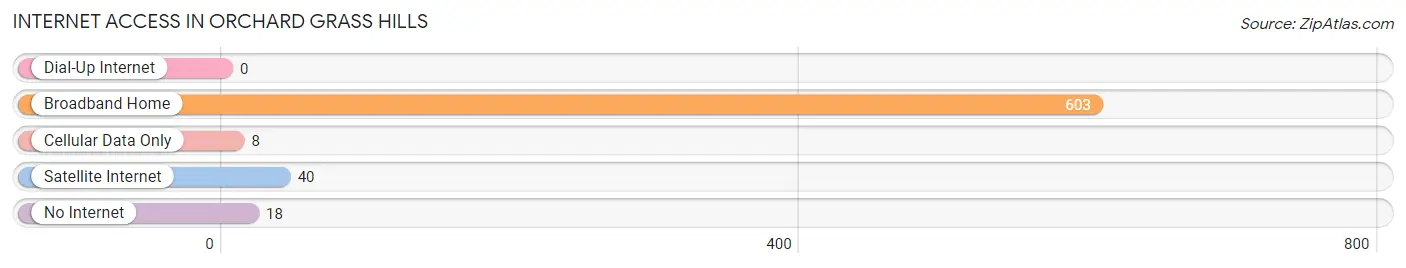
| Internet Type | # Households | % Households |
| Dial-Up Internet | 0 | 0.0% |
| Broadband Home | 603 | 94.1% |
| Cellular Data Only | 8 | 1.3% |
| Satellite Internet | 40 | 6.2% |
| No Internet | 18 | 2.8% |
| Total | 641 | 100.0% |
Orchard Grass Hills Summary
Orchard Grass Hills is a small city located in the state of Kentucky, United States. It is situated in the northern part of the state, in the foothills of the Appalachian Mountains. The city is located in the county of Jefferson, and is part of the Louisville metropolitan area. As of the 2010 census, the population of Orchard Grass Hills was 8,945.
History
The area that is now Orchard Grass Hills was first settled in the late 1700s by a group of German immigrants. The settlers named the area after the abundance of orchard grass that grew in the area. The area was primarily used for farming and the production of tobacco. In the early 1800s, the area was incorporated as a city and named Orchard Grass Hills.
In the late 1800s, the city began to experience a period of growth and development. The city was connected to the Louisville and Nashville Railroad, which allowed for the transportation of goods and people. This led to the development of several businesses in the area, including a flour mill, a sawmill, and a brickyard.
In the early 1900s, the city experienced a period of decline. The Great Depression caused many businesses to close, and the population of the city decreased. However, in the 1950s, the city began to experience a period of growth and development. The city was connected to the interstate highway system, which allowed for the transportation of goods and people. This led to the development of several businesses in the area, including a shopping center, a hospital, and a university.
Geography
Orchard Grass Hills is located in the northern part of the state of Kentucky, in the foothills of the Appalachian Mountains. The city is situated in the county of Jefferson, and is part of the Louisville metropolitan area. The city is located at an elevation of 845 feet above sea level.
The city has a total area of 4.2 square miles, of which 4.1 square miles is land and 0.1 square miles is water. The city is located near the Ohio River, and is bordered by the cities of Prospect and Crestwood.
Economy
The economy of Orchard Grass Hills is primarily based on the service industry. The city is home to several businesses, including restaurants, retail stores, and medical facilities. The city is also home to several educational institutions, including a university and a community college.
The city is also home to several manufacturing companies, including a paper mill and a plastics factory. The city is also home to several technology companies, including a software development firm and a computer hardware manufacturer.
Demographics
As of the 2010 census, the population of Orchard Grass Hills was 8,945. The racial makeup of the city was 87.3% White, 8.2% African American, 0.7% Asian, 0.3% Native American, 0.1% Pacific Islander, and 3.4% from other races. The median household income was $45,945, and the median family income was $54,945.
The city has a large population of immigrants, with over 10% of the population being foreign-born. The largest immigrant groups are from Mexico, India, and China. The city also has a large population of college students, with over 20% of the population being enrolled in college.
Common Questions
What is Per Capita Income in Orchard Grass Hills?
Per Capita income in Orchard Grass Hills is $39,043.
What is the Median Family Income in Orchard Grass Hills?
Median Family Income in Orchard Grass Hills is $102,083.
What is the Median Household income in Orchard Grass Hills?
Median Household Income in Orchard Grass Hills is $97,969.
What is Income or Wage Gap in Orchard Grass Hills?
Income or Wage Gap in Orchard Grass Hills is 29.0%.
Women in Orchard Grass Hills earn 71.0 cents for every dollar earned by a man.
What is Inequality or Gini Index in Orchard Grass Hills?
Inequality or Gini Index in Orchard Grass Hills is 0.32.
What is the Total Population of Orchard Grass Hills?
Total Population of Orchard Grass Hills is 1,937.
What is the Total Male Population of Orchard Grass Hills?
Total Male Population of Orchard Grass Hills is 940.
What is the Total Female Population of Orchard Grass Hills?
Total Female Population of Orchard Grass Hills is 997.
What is the Ratio of Males per 100 Females in Orchard Grass Hills?
There are 94.28 Males per 100 Females in Orchard Grass Hills.
What is the Ratio of Females per 100 Males in Orchard Grass Hills?
There are 106.06 Females per 100 Males in Orchard Grass Hills.
What is the Median Population Age in Orchard Grass Hills?
Median Population Age in Orchard Grass Hills is 30.7 Years.
What is the Average Family Size in Orchard Grass Hills
Average Family Size in Orchard Grass Hills is 3.4 People.
What is the Average Household Size in Orchard Grass Hills
Average Household Size in Orchard Grass Hills is 3.0 People.
How Large is the Labor Force in Orchard Grass Hills?
There are 1,040 People in the Labor Forcein in Orchard Grass Hills.
What is the Percentage of People in the Labor Force in Orchard Grass Hills?
78.5% of People are in the Labor Force in Orchard Grass Hills.
What is the Unemployment Rate in Orchard Grass Hills?
Unemployment Rate in Orchard Grass Hills is 2.7%.