St Regis Park, KY Map & Demographics
St Regis Park Map
St Regis Park Overview
$44,705
PER CAPITA INCOME
$101,379
AVG FAMILY INCOME
$94,803
AVG HOUSEHOLD INCOME
39.6%
WAGE / INCOME GAP [ % ]
60.4¢/ $1
WAGE / INCOME GAP [ $ ]
0.39
INEQUALITY / GINI INDEX
1,671
TOTAL POPULATION
871
MALE POPULATION
800
FEMALE POPULATION
108.88
MALES / 100 FEMALES
91.85
FEMALES / 100 MALES
43.6
MEDIAN AGE
3.0
AVG FAMILY SIZE
2.6
AVG HOUSEHOLD SIZE
832
LABOR FORCE [ PEOPLE ]
62.3%
PERCENT IN LABOR FORCE
2.1%
UNEMPLOYMENT RATE
St Regis Park Area Codes
Income in St Regis Park
Income Overview in St Regis Park
Per Capita Income in St Regis Park is $44,705, while median incomes of families and households are $101,379 and $94,803 respectively.
| Characteristic | Number | Measure |
| Per Capita Income | 1,671 | $44,705 |
| Median Family Income | 448 | $101,379 |
| Mean Family Income | 448 | $128,687 |
| Median Household Income | 635 | $94,803 |
| Mean Household Income | 635 | $114,640 |
| Income Deficit | 448 | $0 |
| Wage / Income Gap (%) | 1,671 | 39.56% |
| Wage / Income Gap ($) | 1,671 | 60.44¢ per $1 |
| Gini / Inequality Index | 1,671 | 0.39 |
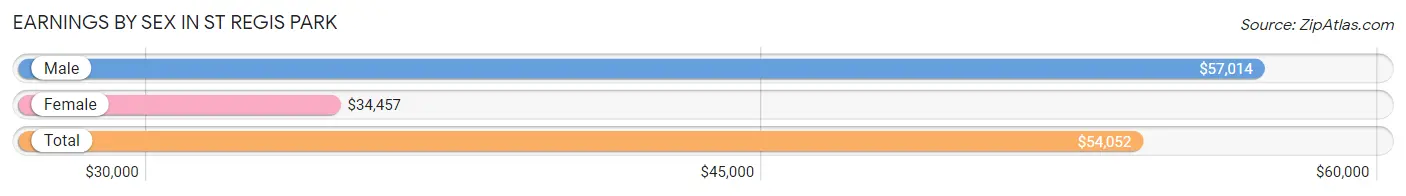
Earnings by Sex in St Regis Park
Average Earnings in St Regis Park are $54,052, $57,014 for men and $34,457 for women, a difference of 39.6%.
| Sex | Number | Average Earnings |
| Male | 506 (56.2%) | $57,014 |
| Female | 394 (43.8%) | $34,457 |
| Total | 900 (100.0%) | $54,052 |
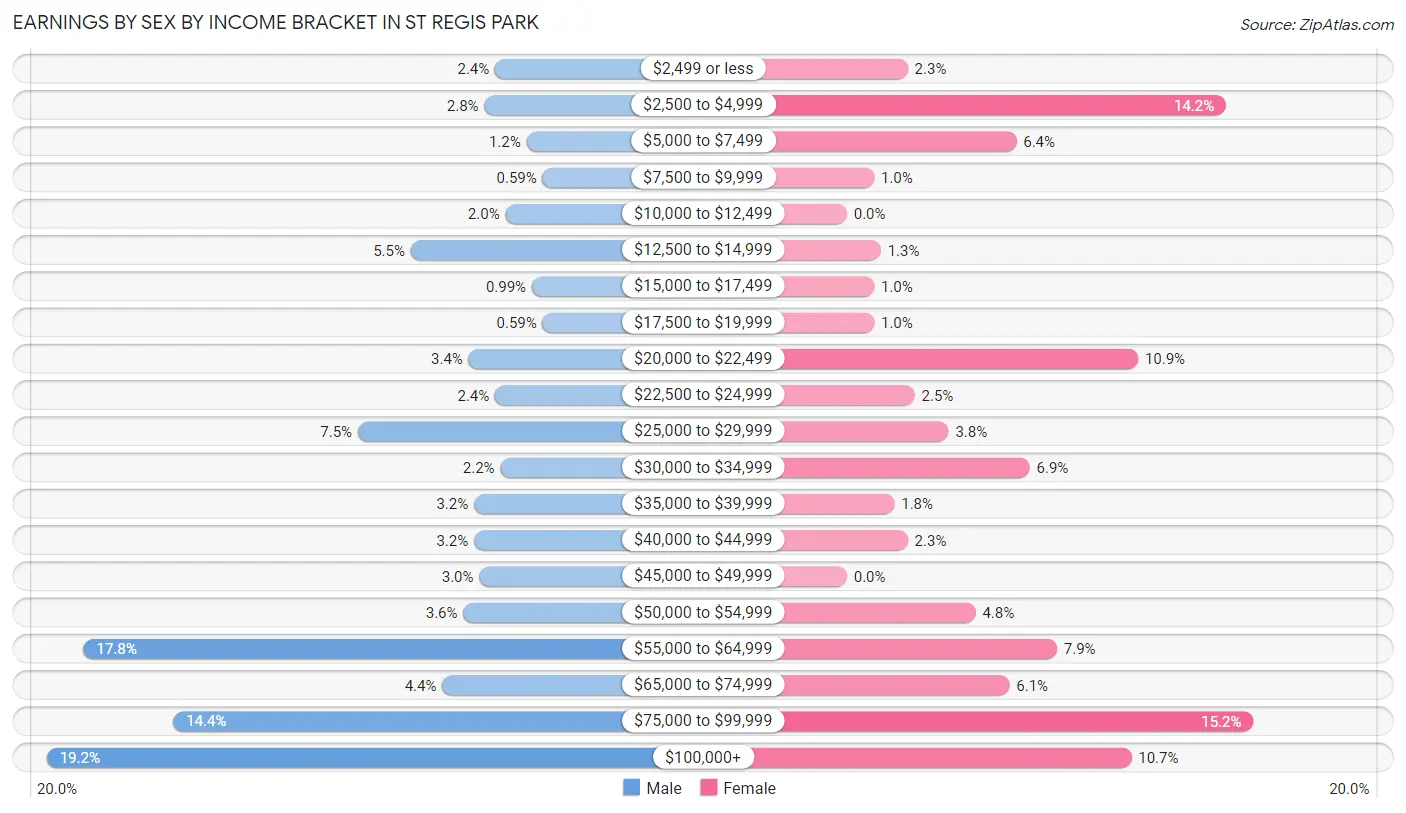
Earnings by Sex by Income Bracket in St Regis Park
The most common earnings brackets in St Regis Park are $100,000+ for men (97 | 19.2%) and $75,000 to $99,999 for women (60 | 15.2%).
| Income | Male | Female |
| $2,499 or less | 12 (2.4%) | 9 (2.3%) |
| $2,500 to $4,999 | 14 (2.8%) | 56 (14.2%) |
| $5,000 to $7,499 | 6 (1.2%) | 25 (6.4%) |
| $7,500 to $9,999 | 3 (0.6%) | 4 (1.0%) |
| $10,000 to $12,499 | 10 (2.0%) | 0 (0.0%) |
| $12,500 to $14,999 | 28 (5.5%) | 5 (1.3%) |
| $15,000 to $17,499 | 5 (1.0%) | 4 (1.0%) |
| $17,500 to $19,999 | 3 (0.6%) | 4 (1.0%) |
| $20,000 to $22,499 | 17 (3.4%) | 43 (10.9%) |
| $22,500 to $24,999 | 12 (2.4%) | 10 (2.5%) |
| $25,000 to $29,999 | 38 (7.5%) | 15 (3.8%) |
| $30,000 to $34,999 | 11 (2.2%) | 27 (6.9%) |
| $35,000 to $39,999 | 16 (3.2%) | 7 (1.8%) |
| $40,000 to $44,999 | 16 (3.2%) | 9 (2.3%) |
| $45,000 to $49,999 | 15 (3.0%) | 0 (0.0%) |
| $50,000 to $54,999 | 18 (3.6%) | 19 (4.8%) |
| $55,000 to $64,999 | 90 (17.8%) | 31 (7.9%) |
| $65,000 to $74,999 | 22 (4.3%) | 24 (6.1%) |
| $75,000 to $99,999 | 73 (14.4%) | 60 (15.2%) |
| $100,000+ | 97 (19.2%) | 42 (10.7%) |
| Total | 506 (100.0%) | 394 (100.0%) |
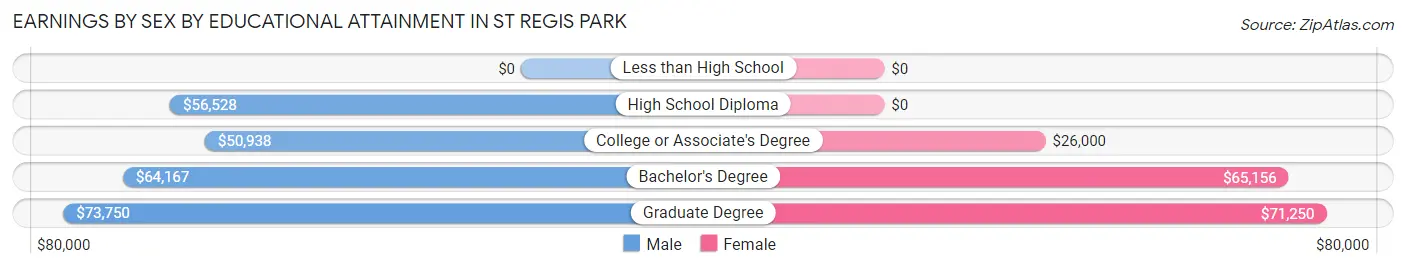
Earnings by Sex by Educational Attainment in St Regis Park
Average earnings in St Regis Park are $60,035 for men and $42,917 for women, a difference of 28.5%. Men with an educational attainment of graduate degree enjoy the highest average annual earnings of $73,750, while those with college or associate's degree education earn the least with $50,938. Women with an educational attainment of graduate degree earn the most with the average annual earnings of $71,250, while those with college or associate's degree education have the smallest earnings of $26,000.
| Educational Attainment | Male Income | Female Income |
| Less than High School | - | - |
| High School Diploma | $56,528 | $0 |
| College or Associate's Degree | $50,938 | $26,000 |
| Bachelor's Degree | $64,167 | $65,156 |
| Graduate Degree | $73,750 | $71,250 |
| Total | $60,035 | $42,917 |
Family Income in St Regis Park
Family Income Brackets in St Regis Park
According to the St Regis Park family income data, there are 117 families falling into the $100,000 to $149,999 income range, which is the most common income bracket and makes up 26.1% of all families.
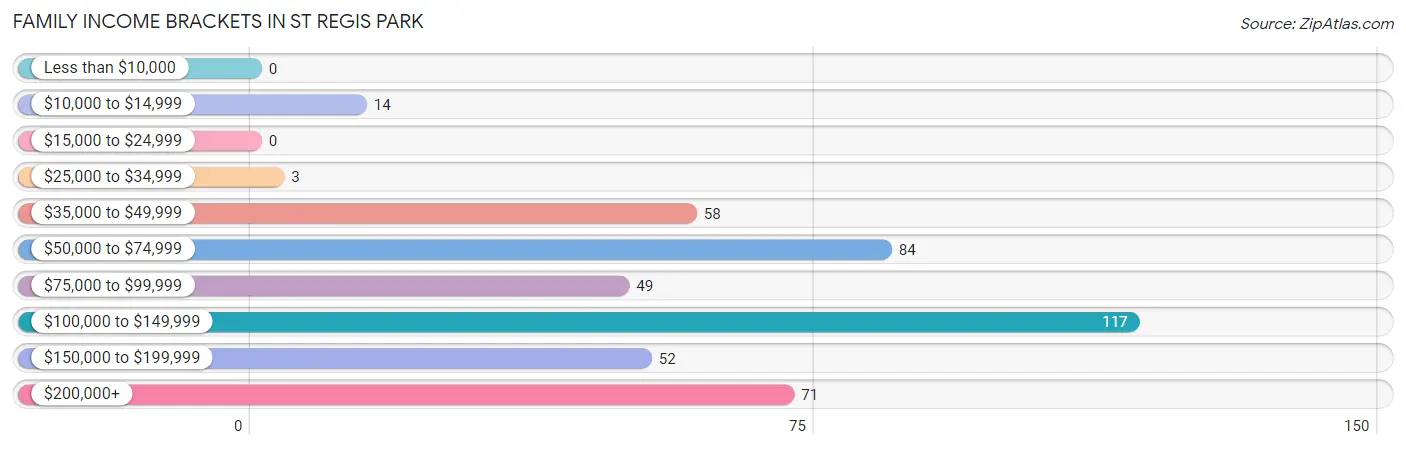
| Income Bracket | # Families | % Families |
| Less than $10,000 | 0 | 0.0% |
| $10,000 to $14,999 | 14 | 3.1% |
| $15,000 to $24,999 | 0 | 0.0% |
| $25,000 to $34,999 | 3 | 0.7% |
| $35,000 to $49,999 | 58 | 12.9% |
| $50,000 to $74,999 | 84 | 18.8% |
| $75,000 to $99,999 | 49 | 10.9% |
| $100,000 to $149,999 | 117 | 26.1% |
| $150,000 to $199,999 | 52 | 11.6% |
| $200,000+ | 71 | 15.8% |
Family Income by Famaliy Size in St Regis Park
4-person families (85 | 19.0%) account for the highest median family income in St Regis Park with $152,813 per family, while 3-person families (71 | 15.9%) have the highest median income of $45,625 per family member.
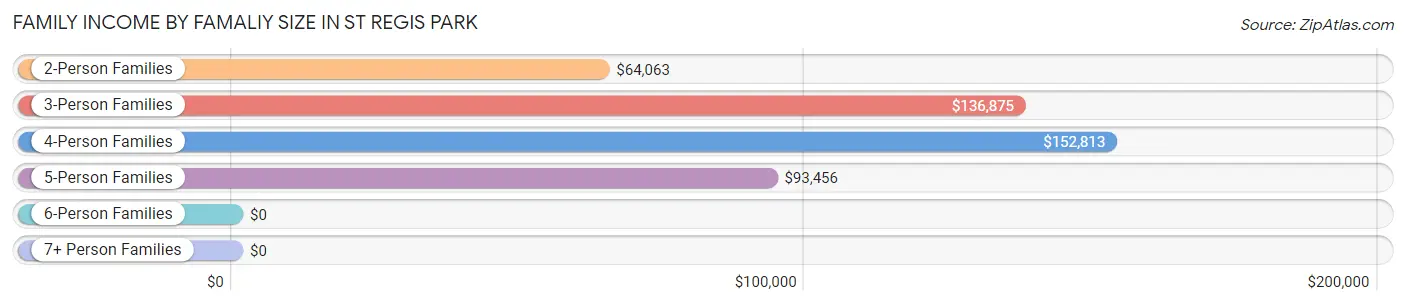
| Income Bracket | # Families | Median Income |
| 2-Person Families | 229 (51.1%) | $64,063 |
| 3-Person Families | 71 (15.9%) | $136,875 |
| 4-Person Families | 85 (19.0%) | $152,813 |
| 5-Person Families | 49 (10.9%) | $93,456 |
| 6-Person Families | 12 (2.7%) | $0 |
| 7+ Person Families | 2 (0.4%) | $0 |
| Total | 448 (100.0%) | $101,379 |
Family Income by Number of Earners in St Regis Park
The median family income in St Regis Park is $101,379, with families comprising 3+ earners (38) having the highest median family income of $156,875, while families with no earners (78) have the lowest median family income of $49,167, accounting for 8.5% and 17.4% of families, respectively.
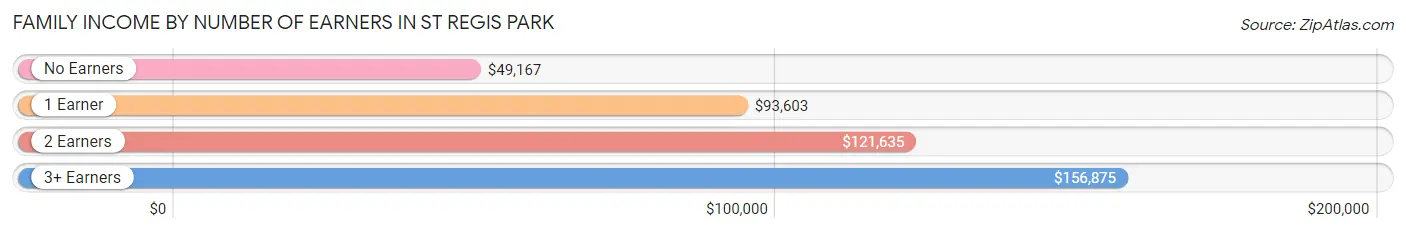
| Number of Earners | # Families | Median Income |
| No Earners | 78 (17.4%) | $49,167 |
| 1 Earner | 133 (29.7%) | $93,603 |
| 2 Earners | 199 (44.4%) | $121,635 |
| 3+ Earners | 38 (8.5%) | $156,875 |
| Total | 448 (100.0%) | $101,379 |
Household Income in St Regis Park
Household Income Brackets in St Regis Park
With 180 households falling in the category, the $100,000 to $149,999 income range is the most frequent in St Regis Park, accounting for 28.3% of all households. In contrast, only 4 households (0.6%) fall into the less than $10,000 income bracket, making it the least populous group.
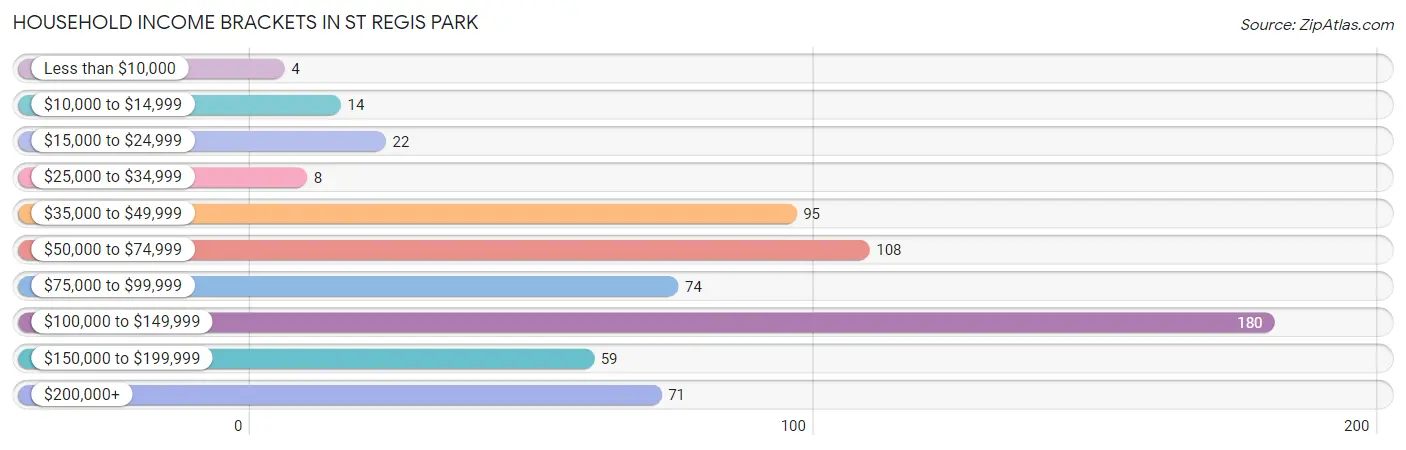
| Income Bracket | # Households | % Households |
| Less than $10,000 | 4 | 0.6% |
| $10,000 to $14,999 | 14 | 2.2% |
| $15,000 to $24,999 | 22 | 3.5% |
| $25,000 to $34,999 | 8 | 1.3% |
| $35,000 to $49,999 | 95 | 15.0% |
| $50,000 to $74,999 | 108 | 17.0% |
| $75,000 to $99,999 | 74 | 11.7% |
| $100,000 to $149,999 | 180 | 28.3% |
| $150,000 to $199,999 | 59 | 9.3% |
| $200,000+ | 71 | 11.2% |
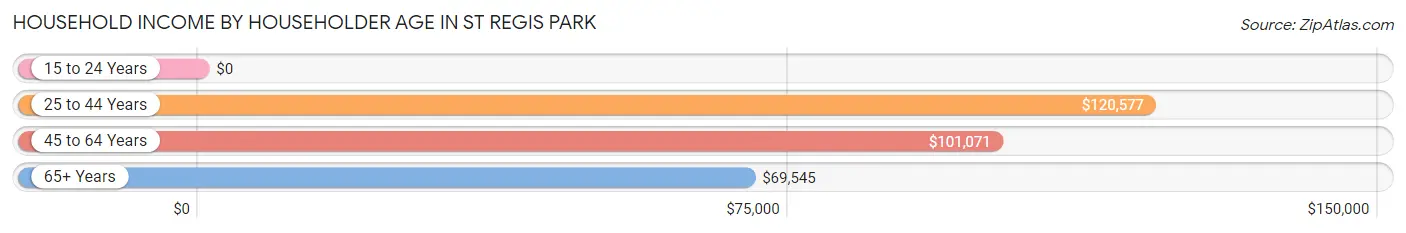
Household Income by Householder Age in St Regis Park
The median household income in St Regis Park is $94,803, with the highest median household income of $120,577 found in the 25 to 44 years age bracket for the primary householder. A total of 162 households (25.5%) fall into this category. Meanwhile, the 15 to 24 years age bracket for the primary householder has the lowest median household income of $0, with 3 households (0.5%) in this group.
| Income Bracket | # Households | Median Income |
| 15 to 24 Years | 3 (0.5%) | $0 |
| 25 to 44 Years | 162 (25.5%) | $120,577 |
| 45 to 64 Years | 292 (46.0%) | $101,071 |
| 65+ Years | 178 (28.0%) | $69,545 |
| Total | 635 (100.0%) | $94,803 |
Poverty in St Regis Park
Income Below Poverty by Sex and Age in St Regis Park
With 6.4% poverty level for males and 8.6% for females among the residents of St Regis Park, 6 to 11 year old males and under 5 year old females are the most vulnerable to poverty, with 30 males (28.8%) and 13 females (26.0%) in their respective age groups living below the poverty level.
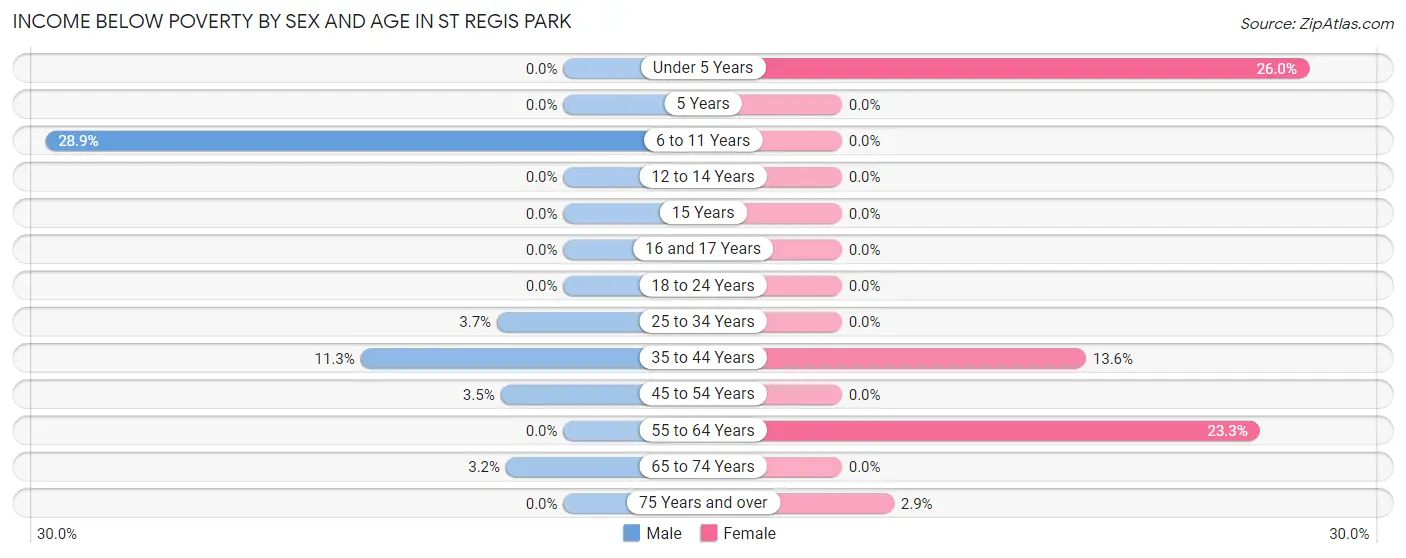
| Age Bracket | Male | Female |
| Under 5 Years | 0 (0.0%) | 13 (26.0%) |
| 5 Years | 0 (0.0%) | 0 (0.0%) |
| 6 to 11 Years | 30 (28.8%) | 0 (0.0%) |
| 12 to 14 Years | 0 (0.0%) | 0 (0.0%) |
| 15 Years | 0 (0.0%) | 0 (0.0%) |
| 16 and 17 Years | 0 (0.0%) | 0 (0.0%) |
| 18 to 24 Years | 0 (0.0%) | 0 (0.0%) |
| 25 to 34 Years | 3 (3.7%) | 0 (0.0%) |
| 35 to 44 Years | 14 (11.3%) | 14 (13.6%) |
| 45 to 54 Years | 5 (3.5%) | 0 (0.0%) |
| 55 to 64 Years | 0 (0.0%) | 40 (23.3%) |
| 65 to 74 Years | 4 (3.2%) | 0 (0.0%) |
| 75 Years and over | 0 (0.0%) | 2 (2.9%) |
| Total | 56 (6.4%) | 69 (8.6%) |
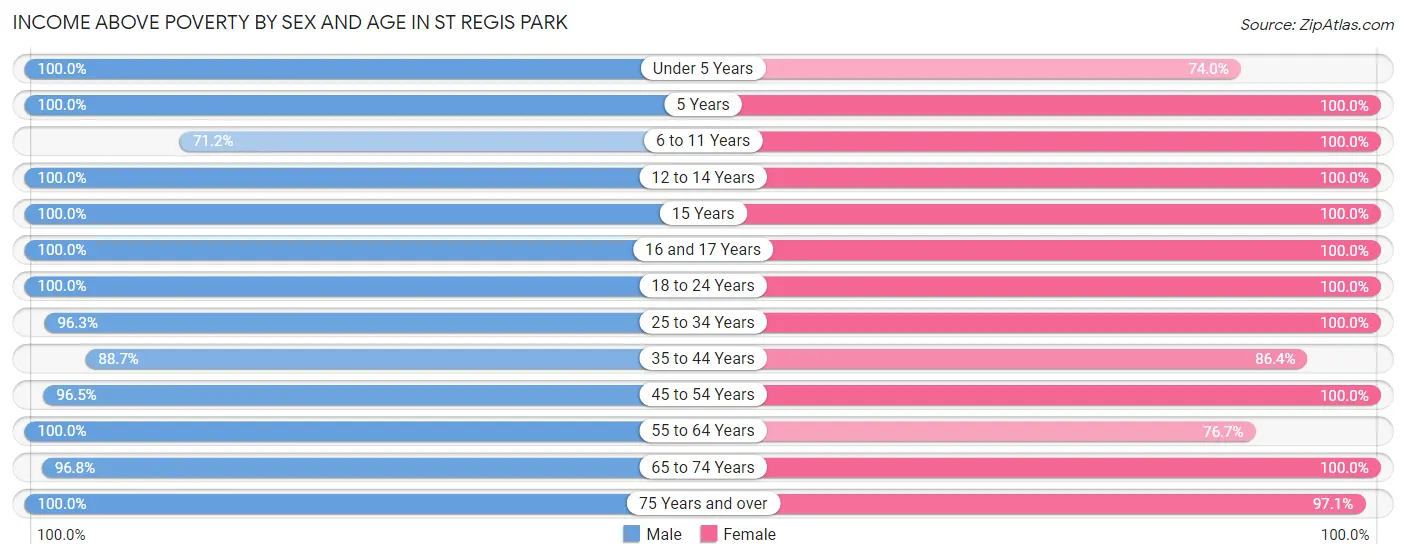
Income Above Poverty by Sex and Age in St Regis Park
According to the poverty statistics in St Regis Park, males aged under 5 years and females aged 5 years are the age groups that are most secure financially, with 100.0% of males and 100.0% of females in these age groups living above the poverty line.
| Age Bracket | Male | Female |
| Under 5 Years | 67 (100.0%) | 37 (74.0%) |
| 5 Years | 2 (100.0%) | 2 (100.0%) |
| 6 to 11 Years | 74 (71.2%) | 44 (100.0%) |
| 12 to 14 Years | 20 (100.0%) | 35 (100.0%) |
| 15 Years | 5 (100.0%) | 7 (100.0%) |
| 16 and 17 Years | 26 (100.0%) | 13 (100.0%) |
| 18 to 24 Years | 28 (100.0%) | 25 (100.0%) |
| 25 to 34 Years | 78 (96.3%) | 126 (100.0%) |
| 35 to 44 Years | 110 (88.7%) | 89 (86.4%) |
| 45 to 54 Years | 138 (96.5%) | 79 (100.0%) |
| 55 to 64 Years | 112 (100.0%) | 132 (76.7%) |
| 65 to 74 Years | 121 (96.8%) | 75 (100.0%) |
| 75 Years and over | 34 (100.0%) | 67 (97.1%) |
| Total | 815 (93.6%) | 731 (91.4%) |
Income Below Poverty Among Married-Couple Families in St Regis Park
The poverty statistics for married-couple families in St Regis Park show that 3.8% or 14 of the total 371 families live below the poverty line. Families with 3 or 4 children have the highest poverty rate of 26.9%, comprising of 14 families. On the other hand, families with no children have the lowest poverty rate of 0.0%, which includes 0 families.
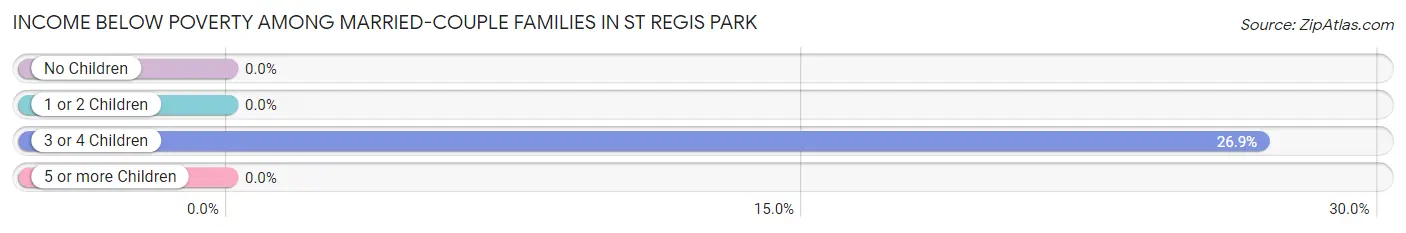
| Children | Above Poverty | Below Poverty |
| No Children | 201 (100.0%) | 0 (0.0%) |
| 1 or 2 Children | 116 (100.0%) | 0 (0.0%) |
| 3 or 4 Children | 38 (73.1%) | 14 (26.9%) |
| 5 or more Children | 2 (100.0%) | 0 (0.0%) |
| Total | 357 (96.2%) | 14 (3.8%) |
Income Below Poverty Among Single-Parent Households in St Regis Park
| Children | Single Father | Single Mother |
| No Children | 0 (0.0%) | 0 (0.0%) |
| 1 or 2 Children | 0 (0.0%) | 0 (0.0%) |
| 3 or 4 Children | 0 (0.0%) | 0 (0.0%) |
| 5 or more Children | 0 (0.0%) | 0 (0.0%) |
| Total | 0 (0.0%) | 0 (0.0%) |
Income Below Poverty Among Married-Couple vs Single-Parent Households in St Regis Park
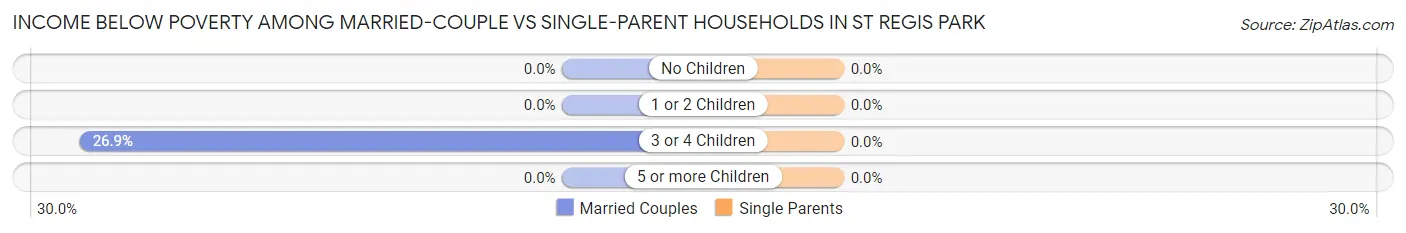
| Children | Married-Couple Families | Single-Parent Households |
| No Children | 0 (0.0%) | 0 (0.0%) |
| 1 or 2 Children | 0 (0.0%) | 0 (0.0%) |
| 3 or 4 Children | 14 (26.9%) | 0 (0.0%) |
| 5 or more Children | 0 (0.0%) | 0 (0.0%) |
| Total | 14 (3.8%) | 0 (0.0%) |
Race in St Regis Park
The most populous races in St Regis Park are White / Caucasian (1,555 | 93.1%), Two or more Races (52 | 3.1%), and Black / African American (47 | 2.8%).
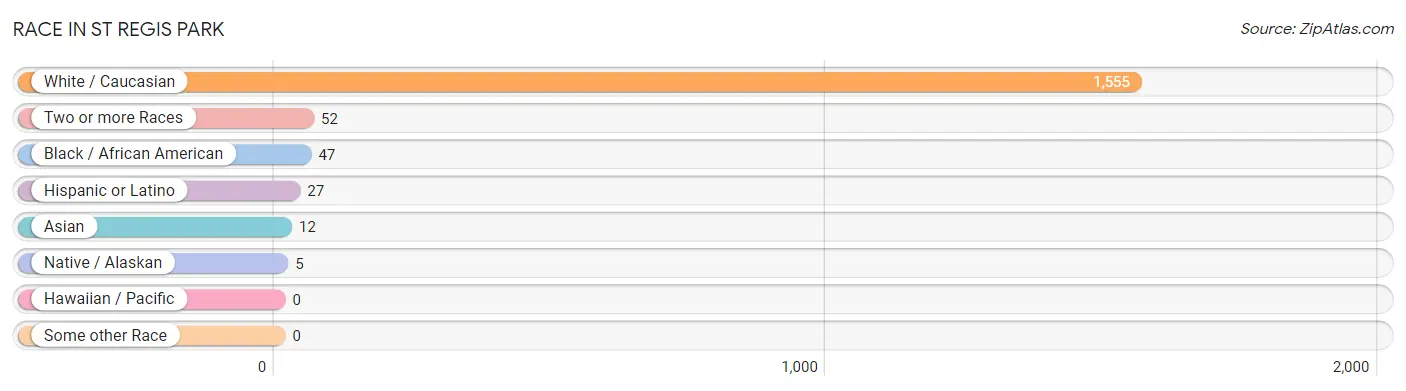
| Race | # Population | % Population |
| Asian | 12 | 0.7% |
| Black / African American | 47 | 2.8% |
| Hawaiian / Pacific | 0 | 0.0% |
| Hispanic or Latino | 27 | 1.6% |
| Native / Alaskan | 5 | 0.3% |
| White / Caucasian | 1,555 | 93.1% |
| Two or more Races | 52 | 3.1% |
| Some other Race | 0 | 0.0% |
| Total | 1,671 | 100.0% |
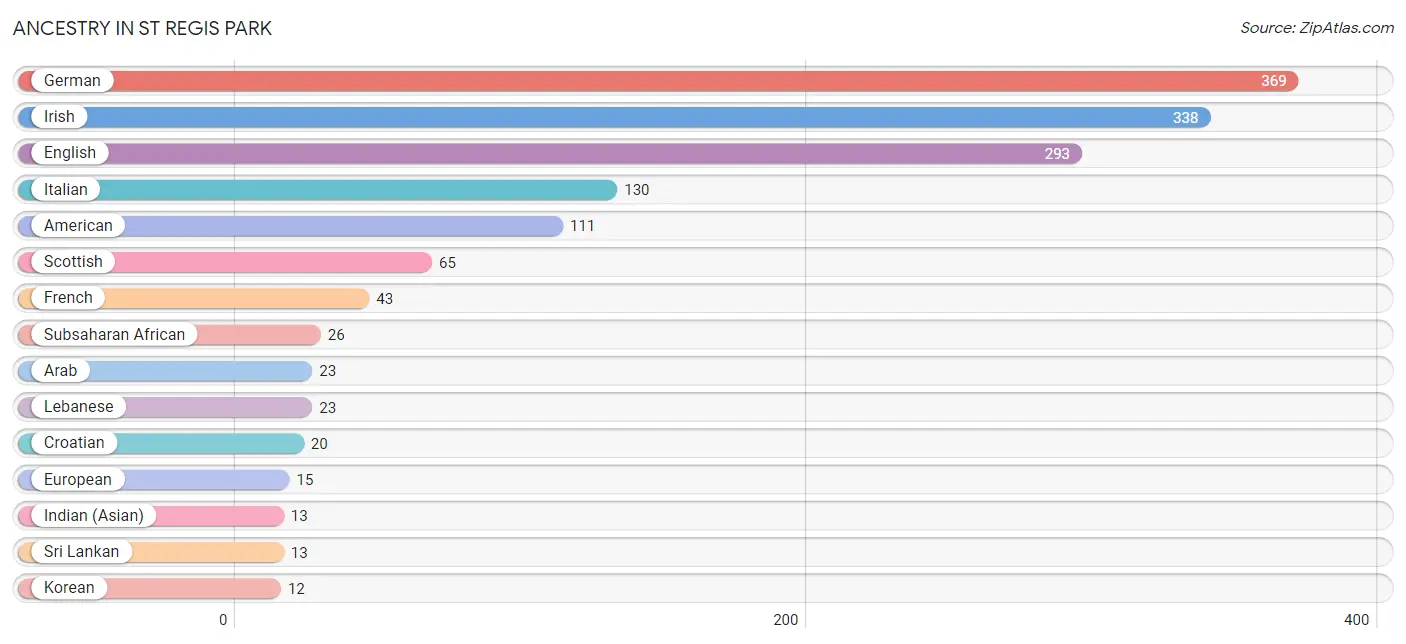
Ancestry in St Regis Park
The most populous ancestries reported in St Regis Park are German (369 | 22.1%), Irish (338 | 20.2%), English (293 | 17.5%), Italian (130 | 7.8%), and American (111 | 6.6%), together accounting for 74.3% of all St Regis Park residents.
| Ancestry | # Population | % Population |
| African | 6 | 0.4% |
| American | 111 | 6.6% |
| Arab | 23 | 1.4% |
| Bhutanese | 3 | 0.2% |
| British | 8 | 0.5% |
| Burmese | 10 | 0.6% |
| Central American | 5 | 0.3% |
| Central American Indian | 11 | 0.7% |
| Croatian | 20 | 1.2% |
| Cuban | 5 | 0.3% |
| Czech | 4 | 0.2% |
| Czechoslovakian | 2 | 0.1% |
| Dutch | 4 | 0.2% |
| Ecuadorian | 2 | 0.1% |
| English | 293 | 17.5% |
| Ethiopian | 4 | 0.2% |
| European | 15 | 0.9% |
| French | 43 | 2.6% |
| French Canadian | 3 | 0.2% |
| German | 369 | 22.1% |
| Greek | 2 | 0.1% |
| Guatemalan | 5 | 0.3% |
| Indian (Asian) | 13 | 0.8% |
| Irish | 338 | 20.2% |
| Italian | 130 | 7.8% |
| Korean | 12 | 0.7% |
| Lebanese | 23 | 1.4% |
| Mexican | 9 | 0.5% |
| Polish | 3 | 0.2% |
| Russian | 3 | 0.2% |
| Scotch-Irish | 12 | 0.7% |
| Scottish | 65 | 3.9% |
| South American | 2 | 0.1% |
| Spanish | 6 | 0.4% |
| Sri Lankan | 13 | 0.8% |
| Subsaharan African | 26 | 1.6% |
| Swedish | 2 | 0.1% |
| Swiss | 6 | 0.4% |
| Welsh | 11 | 0.7% | View All 39 Rows |
Immigrants in St Regis Park
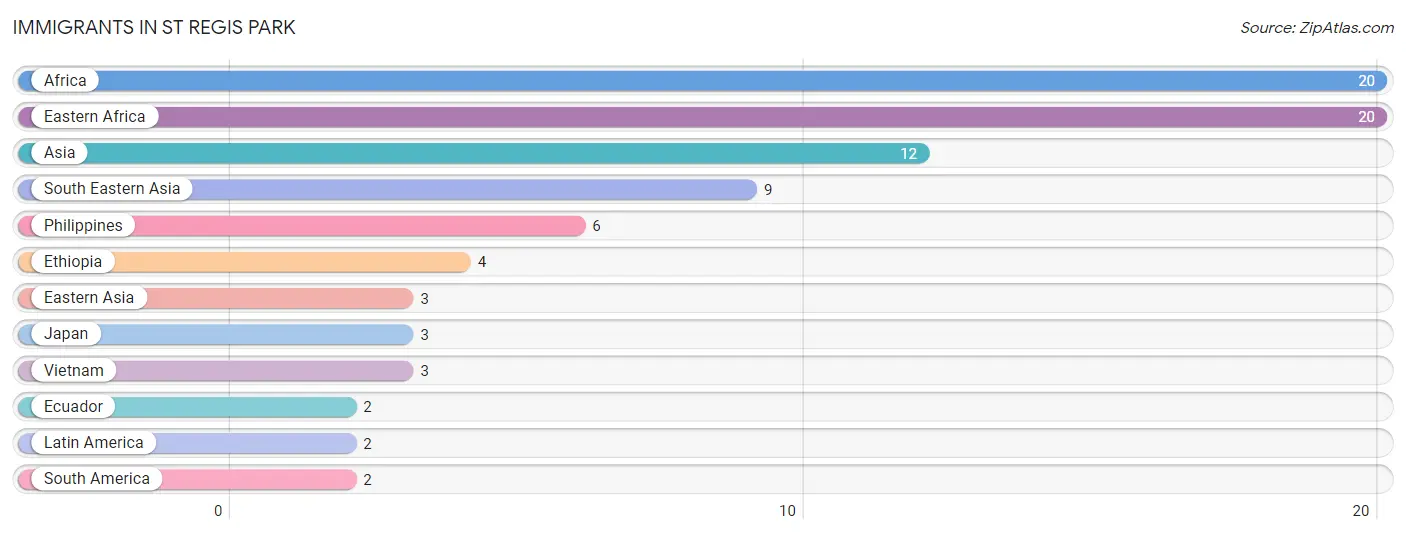
The most numerous immigrant groups reported in St Regis Park came from Africa (20 | 1.2%), Eastern Africa (20 | 1.2%), Asia (12 | 0.7%), South Eastern Asia (9 | 0.5%), and Philippines (6 | 0.4%), together accounting for 4.0% of all St Regis Park residents.
| Immigration Origin | # Population | % Population |
| Africa | 20 | 1.2% |
| Asia | 12 | 0.7% |
| Eastern Africa | 20 | 1.2% |
| Eastern Asia | 3 | 0.2% |
| Ecuador | 2 | 0.1% |
| Ethiopia | 4 | 0.2% |
| Japan | 3 | 0.2% |
| Latin America | 2 | 0.1% |
| Philippines | 6 | 0.4% |
| South America | 2 | 0.1% |
| South Eastern Asia | 9 | 0.5% |
| Vietnam | 3 | 0.2% | View All 12 Rows |
Sex and Age in St Regis Park
Sex and Age in St Regis Park
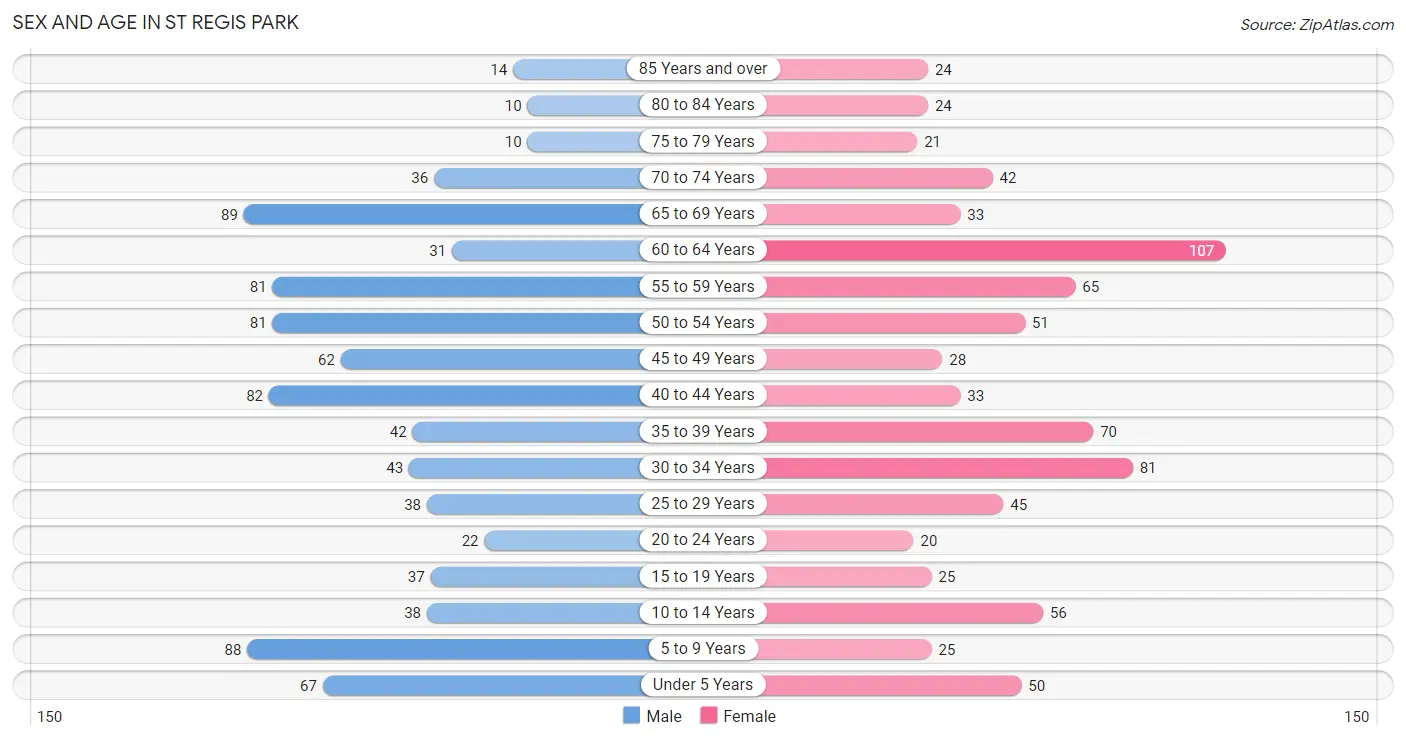
The most populous age groups in St Regis Park are 65 to 69 Years (89 | 10.2%) for men and 60 to 64 Years (107 | 13.4%) for women.
| Age Bracket | Male | Female |
| Under 5 Years | 67 (7.7%) | 50 (6.2%) |
| 5 to 9 Years | 88 (10.1%) | 25 (3.1%) |
| 10 to 14 Years | 38 (4.4%) | 56 (7.0%) |
| 15 to 19 Years | 37 (4.3%) | 25 (3.1%) |
| 20 to 24 Years | 22 (2.5%) | 20 (2.5%) |
| 25 to 29 Years | 38 (4.4%) | 45 (5.6%) |
| 30 to 34 Years | 43 (4.9%) | 81 (10.1%) |
| 35 to 39 Years | 42 (4.8%) | 70 (8.7%) |
| 40 to 44 Years | 82 (9.4%) | 33 (4.1%) |
| 45 to 49 Years | 62 (7.1%) | 28 (3.5%) |
| 50 to 54 Years | 81 (9.3%) | 51 (6.4%) |
| 55 to 59 Years | 81 (9.3%) | 65 (8.1%) |
| 60 to 64 Years | 31 (3.6%) | 107 (13.4%) |
| 65 to 69 Years | 89 (10.2%) | 33 (4.1%) |
| 70 to 74 Years | 36 (4.1%) | 42 (5.2%) |
| 75 to 79 Years | 10 (1.1%) | 21 (2.6%) |
| 80 to 84 Years | 10 (1.1%) | 24 (3.0%) |
| 85 Years and over | 14 (1.6%) | 24 (3.0%) |
| Total | 871 (100.0%) | 800 (100.0%) |
Families and Households in St Regis Park
Median Family Size in St Regis Park
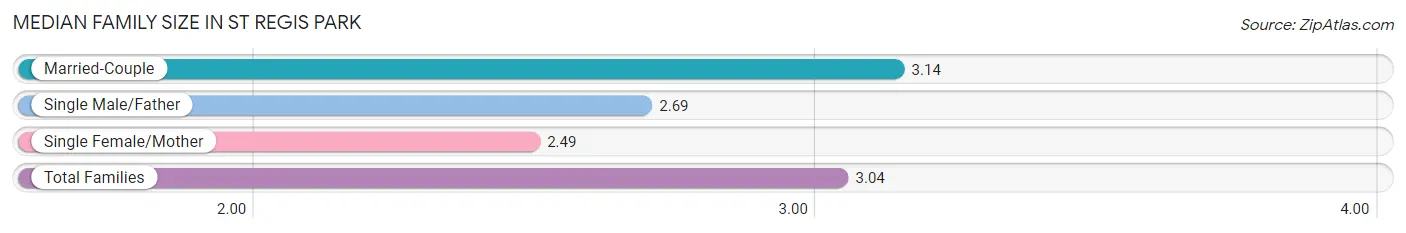
The median family size in St Regis Park is 3.04 persons per family, with married-couple families (371 | 82.8%) accounting for the largest median family size of 3.14 persons per family. On the other hand, single female/mother families (45 | 10.0%) represent the smallest median family size with 2.49 persons per family.
| Family Type | # Families | Family Size |
| Married-Couple | 371 (82.8%) | 3.14 |
| Single Male/Father | 32 (7.1%) | 2.69 |
| Single Female/Mother | 45 (10.0%) | 2.49 |
| Total Families | 448 (100.0%) | 3.04 |
Median Household Size in St Regis Park
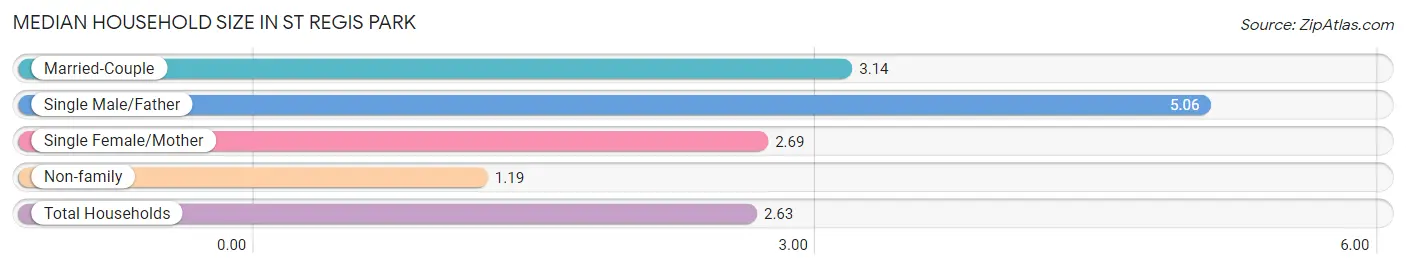
The median household size in St Regis Park is 2.63 persons per household, with single male/father households (32 | 5.0%) accounting for the largest median household size of 5.06 persons per household. non-family households (187 | 29.4%) represent the smallest median household size with 1.19 persons per household.
| Household Type | # Households | Household Size |
| Married-Couple | 371 (58.4%) | 3.14 |
| Single Male/Father | 32 (5.0%) | 5.06 |
| Single Female/Mother | 45 (7.1%) | 2.69 |
| Non-family | 187 (29.4%) | 1.19 |
| Total Households | 635 (100.0%) | 2.63 |
Household Size by Marriage Status in St Regis Park
Out of a total of 635 households in St Regis Park, 448 (70.6%) are family households, while 187 (29.4%) are nonfamily households. The most numerous type of family households are 2-person households, comprising 193, and the most common type of nonfamily households are 1-person households, comprising 154.
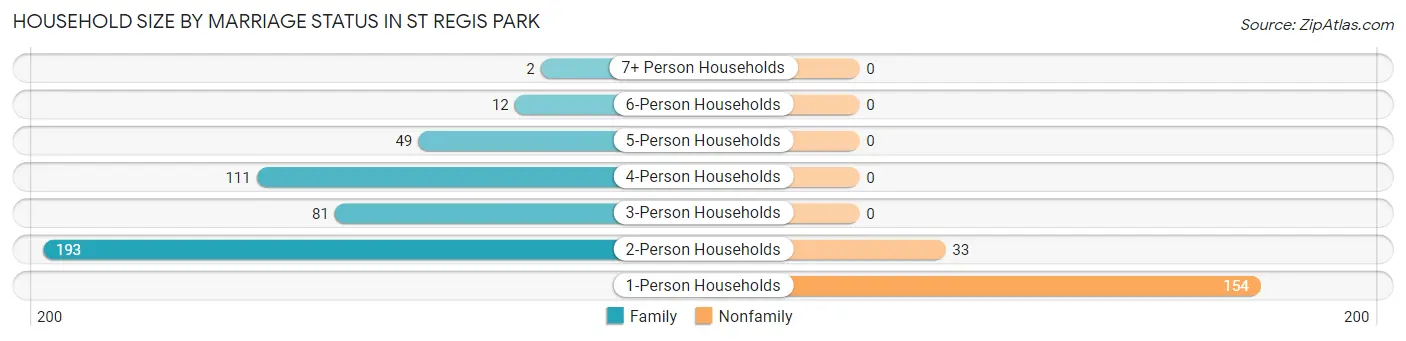
| Household Size | Family Households | Nonfamily Households |
| 1-Person Households | - | 154 (24.2%) |
| 2-Person Households | 193 (30.4%) | 33 (5.2%) |
| 3-Person Households | 81 (12.8%) | 0 (0.0%) |
| 4-Person Households | 111 (17.5%) | 0 (0.0%) |
| 5-Person Households | 49 (7.7%) | 0 (0.0%) |
| 6-Person Households | 12 (1.9%) | 0 (0.0%) |
| 7+ Person Households | 2 (0.3%) | 0 (0.0%) |
| Total | 448 (70.6%) | 187 (29.4%) |
Female Fertility in St Regis Park
Fertility by Age in St Regis Park
Average fertility rate in St Regis Park is 52.0 births per 1,000 women. Women in the age bracket of 20 to 34 years have the highest fertility rate with 89.0 births per 1,000 women. Women in the age bracket of 20 to 34 years acount for 81.2% of all women with births.
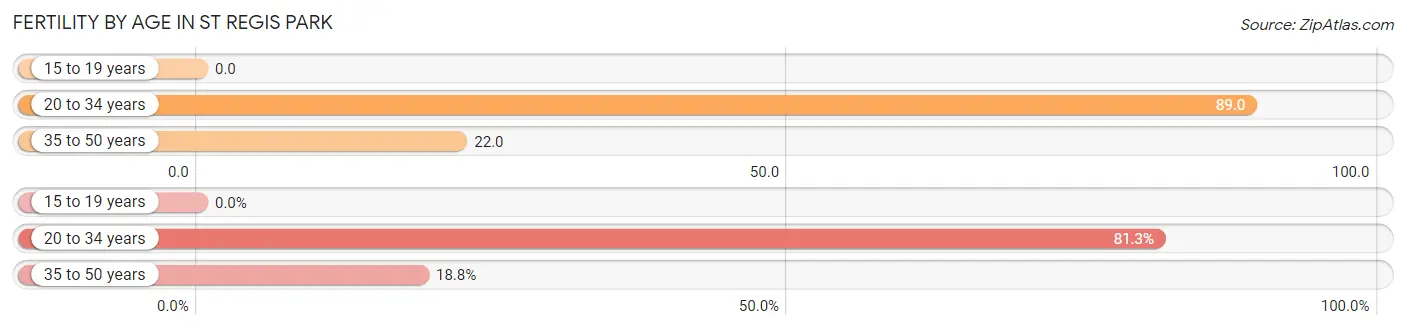
| Age Bracket | Women with Births | Births / 1,000 Women |
| 15 to 19 years | 0 (0.0%) | 0.0 |
| 20 to 34 years | 13 (81.2%) | 89.0 |
| 35 to 50 years | 3 (18.8%) | 22.0 |
| Total | 16 (100.0%) | 52.0 |
Fertility by Age by Marriage Status in St Regis Park
87.5% of women with births (16) in St Regis Park are married. The highest percentage of unmarried women with births falls into 20 to 34 years age bracket with 15.4% of them unmarried at the time of birth, while the lowest percentage of unmarried women with births belong to 35 to 50 years age bracket with 0.0% of them unmarried.
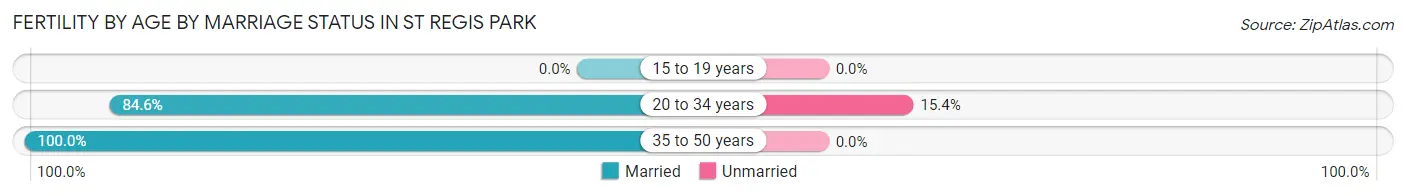
| Age Bracket | Married | Unmarried |
| 15 to 19 years | 0 (0.0%) | 0 (0.0%) |
| 20 to 34 years | 11 (84.6%) | 2 (15.4%) |
| 35 to 50 years | 3 (100.0%) | 0 (0.0%) |
| Total | 14 (87.5%) | 2 (12.5%) |
Fertility by Education in St Regis Park
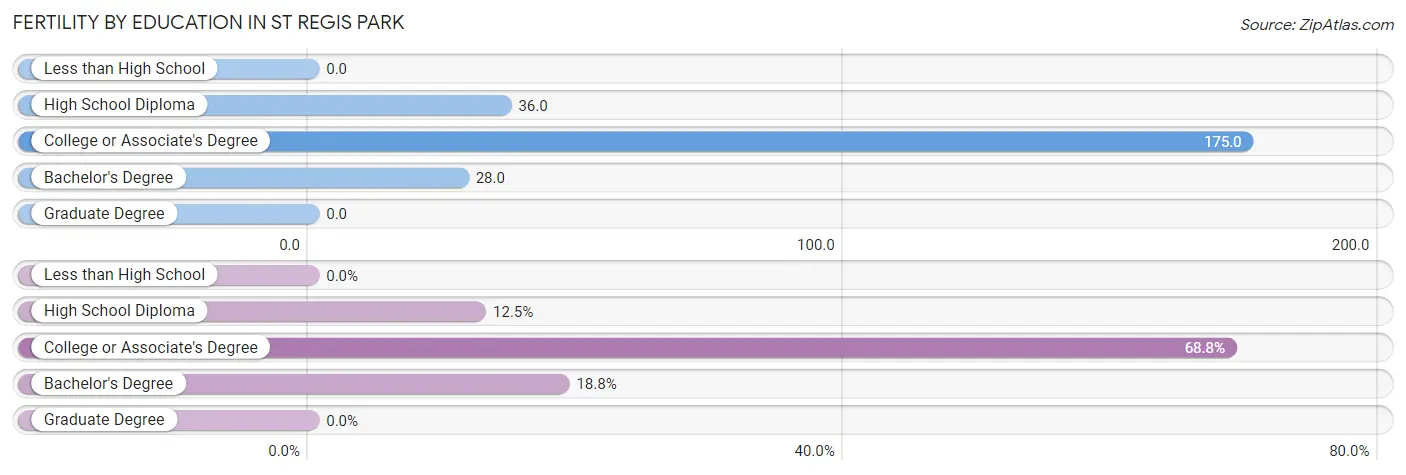
| Educational Attainment | Women with Births | Births / 1,000 Women |
| Less than High School | 0 (0.0%) | 0.0 |
| High School Diploma | 2 (12.5%) | 36.0 |
| College or Associate's Degree | 11 (68.8%) | 175.0 |
| Bachelor's Degree | 3 (18.8%) | 28.0 |
| Graduate Degree | 0 (0.0%) | 0.0 |
| Total | 16 (100.0%) | 52.0 |
Fertility by Education by Marriage Status in St Regis Park
12.5% of women with births in St Regis Park are unmarried. Women with the educational attainment of college or associate's degree are most likely to be married with 100.0% of them married at childbirth, while women with the educational attainment of high school diploma are least likely to be married with 100.0% of them unmarried at childbirth.
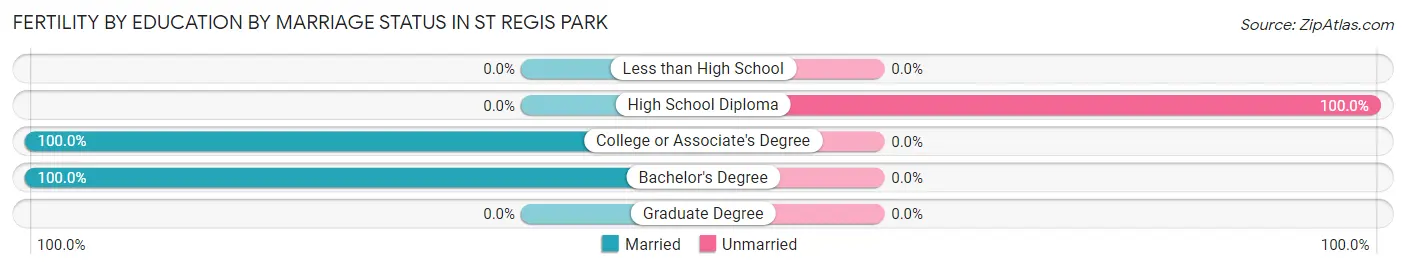
| Educational Attainment | Married | Unmarried |
| Less than High School | 0 (0.0%) | 0 (0.0%) |
| High School Diploma | 0 (0.0%) | 2 (100.0%) |
| College or Associate's Degree | 11 (100.0%) | 0 (0.0%) |
| Bachelor's Degree | 3 (100.0%) | 0 (0.0%) |
| Graduate Degree | 0 (0.0%) | 0 (0.0%) |
| Total | 14 (87.5%) | 2 (12.5%) |
Employment Characteristics in St Regis Park
Employment by Class of Employer in St Regis Park
Among the 808 employed individuals in St Regis Park, private company employees (549 | 67.9%), not-for-profit organizations (101 | 12.5%), and local government employees (57 | 7.0%) make up the most common classes of employment.
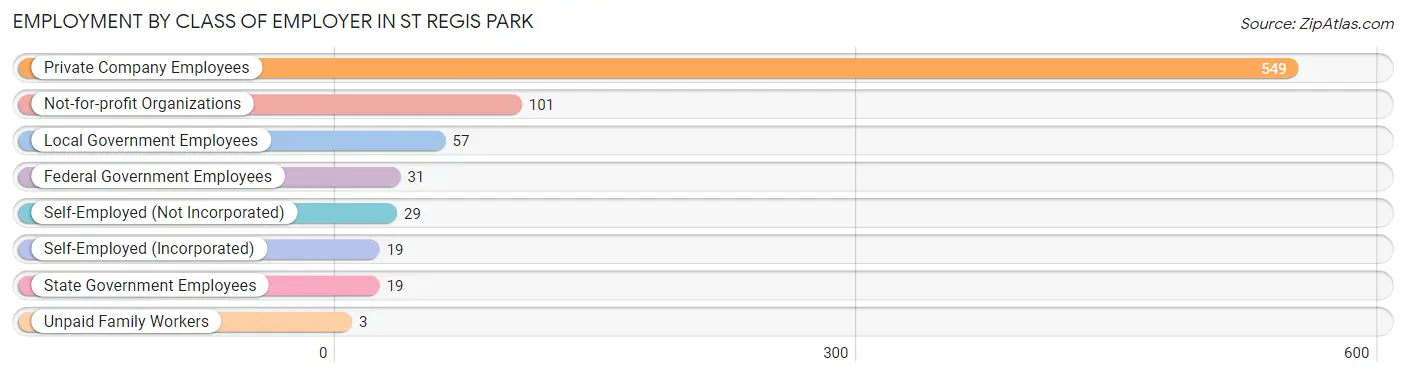
| Employer Class | # Employees | % Employees |
| Private Company Employees | 549 | 67.9% |
| Self-Employed (Incorporated) | 19 | 2.4% |
| Self-Employed (Not Incorporated) | 29 | 3.6% |
| Not-for-profit Organizations | 101 | 12.5% |
| Local Government Employees | 57 | 7.0% |
| State Government Employees | 19 | 2.4% |
| Federal Government Employees | 31 | 3.8% |
| Unpaid Family Workers | 3 | 0.4% |
| Total | 808 | 100.0% |
Employment Status by Age in St Regis Park
According to the labor force statistics for St Regis Park, out of the total population over 16 years of age (1,335), 62.3% or 832 individuals are in the labor force, with 2.1% or 17 of them unemployed. The age group with the highest labor force participation rate is 20 to 24 years, with 100.0% or 42 individuals in the labor force. Within the labor force, the 16 to 19 years age range has the highest percentage of unemployed individuals, with 17.2% or 5 of them being unemployed.
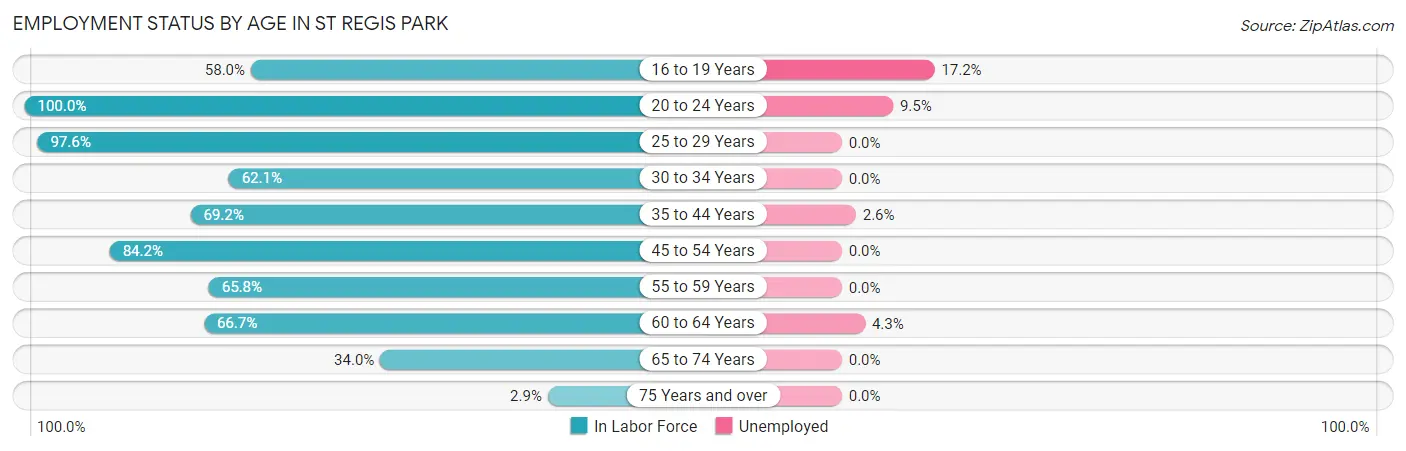
| Age Bracket | In Labor Force | Unemployed |
| 16 to 19 Years | 29 (58.0%) | 5 (17.2%) |
| 20 to 24 Years | 42 (100.0%) | 4 (9.5%) |
| 25 to 29 Years | 81 (97.6%) | 0 (0.0%) |
| 30 to 34 Years | 77 (62.1%) | 0 (0.0%) |
| 35 to 44 Years | 157 (69.2%) | 4 (2.6%) |
| 45 to 54 Years | 187 (84.2%) | 0 (0.0%) |
| 55 to 59 Years | 96 (65.8%) | 0 (0.0%) |
| 60 to 64 Years | 92 (66.7%) | 4 (4.3%) |
| 65 to 74 Years | 68 (34.0%) | 0 (0.0%) |
| 75 Years and over | 3 (2.9%) | 0 (0.0%) |
| Total | 832 (62.3%) | 17 (2.1%) |
Employment Status by Educational Attainment in St Regis Park
According to labor force statistics for St Regis Park, 73.4% of individuals (690) out of the total population between 25 and 64 years of age (940) are in the labor force, with 1.2% or 8 of them being unemployed. The group with the highest labor force participation rate are those with the educational attainment of bachelor's degree or higher, with 84.2% or 409 individuals in the labor force. Within the labor force, individuals with bachelor's degree or higher education have the highest percentage of unemployment, with 2.0% or 8 of them being unemployed.
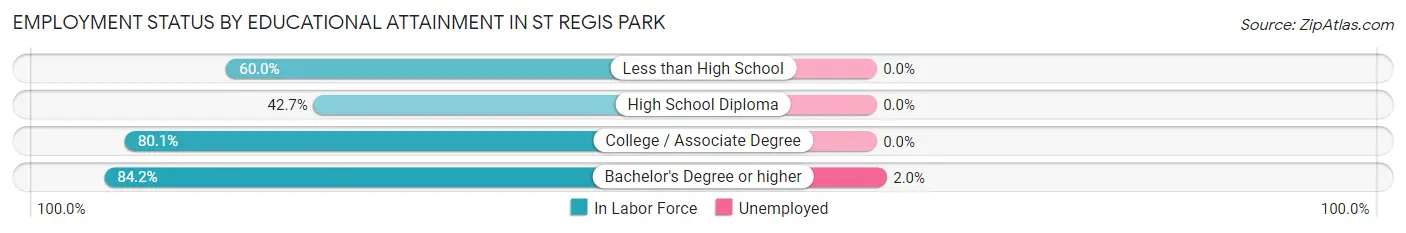
| Educational Attainment | In Labor Force | Unemployed |
| Less than High School | 3 (60.0%) | 0 (0.0%) |
| High School Diploma | 93 (42.7%) | 0 (0.0%) |
| College / Associate Degree | 185 (80.1%) | 0 (0.0%) |
| Bachelor's Degree or higher | 409 (84.2%) | 10 (2.0%) |
| Total | 690 (73.4%) | 11 (1.2%) |
Employment Occupations by Sex in St Regis Park
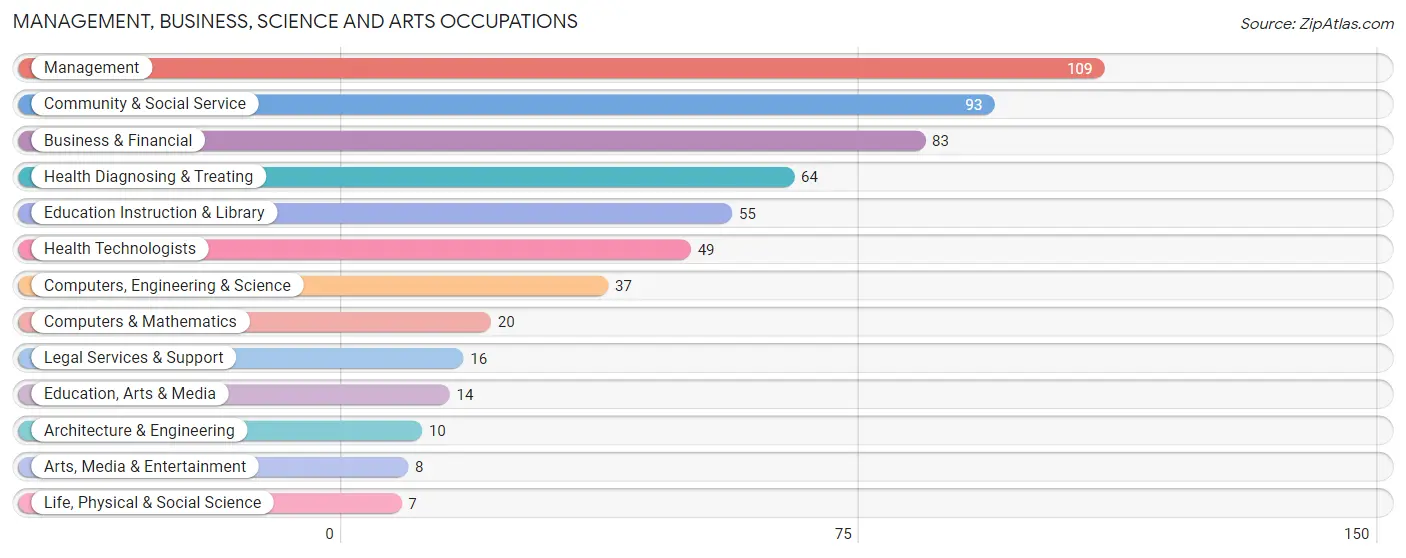
Management, Business, Science and Arts Occupations
The most common Management, Business, Science and Arts occupations in St Regis Park are Management (109 | 13.4%), Community & Social Service (93 | 11.5%), Business & Financial (83 | 10.2%), Health Diagnosing & Treating (64 | 7.9%), and Education Instruction & Library (55 | 6.8%).
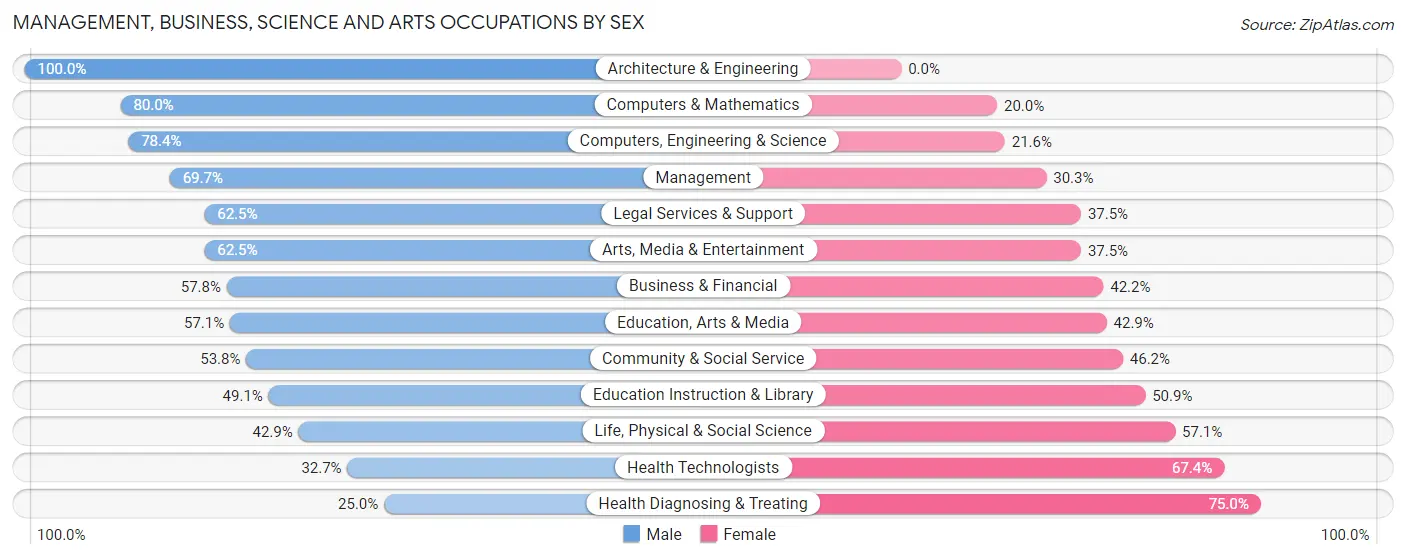
Management, Business, Science and Arts Occupations by Sex
Within the Management, Business, Science and Arts occupations in St Regis Park, the most male-oriented occupations are Architecture & Engineering (100.0%), Computers & Mathematics (80.0%), and Computers, Engineering & Science (78.4%), while the most female-oriented occupations are Health Diagnosing & Treating (75.0%), Health Technologists (67.3%), and Life, Physical & Social Science (57.1%).
| Occupation | Male | Female |
| Management | 76 (69.7%) | 33 (30.3%) |
| Business & Financial | 48 (57.8%) | 35 (42.2%) |
| Computers, Engineering & Science | 29 (78.4%) | 8 (21.6%) |
| Computers & Mathematics | 16 (80.0%) | 4 (20.0%) |
| Architecture & Engineering | 10 (100.0%) | 0 (0.0%) |
| Life, Physical & Social Science | 3 (42.9%) | 4 (57.1%) |
| Community & Social Service | 50 (53.8%) | 43 (46.2%) |
| Education, Arts & Media | 8 (57.1%) | 6 (42.9%) |
| Legal Services & Support | 10 (62.5%) | 6 (37.5%) |
| Education Instruction & Library | 27 (49.1%) | 28 (50.9%) |
| Arts, Media & Entertainment | 5 (62.5%) | 3 (37.5%) |
| Health Diagnosing & Treating | 16 (25.0%) | 48 (75.0%) |
| Health Technologists | 16 (32.7%) | 33 (67.3%) |
| Total (Category) | 219 (56.7%) | 167 (43.3%) |
| Total (Overall) | 487 (60.0%) | 325 (40.0%) |
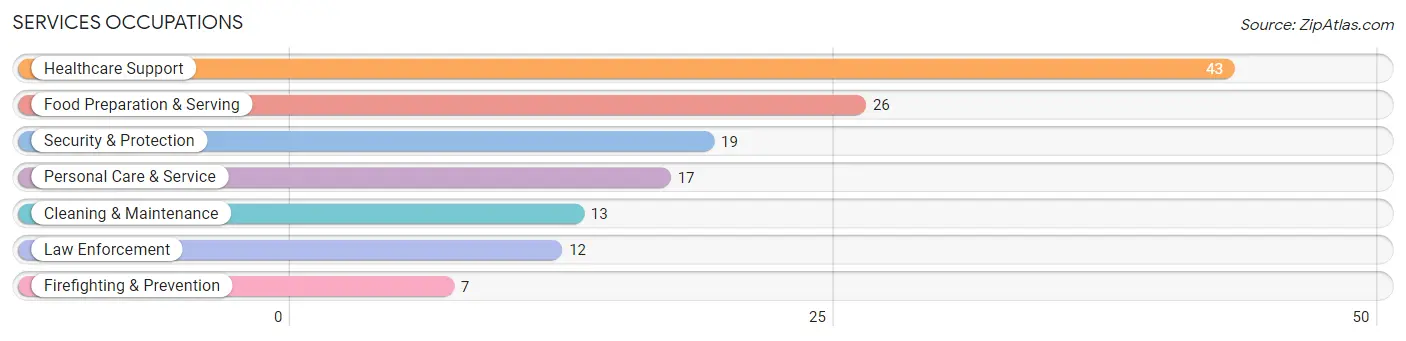
Services Occupations
The most common Services occupations in St Regis Park are Healthcare Support (43 | 5.3%), Food Preparation & Serving (26 | 3.2%), Security & Protection (19 | 2.3%), Personal Care & Service (17 | 2.1%), and Cleaning & Maintenance (13 | 1.6%).
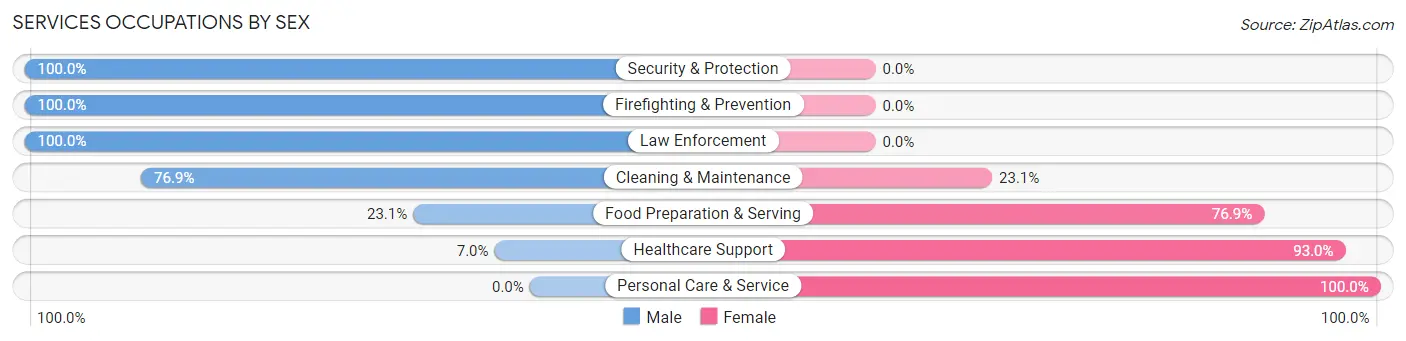
Services Occupations by Sex
Within the Services occupations in St Regis Park, the most male-oriented occupations are Security & Protection (100.0%), Firefighting & Prevention (100.0%), and Law Enforcement (100.0%), while the most female-oriented occupations are Personal Care & Service (100.0%), Healthcare Support (93.0%), and Food Preparation & Serving (76.9%).
| Occupation | Male | Female |
| Healthcare Support | 3 (7.0%) | 40 (93.0%) |
| Security & Protection | 19 (100.0%) | 0 (0.0%) |
| Firefighting & Prevention | 7 (100.0%) | 0 (0.0%) |
| Law Enforcement | 12 (100.0%) | 0 (0.0%) |
| Food Preparation & Serving | 6 (23.1%) | 20 (76.9%) |
| Cleaning & Maintenance | 10 (76.9%) | 3 (23.1%) |
| Personal Care & Service | 0 (0.0%) | 17 (100.0%) |
| Total (Category) | 38 (32.2%) | 80 (67.8%) |
| Total (Overall) | 487 (60.0%) | 325 (40.0%) |
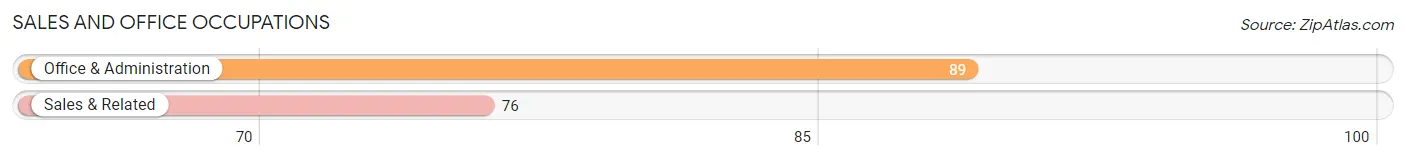
Sales and Office Occupations
The most common Sales and Office occupations in St Regis Park are Office & Administration (89 | 11.0%), and Sales & Related (76 | 9.4%).
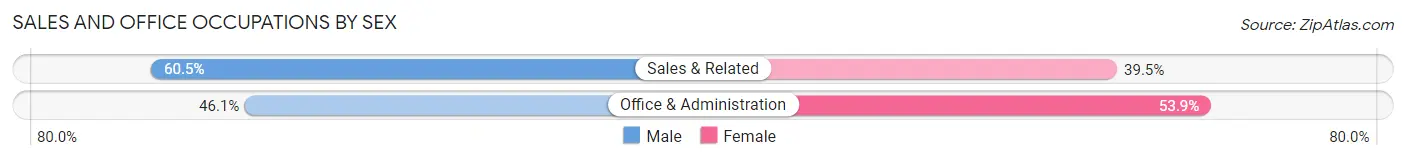
Sales and Office Occupations by Sex
| Occupation | Male | Female |
| Sales & Related | 46 (60.5%) | 30 (39.5%) |
| Office & Administration | 41 (46.1%) | 48 (53.9%) |
| Total (Category) | 87 (52.7%) | 78 (47.3%) |
| Total (Overall) | 487 (60.0%) | 325 (40.0%) |
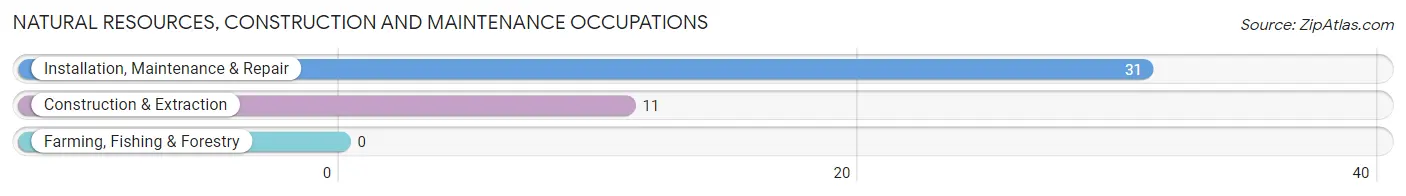
Natural Resources, Construction and Maintenance Occupations
The most common Natural Resources, Construction and Maintenance occupations in St Regis Park are Installation, Maintenance & Repair (31 | 3.8%), and Construction & Extraction (11 | 1.3%).
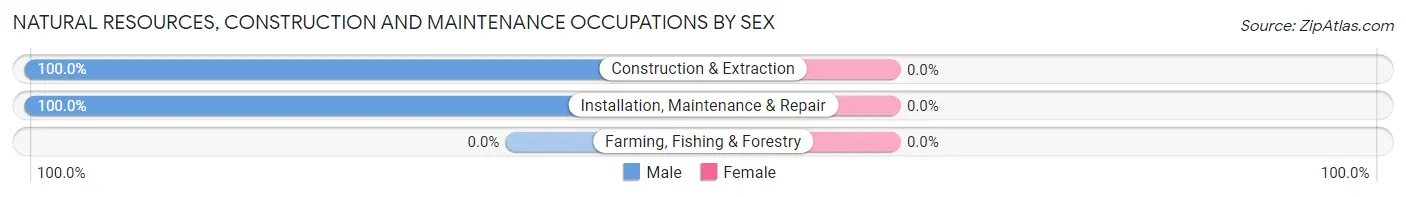
Natural Resources, Construction and Maintenance Occupations by Sex
| Occupation | Male | Female |
| Farming, Fishing & Forestry | 0 (0.0%) | 0 (0.0%) |
| Construction & Extraction | 11 (100.0%) | 0 (0.0%) |
| Installation, Maintenance & Repair | 31 (100.0%) | 0 (0.0%) |
| Total (Category) | 42 (100.0%) | 0 (0.0%) |
| Total (Overall) | 487 (60.0%) | 325 (40.0%) |
Production, Transportation and Moving Occupations
The most common Production, Transportation and Moving occupations in St Regis Park are Transportation (51 | 6.3%), Production (33 | 4.1%), and Material Moving (17 | 2.1%).
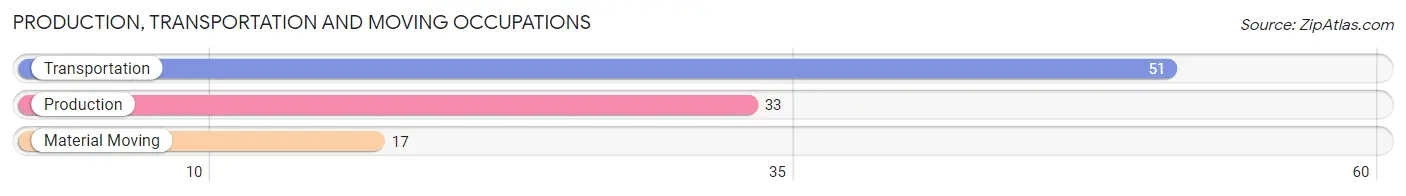
Production, Transportation and Moving Occupations by Sex
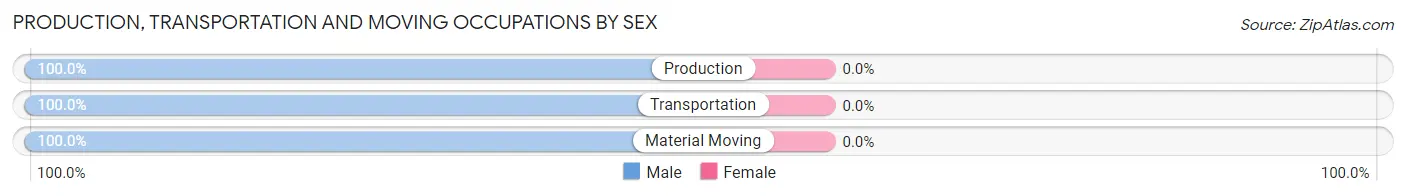
| Occupation | Male | Female |
| Production | 33 (100.0%) | 0 (0.0%) |
| Transportation | 51 (100.0%) | 0 (0.0%) |
| Material Moving | 17 (100.0%) | 0 (0.0%) |
| Total (Category) | 101 (100.0%) | 0 (0.0%) |
| Total (Overall) | 487 (60.0%) | 325 (40.0%) |
Employment Industries by Sex in St Regis Park
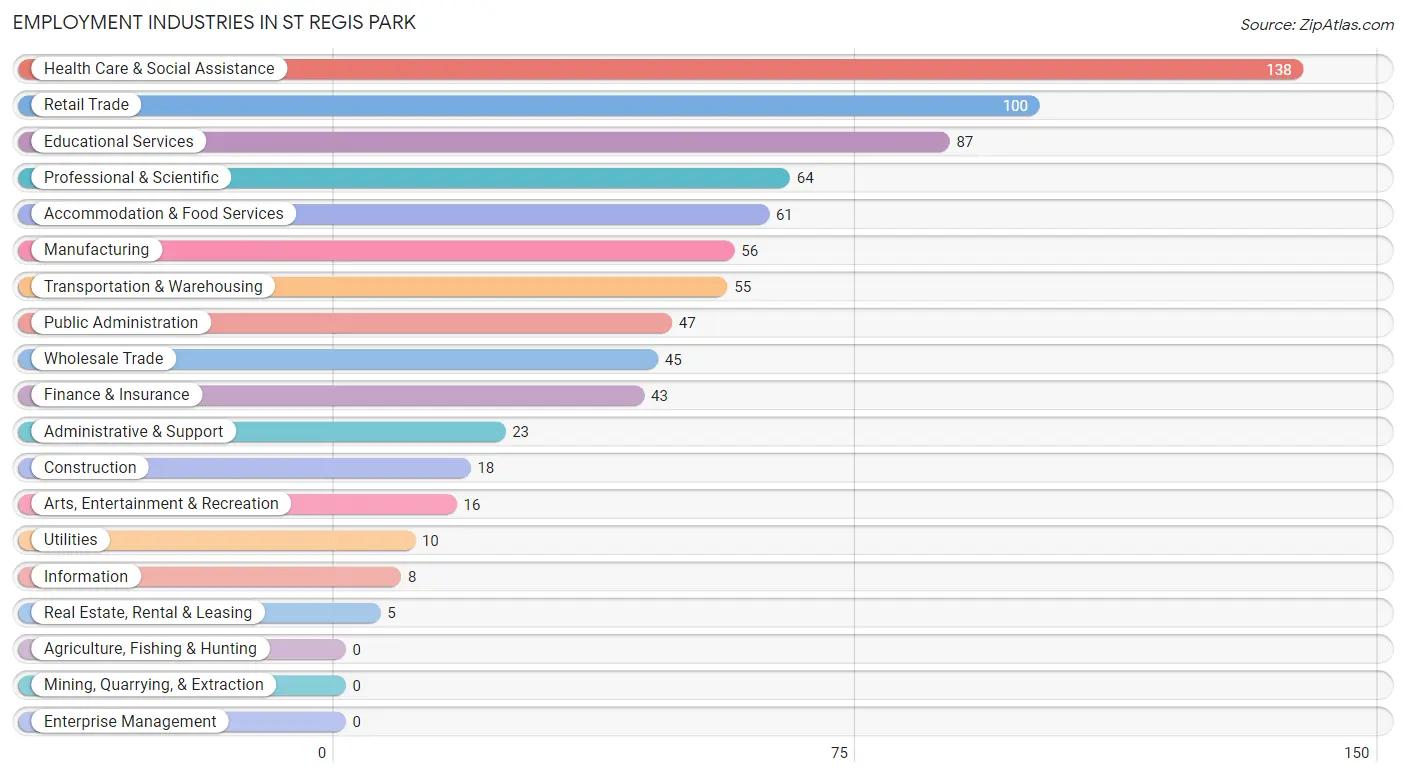
Employment Industries in St Regis Park
The major employment industries in St Regis Park include Health Care & Social Assistance (138 | 17.0%), Retail Trade (100 | 12.3%), Educational Services (87 | 10.7%), Professional & Scientific (64 | 7.9%), and Accommodation & Food Services (61 | 7.5%).
Employment Industries by Sex in St Regis Park
The St Regis Park industries that see more men than women are Utilities (100.0%), Transportation & Warehousing (94.6%), and Construction (88.9%), whereas the industries that tend to have a higher number of women are Real Estate, Rental & Leasing (100.0%), Health Care & Social Assistance (82.6%), and Professional & Scientific (64.1%).
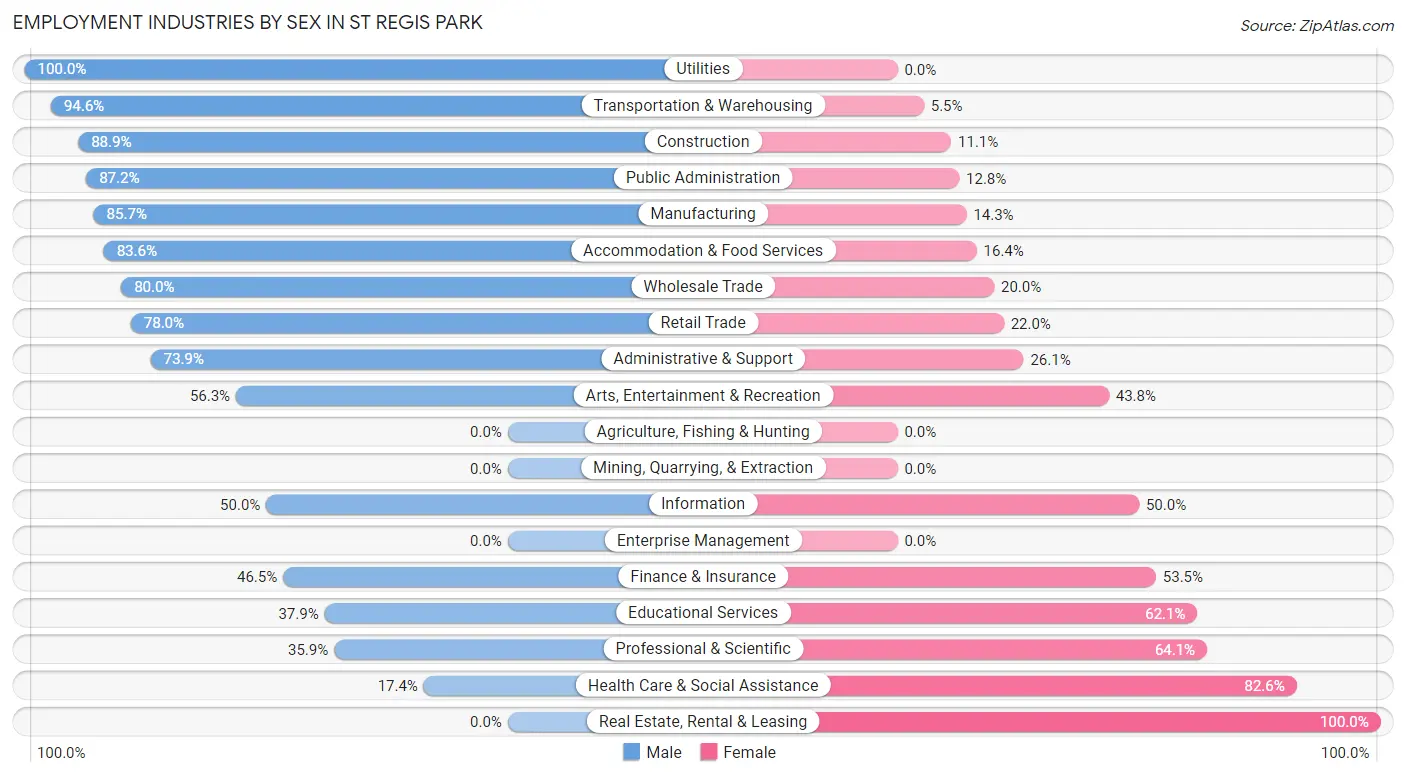
| Industry | Male | Female |
| Agriculture, Fishing & Hunting | 0 (0.0%) | 0 (0.0%) |
| Mining, Quarrying, & Extraction | 0 (0.0%) | 0 (0.0%) |
| Construction | 16 (88.9%) | 2 (11.1%) |
| Manufacturing | 48 (85.7%) | 8 (14.3%) |
| Wholesale Trade | 36 (80.0%) | 9 (20.0%) |
| Retail Trade | 78 (78.0%) | 22 (22.0%) |
| Transportation & Warehousing | 52 (94.6%) | 3 (5.4%) |
| Utilities | 10 (100.0%) | 0 (0.0%) |
| Information | 4 (50.0%) | 4 (50.0%) |
| Finance & Insurance | 20 (46.5%) | 23 (53.5%) |
| Real Estate, Rental & Leasing | 0 (0.0%) | 5 (100.0%) |
| Professional & Scientific | 23 (35.9%) | 41 (64.1%) |
| Enterprise Management | 0 (0.0%) | 0 (0.0%) |
| Administrative & Support | 17 (73.9%) | 6 (26.1%) |
| Educational Services | 33 (37.9%) | 54 (62.1%) |
| Health Care & Social Assistance | 24 (17.4%) | 114 (82.6%) |
| Arts, Entertainment & Recreation | 9 (56.2%) | 7 (43.8%) |
| Accommodation & Food Services | 51 (83.6%) | 10 (16.4%) |
| Public Administration | 41 (87.2%) | 6 (12.8%) |
| Total | 487 (60.0%) | 325 (40.0%) |
Education in St Regis Park
School Enrollment in St Regis Park
The most common levels of schooling among the 363 students in St Regis Park are elementary school (119 | 32.8%), middle school (62 | 17.1%), and high school (60 | 16.5%).
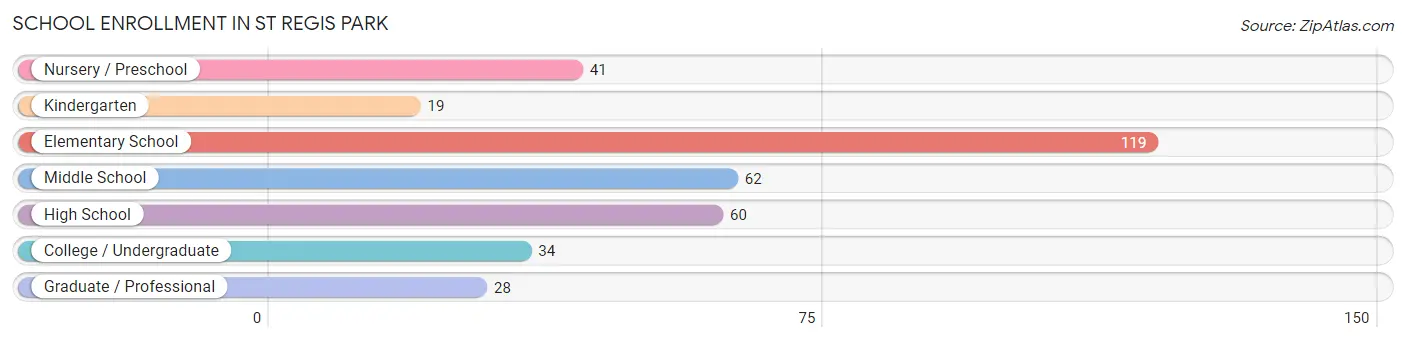
| School Level | # Students | % Students |
| Nursery / Preschool | 41 | 11.3% |
| Kindergarten | 19 | 5.2% |
| Elementary School | 119 | 32.8% |
| Middle School | 62 | 17.1% |
| High School | 60 | 16.5% |
| College / Undergraduate | 34 | 9.4% |
| Graduate / Professional | 28 | 7.7% |
| Total | 363 | 100.0% |
School Enrollment by Age by Funding Source in St Regis Park
Out of a total of 363 students who are enrolled in schools in St Regis Park, 199 (54.8%) attend a private institution, while the remaining 164 (45.2%) are enrolled in public schools. The age group of 3 to 4 year olds has the highest likelihood of being enrolled in private schools, with 39 (100.0% in the age bracket) enrolled. Conversely, the age group of 18 to 19 year olds has the lowest likelihood of being enrolled in a private school, with 10 (100.0% in the age bracket) attending a public institution.
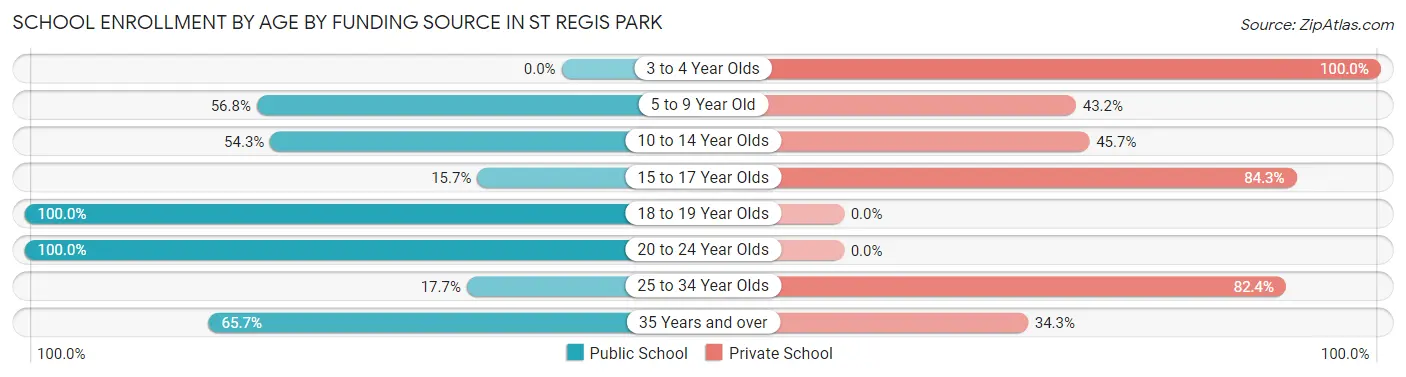
| Age Bracket | Public School | Private School |
| 3 to 4 Year Olds | 0 (0.0%) | 39 (100.0%) |
| 5 to 9 Year Old | 63 (56.8%) | 48 (43.2%) |
| 10 to 14 Year Olds | 51 (54.3%) | 43 (45.7%) |
| 15 to 17 Year Olds | 8 (15.7%) | 43 (84.3%) |
| 18 to 19 Year Olds | 10 (100.0%) | 0 (0.0%) |
| 20 to 24 Year Olds | 6 (100.0%) | 0 (0.0%) |
| 25 to 34 Year Olds | 3 (17.6%) | 14 (82.4%) |
| 35 Years and over | 23 (65.7%) | 12 (34.3%) |
| Total | 164 (45.2%) | 199 (54.8%) |
Educational Attainment by Field of Study in St Regis Park
Business (172 | 25.9%), education (86 | 13.0%), social sciences (62 | 9.3%), science & technology (57 | 8.6%), and engineering (51 | 7.7%) are the most common fields of study among 663 individuals in St Regis Park who have obtained a bachelor's degree or higher.
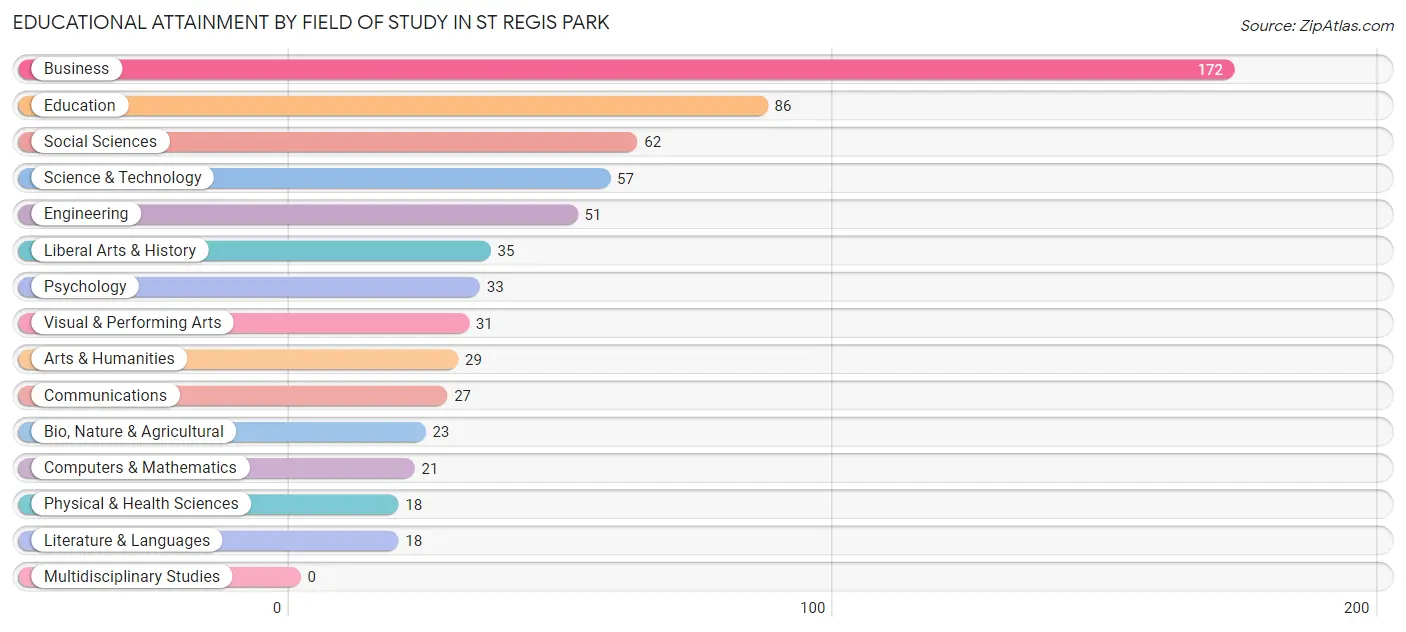
| Field of Study | # Graduates | % Graduates |
| Computers & Mathematics | 21 | 3.2% |
| Bio, Nature & Agricultural | 23 | 3.5% |
| Physical & Health Sciences | 18 | 2.7% |
| Psychology | 33 | 5.0% |
| Social Sciences | 62 | 9.3% |
| Engineering | 51 | 7.7% |
| Multidisciplinary Studies | 0 | 0.0% |
| Science & Technology | 57 | 8.6% |
| Business | 172 | 25.9% |
| Education | 86 | 13.0% |
| Literature & Languages | 18 | 2.7% |
| Liberal Arts & History | 35 | 5.3% |
| Visual & Performing Arts | 31 | 4.7% |
| Communications | 27 | 4.1% |
| Arts & Humanities | 29 | 4.4% |
| Total | 663 | 100.0% |
Transportation & Commute in St Regis Park
Vehicle Availability by Sex in St Regis Park
The most prevalent vehicle ownership categories in St Regis Park are males with 2 vehicles (308, accounting for 63.2%) and females with 2 vehicles (172, making up 96.0%).
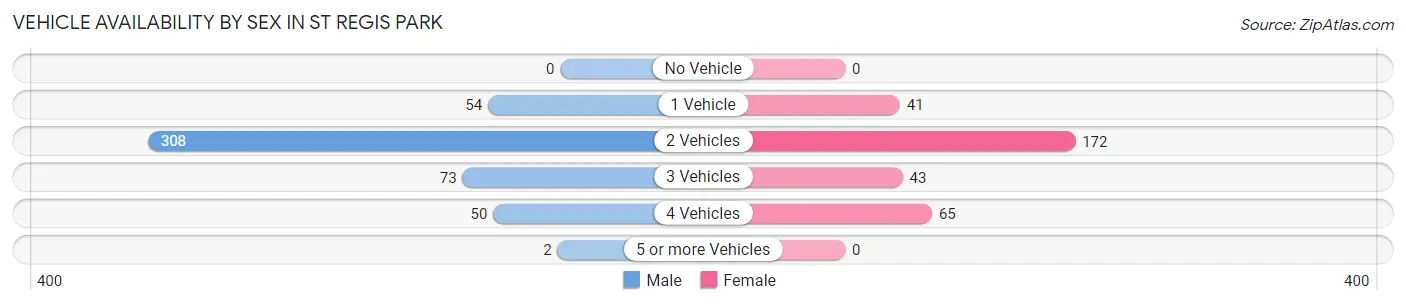
| Vehicles Available | Male | Female |
| No Vehicle | 0 (0.0%) | 0 (0.0%) |
| 1 Vehicle | 54 (11.1%) | 41 (12.8%) |
| 2 Vehicles | 308 (63.2%) | 172 (53.6%) |
| 3 Vehicles | 73 (15.0%) | 43 (13.4%) |
| 4 Vehicles | 50 (10.3%) | 65 (20.3%) |
| 5 or more Vehicles | 2 (0.4%) | 0 (0.0%) |
| Total | 487 (100.0%) | 321 (100.0%) |
Commute Time in St Regis Park
The most frequently occuring commute durations in St Regis Park are 20 to 24 minutes (180 commuters, 26.8%), 15 to 19 minutes (146 commuters, 21.8%), and 10 to 14 minutes (113 commuters, 16.8%).
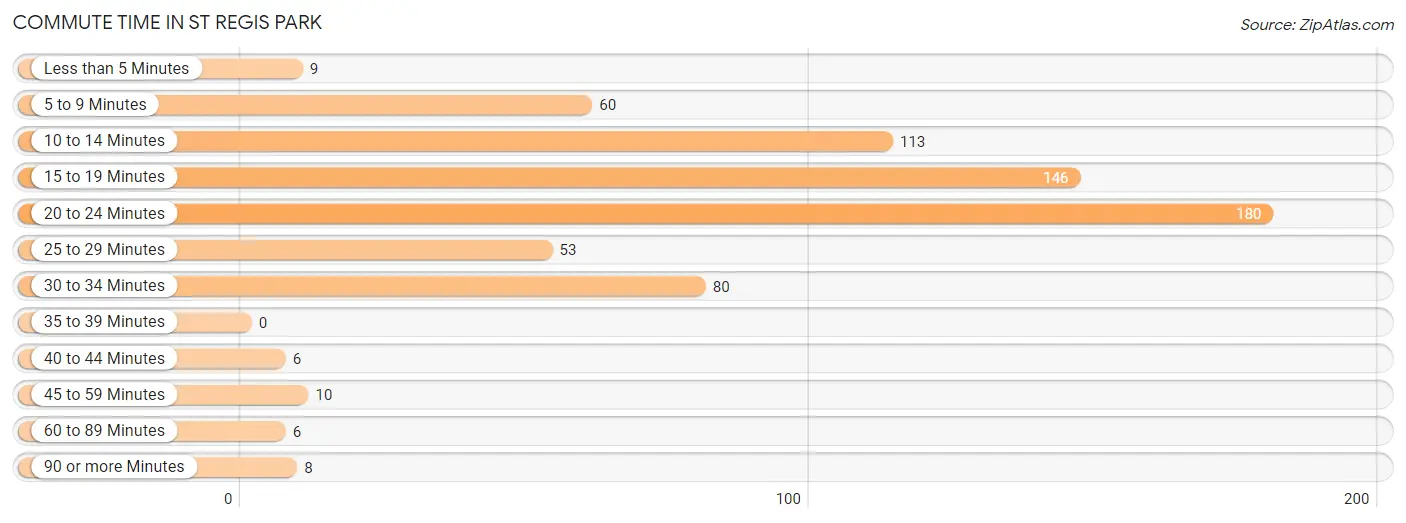
| Commute Time | # Commuters | % Commuters |
| Less than 5 Minutes | 9 | 1.3% |
| 5 to 9 Minutes | 60 | 8.9% |
| 10 to 14 Minutes | 113 | 16.8% |
| 15 to 19 Minutes | 146 | 21.8% |
| 20 to 24 Minutes | 180 | 26.8% |
| 25 to 29 Minutes | 53 | 7.9% |
| 30 to 34 Minutes | 80 | 11.9% |
| 35 to 39 Minutes | 0 | 0.0% |
| 40 to 44 Minutes | 6 | 0.9% |
| 45 to 59 Minutes | 10 | 1.5% |
| 60 to 89 Minutes | 6 | 0.9% |
| 90 or more Minutes | 8 | 1.2% |
Commute Time by Sex in St Regis Park
The most common commute times in St Regis Park are 15 to 19 minutes (111 commuters, 26.9%) for males and 20 to 24 minutes (89 commuters, 34.4%) for females.
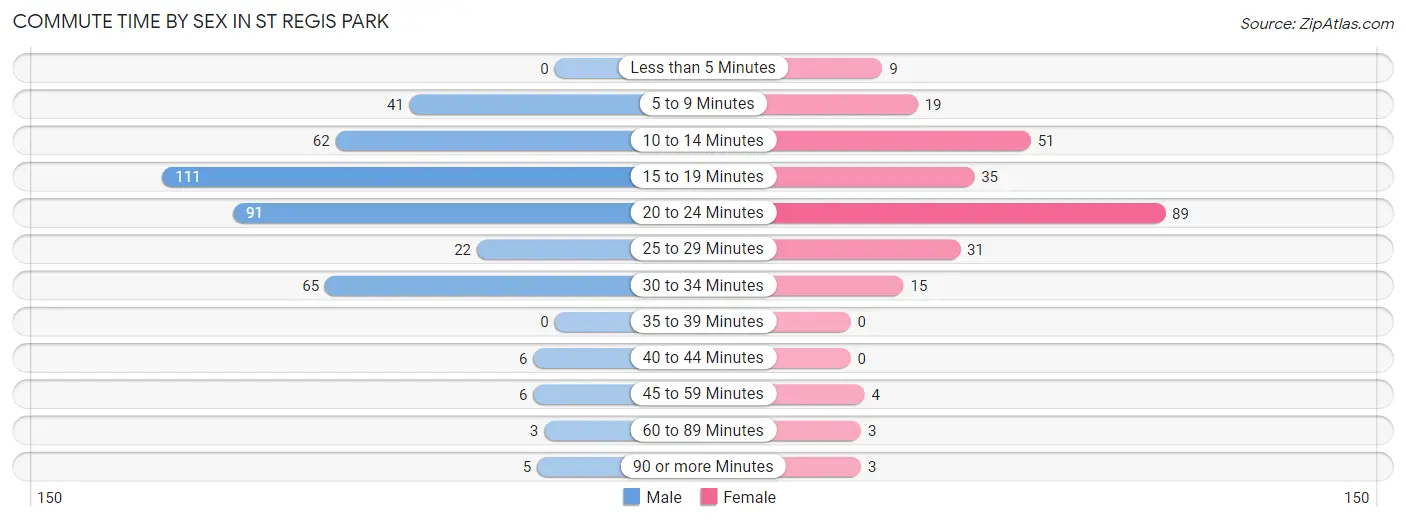
| Commute Time | Male | Female |
| Less than 5 Minutes | 0 (0.0%) | 9 (3.5%) |
| 5 to 9 Minutes | 41 (10.0%) | 19 (7.3%) |
| 10 to 14 Minutes | 62 (15.0%) | 51 (19.7%) |
| 15 to 19 Minutes | 111 (26.9%) | 35 (13.5%) |
| 20 to 24 Minutes | 91 (22.1%) | 89 (34.4%) |
| 25 to 29 Minutes | 22 (5.3%) | 31 (12.0%) |
| 30 to 34 Minutes | 65 (15.8%) | 15 (5.8%) |
| 35 to 39 Minutes | 0 (0.0%) | 0 (0.0%) |
| 40 to 44 Minutes | 6 (1.5%) | 0 (0.0%) |
| 45 to 59 Minutes | 6 (1.5%) | 4 (1.5%) |
| 60 to 89 Minutes | 3 (0.7%) | 3 (1.2%) |
| 90 or more Minutes | 5 (1.2%) | 3 (1.2%) |
Time of Departure to Work by Sex in St Regis Park
The most frequent times of departure to work in St Regis Park are 9:00 AM to 9:59 AM (88, 21.4%) for males and 7:30 AM to 7:59 AM (70, 27.0%) for females.
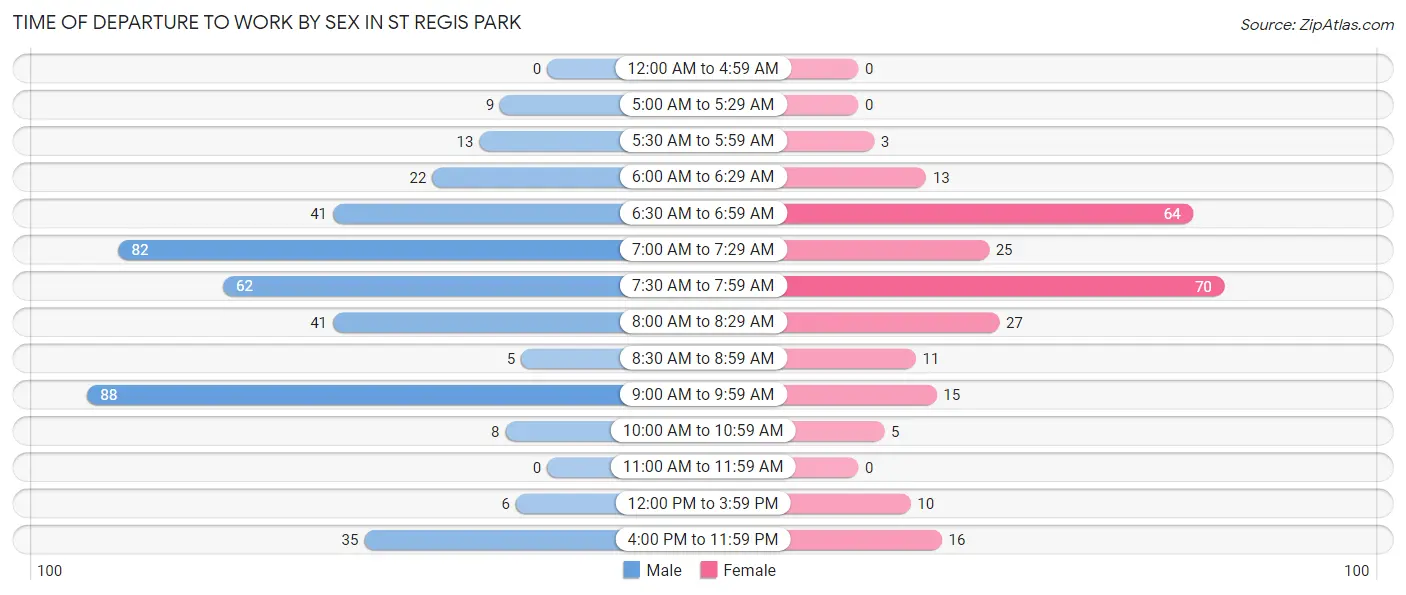
| Time of Departure | Male | Female |
| 12:00 AM to 4:59 AM | 0 (0.0%) | 0 (0.0%) |
| 5:00 AM to 5:29 AM | 9 (2.2%) | 0 (0.0%) |
| 5:30 AM to 5:59 AM | 13 (3.2%) | 3 (1.2%) |
| 6:00 AM to 6:29 AM | 22 (5.3%) | 13 (5.0%) |
| 6:30 AM to 6:59 AM | 41 (10.0%) | 64 (24.7%) |
| 7:00 AM to 7:29 AM | 82 (19.9%) | 25 (9.7%) |
| 7:30 AM to 7:59 AM | 62 (15.0%) | 70 (27.0%) |
| 8:00 AM to 8:29 AM | 41 (10.0%) | 27 (10.4%) |
| 8:30 AM to 8:59 AM | 5 (1.2%) | 11 (4.3%) |
| 9:00 AM to 9:59 AM | 88 (21.4%) | 15 (5.8%) |
| 10:00 AM to 10:59 AM | 8 (1.9%) | 5 (1.9%) |
| 11:00 AM to 11:59 AM | 0 (0.0%) | 0 (0.0%) |
| 12:00 PM to 3:59 PM | 6 (1.5%) | 10 (3.9%) |
| 4:00 PM to 11:59 PM | 35 (8.5%) | 16 (6.2%) |
| Total | 412 (100.0%) | 259 (100.0%) |
Housing Occupancy in St Regis Park
Occupancy by Ownership in St Regis Park
Of the total 635 dwellings in St Regis Park, owner-occupied units account for 601 (94.7%), while renter-occupied units make up 34 (5.3%).
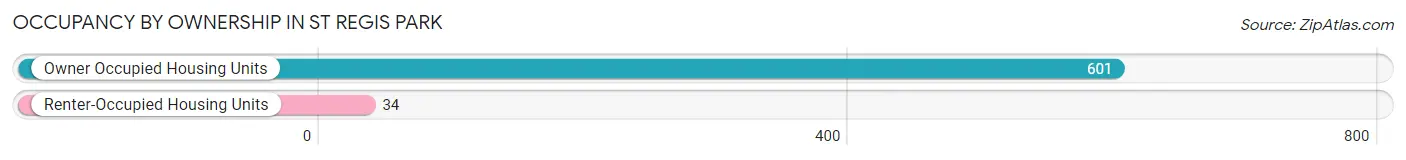
| Occupancy | # Housing Units | % Housing Units |
| Owner Occupied Housing Units | 601 | 94.7% |
| Renter-Occupied Housing Units | 34 | 5.3% |
| Total Occupied Housing Units | 635 | 100.0% |
Occupancy by Household Size in St Regis Park
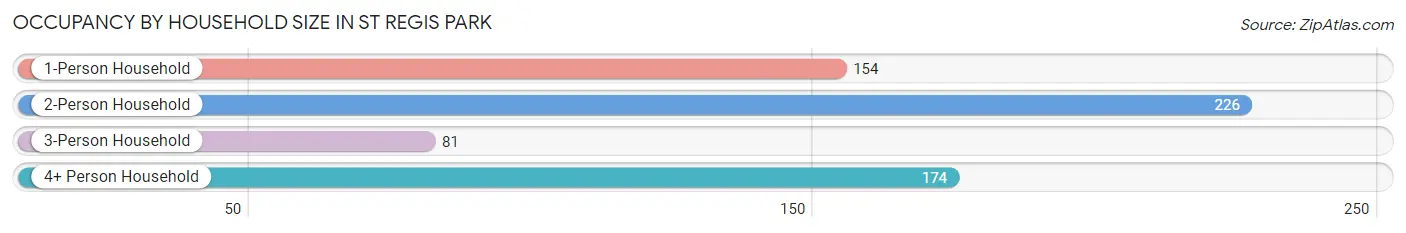
| Household Size | # Housing Units | % Housing Units |
| 1-Person Household | 154 | 24.2% |
| 2-Person Household | 226 | 35.6% |
| 3-Person Household | 81 | 12.8% |
| 4+ Person Household | 174 | 27.4% |
| Total Housing Units | 635 | 100.0% |
Occupancy by Ownership by Household Size in St Regis Park
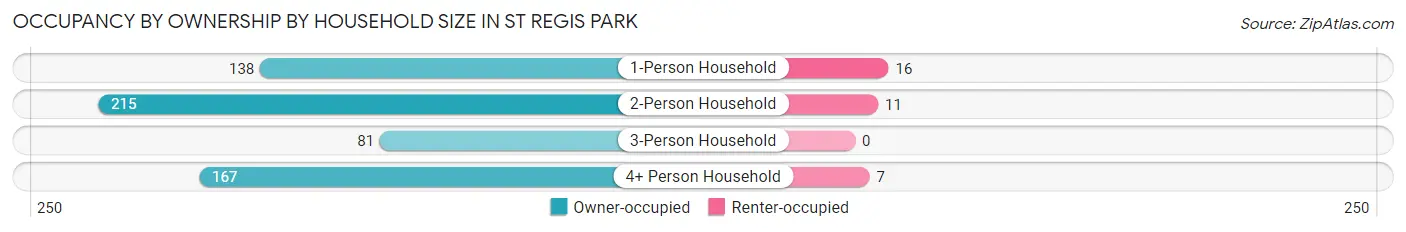
| Household Size | Owner-occupied | Renter-occupied |
| 1-Person Household | 138 (89.6%) | 16 (10.4%) |
| 2-Person Household | 215 (95.1%) | 11 (4.9%) |
| 3-Person Household | 81 (100.0%) | 0 (0.0%) |
| 4+ Person Household | 167 (96.0%) | 7 (4.0%) |
| Total Housing Units | 601 (94.7%) | 34 (5.3%) |
Occupancy by Educational Attainment in St Regis Park
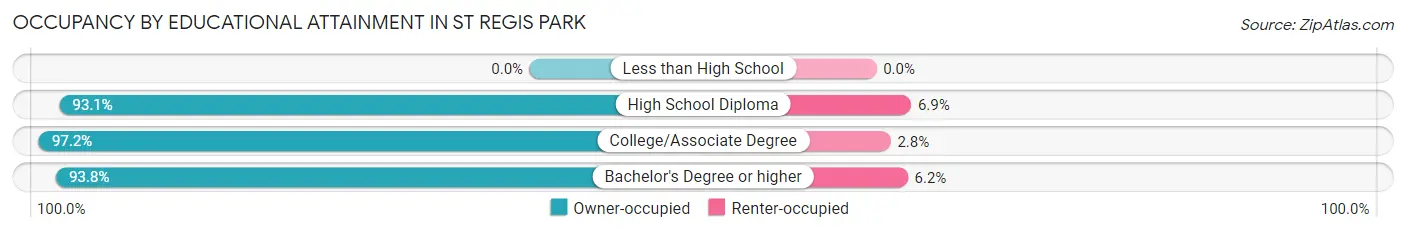
| Household Size | Owner-occupied | Renter-occupied |
| Less than High School | 0 (0.0%) | 0 (0.0%) |
| High School Diploma | 54 (93.1%) | 4 (6.9%) |
| College/Associate Degree | 171 (97.2%) | 5 (2.8%) |
| Bachelor's Degree or higher | 376 (93.8%) | 25 (6.2%) |
Occupancy by Age of Householder in St Regis Park
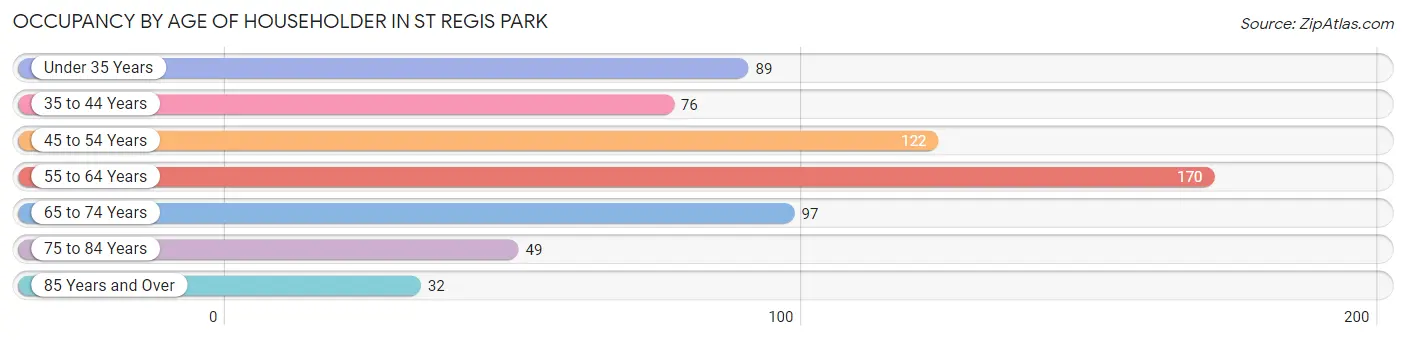
| Age Bracket | # Households | % Households |
| Under 35 Years | 89 | 14.0% |
| 35 to 44 Years | 76 | 12.0% |
| 45 to 54 Years | 122 | 19.2% |
| 55 to 64 Years | 170 | 26.8% |
| 65 to 74 Years | 97 | 15.3% |
| 75 to 84 Years | 49 | 7.7% |
| 85 Years and Over | 32 | 5.0% |
| Total | 635 | 100.0% |
Housing Finances in St Regis Park
Median Income by Occupancy in St Regis Park
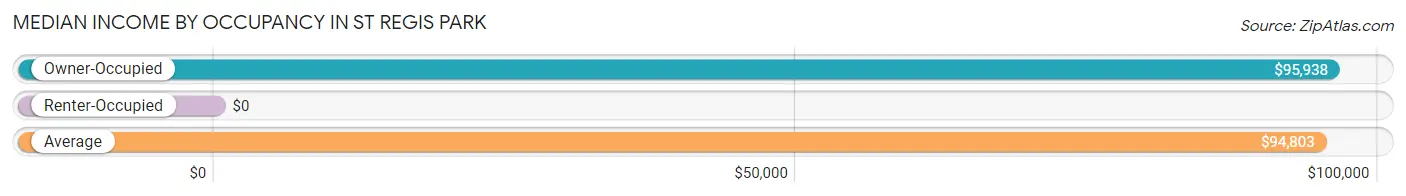
| Occupancy Type | # Households | Median Income |
| Owner-Occupied | 601 (94.7%) | $95,938 |
| Renter-Occupied | 34 (5.3%) | $0 |
| Average | 635 (100.0%) | $94,803 |
Occupancy by Householder Income Bracket in St Regis Park
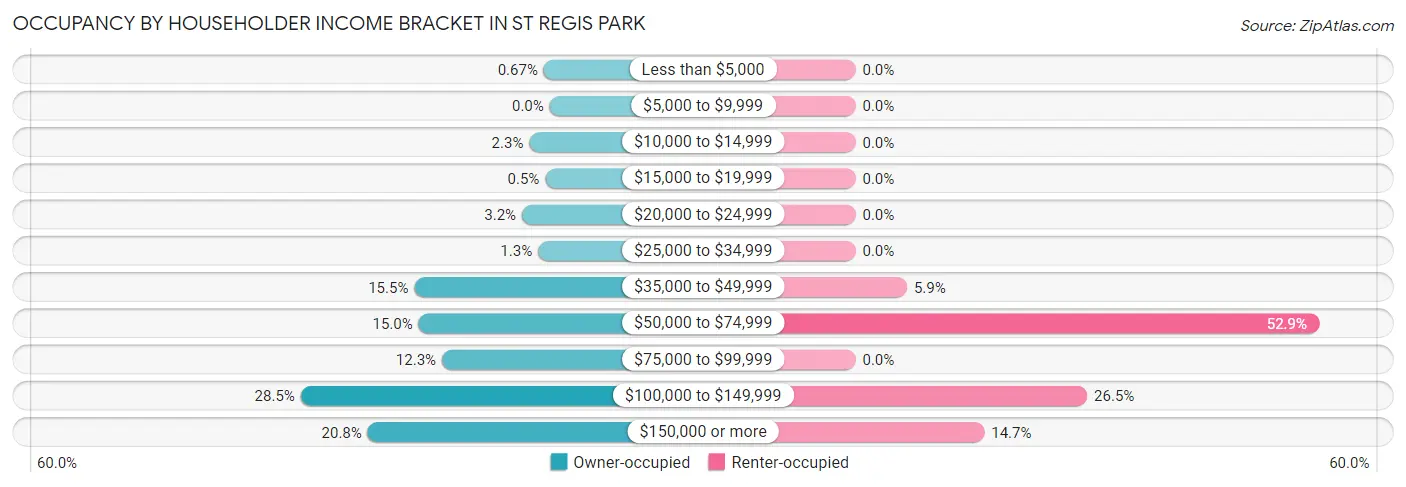
| Income Bracket | Owner-occupied | Renter-occupied |
| Less than $5,000 | 4 (0.7%) | 0 (0.0%) |
| $5,000 to $9,999 | 0 (0.0%) | 0 (0.0%) |
| $10,000 to $14,999 | 14 (2.3%) | 0 (0.0%) |
| $15,000 to $19,999 | 3 (0.5%) | 0 (0.0%) |
| $20,000 to $24,999 | 19 (3.2%) | 0 (0.0%) |
| $25,000 to $34,999 | 8 (1.3%) | 0 (0.0%) |
| $35,000 to $49,999 | 93 (15.5%) | 2 (5.9%) |
| $50,000 to $74,999 | 90 (15.0%) | 18 (52.9%) |
| $75,000 to $99,999 | 74 (12.3%) | 0 (0.0%) |
| $100,000 to $149,999 | 171 (28.4%) | 9 (26.5%) |
| $150,000 or more | 125 (20.8%) | 5 (14.7%) |
| Total | 601 (100.0%) | 34 (100.0%) |
Monthly Housing Cost Tiers in St Regis Park
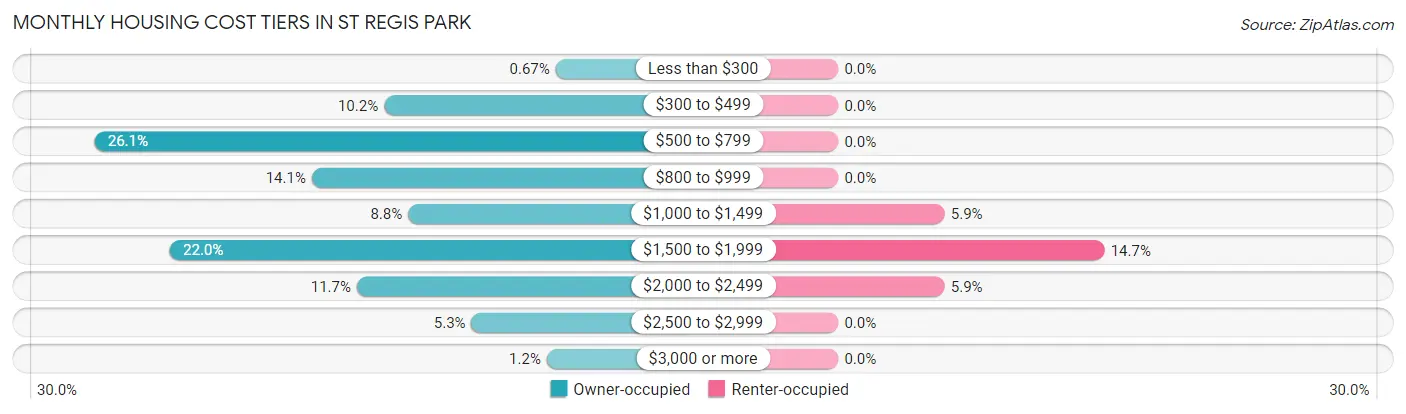
| Monthly Cost | Owner-occupied | Renter-occupied |
| Less than $300 | 4 (0.7%) | 0 (0.0%) |
| $300 to $499 | 61 (10.2%) | 0 (0.0%) |
| $500 to $799 | 157 (26.1%) | 0 (0.0%) |
| $800 to $999 | 85 (14.1%) | 0 (0.0%) |
| $1,000 to $1,499 | 53 (8.8%) | 2 (5.9%) |
| $1,500 to $1,999 | 132 (22.0%) | 5 (14.7%) |
| $2,000 to $2,499 | 70 (11.7%) | 2 (5.9%) |
| $2,500 to $2,999 | 32 (5.3%) | 0 (0.0%) |
| $3,000 or more | 7 (1.2%) | 0 (0.0%) |
| Total | 601 (100.0%) | 34 (100.0%) |
Physical Housing Characteristics in St Regis Park
Housing Structures in St Regis Park
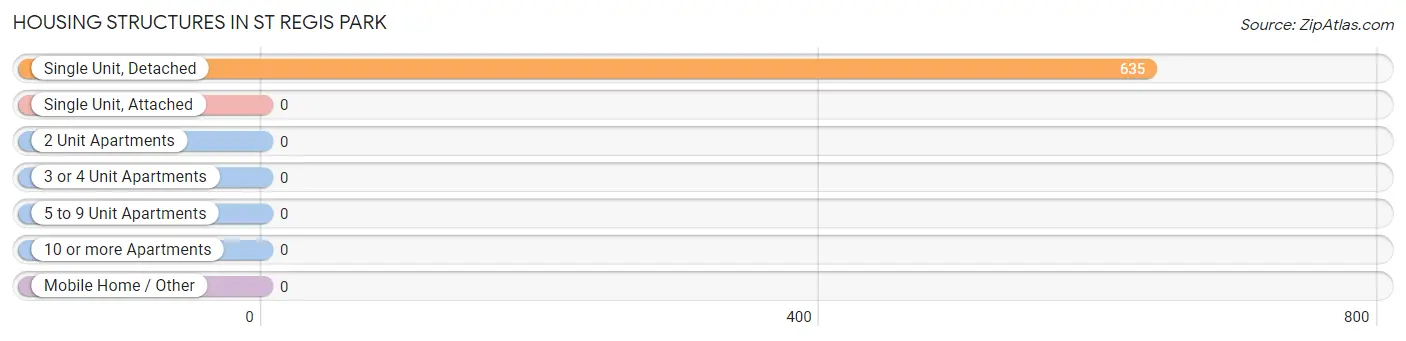
| Structure Type | # Housing Units | % Housing Units |
| Single Unit, Detached | 635 | 100.0% |
| Single Unit, Attached | 0 | 0.0% |
| 2 Unit Apartments | 0 | 0.0% |
| 3 or 4 Unit Apartments | 0 | 0.0% |
| 5 to 9 Unit Apartments | 0 | 0.0% |
| 10 or more Apartments | 0 | 0.0% |
| Mobile Home / Other | 0 | 0.0% |
| Total | 635 | 100.0% |
Housing Structures by Occupancy in St Regis Park
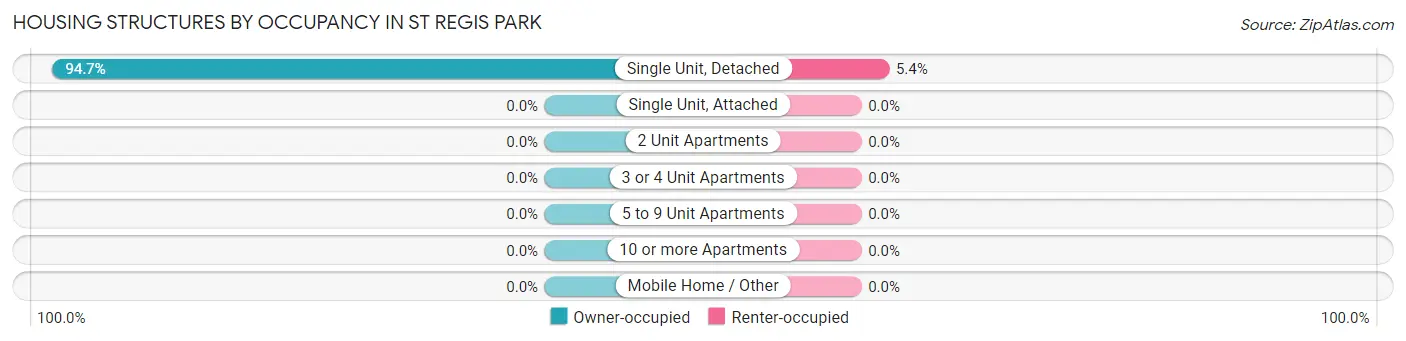
| Structure Type | Owner-occupied | Renter-occupied |
| Single Unit, Detached | 601 (94.7%) | 34 (5.3%) |
| Single Unit, Attached | 0 (0.0%) | 0 (0.0%) |
| 2 Unit Apartments | 0 (0.0%) | 0 (0.0%) |
| 3 or 4 Unit Apartments | 0 (0.0%) | 0 (0.0%) |
| 5 to 9 Unit Apartments | 0 (0.0%) | 0 (0.0%) |
| 10 or more Apartments | 0 (0.0%) | 0 (0.0%) |
| Mobile Home / Other | 0 (0.0%) | 0 (0.0%) |
| Total | 601 (94.7%) | 34 (5.3%) |
Housing Structures by Number of Rooms in St Regis Park
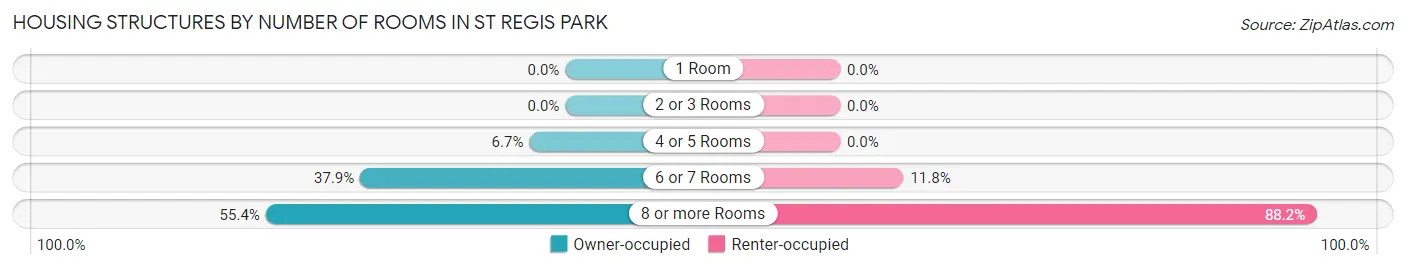
| Number of Rooms | Owner-occupied | Renter-occupied |
| 1 Room | 0 (0.0%) | 0 (0.0%) |
| 2 or 3 Rooms | 0 (0.0%) | 0 (0.0%) |
| 4 or 5 Rooms | 40 (6.7%) | 0 (0.0%) |
| 6 or 7 Rooms | 228 (37.9%) | 4 (11.8%) |
| 8 or more Rooms | 333 (55.4%) | 30 (88.2%) |
| Total | 601 (100.0%) | 34 (100.0%) |
Housing Structure by Heating Type in St Regis Park
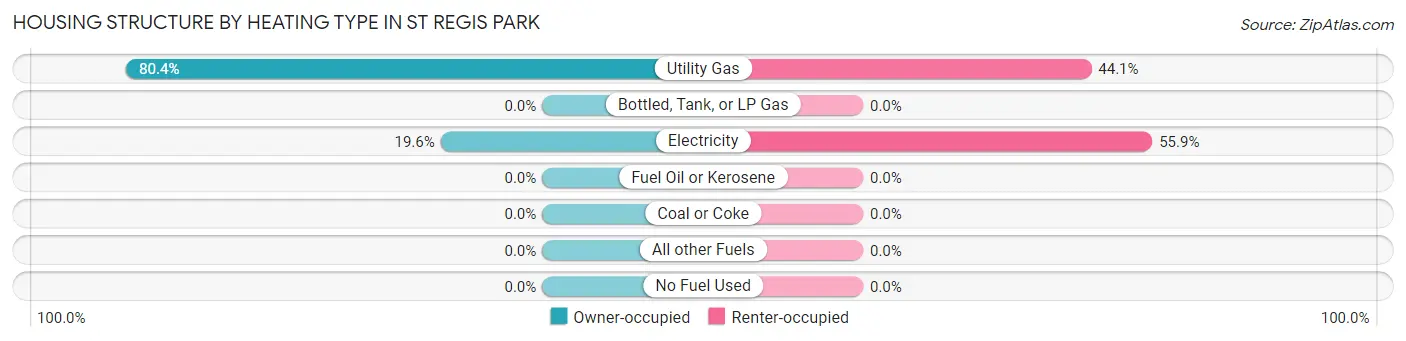
| Heating Type | Owner-occupied | Renter-occupied |
| Utility Gas | 483 (80.4%) | 15 (44.1%) |
| Bottled, Tank, or LP Gas | 0 (0.0%) | 0 (0.0%) |
| Electricity | 118 (19.6%) | 19 (55.9%) |
| Fuel Oil or Kerosene | 0 (0.0%) | 0 (0.0%) |
| Coal or Coke | 0 (0.0%) | 0 (0.0%) |
| All other Fuels | 0 (0.0%) | 0 (0.0%) |
| No Fuel Used | 0 (0.0%) | 0 (0.0%) |
| Total | 601 (100.0%) | 34 (100.0%) |
Household Vehicle Usage in St Regis Park
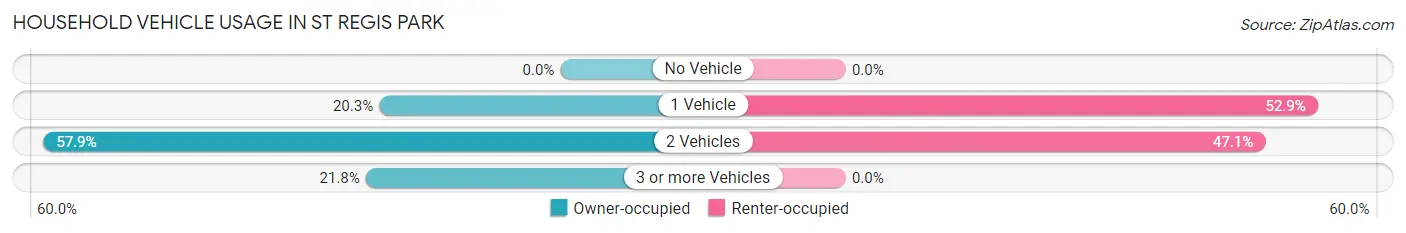
| Vehicles per Household | Owner-occupied | Renter-occupied |
| No Vehicle | 0 (0.0%) | 0 (0.0%) |
| 1 Vehicle | 122 (20.3%) | 18 (52.9%) |
| 2 Vehicles | 348 (57.9%) | 16 (47.1%) |
| 3 or more Vehicles | 131 (21.8%) | 0 (0.0%) |
| Total | 601 (100.0%) | 34 (100.0%) |
Real Estate & Mortgages in St Regis Park
Real Estate and Mortgage Overview in St Regis Park
| Characteristic | Without Mortgage | With Mortgage |
| Housing Units | 299 | 302 |
| Median Property Value | $281,000 | $320,100 |
| Median Household Income | $66,458 | $105 |
| Monthly Housing Costs | $631 | $7 |
| Real Estate Taxes | $2,518 | $7 |
Property Value by Mortgage Status in St Regis Park
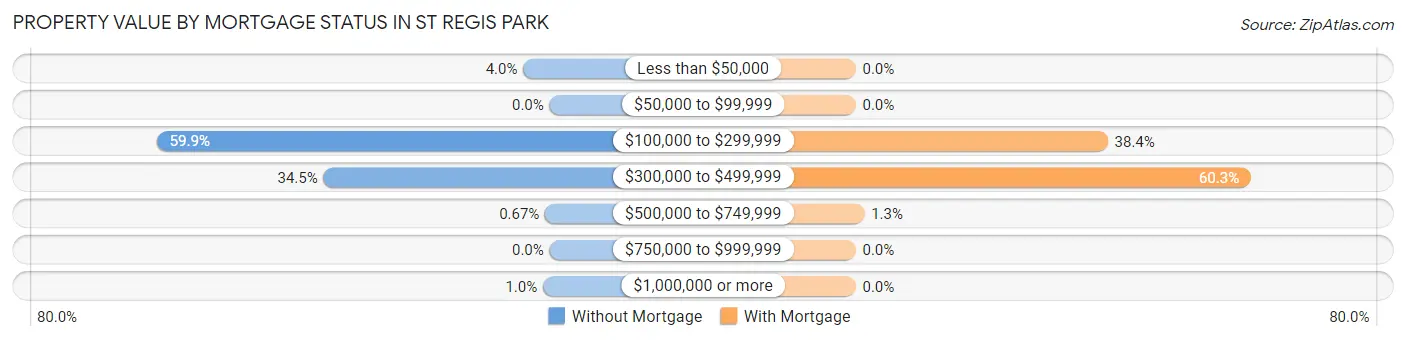
| Property Value | Without Mortgage | With Mortgage |
| Less than $50,000 | 12 (4.0%) | 0 (0.0%) |
| $50,000 to $99,999 | 0 (0.0%) | 0 (0.0%) |
| $100,000 to $299,999 | 179 (59.9%) | 116 (38.4%) |
| $300,000 to $499,999 | 103 (34.4%) | 182 (60.3%) |
| $500,000 to $749,999 | 2 (0.7%) | 4 (1.3%) |
| $750,000 to $999,999 | 0 (0.0%) | 0 (0.0%) |
| $1,000,000 or more | 3 (1.0%) | 0 (0.0%) |
| Total | 299 (100.0%) | 302 (100.0%) |
Household Income by Mortgage Status in St Regis Park
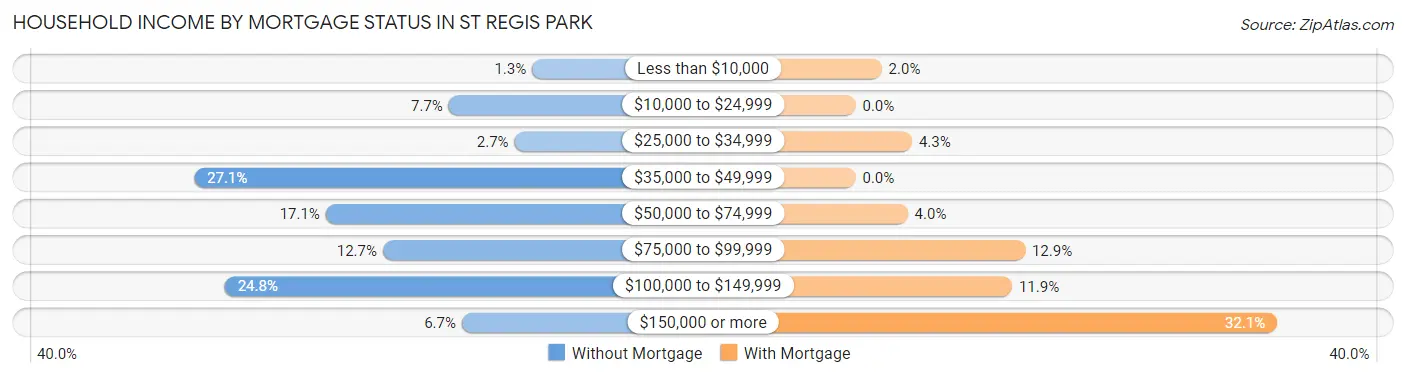
| Household Income | Without Mortgage | With Mortgage |
| Less than $10,000 | 4 (1.3%) | 6 (2.0%) |
| $10,000 to $24,999 | 23 (7.7%) | 0 (0.0%) |
| $25,000 to $34,999 | 8 (2.7%) | 13 (4.3%) |
| $35,000 to $49,999 | 81 (27.1%) | 0 (0.0%) |
| $50,000 to $74,999 | 51 (17.1%) | 12 (4.0%) |
| $75,000 to $99,999 | 38 (12.7%) | 39 (12.9%) |
| $100,000 to $149,999 | 74 (24.7%) | 36 (11.9%) |
| $150,000 or more | 20 (6.7%) | 97 (32.1%) |
| Total | 299 (100.0%) | 302 (100.0%) |
Property Value to Household Income Ratio in St Regis Park
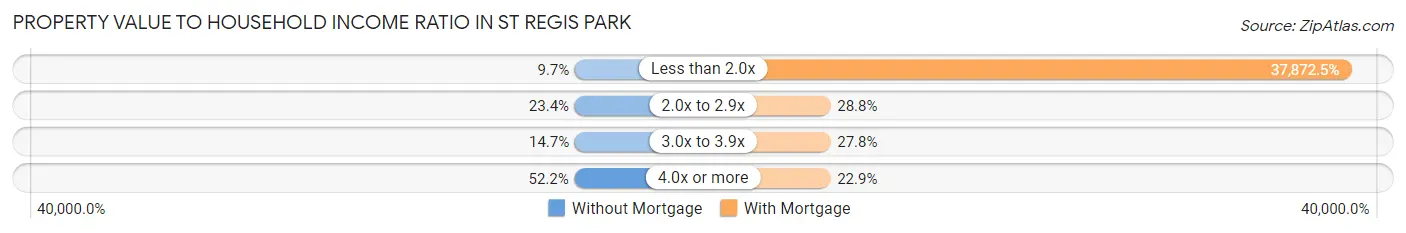
| Value-to-Income Ratio | Without Mortgage | With Mortgage |
| Less than 2.0x | 29 (9.7%) | 114,375 (37,872.5%) |
| 2.0x to 2.9x | 70 (23.4%) | 87 (28.8%) |
| 3.0x to 3.9x | 44 (14.7%) | 84 (27.8%) |
| 4.0x or more | 156 (52.2%) | 69 (22.9%) |
| Total | 299 (100.0%) | 302 (100.0%) |
Real Estate Taxes by Mortgage Status in St Regis Park
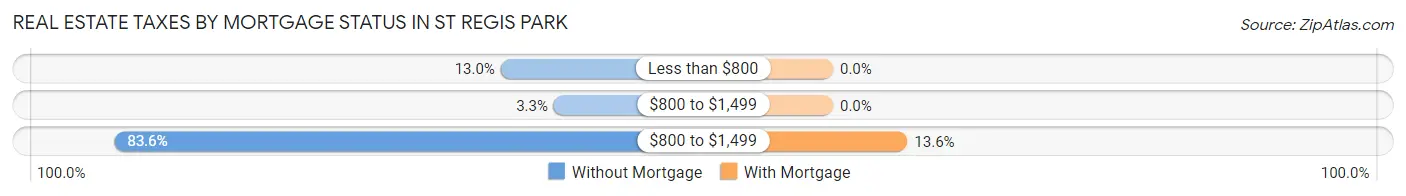
| Property Taxes | Without Mortgage | With Mortgage |
| Less than $800 | 39 (13.0%) | 0 (0.0%) |
| $800 to $1,499 | 10 (3.3%) | 0 (0.0%) |
| $800 to $1,499 | 250 (83.6%) | 41 (13.6%) |
| Total | 299 (100.0%) | 302 (100.0%) |
Health & Disability in St Regis Park
Health Insurance Coverage by Age in St Regis Park
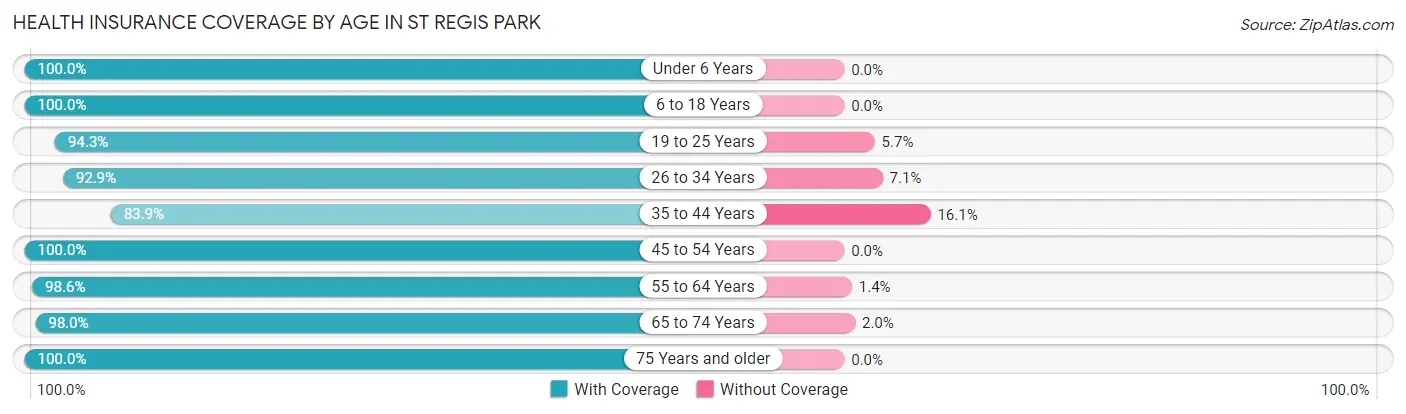
| Age Bracket | With Coverage | Without Coverage |
| Under 6 Years | 121 (100.0%) | 0 (0.0%) |
| 6 to 18 Years | 265 (100.0%) | 0 (0.0%) |
| 19 to 25 Years | 50 (94.3%) | 3 (5.7%) |
| 26 to 34 Years | 182 (92.9%) | 14 (7.1%) |
| 35 to 44 Years | 188 (83.9%) | 36 (16.1%) |
| 45 to 54 Years | 222 (100.0%) | 0 (0.0%) |
| 55 to 64 Years | 280 (98.6%) | 4 (1.4%) |
| 65 to 74 Years | 196 (98.0%) | 4 (2.0%) |
| 75 Years and older | 103 (100.0%) | 0 (0.0%) |
| Total | 1,607 (96.3%) | 61 (3.7%) |
Health Insurance Coverage by Citizenship Status in St Regis Park
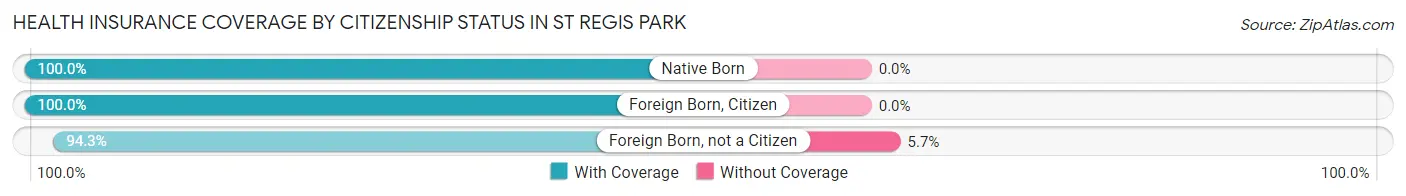
| Citizenship Status | With Coverage | Without Coverage |
| Native Born | 121 (100.0%) | 0 (0.0%) |
| Foreign Born, Citizen | 265 (100.0%) | 0 (0.0%) |
| Foreign Born, not a Citizen | 50 (94.3%) | 3 (5.7%) |
Health Insurance Coverage by Household Income in St Regis Park
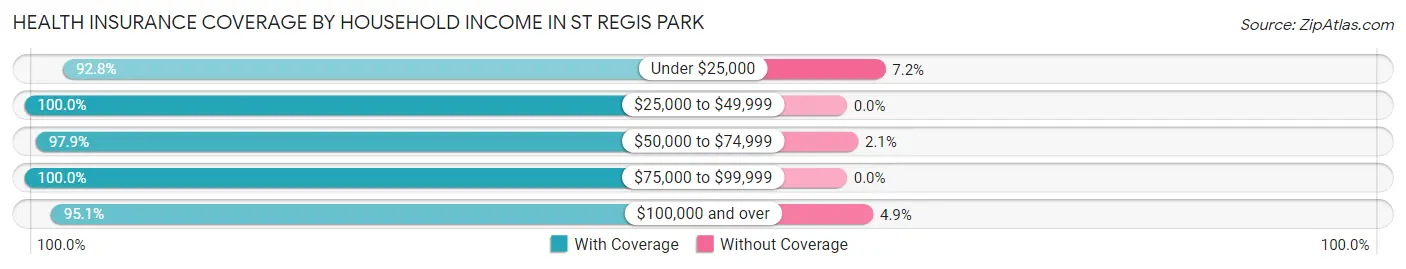
| Household Income | With Coverage | Without Coverage |
| Under $25,000 | 90 (92.8%) | 7 (7.2%) |
| $25,000 to $49,999 | 167 (100.0%) | 0 (0.0%) |
| $50,000 to $74,999 | 186 (97.9%) | 4 (2.1%) |
| $75,000 to $99,999 | 197 (100.0%) | 0 (0.0%) |
| $100,000 and over | 967 (95.1%) | 50 (4.9%) |
Public vs Private Health Insurance Coverage by Age in St Regis Park
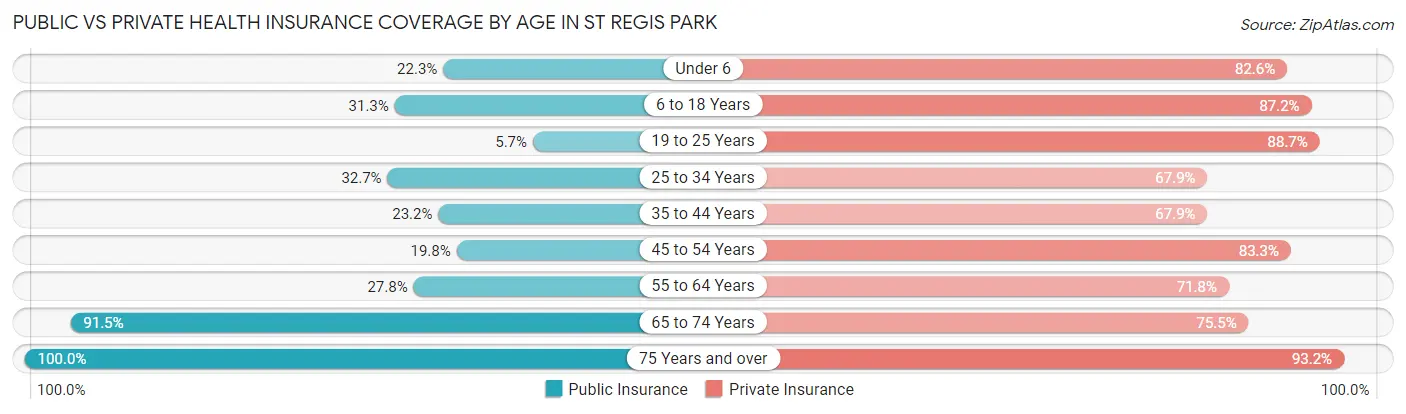
| Age Bracket | Public Insurance | Private Insurance |
| Under 6 | 27 (22.3%) | 100 (82.6%) |
| 6 to 18 Years | 83 (31.3%) | 231 (87.2%) |
| 19 to 25 Years | 3 (5.7%) | 47 (88.7%) |
| 25 to 34 Years | 64 (32.7%) | 133 (67.9%) |
| 35 to 44 Years | 52 (23.2%) | 152 (67.9%) |
| 45 to 54 Years | 44 (19.8%) | 185 (83.3%) |
| 55 to 64 Years | 79 (27.8%) | 204 (71.8%) |
| 65 to 74 Years | 183 (91.5%) | 151 (75.5%) |
| 75 Years and over | 103 (100.0%) | 96 (93.2%) |
| Total | 638 (38.3%) | 1,299 (77.9%) |
Disability Status by Sex by Age in St Regis Park
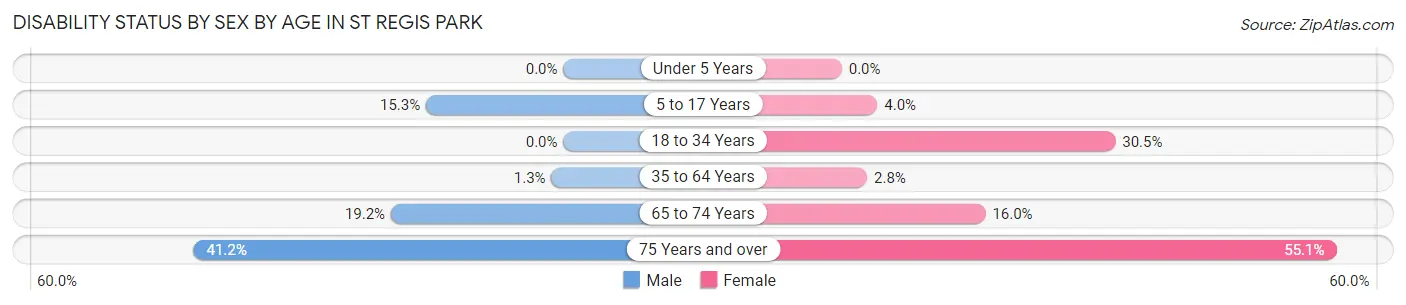
| Age Bracket | Male | Female |
| Under 5 Years | 0 (0.0%) | 0 (0.0%) |
| 5 to 17 Years | 24 (15.3%) | 4 (4.0%) |
| 18 to 34 Years | 0 (0.0%) | 46 (30.5%) |
| 35 to 64 Years | 5 (1.3%) | 10 (2.8%) |
| 65 to 74 Years | 24 (19.2%) | 12 (16.0%) |
| 75 Years and over | 14 (41.2%) | 38 (55.1%) |
Disability Class by Sex by Age in St Regis Park
Disability Class: Hearing Difficulty
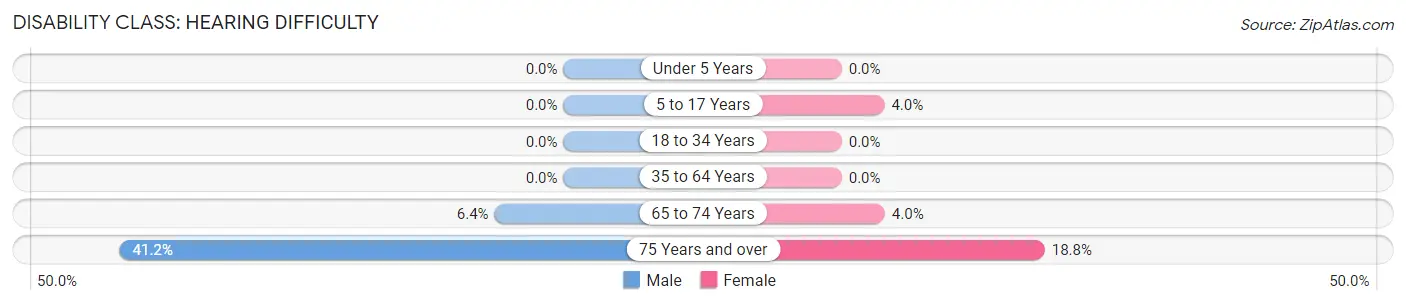
| Age Bracket | Male | Female |
| Under 5 Years | 0 (0.0%) | 0 (0.0%) |
| 5 to 17 Years | 0 (0.0%) | 4 (4.0%) |
| 18 to 34 Years | 0 (0.0%) | 0 (0.0%) |
| 35 to 64 Years | 0 (0.0%) | 0 (0.0%) |
| 65 to 74 Years | 8 (6.4%) | 3 (4.0%) |
| 75 Years and over | 14 (41.2%) | 13 (18.8%) |
Disability Class: Vision Difficulty
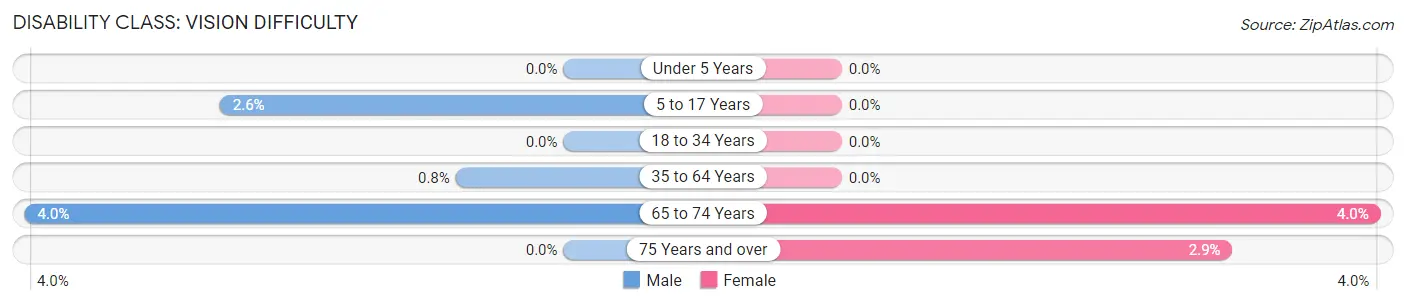
| Age Bracket | Male | Female |
| Under 5 Years | 0 (0.0%) | 0 (0.0%) |
| 5 to 17 Years | 4 (2.5%) | 0 (0.0%) |
| 18 to 34 Years | 0 (0.0%) | 0 (0.0%) |
| 35 to 64 Years | 3 (0.8%) | 0 (0.0%) |
| 65 to 74 Years | 5 (4.0%) | 3 (4.0%) |
| 75 Years and over | 0 (0.0%) | 2 (2.9%) |
Disability Class: Cognitive Difficulty
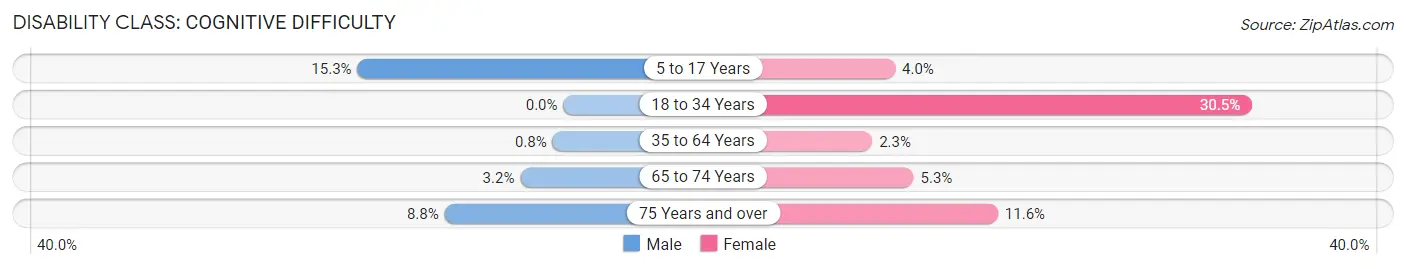
| Age Bracket | Male | Female |
| 5 to 17 Years | 24 (15.3%) | 4 (4.0%) |
| 18 to 34 Years | 0 (0.0%) | 46 (30.5%) |
| 35 to 64 Years | 3 (0.8%) | 8 (2.3%) |
| 65 to 74 Years | 4 (3.2%) | 4 (5.3%) |
| 75 Years and over | 3 (8.8%) | 8 (11.6%) |
Disability Class: Ambulatory Difficulty
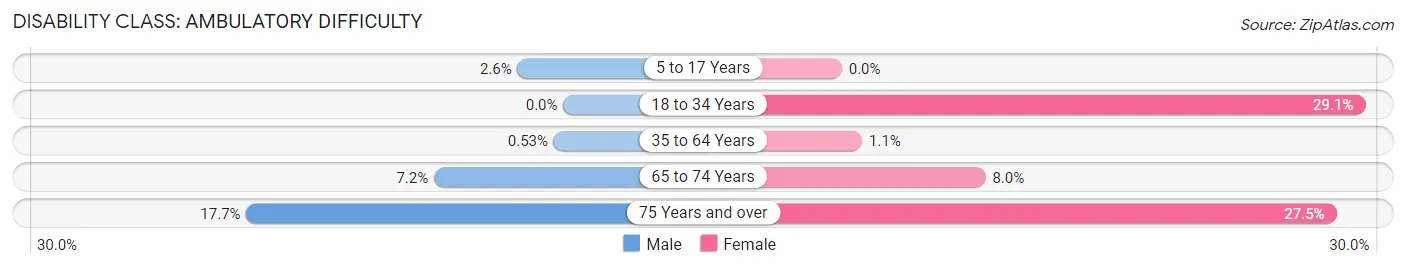
| Age Bracket | Male | Female |
| 5 to 17 Years | 4 (2.5%) | 0 (0.0%) |
| 18 to 34 Years | 0 (0.0%) | 44 (29.1%) |
| 35 to 64 Years | 2 (0.5%) | 4 (1.1%) |
| 65 to 74 Years | 9 (7.2%) | 6 (8.0%) |
| 75 Years and over | 6 (17.6%) | 19 (27.5%) |
Disability Class: Self-Care Difficulty
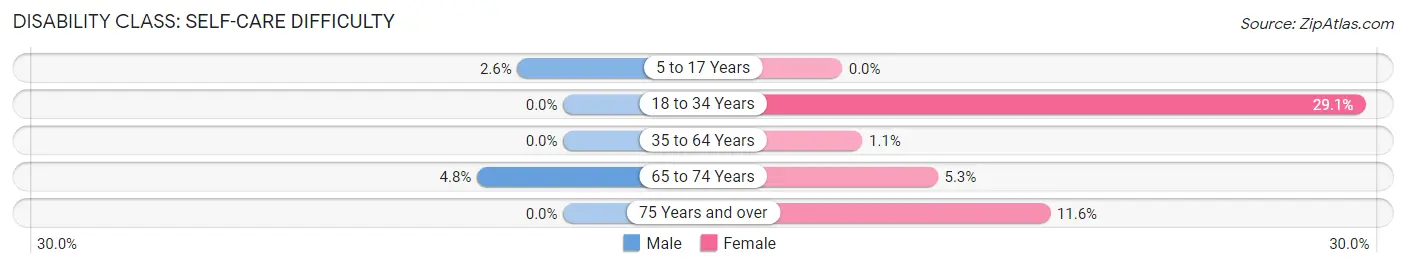
| Age Bracket | Male | Female |
| 5 to 17 Years | 4 (2.5%) | 0 (0.0%) |
| 18 to 34 Years | 0 (0.0%) | 44 (29.1%) |
| 35 to 64 Years | 0 (0.0%) | 4 (1.1%) |
| 65 to 74 Years | 6 (4.8%) | 4 (5.3%) |
| 75 Years and over | 0 (0.0%) | 8 (11.6%) |
Technology Access in St Regis Park
Computing Device Access in St Regis Park
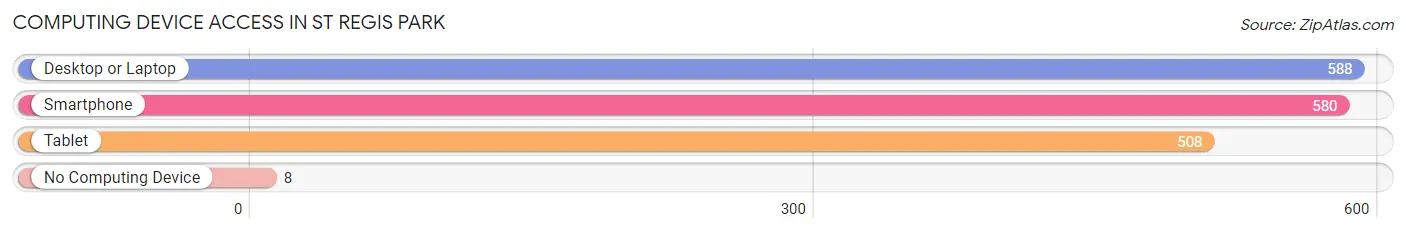
| Device Type | # Households | % Households |
| Desktop or Laptop | 588 | 92.6% |
| Smartphone | 580 | 91.3% |
| Tablet | 508 | 80.0% |
| No Computing Device | 8 | 1.3% |
| Total | 635 | 100.0% |
Internet Access in St Regis Park
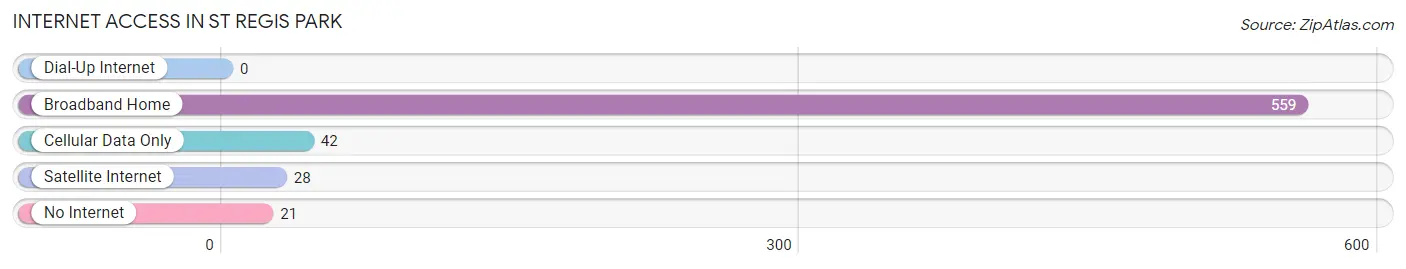
| Internet Type | # Households | % Households |
| Dial-Up Internet | 0 | 0.0% |
| Broadband Home | 559 | 88.0% |
| Cellular Data Only | 42 | 6.6% |
| Satellite Internet | 28 | 4.4% |
| No Internet | 21 | 3.3% |
| Total | 635 | 100.0% |
St Regis Park Summary
St. Regis Park is a small city located in Jefferson County, Kentucky. It is situated in the eastern part of the state, just south of Louisville. The city has a population of approximately 2,000 people and is part of the Louisville metropolitan area.
History
St. Regis Park was founded in the early 1900s by a group of Catholic nuns from the Sisters of St. Joseph of Carondelet. The nuns purchased a large tract of land in the area and established a convent and school. The school was named St. Regis Academy and was open to both boys and girls. The school operated until the late 1960s when it was closed due to declining enrollment.
The city was incorporated in the late 1950s and has since grown to become a small, but vibrant community. The city is home to a variety of businesses, including a grocery store, a pharmacy, and several restaurants.
Geography
St. Regis Park is located in the eastern part of Jefferson County, Kentucky. It is situated just south of Louisville and is part of the Louisville metropolitan area. The city is bordered by the cities of Middletown, Lyndon, and Anchorage. The city is located in a hilly area and is surrounded by wooded areas.
The city has a total area of 1.2 square miles, all of which is land. The city has a humid subtropical climate, with hot, humid summers and mild winters.
Economy
The economy of St. Regis Park is largely based on the service industry. The city is home to a variety of businesses, including a grocery store, a pharmacy, and several restaurants. The city also has a number of small businesses, including a hardware store, a florist, and a pet store.
The city is also home to a number of manufacturing companies, including a plastics manufacturer and a metal fabrication company. The city is also home to a number of medical facilities, including a hospital and several medical offices.
Demographics
As of the 2010 census, the population of St. Regis Park was 2,000. The racial makeup of the city was 94.2% White, 2.2% African American, 0.7% Asian, 0.3% Native American, and 2.6% from other races. The median household income was $45,000, and the median family income was $50,000.
The city has a large population of seniors, with nearly 20% of the population over the age of 65. The city also has a large population of children, with nearly 30% of the population under the age of 18. The city has a low unemployment rate, with only 4.2% of the population unemployed.
Common Questions
What is Per Capita Income in St Regis Park?
Per Capita income in St Regis Park is $44,705.
What is the Median Family Income in St Regis Park?
Median Family Income in St Regis Park is $101,379.
What is the Median Household income in St Regis Park?
Median Household Income in St Regis Park is $94,803.
What is Income or Wage Gap in St Regis Park?
Income or Wage Gap in St Regis Park is 39.6%.
Women in St Regis Park earn 60.4 cents for every dollar earned by a man.
What is Inequality or Gini Index in St Regis Park?
Inequality or Gini Index in St Regis Park is 0.39.
What is the Total Population of St Regis Park?
Total Population of St Regis Park is 1,671.
What is the Total Male Population of St Regis Park?
Total Male Population of St Regis Park is 871.
What is the Total Female Population of St Regis Park?
Total Female Population of St Regis Park is 800.
What is the Ratio of Males per 100 Females in St Regis Park?
There are 108.88 Males per 100 Females in St Regis Park.
What is the Ratio of Females per 100 Males in St Regis Park?
There are 91.85 Females per 100 Males in St Regis Park.
What is the Median Population Age in St Regis Park?
Median Population Age in St Regis Park is 43.6 Years.
What is the Average Family Size in St Regis Park
Average Family Size in St Regis Park is 3.0 People.
What is the Average Household Size in St Regis Park
Average Household Size in St Regis Park is 2.6 People.
How Large is the Labor Force in St Regis Park?
There are 832 People in the Labor Forcein in St Regis Park.
What is the Percentage of People in the Labor Force in St Regis Park?
62.3% of People are in the Labor Force in St Regis Park.
What is the Unemployment Rate in St Regis Park?
Unemployment Rate in St Regis Park is 2.1%.