Princeton, KY Map & Demographics
Princeton Map
Princeton Overview
$29,853
PER CAPITA INCOME
$54,746
AVG FAMILY INCOME
$46,317
AVG HOUSEHOLD INCOME
32.1%
WAGE / INCOME GAP [ % ]
67.9¢/ $1
WAGE / INCOME GAP [ $ ]
0.51
INEQUALITY / GINI INDEX
6,248
TOTAL POPULATION
3,018
MALE POPULATION
3,230
FEMALE POPULATION
93.44
MALES / 100 FEMALES
107.02
FEMALES / 100 MALES
40.4
MEDIAN AGE
3.0
AVG FAMILY SIZE
2.5
AVG HOUSEHOLD SIZE
2,601
LABOR FORCE [ PEOPLE ]
54.1%
PERCENT IN LABOR FORCE
3.8%
UNEMPLOYMENT RATE
Princeton Zip Codes
Princeton Area Codes
Income in Princeton
Income Overview in Princeton
Per Capita Income in Princeton is $29,853, while median incomes of families and households are $54,746 and $46,317 respectively.
| Characteristic | Number | Measure |
| Per Capita Income | 6,248 | $29,853 |
| Median Family Income | 1,572 | $54,746 |
| Mean Family Income | 1,572 | $75,323 |
| Median Household Income | 2,487 | $46,317 |
| Mean Household Income | 2,487 | $67,925 |
| Income Deficit | 1,572 | $0 |
| Wage / Income Gap (%) | 6,248 | 32.13% |
| Wage / Income Gap ($) | 6,248 | 67.87¢ per $1 |
| Gini / Inequality Index | 6,248 | 0.51 |
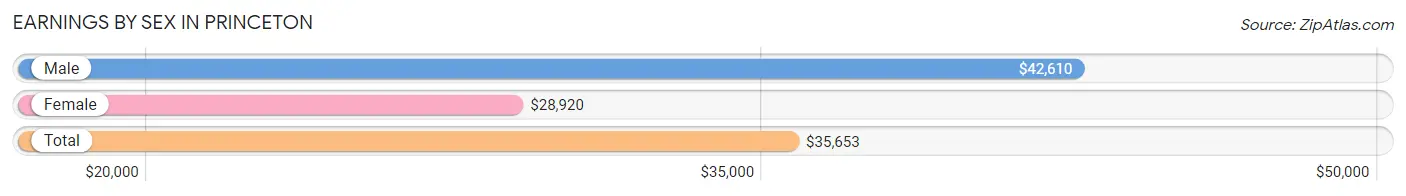
Earnings by Sex in Princeton
Average Earnings in Princeton are $35,653, $42,610 for men and $28,920 for women, a difference of 32.1%.
| Sex | Number | Average Earnings |
| Male | 1,326 (49.3%) | $42,610 |
| Female | 1,363 (50.7%) | $28,920 |
| Total | 2,689 (100.0%) | $35,653 |
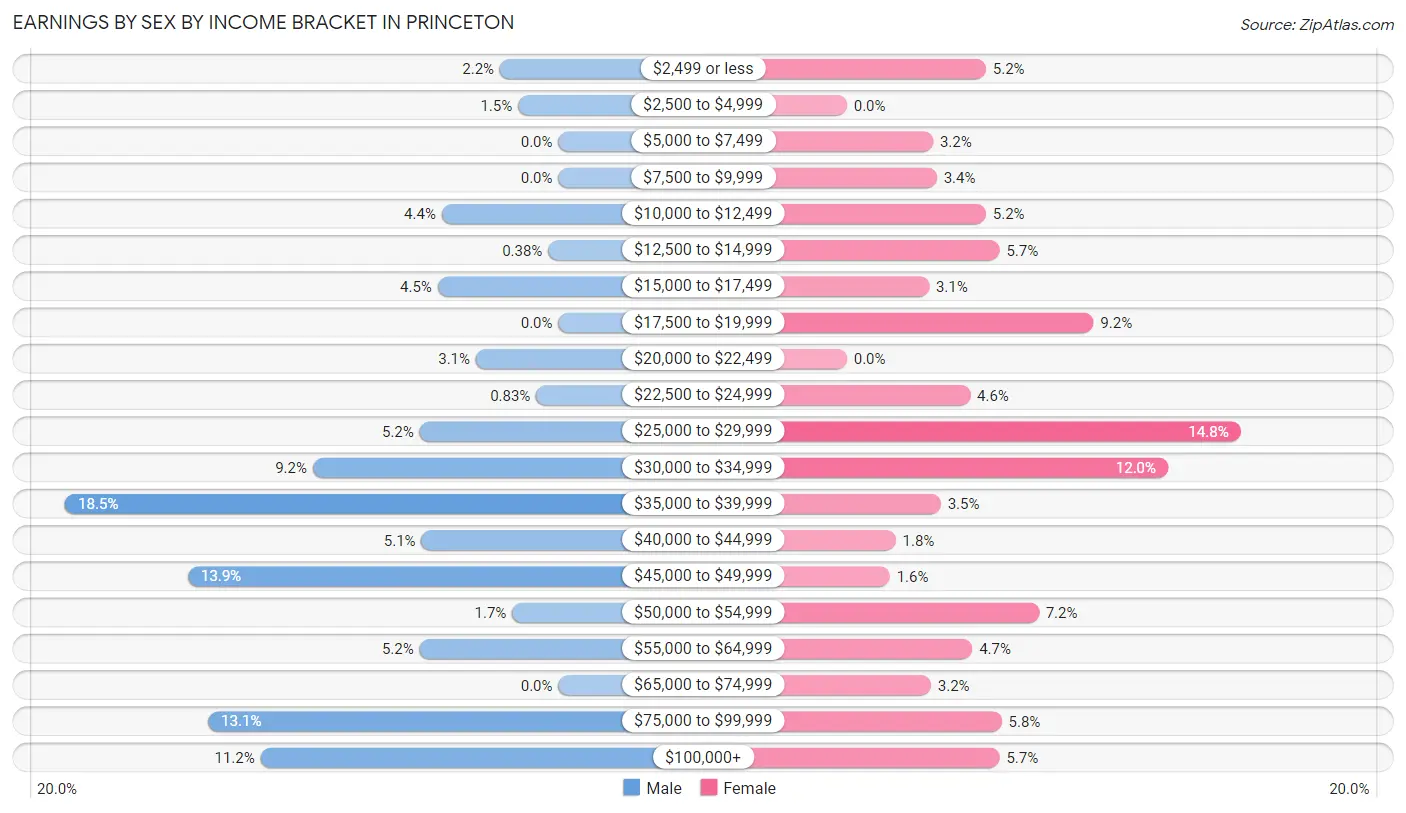
Earnings by Sex by Income Bracket in Princeton
The most common earnings brackets in Princeton are $35,000 to $39,999 for men (245 | 18.5%) and $25,000 to $29,999 for women (201 | 14.7%).
| Income | Male | Female |
| $2,499 or less | 29 (2.2%) | 71 (5.2%) |
| $2,500 to $4,999 | 20 (1.5%) | 0 (0.0%) |
| $5,000 to $7,499 | 0 (0.0%) | 44 (3.2%) |
| $7,500 to $9,999 | 0 (0.0%) | 46 (3.4%) |
| $10,000 to $12,499 | 58 (4.4%) | 71 (5.2%) |
| $12,500 to $14,999 | 5 (0.4%) | 78 (5.7%) |
| $15,000 to $17,499 | 60 (4.5%) | 42 (3.1%) |
| $17,500 to $19,999 | 0 (0.0%) | 126 (9.2%) |
| $20,000 to $22,499 | 41 (3.1%) | 0 (0.0%) |
| $22,500 to $24,999 | 11 (0.8%) | 63 (4.6%) |
| $25,000 to $29,999 | 69 (5.2%) | 201 (14.7%) |
| $30,000 to $34,999 | 122 (9.2%) | 164 (12.0%) |
| $35,000 to $39,999 | 245 (18.5%) | 48 (3.5%) |
| $40,000 to $44,999 | 68 (5.1%) | 25 (1.8%) |
| $45,000 to $49,999 | 184 (13.9%) | 22 (1.6%) |
| $50,000 to $54,999 | 23 (1.7%) | 98 (7.2%) |
| $55,000 to $64,999 | 69 (5.2%) | 64 (4.7%) |
| $65,000 to $74,999 | 0 (0.0%) | 43 (3.2%) |
| $75,000 to $99,999 | 174 (13.1%) | 79 (5.8%) |
| $100,000+ | 148 (11.2%) | 78 (5.7%) |
| Total | 1,326 (100.0%) | 1,363 (100.0%) |
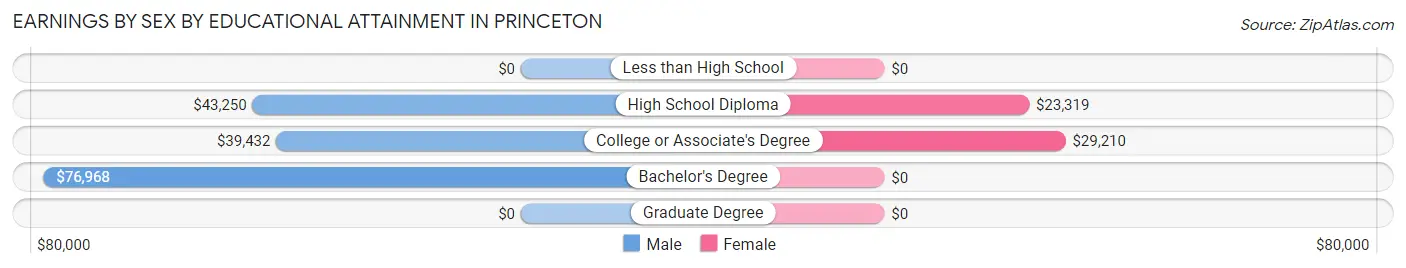
Earnings by Sex by Educational Attainment in Princeton
Average earnings in Princeton are $45,027 for men and $31,045 for women, a difference of 31.0%. Men with an educational attainment of bachelor's degree enjoy the highest average annual earnings of $76,968, while those with college or associate's degree education earn the least with $39,432. Women with an educational attainment of college or associate's degree earn the most with the average annual earnings of $29,210, while those with high school diploma education have the smallest earnings of $23,319.
| Educational Attainment | Male Income | Female Income |
| Less than High School | - | - |
| High School Diploma | $43,250 | $23,319 |
| College or Associate's Degree | $39,432 | $29,210 |
| Bachelor's Degree | $76,968 | $0 |
| Graduate Degree | - | - |
| Total | $45,027 | $31,045 |
Family Income in Princeton
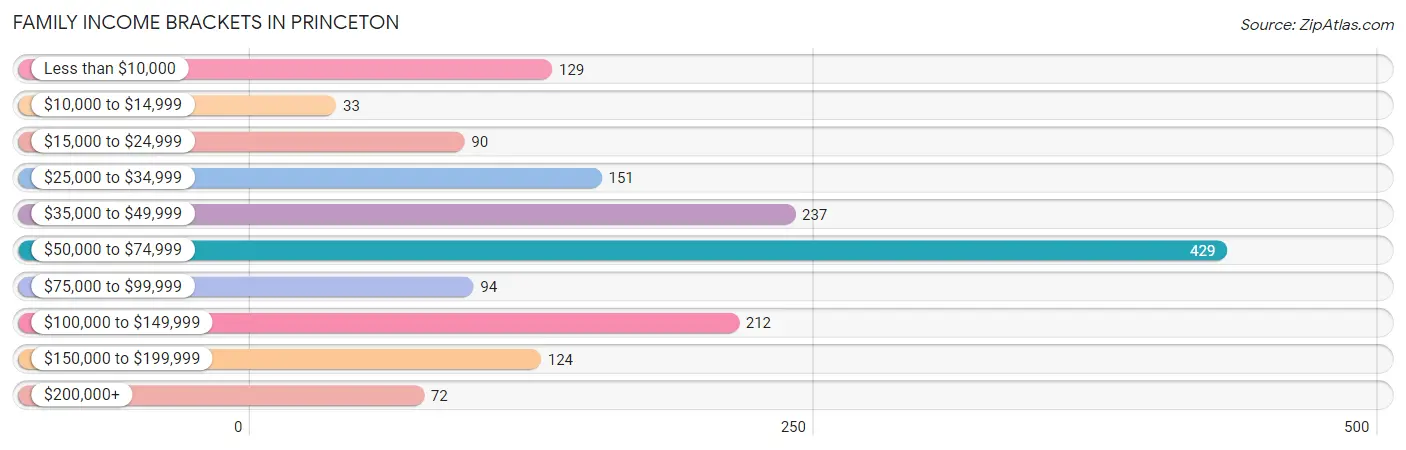
Family Income Brackets in Princeton
According to the Princeton family income data, there are 429 families falling into the $50,000 to $74,999 income range, which is the most common income bracket and makes up 27.3% of all families. Conversely, the $10,000 to $14,999 income bracket is the least frequent group with only 33 families (2.1%) belonging to this category.
| Income Bracket | # Families | % Families |
| Less than $10,000 | 129 | 8.2% |
| $10,000 to $14,999 | 33 | 2.1% |
| $15,000 to $24,999 | 90 | 5.7% |
| $25,000 to $34,999 | 151 | 9.6% |
| $35,000 to $49,999 | 237 | 15.1% |
| $50,000 to $74,999 | 429 | 27.3% |
| $75,000 to $99,999 | 94 | 6.0% |
| $100,000 to $149,999 | 212 | 13.5% |
| $150,000 to $199,999 | 124 | 7.9% |
| $200,000+ | 72 | 4.6% |
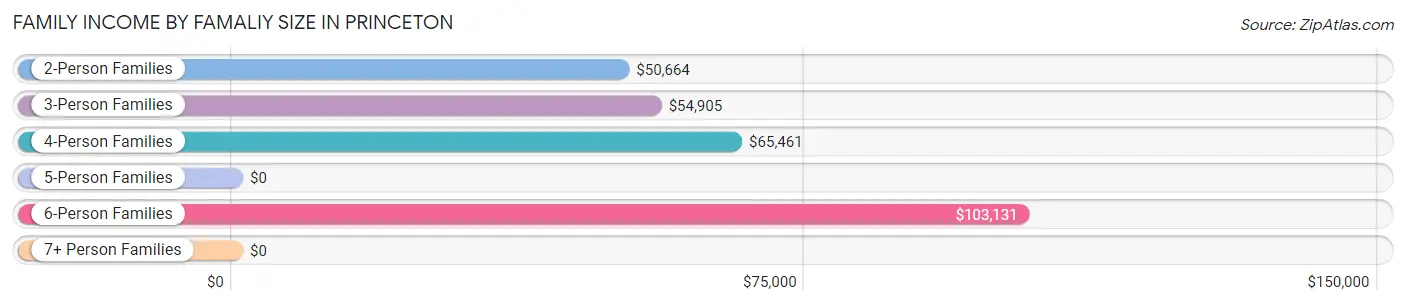
Family Income by Famaliy Size in Princeton
6-person families (145 | 9.2%) account for the highest median family income in Princeton with $103,131 per family, while 2-person families (755 | 48.0%) have the highest median income of $25,332 per family member.
| Income Bracket | # Families | Median Income |
| 2-Person Families | 755 (48.0%) | $50,664 |
| 3-Person Families | 465 (29.6%) | $54,905 |
| 4-Person Families | 189 (12.0%) | $65,461 |
| 5-Person Families | 18 (1.1%) | $0 |
| 6-Person Families | 145 (9.2%) | $103,131 |
| 7+ Person Families | 0 (0.0%) | $0 |
| Total | 1,572 (100.0%) | $54,746 |
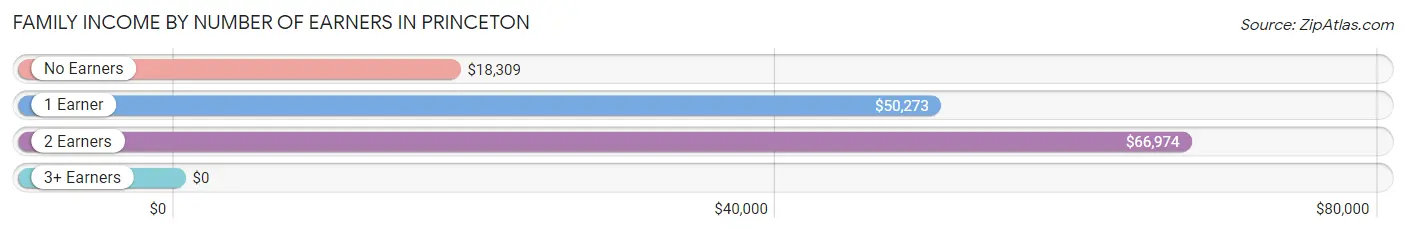
Family Income by Number of Earners in Princeton
| Number of Earners | # Families | Median Income |
| No Earners | 387 (24.6%) | $18,309 |
| 1 Earner | 433 (27.5%) | $50,273 |
| 2 Earners | 714 (45.4%) | $66,974 |
| 3+ Earners | 38 (2.4%) | $0 |
| Total | 1,572 (100.0%) | $54,746 |
Household Income in Princeton
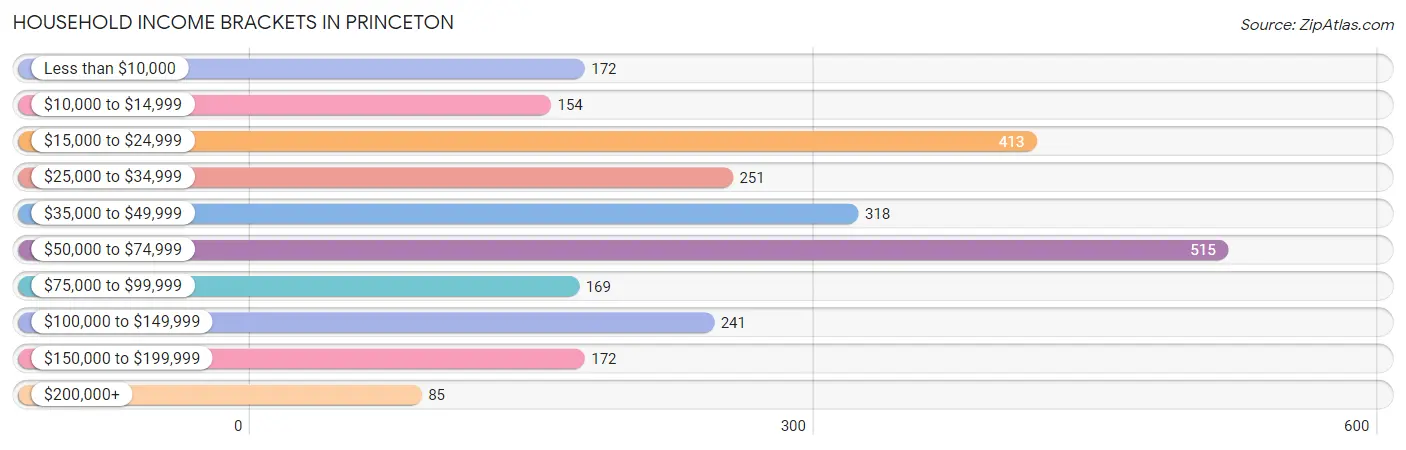
Household Income Brackets in Princeton
With 515 households falling in the category, the $50,000 to $74,999 income range is the most frequent in Princeton, accounting for 20.7% of all households. In contrast, only 85 households (3.4%) fall into the $200,000+ income bracket, making it the least populous group.
| Income Bracket | # Households | % Households |
| Less than $10,000 | 172 | 6.9% |
| $10,000 to $14,999 | 154 | 6.2% |
| $15,000 to $24,999 | 413 | 16.6% |
| $25,000 to $34,999 | 251 | 10.1% |
| $35,000 to $49,999 | 318 | 12.8% |
| $50,000 to $74,999 | 515 | 20.7% |
| $75,000 to $99,999 | 169 | 6.8% |
| $100,000 to $149,999 | 241 | 9.7% |
| $150,000 to $199,999 | 172 | 6.9% |
| $200,000+ | 85 | 3.4% |
Household Income by Householder Age in Princeton
The median household income in Princeton is $46,317, with the highest median household income of $61,570 found in the 45 to 64 years age bracket for the primary householder. A total of 767 households (30.8%) fall into this category. Meanwhile, the 65+ years age bracket for the primary householder has the lowest median household income of $22,674, with 821 households (33.0%) in this group.
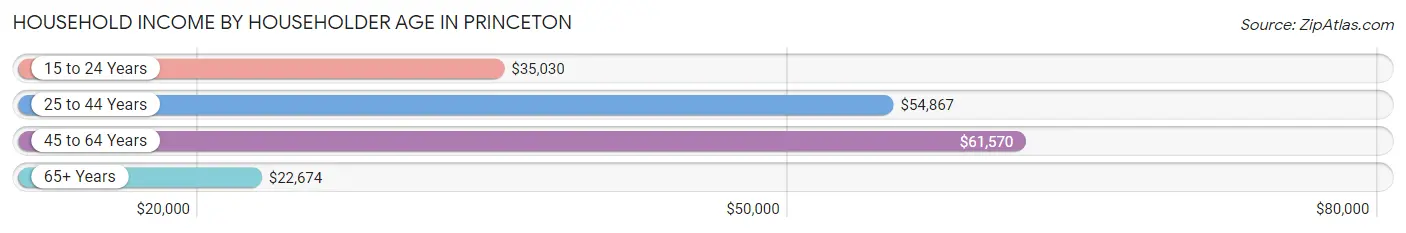
| Income Bracket | # Households | Median Income |
| 15 to 24 Years | 202 (8.1%) | $35,030 |
| 25 to 44 Years | 697 (28.0%) | $54,867 |
| 45 to 64 Years | 767 (30.8%) | $61,570 |
| 65+ Years | 821 (33.0%) | $22,674 |
| Total | 2,487 (100.0%) | $46,317 |
Poverty in Princeton
Income Below Poverty by Sex and Age in Princeton
With 11.9% poverty level for males and 19.2% for females among the residents of Princeton, 16 and 17 year old males and 15 year old females are the most vulnerable to poverty, with 44 males (49.4%) and 25 females (100.0%) in their respective age groups living below the poverty level.
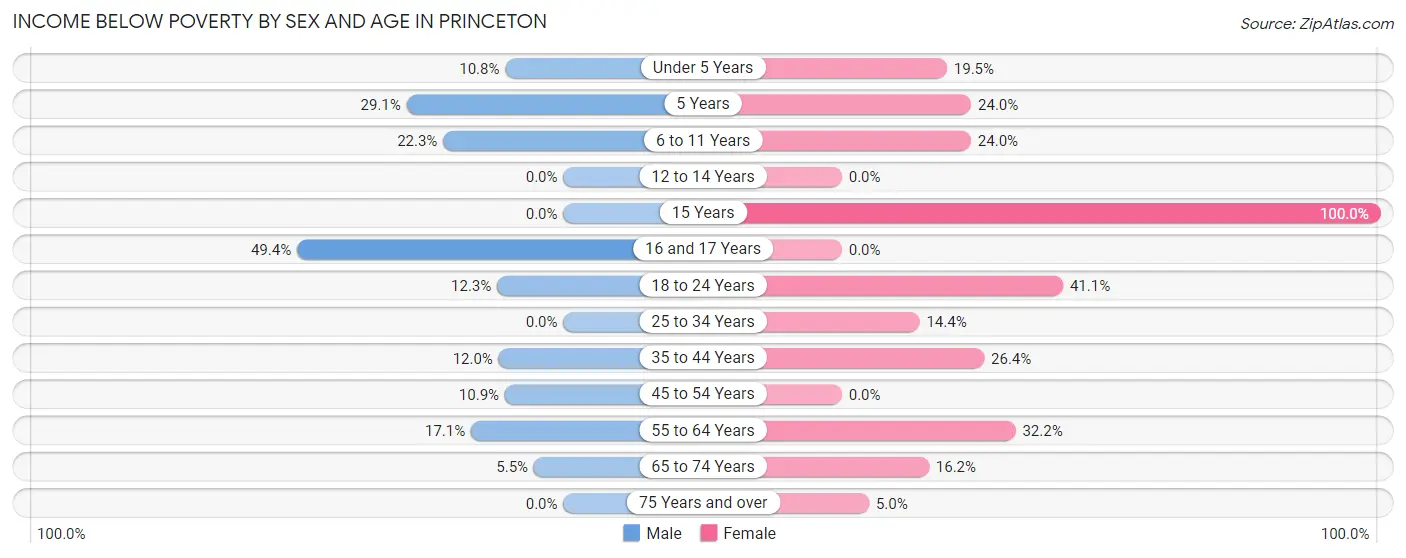
| Age Bracket | Male | Female |
| Under 5 Years | 29 (10.8%) | 39 (19.5%) |
| 5 Years | 16 (29.1%) | 12 (24.0%) |
| 6 to 11 Years | 60 (22.3%) | 29 (24.0%) |
| 12 to 14 Years | 0 (0.0%) | 0 (0.0%) |
| 15 Years | 0 (0.0%) | 25 (100.0%) |
| 16 and 17 Years | 44 (49.4%) | 0 (0.0%) |
| 18 to 24 Years | 38 (12.3%) | 124 (41.1%) |
| 25 to 34 Years | 0 (0.0%) | 61 (14.4%) |
| 35 to 44 Years | 36 (12.0%) | 102 (26.4%) |
| 45 to 54 Years | 60 (10.8%) | 0 (0.0%) |
| 55 to 64 Years | 56 (17.1%) | 128 (32.2%) |
| 65 to 74 Years | 13 (5.5%) | 64 (16.2%) |
| 75 Years and over | 0 (0.0%) | 21 (5.0%) |
| Total | 352 (11.9%) | 605 (19.2%) |
Income Above Poverty by Sex and Age in Princeton
According to the poverty statistics in Princeton, males aged 12 to 14 years and females aged 12 to 14 years are the age groups that are most secure financially, with 100.0% of males and 100.0% of females in these age groups living above the poverty line.
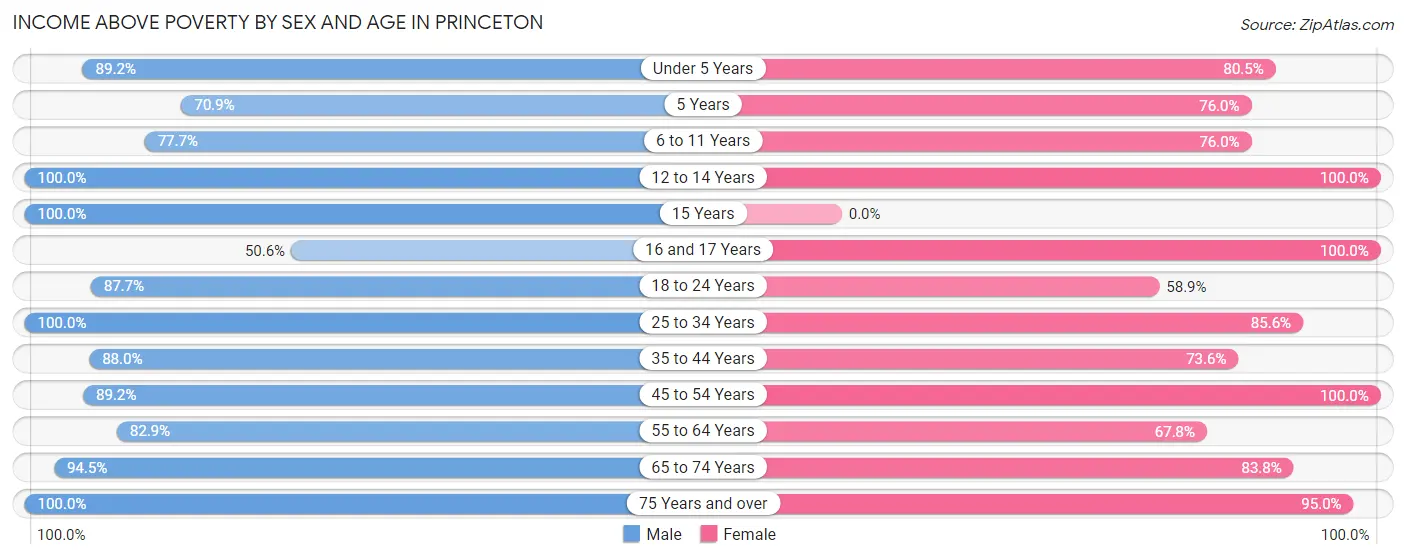
| Age Bracket | Male | Female |
| Under 5 Years | 240 (89.2%) | 161 (80.5%) |
| 5 Years | 39 (70.9%) | 38 (76.0%) |
| 6 to 11 Years | 209 (77.7%) | 92 (76.0%) |
| 12 to 14 Years | 157 (100.0%) | 220 (100.0%) |
| 15 Years | 74 (100.0%) | 0 (0.0%) |
| 16 and 17 Years | 45 (50.6%) | 14 (100.0%) |
| 18 to 24 Years | 271 (87.7%) | 178 (58.9%) |
| 25 to 34 Years | 188 (100.0%) | 362 (85.6%) |
| 35 to 44 Years | 264 (88.0%) | 284 (73.6%) |
| 45 to 54 Years | 493 (89.1%) | 205 (100.0%) |
| 55 to 64 Years | 271 (82.9%) | 269 (67.8%) |
| 65 to 74 Years | 225 (94.5%) | 332 (83.8%) |
| 75 Years and over | 141 (100.0%) | 396 (95.0%) |
| Total | 2,617 (88.1%) | 2,551 (80.8%) |
Income Below Poverty Among Married-Couple Families in Princeton
The poverty statistics for married-couple families in Princeton show that 8.5% or 78 of the total 918 families live below the poverty line. Families with 3 or 4 children have the highest poverty rate of 14.2%, comprising of 16 families. On the other hand, families with no children have the lowest poverty rate of 7.3%, which includes 33 families.
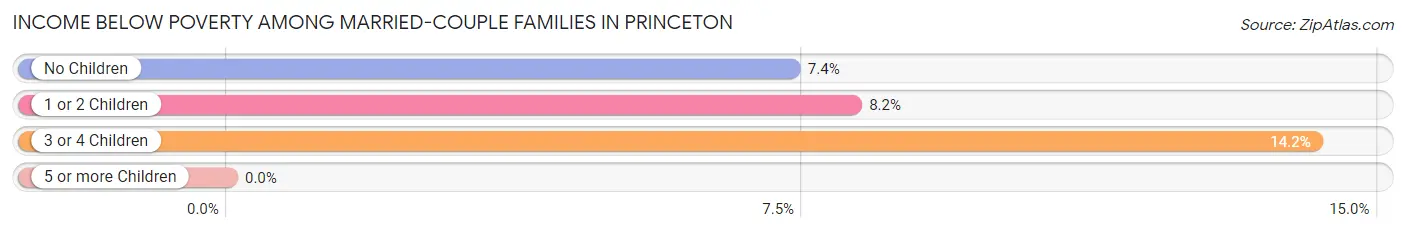
| Children | Above Poverty | Below Poverty |
| No Children | 416 (92.6%) | 33 (7.3%) |
| 1 or 2 Children | 327 (91.8%) | 29 (8.2%) |
| 3 or 4 Children | 97 (85.8%) | 16 (14.2%) |
| 5 or more Children | 0 (0.0%) | 0 (0.0%) |
| Total | 840 (91.5%) | 78 (8.5%) |
Income Below Poverty Among Single-Parent Households in Princeton
According to the poverty data in Princeton, 29.0% or 60 single-father households and 18.3% or 82 single-mother households are living below the poverty line. Among single-father households, those with 1 or 2 children have the highest poverty rate, with 47 households (31.1%) experiencing poverty. Likewise, among single-mother households, those with 5 or more children have the highest poverty rate, with 32 households (100.0%) falling below the poverty line.
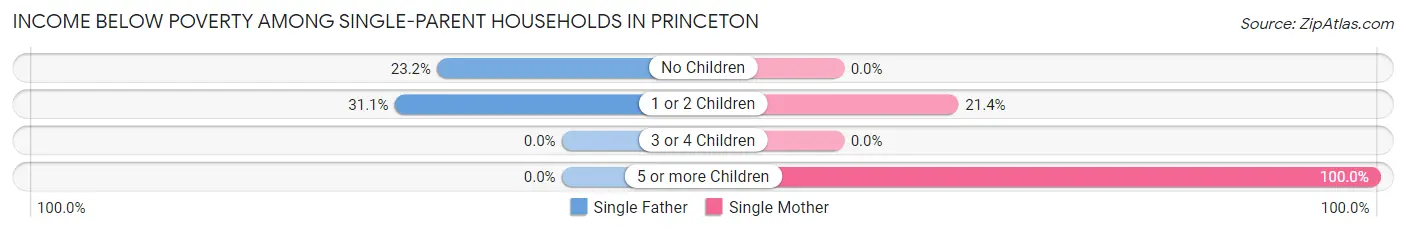
| Children | Single Father | Single Mother |
| No Children | 13 (23.2%) | 0 (0.0%) |
| 1 or 2 Children | 47 (31.1%) | 50 (21.4%) |
| 3 or 4 Children | 0 (0.0%) | 0 (0.0%) |
| 5 or more Children | 0 (0.0%) | 32 (100.0%) |
| Total | 60 (29.0%) | 82 (18.3%) |
Income Below Poverty Among Married-Couple vs Single-Parent Households in Princeton
The poverty data for Princeton shows that 78 of the married-couple family households (8.5%) and 142 of the single-parent households (21.7%) are living below the poverty level. Within the married-couple family households, those with 3 or 4 children have the highest poverty rate, with 16 households (14.2%) falling below the poverty line. Among the single-parent households, those with 5 or more children have the highest poverty rate, with 32 household (100.0%) living below poverty.
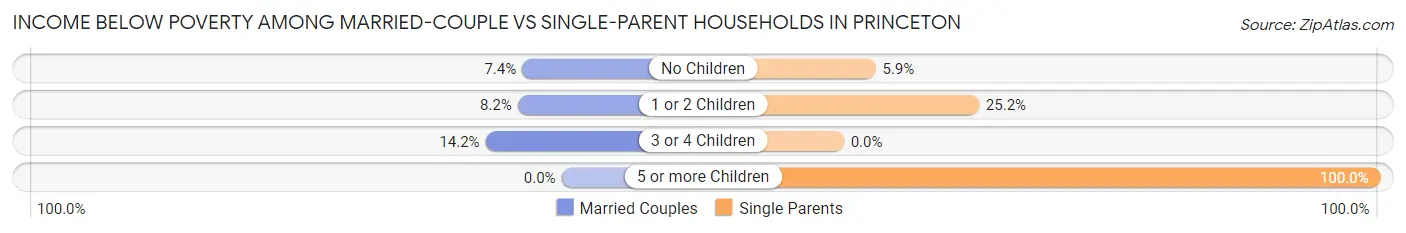
| Children | Married-Couple Families | Single-Parent Households |
| No Children | 33 (7.3%) | 13 (5.9%) |
| 1 or 2 Children | 29 (8.2%) | 97 (25.2%) |
| 3 or 4 Children | 16 (14.2%) | 0 (0.0%) |
| 5 or more Children | 0 (0.0%) | 32 (100.0%) |
| Total | 78 (8.5%) | 142 (21.7%) |
Race in Princeton
The most populous races in Princeton are White / Caucasian (5,218 | 83.5%), Black / African American (722 | 11.6%), and Two or more Races (261 | 4.2%).
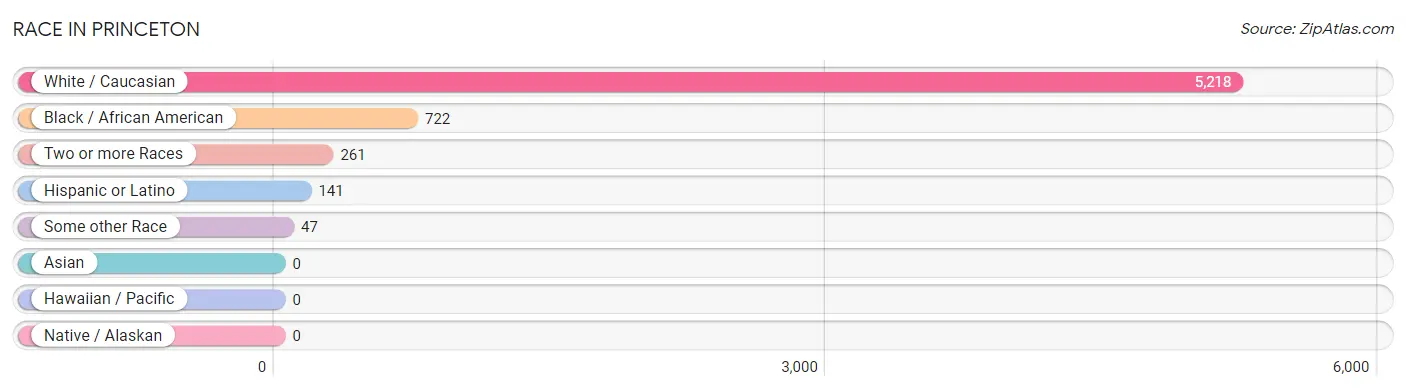
| Race | # Population | % Population |
| Asian | 0 | 0.0% |
| Black / African American | 722 | 11.6% |
| Hawaiian / Pacific | 0 | 0.0% |
| Hispanic or Latino | 141 | 2.3% |
| Native / Alaskan | 0 | 0.0% |
| White / Caucasian | 5,218 | 83.5% |
| Two or more Races | 261 | 4.2% |
| Some other Race | 47 | 0.7% |
| Total | 6,248 | 100.0% |
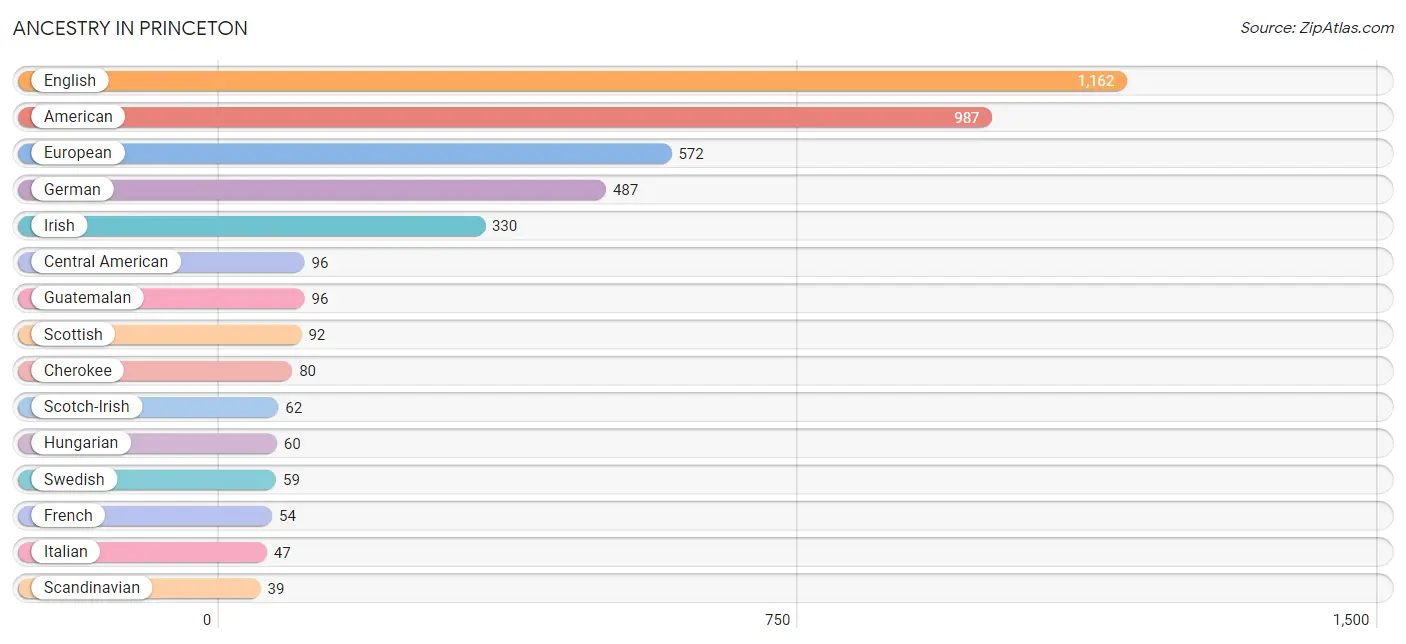
Ancestry in Princeton
The most populous ancestries reported in Princeton are English (1,162 | 18.6%), American (987 | 15.8%), European (572 | 9.1%), German (487 | 7.8%), and Irish (330 | 5.3%), together accounting for 56.6% of all Princeton residents.
| Ancestry | # Population | % Population |
| American | 987 | 15.8% |
| Blackfeet | 1 | 0.0% |
| Central American | 96 | 1.5% |
| Cherokee | 80 | 1.3% |
| Cuban | 10 | 0.2% |
| English | 1,162 | 18.6% |
| European | 572 | 9.1% |
| French | 54 | 0.9% |
| French Canadian | 24 | 0.4% |
| German | 487 | 7.8% |
| Guatemalan | 96 | 1.5% |
| Hungarian | 60 | 1.0% |
| Indian (Asian) | 35 | 0.6% |
| Irish | 330 | 5.3% |
| Italian | 47 | 0.7% |
| Korean | 18 | 0.3% |
| Mexican | 18 | 0.3% |
| Norwegian | 17 | 0.3% |
| Puerto Rican | 17 | 0.3% |
| Russian | 34 | 0.5% |
| Scandinavian | 39 | 0.6% |
| Scotch-Irish | 62 | 1.0% |
| Scottish | 92 | 1.5% |
| Swedish | 59 | 0.9% |
| Thai | 17 | 0.3% |
| Welsh | 9 | 0.1% | View All 26 Rows |
Immigrants in Princeton
The most numerous immigrant groups reported in Princeton came from Central America (96 | 1.5%), Latin America (96 | 1.5%), Mexico (96 | 1.5%), Europe (20 | 0.3%), and Eastern Europe (12 | 0.2%), together accounting for 5.1% of all Princeton residents.
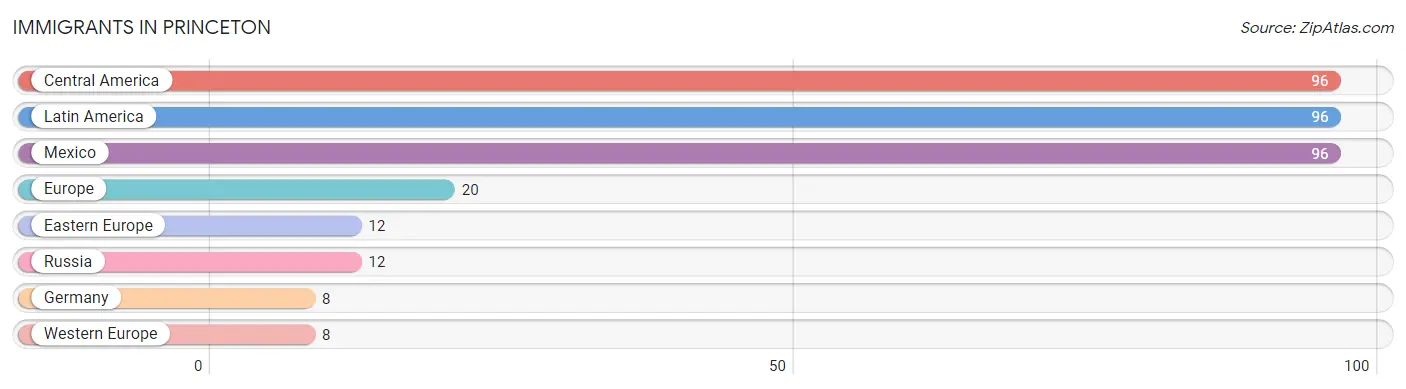
| Immigration Origin | # Population | % Population |
| Central America | 96 | 1.5% |
| Eastern Europe | 12 | 0.2% |
| Europe | 20 | 0.3% |
| Germany | 8 | 0.1% |
| Latin America | 96 | 1.5% |
| Mexico | 96 | 1.5% |
| Russia | 12 | 0.2% |
| Western Europe | 8 | 0.1% | View All 8 Rows |
Sex and Age in Princeton
Sex and Age in Princeton
The most populous age groups in Princeton are 15 to 19 Years (351 | 11.6%) for men and 85 Years and over (295 | 9.1%) for women.
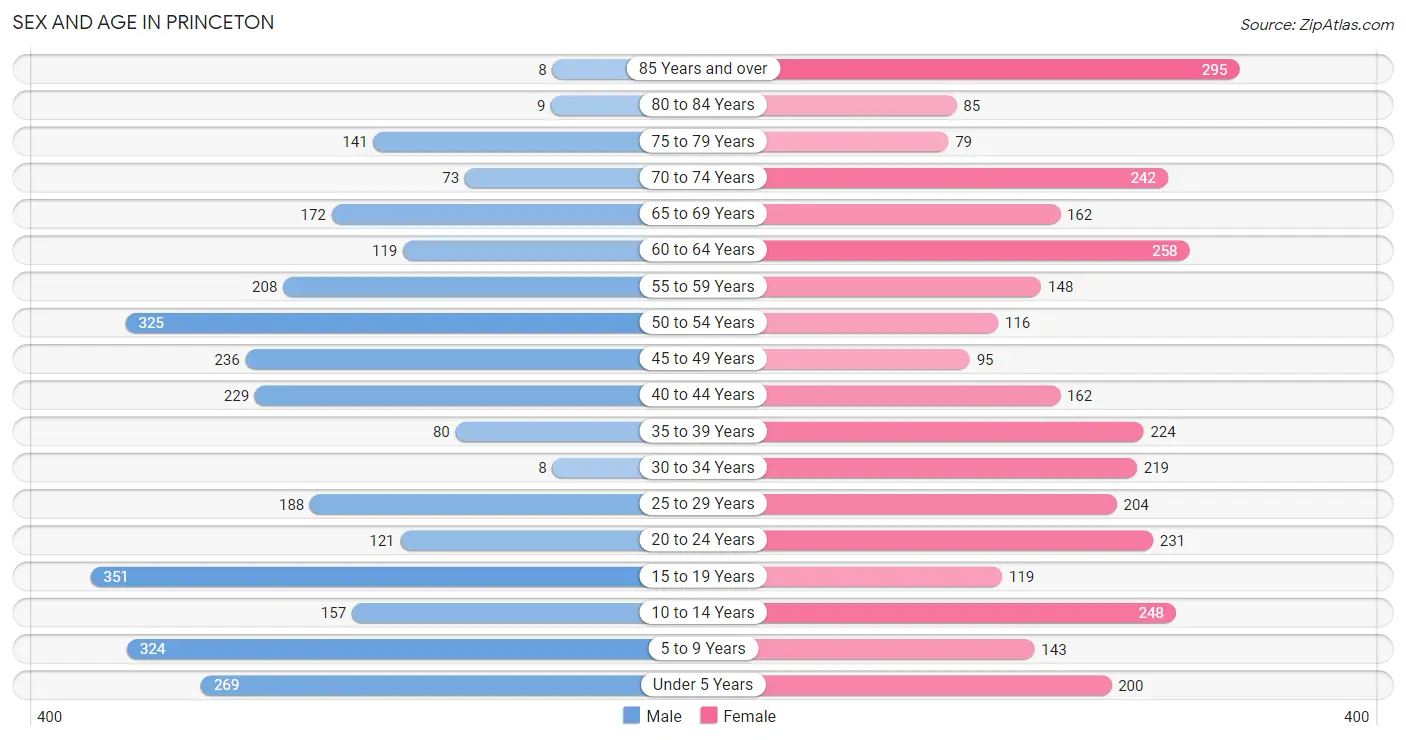
| Age Bracket | Male | Female |
| Under 5 Years | 269 (8.9%) | 200 (6.2%) |
| 5 to 9 Years | 324 (10.7%) | 143 (4.4%) |
| 10 to 14 Years | 157 (5.2%) | 248 (7.7%) |
| 15 to 19 Years | 351 (11.6%) | 119 (3.7%) |
| 20 to 24 Years | 121 (4.0%) | 231 (7.1%) |
| 25 to 29 Years | 188 (6.2%) | 204 (6.3%) |
| 30 to 34 Years | 8 (0.3%) | 219 (6.8%) |
| 35 to 39 Years | 80 (2.6%) | 224 (6.9%) |
| 40 to 44 Years | 229 (7.6%) | 162 (5.0%) |
| 45 to 49 Years | 236 (7.8%) | 95 (2.9%) |
| 50 to 54 Years | 325 (10.8%) | 116 (3.6%) |
| 55 to 59 Years | 208 (6.9%) | 148 (4.6%) |
| 60 to 64 Years | 119 (3.9%) | 258 (8.0%) |
| 65 to 69 Years | 172 (5.7%) | 162 (5.0%) |
| 70 to 74 Years | 73 (2.4%) | 242 (7.5%) |
| 75 to 79 Years | 141 (4.7%) | 79 (2.5%) |
| 80 to 84 Years | 9 (0.3%) | 85 (2.6%) |
| 85 Years and over | 8 (0.3%) | 295 (9.1%) |
| Total | 3,018 (100.0%) | 3,230 (100.0%) |
Families and Households in Princeton
Median Family Size in Princeton
The median family size in Princeton is 3.04 persons per family, with married-couple families (918 | 58.4%) accounting for the largest median family size of 3.22 persons per family. On the other hand, single male/father families (207 | 13.2%) represent the smallest median family size with 2.61 persons per family.
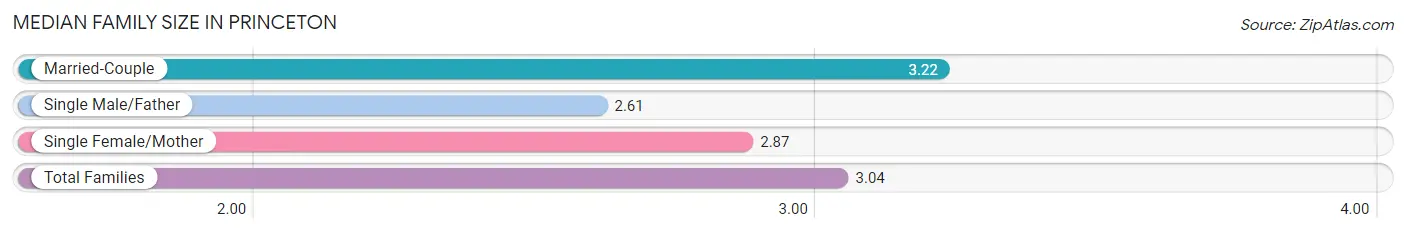
| Family Type | # Families | Family Size |
| Married-Couple | 918 (58.4%) | 3.22 |
| Single Male/Father | 207 (13.2%) | 2.61 |
| Single Female/Mother | 447 (28.4%) | 2.87 |
| Total Families | 1,572 (100.0%) | 3.04 |
Median Household Size in Princeton
The median household size in Princeton is 2.46 persons per household, with married-couple households (918 | 36.9%) accounting for the largest median household size of 3.22 persons per household. non-family households (915 | 36.8%) represent the smallest median household size with 1.33 persons per household.
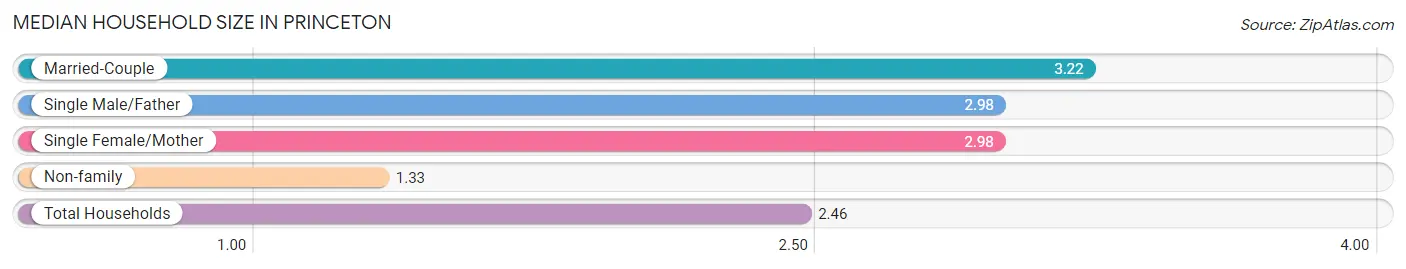
| Household Type | # Households | Household Size |
| Married-Couple | 918 (36.9%) | 3.22 |
| Single Male/Father | 207 (8.3%) | 2.98 |
| Single Female/Mother | 447 (18.0%) | 2.98 |
| Non-family | 915 (36.8%) | 1.33 |
| Total Households | 2,487 (100.0%) | 2.46 |
Household Size by Marriage Status in Princeton
Out of a total of 2,487 households in Princeton, 1,572 (63.2%) are family households, while 915 (36.8%) are nonfamily households. The most numerous type of family households are 2-person households, comprising 648, and the most common type of nonfamily households are 1-person households, comprising 734.
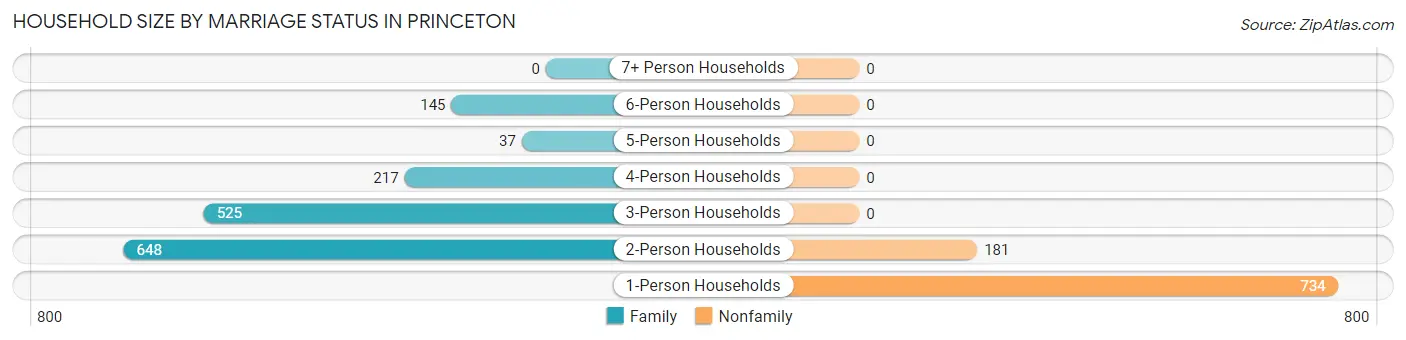
| Household Size | Family Households | Nonfamily Households |
| 1-Person Households | - | 734 (29.5%) |
| 2-Person Households | 648 (26.1%) | 181 (7.3%) |
| 3-Person Households | 525 (21.1%) | 0 (0.0%) |
| 4-Person Households | 217 (8.7%) | 0 (0.0%) |
| 5-Person Households | 37 (1.5%) | 0 (0.0%) |
| 6-Person Households | 145 (5.8%) | 0 (0.0%) |
| 7+ Person Households | 0 (0.0%) | 0 (0.0%) |
| Total | 1,572 (63.2%) | 915 (36.8%) |
Female Fertility in Princeton
Fertility by Age in Princeton
Average fertility rate in Princeton is 131.0 births per 1,000 women. Women in the age bracket of 20 to 34 years have the highest fertility rate with 258.0 births per 1,000 women. Women in the age bracket of 20 to 34 years acount for 100.0% of all women with births.
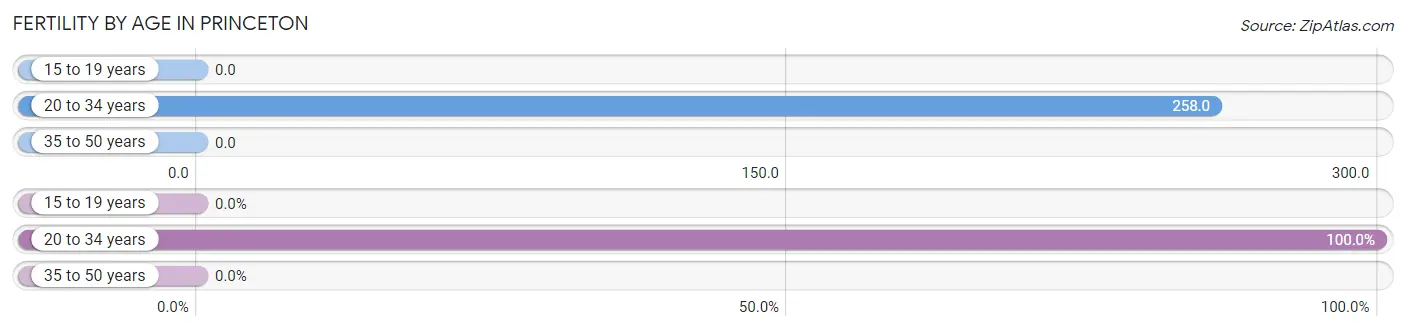
| Age Bracket | Women with Births | Births / 1,000 Women |
| 15 to 19 years | 0 (0.0%) | 0.0 |
| 20 to 34 years | 169 (100.0%) | 258.0 |
| 35 to 50 years | 0 (0.0%) | 0.0 |
| Total | 169 (100.0%) | 131.0 |
Fertility by Age by Marriage Status in Princeton
15.4% of women with births (169) in Princeton are married. The highest percentage of unmarried women with births falls into 20 to 34 years age bracket with 84.6% of them unmarried at the time of birth, while the lowest percentage of unmarried women with births belong to 20 to 34 years age bracket with 84.6% of them unmarried.
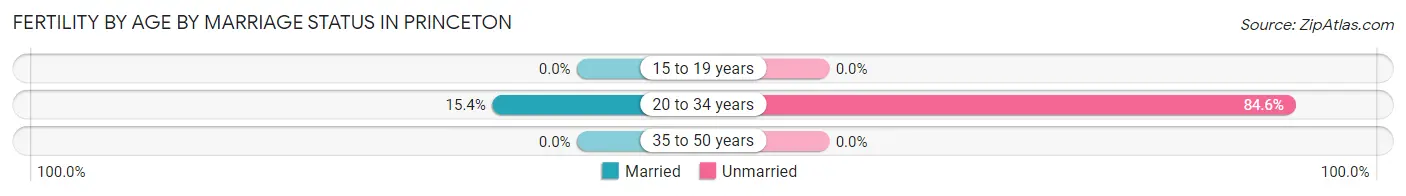
| Age Bracket | Married | Unmarried |
| 15 to 19 years | 0 (0.0%) | 0 (0.0%) |
| 20 to 34 years | 26 (15.4%) | 143 (84.6%) |
| 35 to 50 years | 0 (0.0%) | 0 (0.0%) |
| Total | 26 (15.4%) | 143 (84.6%) |
Fertility by Education in Princeton
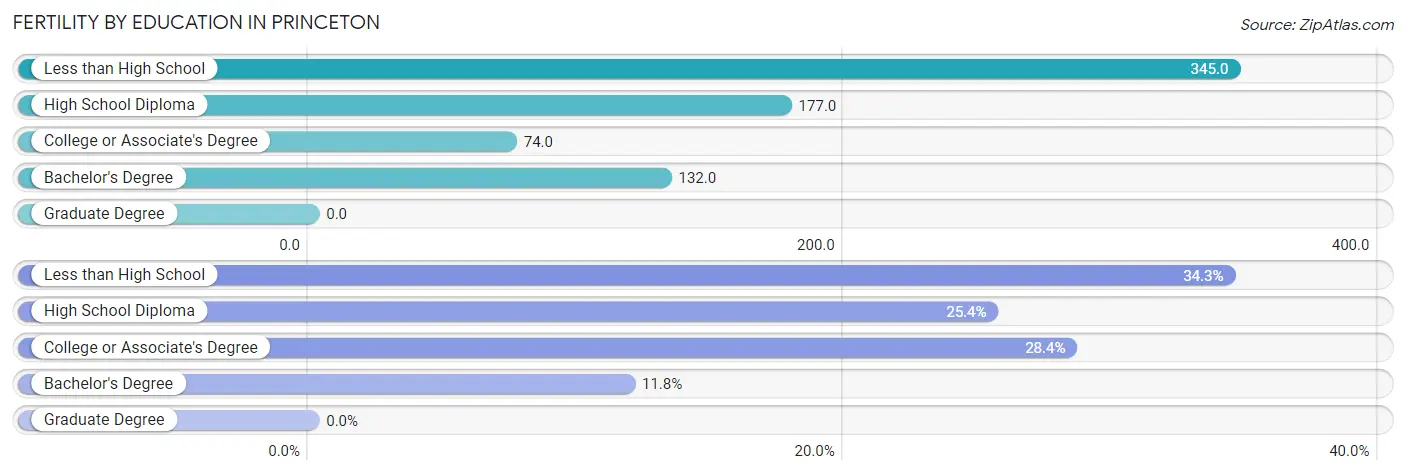
| Educational Attainment | Women with Births | Births / 1,000 Women |
| Less than High School | 58 (34.3%) | 345.0 |
| High School Diploma | 43 (25.4%) | 177.0 |
| College or Associate's Degree | 48 (28.4%) | 74.0 |
| Bachelor's Degree | 20 (11.8%) | 132.0 |
| Graduate Degree | 0 (0.0%) | 0.0 |
| Total | 169 (100.0%) | 131.0 |
Fertility by Education by Marriage Status in Princeton
84.6% of women with births in Princeton are unmarried. Women with the educational attainment of bachelor's degree are most likely to be married with 100.0% of them married at childbirth, while women with the educational attainment of less than high school are least likely to be married with 100.0% of them unmarried at childbirth.
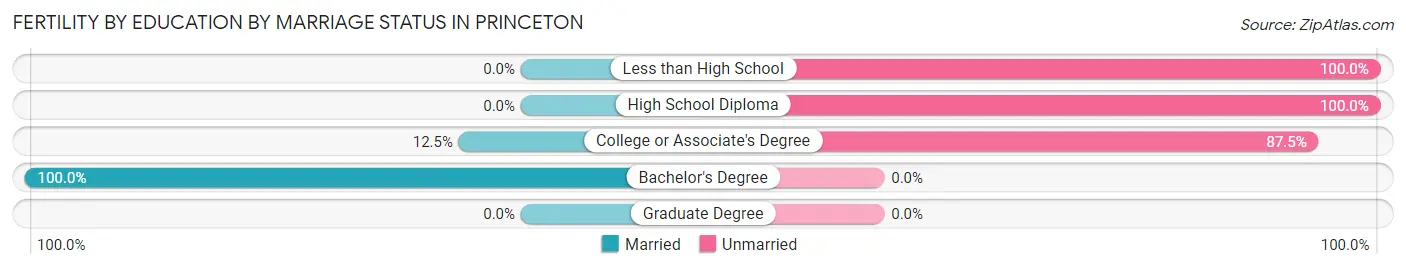
| Educational Attainment | Married | Unmarried |
| Less than High School | 0 (0.0%) | 58 (100.0%) |
| High School Diploma | 0 (0.0%) | 43 (100.0%) |
| College or Associate's Degree | 6 (12.5%) | 42 (87.5%) |
| Bachelor's Degree | 20 (100.0%) | 0 (0.0%) |
| Graduate Degree | 0 (0.0%) | 0 (0.0%) |
| Total | 26 (15.4%) | 143 (84.6%) |
Employment Characteristics in Princeton
Employment by Class of Employer in Princeton
Among the 2,471 employed individuals in Princeton, private company employees (1,834 | 74.2%), local government employees (278 | 11.3%), and state government employees (135 | 5.5%) make up the most common classes of employment.
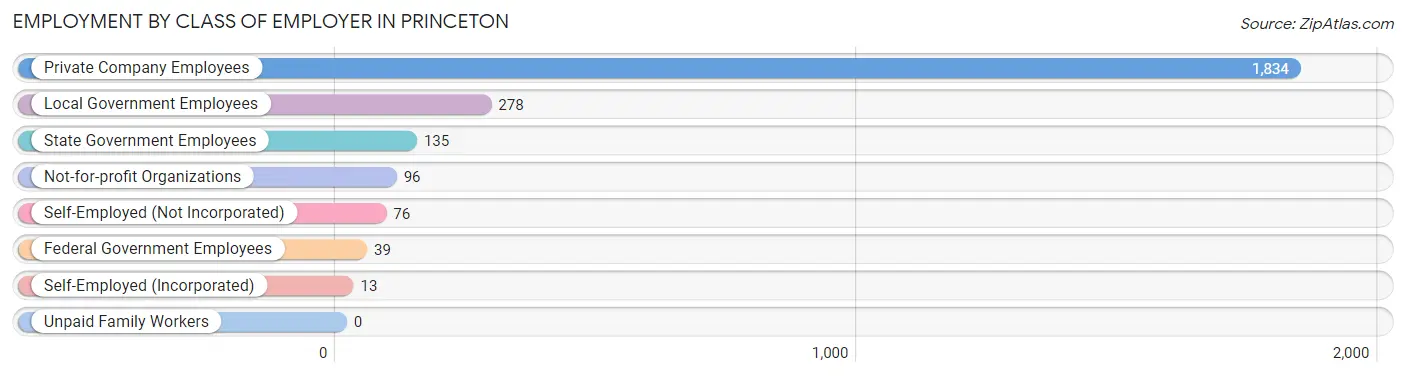
| Employer Class | # Employees | % Employees |
| Private Company Employees | 1,834 | 74.2% |
| Self-Employed (Incorporated) | 13 | 0.5% |
| Self-Employed (Not Incorporated) | 76 | 3.1% |
| Not-for-profit Organizations | 96 | 3.9% |
| Local Government Employees | 278 | 11.3% |
| State Government Employees | 135 | 5.5% |
| Federal Government Employees | 39 | 1.6% |
| Unpaid Family Workers | 0 | 0.0% |
| Total | 2,471 | 100.0% |
Employment Status by Age in Princeton
According to the labor force statistics for Princeton, out of the total population over 16 years of age (4,808), 54.1% or 2,601 individuals are in the labor force, with 3.8% or 99 of them unemployed. The age group with the highest labor force participation rate is 30 to 34 years, with 96.5% or 219 individuals in the labor force. Within the labor force, the 16 to 19 years age range has the highest percentage of unemployed individuals, with 16.9% or 23 of them being unemployed.
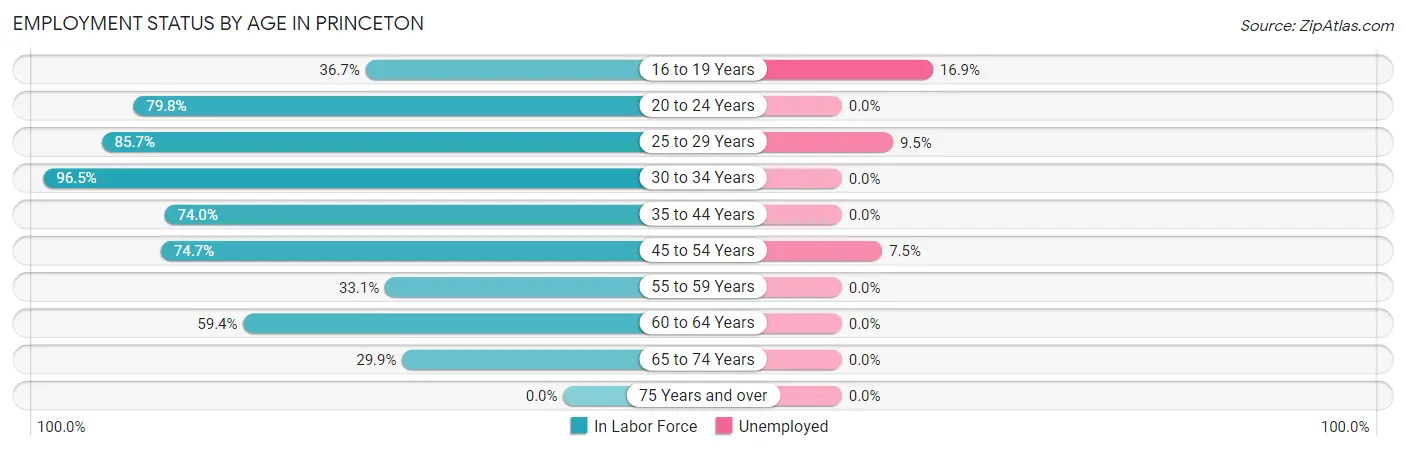
| Age Bracket | In Labor Force | Unemployed |
| 16 to 19 Years | 136 (36.7%) | 23 (16.9%) |
| 20 to 24 Years | 281 (79.8%) | 0 (0.0%) |
| 25 to 29 Years | 336 (85.7%) | 32 (9.5%) |
| 30 to 34 Years | 219 (96.5%) | 0 (0.0%) |
| 35 to 44 Years | 514 (74.0%) | 0 (0.0%) |
| 45 to 54 Years | 577 (74.7%) | 43 (7.5%) |
| 55 to 59 Years | 118 (33.1%) | 0 (0.0%) |
| 60 to 64 Years | 224 (59.4%) | 0 (0.0%) |
| 65 to 74 Years | 194 (29.9%) | 0 (0.0%) |
| 75 Years and over | 0 (0.0%) | 0 (0.0%) |
| Total | 2,601 (54.1%) | 99 (3.8%) |
Employment Status by Educational Attainment in Princeton
According to labor force statistics for Princeton, 70.5% of individuals (1,987) out of the total population between 25 and 64 years of age (2,819) are in the labor force, with 3.8% or 76 of them being unemployed. The group with the highest labor force participation rate are those with the educational attainment of bachelor's degree or higher, with 96.0% or 475 individuals in the labor force. Within the labor force, individuals with less than high school education have the highest percentage of unemployment, with 21.2% or 32 of them being unemployed.
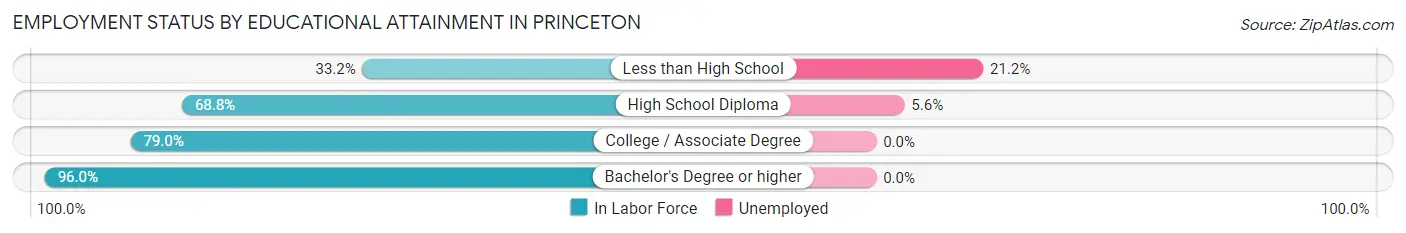
| Educational Attainment | In Labor Force | Unemployed |
| Less than High School | 151 (33.2%) | 96 (21.2%) |
| High School Diploma | 769 (68.8%) | 63 (5.6%) |
| College / Associate Degree | 593 (79.0%) | 0 (0.0%) |
| Bachelor's Degree or higher | 475 (96.0%) | 0 (0.0%) |
| Total | 1,987 (70.5%) | 107 (3.8%) |
Employment Occupations by Sex in Princeton
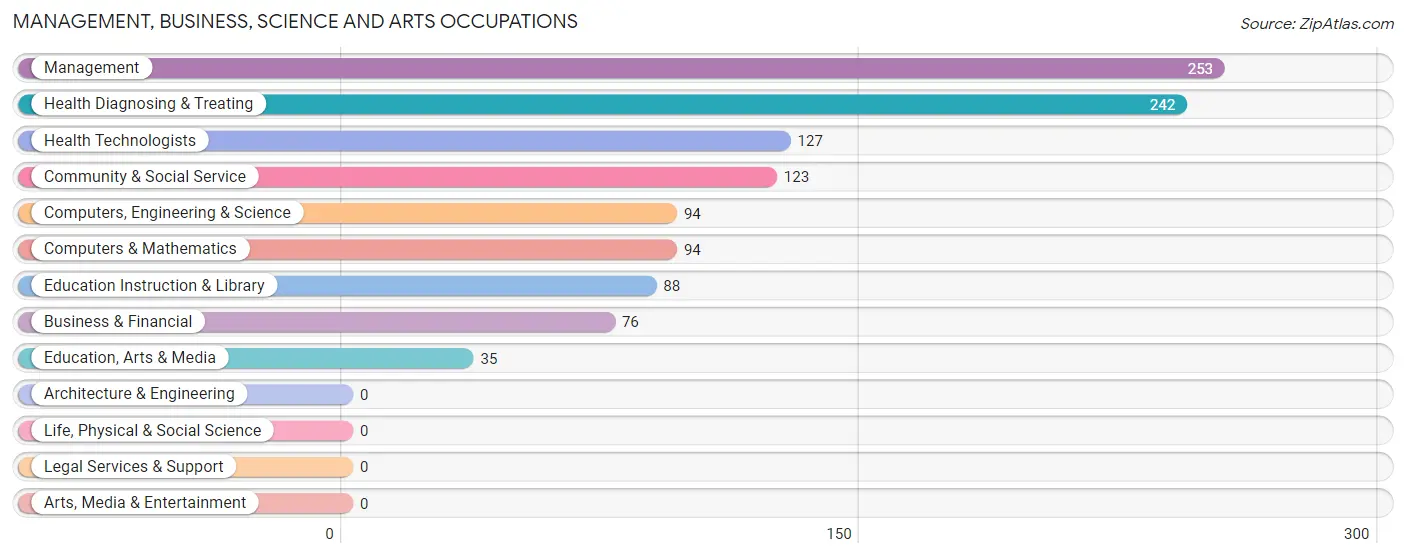
Management, Business, Science and Arts Occupations
The most common Management, Business, Science and Arts occupations in Princeton are Management (253 | 10.1%), Health Diagnosing & Treating (242 | 9.7%), Health Technologists (127 | 5.1%), Community & Social Service (123 | 4.9%), and Computers, Engineering & Science (94 | 3.8%).
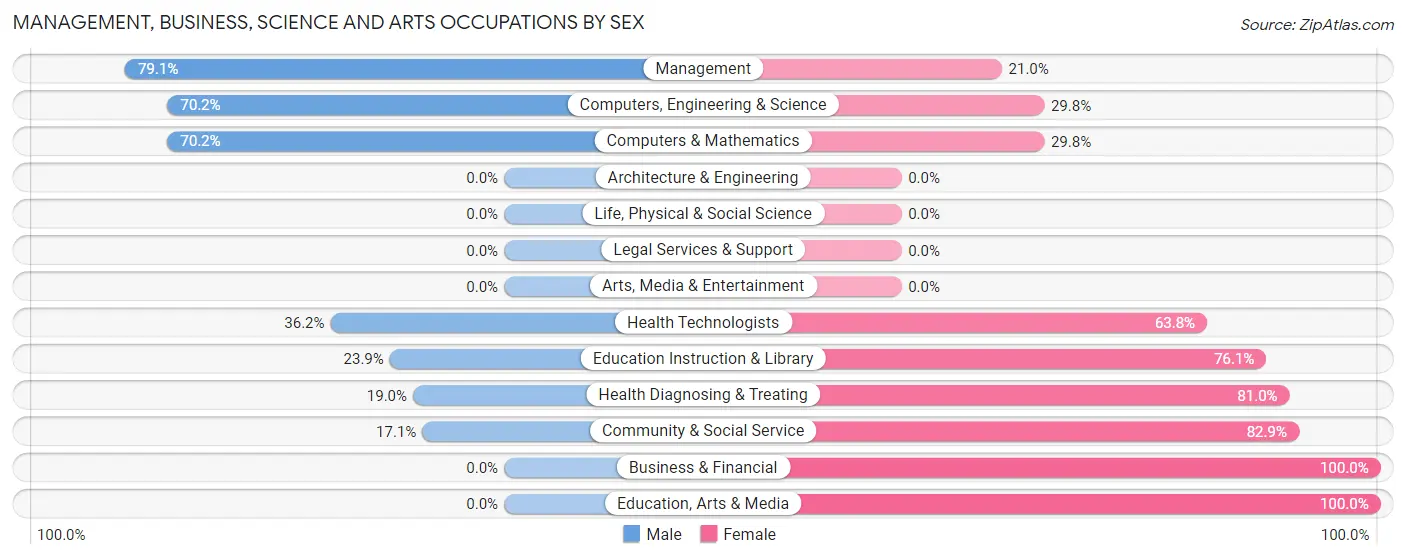
Management, Business, Science and Arts Occupations by Sex
Within the Management, Business, Science and Arts occupations in Princeton, the most male-oriented occupations are Management (79.0%), Computers, Engineering & Science (70.2%), and Computers & Mathematics (70.2%), while the most female-oriented occupations are Business & Financial (100.0%), Education, Arts & Media (100.0%), and Community & Social Service (82.9%).
| Occupation | Male | Female |
| Management | 200 (79.0%) | 53 (20.9%) |
| Business & Financial | 0 (0.0%) | 76 (100.0%) |
| Computers, Engineering & Science | 66 (70.2%) | 28 (29.8%) |
| Computers & Mathematics | 66 (70.2%) | 28 (29.8%) |
| Architecture & Engineering | 0 (0.0%) | 0 (0.0%) |
| Life, Physical & Social Science | 0 (0.0%) | 0 (0.0%) |
| Community & Social Service | 21 (17.1%) | 102 (82.9%) |
| Education, Arts & Media | 0 (0.0%) | 35 (100.0%) |
| Legal Services & Support | 0 (0.0%) | 0 (0.0%) |
| Education Instruction & Library | 21 (23.9%) | 67 (76.1%) |
| Arts, Media & Entertainment | 0 (0.0%) | 0 (0.0%) |
| Health Diagnosing & Treating | 46 (19.0%) | 196 (81.0%) |
| Health Technologists | 46 (36.2%) | 81 (63.8%) |
| Total (Category) | 333 (42.3%) | 455 (57.7%) |
| Total (Overall) | 1,255 (50.2%) | 1,246 (49.8%) |
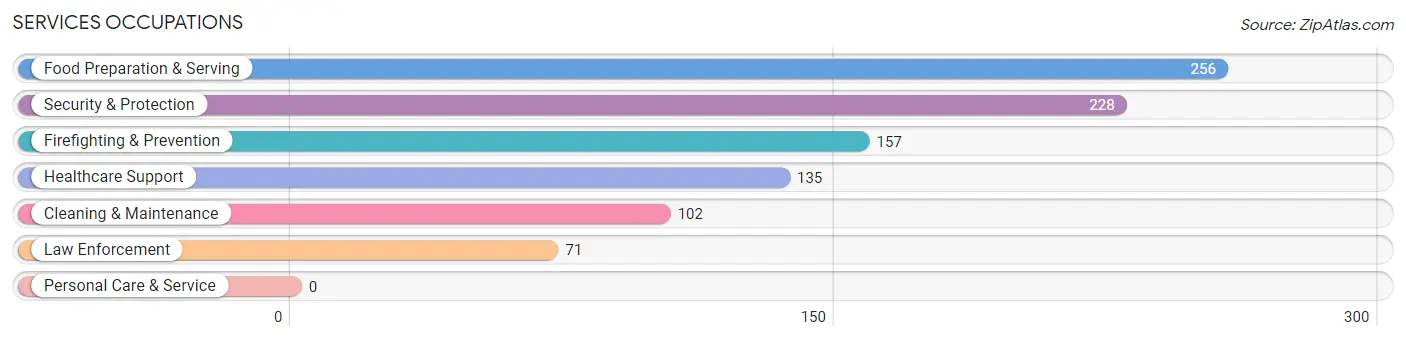
Services Occupations
The most common Services occupations in Princeton are Food Preparation & Serving (256 | 10.2%), Security & Protection (228 | 9.1%), Firefighting & Prevention (157 | 6.3%), Healthcare Support (135 | 5.4%), and Cleaning & Maintenance (102 | 4.1%).
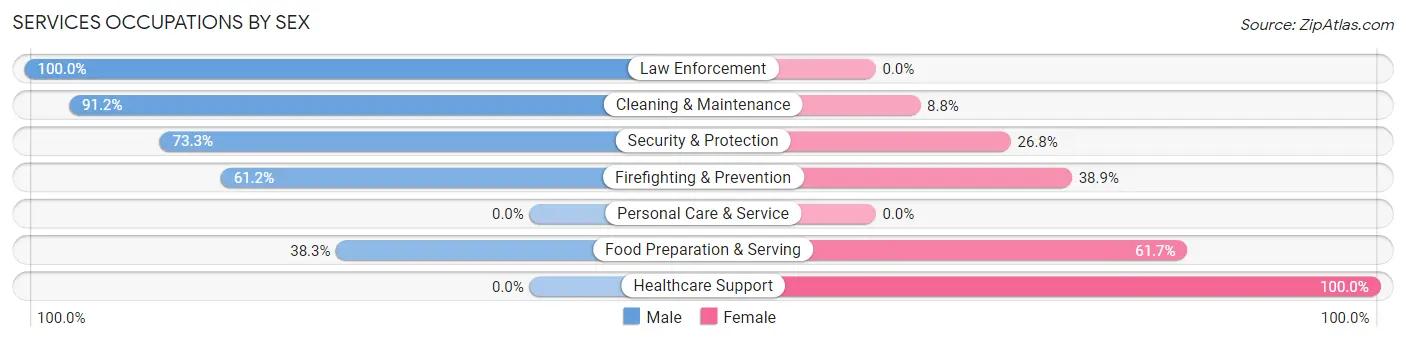
Services Occupations by Sex
Within the Services occupations in Princeton, the most male-oriented occupations are Law Enforcement (100.0%), Cleaning & Maintenance (91.2%), and Security & Protection (73.3%), while the most female-oriented occupations are Healthcare Support (100.0%), Food Preparation & Serving (61.7%), and Firefighting & Prevention (38.9%).
| Occupation | Male | Female |
| Healthcare Support | 0 (0.0%) | 135 (100.0%) |
| Security & Protection | 167 (73.3%) | 61 (26.8%) |
| Firefighting & Prevention | 96 (61.2%) | 61 (38.9%) |
| Law Enforcement | 71 (100.0%) | 0 (0.0%) |
| Food Preparation & Serving | 98 (38.3%) | 158 (61.7%) |
| Cleaning & Maintenance | 93 (91.2%) | 9 (8.8%) |
| Personal Care & Service | 0 (0.0%) | 0 (0.0%) |
| Total (Category) | 358 (49.6%) | 363 (50.3%) |
| Total (Overall) | 1,255 (50.2%) | 1,246 (49.8%) |
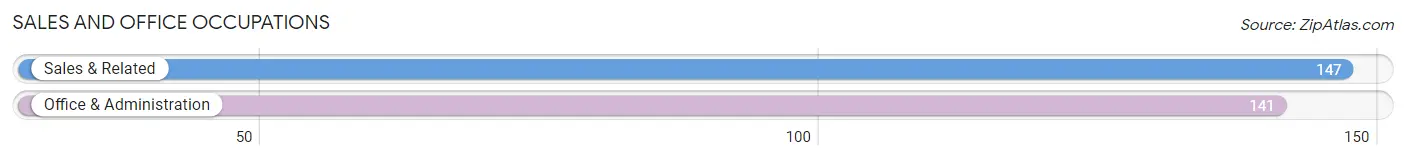
Sales and Office Occupations
The most common Sales and Office occupations in Princeton are Sales & Related (147 | 5.9%), and Office & Administration (141 | 5.6%).
Sales and Office Occupations by Sex
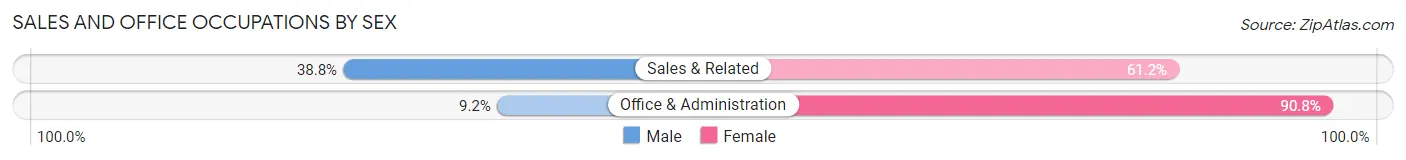
| Occupation | Male | Female |
| Sales & Related | 57 (38.8%) | 90 (61.2%) |
| Office & Administration | 13 (9.2%) | 128 (90.8%) |
| Total (Category) | 70 (24.3%) | 218 (75.7%) |
| Total (Overall) | 1,255 (50.2%) | 1,246 (49.8%) |
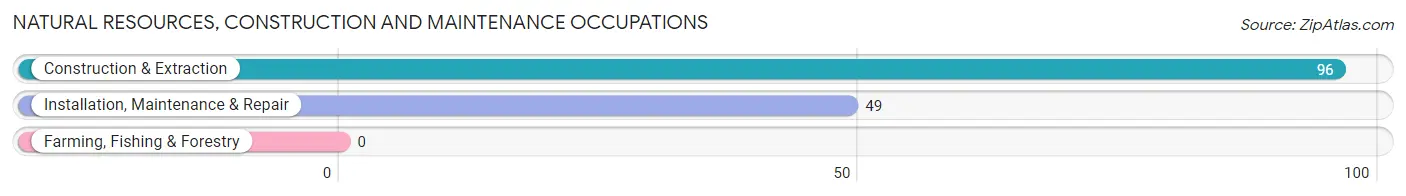
Natural Resources, Construction and Maintenance Occupations
The most common Natural Resources, Construction and Maintenance occupations in Princeton are Construction & Extraction (96 | 3.8%), and Installation, Maintenance & Repair (49 | 2.0%).
Natural Resources, Construction and Maintenance Occupations by Sex
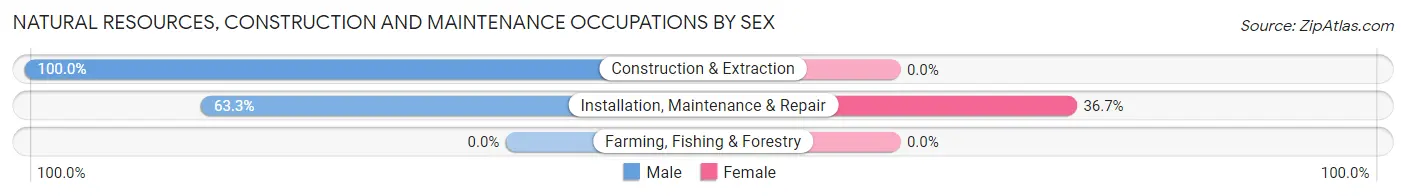
| Occupation | Male | Female |
| Farming, Fishing & Forestry | 0 (0.0%) | 0 (0.0%) |
| Construction & Extraction | 96 (100.0%) | 0 (0.0%) |
| Installation, Maintenance & Repair | 31 (63.3%) | 18 (36.7%) |
| Total (Category) | 127 (87.6%) | 18 (12.4%) |
| Total (Overall) | 1,255 (50.2%) | 1,246 (49.8%) |
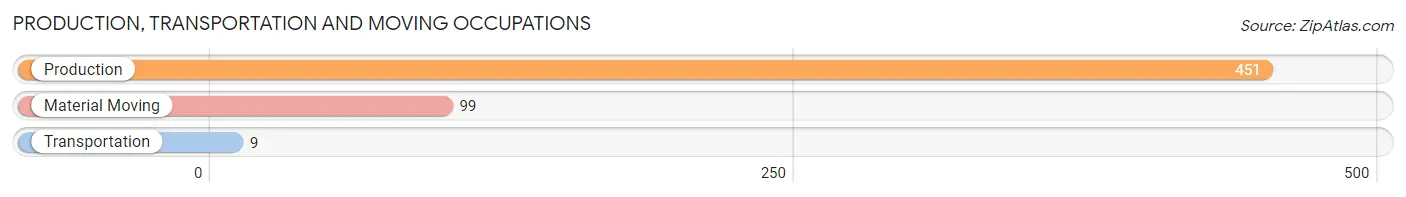
Production, Transportation and Moving Occupations
The most common Production, Transportation and Moving occupations in Princeton are Production (451 | 18.0%), Material Moving (99 | 4.0%), and Transportation (9 | 0.4%).
Production, Transportation and Moving Occupations by Sex
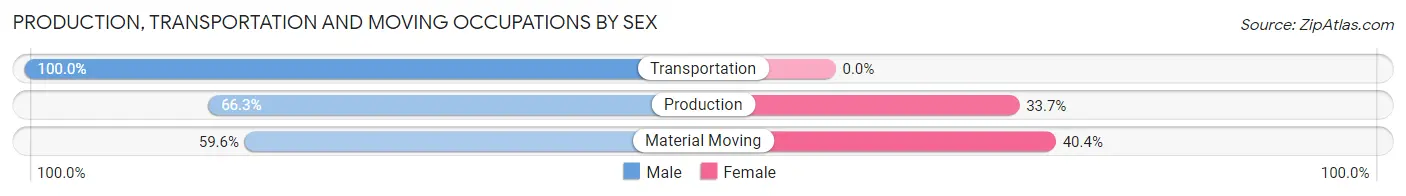
| Occupation | Male | Female |
| Production | 299 (66.3%) | 152 (33.7%) |
| Transportation | 9 (100.0%) | 0 (0.0%) |
| Material Moving | 59 (59.6%) | 40 (40.4%) |
| Total (Category) | 367 (65.6%) | 192 (34.4%) |
| Total (Overall) | 1,255 (50.2%) | 1,246 (49.8%) |
Employment Industries by Sex in Princeton
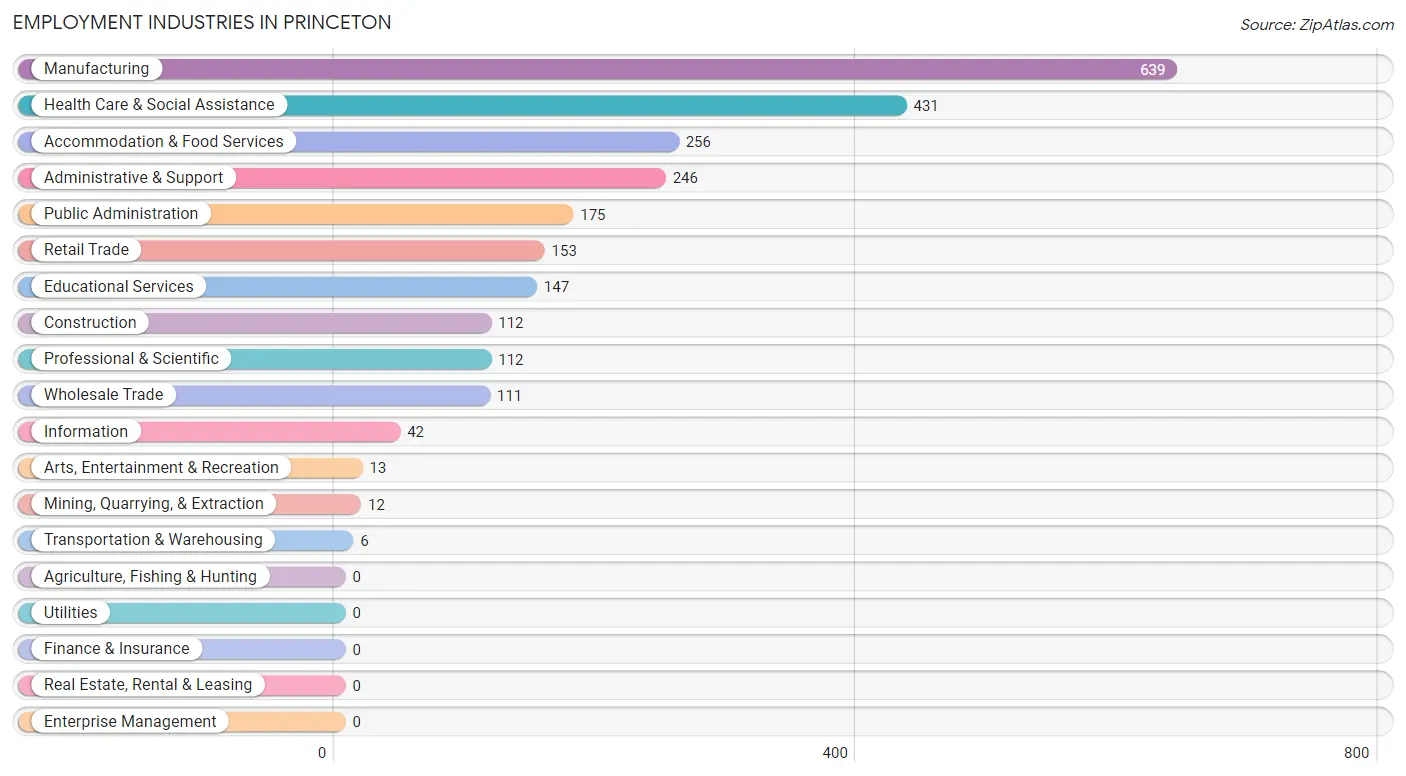
Employment Industries in Princeton
The major employment industries in Princeton include Manufacturing (639 | 25.6%), Health Care & Social Assistance (431 | 17.2%), Accommodation & Food Services (256 | 10.2%), Administrative & Support (246 | 9.8%), and Public Administration (175 | 7.0%).
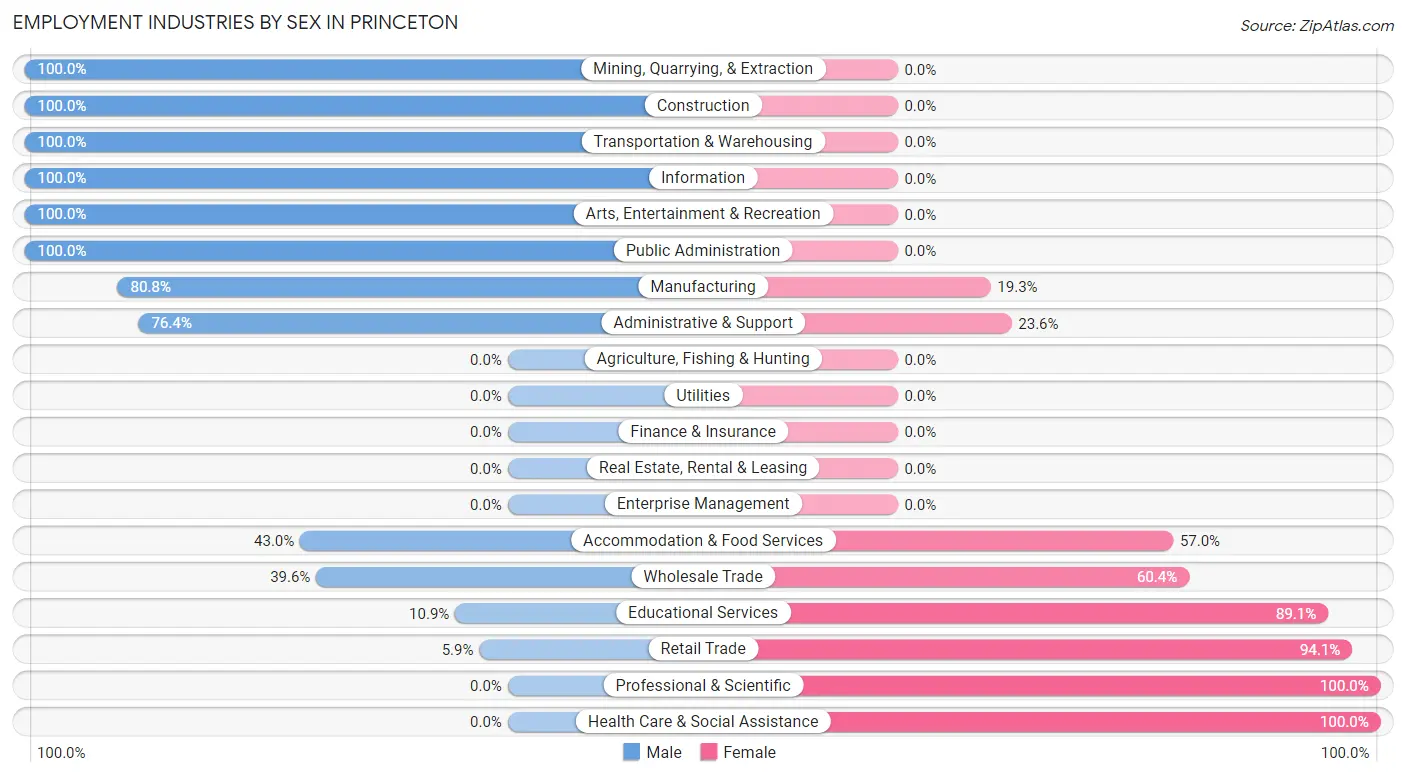
Employment Industries by Sex in Princeton
The Princeton industries that see more men than women are Mining, Quarrying, & Extraction (100.0%), Construction (100.0%), and Transportation & Warehousing (100.0%), whereas the industries that tend to have a higher number of women are Professional & Scientific (100.0%), Health Care & Social Assistance (100.0%), and Retail Trade (94.1%).
| Industry | Male | Female |
| Agriculture, Fishing & Hunting | 0 (0.0%) | 0 (0.0%) |
| Mining, Quarrying, & Extraction | 12 (100.0%) | 0 (0.0%) |
| Construction | 112 (100.0%) | 0 (0.0%) |
| Manufacturing | 516 (80.7%) | 123 (19.3%) |
| Wholesale Trade | 44 (39.6%) | 67 (60.4%) |
| Retail Trade | 9 (5.9%) | 144 (94.1%) |
| Transportation & Warehousing | 6 (100.0%) | 0 (0.0%) |
| Utilities | 0 (0.0%) | 0 (0.0%) |
| Information | 42 (100.0%) | 0 (0.0%) |
| Finance & Insurance | 0 (0.0%) | 0 (0.0%) |
| Real Estate, Rental & Leasing | 0 (0.0%) | 0 (0.0%) |
| Professional & Scientific | 0 (0.0%) | 112 (100.0%) |
| Enterprise Management | 0 (0.0%) | 0 (0.0%) |
| Administrative & Support | 188 (76.4%) | 58 (23.6%) |
| Educational Services | 16 (10.9%) | 131 (89.1%) |
| Health Care & Social Assistance | 0 (0.0%) | 431 (100.0%) |
| Arts, Entertainment & Recreation | 13 (100.0%) | 0 (0.0%) |
| Accommodation & Food Services | 110 (43.0%) | 146 (57.0%) |
| Public Administration | 175 (100.0%) | 0 (0.0%) |
| Total | 1,255 (50.2%) | 1,246 (49.8%) |
Education in Princeton
School Enrollment in Princeton
The most common levels of schooling among the 1,392 students in Princeton are middle school (398 | 28.6%), high school (332 | 23.8%), and elementary school (249 | 17.9%).
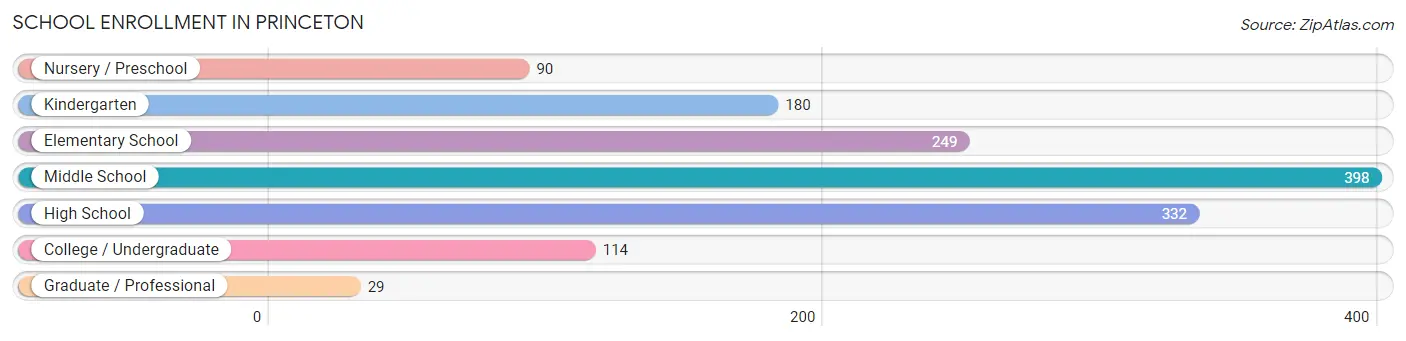
| School Level | # Students | % Students |
| Nursery / Preschool | 90 | 6.5% |
| Kindergarten | 180 | 12.9% |
| Elementary School | 249 | 17.9% |
| Middle School | 398 | 28.6% |
| High School | 332 | 23.8% |
| College / Undergraduate | 114 | 8.2% |
| Graduate / Professional | 29 | 2.1% |
| Total | 1,392 | 100.0% |
School Enrollment by Age by Funding Source in Princeton
Out of a total of 1,392 students who are enrolled in schools in Princeton, 88 (6.3%) attend a private institution, while the remaining 1,304 (93.7%) are enrolled in public schools. The age group of 25 to 34 year olds has the highest likelihood of being enrolled in private schools, with 30 (53.6% in the age bracket) enrolled. Conversely, the age group of 10 to 14 year olds has the lowest likelihood of being enrolled in a private school, with 405 (100.0% in the age bracket) attending a public institution.
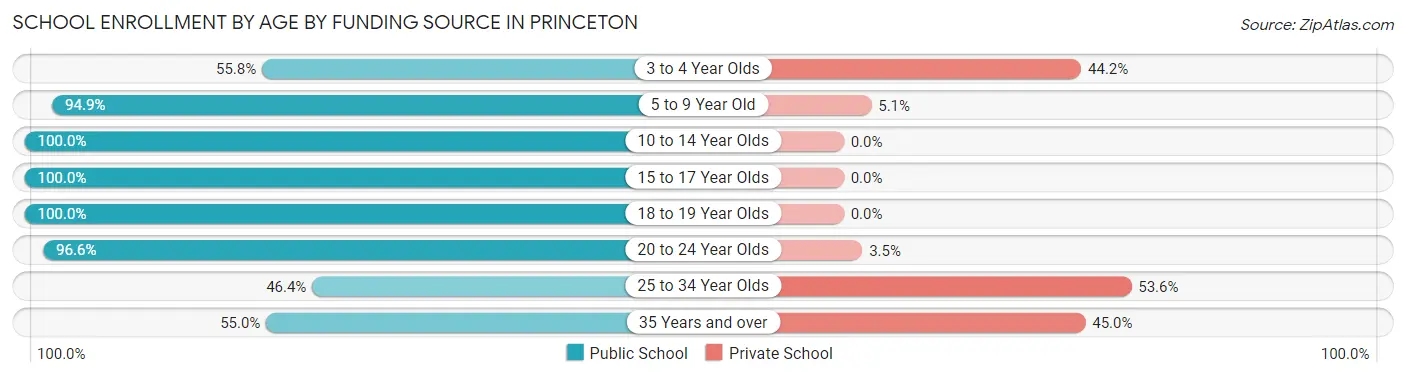
| Age Bracket | Public School | Private School |
| 3 to 4 Year Olds | 29 (55.8%) | 23 (44.2%) |
| 5 to 9 Year Old | 443 (94.9%) | 24 (5.1%) |
| 10 to 14 Year Olds | 405 (100.0%) | 0 (0.0%) |
| 15 to 17 Year Olds | 202 (100.0%) | 0 (0.0%) |
| 18 to 19 Year Olds | 132 (100.0%) | 0 (0.0%) |
| 20 to 24 Year Olds | 56 (96.6%) | 2 (3.5%) |
| 25 to 34 Year Olds | 26 (46.4%) | 30 (53.6%) |
| 35 Years and over | 11 (55.0%) | 9 (45.0%) |
| Total | 1,304 (93.7%) | 88 (6.3%) |
Educational Attainment by Field of Study in Princeton
Education (161 | 21.3%), science & technology (129 | 17.0%), bio, nature & agricultural (110 | 14.5%), arts & humanities (103 | 13.6%), and business (88 | 11.6%) are the most common fields of study among 757 individuals in Princeton who have obtained a bachelor's degree or higher.
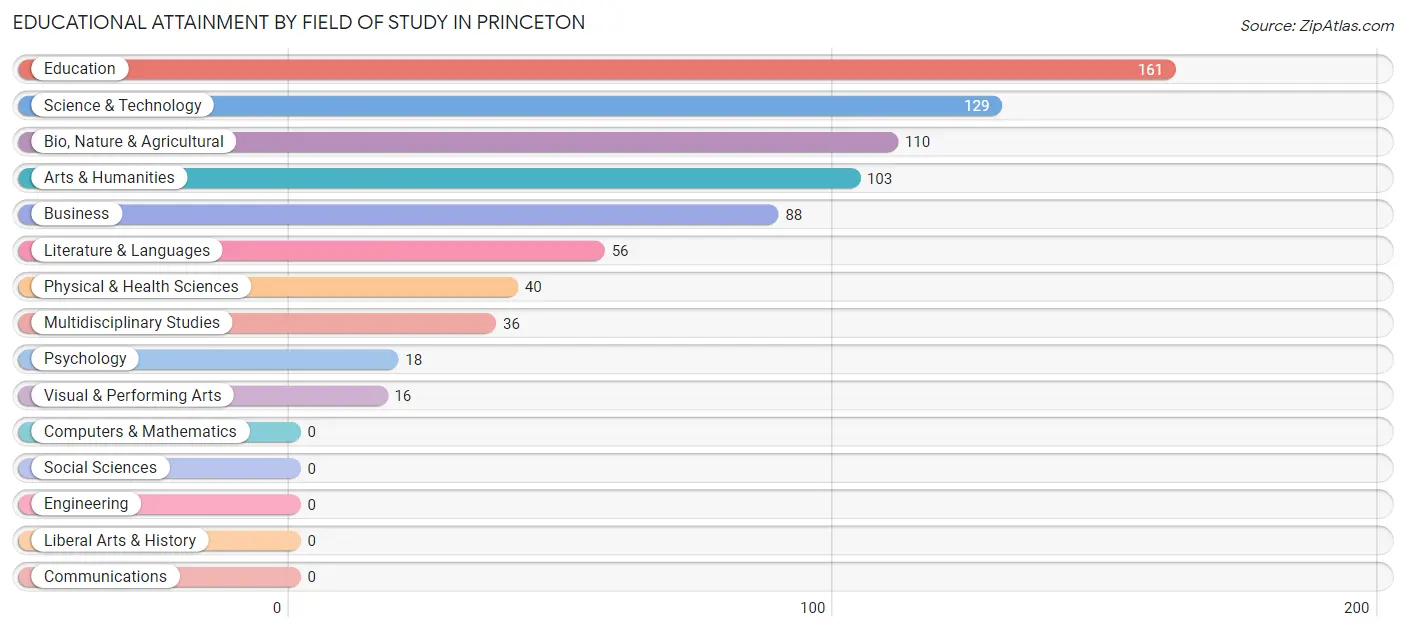
| Field of Study | # Graduates | % Graduates |
| Computers & Mathematics | 0 | 0.0% |
| Bio, Nature & Agricultural | 110 | 14.5% |
| Physical & Health Sciences | 40 | 5.3% |
| Psychology | 18 | 2.4% |
| Social Sciences | 0 | 0.0% |
| Engineering | 0 | 0.0% |
| Multidisciplinary Studies | 36 | 4.8% |
| Science & Technology | 129 | 17.0% |
| Business | 88 | 11.6% |
| Education | 161 | 21.3% |
| Literature & Languages | 56 | 7.4% |
| Liberal Arts & History | 0 | 0.0% |
| Visual & Performing Arts | 16 | 2.1% |
| Communications | 0 | 0.0% |
| Arts & Humanities | 103 | 13.6% |
| Total | 757 | 100.0% |
Transportation & Commute in Princeton
Vehicle Availability by Sex in Princeton
The most prevalent vehicle ownership categories in Princeton are males with 3 vehicles (434, accounting for 35.1%) and females with 3 vehicles (255, making up 35.2%).
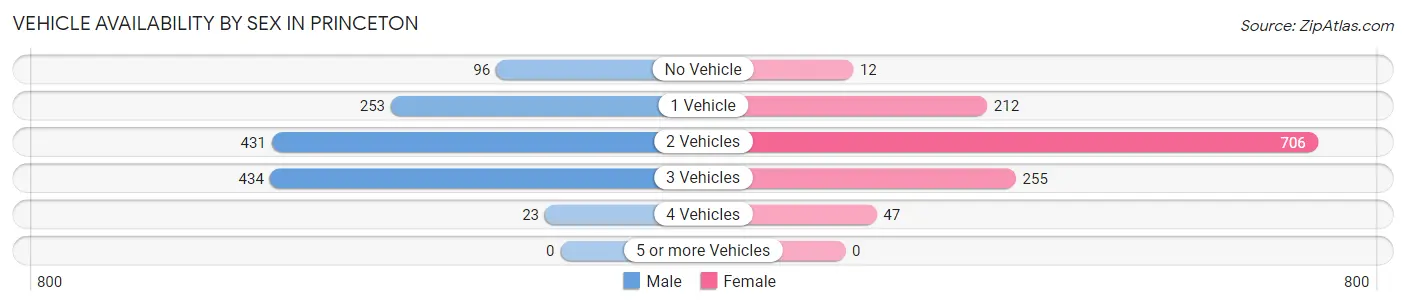
| Vehicles Available | Male | Female |
| No Vehicle | 96 (7.8%) | 12 (1.0%) |
| 1 Vehicle | 253 (20.4%) | 212 (17.2%) |
| 2 Vehicles | 431 (34.8%) | 706 (57.3%) |
| 3 Vehicles | 434 (35.1%) | 255 (20.7%) |
| 4 Vehicles | 23 (1.9%) | 47 (3.8%) |
| 5 or more Vehicles | 0 (0.0%) | 0 (0.0%) |
| Total | 1,237 (100.0%) | 1,232 (100.0%) |
Commute Time in Princeton
The most frequently occuring commute durations in Princeton are 5 to 9 minutes (556 commuters, 24.3%), 45 to 59 minutes (306 commuters, 13.4%), and 10 to 14 minutes (294 commuters, 12.8%).
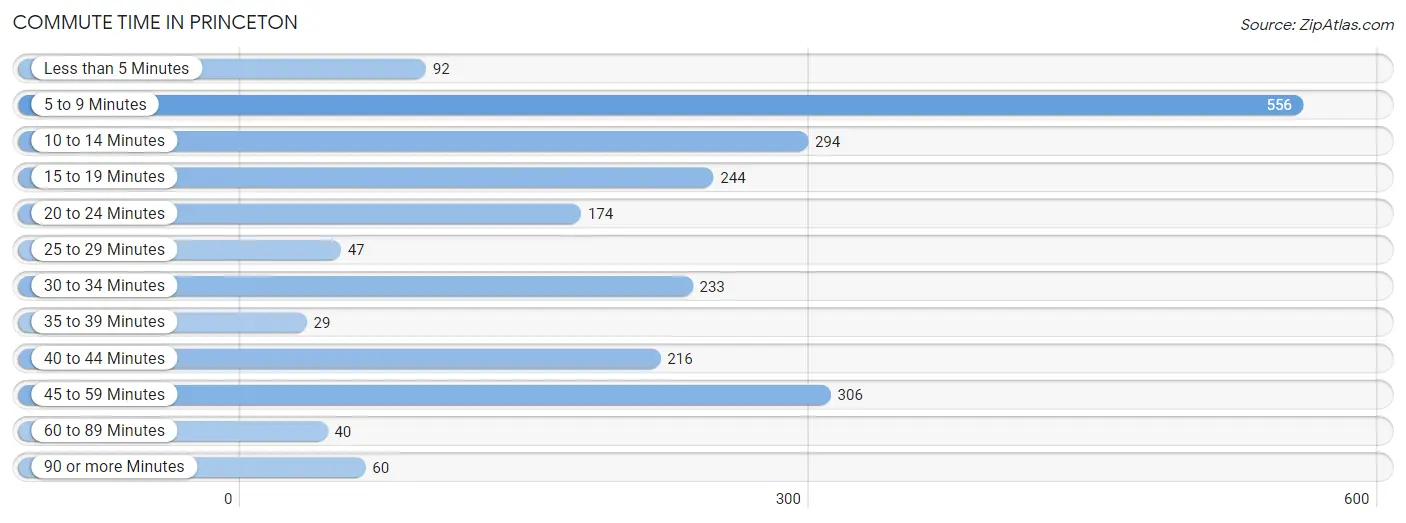
| Commute Time | # Commuters | % Commuters |
| Less than 5 Minutes | 92 | 4.0% |
| 5 to 9 Minutes | 556 | 24.3% |
| 10 to 14 Minutes | 294 | 12.8% |
| 15 to 19 Minutes | 244 | 10.6% |
| 20 to 24 Minutes | 174 | 7.6% |
| 25 to 29 Minutes | 47 | 2.1% |
| 30 to 34 Minutes | 233 | 10.2% |
| 35 to 39 Minutes | 29 | 1.3% |
| 40 to 44 Minutes | 216 | 9.4% |
| 45 to 59 Minutes | 306 | 13.4% |
| 60 to 89 Minutes | 40 | 1.8% |
| 90 or more Minutes | 60 | 2.6% |
Commute Time by Sex in Princeton
The most common commute times in Princeton are 5 to 9 minutes (261 commuters, 22.8%) for males and 5 to 9 minutes (295 commuters, 25.7%) for females.
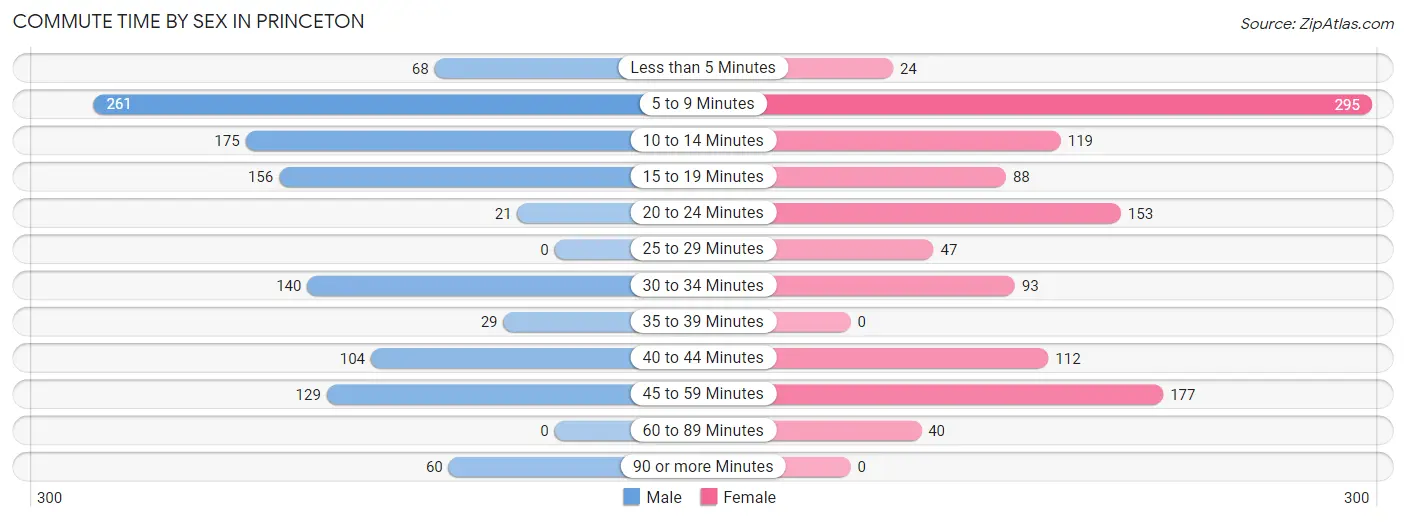
| Commute Time | Male | Female |
| Less than 5 Minutes | 68 (5.9%) | 24 (2.1%) |
| 5 to 9 Minutes | 261 (22.8%) | 295 (25.7%) |
| 10 to 14 Minutes | 175 (15.3%) | 119 (10.4%) |
| 15 to 19 Minutes | 156 (13.7%) | 88 (7.7%) |
| 20 to 24 Minutes | 21 (1.8%) | 153 (13.3%) |
| 25 to 29 Minutes | 0 (0.0%) | 47 (4.1%) |
| 30 to 34 Minutes | 140 (12.2%) | 93 (8.1%) |
| 35 to 39 Minutes | 29 (2.5%) | 0 (0.0%) |
| 40 to 44 Minutes | 104 (9.1%) | 112 (9.8%) |
| 45 to 59 Minutes | 129 (11.3%) | 177 (15.4%) |
| 60 to 89 Minutes | 0 (0.0%) | 40 (3.5%) |
| 90 or more Minutes | 60 (5.2%) | 0 (0.0%) |
Time of Departure to Work by Sex in Princeton
The most frequent times of departure to work in Princeton are 7:00 AM to 7:29 AM (309, 27.0%) for males and 7:30 AM to 7:59 AM (214, 18.6%) for females.
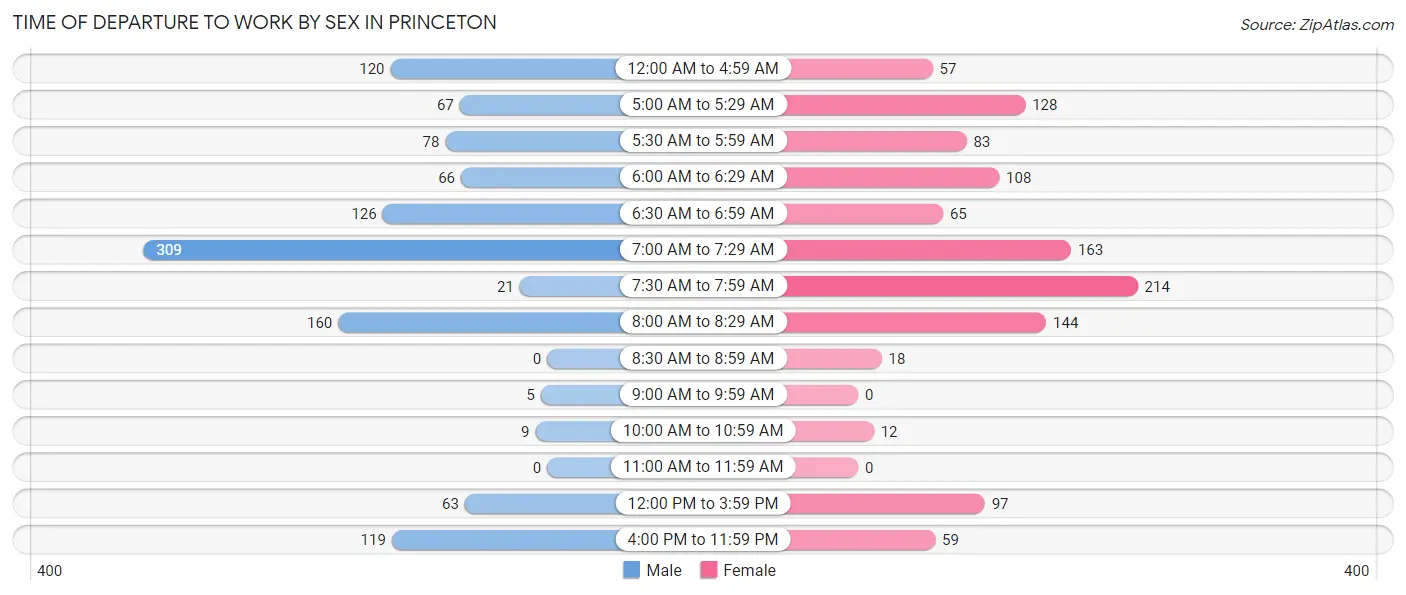
| Time of Departure | Male | Female |
| 12:00 AM to 4:59 AM | 120 (10.5%) | 57 (5.0%) |
| 5:00 AM to 5:29 AM | 67 (5.9%) | 128 (11.2%) |
| 5:30 AM to 5:59 AM | 78 (6.8%) | 83 (7.2%) |
| 6:00 AM to 6:29 AM | 66 (5.8%) | 108 (9.4%) |
| 6:30 AM to 6:59 AM | 126 (11.0%) | 65 (5.7%) |
| 7:00 AM to 7:29 AM | 309 (27.0%) | 163 (14.2%) |
| 7:30 AM to 7:59 AM | 21 (1.8%) | 214 (18.6%) |
| 8:00 AM to 8:29 AM | 160 (14.0%) | 144 (12.5%) |
| 8:30 AM to 8:59 AM | 0 (0.0%) | 18 (1.6%) |
| 9:00 AM to 9:59 AM | 5 (0.4%) | 0 (0.0%) |
| 10:00 AM to 10:59 AM | 9 (0.8%) | 12 (1.1%) |
| 11:00 AM to 11:59 AM | 0 (0.0%) | 0 (0.0%) |
| 12:00 PM to 3:59 PM | 63 (5.5%) | 97 (8.5%) |
| 4:00 PM to 11:59 PM | 119 (10.4%) | 59 (5.1%) |
| Total | 1,143 (100.0%) | 1,148 (100.0%) |
Housing Occupancy in Princeton
Occupancy by Ownership in Princeton
Of the total 2,487 dwellings in Princeton, owner-occupied units account for 1,489 (59.9%), while renter-occupied units make up 998 (40.1%).
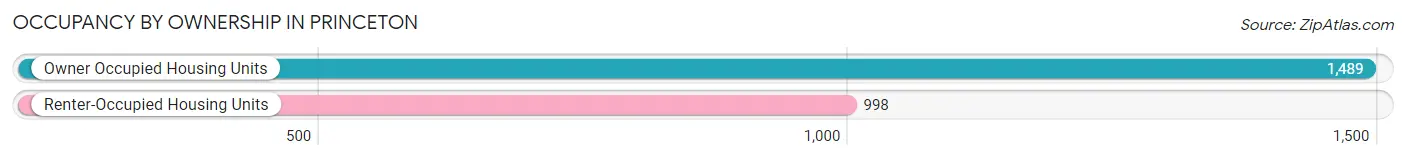
| Occupancy | # Housing Units | % Housing Units |
| Owner Occupied Housing Units | 1,489 | 59.9% |
| Renter-Occupied Housing Units | 998 | 40.1% |
| Total Occupied Housing Units | 2,487 | 100.0% |
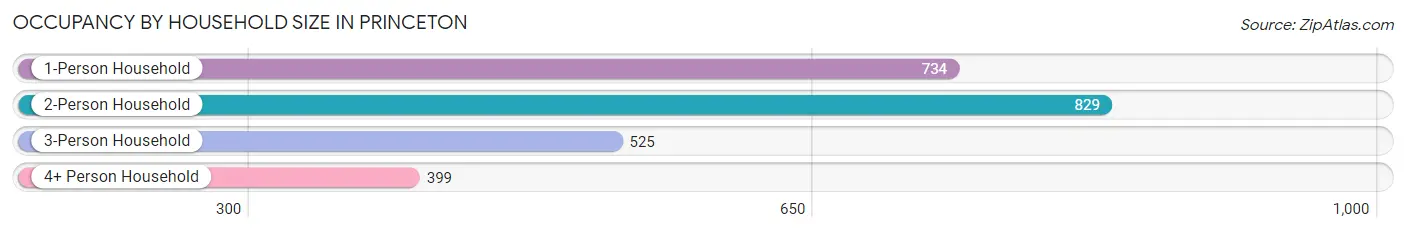
Occupancy by Household Size in Princeton
| Household Size | # Housing Units | % Housing Units |
| 1-Person Household | 734 | 29.5% |
| 2-Person Household | 829 | 33.3% |
| 3-Person Household | 525 | 21.1% |
| 4+ Person Household | 399 | 16.0% |
| Total Housing Units | 2,487 | 100.0% |
Occupancy by Ownership by Household Size in Princeton
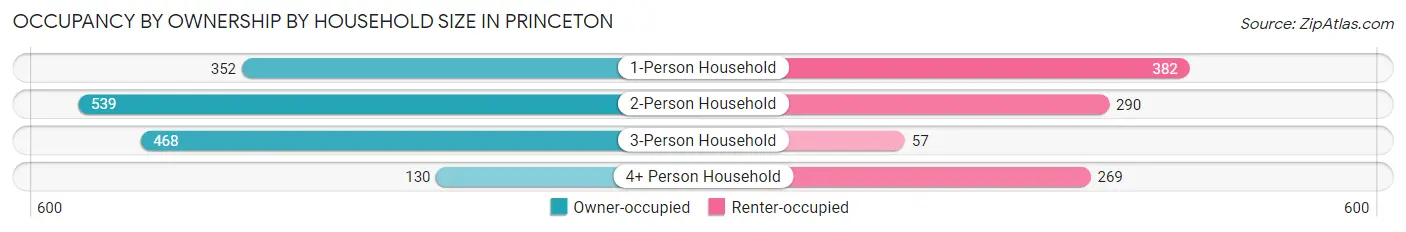
| Household Size | Owner-occupied | Renter-occupied |
| 1-Person Household | 352 (48.0%) | 382 (52.0%) |
| 2-Person Household | 539 (65.0%) | 290 (35.0%) |
| 3-Person Household | 468 (89.1%) | 57 (10.9%) |
| 4+ Person Household | 130 (32.6%) | 269 (67.4%) |
| Total Housing Units | 1,489 (59.9%) | 998 (40.1%) |
Occupancy by Educational Attainment in Princeton
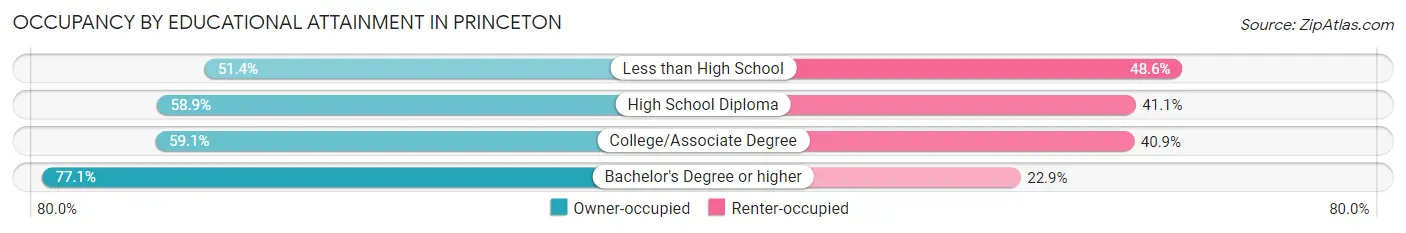
| Household Size | Owner-occupied | Renter-occupied |
| Less than High School | 287 (51.4%) | 271 (48.6%) |
| High School Diploma | 414 (58.9%) | 289 (41.1%) |
| College/Associate Degree | 518 (59.1%) | 358 (40.9%) |
| Bachelor's Degree or higher | 270 (77.1%) | 80 (22.9%) |
Occupancy by Age of Householder in Princeton
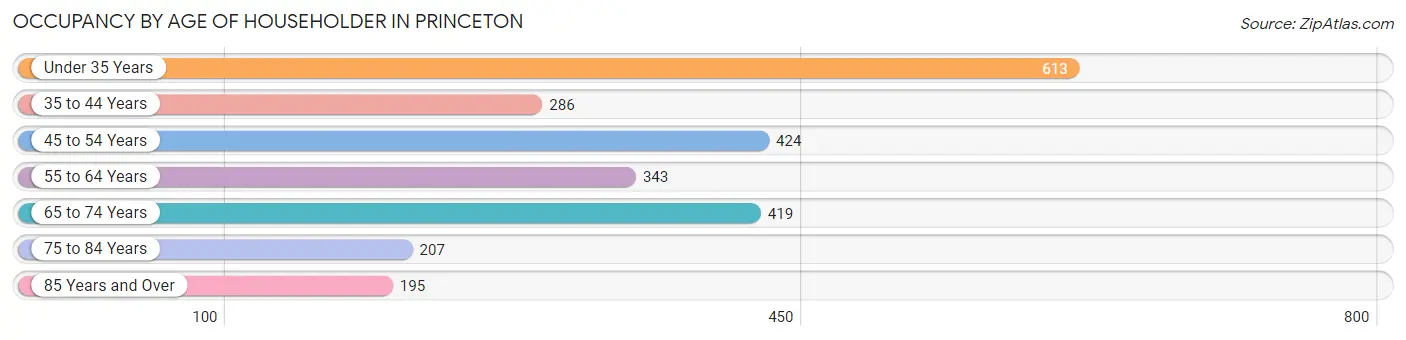
| Age Bracket | # Households | % Households |
| Under 35 Years | 613 | 24.6% |
| 35 to 44 Years | 286 | 11.5% |
| 45 to 54 Years | 424 | 17.1% |
| 55 to 64 Years | 343 | 13.8% |
| 65 to 74 Years | 419 | 16.9% |
| 75 to 84 Years | 207 | 8.3% |
| 85 Years and Over | 195 | 7.8% |
| Total | 2,487 | 100.0% |
Housing Finances in Princeton
Median Income by Occupancy in Princeton
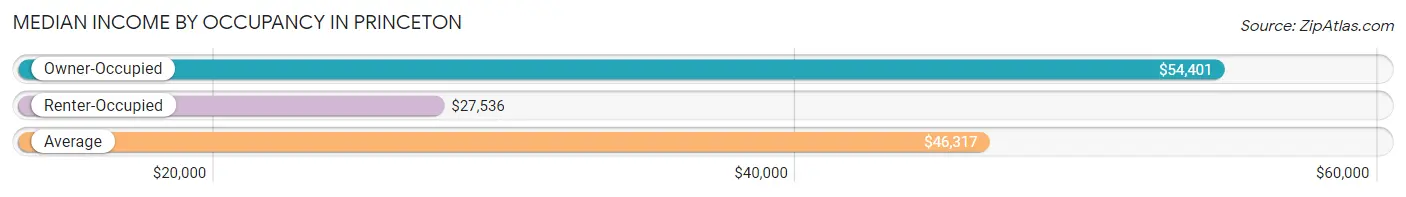
| Occupancy Type | # Households | Median Income |
| Owner-Occupied | 1,489 (59.9%) | $54,401 |
| Renter-Occupied | 998 (40.1%) | $27,536 |
| Average | 2,487 (100.0%) | $46,317 |
Occupancy by Householder Income Bracket in Princeton
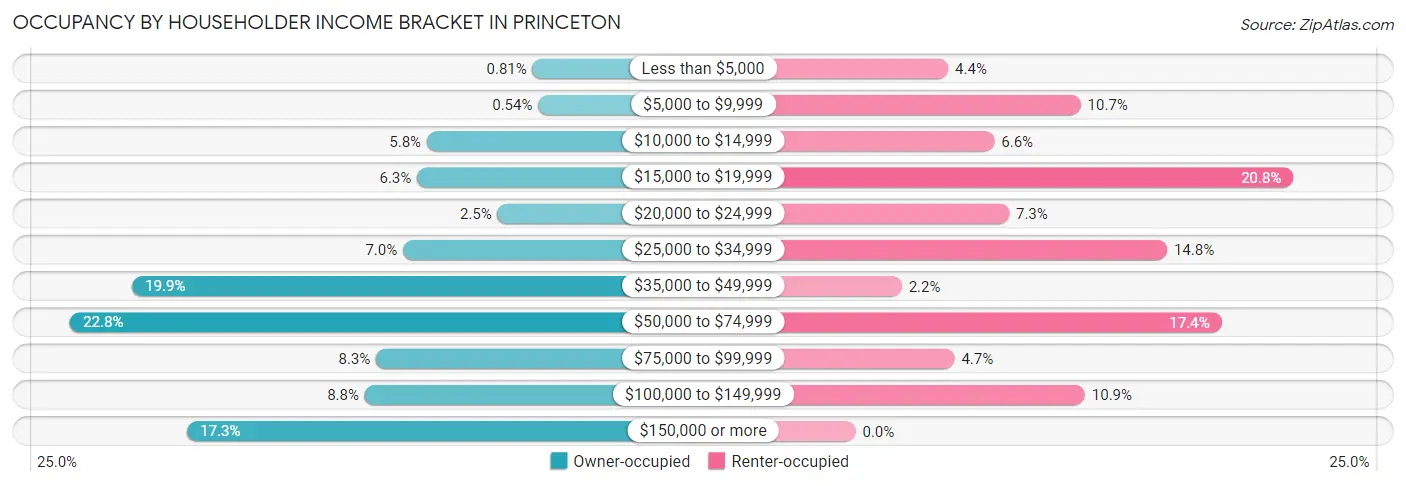
| Income Bracket | Owner-occupied | Renter-occupied |
| Less than $5,000 | 12 (0.8%) | 44 (4.4%) |
| $5,000 to $9,999 | 8 (0.5%) | 107 (10.7%) |
| $10,000 to $14,999 | 87 (5.8%) | 66 (6.6%) |
| $15,000 to $19,999 | 94 (6.3%) | 208 (20.8%) |
| $20,000 to $24,999 | 37 (2.5%) | 73 (7.3%) |
| $25,000 to $34,999 | 104 (7.0%) | 148 (14.8%) |
| $35,000 to $49,999 | 296 (19.9%) | 22 (2.2%) |
| $50,000 to $74,999 | 340 (22.8%) | 174 (17.4%) |
| $75,000 to $99,999 | 123 (8.3%) | 47 (4.7%) |
| $100,000 to $149,999 | 131 (8.8%) | 109 (10.9%) |
| $150,000 or more | 257 (17.3%) | 0 (0.0%) |
| Total | 1,489 (100.0%) | 998 (100.0%) |
Monthly Housing Cost Tiers in Princeton
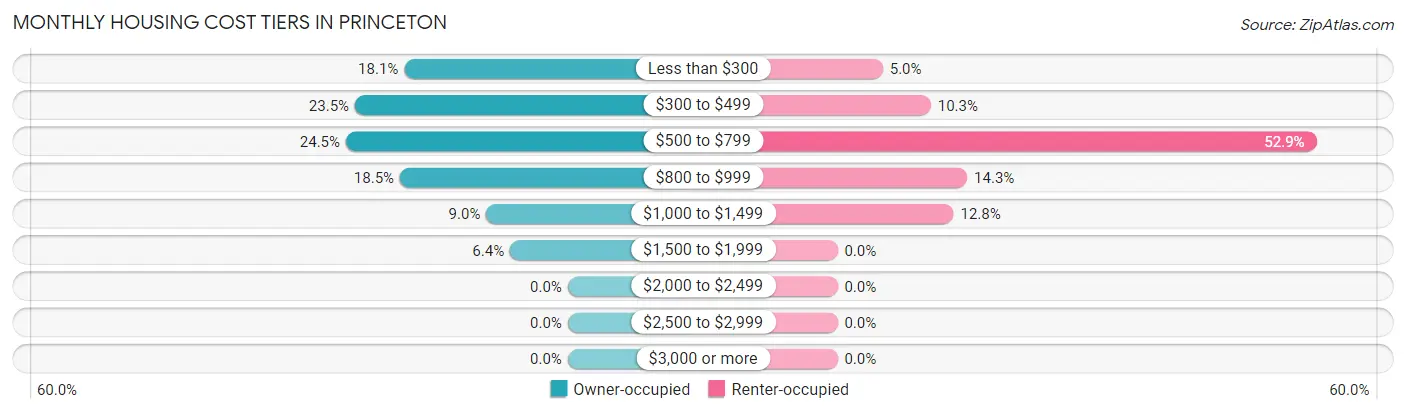
| Monthly Cost | Owner-occupied | Renter-occupied |
| Less than $300 | 269 (18.1%) | 50 (5.0%) |
| $300 to $499 | 350 (23.5%) | 103 (10.3%) |
| $500 to $799 | 365 (24.5%) | 528 (52.9%) |
| $800 to $999 | 276 (18.5%) | 143 (14.3%) |
| $1,000 to $1,499 | 134 (9.0%) | 128 (12.8%) |
| $1,500 to $1,999 | 95 (6.4%) | 0 (0.0%) |
| $2,000 to $2,499 | 0 (0.0%) | 0 (0.0%) |
| $2,500 to $2,999 | 0 (0.0%) | 0 (0.0%) |
| $3,000 or more | 0 (0.0%) | 0 (0.0%) |
| Total | 1,489 (100.0%) | 998 (100.0%) |
Physical Housing Characteristics in Princeton
Housing Structures in Princeton
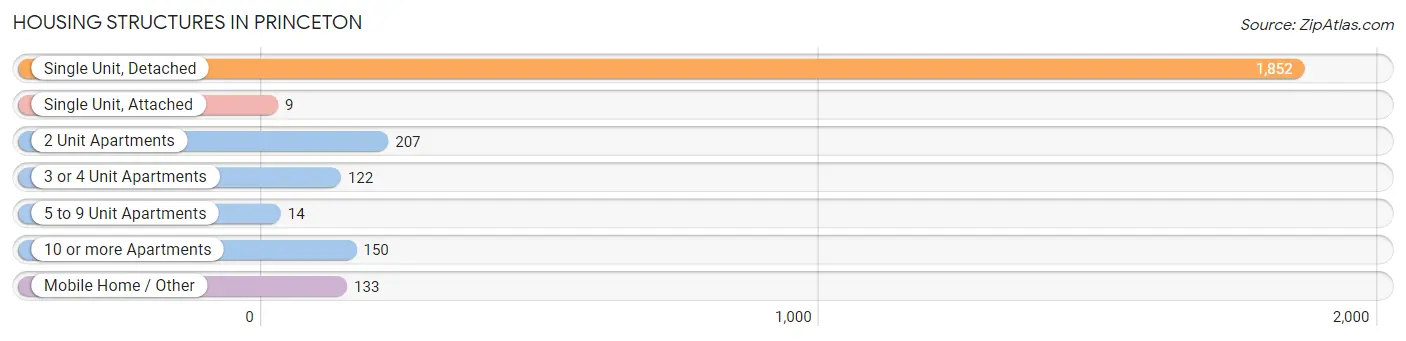
| Structure Type | # Housing Units | % Housing Units |
| Single Unit, Detached | 1,852 | 74.5% |
| Single Unit, Attached | 9 | 0.4% |
| 2 Unit Apartments | 207 | 8.3% |
| 3 or 4 Unit Apartments | 122 | 4.9% |
| 5 to 9 Unit Apartments | 14 | 0.6% |
| 10 or more Apartments | 150 | 6.0% |
| Mobile Home / Other | 133 | 5.3% |
| Total | 2,487 | 100.0% |
Housing Structures by Occupancy in Princeton
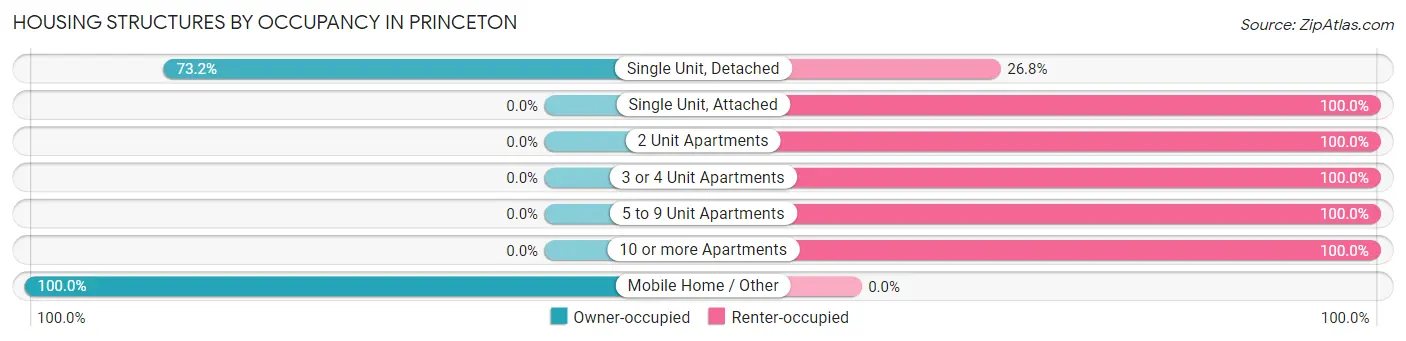
| Structure Type | Owner-occupied | Renter-occupied |
| Single Unit, Detached | 1,356 (73.2%) | 496 (26.8%) |
| Single Unit, Attached | 0 (0.0%) | 9 (100.0%) |
| 2 Unit Apartments | 0 (0.0%) | 207 (100.0%) |
| 3 or 4 Unit Apartments | 0 (0.0%) | 122 (100.0%) |
| 5 to 9 Unit Apartments | 0 (0.0%) | 14 (100.0%) |
| 10 or more Apartments | 0 (0.0%) | 150 (100.0%) |
| Mobile Home / Other | 133 (100.0%) | 0 (0.0%) |
| Total | 1,489 (59.9%) | 998 (40.1%) |
Housing Structures by Number of Rooms in Princeton
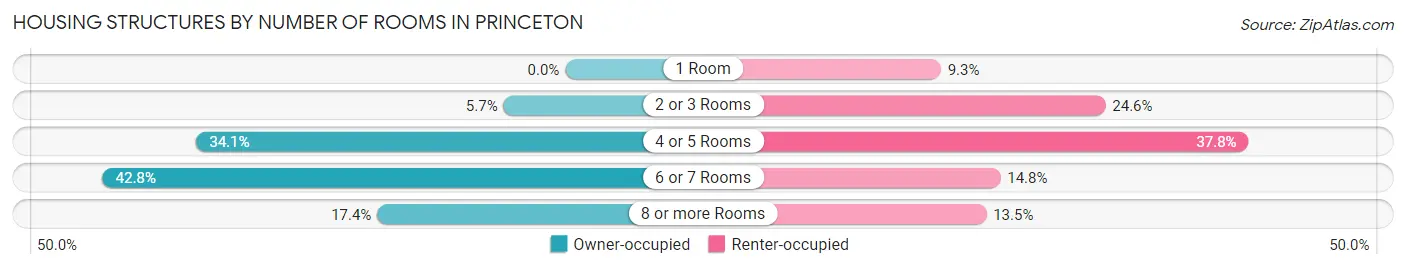
| Number of Rooms | Owner-occupied | Renter-occupied |
| 1 Room | 0 (0.0%) | 93 (9.3%) |
| 2 or 3 Rooms | 85 (5.7%) | 245 (24.5%) |
| 4 or 5 Rooms | 508 (34.1%) | 377 (37.8%) |
| 6 or 7 Rooms | 637 (42.8%) | 148 (14.8%) |
| 8 or more Rooms | 259 (17.4%) | 135 (13.5%) |
| Total | 1,489 (100.0%) | 998 (100.0%) |
Housing Structure by Heating Type in Princeton
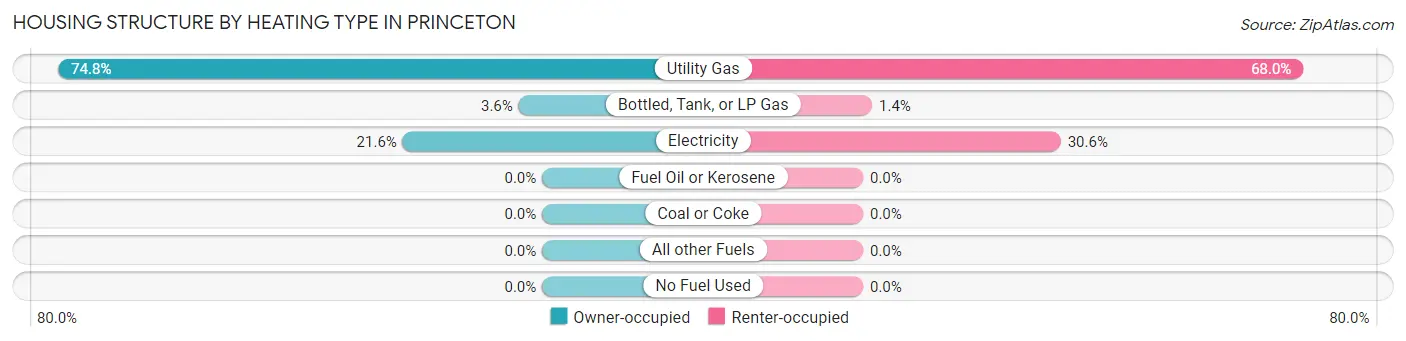
| Heating Type | Owner-occupied | Renter-occupied |
| Utility Gas | 1,114 (74.8%) | 679 (68.0%) |
| Bottled, Tank, or LP Gas | 54 (3.6%) | 14 (1.4%) |
| Electricity | 321 (21.6%) | 305 (30.6%) |
| Fuel Oil or Kerosene | 0 (0.0%) | 0 (0.0%) |
| Coal or Coke | 0 (0.0%) | 0 (0.0%) |
| All other Fuels | 0 (0.0%) | 0 (0.0%) |
| No Fuel Used | 0 (0.0%) | 0 (0.0%) |
| Total | 1,489 (100.0%) | 998 (100.0%) |
Household Vehicle Usage in Princeton
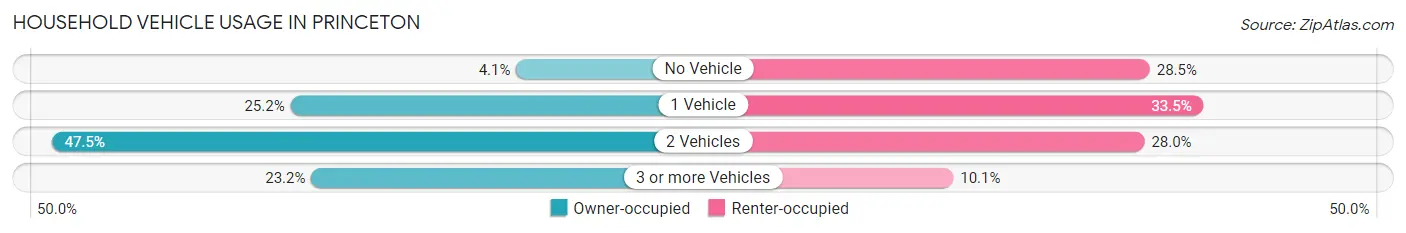
| Vehicles per Household | Owner-occupied | Renter-occupied |
| No Vehicle | 61 (4.1%) | 284 (28.5%) |
| 1 Vehicle | 375 (25.2%) | 334 (33.5%) |
| 2 Vehicles | 707 (47.5%) | 279 (28.0%) |
| 3 or more Vehicles | 346 (23.2%) | 101 (10.1%) |
| Total | 1,489 (100.0%) | 998 (100.0%) |
Real Estate & Mortgages in Princeton
Real Estate and Mortgage Overview in Princeton
| Characteristic | Without Mortgage | With Mortgage |
| Housing Units | 794 | 695 |
| Median Property Value | $72,500 | $96,800 |
| Median Household Income | $43,821 | $152 |
| Monthly Housing Costs | $360 | $0 |
| Real Estate Taxes | $335 | $64 |
Property Value by Mortgage Status in Princeton
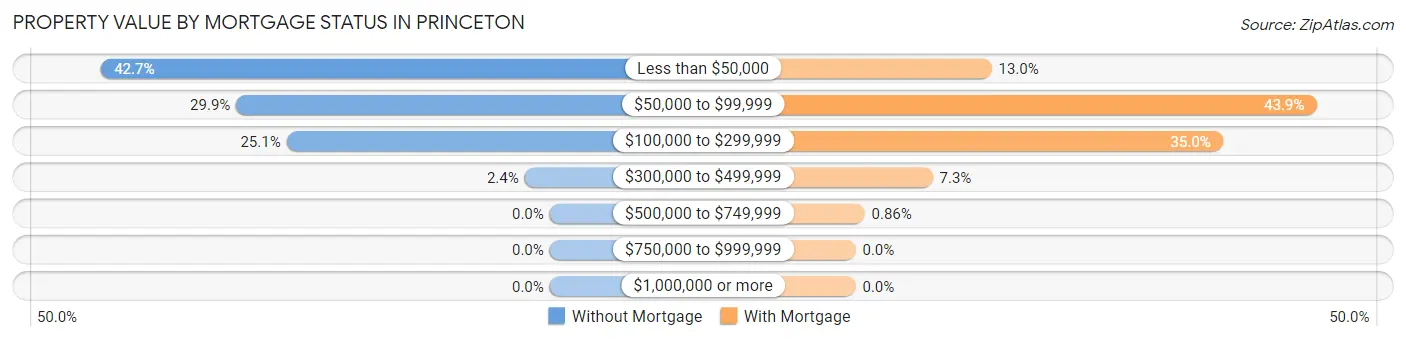
| Property Value | Without Mortgage | With Mortgage |
| Less than $50,000 | 339 (42.7%) | 90 (13.0%) |
| $50,000 to $99,999 | 237 (29.8%) | 305 (43.9%) |
| $100,000 to $299,999 | 199 (25.1%) | 243 (35.0%) |
| $300,000 to $499,999 | 19 (2.4%) | 51 (7.3%) |
| $500,000 to $749,999 | 0 (0.0%) | 6 (0.9%) |
| $750,000 to $999,999 | 0 (0.0%) | 0 (0.0%) |
| $1,000,000 or more | 0 (0.0%) | 0 (0.0%) |
| Total | 794 (100.0%) | 695 (100.0%) |
Household Income by Mortgage Status in Princeton
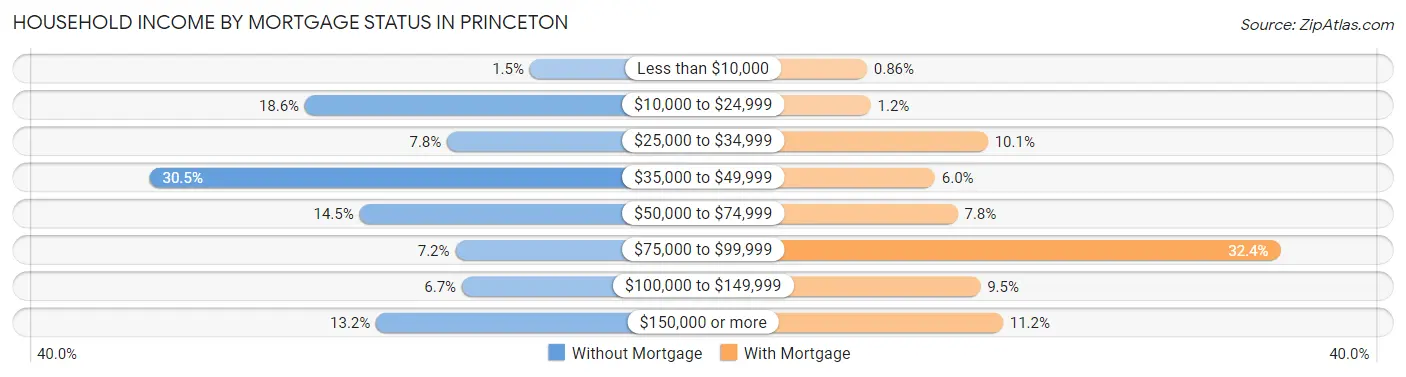
| Household Income | Without Mortgage | With Mortgage |
| Less than $10,000 | 12 (1.5%) | 6 (0.9%) |
| $10,000 to $24,999 | 148 (18.6%) | 8 (1.1%) |
| $25,000 to $34,999 | 62 (7.8%) | 70 (10.1%) |
| $35,000 to $49,999 | 242 (30.5%) | 42 (6.0%) |
| $50,000 to $74,999 | 115 (14.5%) | 54 (7.8%) |
| $75,000 to $99,999 | 57 (7.2%) | 225 (32.4%) |
| $100,000 to $149,999 | 53 (6.7%) | 66 (9.5%) |
| $150,000 or more | 105 (13.2%) | 78 (11.2%) |
| Total | 794 (100.0%) | 695 (100.0%) |
Property Value to Household Income Ratio in Princeton
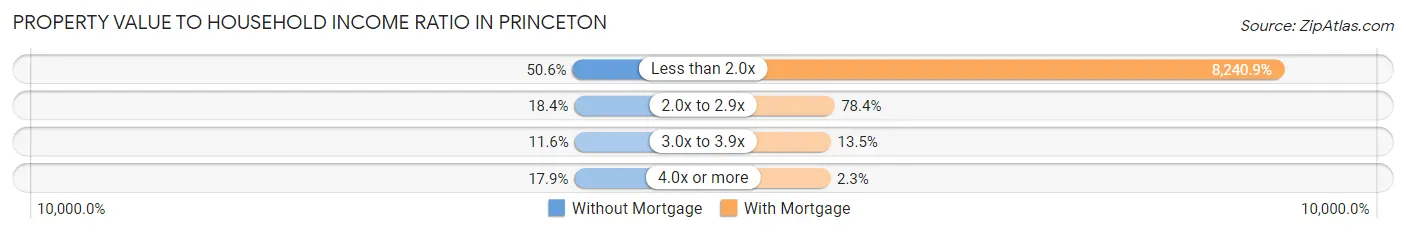
| Value-to-Income Ratio | Without Mortgage | With Mortgage |
| Less than 2.0x | 402 (50.6%) | 57,274 (8,240.9%) |
| 2.0x to 2.9x | 146 (18.4%) | 545 (78.4%) |
| 3.0x to 3.9x | 92 (11.6%) | 94 (13.5%) |
| 4.0x or more | 142 (17.9%) | 16 (2.3%) |
| Total | 794 (100.0%) | 695 (100.0%) |
Real Estate Taxes by Mortgage Status in Princeton
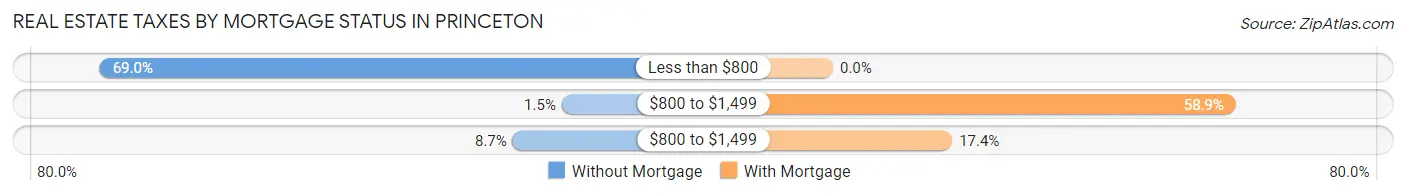
| Property Taxes | Without Mortgage | With Mortgage |
| Less than $800 | 548 (69.0%) | 0 (0.0%) |
| $800 to $1,499 | 12 (1.5%) | 409 (58.9%) |
| $800 to $1,499 | 69 (8.7%) | 121 (17.4%) |
| Total | 794 (100.0%) | 695 (100.0%) |
Health & Disability in Princeton
Health Insurance Coverage by Age in Princeton
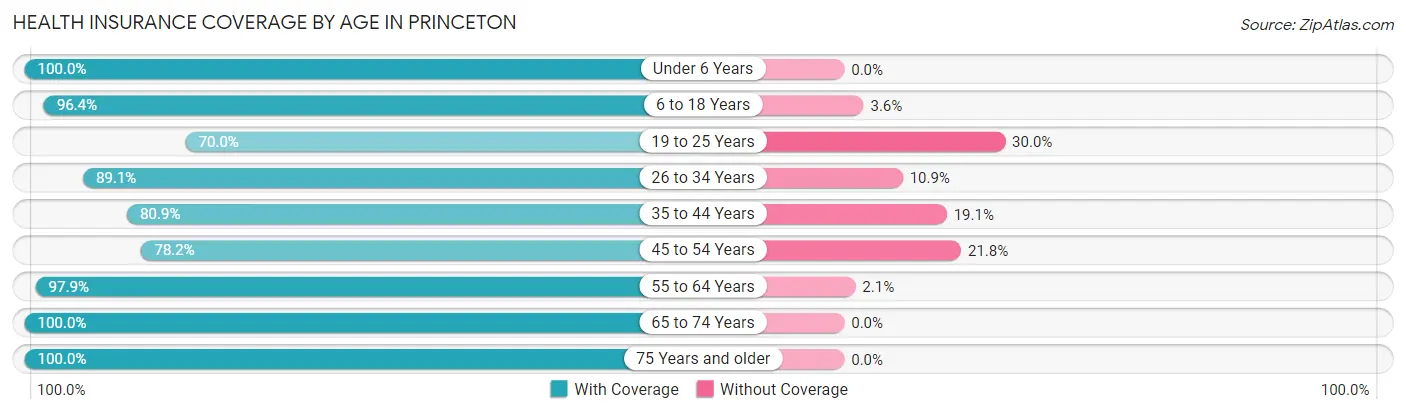
| Age Bracket | With Coverage | Without Coverage |
| Under 6 Years | 574 (100.0%) | 0 (0.0%) |
| 6 to 18 Years | 1,128 (96.4%) | 42 (3.6%) |
| 19 to 25 Years | 329 (70.0%) | 141 (30.0%) |
| 26 to 34 Years | 491 (89.1%) | 60 (10.9%) |
| 35 to 44 Years | 555 (80.9%) | 131 (19.1%) |
| 45 to 54 Years | 593 (78.2%) | 165 (21.8%) |
| 55 to 64 Years | 709 (97.9%) | 15 (2.1%) |
| 65 to 74 Years | 634 (100.0%) | 0 (0.0%) |
| 75 Years and older | 558 (100.0%) | 0 (0.0%) |
| Total | 5,571 (91.0%) | 554 (9.0%) |
Health Insurance Coverage by Citizenship Status in Princeton
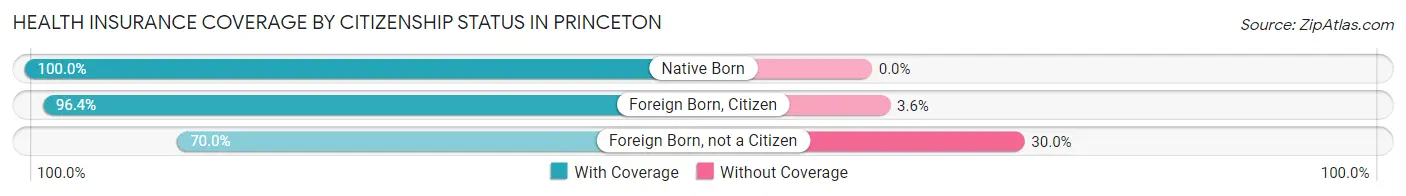
| Citizenship Status | With Coverage | Without Coverage |
| Native Born | 574 (100.0%) | 0 (0.0%) |
| Foreign Born, Citizen | 1,128 (96.4%) | 42 (3.6%) |
| Foreign Born, not a Citizen | 329 (70.0%) | 141 (30.0%) |
Health Insurance Coverage by Household Income in Princeton
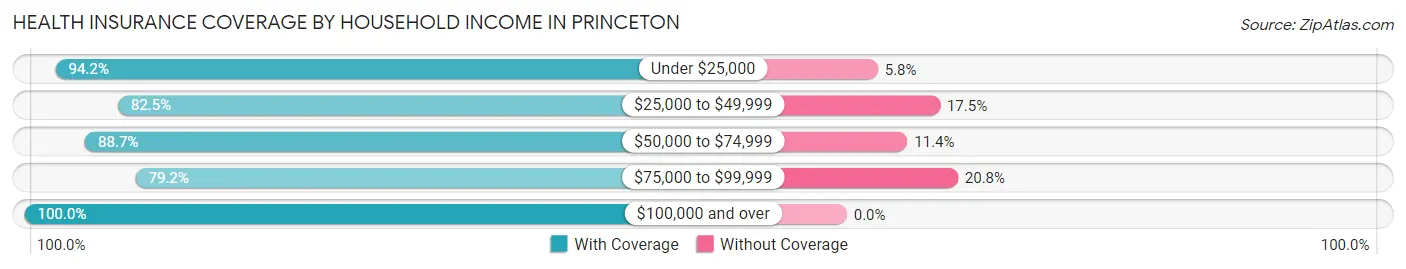
| Household Income | With Coverage | Without Coverage |
| Under $25,000 | 1,056 (94.2%) | 65 (5.8%) |
| $25,000 to $49,999 | 1,106 (82.5%) | 234 (17.5%) |
| $50,000 to $74,999 | 1,132 (88.6%) | 145 (11.4%) |
| $75,000 to $99,999 | 411 (79.2%) | 108 (20.8%) |
| $100,000 and over | 1,866 (100.0%) | 0 (0.0%) |
Public vs Private Health Insurance Coverage by Age in Princeton
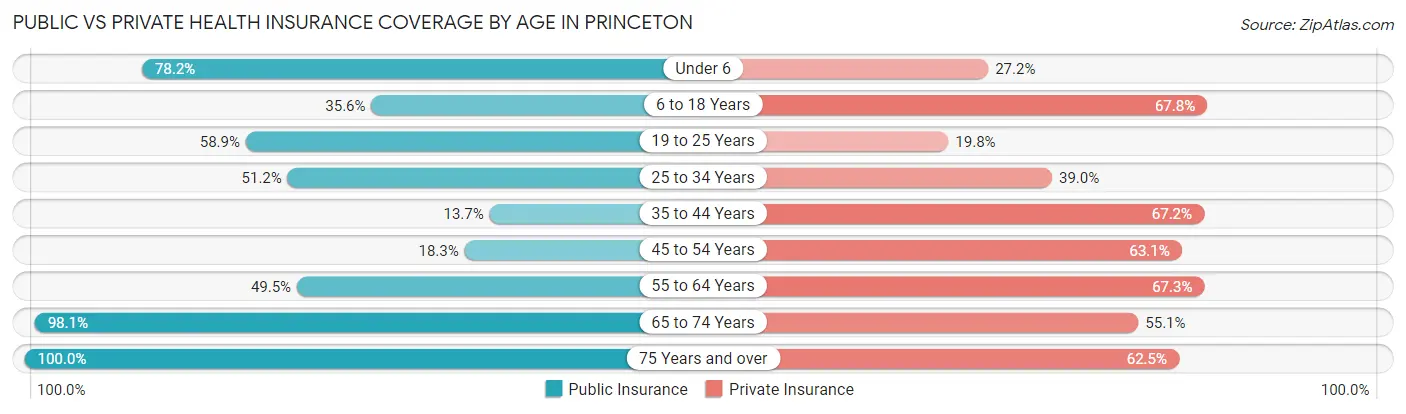
| Age Bracket | Public Insurance | Private Insurance |
| Under 6 | 449 (78.2%) | 156 (27.2%) |
| 6 to 18 Years | 417 (35.6%) | 793 (67.8%) |
| 19 to 25 Years | 277 (58.9%) | 93 (19.8%) |
| 25 to 34 Years | 282 (51.2%) | 215 (39.0%) |
| 35 to 44 Years | 94 (13.7%) | 461 (67.2%) |
| 45 to 54 Years | 139 (18.3%) | 478 (63.1%) |
| 55 to 64 Years | 358 (49.4%) | 487 (67.3%) |
| 65 to 74 Years | 622 (98.1%) | 349 (55.0%) |
| 75 Years and over | 558 (100.0%) | 349 (62.5%) |
| Total | 3,196 (52.2%) | 3,381 (55.2%) |
Disability Status by Sex by Age in Princeton
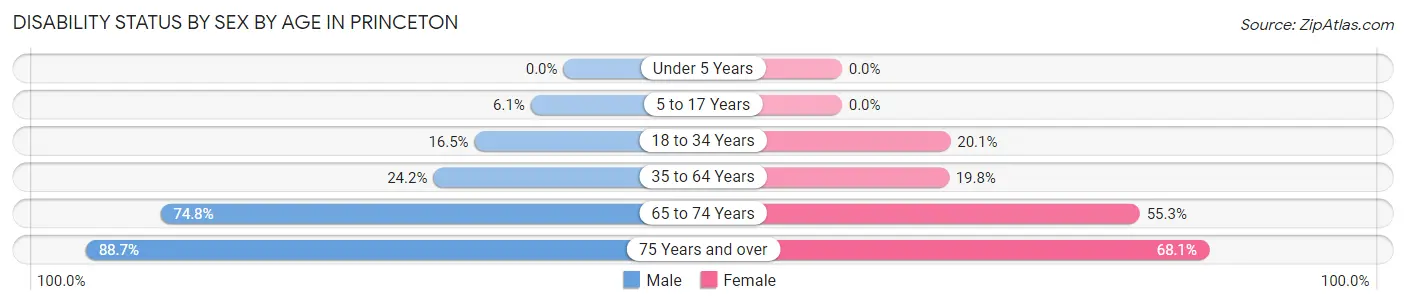
| Age Bracket | Male | Female |
| Under 5 Years | 0 (0.0%) | 0 (0.0%) |
| 5 to 17 Years | 39 (6.1%) | 0 (0.0%) |
| 18 to 34 Years | 82 (16.5%) | 146 (20.1%) |
| 35 to 64 Years | 285 (24.1%) | 196 (19.8%) |
| 65 to 74 Years | 178 (74.8%) | 219 (55.3%) |
| 75 Years and over | 125 (88.6%) | 284 (68.1%) |
Disability Class by Sex by Age in Princeton
Disability Class: Hearing Difficulty
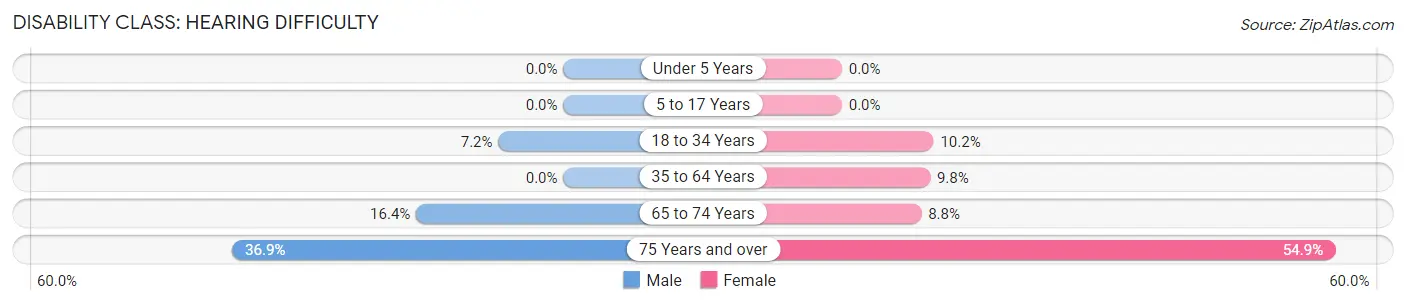
| Age Bracket | Male | Female |
| Under 5 Years | 0 (0.0%) | 0 (0.0%) |
| 5 to 17 Years | 0 (0.0%) | 0 (0.0%) |
| 18 to 34 Years | 36 (7.2%) | 74 (10.2%) |
| 35 to 64 Years | 0 (0.0%) | 97 (9.8%) |
| 65 to 74 Years | 39 (16.4%) | 35 (8.8%) |
| 75 Years and over | 52 (36.9%) | 229 (54.9%) |
Disability Class: Vision Difficulty
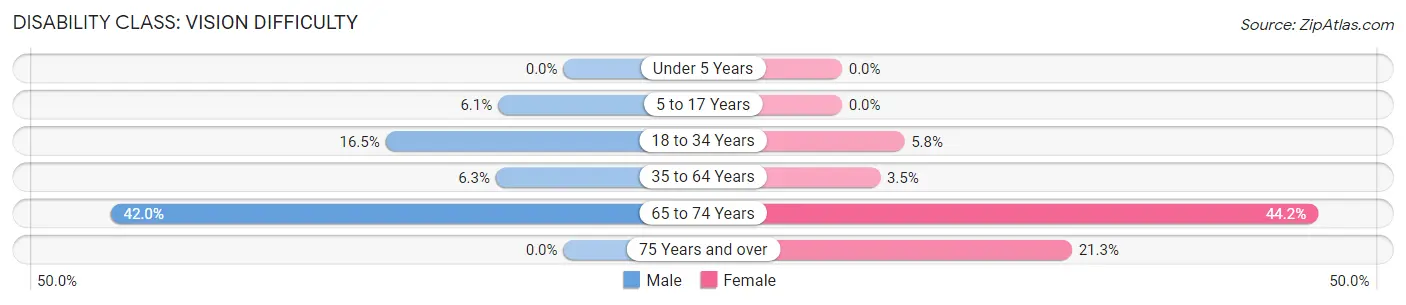
| Age Bracket | Male | Female |
| Under 5 Years | 0 (0.0%) | 0 (0.0%) |
| 5 to 17 Years | 39 (6.1%) | 0 (0.0%) |
| 18 to 34 Years | 82 (16.5%) | 42 (5.8%) |
| 35 to 64 Years | 74 (6.3%) | 35 (3.5%) |
| 65 to 74 Years | 100 (42.0%) | 175 (44.2%) |
| 75 Years and over | 0 (0.0%) | 89 (21.3%) |
Disability Class: Cognitive Difficulty
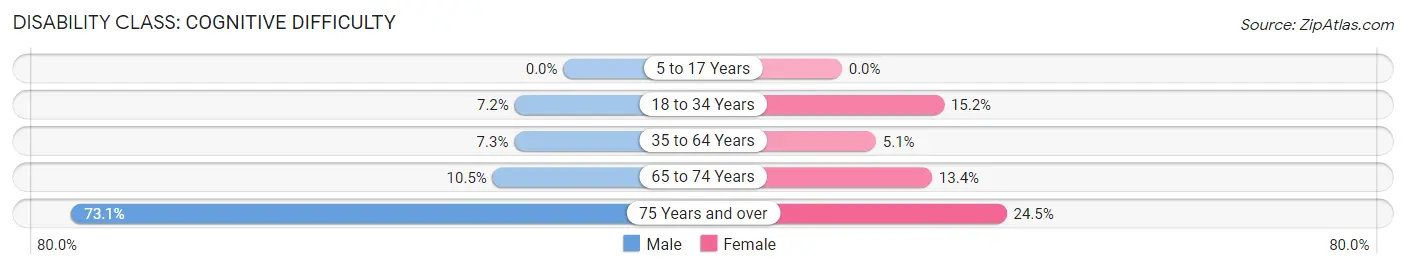
| Age Bracket | Male | Female |
| 5 to 17 Years | 0 (0.0%) | 0 (0.0%) |
| 18 to 34 Years | 36 (7.2%) | 110 (15.2%) |
| 35 to 64 Years | 86 (7.3%) | 50 (5.1%) |
| 65 to 74 Years | 25 (10.5%) | 53 (13.4%) |
| 75 Years and over | 103 (73.1%) | 102 (24.5%) |
Disability Class: Ambulatory Difficulty
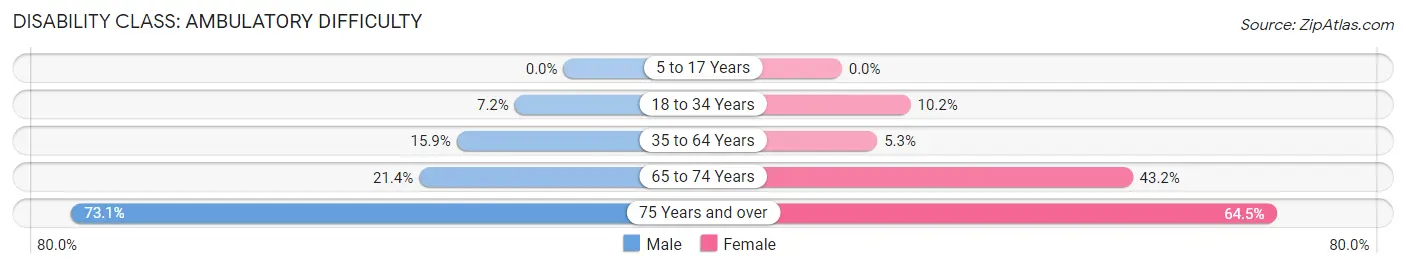
| Age Bracket | Male | Female |
| 5 to 17 Years | 0 (0.0%) | 0 (0.0%) |
| 18 to 34 Years | 36 (7.2%) | 74 (10.2%) |
| 35 to 64 Years | 187 (15.9%) | 52 (5.3%) |
| 65 to 74 Years | 51 (21.4%) | 171 (43.2%) |
| 75 Years and over | 103 (73.1%) | 269 (64.5%) |
Disability Class: Self-Care Difficulty
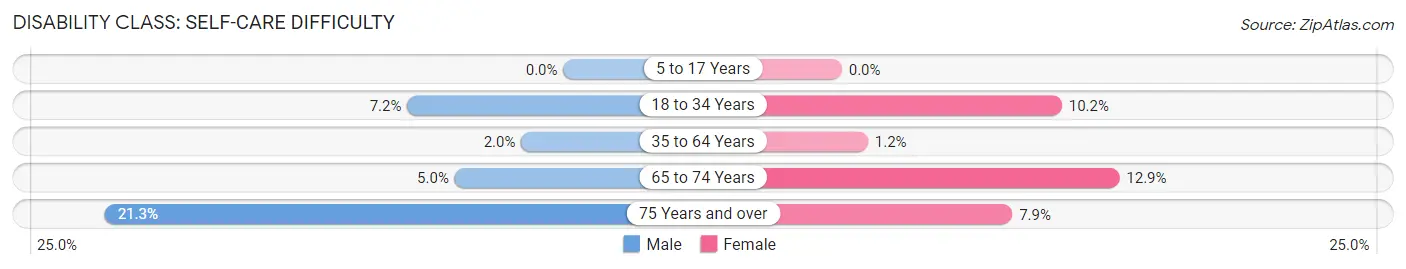
| Age Bracket | Male | Female |
| 5 to 17 Years | 0 (0.0%) | 0 (0.0%) |
| 18 to 34 Years | 36 (7.2%) | 74 (10.2%) |
| 35 to 64 Years | 23 (1.9%) | 12 (1.2%) |
| 65 to 74 Years | 12 (5.0%) | 51 (12.9%) |
| 75 Years and over | 30 (21.3%) | 33 (7.9%) |
Technology Access in Princeton
Computing Device Access in Princeton
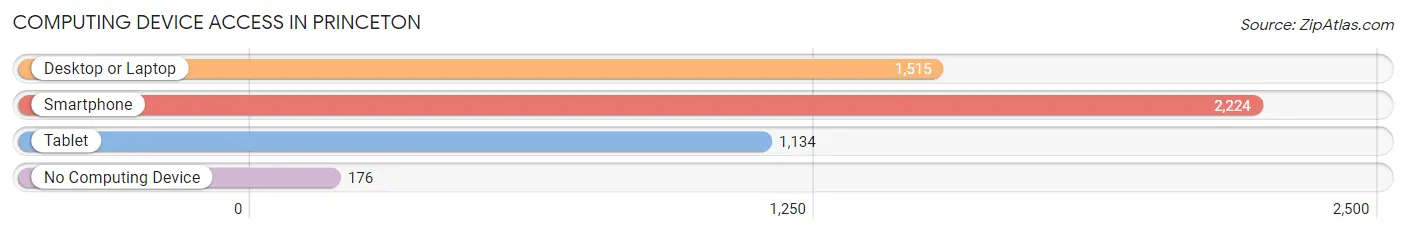
| Device Type | # Households | % Households |
| Desktop or Laptop | 1,515 | 60.9% |
| Smartphone | 2,224 | 89.4% |
| Tablet | 1,134 | 45.6% |
| No Computing Device | 176 | 7.1% |
| Total | 2,487 | 100.0% |
Internet Access in Princeton
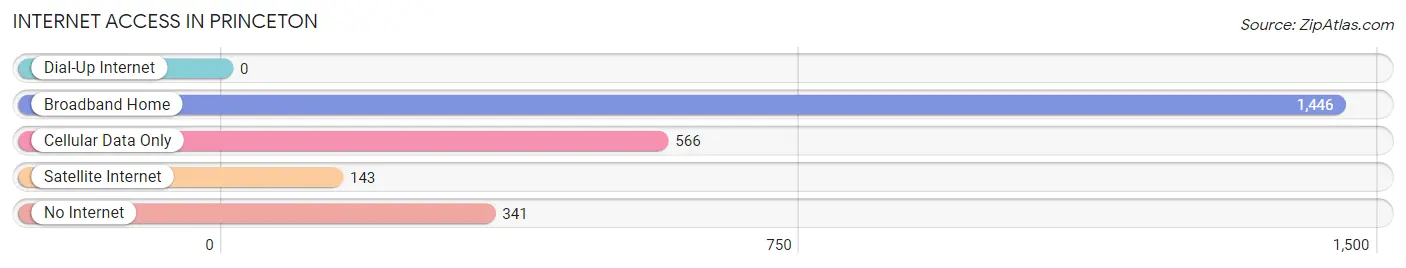
| Internet Type | # Households | % Households |
| Dial-Up Internet | 0 | 0.0% |
| Broadband Home | 1,446 | 58.1% |
| Cellular Data Only | 566 | 22.8% |
| Satellite Internet | 143 | 5.8% |
| No Internet | 341 | 13.7% |
| Total | 2,487 | 100.0% |
Princeton Summary
Princeton, Kentucky is a small city located in Caldwell County, Kentucky. It is situated in the western part of the state, about halfway between the cities of Paducah and Hopkinsville. The city has a population of approximately 2,000 people and is the county seat of Caldwell County.
History
The area that is now Princeton was first settled in the early 1800s by a group of settlers from Virginia. The town was originally known as “Caldwell’s Station” and was established in 1819. The town was renamed Princeton in 1820 in honor of the Revolutionary War hero, General Hugh Mercer.
The town was incorporated in 1837 and was the county seat of Caldwell County. During the Civil War, Princeton was a major supply center for the Confederate Army. After the war, the town experienced a period of growth and prosperity.
Geography
Princeton is located in western Kentucky, about halfway between the cities of Paducah and Hopkinsville. The city is situated on the banks of the Tradewater River, which flows through the city. The city is surrounded by rolling hills and farmland.
The climate in Princeton is generally mild, with hot summers and cold winters. The average temperature in the summer is around 80 degrees Fahrenheit, while the average temperature in the winter is around 40 degrees Fahrenheit.
Economy
The economy of Princeton is largely based on agriculture and manufacturing. The city is home to several large manufacturing plants, including a paper mill, a furniture factory, and a plastics plant. The city also has a thriving agricultural sector, with many local farmers growing corn, soybeans, and other crops.
The city also has a vibrant tourism industry, with many visitors coming to the area to enjoy the city’s historic sites, outdoor activities, and cultural attractions.
Demographics
As of the 2010 census, the population of Princeton was 2,000 people. The racial makeup of the city was 95.2% White, 2.2% African American, 0.2% Native American, 0.4% Asian, and 1.9% from other races. The median household income in the city was $31,250, and the median family income was $37,500.
The city is served by the Caldwell County School District, which includes two elementary schools, one middle school, and one high school. The city also has several private schools, including a Catholic school and a Christian school.
Conclusion
Princeton, Kentucky is a small city located in Caldwell County, Kentucky. It is situated in the western part of the state, about halfway between the cities of Paducah and Hopkinsville. The city has a population of approximately 2,000 people and is the county seat of Caldwell County. The economy of Princeton is largely based on agriculture and manufacturing, and the city also has a thriving tourism industry. The city is served by the Caldwell County School District, and the racial makeup of the city is 95.2% White, 2.2% African American, 0.2% Native American, 0.4% Asian, and 1.9% from other races.
Common Questions
What is Per Capita Income in Princeton?
Per Capita income in Princeton is $29,853.
What is the Median Family Income in Princeton?
Median Family Income in Princeton is $54,746.
What is the Median Household income in Princeton?
Median Household Income in Princeton is $46,317.
What is Income or Wage Gap in Princeton?
Income or Wage Gap in Princeton is 32.1%.
Women in Princeton earn 67.9 cents for every dollar earned by a man.
What is Inequality or Gini Index in Princeton?
Inequality or Gini Index in Princeton is 0.51.
What is the Total Population of Princeton?
Total Population of Princeton is 6,248.
What is the Total Male Population of Princeton?
Total Male Population of Princeton is 3,018.
What is the Total Female Population of Princeton?
Total Female Population of Princeton is 3,230.
What is the Ratio of Males per 100 Females in Princeton?
There are 93.44 Males per 100 Females in Princeton.
What is the Ratio of Females per 100 Males in Princeton?
There are 107.02 Females per 100 Males in Princeton.
What is the Median Population Age in Princeton?
Median Population Age in Princeton is 40.4 Years.
What is the Average Family Size in Princeton
Average Family Size in Princeton is 3.0 People.
What is the Average Household Size in Princeton
Average Household Size in Princeton is 2.5 People.
How Large is the Labor Force in Princeton?
There are 2,601 People in the Labor Forcein in Princeton.
What is the Percentage of People in the Labor Force in Princeton?
54.1% of People are in the Labor Force in Princeton.
What is the Unemployment Rate in Princeton?
Unemployment Rate in Princeton is 3.8%.