Richmond, KY Map & Demographics
Richmond Map
Richmond Overview
$26,787
PER CAPITA INCOME
$69,651
AVG FAMILY INCOME
$45,457
AVG HOUSEHOLD INCOME
35.1%
WAGE / INCOME GAP [ % ]
64.9¢/ $1
WAGE / INCOME GAP [ $ ]
$11,702
FAMILY INCOME DEFICIT
0.45
INEQUALITY / GINI INDEX
34,883
TOTAL POPULATION
16,881
MALE POPULATION
18,002
FEMALE POPULATION
93.77
MALES / 100 FEMALES
106.64
FEMALES / 100 MALES
27.7
MEDIAN AGE
3.0
AVG FAMILY SIZE
2.2
AVG HOUSEHOLD SIZE
20,007
LABOR FORCE [ PEOPLE ]
67.7%
PERCENT IN LABOR FORCE
7.3%
UNEMPLOYMENT RATE
Richmond Zip Codes
Richmond Area Codes
Income in Richmond
Income Overview in Richmond
Per Capita Income in Richmond is $26,787, while median incomes of families and households are $69,651 and $45,457 respectively.
| Characteristic | Number | Measure |
| Per Capita Income | 34,883 | $26,787 |
| Median Family Income | 6,558 | $69,651 |
| Mean Family Income | 6,558 | $81,796 |
| Median Household Income | 14,354 | $45,457 |
| Mean Household Income | 14,354 | $63,295 |
| Income Deficit | 6,558 | $11,702 |
| Wage / Income Gap (%) | 34,883 | 35.09% |
| Wage / Income Gap ($) | 34,883 | 64.91¢ per $1 |
| Gini / Inequality Index | 34,883 | 0.45 |
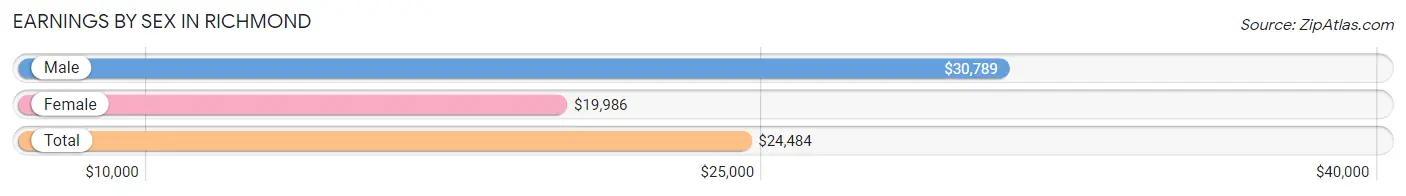
Earnings by Sex in Richmond
Average Earnings in Richmond are $24,484, $30,789 for men and $19,986 for women, a difference of 35.1%.
| Sex | Number | Average Earnings |
| Male | 10,837 (49.8%) | $30,789 |
| Female | 10,940 (50.2%) | $19,986 |
| Total | 21,777 (100.0%) | $24,484 |
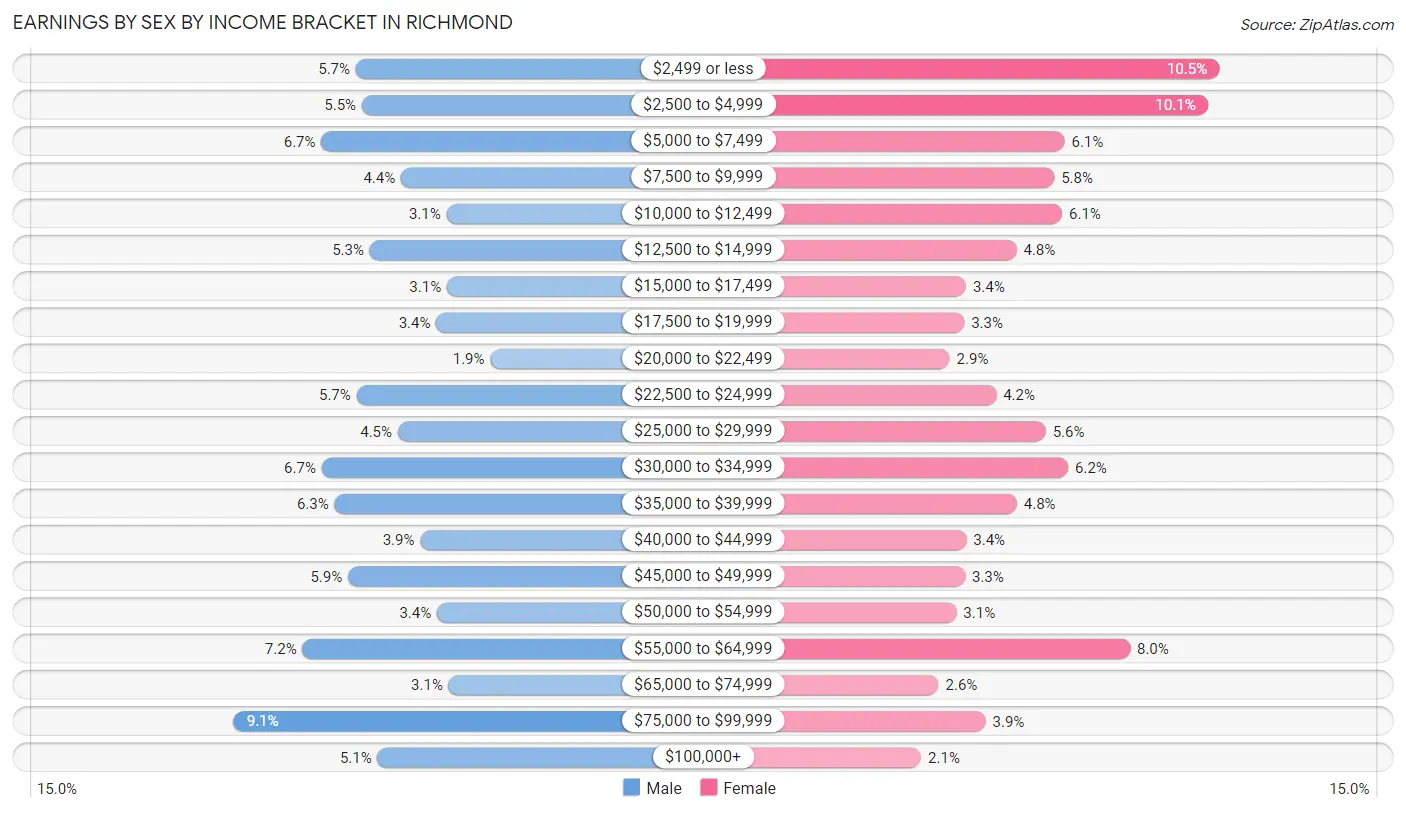
Earnings by Sex by Income Bracket in Richmond
The most common earnings brackets in Richmond are $75,000 to $99,999 for men (988 | 9.1%) and $2,499 or less for women (1,144 | 10.5%).
| Income | Male | Female |
| $2,499 or less | 617 (5.7%) | 1,144 (10.5%) |
| $2,500 to $4,999 | 598 (5.5%) | 1,109 (10.1%) |
| $5,000 to $7,499 | 722 (6.7%) | 670 (6.1%) |
| $7,500 to $9,999 | 479 (4.4%) | 638 (5.8%) |
| $10,000 to $12,499 | 340 (3.1%) | 662 (6.0%) |
| $12,500 to $14,999 | 574 (5.3%) | 522 (4.8%) |
| $15,000 to $17,499 | 339 (3.1%) | 366 (3.4%) |
| $17,500 to $19,999 | 372 (3.4%) | 361 (3.3%) |
| $20,000 to $22,499 | 207 (1.9%) | 316 (2.9%) |
| $22,500 to $24,999 | 614 (5.7%) | 460 (4.2%) |
| $25,000 to $29,999 | 489 (4.5%) | 612 (5.6%) |
| $30,000 to $34,999 | 721 (6.7%) | 680 (6.2%) |
| $35,000 to $39,999 | 682 (6.3%) | 523 (4.8%) |
| $40,000 to $44,999 | 421 (3.9%) | 368 (3.4%) |
| $45,000 to $49,999 | 640 (5.9%) | 363 (3.3%) |
| $50,000 to $54,999 | 370 (3.4%) | 337 (3.1%) |
| $55,000 to $64,999 | 779 (7.2%) | 871 (8.0%) |
| $65,000 to $74,999 | 334 (3.1%) | 282 (2.6%) |
| $75,000 to $99,999 | 988 (9.1%) | 427 (3.9%) |
| $100,000+ | 551 (5.1%) | 229 (2.1%) |
| Total | 10,837 (100.0%) | 10,940 (100.0%) |
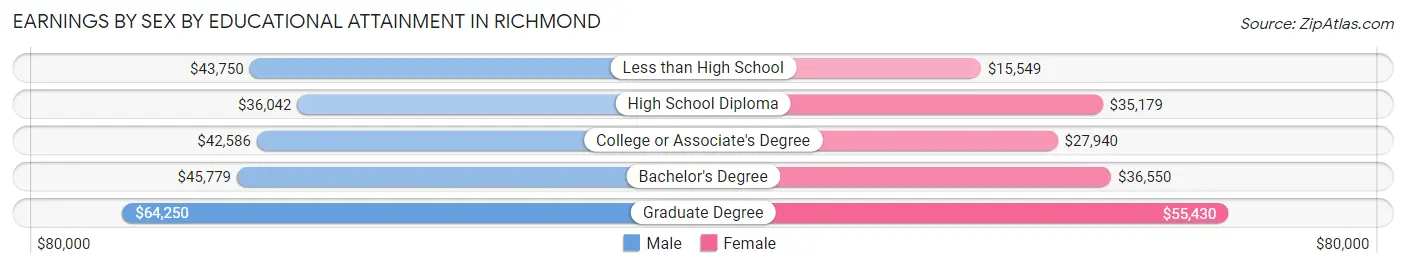
Earnings by Sex by Educational Attainment in Richmond
Average earnings in Richmond are $42,634 for men and $34,230 for women, a difference of 19.7%. Men with an educational attainment of graduate degree enjoy the highest average annual earnings of $64,250, while those with high school diploma education earn the least with $36,042. Women with an educational attainment of graduate degree earn the most with the average annual earnings of $55,430, while those with less than high school education have the smallest earnings of $15,549.
| Educational Attainment | Male Income | Female Income |
| Less than High School | $43,750 | $15,549 |
| High School Diploma | $36,042 | $35,179 |
| College or Associate's Degree | $42,586 | $27,940 |
| Bachelor's Degree | $45,779 | $36,550 |
| Graduate Degree | $64,250 | $55,430 |
| Total | $42,634 | $34,230 |
Family Income in Richmond
Family Income Brackets in Richmond
According to the Richmond family income data, there are 1,246 families falling into the $50,000 to $74,999 income range, which is the most common income bracket and makes up 19.0% of all families. Conversely, the $10,000 to $14,999 income bracket is the least frequent group with only 262 families (4.0%) belonging to this category.
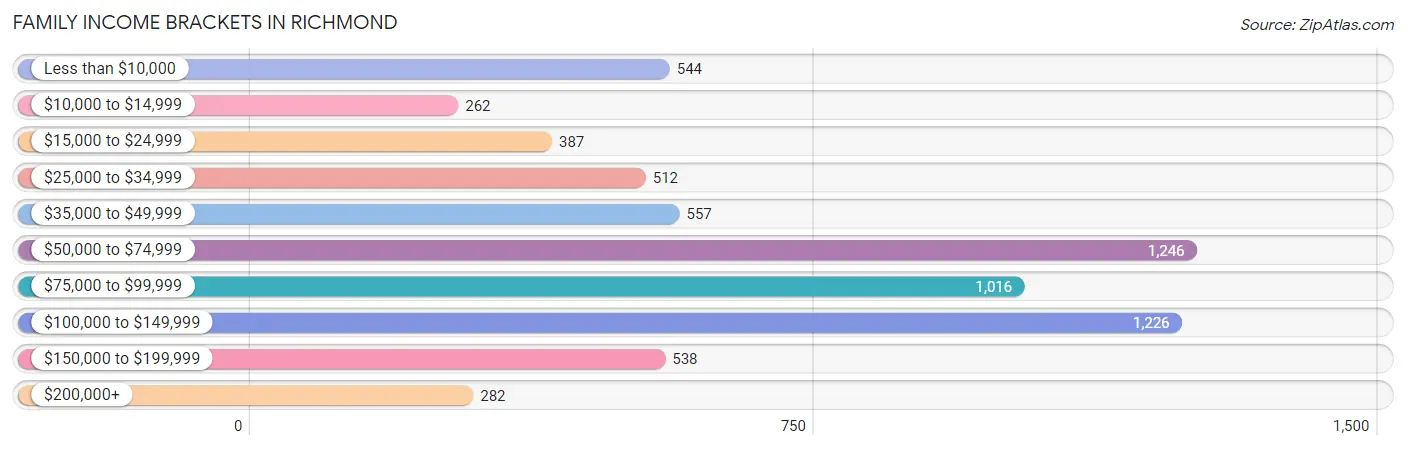
| Income Bracket | # Families | % Families |
| Less than $10,000 | 544 | 8.3% |
| $10,000 to $14,999 | 262 | 4.0% |
| $15,000 to $24,999 | 387 | 5.9% |
| $25,000 to $34,999 | 512 | 7.8% |
| $35,000 to $49,999 | 557 | 8.5% |
| $50,000 to $74,999 | 1,246 | 19.0% |
| $75,000 to $99,999 | 1,016 | 15.5% |
| $100,000 to $149,999 | 1,226 | 18.7% |
| $150,000 to $199,999 | 538 | 8.2% |
| $200,000+ | 282 | 4.3% |
Family Income by Famaliy Size in Richmond
7+ person families (129 | 2.0%) account for the highest median family income in Richmond with $150,369 per family, while 2-person families (3,233 | 49.3%) have the highest median income of $27,726 per family member.
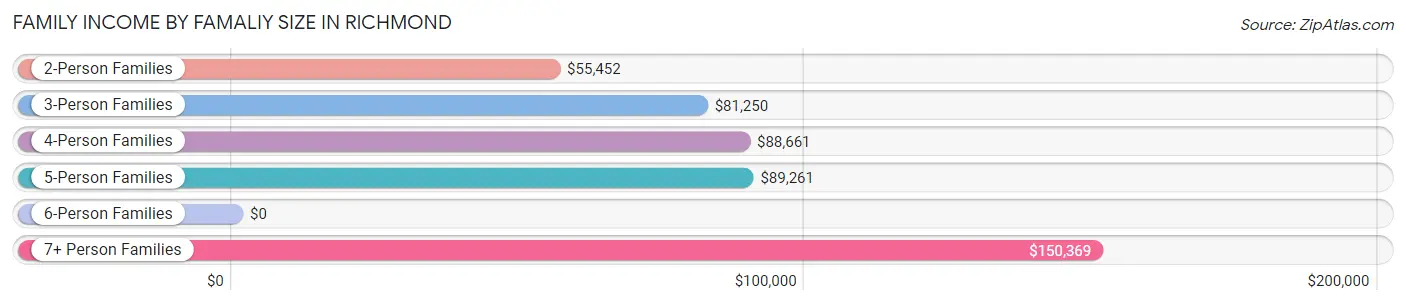
| Income Bracket | # Families | Median Income |
| 2-Person Families | 3,233 (49.3%) | $55,452 |
| 3-Person Families | 1,670 (25.5%) | $81,250 |
| 4-Person Families | 1,064 (16.2%) | $88,661 |
| 5-Person Families | 327 (5.0%) | $89,261 |
| 6-Person Families | 135 (2.1%) | $0 |
| 7+ Person Families | 129 (2.0%) | $150,369 |
| Total | 6,558 (100.0%) | $69,651 |
Family Income by Number of Earners in Richmond
The median family income in Richmond is $69,651, with families comprising 3+ earners (829) having the highest median family income of $126,082, while families with no earners (823) have the lowest median family income of $20,031, accounting for 12.6% and 12.6% of families, respectively.
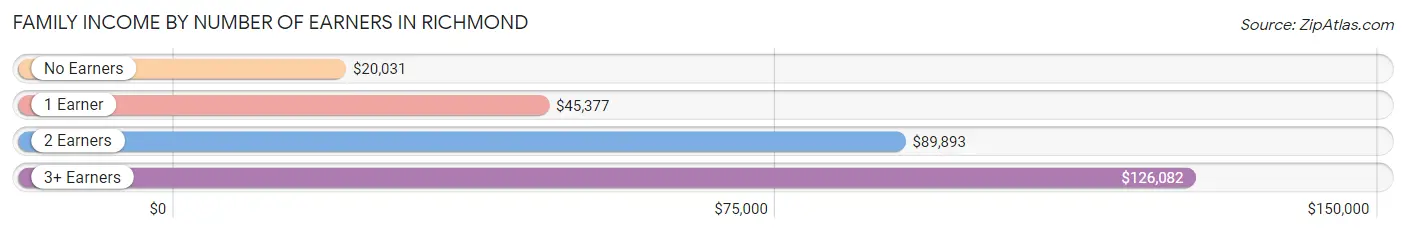
| Number of Earners | # Families | Median Income |
| No Earners | 823 (12.6%) | $20,031 |
| 1 Earner | 2,271 (34.6%) | $45,377 |
| 2 Earners | 2,635 (40.2%) | $89,893 |
| 3+ Earners | 829 (12.6%) | $126,082 |
| Total | 6,558 (100.0%) | $69,651 |
Household Income in Richmond
Household Income Brackets in Richmond
With 2,325 households falling in the category, the $35,000 to $49,999 income range is the most frequent in Richmond, accounting for 16.2% of all households. In contrast, only 359 households (2.5%) fall into the $200,000+ income bracket, making it the least populous group.
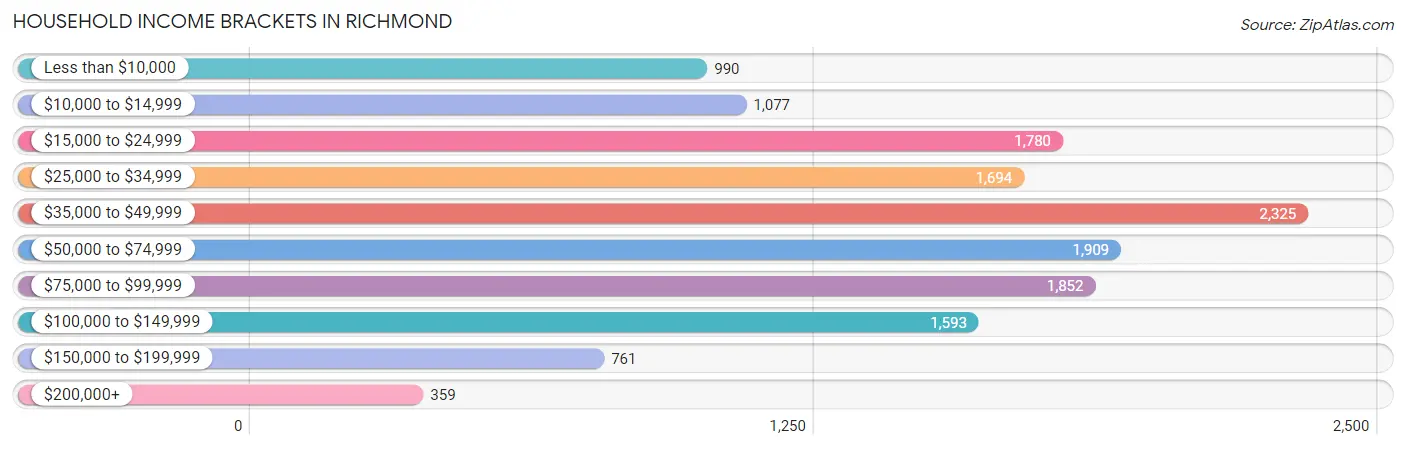
| Income Bracket | # Households | % Households |
| Less than $10,000 | 990 | 6.9% |
| $10,000 to $14,999 | 1,077 | 7.5% |
| $15,000 to $24,999 | 1,780 | 12.4% |
| $25,000 to $34,999 | 1,694 | 11.8% |
| $35,000 to $49,999 | 2,325 | 16.2% |
| $50,000 to $74,999 | 1,909 | 13.3% |
| $75,000 to $99,999 | 1,852 | 12.9% |
| $100,000 to $149,999 | 1,593 | 11.1% |
| $150,000 to $199,999 | 761 | 5.3% |
| $200,000+ | 359 | 2.5% |
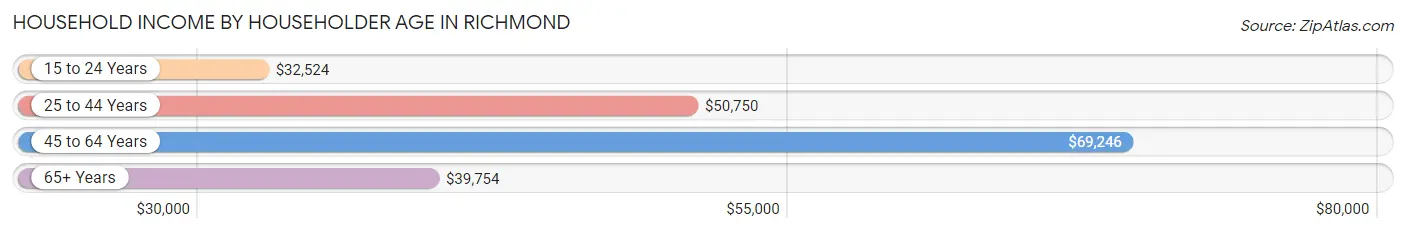
Household Income by Householder Age in Richmond
The median household income in Richmond is $45,457, with the highest median household income of $69,246 found in the 45 to 64 years age bracket for the primary householder. A total of 3,632 households (25.3%) fall into this category. Meanwhile, the 15 to 24 years age bracket for the primary householder has the lowest median household income of $32,524, with 2,895 households (20.2%) in this group.
| Income Bracket | # Households | Median Income |
| 15 to 24 Years | 2,895 (20.2%) | $32,524 |
| 25 to 44 Years | 5,151 (35.9%) | $50,750 |
| 45 to 64 Years | 3,632 (25.3%) | $69,246 |
| 65+ Years | 2,676 (18.6%) | $39,754 |
| Total | 14,354 (100.0%) | $45,457 |
Poverty in Richmond
Income Below Poverty by Sex and Age in Richmond
With 21.0% poverty level for males and 23.5% for females among the residents of Richmond, 18 to 24 year old males and 18 to 24 year old females are the most vulnerable to poverty, with 1,296 males (41.2%) and 1,838 females (59.0%) in their respective age groups living below the poverty level.
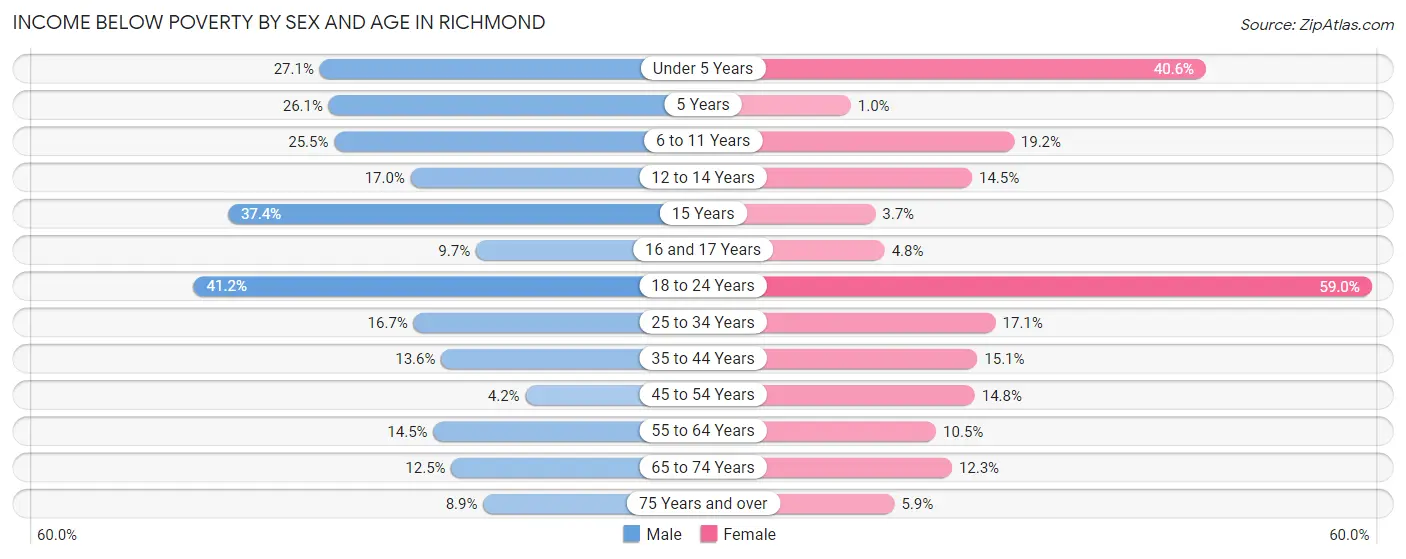
| Age Bracket | Male | Female |
| Under 5 Years | 319 (27.1%) | 223 (40.6%) |
| 5 Years | 35 (26.1%) | 1 (1.0%) |
| 6 to 11 Years | 249 (25.5%) | 206 (19.2%) |
| 12 to 14 Years | 68 (17.0%) | 82 (14.5%) |
| 15 Years | 31 (37.3%) | 8 (3.7%) |
| 16 and 17 Years | 29 (9.7%) | 15 (4.8%) |
| 18 to 24 Years | 1,296 (41.2%) | 1,838 (59.0%) |
| 25 to 34 Years | 519 (16.7%) | 409 (17.1%) |
| 35 to 44 Years | 264 (13.6%) | 325 (15.1%) |
| 45 to 54 Years | 59 (4.2%) | 226 (14.8%) |
| 55 to 64 Years | 179 (14.5%) | 146 (10.5%) |
| 65 to 74 Years | 108 (12.5%) | 146 (12.3%) |
| 75 Years and over | 44 (8.9%) | 68 (5.9%) |
| Total | 3,200 (21.0%) | 3,693 (23.5%) |
Income Above Poverty by Sex and Age in Richmond
According to the poverty statistics in Richmond, males aged 45 to 54 years and females aged 5 years are the age groups that are most secure financially, with 95.8% of males and 99.0% of females in these age groups living above the poverty line.
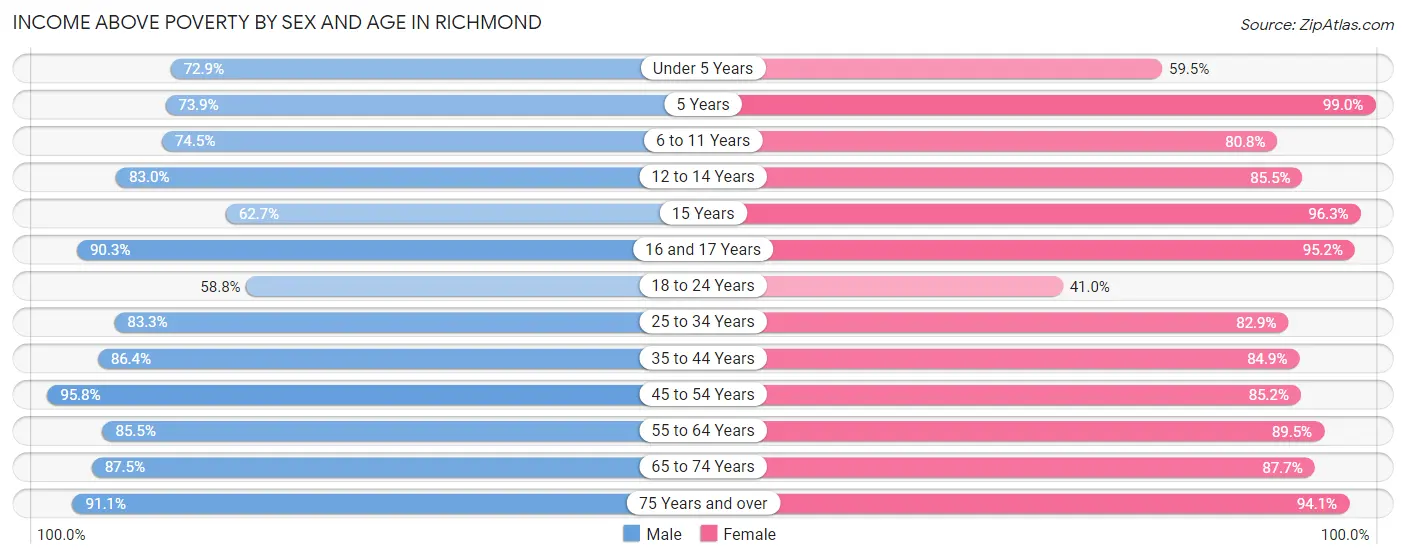
| Age Bracket | Male | Female |
| Under 5 Years | 857 (72.9%) | 327 (59.5%) |
| 5 Years | 99 (73.9%) | 98 (99.0%) |
| 6 to 11 Years | 727 (74.5%) | 869 (80.8%) |
| 12 to 14 Years | 332 (83.0%) | 483 (85.5%) |
| 15 Years | 52 (62.6%) | 206 (96.3%) |
| 16 and 17 Years | 269 (90.3%) | 299 (95.2%) |
| 18 to 24 Years | 1,852 (58.8%) | 1,277 (41.0%) |
| 25 to 34 Years | 2,595 (83.3%) | 1,979 (82.9%) |
| 35 to 44 Years | 1,679 (86.4%) | 1,828 (84.9%) |
| 45 to 54 Years | 1,339 (95.8%) | 1,300 (85.2%) |
| 55 to 64 Years | 1,058 (85.5%) | 1,243 (89.5%) |
| 65 to 74 Years | 758 (87.5%) | 1,044 (87.7%) |
| 75 Years and over | 449 (91.1%) | 1,090 (94.1%) |
| Total | 12,066 (79.0%) | 12,043 (76.5%) |
Income Below Poverty Among Married-Couple Families in Richmond
The poverty statistics for married-couple families in Richmond show that 6.3% or 268 of the total 4,241 families live below the poverty line. Families with 3 or 4 children have the highest poverty rate of 24.6%, comprising of 72 families. On the other hand, families with 5 or more children have the lowest poverty rate of 0.0%, which includes 0 families.
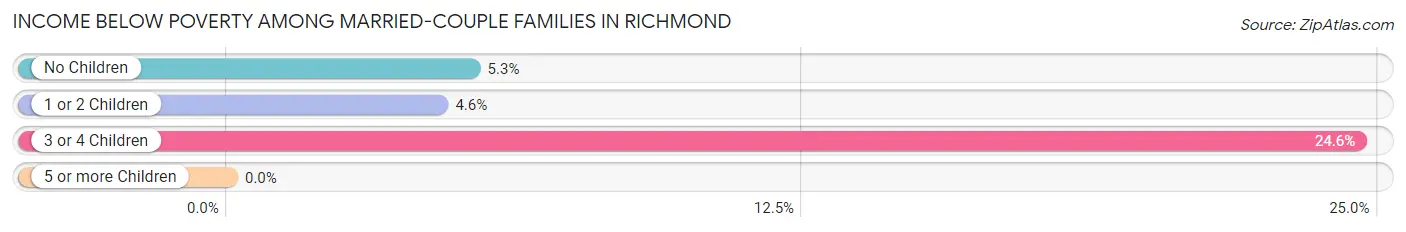
| Children | Above Poverty | Below Poverty |
| No Children | 2,366 (94.7%) | 132 (5.3%) |
| 1 or 2 Children | 1,332 (95.4%) | 64 (4.6%) |
| 3 or 4 Children | 221 (75.4%) | 72 (24.6%) |
| 5 or more Children | 54 (100.0%) | 0 (0.0%) |
| Total | 3,973 (93.7%) | 268 (6.3%) |
Income Below Poverty Among Single-Parent Households in Richmond
According to the poverty data in Richmond, 33.4% or 149 single-father households and 34.5% or 645 single-mother households are living below the poverty line. Among single-father households, those with 3 or 4 children have the highest poverty rate, with 47 households (100.0%) experiencing poverty. Likewise, among single-mother households, those with 3 or 4 children have the highest poverty rate, with 81 households (61.8%) falling below the poverty line.
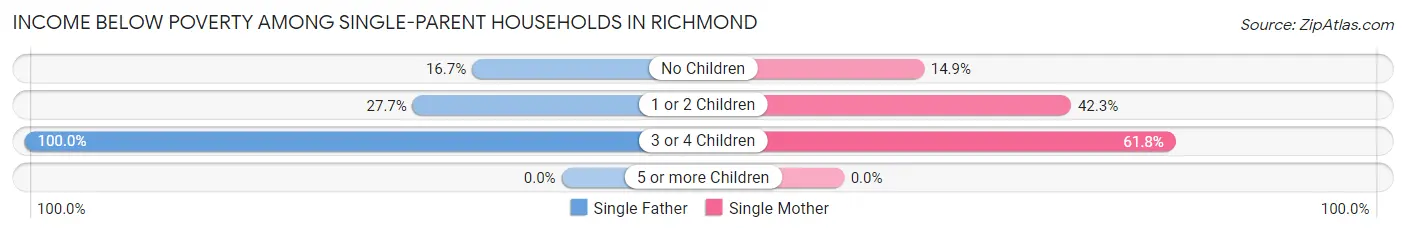
| Children | Single Father | Single Mother |
| No Children | 13 (16.7%) | 94 (14.9%) |
| 1 or 2 Children | 89 (27.7%) | 470 (42.3%) |
| 3 or 4 Children | 47 (100.0%) | 81 (61.8%) |
| 5 or more Children | 0 (0.0%) | 0 (0.0%) |
| Total | 149 (33.4%) | 645 (34.5%) |
Income Below Poverty Among Married-Couple vs Single-Parent Households in Richmond
The poverty data for Richmond shows that 268 of the married-couple family households (6.3%) and 794 of the single-parent households (34.3%) are living below the poverty level. Within the married-couple family households, those with 3 or 4 children have the highest poverty rate, with 72 households (24.6%) falling below the poverty line. Among the single-parent households, those with 3 or 4 children have the highest poverty rate, with 128 household (71.9%) living below poverty.
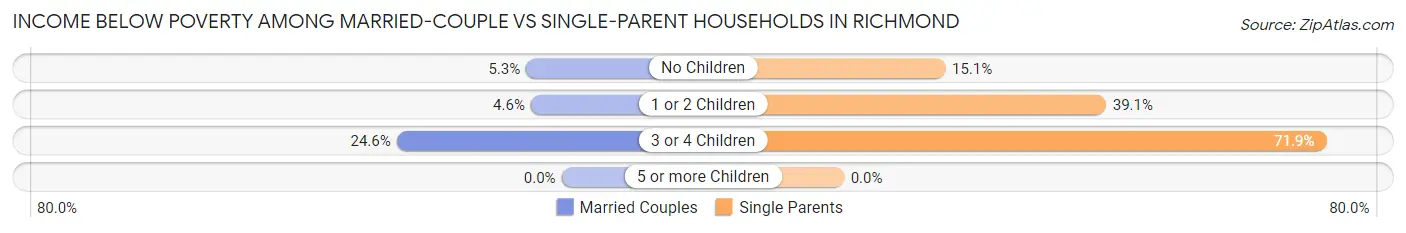
| Children | Married-Couple Families | Single-Parent Households |
| No Children | 132 (5.3%) | 107 (15.1%) |
| 1 or 2 Children | 64 (4.6%) | 559 (39.1%) |
| 3 or 4 Children | 72 (24.6%) | 128 (71.9%) |
| 5 or more Children | 0 (0.0%) | 0 (0.0%) |
| Total | 268 (6.3%) | 794 (34.3%) |
Race in Richmond
The most populous races in Richmond are White / Caucasian (30,068 | 86.2%), Black / African American (2,126 | 6.1%), and Two or more Races (1,557 | 4.5%).
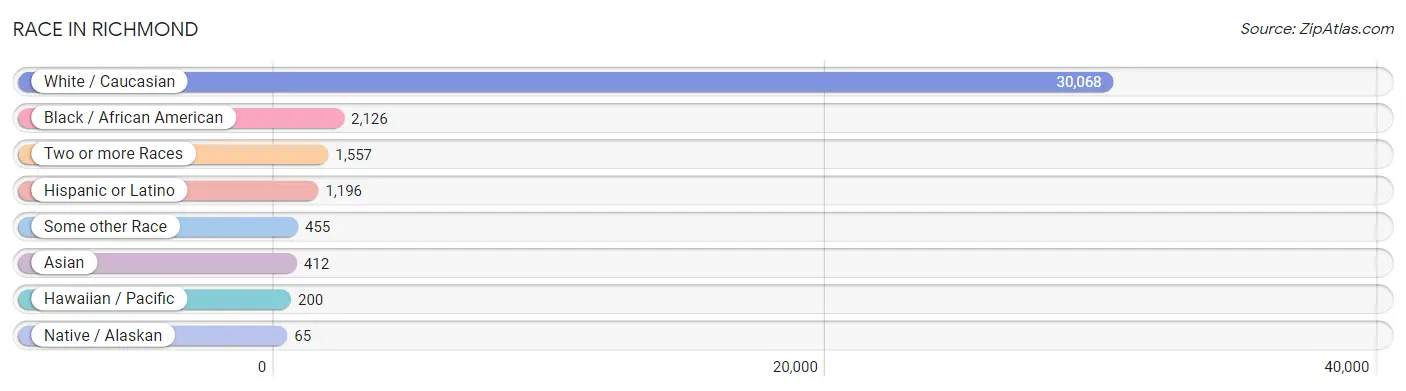
| Race | # Population | % Population |
| Asian | 412 | 1.2% |
| Black / African American | 2,126 | 6.1% |
| Hawaiian / Pacific | 200 | 0.6% |
| Hispanic or Latino | 1,196 | 3.4% |
| Native / Alaskan | 65 | 0.2% |
| White / Caucasian | 30,068 | 86.2% |
| Two or more Races | 1,557 | 4.5% |
| Some other Race | 455 | 1.3% |
| Total | 34,883 | 100.0% |
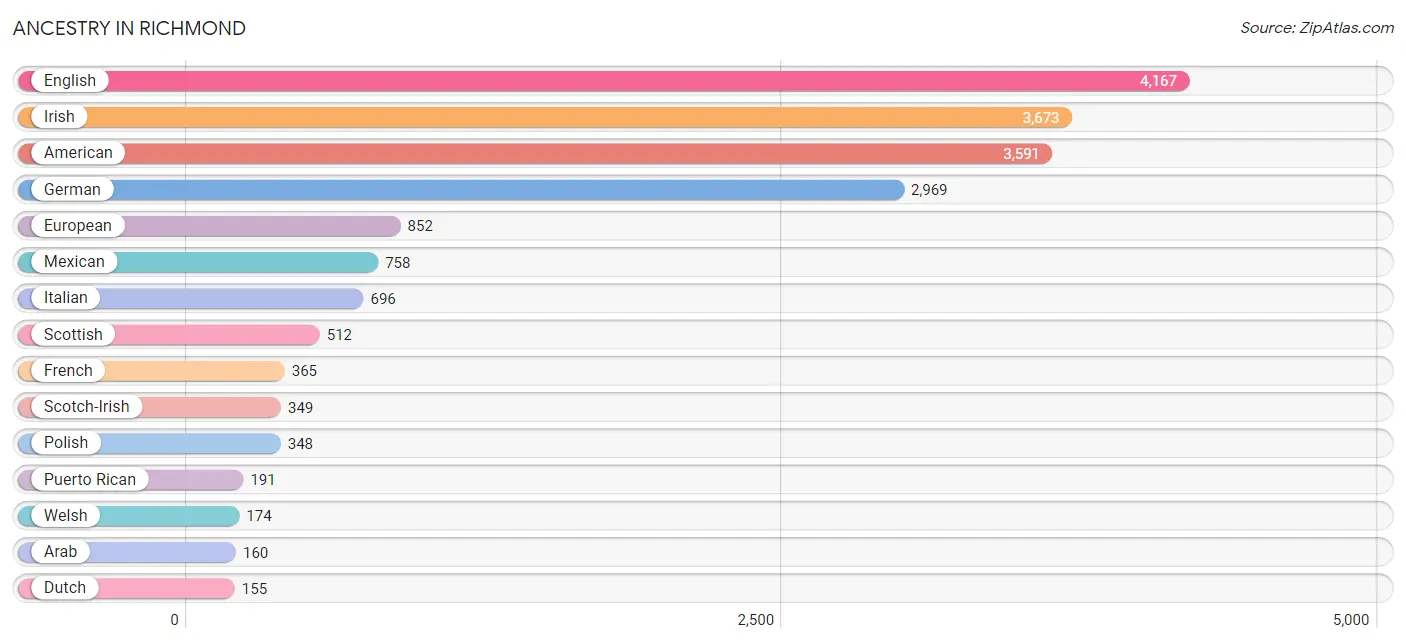
Ancestry in Richmond
The most populous ancestries reported in Richmond are English (4,167 | 11.9%), Irish (3,673 | 10.5%), American (3,591 | 10.3%), German (2,969 | 8.5%), and European (852 | 2.4%), together accounting for 43.7% of all Richmond residents.
| Ancestry | # Population | % Population |
| African | 49 | 0.1% |
| Albanian | 90 | 0.3% |
| Alsatian | 15 | 0.0% |
| American | 3,591 | 10.3% |
| Arab | 160 | 0.5% |
| Armenian | 15 | 0.0% |
| Australian | 17 | 0.1% |
| Austrian | 14 | 0.0% |
| Belgian | 91 | 0.3% |
| Bhutanese | 36 | 0.1% |
| Blackfeet | 23 | 0.1% |
| Brazilian | 27 | 0.1% |
| British | 115 | 0.3% |
| Bulgarian | 10 | 0.0% |
| Burmese | 18 | 0.1% |
| Canadian | 36 | 0.1% |
| Celtic | 12 | 0.0% |
| Cherokee | 54 | 0.2% |
| Chickasaw | 2 | 0.0% |
| Choctaw | 1 | 0.0% |
| Colombian | 23 | 0.1% |
| Croatian | 2 | 0.0% |
| Czech | 20 | 0.1% |
| Danish | 31 | 0.1% |
| Dominican | 16 | 0.1% |
| Dutch | 155 | 0.4% |
| Eastern European | 6 | 0.0% |
| Egyptian | 12 | 0.0% |
| English | 4,167 | 11.9% |
| European | 852 | 2.4% |
| Filipino | 3 | 0.0% |
| Finnish | 27 | 0.1% |
| French | 365 | 1.1% |
| French Canadian | 29 | 0.1% |
| German | 2,969 | 8.5% |
| Greek | 101 | 0.3% |
| Guamanian / Chamorro | 87 | 0.3% |
| Hungarian | 11 | 0.0% |
| Indian (Asian) | 67 | 0.2% |
| Iranian | 29 | 0.1% |
| Irish | 3,673 | 10.5% |
| Italian | 696 | 2.0% |
| Jamaican | 20 | 0.1% |
| Japanese | 83 | 0.2% |
| Korean | 155 | 0.4% |
| Latvian | 7 | 0.0% |
| Lebanese | 33 | 0.1% |
| Lithuanian | 24 | 0.1% |
| Malaysian | 5 | 0.0% |
| Mexican | 758 | 2.2% |
| Nigerian | 37 | 0.1% |
| Northern European | 40 | 0.1% |
| Norwegian | 41 | 0.1% |
| Palestinian | 80 | 0.2% |
| Peruvian | 15 | 0.0% |
| Polish | 348 | 1.0% |
| Puerto Rican | 191 | 0.5% |
| Russian | 74 | 0.2% |
| Scandinavian | 73 | 0.2% |
| Scotch-Irish | 349 | 1.0% |
| Scottish | 512 | 1.5% |
| Slovak | 14 | 0.0% |
| South American | 38 | 0.1% |
| Spanish | 40 | 0.1% |
| Subsaharan African | 86 | 0.3% |
| Swedish | 69 | 0.2% |
| Swiss | 38 | 0.1% |
| Syrian | 23 | 0.1% |
| Thai | 15 | 0.0% |
| Welsh | 174 | 0.5% |
| Yugoslavian | 2 | 0.0% | View All 71 Rows |
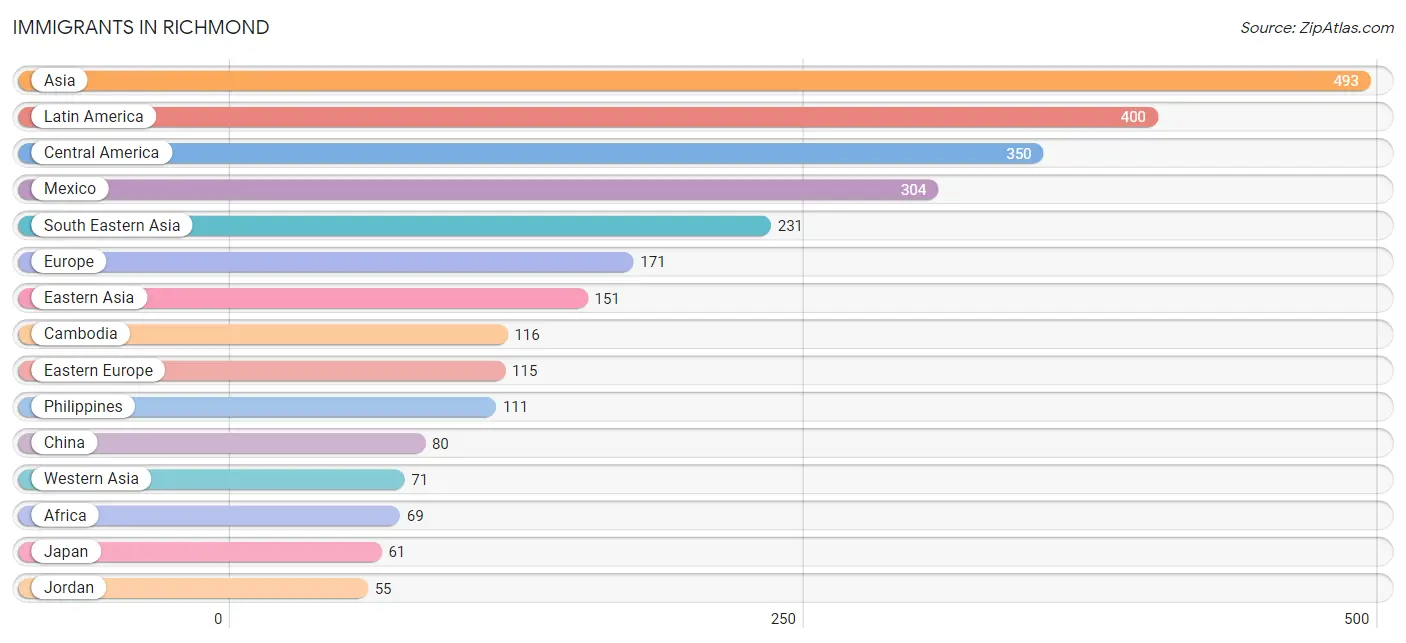
Immigrants in Richmond
The most numerous immigrant groups reported in Richmond came from Asia (493 | 1.4%), Latin America (400 | 1.1%), Central America (350 | 1.0%), Mexico (304 | 0.9%), and South Eastern Asia (231 | 0.7%), together accounting for 5.1% of all Richmond residents.
| Immigration Origin | # Population | % Population |
| Africa | 69 | 0.2% |
| Asia | 493 | 1.4% |
| Brazil | 7 | 0.0% |
| Bulgaria | 10 | 0.0% |
| Cambodia | 116 | 0.3% |
| Central America | 350 | 1.0% |
| China | 80 | 0.2% |
| Colombia | 23 | 0.1% |
| Eastern Africa | 19 | 0.1% |
| Eastern Asia | 151 | 0.4% |
| Eastern Europe | 115 | 0.3% |
| Europe | 171 | 0.5% |
| France | 12 | 0.0% |
| Germany | 26 | 0.1% |
| Guatemala | 33 | 0.1% |
| India | 15 | 0.0% |
| Italy | 7 | 0.0% |
| Japan | 61 | 0.2% |
| Jordan | 55 | 0.2% |
| Kenya | 19 | 0.1% |
| Korea | 10 | 0.0% |
| Laos | 4 | 0.0% |
| Latin America | 400 | 1.1% |
| Latvia | 36 | 0.1% |
| Lebanon | 16 | 0.1% |
| Mexico | 304 | 0.9% |
| Nigeria | 40 | 0.1% |
| Northern Europe | 5 | 0.0% |
| Panama | 13 | 0.0% |
| Peru | 15 | 0.0% |
| Philippines | 111 | 0.3% |
| Poland | 4 | 0.0% |
| Russia | 9 | 0.0% |
| South Africa | 10 | 0.0% |
| South America | 50 | 0.1% |
| South Central Asia | 15 | 0.0% |
| South Eastern Asia | 231 | 0.7% |
| Southern Europe | 7 | 0.0% |
| Switzerland | 6 | 0.0% |
| Venezuela | 5 | 0.0% |
| Western Africa | 40 | 0.1% |
| Western Asia | 71 | 0.2% |
| Western Europe | 44 | 0.1% | View All 43 Rows |
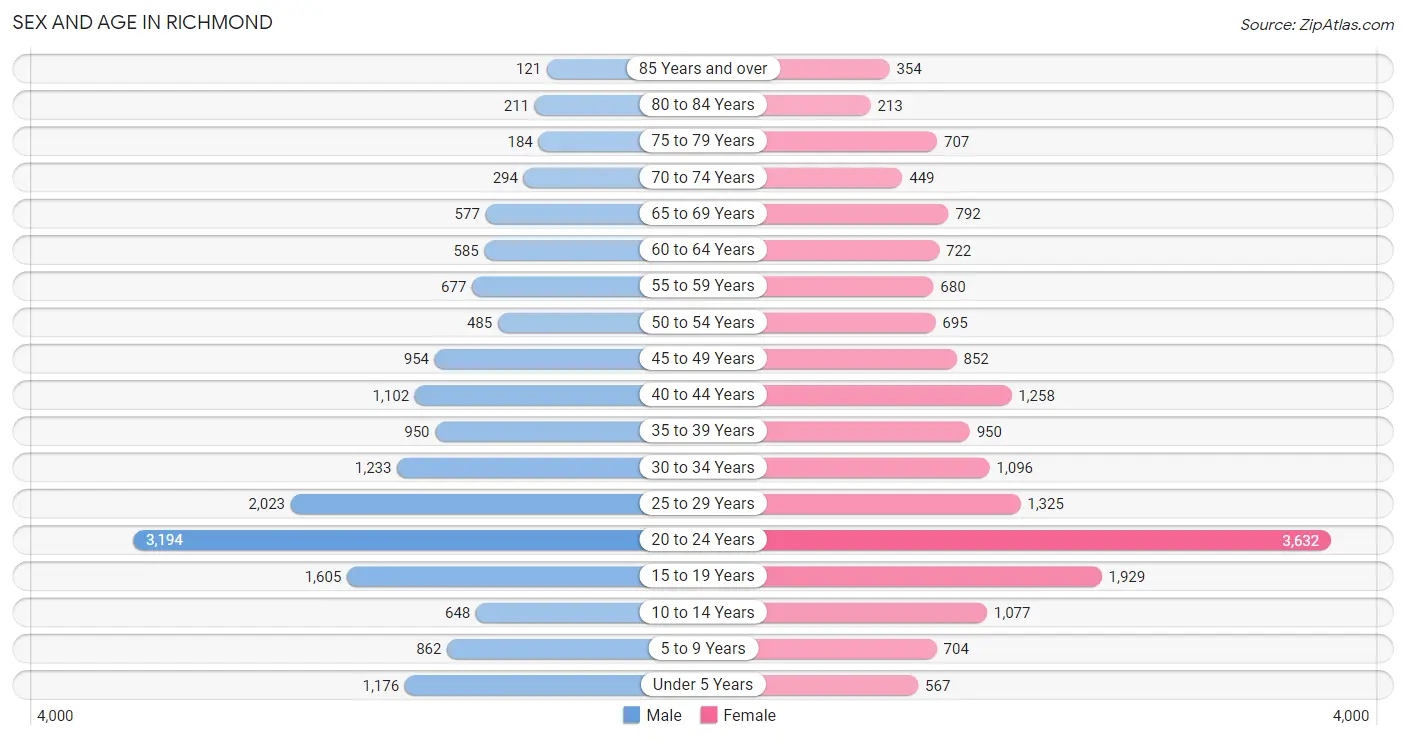
Sex and Age in Richmond
Sex and Age in Richmond
The most populous age groups in Richmond are 20 to 24 Years (3,194 | 18.9%) for men and 20 to 24 Years (3,632 | 20.2%) for women.
| Age Bracket | Male | Female |
| Under 5 Years | 1,176 (7.0%) | 567 (3.2%) |
| 5 to 9 Years | 862 (5.1%) | 704 (3.9%) |
| 10 to 14 Years | 648 (3.8%) | 1,077 (6.0%) |
| 15 to 19 Years | 1,605 (9.5%) | 1,929 (10.7%) |
| 20 to 24 Years | 3,194 (18.9%) | 3,632 (20.2%) |
| 25 to 29 Years | 2,023 (12.0%) | 1,325 (7.4%) |
| 30 to 34 Years | 1,233 (7.3%) | 1,096 (6.1%) |
| 35 to 39 Years | 950 (5.6%) | 950 (5.3%) |
| 40 to 44 Years | 1,102 (6.5%) | 1,258 (7.0%) |
| 45 to 49 Years | 954 (5.7%) | 852 (4.7%) |
| 50 to 54 Years | 485 (2.9%) | 695 (3.9%) |
| 55 to 59 Years | 677 (4.0%) | 680 (3.8%) |
| 60 to 64 Years | 585 (3.5%) | 722 (4.0%) |
| 65 to 69 Years | 577 (3.4%) | 792 (4.4%) |
| 70 to 74 Years | 294 (1.7%) | 449 (2.5%) |
| 75 to 79 Years | 184 (1.1%) | 707 (3.9%) |
| 80 to 84 Years | 211 (1.3%) | 213 (1.2%) |
| 85 Years and over | 121 (0.7%) | 354 (2.0%) |
| Total | 16,881 (100.0%) | 18,002 (100.0%) |
Families and Households in Richmond
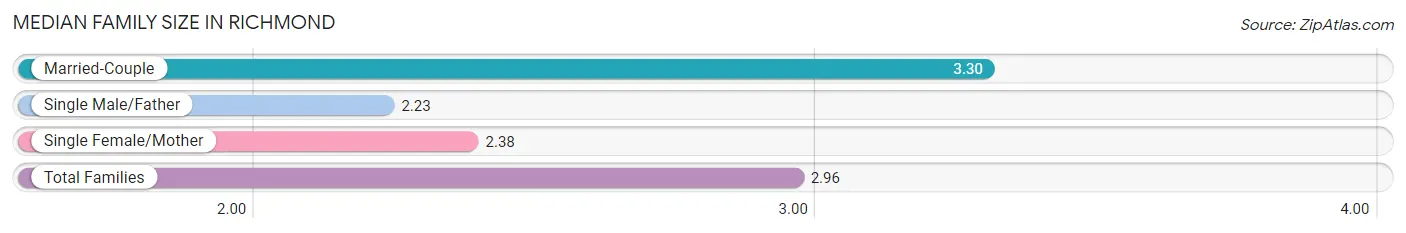
Median Family Size in Richmond
The median family size in Richmond is 2.96 persons per family, with married-couple families (4,241 | 64.7%) accounting for the largest median family size of 3.3 persons per family. On the other hand, single male/father families (446 | 6.8%) represent the smallest median family size with 2.23 persons per family.
| Family Type | # Families | Family Size |
| Married-Couple | 4,241 (64.7%) | 3.30 |
| Single Male/Father | 446 (6.8%) | 2.23 |
| Single Female/Mother | 1,871 (28.5%) | 2.38 |
| Total Families | 6,558 (100.0%) | 2.96 |
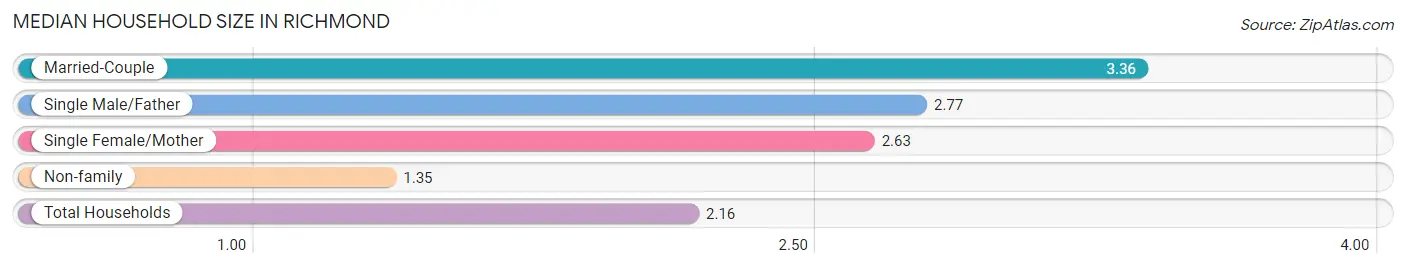
Median Household Size in Richmond
The median household size in Richmond is 2.16 persons per household, with married-couple households (4,241 | 29.5%) accounting for the largest median household size of 3.36 persons per household. non-family households (7,796 | 54.3%) represent the smallest median household size with 1.35 persons per household.
| Household Type | # Households | Household Size |
| Married-Couple | 4,241 (29.5%) | 3.36 |
| Single Male/Father | 446 (3.1%) | 2.77 |
| Single Female/Mother | 1,871 (13.0%) | 2.63 |
| Non-family | 7,796 (54.3%) | 1.35 |
| Total Households | 14,354 (100.0%) | 2.16 |
Household Size by Marriage Status in Richmond
Out of a total of 14,354 households in Richmond, 6,558 (45.7%) are family households, while 7,796 (54.3%) are nonfamily households. The most numerous type of family households are 2-person households, comprising 2,806, and the most common type of nonfamily households are 1-person households, comprising 5,666.
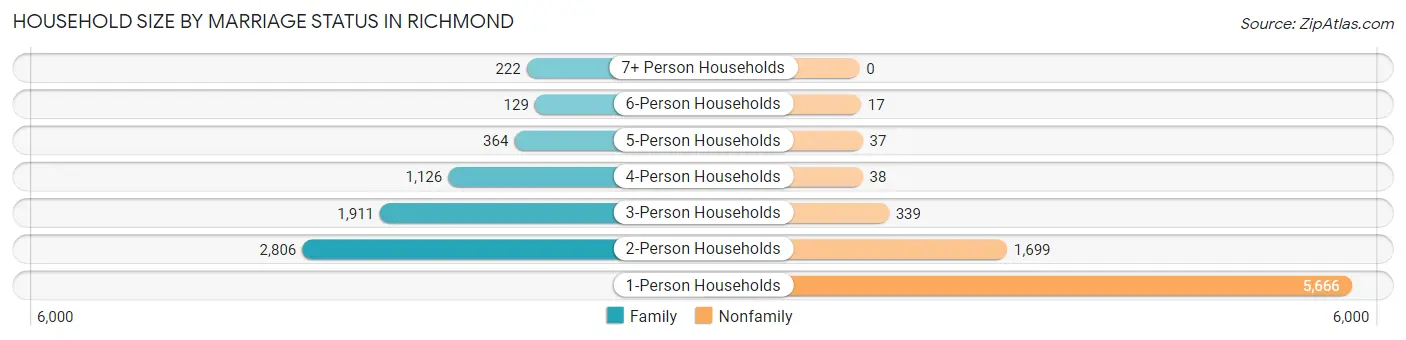
| Household Size | Family Households | Nonfamily Households |
| 1-Person Households | - | 5,666 (39.5%) |
| 2-Person Households | 2,806 (19.6%) | 1,699 (11.8%) |
| 3-Person Households | 1,911 (13.3%) | 339 (2.4%) |
| 4-Person Households | 1,126 (7.8%) | 38 (0.3%) |
| 5-Person Households | 364 (2.5%) | 37 (0.3%) |
| 6-Person Households | 129 (0.9%) | 17 (0.1%) |
| 7+ Person Households | 222 (1.5%) | 0 (0.0%) |
| Total | 6,558 (45.7%) | 7,796 (54.3%) |
Female Fertility in Richmond
Fertility by Age in Richmond
Average fertility rate in Richmond is 46.0 births per 1,000 women. Women in the age bracket of 20 to 34 years have the highest fertility rate with 64.0 births per 1,000 women. Women in the age bracket of 20 to 34 years acount for 75.2% of all women with births.
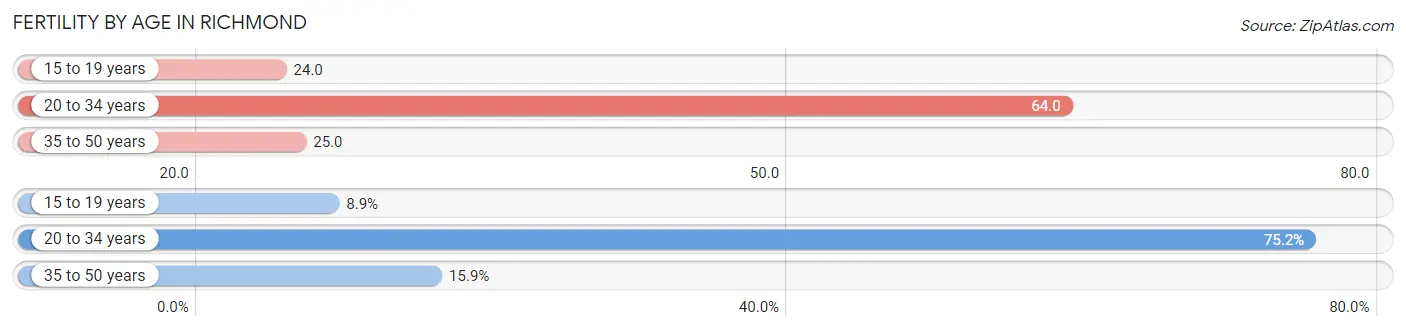
| Age Bracket | Women with Births | Births / 1,000 Women |
| 15 to 19 years | 46 (8.9%) | 24.0 |
| 20 to 34 years | 388 (75.2%) | 64.0 |
| 35 to 50 years | 82 (15.9%) | 25.0 |
| Total | 516 (100.0%) | 46.0 |
Fertility by Age by Marriage Status in Richmond
52.9% of women with births (516) in Richmond are married. The highest percentage of unmarried women with births falls into 15 to 19 years age bracket with 100.0% of them unmarried at the time of birth, while the lowest percentage of unmarried women with births belong to 35 to 50 years age bracket with 23.2% of them unmarried.
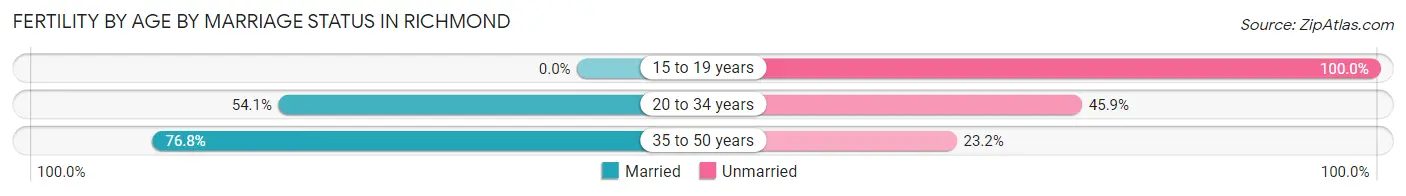
| Age Bracket | Married | Unmarried |
| 15 to 19 years | 0 (0.0%) | 46 (100.0%) |
| 20 to 34 years | 210 (54.1%) | 178 (45.9%) |
| 35 to 50 years | 63 (76.8%) | 19 (23.2%) |
| Total | 273 (52.9%) | 243 (47.1%) |
Fertility by Education in Richmond
Average fertility rate in Richmond is 46.0 births per 1,000 women. Women with the education attainment of graduate degree have the highest fertility rate of 60.0 births per 1,000 women, while women with the education attainment of high school diploma have the lowest fertility at 20.0 births per 1,000 women. Women with the education attainment of college or associate's degree represent 52.9% of all women with births.
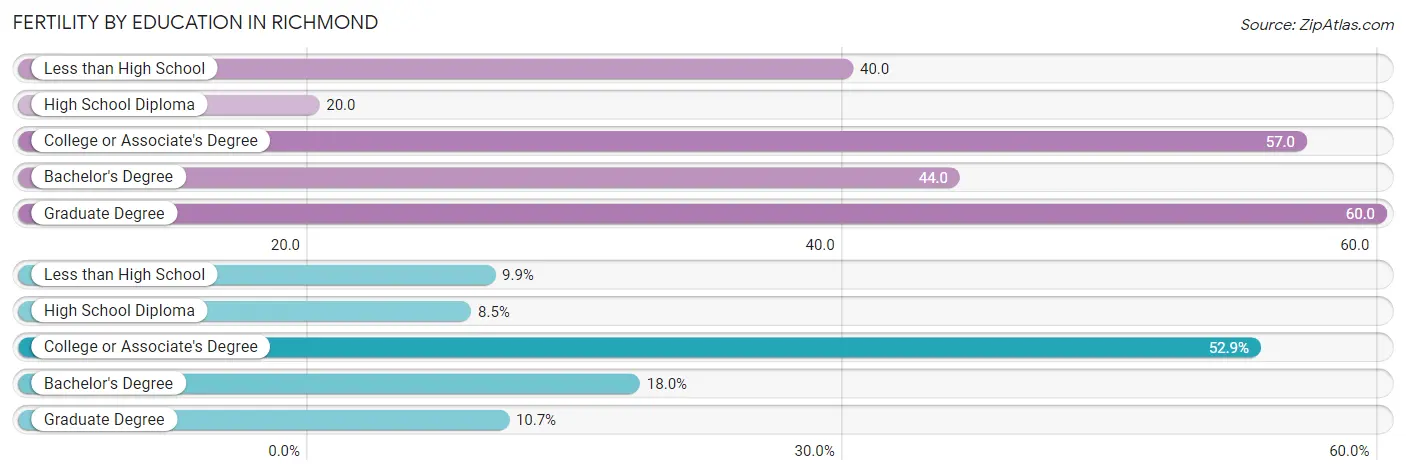
| Educational Attainment | Women with Births | Births / 1,000 Women |
| Less than High School | 51 (9.9%) | 40.0 |
| High School Diploma | 44 (8.5%) | 20.0 |
| College or Associate's Degree | 273 (52.9%) | 57.0 |
| Bachelor's Degree | 93 (18.0%) | 44.0 |
| Graduate Degree | 55 (10.7%) | 60.0 |
| Total | 516 (100.0%) | 46.0 |
Fertility by Education by Marriage Status in Richmond
47.1% of women with births in Richmond are unmarried. Women with the educational attainment of bachelor's degree are most likely to be married with 100.0% of them married at childbirth, while women with the educational attainment of less than high school are least likely to be married with 100.0% of them unmarried at childbirth.
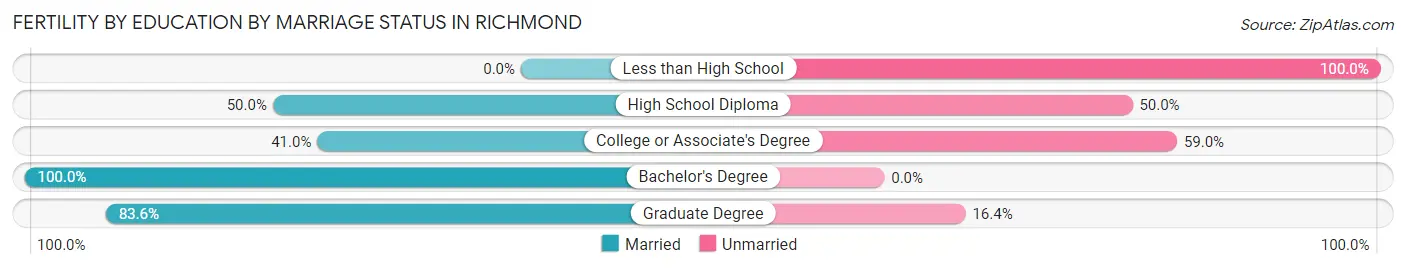
| Educational Attainment | Married | Unmarried |
| Less than High School | 0 (0.0%) | 51 (100.0%) |
| High School Diploma | 22 (50.0%) | 22 (50.0%) |
| College or Associate's Degree | 112 (41.0%) | 161 (59.0%) |
| Bachelor's Degree | 93 (100.0%) | 0 (0.0%) |
| Graduate Degree | 46 (83.6%) | 9 (16.4%) |
| Total | 273 (52.9%) | 243 (47.1%) |
Employment Characteristics in Richmond
Employment by Class of Employer in Richmond
Among the 17,809 employed individuals in Richmond, private company employees (12,372 | 69.5%), state government employees (1,305 | 7.3%), and local government employees (1,223 | 6.9%) make up the most common classes of employment.
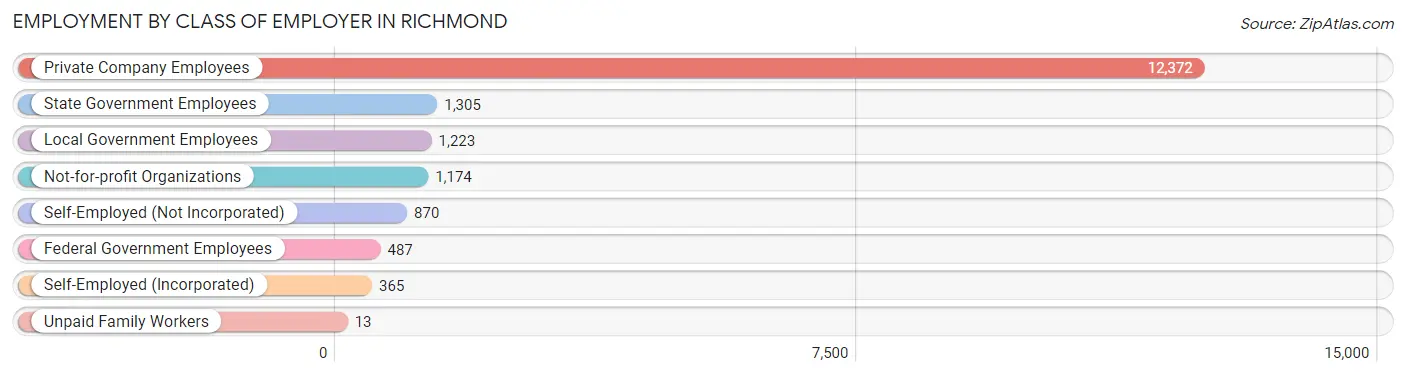
| Employer Class | # Employees | % Employees |
| Private Company Employees | 12,372 | 69.5% |
| Self-Employed (Incorporated) | 365 | 2.1% |
| Self-Employed (Not Incorporated) | 870 | 4.9% |
| Not-for-profit Organizations | 1,174 | 6.6% |
| Local Government Employees | 1,223 | 6.9% |
| State Government Employees | 1,305 | 7.3% |
| Federal Government Employees | 487 | 2.7% |
| Unpaid Family Workers | 13 | 0.1% |
| Total | 17,809 | 100.0% |
Employment Status by Age in Richmond
According to the labor force statistics for Richmond, out of the total population over 16 years of age (29,552), 67.7% or 20,007 individuals are in the labor force, with 7.3% or 1,461 of them unemployed. The age group with the highest labor force participation rate is 25 to 29 years, with 84.8% or 2,839 individuals in the labor force. Within the labor force, the 20 to 24 years age range has the highest percentage of unemployed individuals, with 11.3% or 626 of them being unemployed.
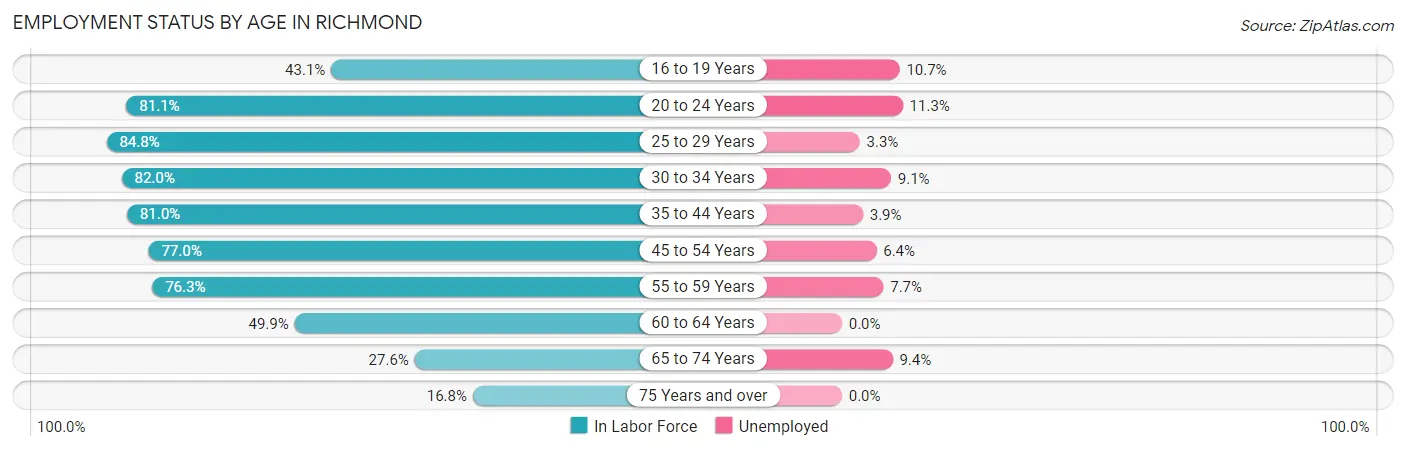
| Age Bracket | In Labor Force | Unemployed |
| 16 to 19 Years | 1,395 (43.1%) | 149 (10.7%) |
| 20 to 24 Years | 5,536 (81.1%) | 626 (11.3%) |
| 25 to 29 Years | 2,839 (84.8%) | 94 (3.3%) |
| 30 to 34 Years | 1,910 (82.0%) | 174 (9.1%) |
| 35 to 44 Years | 3,451 (81.0%) | 135 (3.9%) |
| 45 to 54 Years | 2,299 (77.0%) | 147 (6.4%) |
| 55 to 59 Years | 1,035 (76.3%) | 80 (7.7%) |
| 60 to 64 Years | 652 (49.9%) | 0 (0.0%) |
| 65 to 74 Years | 583 (27.6%) | 55 (9.4%) |
| 75 Years and over | 301 (16.8%) | 0 (0.0%) |
| Total | 20,007 (67.7%) | 1,461 (7.3%) |
Employment Status by Educational Attainment in Richmond
According to labor force statistics for Richmond, 78.2% of individuals (12,189) out of the total population between 25 and 64 years of age (15,587) are in the labor force, with 5.2% or 634 of them being unemployed. The group with the highest labor force participation rate are those with the educational attainment of bachelor's degree or higher, with 87.1% or 4,927 individuals in the labor force. Within the labor force, individuals with less than high school education have the highest percentage of unemployment, with 11.5% or 77 of them being unemployed.
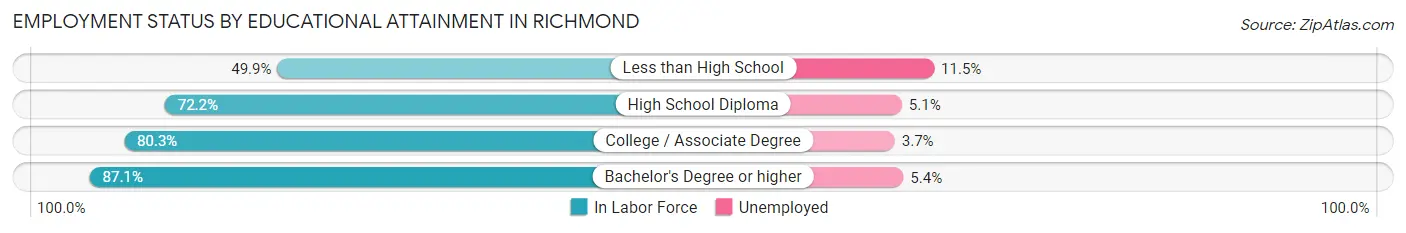
| Educational Attainment | In Labor Force | Unemployed |
| Less than High School | 672 (49.9%) | 155 (11.5%) |
| High School Diploma | 2,750 (72.2%) | 194 (5.1%) |
| College / Associate Degree | 3,834 (80.3%) | 177 (3.7%) |
| Bachelor's Degree or higher | 4,927 (87.1%) | 305 (5.4%) |
| Total | 12,189 (78.2%) | 811 (5.2%) |
Employment Occupations by Sex in Richmond
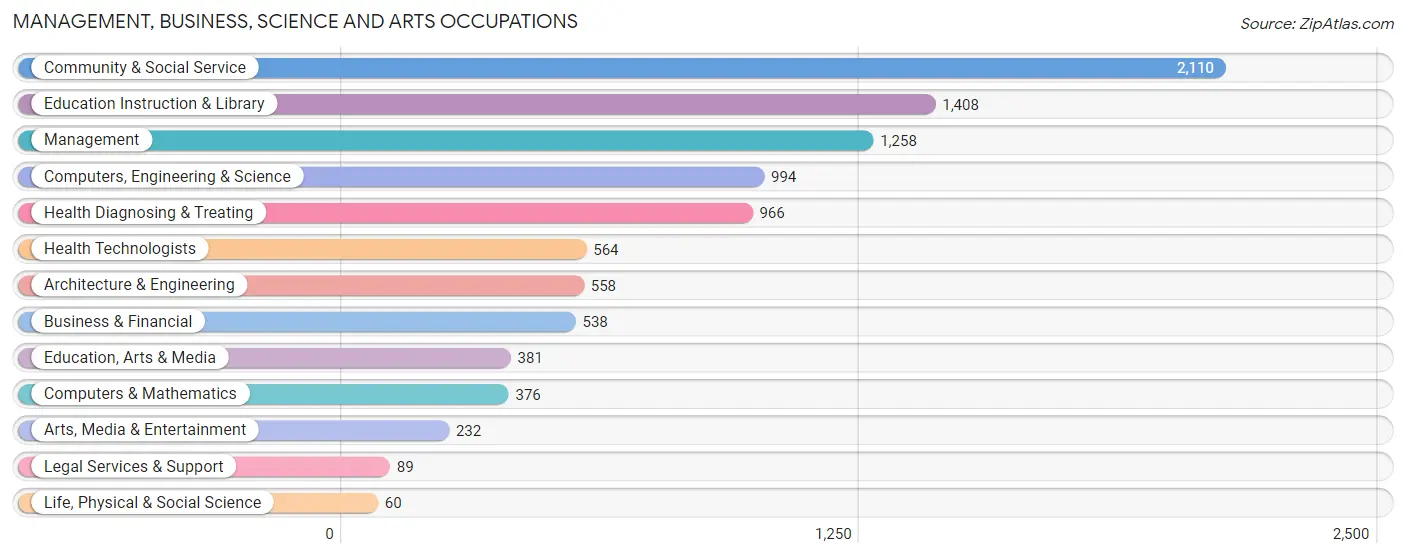
Management, Business, Science and Arts Occupations
The most common Management, Business, Science and Arts occupations in Richmond are Community & Social Service (2,110 | 11.4%), Education Instruction & Library (1,408 | 7.6%), Management (1,258 | 6.8%), Computers, Engineering & Science (994 | 5.4%), and Health Diagnosing & Treating (966 | 5.2%).
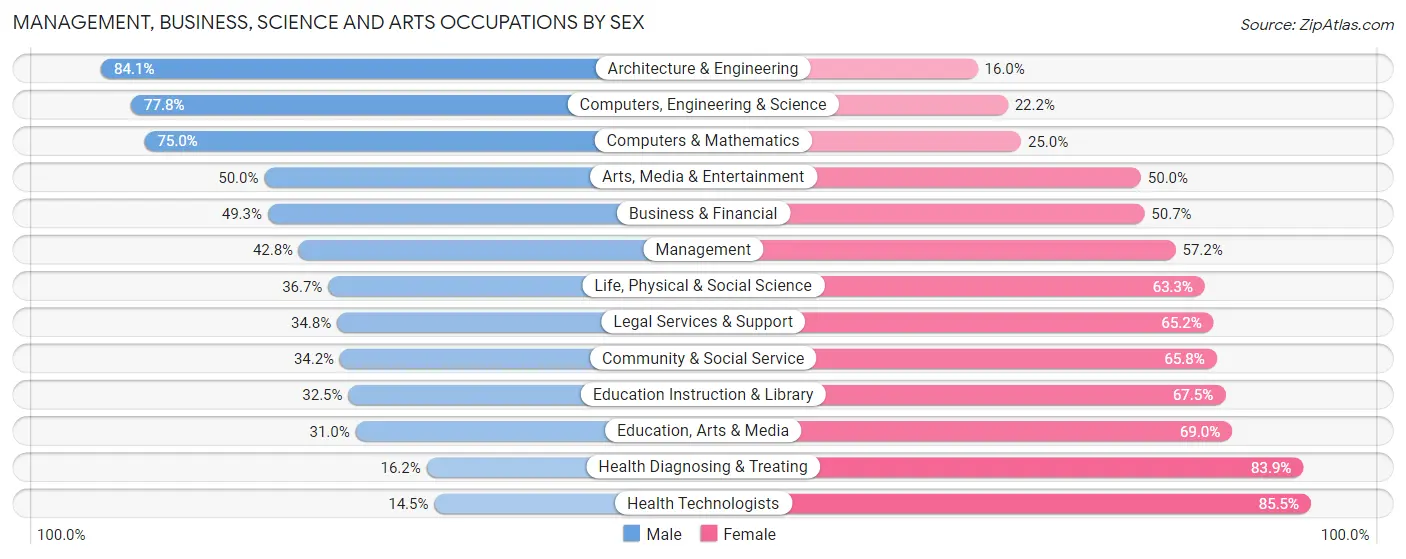
Management, Business, Science and Arts Occupations by Sex
Within the Management, Business, Science and Arts occupations in Richmond, the most male-oriented occupations are Architecture & Engineering (84.1%), Computers, Engineering & Science (77.8%), and Computers & Mathematics (75.0%), while the most female-oriented occupations are Health Technologists (85.5%), Health Diagnosing & Treating (83.9%), and Education, Arts & Media (69.0%).
| Occupation | Male | Female |
| Management | 538 (42.8%) | 720 (57.2%) |
| Business & Financial | 265 (49.3%) | 273 (50.7%) |
| Computers, Engineering & Science | 773 (77.8%) | 221 (22.2%) |
| Computers & Mathematics | 282 (75.0%) | 94 (25.0%) |
| Architecture & Engineering | 469 (84.1%) | 89 (16.0%) |
| Life, Physical & Social Science | 22 (36.7%) | 38 (63.3%) |
| Community & Social Service | 722 (34.2%) | 1,388 (65.8%) |
| Education, Arts & Media | 118 (31.0%) | 263 (69.0%) |
| Legal Services & Support | 31 (34.8%) | 58 (65.2%) |
| Education Instruction & Library | 457 (32.5%) | 951 (67.5%) |
| Arts, Media & Entertainment | 116 (50.0%) | 116 (50.0%) |
| Health Diagnosing & Treating | 156 (16.2%) | 810 (83.9%) |
| Health Technologists | 82 (14.5%) | 482 (85.5%) |
| Total (Category) | 2,454 (41.8%) | 3,412 (58.2%) |
| Total (Overall) | 9,284 (50.2%) | 9,224 (49.8%) |
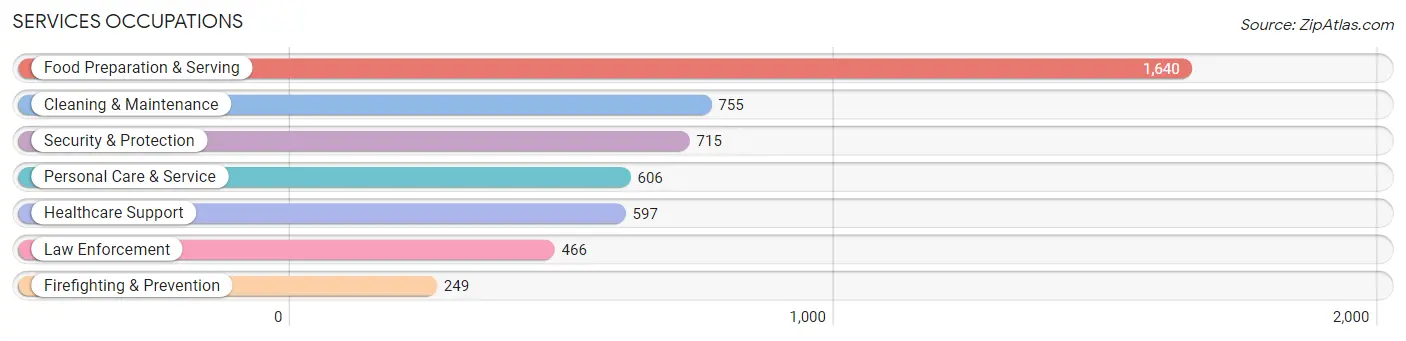
Services Occupations
The most common Services occupations in Richmond are Food Preparation & Serving (1,640 | 8.9%), Cleaning & Maintenance (755 | 4.1%), Security & Protection (715 | 3.9%), Personal Care & Service (606 | 3.3%), and Healthcare Support (597 | 3.2%).
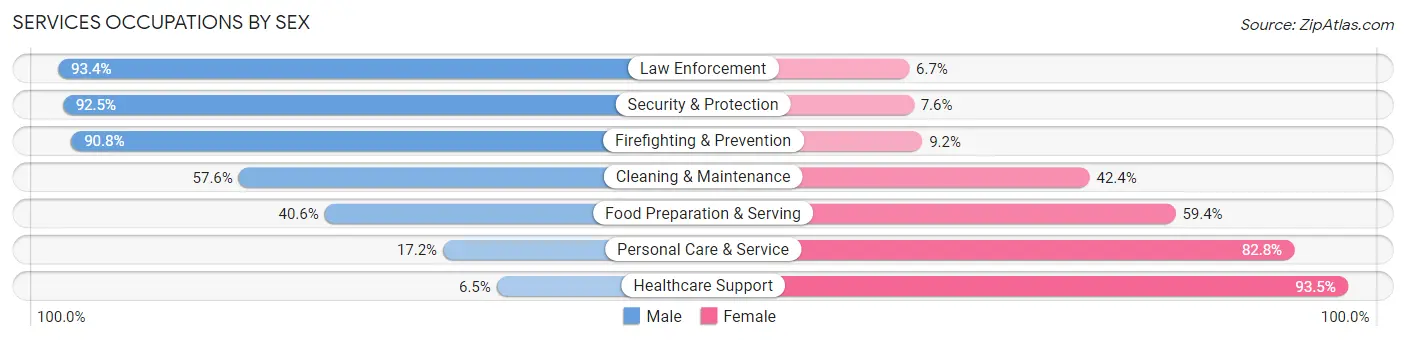
Services Occupations by Sex
Within the Services occupations in Richmond, the most male-oriented occupations are Law Enforcement (93.3%), Security & Protection (92.4%), and Firefighting & Prevention (90.8%), while the most female-oriented occupations are Healthcare Support (93.5%), Personal Care & Service (82.8%), and Food Preparation & Serving (59.4%).
| Occupation | Male | Female |
| Healthcare Support | 39 (6.5%) | 558 (93.5%) |
| Security & Protection | 661 (92.4%) | 54 (7.5%) |
| Firefighting & Prevention | 226 (90.8%) | 23 (9.2%) |
| Law Enforcement | 435 (93.3%) | 31 (6.7%) |
| Food Preparation & Serving | 666 (40.6%) | 974 (59.4%) |
| Cleaning & Maintenance | 435 (57.6%) | 320 (42.4%) |
| Personal Care & Service | 104 (17.2%) | 502 (82.8%) |
| Total (Category) | 1,905 (44.2%) | 2,408 (55.8%) |
| Total (Overall) | 9,284 (50.2%) | 9,224 (49.8%) |
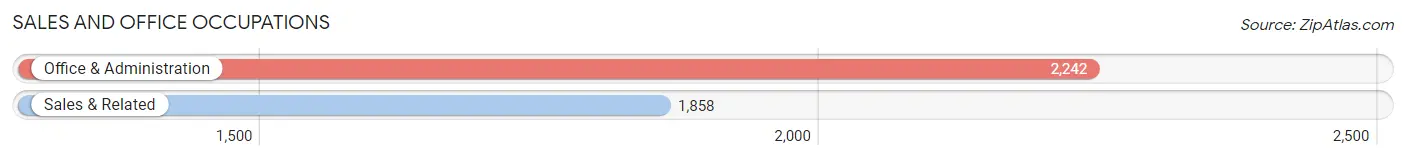
Sales and Office Occupations
The most common Sales and Office occupations in Richmond are Office & Administration (2,242 | 12.1%), and Sales & Related (1,858 | 10.0%).
Sales and Office Occupations by Sex
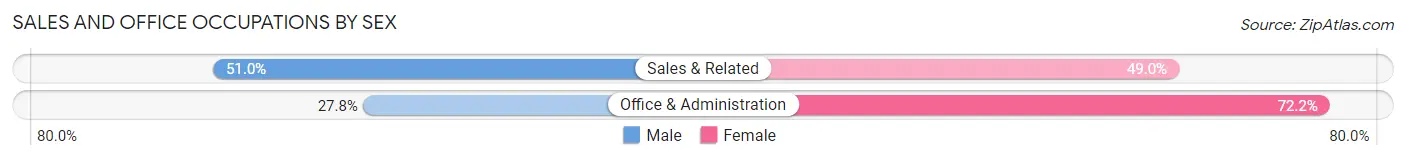
| Occupation | Male | Female |
| Sales & Related | 948 (51.0%) | 910 (49.0%) |
| Office & Administration | 624 (27.8%) | 1,618 (72.2%) |
| Total (Category) | 1,572 (38.3%) | 2,528 (61.7%) |
| Total (Overall) | 9,284 (50.2%) | 9,224 (49.8%) |
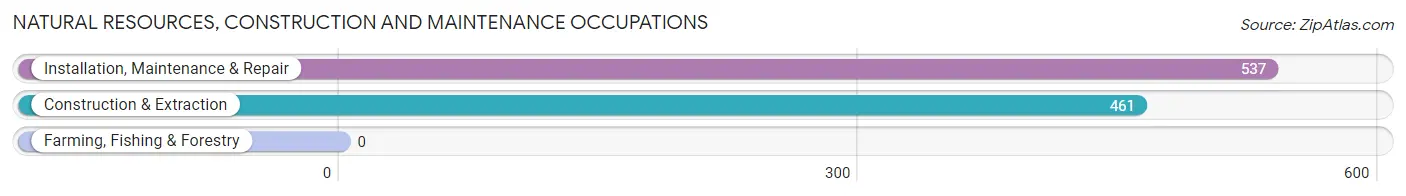
Natural Resources, Construction and Maintenance Occupations
The most common Natural Resources, Construction and Maintenance occupations in Richmond are Installation, Maintenance & Repair (537 | 2.9%), and Construction & Extraction (461 | 2.5%).
Natural Resources, Construction and Maintenance Occupations by Sex
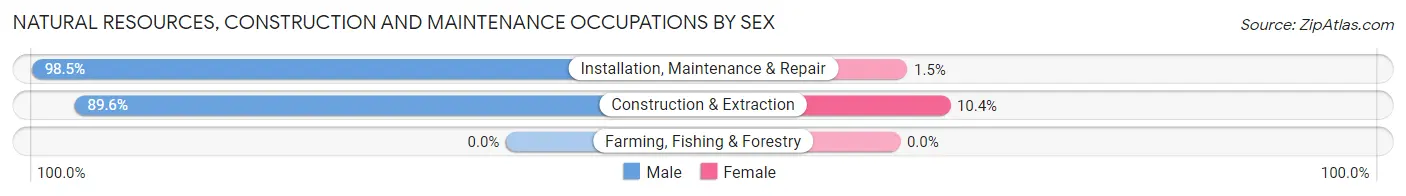
| Occupation | Male | Female |
| Farming, Fishing & Forestry | 0 (0.0%) | 0 (0.0%) |
| Construction & Extraction | 413 (89.6%) | 48 (10.4%) |
| Installation, Maintenance & Repair | 529 (98.5%) | 8 (1.5%) |
| Total (Category) | 942 (94.4%) | 56 (5.6%) |
| Total (Overall) | 9,284 (50.2%) | 9,224 (49.8%) |
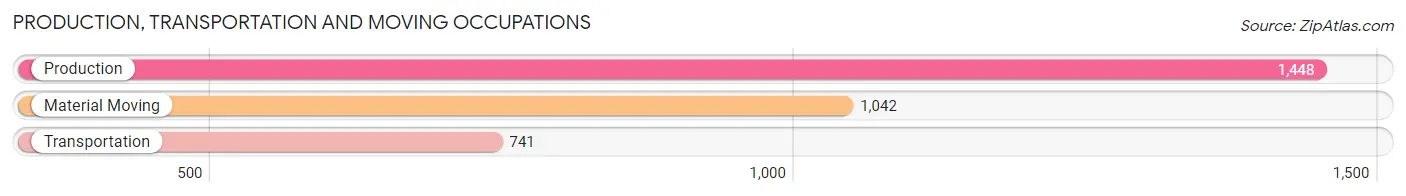
Production, Transportation and Moving Occupations
The most common Production, Transportation and Moving occupations in Richmond are Production (1,448 | 7.8%), Material Moving (1,042 | 5.6%), and Transportation (741 | 4.0%).
Production, Transportation and Moving Occupations by Sex
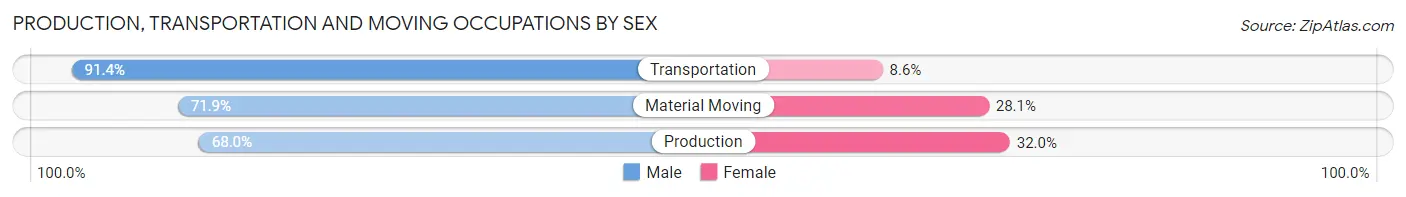
| Occupation | Male | Female |
| Production | 985 (68.0%) | 463 (32.0%) |
| Transportation | 677 (91.4%) | 64 (8.6%) |
| Material Moving | 749 (71.9%) | 293 (28.1%) |
| Total (Category) | 2,411 (74.6%) | 820 (25.4%) |
| Total (Overall) | 9,284 (50.2%) | 9,224 (49.8%) |
Employment Industries by Sex in Richmond
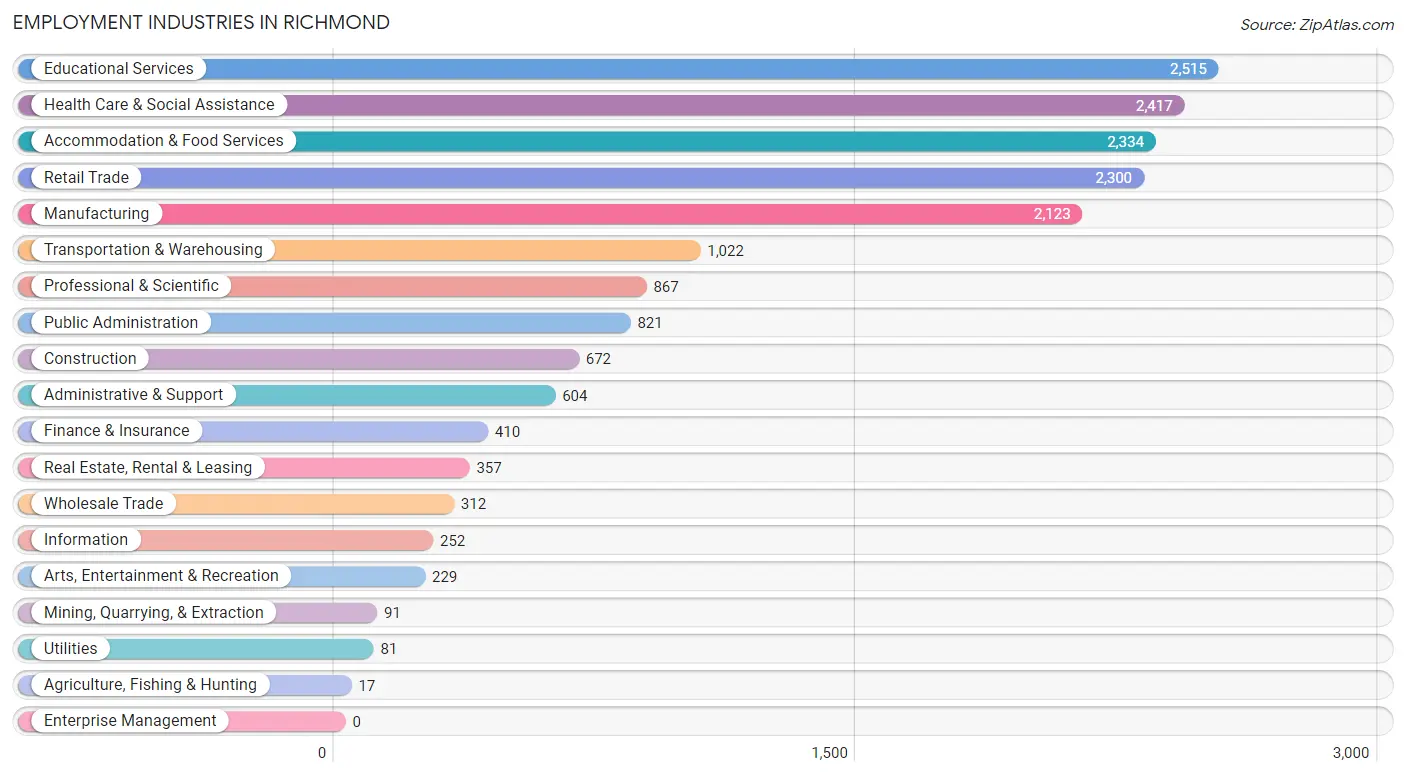
Employment Industries in Richmond
The major employment industries in Richmond include Educational Services (2,515 | 13.6%), Health Care & Social Assistance (2,417 | 13.1%), Accommodation & Food Services (2,334 | 12.6%), Retail Trade (2,300 | 12.4%), and Manufacturing (2,123 | 11.5%).
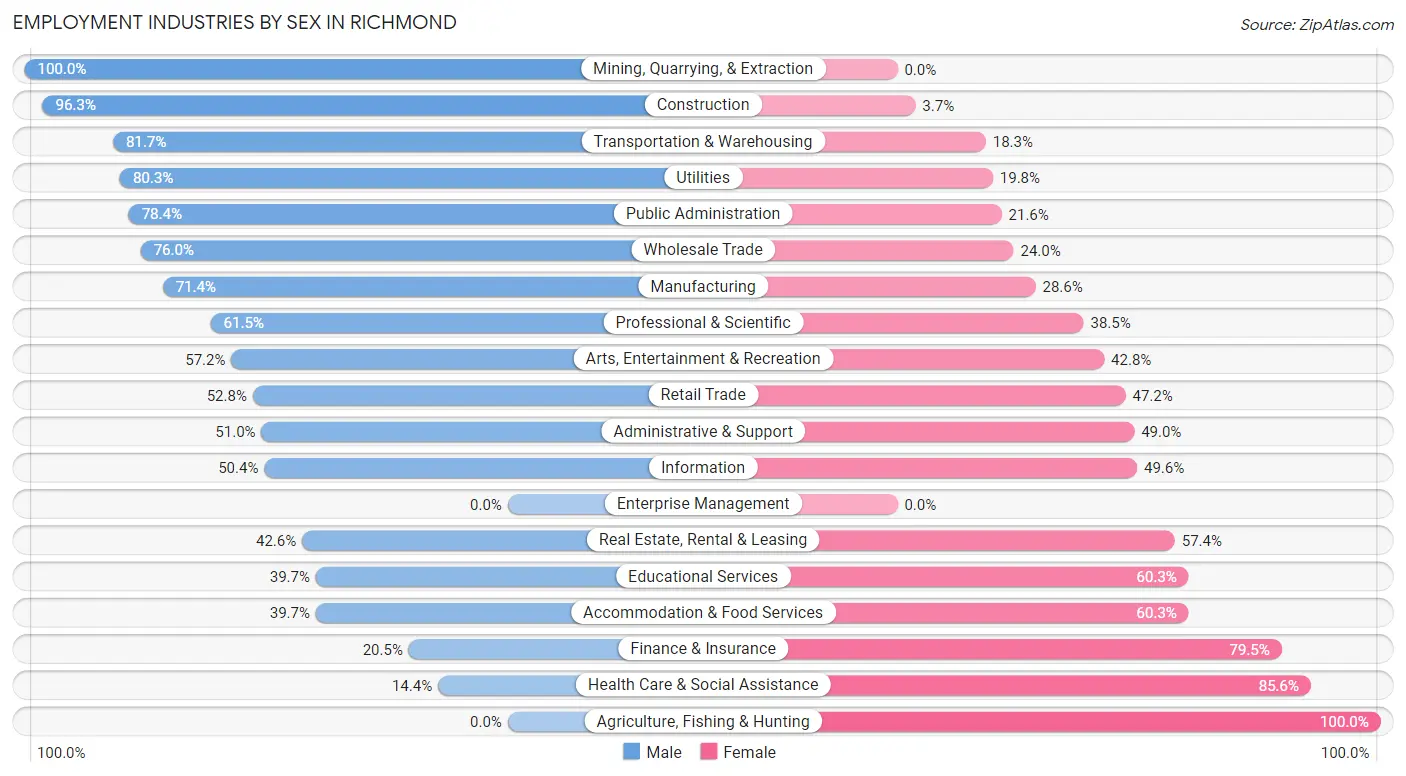
Employment Industries by Sex in Richmond
The Richmond industries that see more men than women are Mining, Quarrying, & Extraction (100.0%), Construction (96.3%), and Transportation & Warehousing (81.7%), whereas the industries that tend to have a higher number of women are Agriculture, Fishing & Hunting (100.0%), Health Care & Social Assistance (85.6%), and Finance & Insurance (79.5%).
| Industry | Male | Female |
| Agriculture, Fishing & Hunting | 0 (0.0%) | 17 (100.0%) |
| Mining, Quarrying, & Extraction | 91 (100.0%) | 0 (0.0%) |
| Construction | 647 (96.3%) | 25 (3.7%) |
| Manufacturing | 1,516 (71.4%) | 607 (28.6%) |
| Wholesale Trade | 237 (76.0%) | 75 (24.0%) |
| Retail Trade | 1,214 (52.8%) | 1,086 (47.2%) |
| Transportation & Warehousing | 835 (81.7%) | 187 (18.3%) |
| Utilities | 65 (80.2%) | 16 (19.8%) |
| Information | 127 (50.4%) | 125 (49.6%) |
| Finance & Insurance | 84 (20.5%) | 326 (79.5%) |
| Real Estate, Rental & Leasing | 152 (42.6%) | 205 (57.4%) |
| Professional & Scientific | 533 (61.5%) | 334 (38.5%) |
| Enterprise Management | 0 (0.0%) | 0 (0.0%) |
| Administrative & Support | 308 (51.0%) | 296 (49.0%) |
| Educational Services | 999 (39.7%) | 1,516 (60.3%) |
| Health Care & Social Assistance | 349 (14.4%) | 2,068 (85.6%) |
| Arts, Entertainment & Recreation | 131 (57.2%) | 98 (42.8%) |
| Accommodation & Food Services | 927 (39.7%) | 1,407 (60.3%) |
| Public Administration | 644 (78.4%) | 177 (21.6%) |
| Total | 9,284 (50.2%) | 9,224 (49.8%) |
Education in Richmond
School Enrollment in Richmond
The most common levels of schooling among the 12,013 students in Richmond are college / undergraduate (6,861 | 57.1%), elementary school (1,358 | 11.3%), and middle school (1,353 | 11.3%).
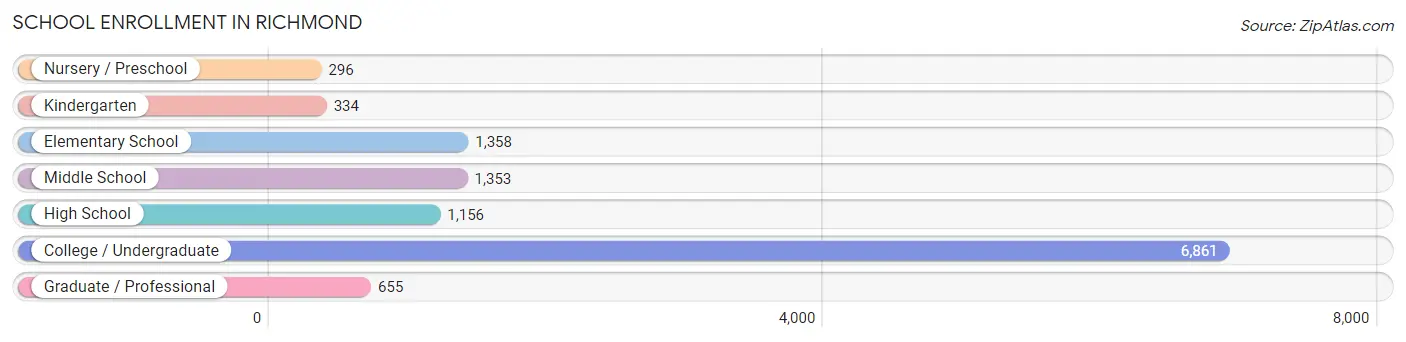
| School Level | # Students | % Students |
| Nursery / Preschool | 296 | 2.5% |
| Kindergarten | 334 | 2.8% |
| Elementary School | 1,358 | 11.3% |
| Middle School | 1,353 | 11.3% |
| High School | 1,156 | 9.6% |
| College / Undergraduate | 6,861 | 57.1% |
| Graduate / Professional | 655 | 5.4% |
| Total | 12,013 | 100.0% |
School Enrollment by Age by Funding Source in Richmond
Out of a total of 12,013 students who are enrolled in schools in Richmond, 2,126 (17.7%) attend a private institution, while the remaining 9,887 (82.3%) are enrolled in public schools. The age group of 3 to 4 year olds has the highest likelihood of being enrolled in private schools, with 102 (40.5% in the age bracket) enrolled. Conversely, the age group of 15 to 17 year olds has the lowest likelihood of being enrolled in a private school, with 809 (90.2% in the age bracket) attending a public institution.
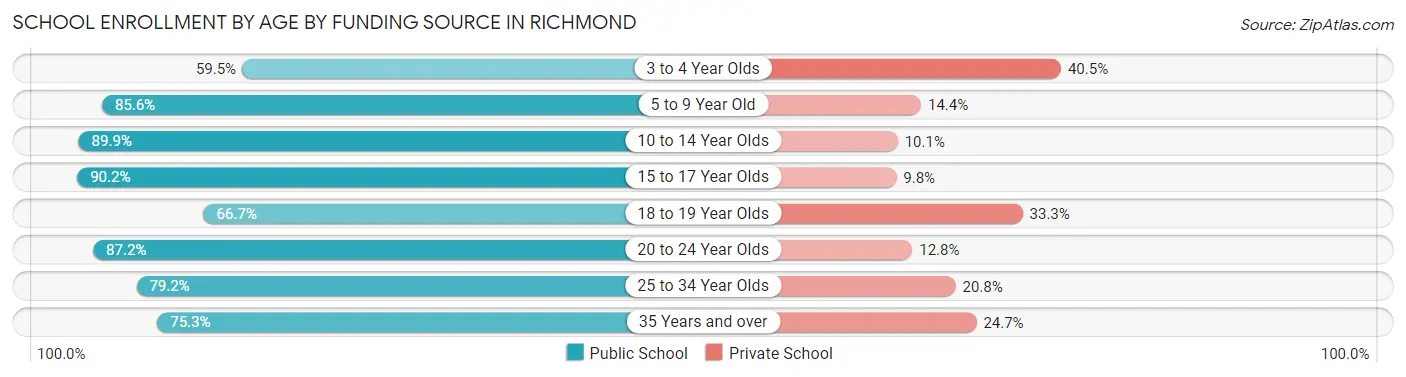
| Age Bracket | Public School | Private School |
| 3 to 4 Year Olds | 150 (59.5%) | 102 (40.5%) |
| 5 to 9 Year Old | 1,265 (85.6%) | 213 (14.4%) |
| 10 to 14 Year Olds | 1,527 (89.9%) | 171 (10.1%) |
| 15 to 17 Year Olds | 809 (90.2%) | 88 (9.8%) |
| 18 to 19 Year Olds | 1,492 (66.7%) | 746 (33.3%) |
| 20 to 24 Year Olds | 3,618 (87.2%) | 530 (12.8%) |
| 25 to 34 Year Olds | 813 (79.2%) | 214 (20.8%) |
| 35 Years and over | 207 (75.3%) | 68 (24.7%) |
| Total | 9,887 (82.3%) | 2,126 (17.7%) |
Educational Attainment by Field of Study in Richmond
Education (1,029 | 14.0%), business (998 | 13.6%), arts & humanities (859 | 11.7%), science & technology (849 | 11.6%), and liberal arts & history (560 | 7.6%) are the most common fields of study among 7,353 individuals in Richmond who have obtained a bachelor's degree or higher.
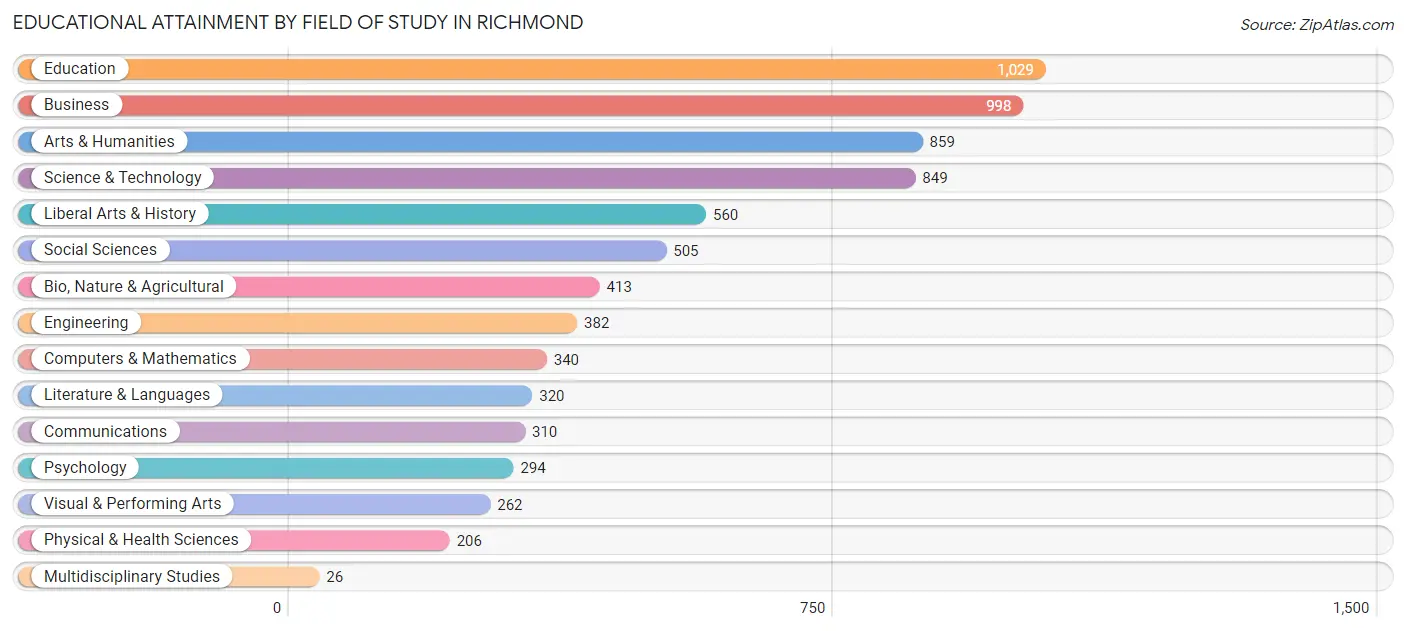
| Field of Study | # Graduates | % Graduates |
| Computers & Mathematics | 340 | 4.6% |
| Bio, Nature & Agricultural | 413 | 5.6% |
| Physical & Health Sciences | 206 | 2.8% |
| Psychology | 294 | 4.0% |
| Social Sciences | 505 | 6.9% |
| Engineering | 382 | 5.2% |
| Multidisciplinary Studies | 26 | 0.4% |
| Science & Technology | 849 | 11.6% |
| Business | 998 | 13.6% |
| Education | 1,029 | 14.0% |
| Literature & Languages | 320 | 4.3% |
| Liberal Arts & History | 560 | 7.6% |
| Visual & Performing Arts | 262 | 3.6% |
| Communications | 310 | 4.2% |
| Arts & Humanities | 859 | 11.7% |
| Total | 7,353 | 100.0% |
Transportation & Commute in Richmond
Vehicle Availability by Sex in Richmond
The most prevalent vehicle ownership categories in Richmond are males with 2 vehicles (3,992, accounting for 46.9%) and females with 2 vehicles (3,648, making up 50.2%).
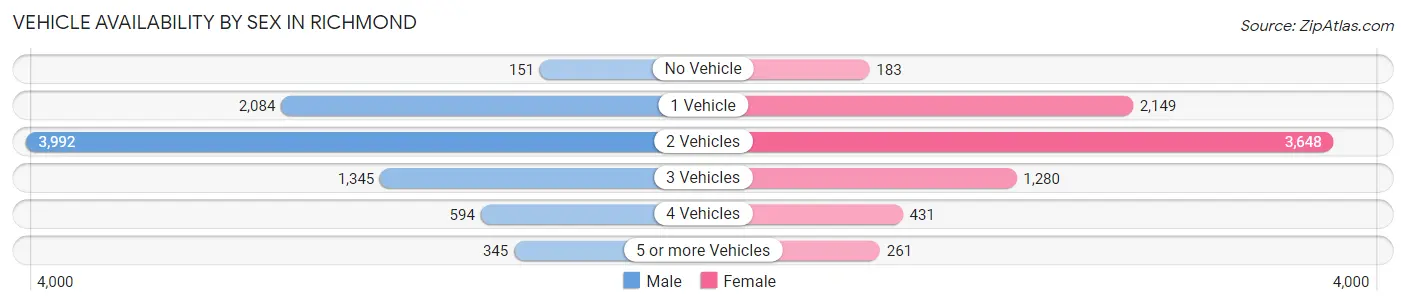
| Vehicles Available | Male | Female |
| No Vehicle | 151 (1.8%) | 183 (2.3%) |
| 1 Vehicle | 2,084 (24.5%) | 2,149 (27.0%) |
| 2 Vehicles | 3,992 (46.9%) | 3,648 (45.9%) |
| 3 Vehicles | 1,345 (15.8%) | 1,280 (16.1%) |
| 4 Vehicles | 594 (7.0%) | 431 (5.4%) |
| 5 or more Vehicles | 345 (4.1%) | 261 (3.3%) |
| Total | 8,511 (100.0%) | 7,952 (100.0%) |
Commute Time in Richmond
The most frequently occuring commute durations in Richmond are 10 to 14 minutes (3,606 commuters, 21.4%), 5 to 9 minutes (2,951 commuters, 17.5%), and 15 to 19 minutes (2,720 commuters, 16.2%).
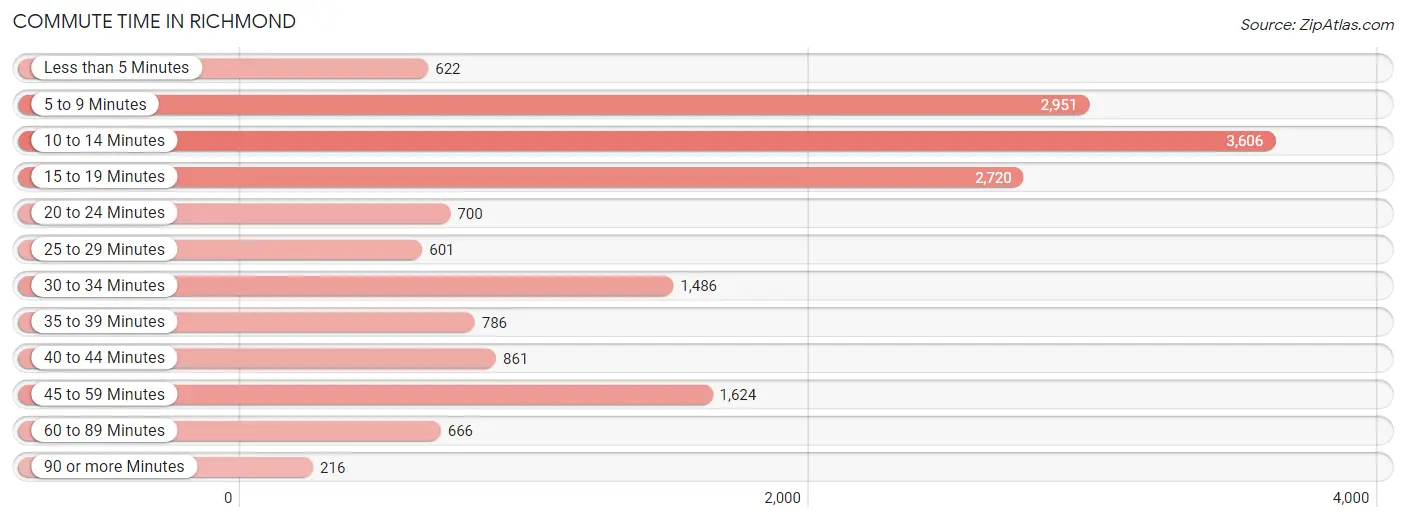
| Commute Time | # Commuters | % Commuters |
| Less than 5 Minutes | 622 | 3.7% |
| 5 to 9 Minutes | 2,951 | 17.5% |
| 10 to 14 Minutes | 3,606 | 21.4% |
| 15 to 19 Minutes | 2,720 | 16.2% |
| 20 to 24 Minutes | 700 | 4.2% |
| 25 to 29 Minutes | 601 | 3.6% |
| 30 to 34 Minutes | 1,486 | 8.8% |
| 35 to 39 Minutes | 786 | 4.7% |
| 40 to 44 Minutes | 861 | 5.1% |
| 45 to 59 Minutes | 1,624 | 9.6% |
| 60 to 89 Minutes | 666 | 4.0% |
| 90 or more Minutes | 216 | 1.3% |
Commute Time by Sex in Richmond
The most common commute times in Richmond are 10 to 14 minutes (2,142 commuters, 24.9%) for males and 5 to 9 minutes (1,601 commuters, 19.4%) for females.
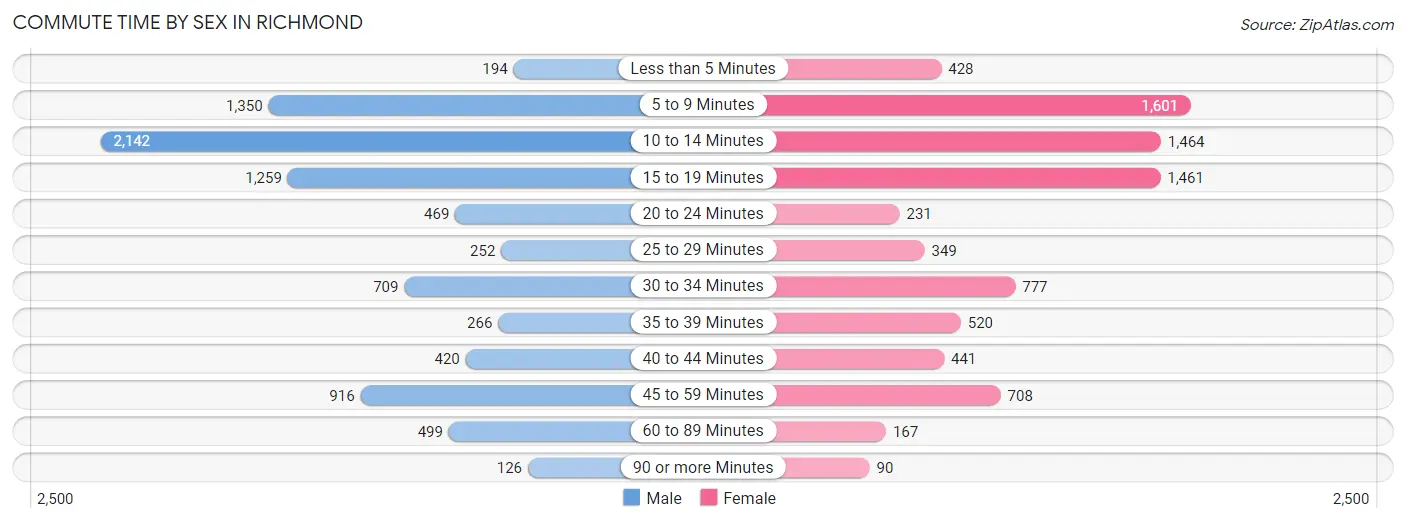
| Commute Time | Male | Female |
| Less than 5 Minutes | 194 (2.3%) | 428 (5.2%) |
| 5 to 9 Minutes | 1,350 (15.7%) | 1,601 (19.4%) |
| 10 to 14 Minutes | 2,142 (24.9%) | 1,464 (17.8%) |
| 15 to 19 Minutes | 1,259 (14.6%) | 1,461 (17.7%) |
| 20 to 24 Minutes | 469 (5.4%) | 231 (2.8%) |
| 25 to 29 Minutes | 252 (2.9%) | 349 (4.2%) |
| 30 to 34 Minutes | 709 (8.2%) | 777 (9.4%) |
| 35 to 39 Minutes | 266 (3.1%) | 520 (6.3%) |
| 40 to 44 Minutes | 420 (4.9%) | 441 (5.3%) |
| 45 to 59 Minutes | 916 (10.6%) | 708 (8.6%) |
| 60 to 89 Minutes | 499 (5.8%) | 167 (2.0%) |
| 90 or more Minutes | 126 (1.5%) | 90 (1.1%) |
Time of Departure to Work by Sex in Richmond
The most frequent times of departure to work in Richmond are 12:00 PM to 3:59 PM (1,632, 19.0%) for males and 7:30 AM to 7:59 AM (1,113, 13.5%) for females.
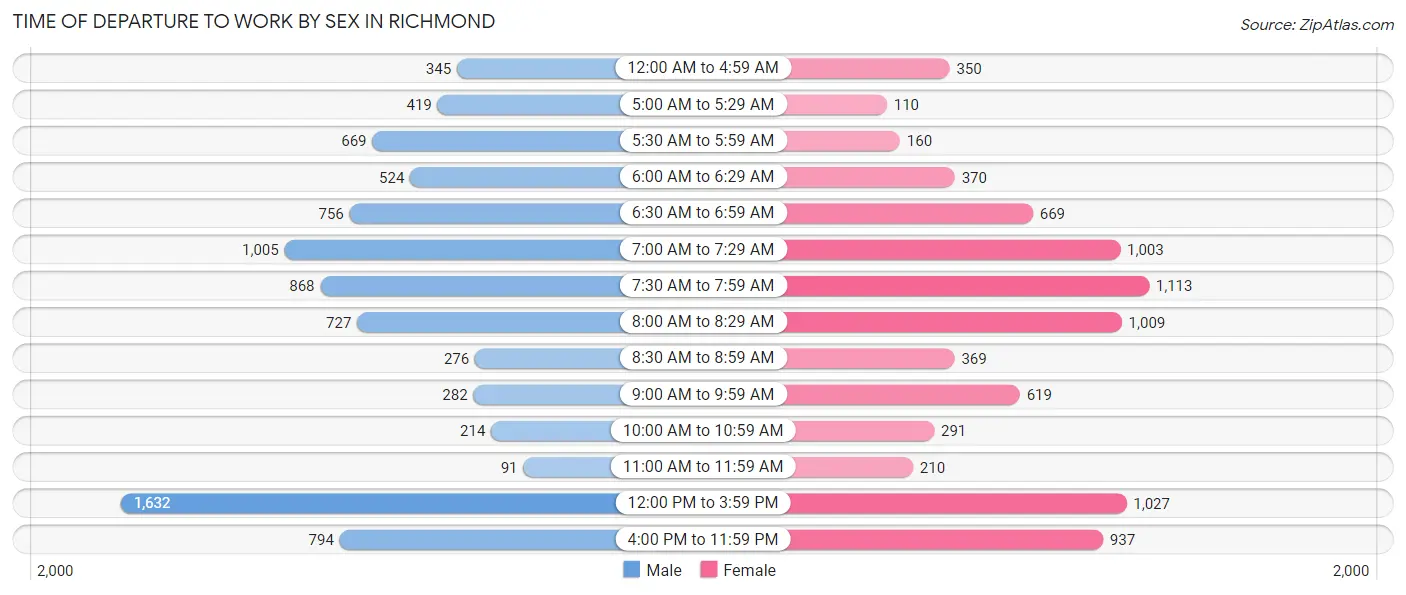
| Time of Departure | Male | Female |
| 12:00 AM to 4:59 AM | 345 (4.0%) | 350 (4.3%) |
| 5:00 AM to 5:29 AM | 419 (4.9%) | 110 (1.3%) |
| 5:30 AM to 5:59 AM | 669 (7.8%) | 160 (1.9%) |
| 6:00 AM to 6:29 AM | 524 (6.1%) | 370 (4.5%) |
| 6:30 AM to 6:59 AM | 756 (8.8%) | 669 (8.1%) |
| 7:00 AM to 7:29 AM | 1,005 (11.7%) | 1,003 (12.2%) |
| 7:30 AM to 7:59 AM | 868 (10.1%) | 1,113 (13.5%) |
| 8:00 AM to 8:29 AM | 727 (8.5%) | 1,009 (12.2%) |
| 8:30 AM to 8:59 AM | 276 (3.2%) | 369 (4.5%) |
| 9:00 AM to 9:59 AM | 282 (3.3%) | 619 (7.5%) |
| 10:00 AM to 10:59 AM | 214 (2.5%) | 291 (3.5%) |
| 11:00 AM to 11:59 AM | 91 (1.1%) | 210 (2.5%) |
| 12:00 PM to 3:59 PM | 1,632 (19.0%) | 1,027 (12.5%) |
| 4:00 PM to 11:59 PM | 794 (9.2%) | 937 (11.4%) |
| Total | 8,602 (100.0%) | 8,237 (100.0%) |
Housing Occupancy in Richmond
Occupancy by Ownership in Richmond
Of the total 14,354 dwellings in Richmond, owner-occupied units account for 5,510 (38.4%), while renter-occupied units make up 8,844 (61.6%).
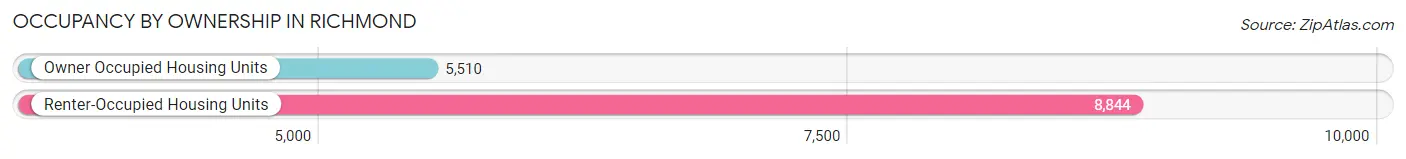
| Occupancy | # Housing Units | % Housing Units |
| Owner Occupied Housing Units | 5,510 | 38.4% |
| Renter-Occupied Housing Units | 8,844 | 61.6% |
| Total Occupied Housing Units | 14,354 | 100.0% |
Occupancy by Household Size in Richmond
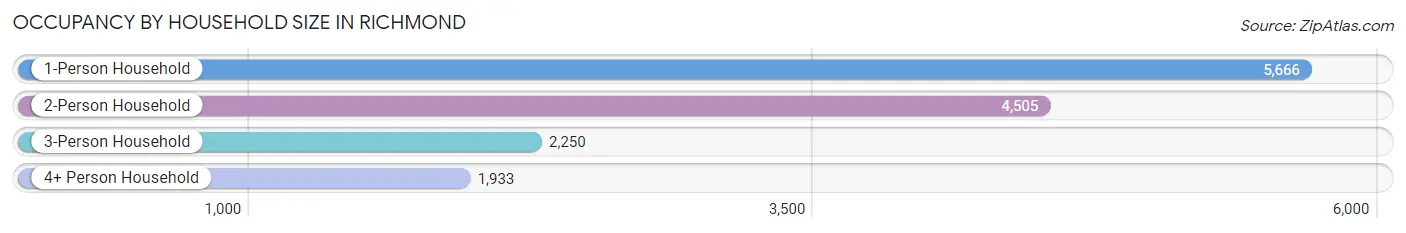
| Household Size | # Housing Units | % Housing Units |
| 1-Person Household | 5,666 | 39.5% |
| 2-Person Household | 4,505 | 31.4% |
| 3-Person Household | 2,250 | 15.7% |
| 4+ Person Household | 1,933 | 13.5% |
| Total Housing Units | 14,354 | 100.0% |
Occupancy by Ownership by Household Size in Richmond
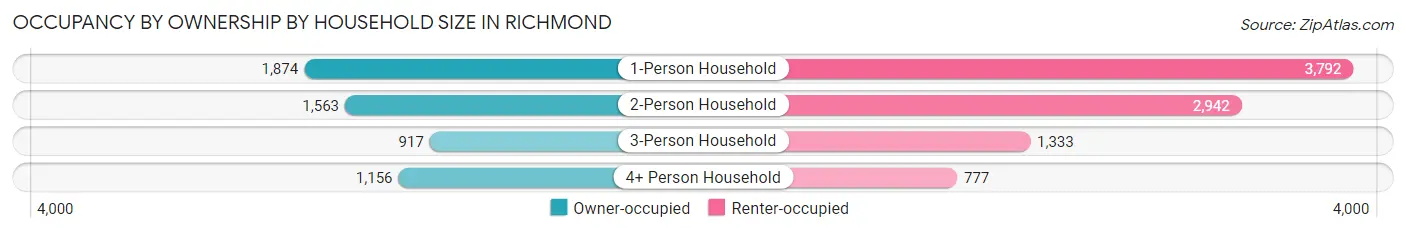
| Household Size | Owner-occupied | Renter-occupied |
| 1-Person Household | 1,874 (33.1%) | 3,792 (66.9%) |
| 2-Person Household | 1,563 (34.7%) | 2,942 (65.3%) |
| 3-Person Household | 917 (40.8%) | 1,333 (59.2%) |
| 4+ Person Household | 1,156 (59.8%) | 777 (40.2%) |
| Total Housing Units | 5,510 (38.4%) | 8,844 (61.6%) |
Occupancy by Educational Attainment in Richmond
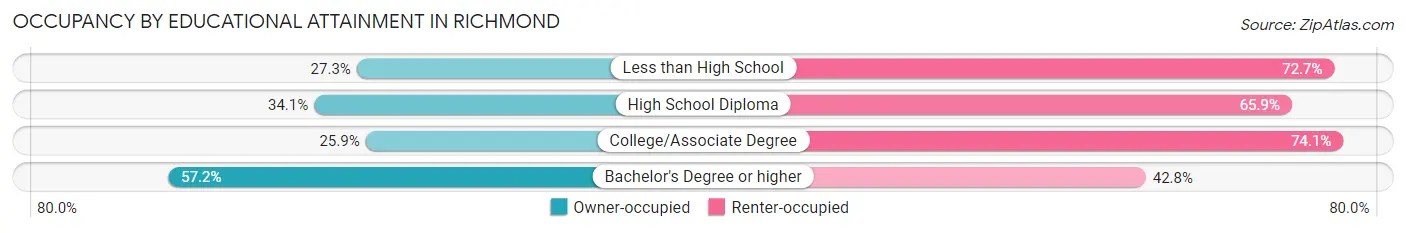
| Household Size | Owner-occupied | Renter-occupied |
| Less than High School | 329 (27.3%) | 875 (72.7%) |
| High School Diploma | 1,082 (34.1%) | 2,092 (65.9%) |
| College/Associate Degree | 1,334 (25.9%) | 3,811 (74.1%) |
| Bachelor's Degree or higher | 2,765 (57.2%) | 2,066 (42.8%) |
Occupancy by Age of Householder in Richmond
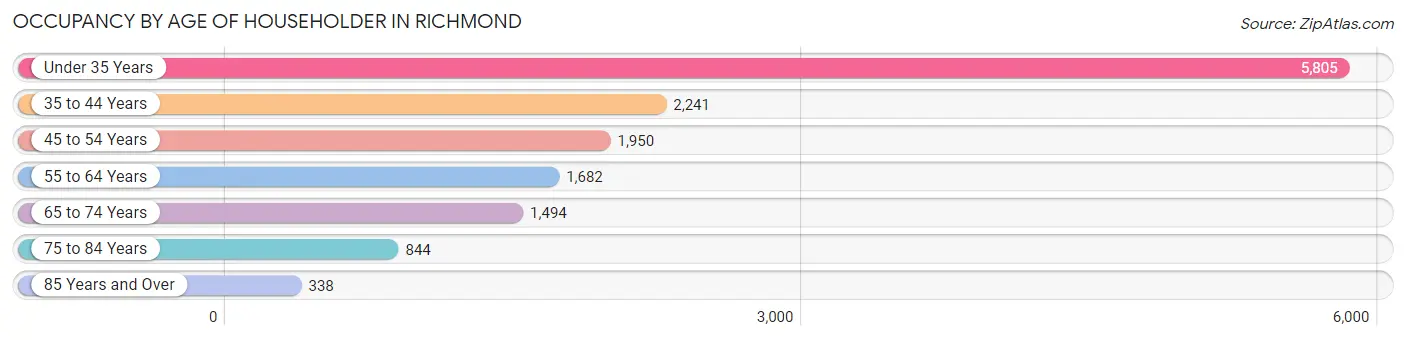
| Age Bracket | # Households | % Households |
| Under 35 Years | 5,805 | 40.4% |
| 35 to 44 Years | 2,241 | 15.6% |
| 45 to 54 Years | 1,950 | 13.6% |
| 55 to 64 Years | 1,682 | 11.7% |
| 65 to 74 Years | 1,494 | 10.4% |
| 75 to 84 Years | 844 | 5.9% |
| 85 Years and Over | 338 | 2.4% |
| Total | 14,354 | 100.0% |
Housing Finances in Richmond
Median Income by Occupancy in Richmond
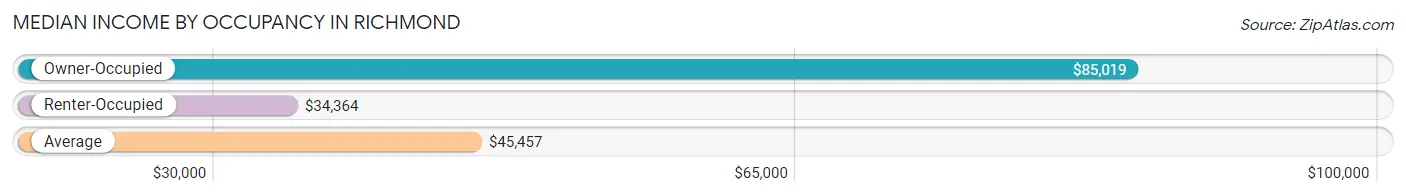
| Occupancy Type | # Households | Median Income |
| Owner-Occupied | 5,510 (38.4%) | $85,019 |
| Renter-Occupied | 8,844 (61.6%) | $34,364 |
| Average | 14,354 (100.0%) | $45,457 |
Occupancy by Householder Income Bracket in Richmond

| Income Bracket | Owner-occupied | Renter-occupied |
| Less than $5,000 | 54 (1.0%) | 563 (6.4%) |
| $5,000 to $9,999 | 49 (0.9%) | 328 (3.7%) |
| $10,000 to $14,999 | 97 (1.8%) | 983 (11.1%) |
| $15,000 to $19,999 | 195 (3.5%) | 862 (9.8%) |
| $20,000 to $24,999 | 204 (3.7%) | 520 (5.9%) |
| $25,000 to $34,999 | 377 (6.8%) | 1,320 (14.9%) |
| $35,000 to $49,999 | 654 (11.9%) | 1,670 (18.9%) |
| $50,000 to $74,999 | 789 (14.3%) | 1,124 (12.7%) |
| $75,000 to $99,999 | 1,014 (18.4%) | 833 (9.4%) |
| $100,000 to $149,999 | 1,152 (20.9%) | 443 (5.0%) |
| $150,000 or more | 925 (16.8%) | 198 (2.2%) |
| Total | 5,510 (100.0%) | 8,844 (100.0%) |
Monthly Housing Cost Tiers in Richmond
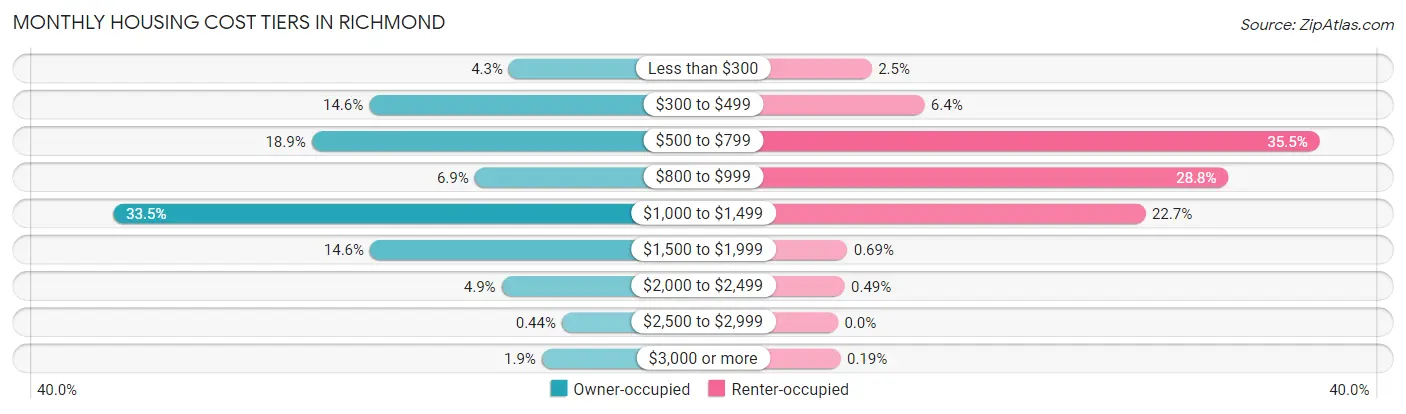
| Monthly Cost | Owner-occupied | Renter-occupied |
| Less than $300 | 239 (4.3%) | 220 (2.5%) |
| $300 to $499 | 806 (14.6%) | 563 (6.4%) |
| $500 to $799 | 1,040 (18.9%) | 3,140 (35.5%) |
| $800 to $999 | 378 (6.9%) | 2,546 (28.8%) |
| $1,000 to $1,499 | 1,845 (33.5%) | 2,003 (22.7%) |
| $1,500 to $1,999 | 803 (14.6%) | 61 (0.7%) |
| $2,000 to $2,499 | 269 (4.9%) | 43 (0.5%) |
| $2,500 to $2,999 | 24 (0.4%) | 0 (0.0%) |
| $3,000 or more | 106 (1.9%) | 17 (0.2%) |
| Total | 5,510 (100.0%) | 8,844 (100.0%) |
Physical Housing Characteristics in Richmond
Housing Structures in Richmond
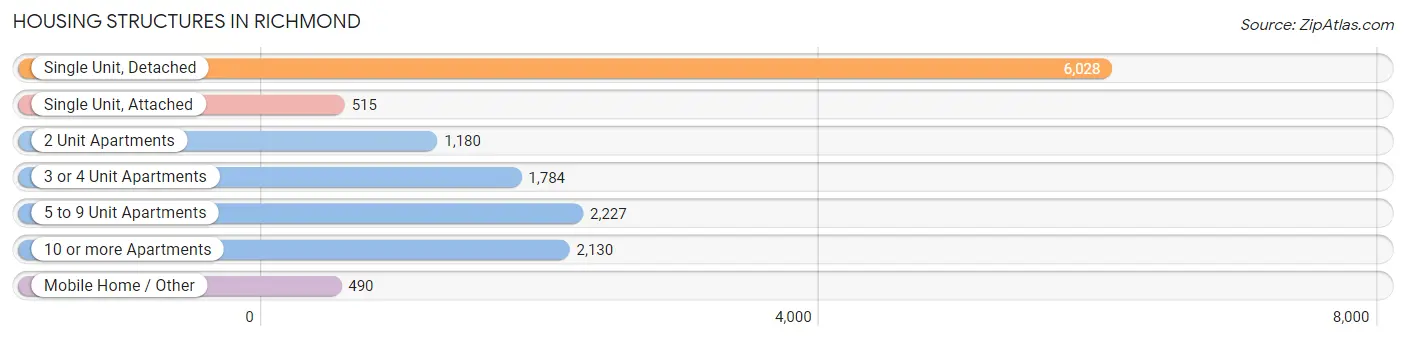
| Structure Type | # Housing Units | % Housing Units |
| Single Unit, Detached | 6,028 | 42.0% |
| Single Unit, Attached | 515 | 3.6% |
| 2 Unit Apartments | 1,180 | 8.2% |
| 3 or 4 Unit Apartments | 1,784 | 12.4% |
| 5 to 9 Unit Apartments | 2,227 | 15.5% |
| 10 or more Apartments | 2,130 | 14.8% |
| Mobile Home / Other | 490 | 3.4% |
| Total | 14,354 | 100.0% |
Housing Structures by Occupancy in Richmond
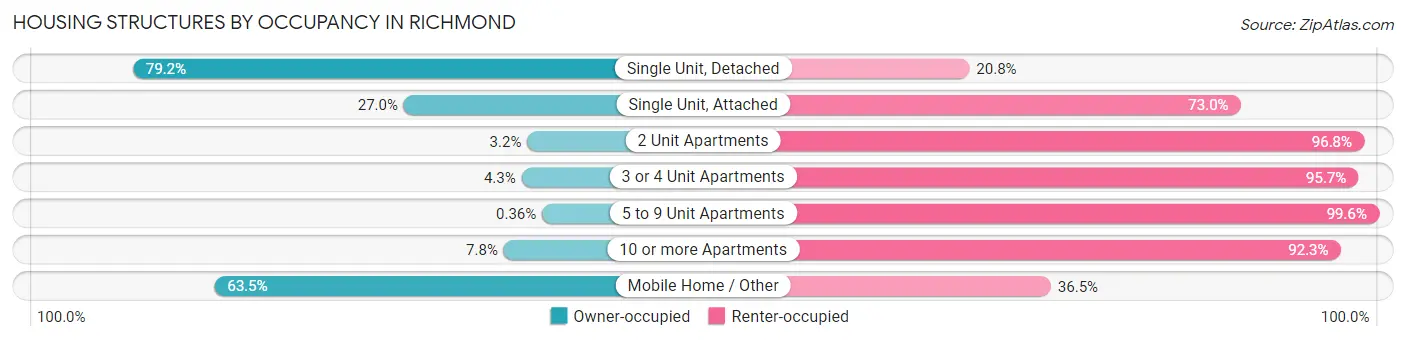
| Structure Type | Owner-occupied | Renter-occupied |
| Single Unit, Detached | 4,772 (79.2%) | 1,256 (20.8%) |
| Single Unit, Attached | 139 (27.0%) | 376 (73.0%) |
| 2 Unit Apartments | 38 (3.2%) | 1,142 (96.8%) |
| 3 or 4 Unit Apartments | 77 (4.3%) | 1,707 (95.7%) |
| 5 to 9 Unit Apartments | 8 (0.4%) | 2,219 (99.6%) |
| 10 or more Apartments | 165 (7.7%) | 1,965 (92.2%) |
| Mobile Home / Other | 311 (63.5%) | 179 (36.5%) |
| Total | 5,510 (38.4%) | 8,844 (61.6%) |
Housing Structures by Number of Rooms in Richmond
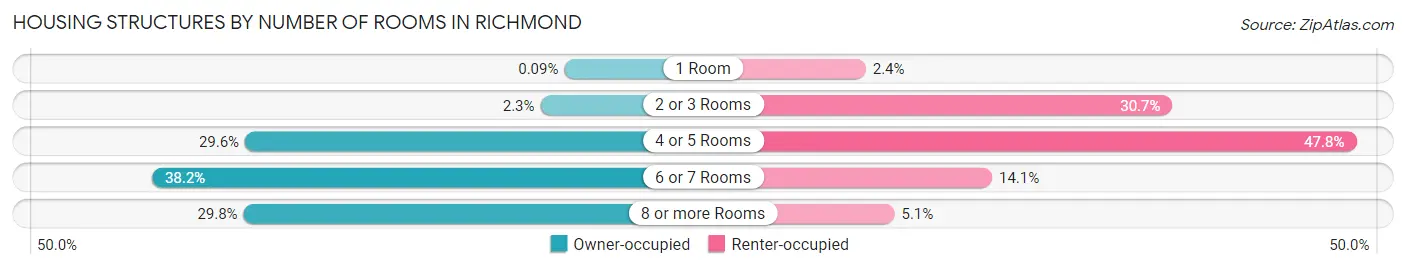
| Number of Rooms | Owner-occupied | Renter-occupied |
| 1 Room | 5 (0.1%) | 211 (2.4%) |
| 2 or 3 Rooms | 127 (2.3%) | 2,719 (30.7%) |
| 4 or 5 Rooms | 1,632 (29.6%) | 4,223 (47.7%) |
| 6 or 7 Rooms | 2,106 (38.2%) | 1,244 (14.1%) |
| 8 or more Rooms | 1,640 (29.8%) | 447 (5.1%) |
| Total | 5,510 (100.0%) | 8,844 (100.0%) |
Housing Structure by Heating Type in Richmond
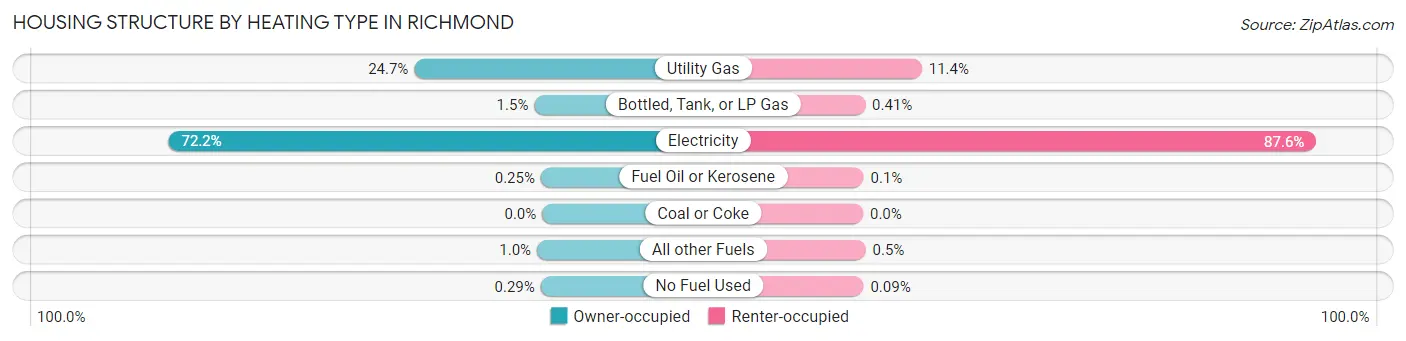
| Heating Type | Owner-occupied | Renter-occupied |
| Utility Gas | 1,362 (24.7%) | 1,004 (11.4%) |
| Bottled, Tank, or LP Gas | 84 (1.5%) | 36 (0.4%) |
| Electricity | 3,979 (72.2%) | 7,743 (87.5%) |
| Fuel Oil or Kerosene | 14 (0.3%) | 9 (0.1%) |
| Coal or Coke | 0 (0.0%) | 0 (0.0%) |
| All other Fuels | 55 (1.0%) | 44 (0.5%) |
| No Fuel Used | 16 (0.3%) | 8 (0.1%) |
| Total | 5,510 (100.0%) | 8,844 (100.0%) |
Household Vehicle Usage in Richmond
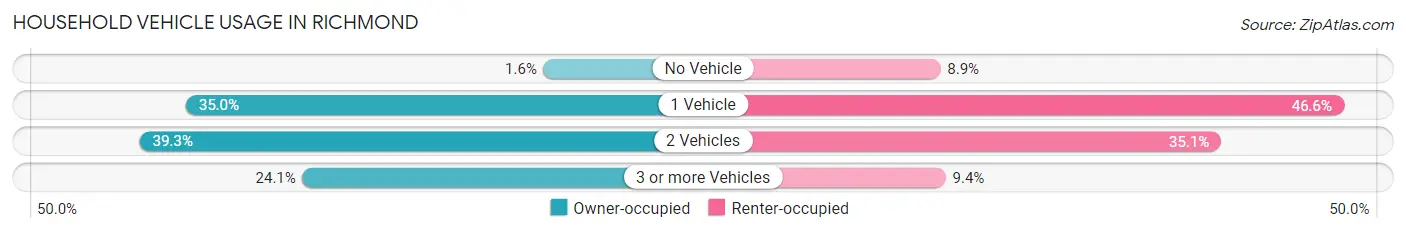
| Vehicles per Household | Owner-occupied | Renter-occupied |
| No Vehicle | 90 (1.6%) | 788 (8.9%) |
| 1 Vehicle | 1,926 (34.9%) | 4,119 (46.6%) |
| 2 Vehicles | 2,164 (39.3%) | 3,106 (35.1%) |
| 3 or more Vehicles | 1,330 (24.1%) | 831 (9.4%) |
| Total | 5,510 (100.0%) | 8,844 (100.0%) |
Real Estate & Mortgages in Richmond
Real Estate and Mortgage Overview in Richmond
| Characteristic | Without Mortgage | With Mortgage |
| Housing Units | 1,817 | 3,693 |
| Median Property Value | $146,300 | $188,500 |
| Median Household Income | $56,463 | $580 |
| Monthly Housing Costs | $468 | $106 |
| Real Estate Taxes | $1,309 | $271 |
Property Value by Mortgage Status in Richmond
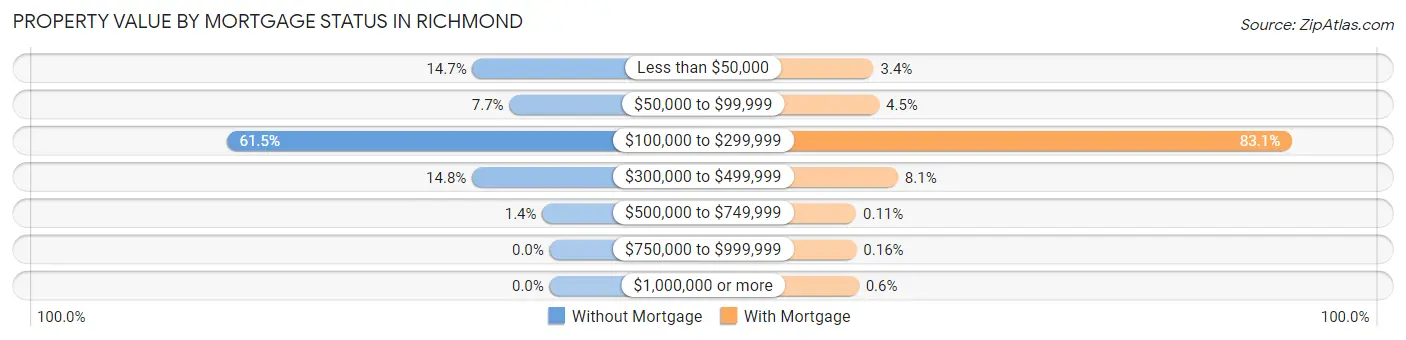
| Property Value | Without Mortgage | With Mortgage |
| Less than $50,000 | 267 (14.7%) | 127 (3.4%) |
| $50,000 to $99,999 | 139 (7.6%) | 166 (4.5%) |
| $100,000 to $299,999 | 1,118 (61.5%) | 3,070 (83.1%) |
| $300,000 to $499,999 | 268 (14.7%) | 298 (8.1%) |
| $500,000 to $749,999 | 25 (1.4%) | 4 (0.1%) |
| $750,000 to $999,999 | 0 (0.0%) | 6 (0.2%) |
| $1,000,000 or more | 0 (0.0%) | 22 (0.6%) |
| Total | 1,817 (100.0%) | 3,693 (100.0%) |
Household Income by Mortgage Status in Richmond
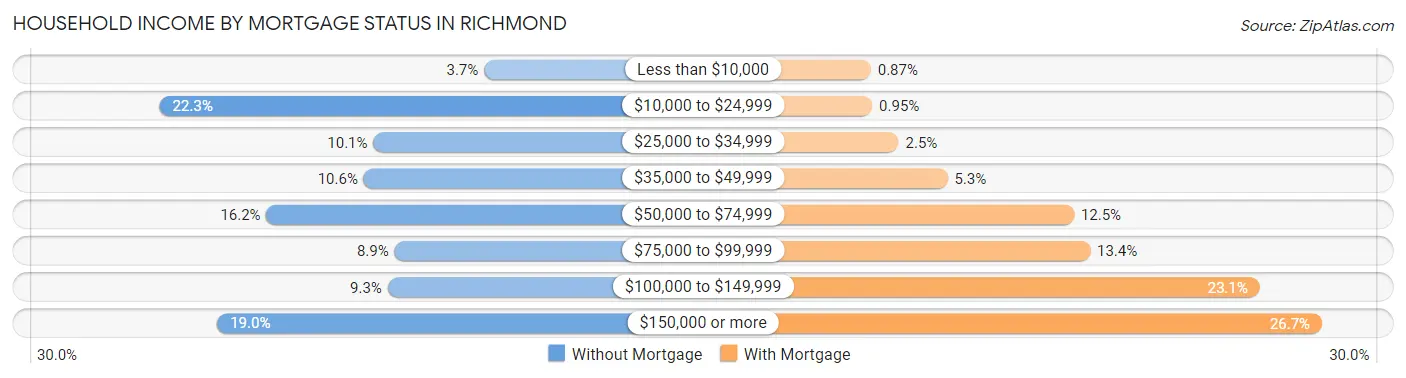
| Household Income | Without Mortgage | With Mortgage |
| Less than $10,000 | 68 (3.7%) | 32 (0.9%) |
| $10,000 to $24,999 | 405 (22.3%) | 35 (0.9%) |
| $25,000 to $34,999 | 183 (10.1%) | 91 (2.5%) |
| $35,000 to $49,999 | 193 (10.6%) | 194 (5.2%) |
| $50,000 to $74,999 | 294 (16.2%) | 461 (12.5%) |
| $75,000 to $99,999 | 161 (8.9%) | 495 (13.4%) |
| $100,000 to $149,999 | 168 (9.2%) | 853 (23.1%) |
| $150,000 or more | 345 (19.0%) | 984 (26.7%) |
| Total | 1,817 (100.0%) | 3,693 (100.0%) |
Property Value to Household Income Ratio in Richmond
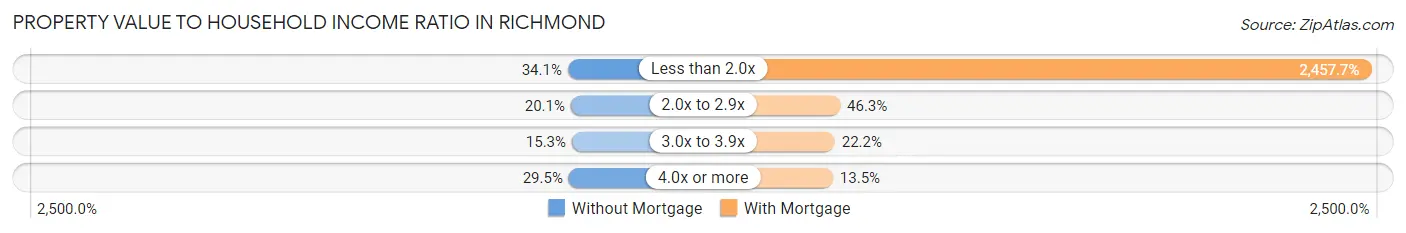
| Value-to-Income Ratio | Without Mortgage | With Mortgage |
| Less than 2.0x | 620 (34.1%) | 90,764 (2,457.7%) |
| 2.0x to 2.9x | 365 (20.1%) | 1,709 (46.3%) |
| 3.0x to 3.9x | 278 (15.3%) | 821 (22.2%) |
| 4.0x or more | 536 (29.5%) | 498 (13.5%) |
| Total | 1,817 (100.0%) | 3,693 (100.0%) |
Real Estate Taxes by Mortgage Status in Richmond
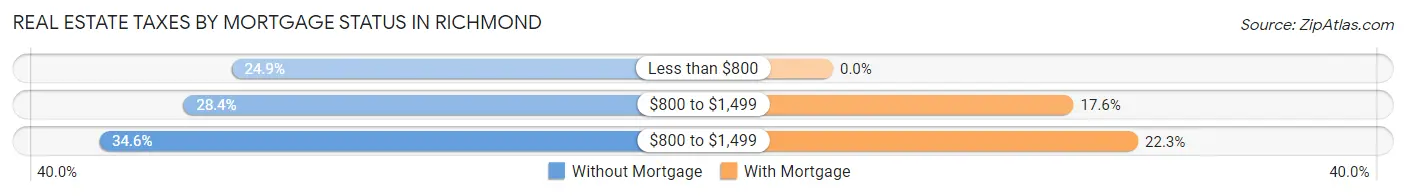
| Property Taxes | Without Mortgage | With Mortgage |
| Less than $800 | 452 (24.9%) | 0 (0.0%) |
| $800 to $1,499 | 516 (28.4%) | 649 (17.6%) |
| $800 to $1,499 | 628 (34.6%) | 823 (22.3%) |
| Total | 1,817 (100.0%) | 3,693 (100.0%) |
Health & Disability in Richmond
Health Insurance Coverage by Age in Richmond
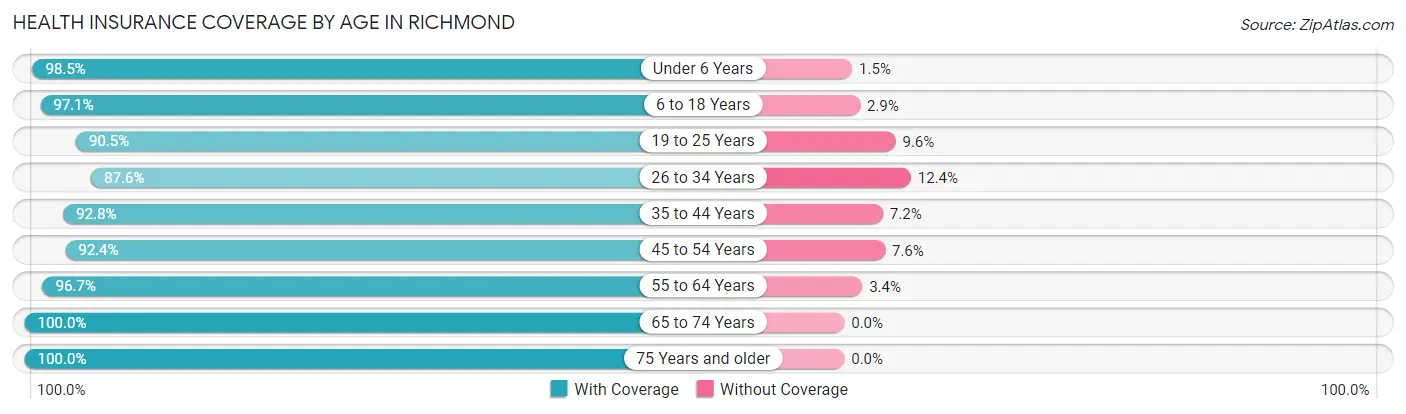
| Age Bracket | With Coverage | Without Coverage |
| Under 6 Years | 1,947 (98.5%) | 29 (1.5%) |
| 6 to 18 Years | 5,100 (97.1%) | 154 (2.9%) |
| 19 to 25 Years | 8,243 (90.4%) | 870 (9.6%) |
| 26 to 34 Years | 3,968 (87.6%) | 562 (12.4%) |
| 35 to 44 Years | 3,801 (92.8%) | 295 (7.2%) |
| 45 to 54 Years | 2,702 (92.4%) | 222 (7.6%) |
| 55 to 64 Years | 2,542 (96.7%) | 88 (3.4%) |
| 65 to 74 Years | 2,056 (100.0%) | 0 (0.0%) |
| 75 Years and older | 1,651 (100.0%) | 0 (0.0%) |
| Total | 32,010 (93.5%) | 2,220 (6.5%) |
Health Insurance Coverage by Citizenship Status in Richmond
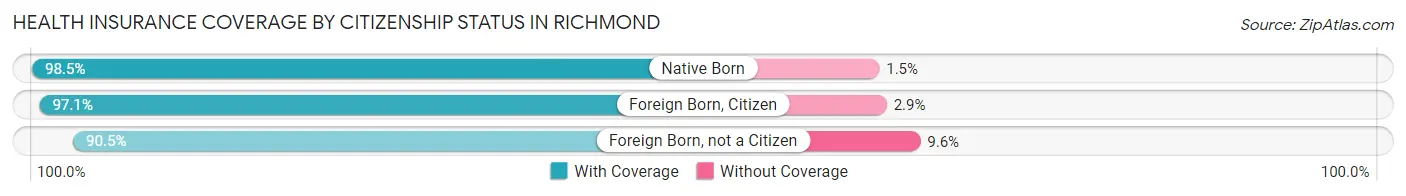
| Citizenship Status | With Coverage | Without Coverage |
| Native Born | 1,947 (98.5%) | 29 (1.5%) |
| Foreign Born, Citizen | 5,100 (97.1%) | 154 (2.9%) |
| Foreign Born, not a Citizen | 8,243 (90.4%) | 870 (9.6%) |
Health Insurance Coverage by Household Income in Richmond
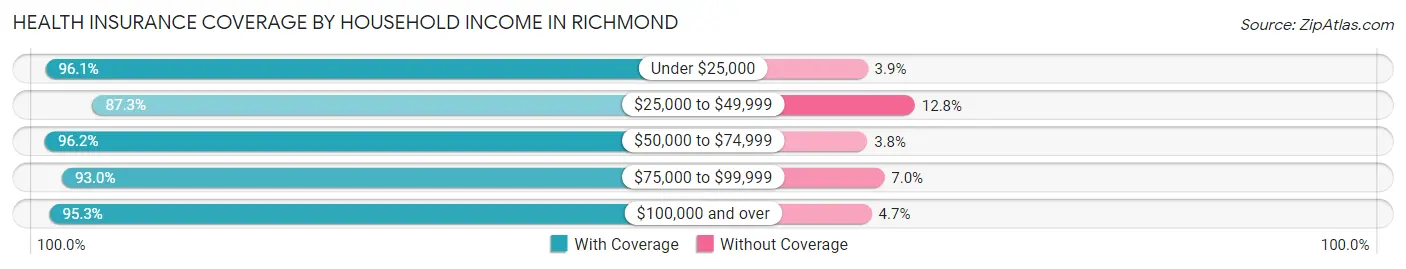
| Household Income | With Coverage | Without Coverage |
| Under $25,000 | 5,757 (96.1%) | 234 (3.9%) |
| $25,000 to $49,999 | 6,496 (87.3%) | 949 (12.8%) |
| $50,000 to $74,999 | 4,054 (96.2%) | 162 (3.8%) |
| $75,000 to $99,999 | 4,176 (93.0%) | 316 (7.0%) |
| $100,000 and over | 8,345 (95.3%) | 408 (4.7%) |
Public vs Private Health Insurance Coverage by Age in Richmond
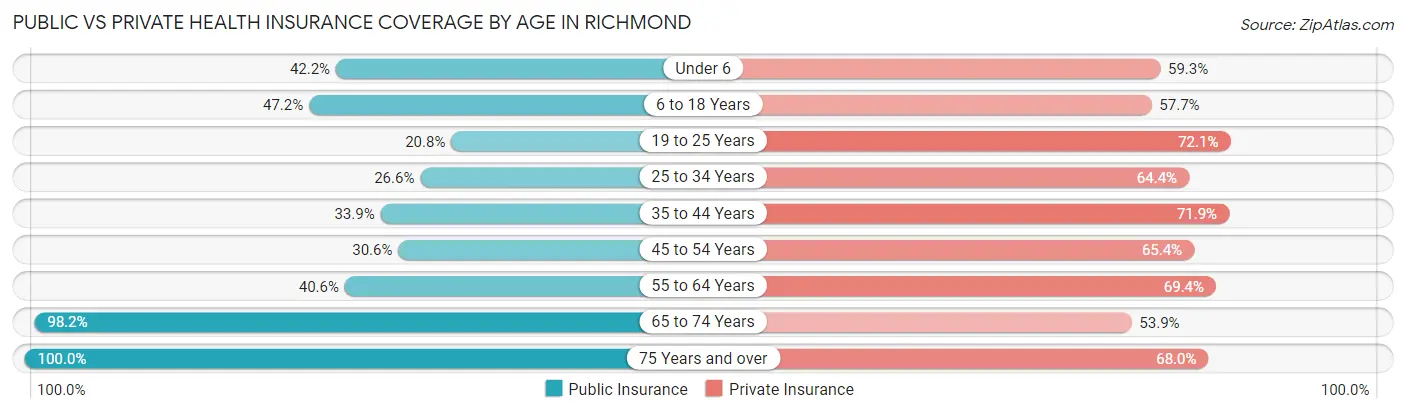
| Age Bracket | Public Insurance | Private Insurance |
| Under 6 | 834 (42.2%) | 1,171 (59.3%) |
| 6 to 18 Years | 2,480 (47.2%) | 3,029 (57.7%) |
| 19 to 25 Years | 1,896 (20.8%) | 6,570 (72.1%) |
| 25 to 34 Years | 1,203 (26.6%) | 2,918 (64.4%) |
| 35 to 44 Years | 1,390 (33.9%) | 2,943 (71.9%) |
| 45 to 54 Years | 896 (30.6%) | 1,911 (65.4%) |
| 55 to 64 Years | 1,067 (40.6%) | 1,826 (69.4%) |
| 65 to 74 Years | 2,019 (98.2%) | 1,109 (53.9%) |
| 75 Years and over | 1,651 (100.0%) | 1,123 (68.0%) |
| Total | 13,436 (39.3%) | 22,600 (66.0%) |
Disability Status by Sex by Age in Richmond
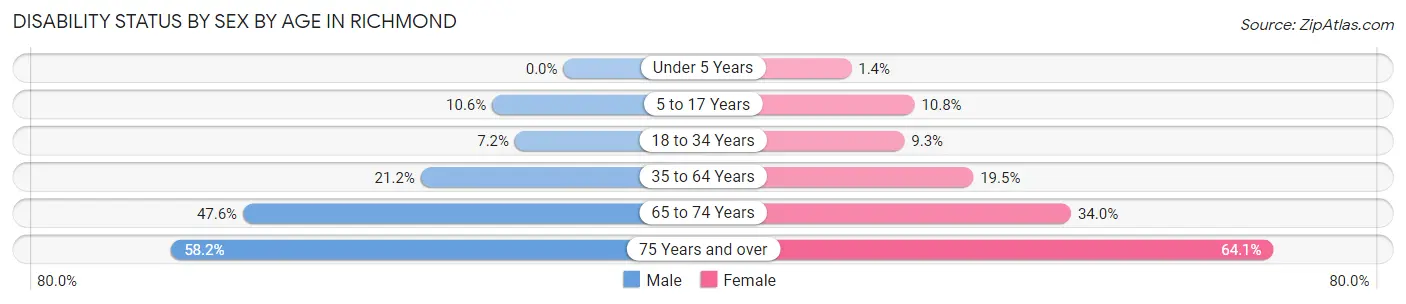
| Age Bracket | Male | Female |
| Under 5 Years | 0 (0.0%) | 8 (1.4%) |
| 5 to 17 Years | 200 (10.6%) | 250 (10.8%) |
| 18 to 34 Years | 541 (7.2%) | 688 (9.3%) |
| 35 to 64 Years | 970 (21.2%) | 990 (19.5%) |
| 65 to 74 Years | 412 (47.6%) | 405 (34.0%) |
| 75 Years and over | 287 (58.2%) | 742 (64.1%) |
Disability Class by Sex by Age in Richmond
Disability Class: Hearing Difficulty
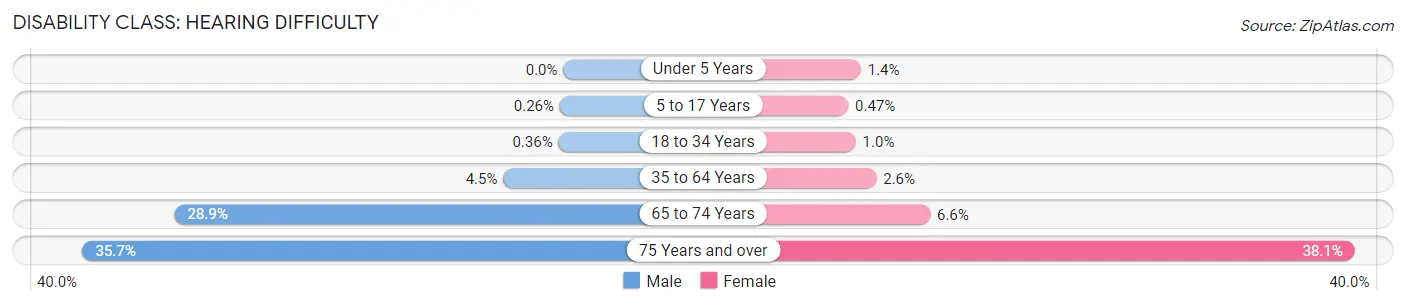
| Age Bracket | Male | Female |
| Under 5 Years | 0 (0.0%) | 8 (1.4%) |
| 5 to 17 Years | 5 (0.3%) | 11 (0.5%) |
| 18 to 34 Years | 27 (0.4%) | 76 (1.0%) |
| 35 to 64 Years | 204 (4.5%) | 130 (2.6%) |
| 65 to 74 Years | 250 (28.9%) | 78 (6.6%) |
| 75 Years and over | 176 (35.7%) | 441 (38.1%) |
Disability Class: Vision Difficulty
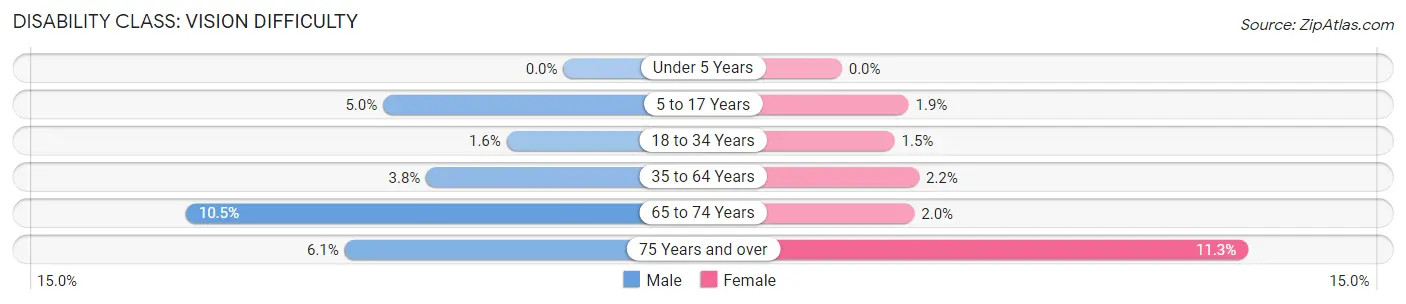
| Age Bracket | Male | Female |
| Under 5 Years | 0 (0.0%) | 0 (0.0%) |
| 5 to 17 Years | 95 (5.0%) | 43 (1.9%) |
| 18 to 34 Years | 119 (1.6%) | 109 (1.5%) |
| 35 to 64 Years | 175 (3.8%) | 109 (2.1%) |
| 65 to 74 Years | 91 (10.5%) | 24 (2.0%) |
| 75 Years and over | 30 (6.1%) | 131 (11.3%) |
Disability Class: Cognitive Difficulty
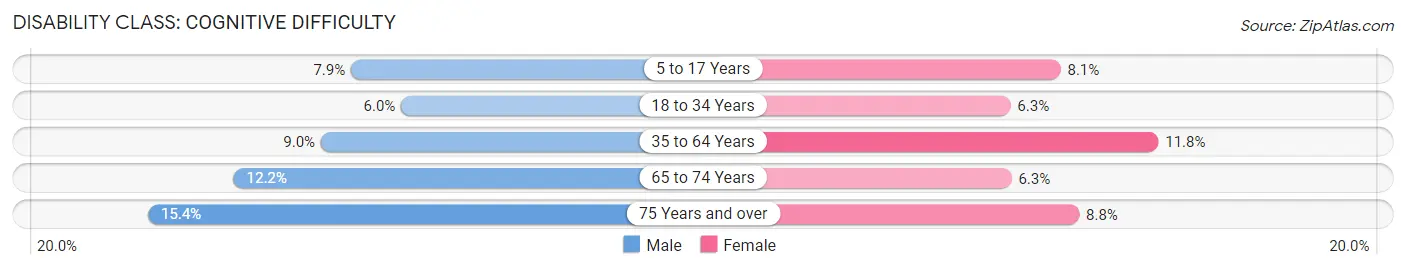
| Age Bracket | Male | Female |
| 5 to 17 Years | 149 (7.9%) | 188 (8.1%) |
| 18 to 34 Years | 452 (6.0%) | 464 (6.3%) |
| 35 to 64 Years | 412 (9.0%) | 596 (11.7%) |
| 65 to 74 Years | 106 (12.2%) | 75 (6.3%) |
| 75 Years and over | 76 (15.4%) | 102 (8.8%) |
Disability Class: Ambulatory Difficulty
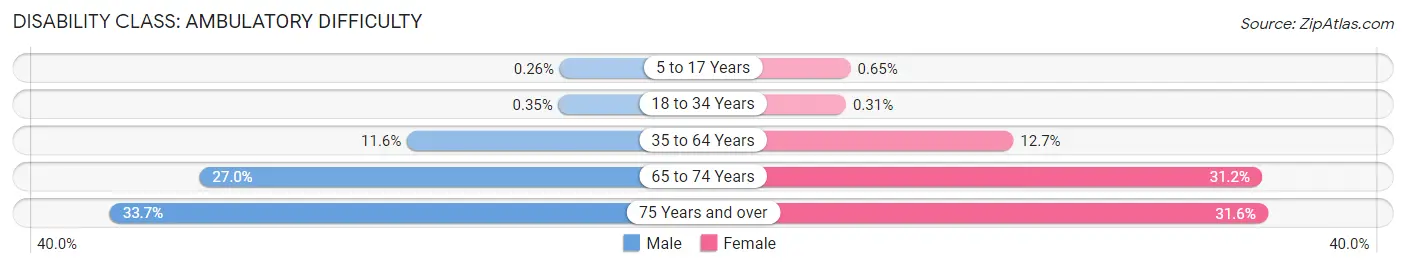
| Age Bracket | Male | Female |
| 5 to 17 Years | 5 (0.3%) | 15 (0.6%) |
| 18 to 34 Years | 26 (0.4%) | 23 (0.3%) |
| 35 to 64 Years | 531 (11.6%) | 646 (12.7%) |
| 65 to 74 Years | 234 (27.0%) | 371 (31.2%) |
| 75 Years and over | 166 (33.7%) | 366 (31.6%) |
Disability Class: Self-Care Difficulty
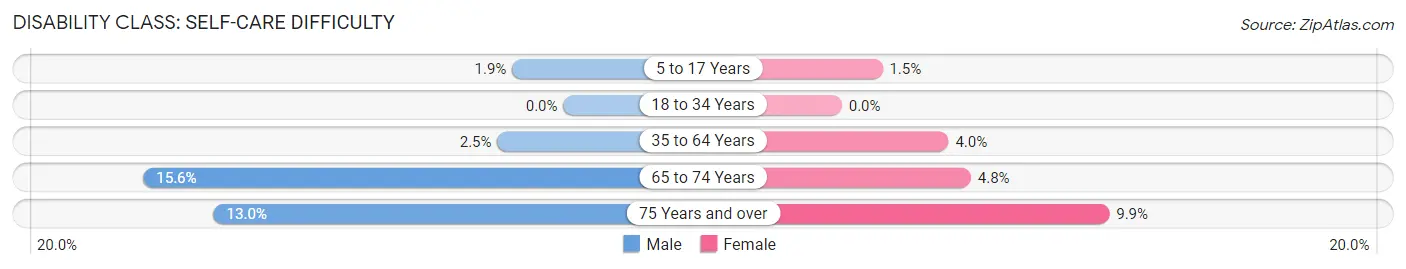
| Age Bracket | Male | Female |
| 5 to 17 Years | 36 (1.9%) | 35 (1.5%) |
| 18 to 34 Years | 0 (0.0%) | 0 (0.0%) |
| 35 to 64 Years | 112 (2.5%) | 201 (4.0%) |
| 65 to 74 Years | 135 (15.6%) | 57 (4.8%) |
| 75 Years and over | 64 (13.0%) | 115 (9.9%) |
Technology Access in Richmond
Computing Device Access in Richmond
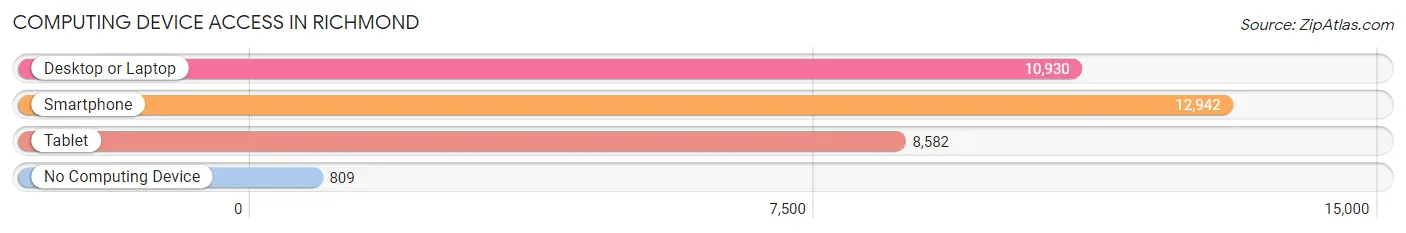
| Device Type | # Households | % Households |
| Desktop or Laptop | 10,930 | 76.1% |
| Smartphone | 12,942 | 90.2% |
| Tablet | 8,582 | 59.8% |
| No Computing Device | 809 | 5.6% |
| Total | 14,354 | 100.0% |
Internet Access in Richmond
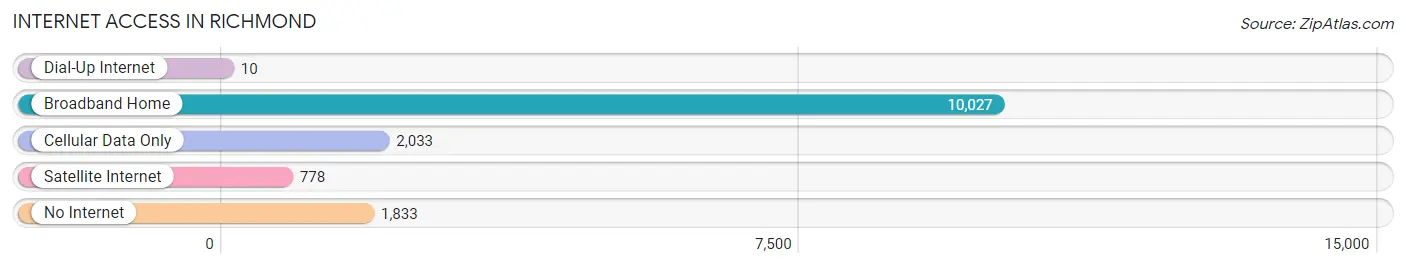
| Internet Type | # Households | % Households |
| Dial-Up Internet | 10 | 0.1% |
| Broadband Home | 10,027 | 69.9% |
| Cellular Data Only | 2,033 | 14.2% |
| Satellite Internet | 778 | 5.4% |
| No Internet | 1,833 | 12.8% |
| Total | 14,354 | 100.0% |
Richmond Summary
Richmond, Kentucky is a city located in Madison County, Kentucky, United States. It is the county seat of Madison County and the principal city of the Richmond-Berea Micropolitan Statistical Area, which includes all of Madison and Rockcastle counties. As of the 2010 census, the city had a population of 33,533.
History
Richmond was founded in 1798 by Colonel John Miller, who was a Revolutionary War veteran. The city was named after Miller's friend, Charles Lennox, 3rd Duke of Richmond. The city was incorporated in 1810 and became the county seat of Madison County in 1814.
During the Civil War, Richmond was the site of a major battle in 1862, the Battle of Richmond. The Confederate Army was defeated by the Union Army, and the city was occupied by Union forces for the remainder of the war.
In the late 19th century, Richmond became a major center for tobacco production and processing. The city was also home to several large manufacturing plants, including the Richmond Iron Works and the Richmond Carriage Works.
Geography
Richmond is located in central Kentucky, approximately 25 miles south of Lexington. It is situated in the foothills of the Appalachian Mountains, and is surrounded by rolling hills and farmland. The city is located at the junction of Interstate 75 and US 25.
The city has a total area of 16.2 square miles, of which 16.1 square miles is land and 0.1 square miles is water.
Economy
Richmond's economy is largely based on manufacturing and agriculture. The city is home to several large manufacturing plants, including the Richmond Iron Works and the Richmond Carriage Works. The city is also home to several large agricultural operations, including tobacco, corn, and soybean farms.
The city is also home to Eastern Kentucky University, which is a major employer in the area. The university has an enrollment of over 16,000 students and employs over 1,000 faculty and staff.
Demographics
As of the 2010 census, there were 33,533 people, 13,845 households, and 8,717 families residing in the city. The population density was 2,072.3 people per square mile. The racial makeup of the city was 84.2% White, 11.3% African American, 0.3% Native American, 0.7% Asian, 0.1% Pacific Islander, 1.2% from other races, and 2.3% from two or more races. Hispanic or Latino of any race were 3.2% of the population.
The median income for a household in the city was $31,919, and the median income for a family was $41,919. The per capita income for the city was $17,845. About 17.2% of families and 22.2% of the population were below the poverty line, including 28.3% of those under age 18 and 14.2% of those age 65 or over.
Common Questions
What is Per Capita Income in Richmond?
Per Capita income in Richmond is $26,787.
What is the Median Family Income in Richmond?
Median Family Income in Richmond is $69,651.
What is the Median Household income in Richmond?
Median Household Income in Richmond is $45,457.
What is Income or Wage Gap in Richmond?
Income or Wage Gap in Richmond is 35.1%.
Women in Richmond earn 64.9 cents for every dollar earned by a man.
What is Family Income Deficit in Richmond?
Family Income Deficit in Richmond is $11,702.
Families that are below poverty line in Richmond earn $11,702 less on average than the poverty threshold level.
What is Inequality or Gini Index in Richmond?
Inequality or Gini Index in Richmond is 0.45.
What is the Total Population of Richmond?
Total Population of Richmond is 34,883.
What is the Total Male Population of Richmond?
Total Male Population of Richmond is 16,881.
What is the Total Female Population of Richmond?
Total Female Population of Richmond is 18,002.
What is the Ratio of Males per 100 Females in Richmond?
There are 93.77 Males per 100 Females in Richmond.
What is the Ratio of Females per 100 Males in Richmond?
There are 106.64 Females per 100 Males in Richmond.
What is the Median Population Age in Richmond?
Median Population Age in Richmond is 27.7 Years.
What is the Average Family Size in Richmond
Average Family Size in Richmond is 3.0 People.
What is the Average Household Size in Richmond
Average Household Size in Richmond is 2.2 People.
How Large is the Labor Force in Richmond?
There are 20,007 People in the Labor Forcein in Richmond.
What is the Percentage of People in the Labor Force in Richmond?
67.7% of People are in the Labor Force in Richmond.
What is the Unemployment Rate in Richmond?
Unemployment Rate in Richmond is 7.3%.