Briarwood, KY Map & Demographics
Briarwood Map
Briarwood Overview
$43,860
PER CAPITA INCOME
$78,750
AVG FAMILY INCOME
$75,147
AVG HOUSEHOLD INCOME
17.1%
WAGE / INCOME GAP [ % ]
82.9¢/ $1
WAGE / INCOME GAP [ $ ]
0.33
INEQUALITY / GINI INDEX
385
TOTAL POPULATION
185
MALE POPULATION
200
FEMALE POPULATION
92.50
MALES / 100 FEMALES
108.11
FEMALES / 100 MALES
47.1
MEDIAN AGE
2.5
AVG FAMILY SIZE
1.9
AVG HOUSEHOLD SIZE
220
LABOR FORCE [ PEOPLE ]
65.7%
PERCENT IN LABOR FORCE
5.0%
UNEMPLOYMENT RATE
Briarwood Area Codes
Income in Briarwood
Income Overview in Briarwood
Per Capita Income in Briarwood is $43,860, while median incomes of families and households are $78,750 and $75,147 respectively.
| Characteristic | Number | Measure |
| Per Capita Income | 385 | $43,860 |
| Median Family Income | 108 | $78,750 |
| Mean Family Income | 108 | $90,432 |
| Median Household Income | 202 | $75,147 |
| Mean Household Income | 202 | $83,269 |
| Income Deficit | 108 | $0 |
| Wage / Income Gap (%) | 385 | 17.09% |
| Wage / Income Gap ($) | 385 | 82.91¢ per $1 |
| Gini / Inequality Index | 385 | 0.33 |
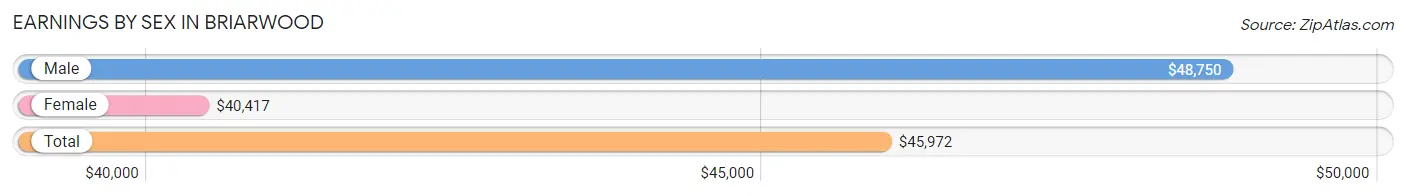
Earnings by Sex in Briarwood
Average Earnings in Briarwood are $45,972, $48,750 for men and $40,417 for women, a difference of 17.1%.
| Sex | Number | Average Earnings |
| Male | 120 (48.4%) | $48,750 |
| Female | 128 (51.6%) | $40,417 |
| Total | 248 (100.0%) | $45,972 |
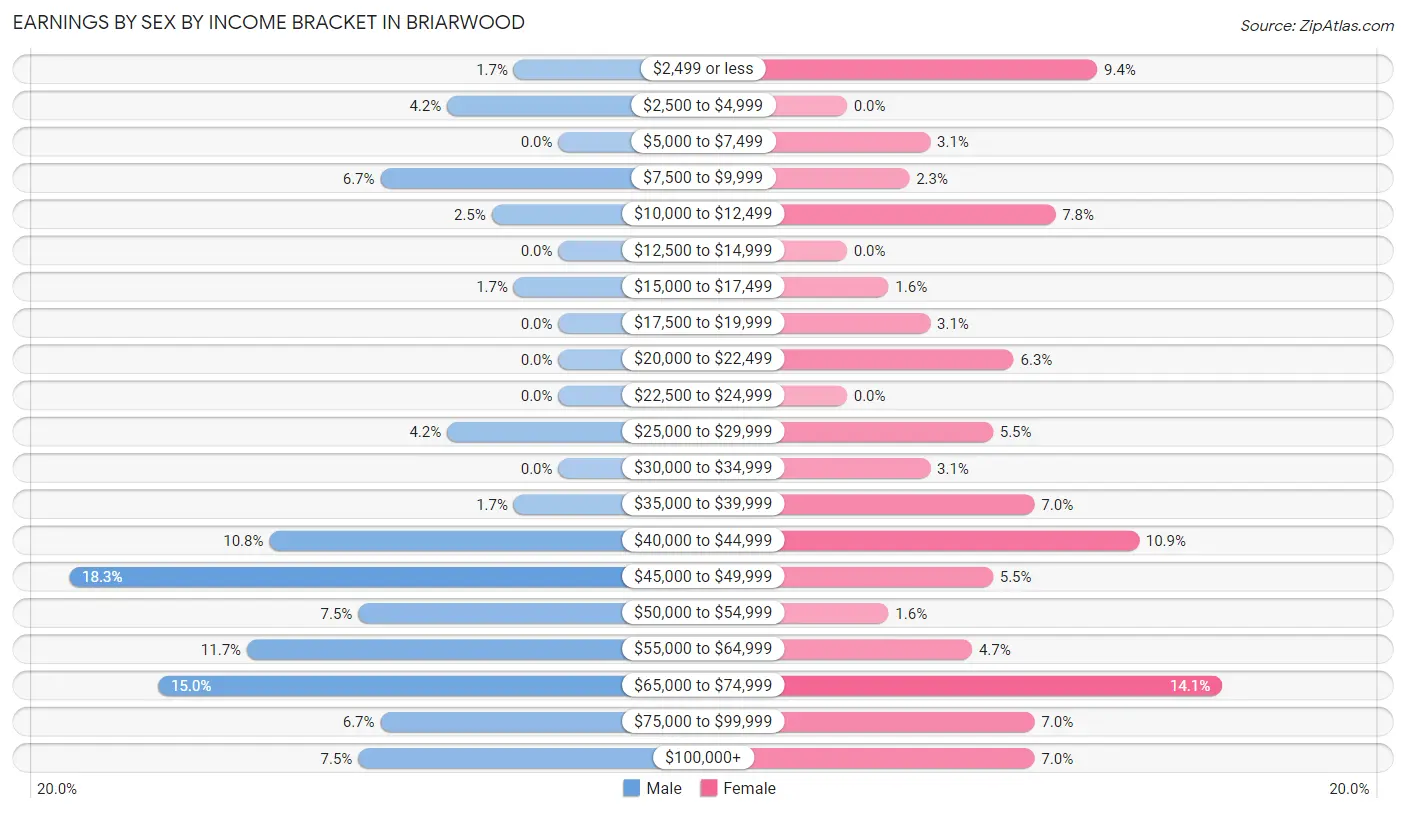
Earnings by Sex by Income Bracket in Briarwood
The most common earnings brackets in Briarwood are $45,000 to $49,999 for men (22 | 18.3%) and $65,000 to $74,999 for women (18 | 14.1%).
| Income | Male | Female |
| $2,499 or less | 2 (1.7%) | 12 (9.4%) |
| $2,500 to $4,999 | 5 (4.2%) | 0 (0.0%) |
| $5,000 to $7,499 | 0 (0.0%) | 4 (3.1%) |
| $7,500 to $9,999 | 8 (6.7%) | 3 (2.3%) |
| $10,000 to $12,499 | 3 (2.5%) | 10 (7.8%) |
| $12,500 to $14,999 | 0 (0.0%) | 0 (0.0%) |
| $15,000 to $17,499 | 2 (1.7%) | 2 (1.6%) |
| $17,500 to $19,999 | 0 (0.0%) | 4 (3.1%) |
| $20,000 to $22,499 | 0 (0.0%) | 8 (6.2%) |
| $22,500 to $24,999 | 0 (0.0%) | 0 (0.0%) |
| $25,000 to $29,999 | 5 (4.2%) | 7 (5.5%) |
| $30,000 to $34,999 | 0 (0.0%) | 4 (3.1%) |
| $35,000 to $39,999 | 2 (1.7%) | 9 (7.0%) |
| $40,000 to $44,999 | 13 (10.8%) | 14 (10.9%) |
| $45,000 to $49,999 | 22 (18.3%) | 7 (5.5%) |
| $50,000 to $54,999 | 9 (7.5%) | 2 (1.6%) |
| $55,000 to $64,999 | 14 (11.7%) | 6 (4.7%) |
| $65,000 to $74,999 | 18 (15.0%) | 18 (14.1%) |
| $75,000 to $99,999 | 8 (6.7%) | 9 (7.0%) |
| $100,000+ | 9 (7.5%) | 9 (7.0%) |
| Total | 120 (100.0%) | 128 (100.0%) |
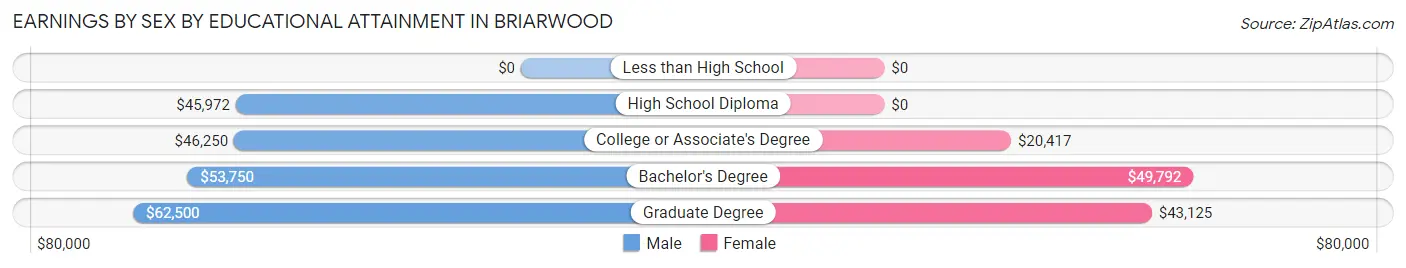
Earnings by Sex by Educational Attainment in Briarwood
Average earnings in Briarwood are $50,625 for men and $42,917 for women, a difference of 15.2%. Men with an educational attainment of graduate degree enjoy the highest average annual earnings of $62,500, while those with high school diploma education earn the least with $45,972. Women with an educational attainment of bachelor's degree earn the most with the average annual earnings of $49,792, while those with college or associate's degree education have the smallest earnings of $20,417.
| Educational Attainment | Male Income | Female Income |
| Less than High School | - | - |
| High School Diploma | $45,972 | $0 |
| College or Associate's Degree | $46,250 | $20,417 |
| Bachelor's Degree | $53,750 | $49,792 |
| Graduate Degree | $62,500 | $43,125 |
| Total | $50,625 | $42,917 |
Family Income in Briarwood
Family Income Brackets in Briarwood
According to the Briarwood family income data, there are 31 families falling into the $75,000 to $99,999 income range, which is the most common income bracket and makes up 28.7% of all families.
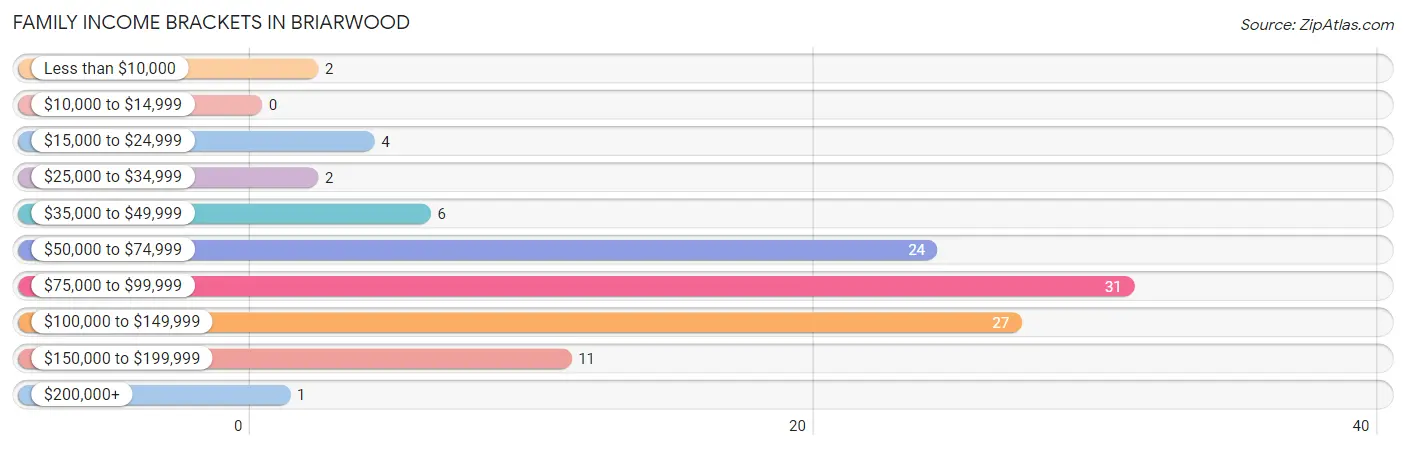
| Income Bracket | # Families | % Families |
| Less than $10,000 | 2 | 1.9% |
| $10,000 to $14,999 | 0 | 0.0% |
| $15,000 to $24,999 | 4 | 3.7% |
| $25,000 to $34,999 | 2 | 1.9% |
| $35,000 to $49,999 | 6 | 5.6% |
| $50,000 to $74,999 | 24 | 22.2% |
| $75,000 to $99,999 | 31 | 28.7% |
| $100,000 to $149,999 | 27 | 25.0% |
| $150,000 to $199,999 | 11 | 10.2% |
| $200,000+ | 1 | 0.9% |
Family Income by Famaliy Size in Briarwood
3-person families (28 | 25.9%) account for the highest median family income in Briarwood with $99,167 per family, while 2-person families (69 | 63.9%) have the highest median income of $39,062 per family member.
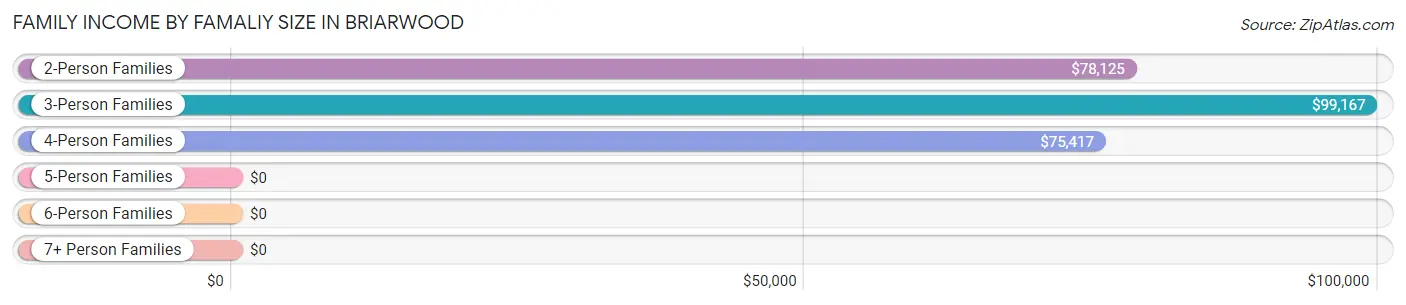
| Income Bracket | # Families | Median Income |
| 2-Person Families | 69 (63.9%) | $78,125 |
| 3-Person Families | 28 (25.9%) | $99,167 |
| 4-Person Families | 9 (8.3%) | $75,417 |
| 5-Person Families | 2 (1.8%) | $0 |
| 6-Person Families | 0 (0.0%) | $0 |
| 7+ Person Families | 0 (0.0%) | $0 |
| Total | 108 (100.0%) | $78,750 |
Family Income by Number of Earners in Briarwood
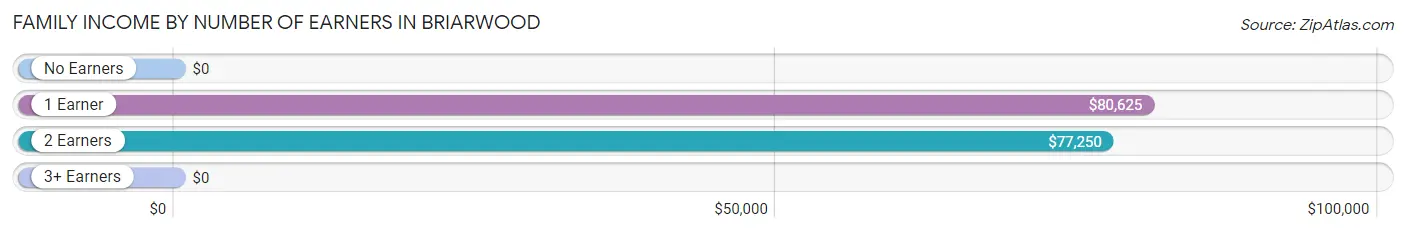
| Number of Earners | # Families | Median Income |
| No Earners | 12 (11.1%) | $0 |
| 1 Earner | 33 (30.6%) | $80,625 |
| 2 Earners | 61 (56.5%) | $77,250 |
| 3+ Earners | 2 (1.8%) | $0 |
| Total | 108 (100.0%) | $78,750 |
Household Income in Briarwood
Household Income Brackets in Briarwood
With 44 households falling in the category, the $75,000 to $99,999 income range is the most frequent in Briarwood, accounting for 21.8% of all households. In contrast, only 2 households (1.0%) fall into the less than $10,000 income bracket, making it the least populous group.
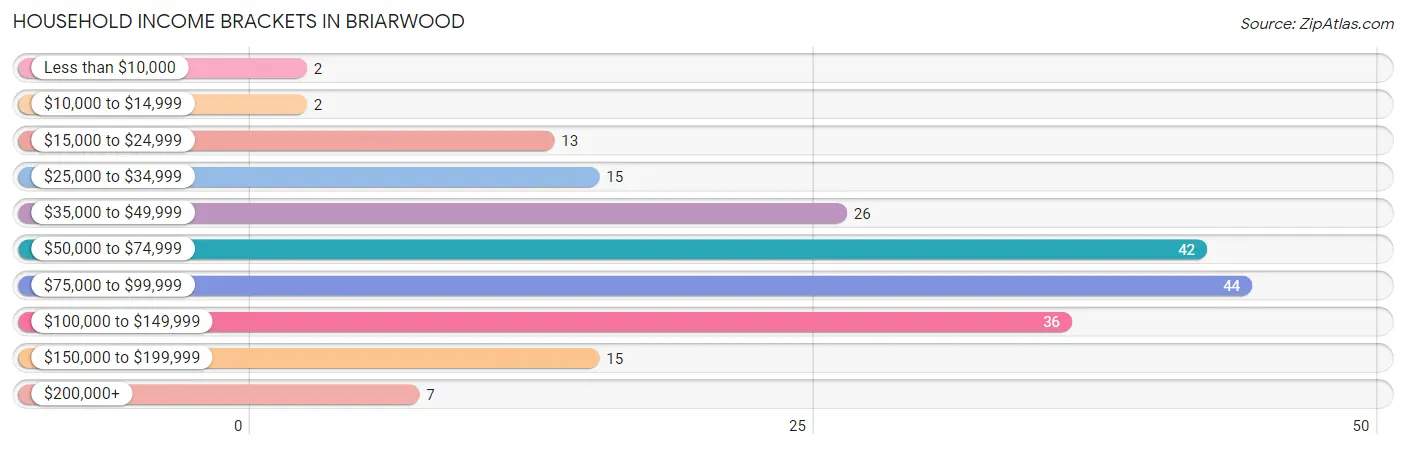
| Income Bracket | # Households | % Households |
| Less than $10,000 | 2 | 1.0% |
| $10,000 to $14,999 | 2 | 1.0% |
| $15,000 to $24,999 | 13 | 6.4% |
| $25,000 to $34,999 | 15 | 7.4% |
| $35,000 to $49,999 | 26 | 12.9% |
| $50,000 to $74,999 | 42 | 20.8% |
| $75,000 to $99,999 | 44 | 21.8% |
| $100,000 to $149,999 | 36 | 17.8% |
| $150,000 to $199,999 | 15 | 7.4% |
| $200,000+ | 7 | 3.5% |
Household Income by Householder Age in Briarwood
The median household income in Briarwood is $75,147, with the highest median household income of $76,250 found in the 65+ years age bracket for the primary householder. A total of 74 households (36.6%) fall into this category.
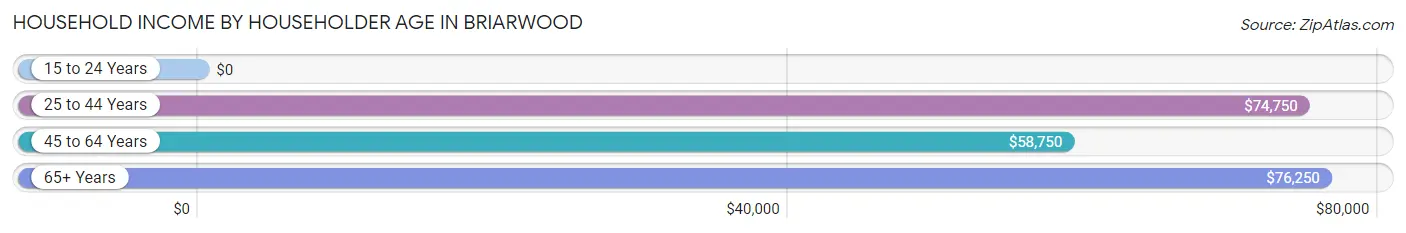
| Income Bracket | # Households | Median Income |
| 15 to 24 Years | 0 (0.0%) | $0 |
| 25 to 44 Years | 72 (35.6%) | $74,750 |
| 45 to 64 Years | 56 (27.7%) | $58,750 |
| 65+ Years | 74 (36.6%) | $76,250 |
| Total | 202 (100.0%) | $75,147 |
Poverty in Briarwood
Income Below Poverty by Sex and Age in Briarwood
With 4.9% poverty level for males and 5.5% for females among the residents of Briarwood, 16 and 17 year old males and under 5 year old females are the most vulnerable to poverty, with 2 males (100.0%) and 2 females (22.2%) in their respective age groups living below the poverty level.
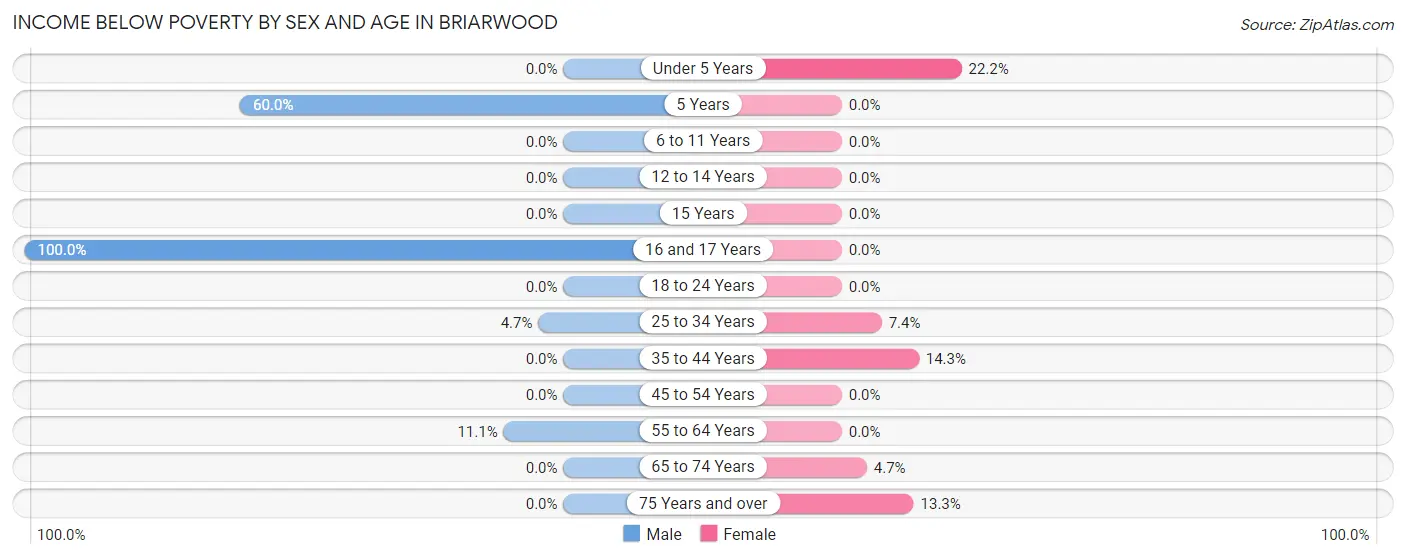
| Age Bracket | Male | Female |
| Under 5 Years | 0 (0.0%) | 2 (22.2%) |
| 5 Years | 3 (60.0%) | 0 (0.0%) |
| 6 to 11 Years | 0 (0.0%) | 0 (0.0%) |
| 12 to 14 Years | 0 (0.0%) | 0 (0.0%) |
| 15 Years | 0 (0.0%) | 0 (0.0%) |
| 16 and 17 Years | 2 (100.0%) | 0 (0.0%) |
| 18 to 24 Years | 0 (0.0%) | 0 (0.0%) |
| 25 to 34 Years | 2 (4.6%) | 2 (7.4%) |
| 35 to 44 Years | 0 (0.0%) | 3 (14.3%) |
| 45 to 54 Years | 0 (0.0%) | 0 (0.0%) |
| 55 to 64 Years | 2 (11.1%) | 0 (0.0%) |
| 65 to 74 Years | 0 (0.0%) | 2 (4.6%) |
| 75 Years and over | 0 (0.0%) | 2 (13.3%) |
| Total | 9 (4.9%) | 11 (5.5%) |
Income Above Poverty by Sex and Age in Briarwood
According to the poverty statistics in Briarwood, males aged under 5 years and females aged 6 to 11 years are the age groups that are most secure financially, with 100.0% of males and 100.0% of females in these age groups living above the poverty line.
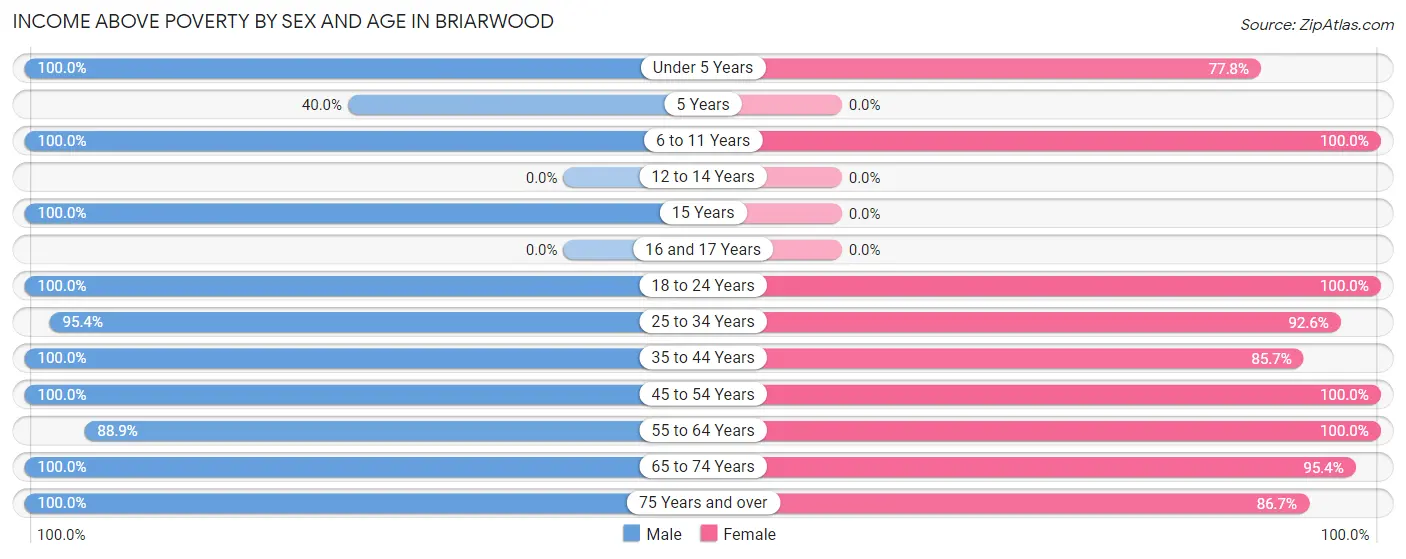
| Age Bracket | Male | Female |
| Under 5 Years | 17 (100.0%) | 7 (77.8%) |
| 5 Years | 2 (40.0%) | 0 (0.0%) |
| 6 to 11 Years | 8 (100.0%) | 9 (100.0%) |
| 12 to 14 Years | 0 (0.0%) | 0 (0.0%) |
| 15 Years | 2 (100.0%) | 0 (0.0%) |
| 16 and 17 Years | 0 (0.0%) | 0 (0.0%) |
| 18 to 24 Years | 5 (100.0%) | 16 (100.0%) |
| 25 to 34 Years | 41 (95.4%) | 25 (92.6%) |
| 35 to 44 Years | 21 (100.0%) | 18 (85.7%) |
| 45 to 54 Years | 17 (100.0%) | 25 (100.0%) |
| 55 to 64 Years | 16 (88.9%) | 35 (100.0%) |
| 65 to 74 Years | 31 (100.0%) | 41 (95.4%) |
| 75 Years and over | 16 (100.0%) | 13 (86.7%) |
| Total | 176 (95.1%) | 189 (94.5%) |
Income Below Poverty Among Married-Couple Families in Briarwood
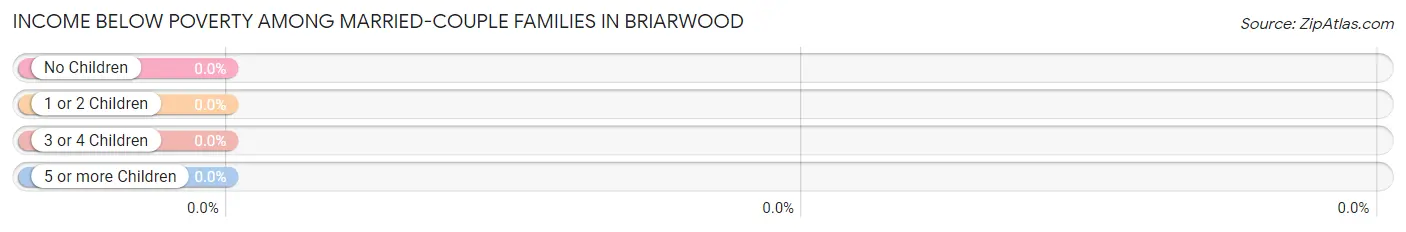
| Children | Above Poverty | Below Poverty |
| No Children | 59 (100.0%) | 0 (0.0%) |
| 1 or 2 Children | 20 (100.0%) | 0 (0.0%) |
| 3 or 4 Children | 2 (100.0%) | 0 (0.0%) |
| 5 or more Children | 0 (0.0%) | 0 (0.0%) |
| Total | 81 (100.0%) | 0 (0.0%) |
Income Below Poverty Among Single-Parent Households in Briarwood
According to the poverty data in Briarwood, 33.3% or 2 single-father households and 9.5% or 2 single-mother households are living below the poverty line. Among single-father households, those with 1 or 2 children have the highest poverty rate, with 2 households (33.3%) experiencing poverty. Likewise, among single-mother households, those with 1 or 2 children have the highest poverty rate, with 2 households (28.6%) falling below the poverty line.
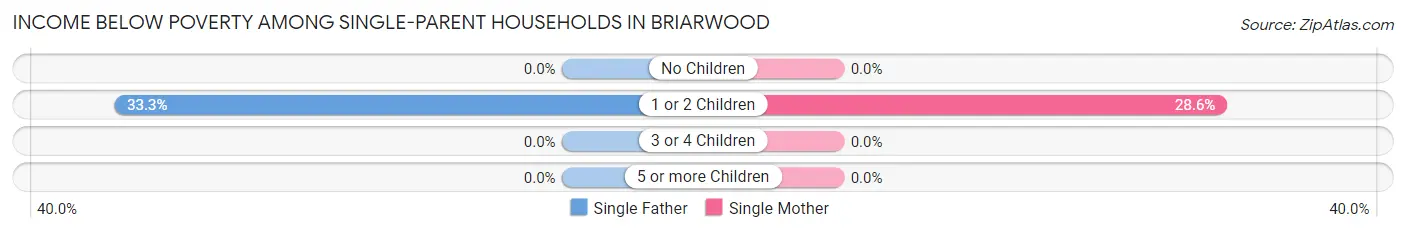
| Children | Single Father | Single Mother |
| No Children | 0 (0.0%) | 0 (0.0%) |
| 1 or 2 Children | 2 (33.3%) | 2 (28.6%) |
| 3 or 4 Children | 0 (0.0%) | 0 (0.0%) |
| 5 or more Children | 0 (0.0%) | 0 (0.0%) |
| Total | 2 (33.3%) | 2 (9.5%) |
Income Below Poverty Among Married-Couple vs Single-Parent Households in Briarwood
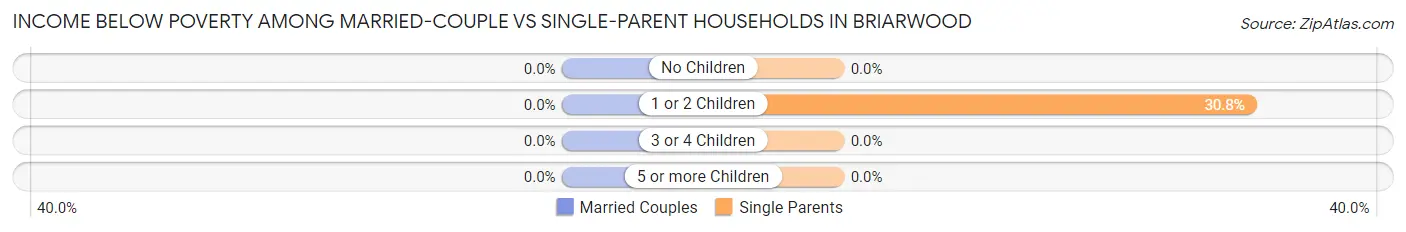
| Children | Married-Couple Families | Single-Parent Households |
| No Children | 0 (0.0%) | 0 (0.0%) |
| 1 or 2 Children | 0 (0.0%) | 4 (30.8%) |
| 3 or 4 Children | 0 (0.0%) | 0 (0.0%) |
| 5 or more Children | 0 (0.0%) | 0 (0.0%) |
| Total | 0 (0.0%) | 4 (14.8%) |
Race in Briarwood
The most populous races in Briarwood are White / Caucasian (326 | 84.7%), Black / African American (47 | 12.2%), and Some other Race (5 | 1.3%).
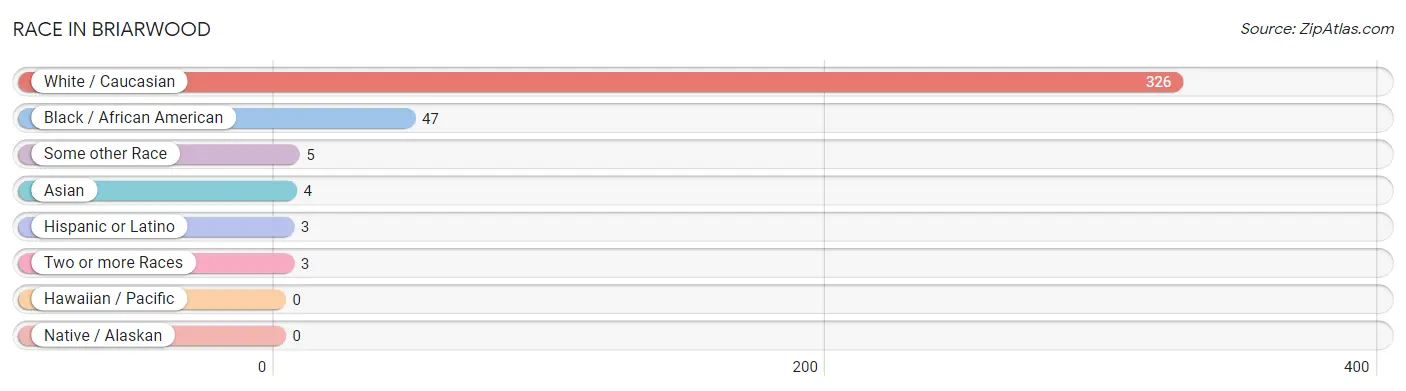
| Race | # Population | % Population |
| Asian | 4 | 1.0% |
| Black / African American | 47 | 12.2% |
| Hawaiian / Pacific | 0 | 0.0% |
| Hispanic or Latino | 3 | 0.8% |
| Native / Alaskan | 0 | 0.0% |
| White / Caucasian | 326 | 84.7% |
| Two or more Races | 3 | 0.8% |
| Some other Race | 5 | 1.3% |
| Total | 385 | 100.0% |
Ancestry in Briarwood
The most populous ancestries reported in Briarwood are German (91 | 23.6%), English (69 | 17.9%), Irish (60 | 15.6%), American (25 | 6.5%), and Italian (23 | 6.0%), together accounting for 69.6% of all Briarwood residents.
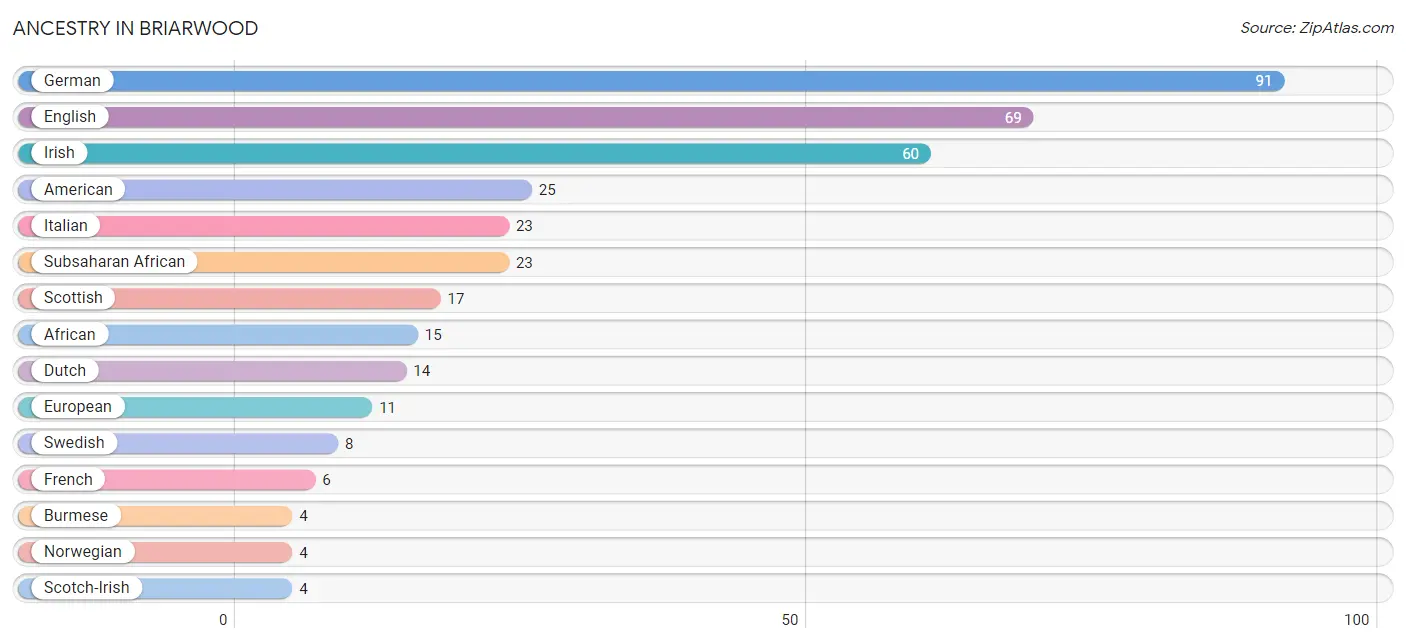
| Ancestry | # Population | % Population |
| African | 15 | 3.9% |
| American | 25 | 6.5% |
| British | 2 | 0.5% |
| Burmese | 4 | 1.0% |
| Canadian | 2 | 0.5% |
| Cherokee | 1 | 0.3% |
| Colombian | 2 | 0.5% |
| Croatian | 1 | 0.3% |
| Dutch | 14 | 3.6% |
| English | 69 | 17.9% |
| European | 11 | 2.9% |
| French | 6 | 1.6% |
| German | 91 | 23.6% |
| Irish | 60 | 15.6% |
| Italian | 23 | 6.0% |
| Northern European | 2 | 0.5% |
| Norwegian | 4 | 1.0% |
| Polish | 2 | 0.5% |
| Scotch-Irish | 4 | 1.0% |
| Scottish | 17 | 4.4% |
| South American | 3 | 0.8% |
| Subsaharan African | 23 | 6.0% |
| Swedish | 8 | 2.1% |
| Swiss | 2 | 0.5% | View All 24 Rows |
Immigrants in Briarwood
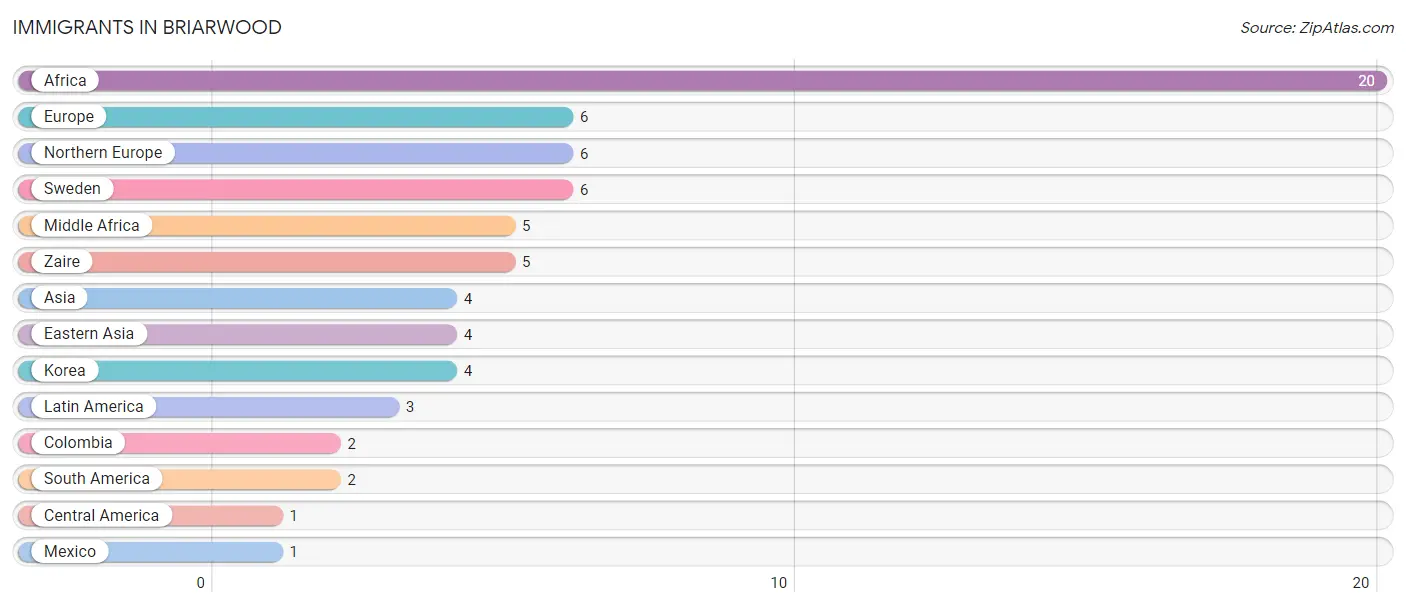
The most numerous immigrant groups reported in Briarwood came from Africa (20 | 5.2%), Europe (6 | 1.6%), Northern Europe (6 | 1.6%), Sweden (6 | 1.6%), and Middle Africa (5 | 1.3%), together accounting for 11.2% of all Briarwood residents.
| Immigration Origin | # Population | % Population |
| Africa | 20 | 5.2% |
| Asia | 4 | 1.0% |
| Central America | 1 | 0.3% |
| Colombia | 2 | 0.5% |
| Eastern Asia | 4 | 1.0% |
| Europe | 6 | 1.6% |
| Korea | 4 | 1.0% |
| Latin America | 3 | 0.8% |
| Mexico | 1 | 0.3% |
| Middle Africa | 5 | 1.3% |
| Northern Europe | 6 | 1.6% |
| South America | 2 | 0.5% |
| Sweden | 6 | 1.6% |
| Zaire | 5 | 1.3% | View All 14 Rows |
Sex and Age in Briarwood
Sex and Age in Briarwood
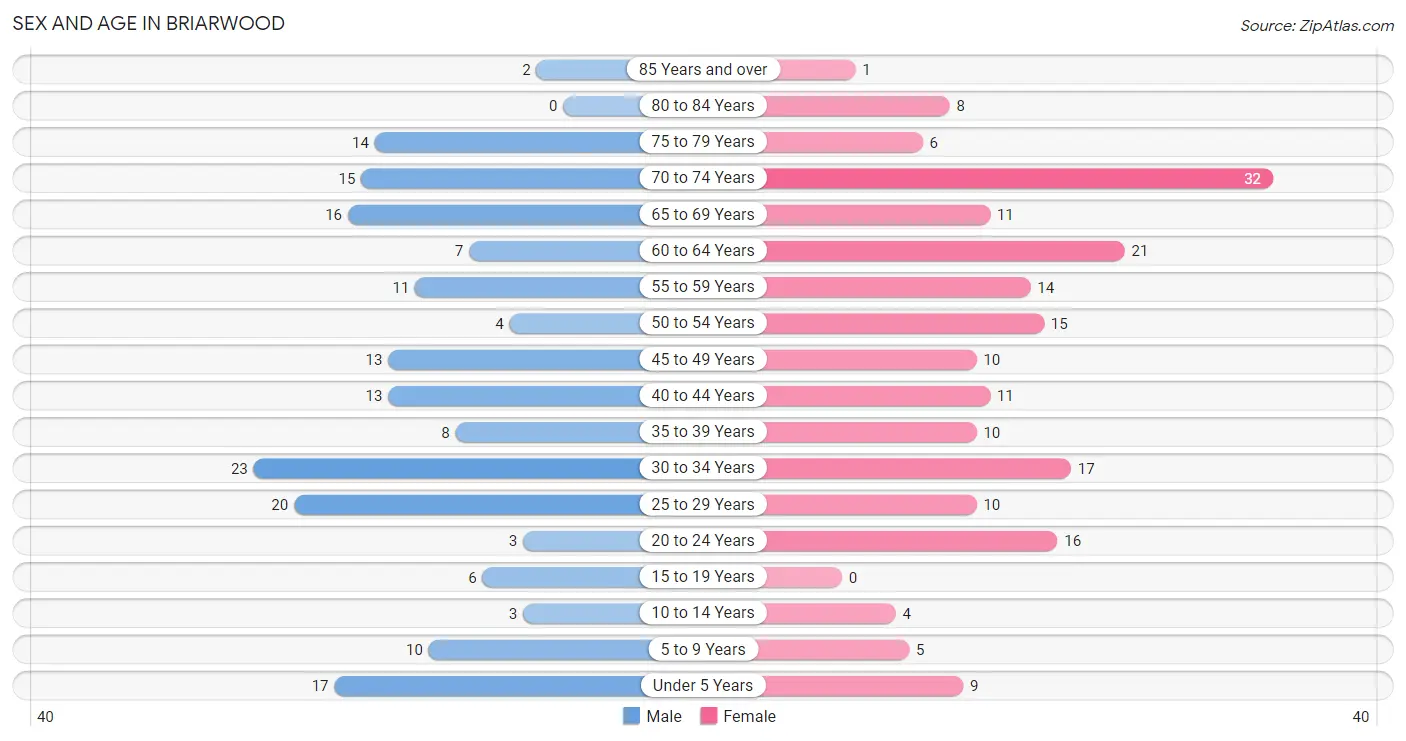
The most populous age groups in Briarwood are 30 to 34 Years (23 | 12.4%) for men and 70 to 74 Years (32 | 16.0%) for women.
| Age Bracket | Male | Female |
| Under 5 Years | 17 (9.2%) | 9 (4.5%) |
| 5 to 9 Years | 10 (5.4%) | 5 (2.5%) |
| 10 to 14 Years | 3 (1.6%) | 4 (2.0%) |
| 15 to 19 Years | 6 (3.2%) | 0 (0.0%) |
| 20 to 24 Years | 3 (1.6%) | 16 (8.0%) |
| 25 to 29 Years | 20 (10.8%) | 10 (5.0%) |
| 30 to 34 Years | 23 (12.4%) | 17 (8.5%) |
| 35 to 39 Years | 8 (4.3%) | 10 (5.0%) |
| 40 to 44 Years | 13 (7.0%) | 11 (5.5%) |
| 45 to 49 Years | 13 (7.0%) | 10 (5.0%) |
| 50 to 54 Years | 4 (2.2%) | 15 (7.5%) |
| 55 to 59 Years | 11 (5.9%) | 14 (7.0%) |
| 60 to 64 Years | 7 (3.8%) | 21 (10.5%) |
| 65 to 69 Years | 16 (8.6%) | 11 (5.5%) |
| 70 to 74 Years | 15 (8.1%) | 32 (16.0%) |
| 75 to 79 Years | 14 (7.6%) | 6 (3.0%) |
| 80 to 84 Years | 0 (0.0%) | 8 (4.0%) |
| 85 Years and over | 2 (1.1%) | 1 (0.5%) |
| Total | 185 (100.0%) | 200 (100.0%) |
Families and Households in Briarwood
Median Family Size in Briarwood
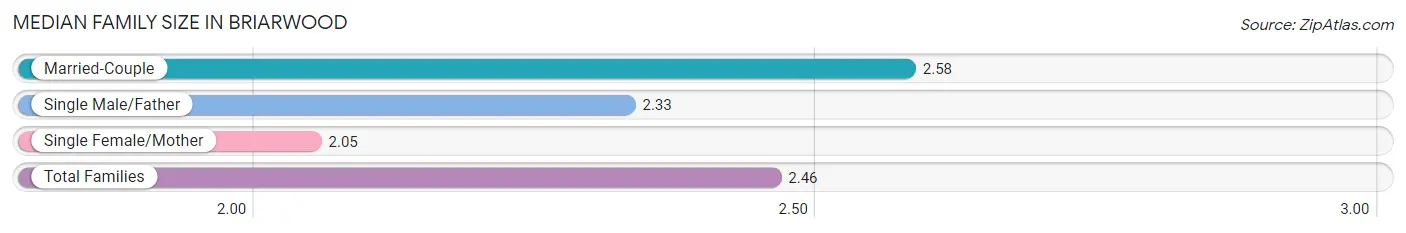
The median family size in Briarwood is 2.46 persons per family, with married-couple families (81 | 75.0%) accounting for the largest median family size of 2.58 persons per family. On the other hand, single female/mother families (21 | 19.4%) represent the smallest median family size with 2.05 persons per family.
| Family Type | # Families | Family Size |
| Married-Couple | 81 (75.0%) | 2.58 |
| Single Male/Father | 6 (5.6%) | 2.33 |
| Single Female/Mother | 21 (19.4%) | 2.05 |
| Total Families | 108 (100.0%) | 2.46 |
Median Household Size in Briarwood
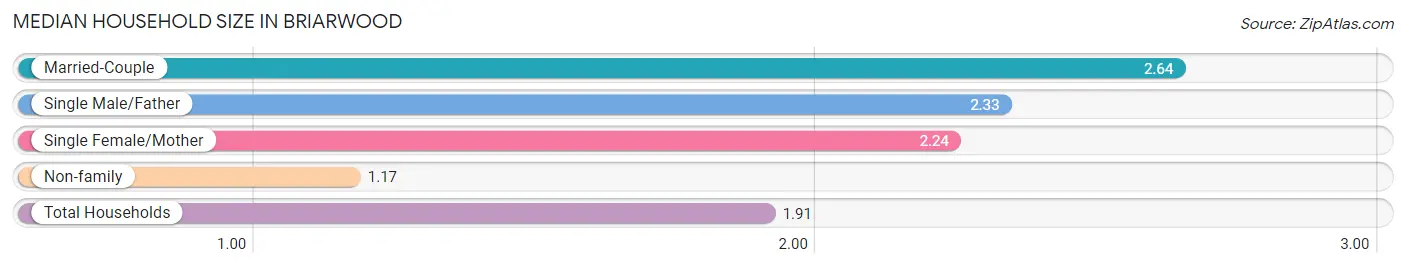
The median household size in Briarwood is 1.91 persons per household, with married-couple households (81 | 40.1%) accounting for the largest median household size of 2.64 persons per household. non-family households (94 | 46.5%) represent the smallest median household size with 1.17 persons per household.
| Household Type | # Households | Household Size |
| Married-Couple | 81 (40.1%) | 2.64 |
| Single Male/Father | 6 (3.0%) | 2.33 |
| Single Female/Mother | 21 (10.4%) | 2.24 |
| Non-family | 94 (46.5%) | 1.17 |
| Total Households | 202 (100.0%) | 1.91 |
Household Size by Marriage Status in Briarwood
Out of a total of 202 households in Briarwood, 108 (53.5%) are family households, while 94 (46.5%) are nonfamily households. The most numerous type of family households are 2-person households, comprising 65, and the most common type of nonfamily households are 1-person households, comprising 82.
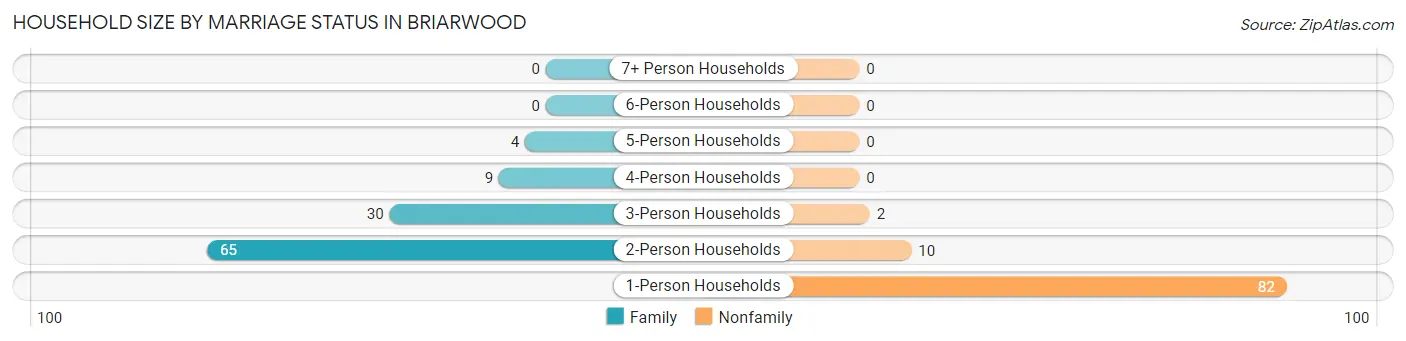
| Household Size | Family Households | Nonfamily Households |
| 1-Person Households | - | 82 (40.6%) |
| 2-Person Households | 65 (32.2%) | 10 (5.0%) |
| 3-Person Households | 30 (14.8%) | 2 (1.0%) |
| 4-Person Households | 9 (4.5%) | 0 (0.0%) |
| 5-Person Households | 4 (2.0%) | 0 (0.0%) |
| 6-Person Households | 0 (0.0%) | 0 (0.0%) |
| 7+ Person Households | 0 (0.0%) | 0 (0.0%) |
| Total | 108 (53.5%) | 94 (46.5%) |
Female Fertility in Briarwood
Fertility by Age in Briarwood
Average fertility rate in Briarwood is 95.0 births per 1,000 women. Women in the age bracket of 20 to 34 years have the highest fertility rate with 163.0 births per 1,000 women. Women in the age bracket of 20 to 34 years acount for 100.0% of all women with births.
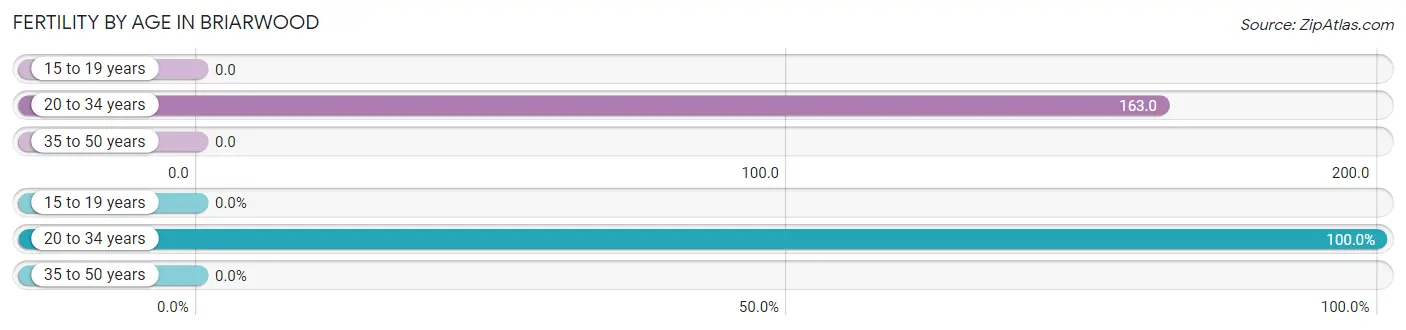
| Age Bracket | Women with Births | Births / 1,000 Women |
| 15 to 19 years | 0 (0.0%) | 0.0 |
| 20 to 34 years | 7 (100.0%) | 163.0 |
| 35 to 50 years | 0 (0.0%) | 0.0 |
| Total | 7 (100.0%) | 95.0 |
Fertility by Age by Marriage Status in Briarwood
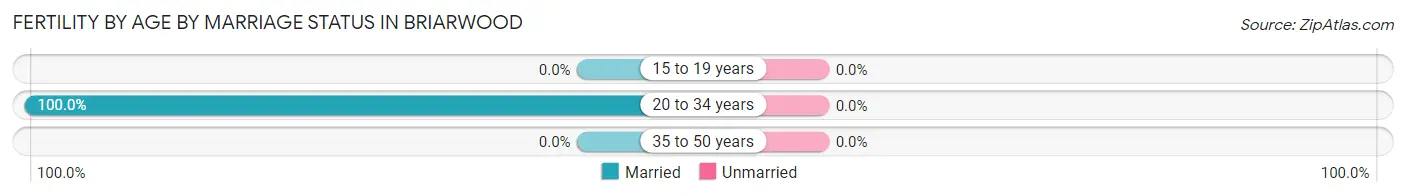
| Age Bracket | Married | Unmarried |
| 15 to 19 years | 0 (0.0%) | 0 (0.0%) |
| 20 to 34 years | 7 (100.0%) | 0 (0.0%) |
| 35 to 50 years | 0 (0.0%) | 0 (0.0%) |
| Total | 7 (100.0%) | 0 (0.0%) |
Fertility by Education in Briarwood
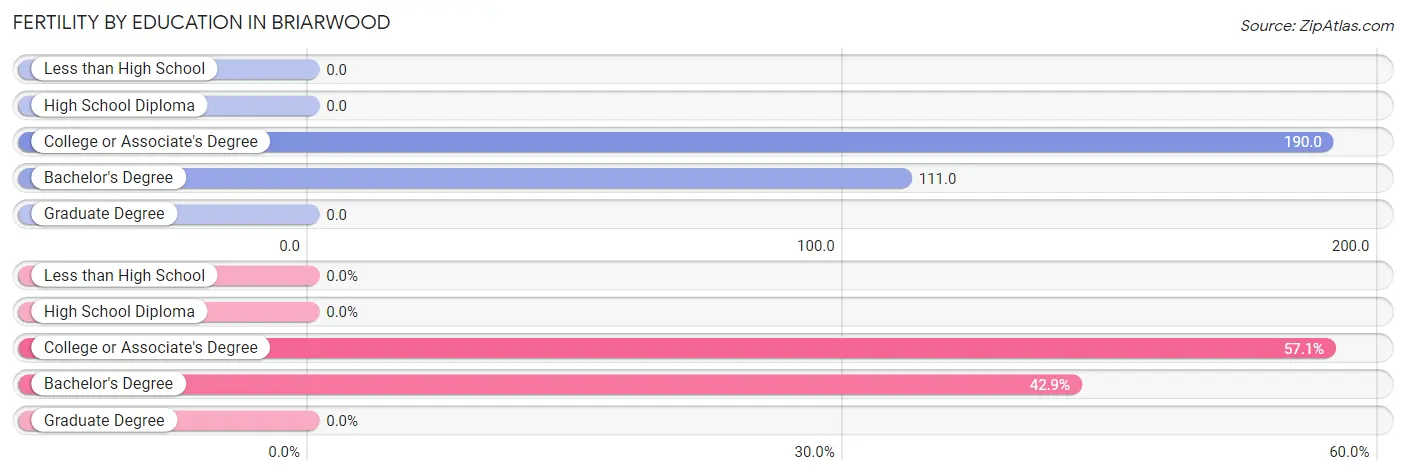
| Educational Attainment | Women with Births | Births / 1,000 Women |
| Less than High School | 0 (0.0%) | 0.0 |
| High School Diploma | 0 (0.0%) | 0.0 |
| College or Associate's Degree | 4 (57.1%) | 190.0 |
| Bachelor's Degree | 3 (42.9%) | 111.0 |
| Graduate Degree | 0 (0.0%) | 0.0 |
| Total | 7 (100.0%) | 95.0 |
Fertility by Education by Marriage Status in Briarwood
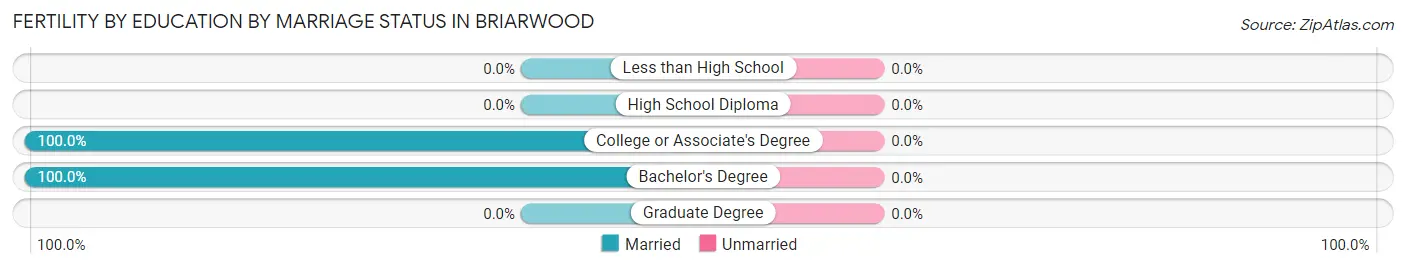
| Educational Attainment | Married | Unmarried |
| Less than High School | 0 (0.0%) | 0 (0.0%) |
| High School Diploma | 0 (0.0%) | 0 (0.0%) |
| College or Associate's Degree | 4 (100.0%) | 0 (0.0%) |
| Bachelor's Degree | 3 (100.0%) | 0 (0.0%) |
| Graduate Degree | 0 (0.0%) | 0 (0.0%) |
| Total | 7 (100.0%) | 0 (0.0%) |
Employment Characteristics in Briarwood
Employment by Class of Employer in Briarwood
Among the 207 employed individuals in Briarwood, private company employees (149 | 72.0%), not-for-profit organizations (18 | 8.7%), and local government employees (18 | 8.7%) make up the most common classes of employment.
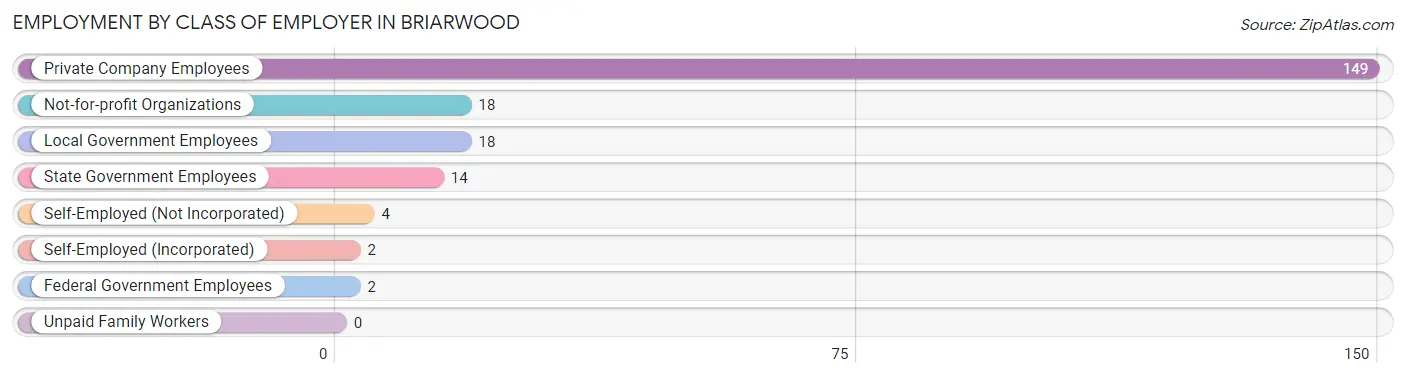
| Employer Class | # Employees | % Employees |
| Private Company Employees | 149 | 72.0% |
| Self-Employed (Incorporated) | 2 | 1.0% |
| Self-Employed (Not Incorporated) | 4 | 1.9% |
| Not-for-profit Organizations | 18 | 8.7% |
| Local Government Employees | 18 | 8.7% |
| State Government Employees | 14 | 6.8% |
| Federal Government Employees | 2 | 1.0% |
| Unpaid Family Workers | 0 | 0.0% |
| Total | 207 | 100.0% |
Employment Status by Age in Briarwood
According to the labor force statistics for Briarwood, out of the total population over 16 years of age (335), 65.7% or 220 individuals are in the labor force, with 5.0% or 11 of them unemployed. The age group with the highest labor force participation rate is 16 to 19 years, with 100.0% or 4 individuals in the labor force. Within the labor force, the 20 to 24 years age range has the highest percentage of unemployed individuals, with 21.1% or 4 of them being unemployed.
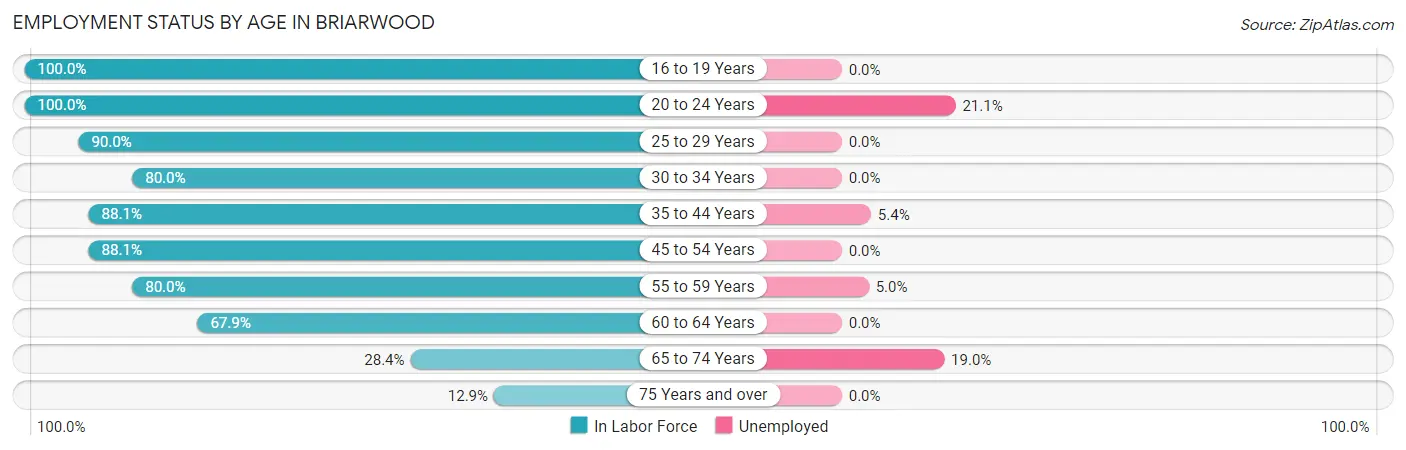
| Age Bracket | In Labor Force | Unemployed |
| 16 to 19 Years | 4 (100.0%) | 0 (0.0%) |
| 20 to 24 Years | 19 (100.0%) | 4 (21.1%) |
| 25 to 29 Years | 27 (90.0%) | 0 (0.0%) |
| 30 to 34 Years | 32 (80.0%) | 0 (0.0%) |
| 35 to 44 Years | 37 (88.1%) | 2 (5.4%) |
| 45 to 54 Years | 37 (88.1%) | 0 (0.0%) |
| 55 to 59 Years | 20 (80.0%) | 1 (5.0%) |
| 60 to 64 Years | 19 (67.9%) | 0 (0.0%) |
| 65 to 74 Years | 21 (28.4%) | 4 (19.0%) |
| 75 Years and over | 4 (12.9%) | 0 (0.0%) |
| Total | 220 (65.7%) | 11 (5.0%) |
Employment Status by Educational Attainment in Briarwood
According to labor force statistics for Briarwood, 83.1% of individuals (172) out of the total population between 25 and 64 years of age (207) are in the labor force, with 1.7% or 3 of them being unemployed. The group with the highest labor force participation rate are those with the educational attainment of bachelor's degree or higher, with 90.2% or 119 individuals in the labor force. Within the labor force, individuals with college / associate degree education have the highest percentage of unemployment, with 10.7% or 3 of them being unemployed.
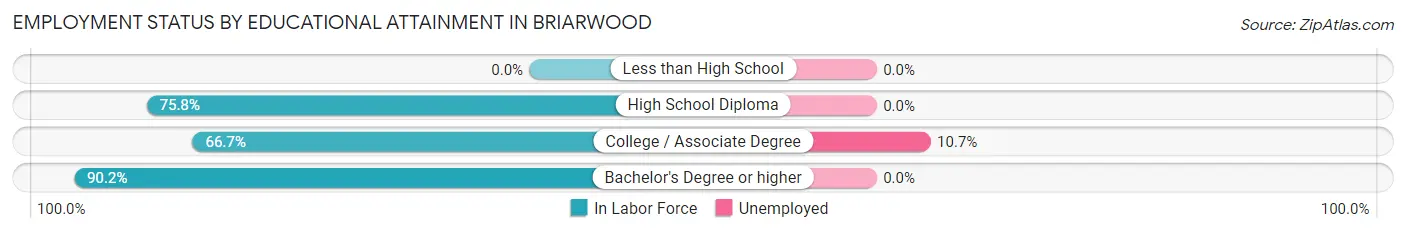
| Educational Attainment | In Labor Force | Unemployed |
| Less than High School | 0 (0.0%) | 0 (0.0%) |
| High School Diploma | 25 (75.8%) | 0 (0.0%) |
| College / Associate Degree | 28 (66.7%) | 4 (10.7%) |
| Bachelor's Degree or higher | 119 (90.2%) | 0 (0.0%) |
| Total | 172 (83.1%) | 4 (1.7%) |
Employment Occupations by Sex in Briarwood
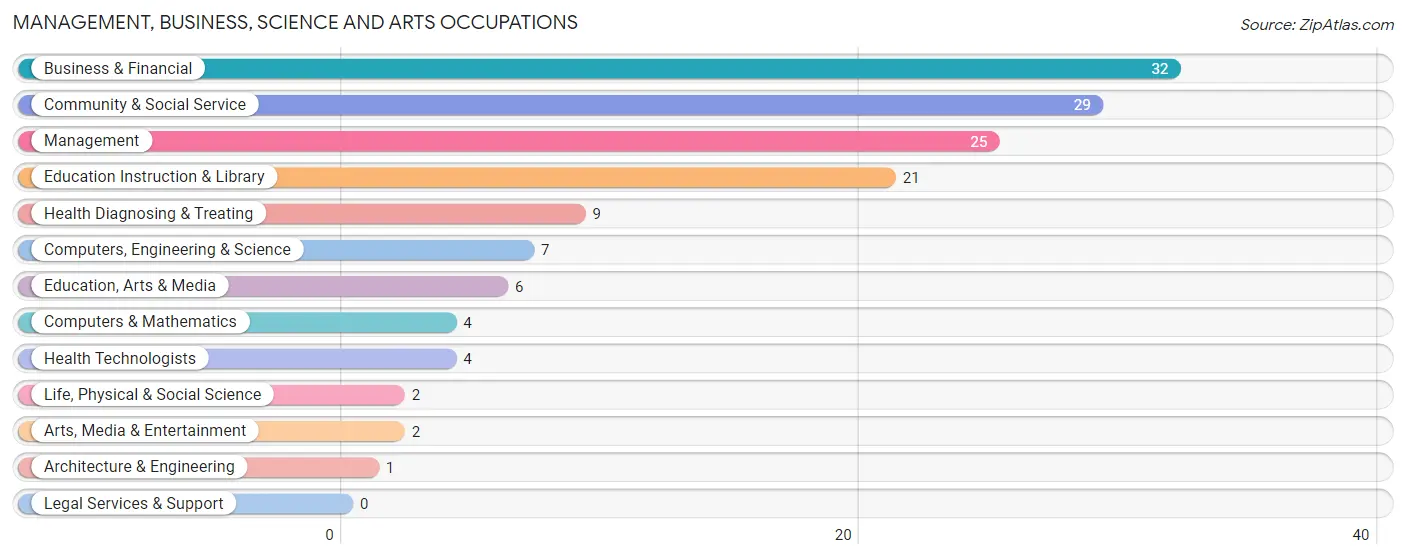
Management, Business, Science and Arts Occupations
The most common Management, Business, Science and Arts occupations in Briarwood are Business & Financial (32 | 15.3%), Community & Social Service (29 | 13.9%), Management (25 | 12.0%), Education Instruction & Library (21 | 10.1%), and Health Diagnosing & Treating (9 | 4.3%).
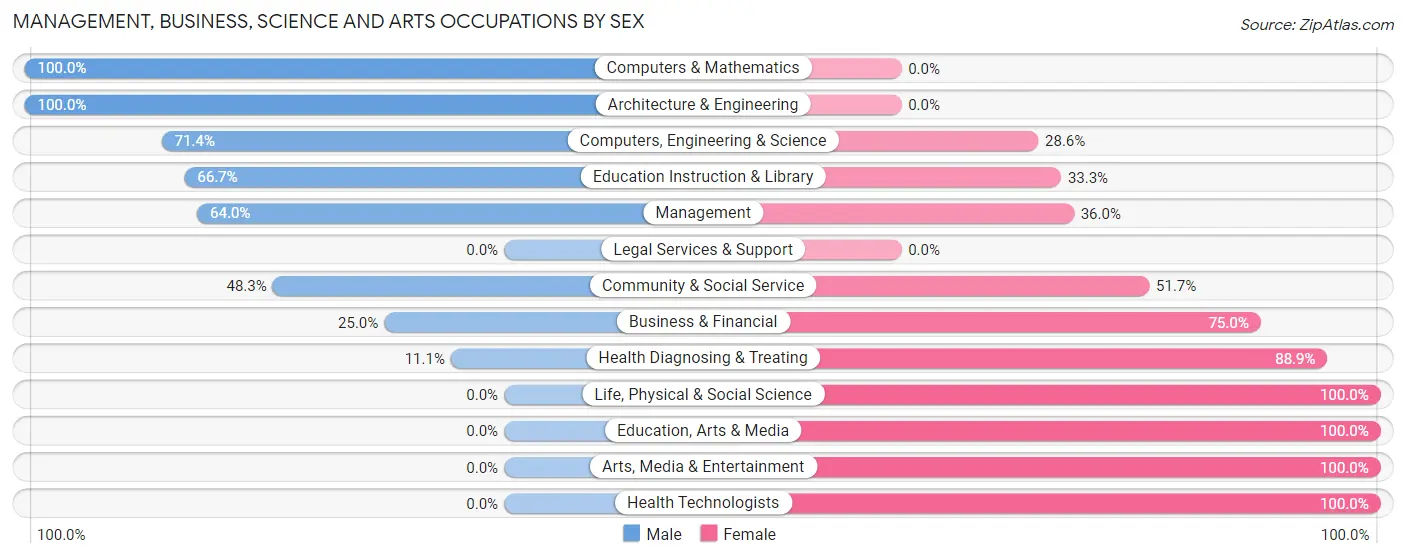
Management, Business, Science and Arts Occupations by Sex
Within the Management, Business, Science and Arts occupations in Briarwood, the most male-oriented occupations are Computers & Mathematics (100.0%), Architecture & Engineering (100.0%), and Computers, Engineering & Science (71.4%), while the most female-oriented occupations are Life, Physical & Social Science (100.0%), Education, Arts & Media (100.0%), and Arts, Media & Entertainment (100.0%).
| Occupation | Male | Female |
| Management | 16 (64.0%) | 9 (36.0%) |
| Business & Financial | 8 (25.0%) | 24 (75.0%) |
| Computers, Engineering & Science | 5 (71.4%) | 2 (28.6%) |
| Computers & Mathematics | 4 (100.0%) | 0 (0.0%) |
| Architecture & Engineering | 1 (100.0%) | 0 (0.0%) |
| Life, Physical & Social Science | 0 (0.0%) | 2 (100.0%) |
| Community & Social Service | 14 (48.3%) | 15 (51.7%) |
| Education, Arts & Media | 0 (0.0%) | 6 (100.0%) |
| Legal Services & Support | 0 (0.0%) | 0 (0.0%) |
| Education Instruction & Library | 14 (66.7%) | 7 (33.3%) |
| Arts, Media & Entertainment | 0 (0.0%) | 2 (100.0%) |
| Health Diagnosing & Treating | 1 (11.1%) | 8 (88.9%) |
| Health Technologists | 0 (0.0%) | 4 (100.0%) |
| Total (Category) | 44 (43.1%) | 58 (56.9%) |
| Total (Overall) | 105 (50.2%) | 104 (49.8%) |
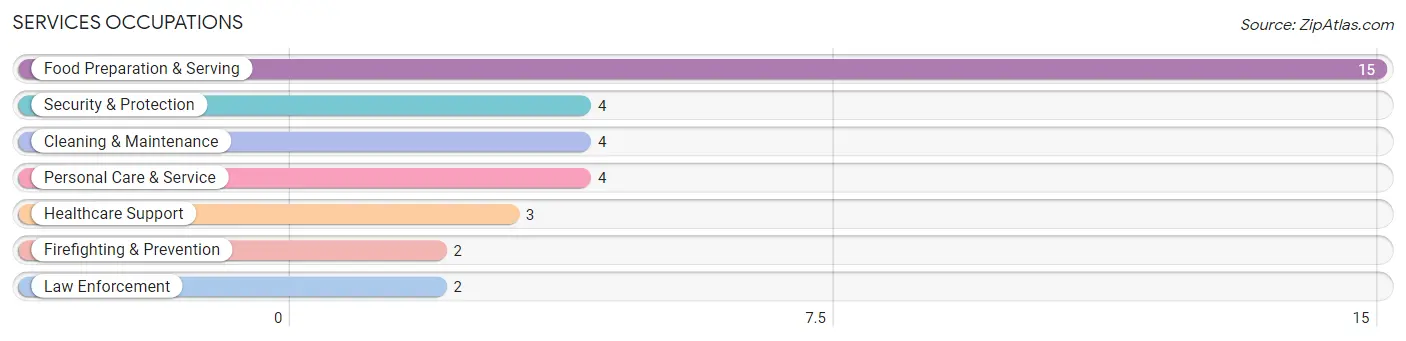
Services Occupations
The most common Services occupations in Briarwood are Food Preparation & Serving (15 | 7.2%), Security & Protection (4 | 1.9%), Cleaning & Maintenance (4 | 1.9%), Personal Care & Service (4 | 1.9%), and Healthcare Support (3 | 1.4%).
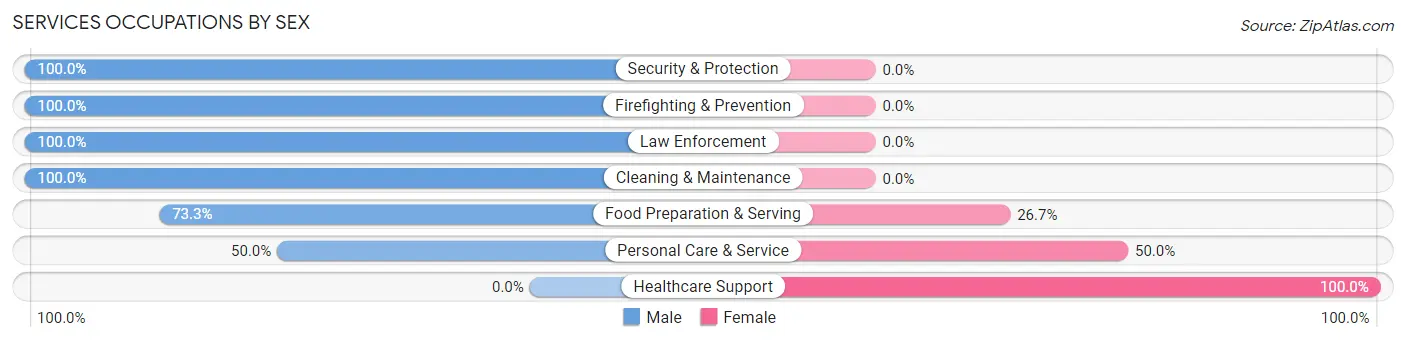
Services Occupations by Sex
Within the Services occupations in Briarwood, the most male-oriented occupations are Security & Protection (100.0%), Firefighting & Prevention (100.0%), and Law Enforcement (100.0%), while the most female-oriented occupations are Healthcare Support (100.0%), Personal Care & Service (50.0%), and Food Preparation & Serving (26.7%).
| Occupation | Male | Female |
| Healthcare Support | 0 (0.0%) | 3 (100.0%) |
| Security & Protection | 4 (100.0%) | 0 (0.0%) |
| Firefighting & Prevention | 2 (100.0%) | 0 (0.0%) |
| Law Enforcement | 2 (100.0%) | 0 (0.0%) |
| Food Preparation & Serving | 11 (73.3%) | 4 (26.7%) |
| Cleaning & Maintenance | 4 (100.0%) | 0 (0.0%) |
| Personal Care & Service | 2 (50.0%) | 2 (50.0%) |
| Total (Category) | 21 (70.0%) | 9 (30.0%) |
| Total (Overall) | 105 (50.2%) | 104 (49.8%) |
Sales and Office Occupations
The most common Sales and Office occupations in Briarwood are Sales & Related (30 | 14.3%), and Office & Administration (24 | 11.5%).
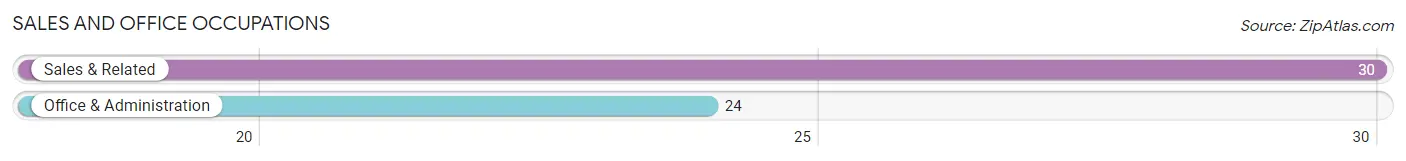
Sales and Office Occupations by Sex
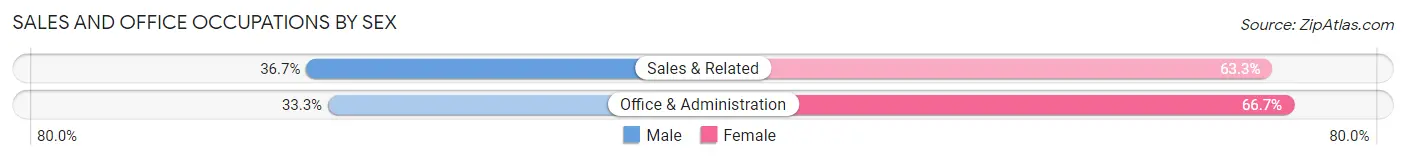
| Occupation | Male | Female |
| Sales & Related | 11 (36.7%) | 19 (63.3%) |
| Office & Administration | 8 (33.3%) | 16 (66.7%) |
| Total (Category) | 19 (35.2%) | 35 (64.8%) |
| Total (Overall) | 105 (50.2%) | 104 (49.8%) |
Natural Resources, Construction and Maintenance Occupations
The most common Natural Resources, Construction and Maintenance occupations in Briarwood are Construction & Extraction (2 | 1.0%), and Installation, Maintenance & Repair (2 | 1.0%).
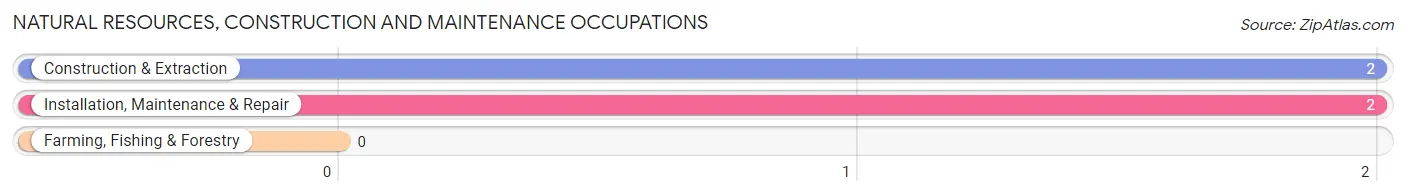
Natural Resources, Construction and Maintenance Occupations by Sex

| Occupation | Male | Female |
| Farming, Fishing & Forestry | 0 (0.0%) | 0 (0.0%) |
| Construction & Extraction | 2 (100.0%) | 0 (0.0%) |
| Installation, Maintenance & Repair | 2 (100.0%) | 0 (0.0%) |
| Total (Category) | 4 (100.0%) | 0 (0.0%) |
| Total (Overall) | 105 (50.2%) | 104 (49.8%) |
Production, Transportation and Moving Occupations
The most common Production, Transportation and Moving occupations in Briarwood are Production (9 | 4.3%), Transportation (7 | 3.4%), and Material Moving (3 | 1.4%).
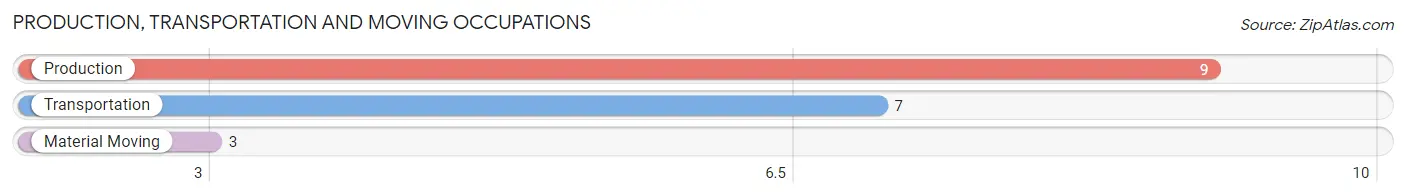
Production, Transportation and Moving Occupations by Sex
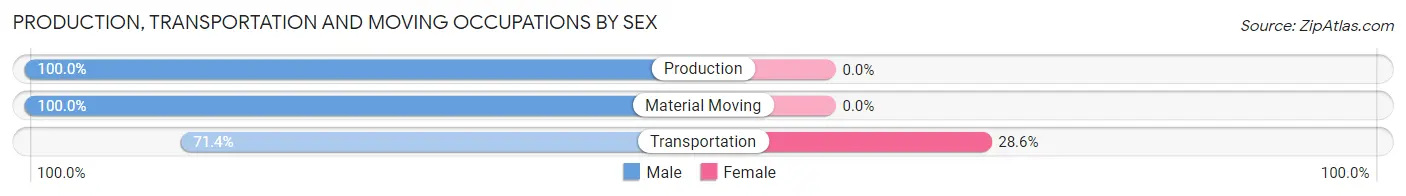
| Occupation | Male | Female |
| Production | 9 (100.0%) | 0 (0.0%) |
| Transportation | 5 (71.4%) | 2 (28.6%) |
| Material Moving | 3 (100.0%) | 0 (0.0%) |
| Total (Category) | 17 (89.5%) | 2 (10.5%) |
| Total (Overall) | 105 (50.2%) | 104 (49.8%) |
Employment Industries by Sex in Briarwood
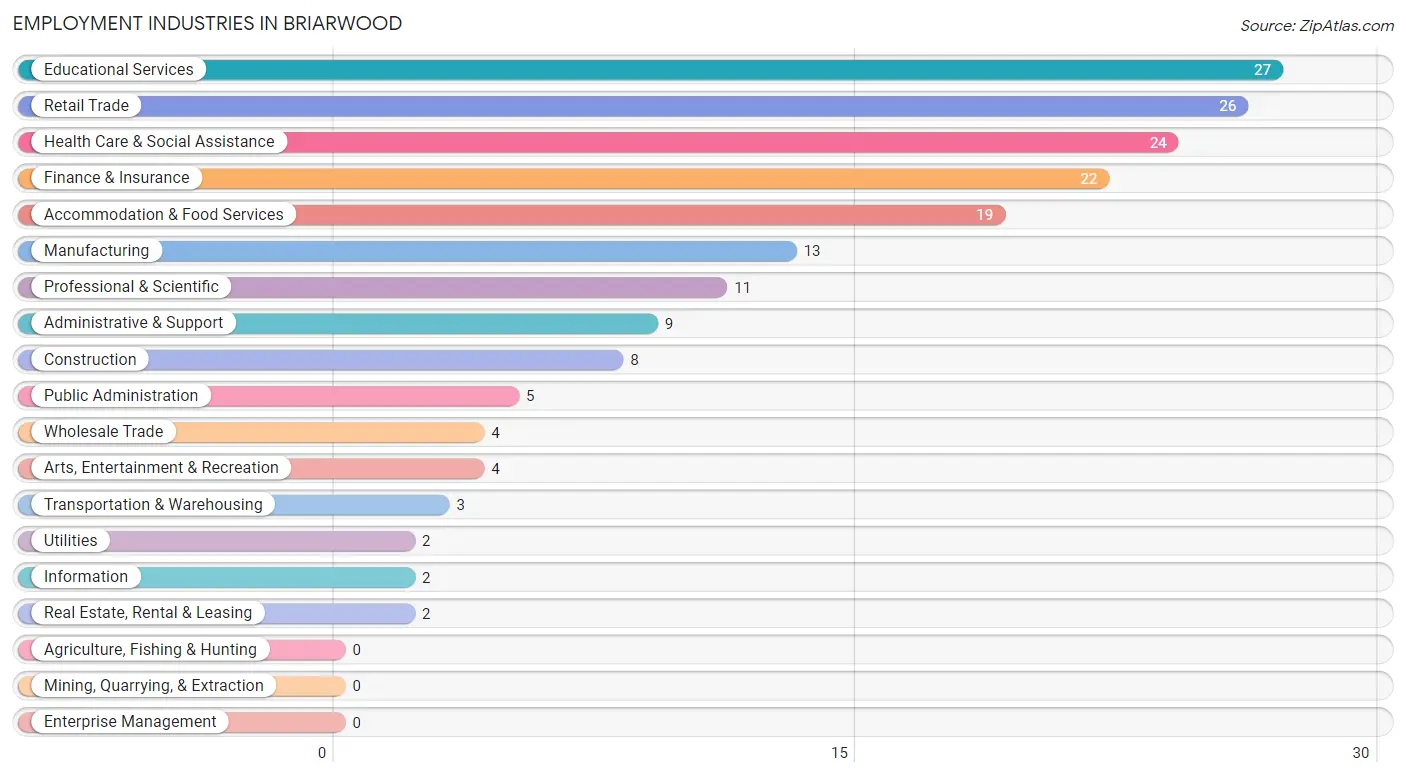
Employment Industries in Briarwood
The major employment industries in Briarwood include Educational Services (27 | 12.9%), Retail Trade (26 | 12.4%), Health Care & Social Assistance (24 | 11.5%), Finance & Insurance (22 | 10.5%), and Accommodation & Food Services (19 | 9.1%).
Employment Industries by Sex in Briarwood
The Briarwood industries that see more men than women are Transportation & Warehousing (100.0%), Utilities (100.0%), and Information (100.0%), whereas the industries that tend to have a higher number of women are Wholesale Trade (100.0%), Real Estate, Rental & Leasing (100.0%), and Professional & Scientific (81.8%).
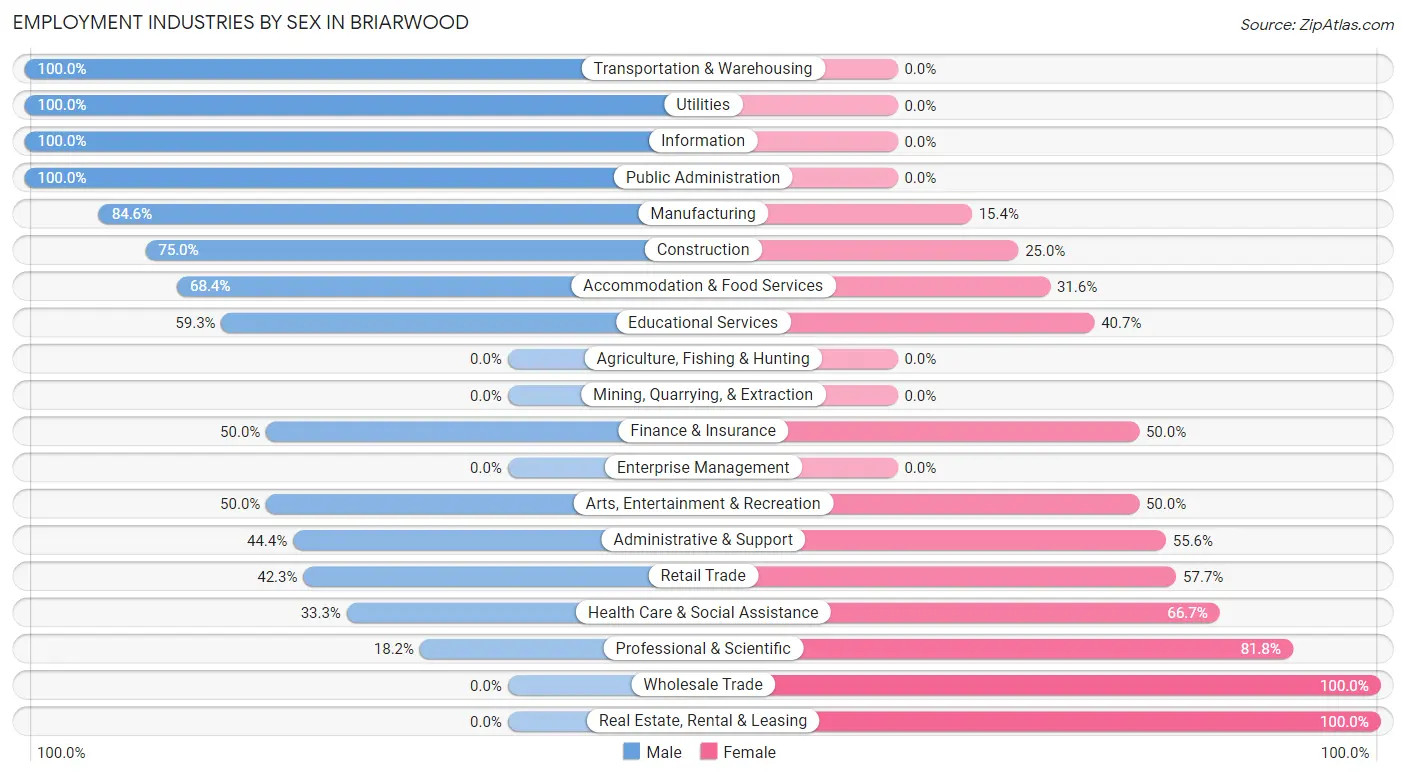
| Industry | Male | Female |
| Agriculture, Fishing & Hunting | 0 (0.0%) | 0 (0.0%) |
| Mining, Quarrying, & Extraction | 0 (0.0%) | 0 (0.0%) |
| Construction | 6 (75.0%) | 2 (25.0%) |
| Manufacturing | 11 (84.6%) | 2 (15.4%) |
| Wholesale Trade | 0 (0.0%) | 4 (100.0%) |
| Retail Trade | 11 (42.3%) | 15 (57.7%) |
| Transportation & Warehousing | 3 (100.0%) | 0 (0.0%) |
| Utilities | 2 (100.0%) | 0 (0.0%) |
| Information | 2 (100.0%) | 0 (0.0%) |
| Finance & Insurance | 11 (50.0%) | 11 (50.0%) |
| Real Estate, Rental & Leasing | 0 (0.0%) | 2 (100.0%) |
| Professional & Scientific | 2 (18.2%) | 9 (81.8%) |
| Enterprise Management | 0 (0.0%) | 0 (0.0%) |
| Administrative & Support | 4 (44.4%) | 5 (55.6%) |
| Educational Services | 16 (59.3%) | 11 (40.7%) |
| Health Care & Social Assistance | 8 (33.3%) | 16 (66.7%) |
| Arts, Entertainment & Recreation | 2 (50.0%) | 2 (50.0%) |
| Accommodation & Food Services | 13 (68.4%) | 6 (31.6%) |
| Public Administration | 5 (100.0%) | 0 (0.0%) |
| Total | 105 (50.2%) | 104 (49.8%) |
Education in Briarwood
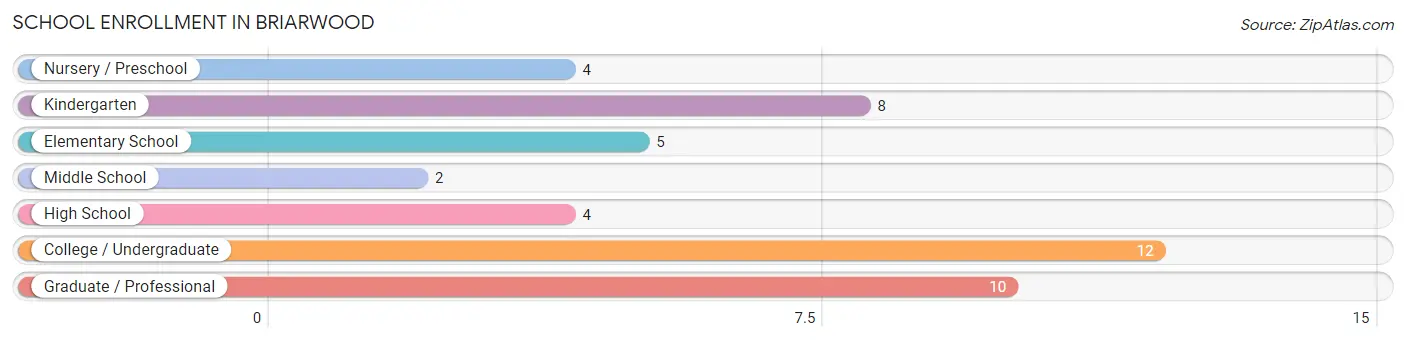
School Enrollment in Briarwood
The most common levels of schooling among the 45 students in Briarwood are college / undergraduate (12 | 26.7%), graduate / professional (10 | 22.2%), and kindergarten (8 | 17.8%).
| School Level | # Students | % Students |
| Nursery / Preschool | 4 | 8.9% |
| Kindergarten | 8 | 17.8% |
| Elementary School | 5 | 11.1% |
| Middle School | 2 | 4.4% |
| High School | 4 | 8.9% |
| College / Undergraduate | 12 | 26.7% |
| Graduate / Professional | 10 | 22.2% |
| Total | 45 | 100.0% |
School Enrollment by Age by Funding Source in Briarwood
Out of a total of 45 students who are enrolled in schools in Briarwood, 31 (68.9%) attend a private institution, while the remaining 14 (31.1%) are enrolled in public schools. The age group of 3 to 4 year olds has the highest likelihood of being enrolled in private schools, with 4 (100.0% in the age bracket) enrolled. Conversely, the age group of 5 to 9 year old has the lowest likelihood of being enrolled in a private school, with 8 (80.0% in the age bracket) attending a public institution.
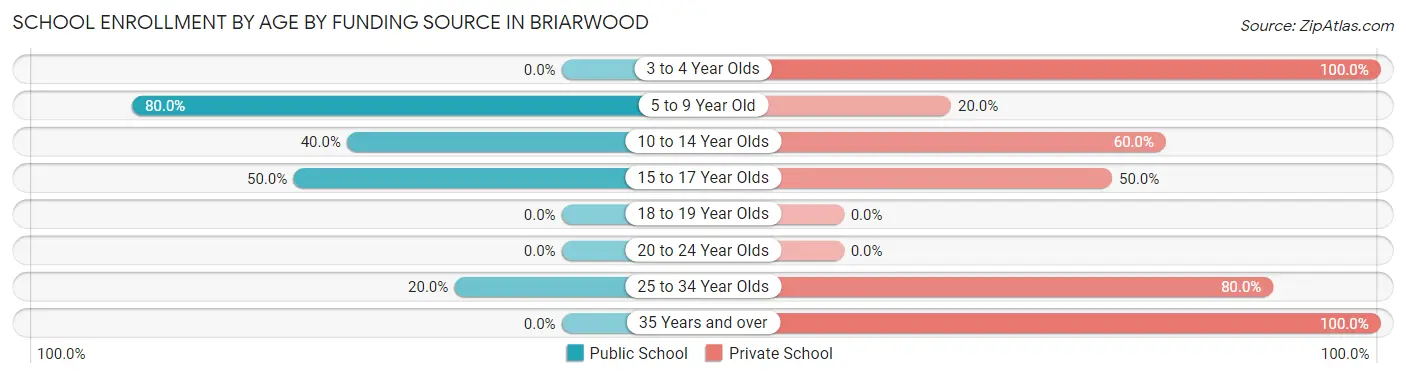
| Age Bracket | Public School | Private School |
| 3 to 4 Year Olds | 0 (0.0%) | 4 (100.0%) |
| 5 to 9 Year Old | 8 (80.0%) | 2 (20.0%) |
| 10 to 14 Year Olds | 2 (40.0%) | 3 (60.0%) |
| 15 to 17 Year Olds | 2 (50.0%) | 2 (50.0%) |
| 18 to 19 Year Olds | 0 (0.0%) | 0 (0.0%) |
| 20 to 24 Year Olds | 0 (0.0%) | 0 (0.0%) |
| 25 to 34 Year Olds | 2 (20.0%) | 8 (80.0%) |
| 35 Years and over | 0 (0.0%) | 12 (100.0%) |
| Total | 14 (31.1%) | 31 (68.9%) |
Educational Attainment by Field of Study in Briarwood
Business (34 | 18.5%), liberal arts & history (27 | 14.7%), education (23 | 12.5%), science & technology (16 | 8.7%), and visual & performing arts (13 | 7.1%) are the most common fields of study among 184 individuals in Briarwood who have obtained a bachelor's degree or higher.
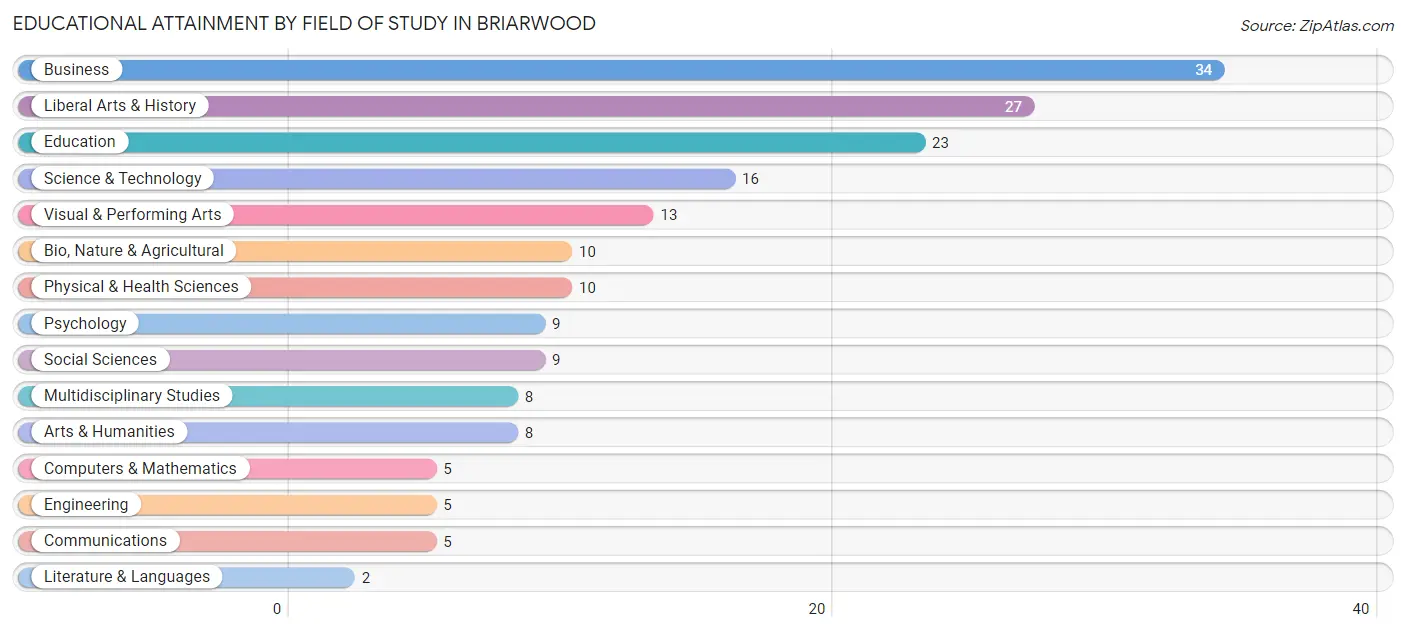
| Field of Study | # Graduates | % Graduates |
| Computers & Mathematics | 5 | 2.7% |
| Bio, Nature & Agricultural | 10 | 5.4% |
| Physical & Health Sciences | 10 | 5.4% |
| Psychology | 9 | 4.9% |
| Social Sciences | 9 | 4.9% |
| Engineering | 5 | 2.7% |
| Multidisciplinary Studies | 8 | 4.3% |
| Science & Technology | 16 | 8.7% |
| Business | 34 | 18.5% |
| Education | 23 | 12.5% |
| Literature & Languages | 2 | 1.1% |
| Liberal Arts & History | 27 | 14.7% |
| Visual & Performing Arts | 13 | 7.1% |
| Communications | 5 | 2.7% |
| Arts & Humanities | 8 | 4.3% |
| Total | 184 | 100.0% |
Transportation & Commute in Briarwood
Vehicle Availability by Sex in Briarwood
The most prevalent vehicle ownership categories in Briarwood are males with 2 vehicles (64, accounting for 62.1%) and females with 2 vehicles (64, making up 61.5%).
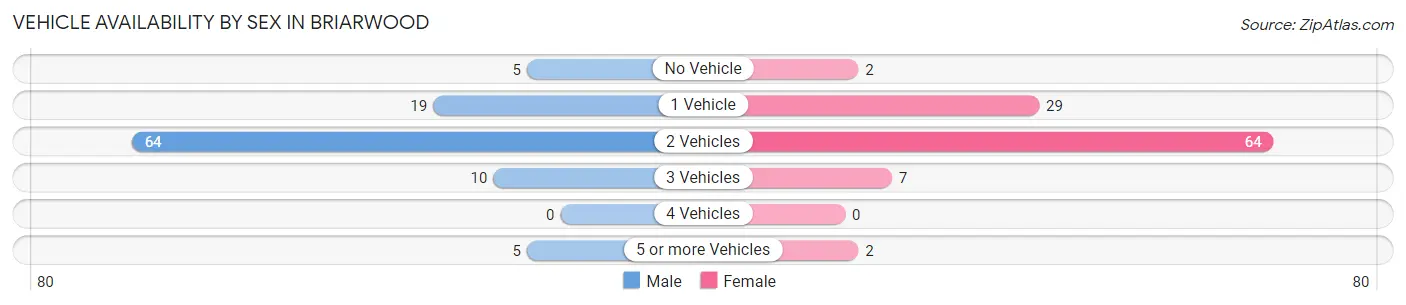
| Vehicles Available | Male | Female |
| No Vehicle | 5 (4.9%) | 2 (1.9%) |
| 1 Vehicle | 19 (18.4%) | 29 (27.9%) |
| 2 Vehicles | 64 (62.1%) | 64 (61.5%) |
| 3 Vehicles | 10 (9.7%) | 7 (6.7%) |
| 4 Vehicles | 0 (0.0%) | 0 (0.0%) |
| 5 or more Vehicles | 5 (4.9%) | 2 (1.9%) |
| Total | 103 (100.0%) | 104 (100.0%) |
Commute Time in Briarwood
The most frequently occuring commute durations in Briarwood are 15 to 19 minutes (43 commuters, 23.2%), 10 to 14 minutes (42 commuters, 22.7%), and 20 to 24 minutes (37 commuters, 20.0%).
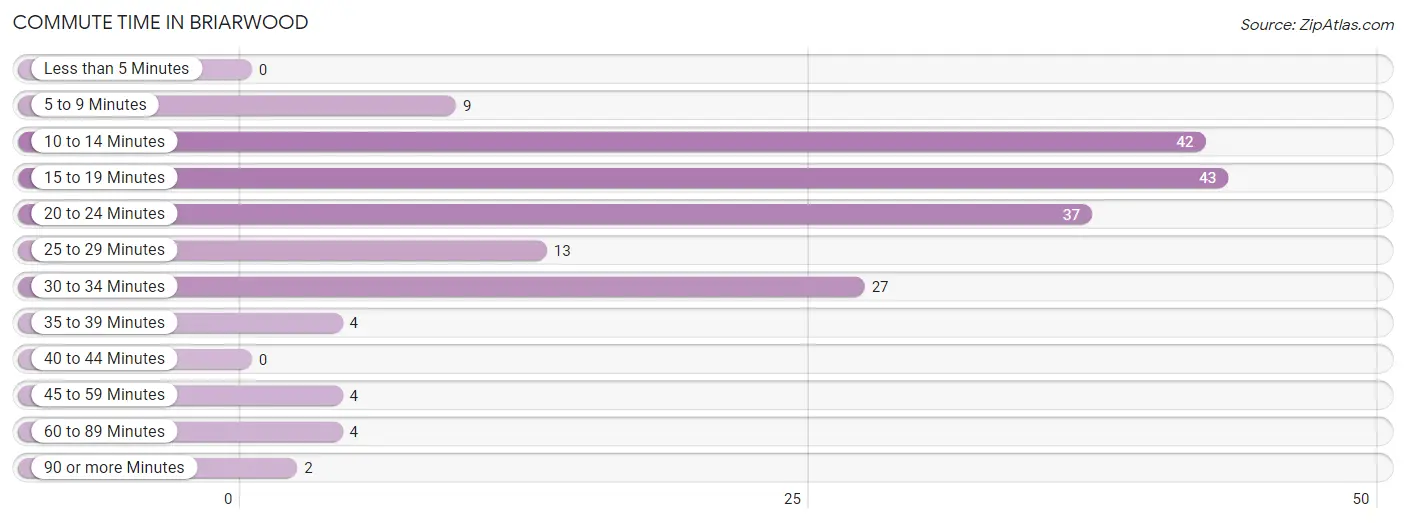
| Commute Time | # Commuters | % Commuters |
| Less than 5 Minutes | 0 | 0.0% |
| 5 to 9 Minutes | 9 | 4.9% |
| 10 to 14 Minutes | 42 | 22.7% |
| 15 to 19 Minutes | 43 | 23.2% |
| 20 to 24 Minutes | 37 | 20.0% |
| 25 to 29 Minutes | 13 | 7.0% |
| 30 to 34 Minutes | 27 | 14.6% |
| 35 to 39 Minutes | 4 | 2.2% |
| 40 to 44 Minutes | 0 | 0.0% |
| 45 to 59 Minutes | 4 | 2.2% |
| 60 to 89 Minutes | 4 | 2.2% |
| 90 or more Minutes | 2 | 1.1% |
Commute Time by Sex in Briarwood
The most common commute times in Briarwood are 10 to 14 minutes (30 commuters, 31.6%) for males and 15 to 19 minutes (27 commuters, 30.0%) for females.
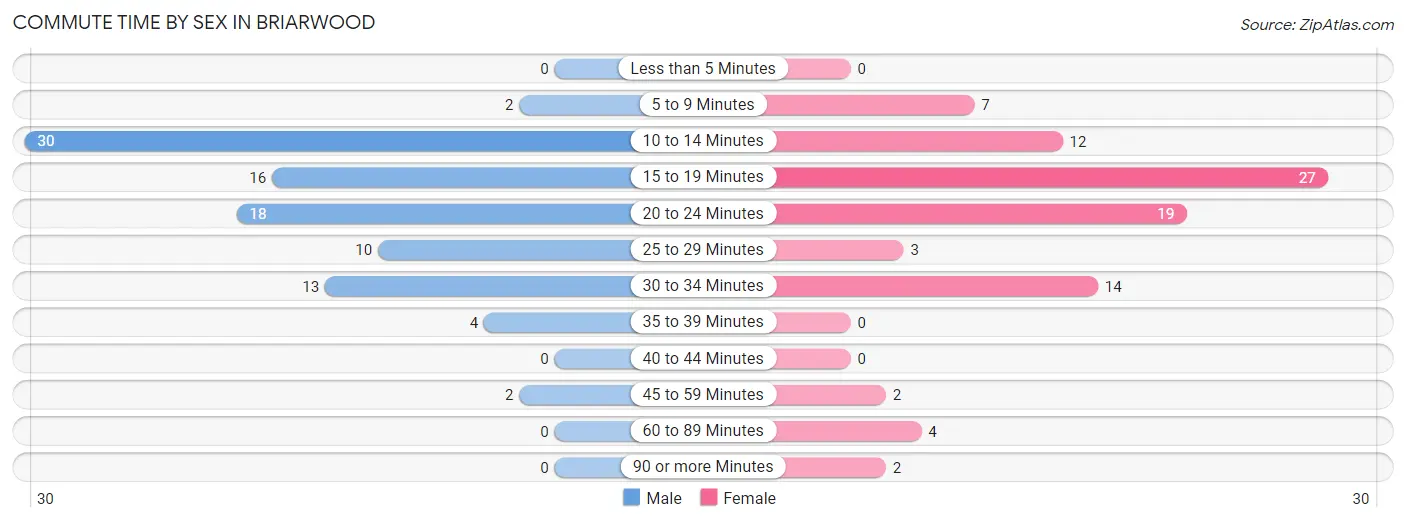
| Commute Time | Male | Female |
| Less than 5 Minutes | 0 (0.0%) | 0 (0.0%) |
| 5 to 9 Minutes | 2 (2.1%) | 7 (7.8%) |
| 10 to 14 Minutes | 30 (31.6%) | 12 (13.3%) |
| 15 to 19 Minutes | 16 (16.8%) | 27 (30.0%) |
| 20 to 24 Minutes | 18 (19.0%) | 19 (21.1%) |
| 25 to 29 Minutes | 10 (10.5%) | 3 (3.3%) |
| 30 to 34 Minutes | 13 (13.7%) | 14 (15.6%) |
| 35 to 39 Minutes | 4 (4.2%) | 0 (0.0%) |
| 40 to 44 Minutes | 0 (0.0%) | 0 (0.0%) |
| 45 to 59 Minutes | 2 (2.1%) | 2 (2.2%) |
| 60 to 89 Minutes | 0 (0.0%) | 4 (4.4%) |
| 90 or more Minutes | 0 (0.0%) | 2 (2.2%) |
Time of Departure to Work by Sex in Briarwood
The most frequent times of departure to work in Briarwood are 7:00 AM to 7:29 AM (21, 22.1%) for males and 9:00 AM to 9:59 AM (19, 21.1%) for females.
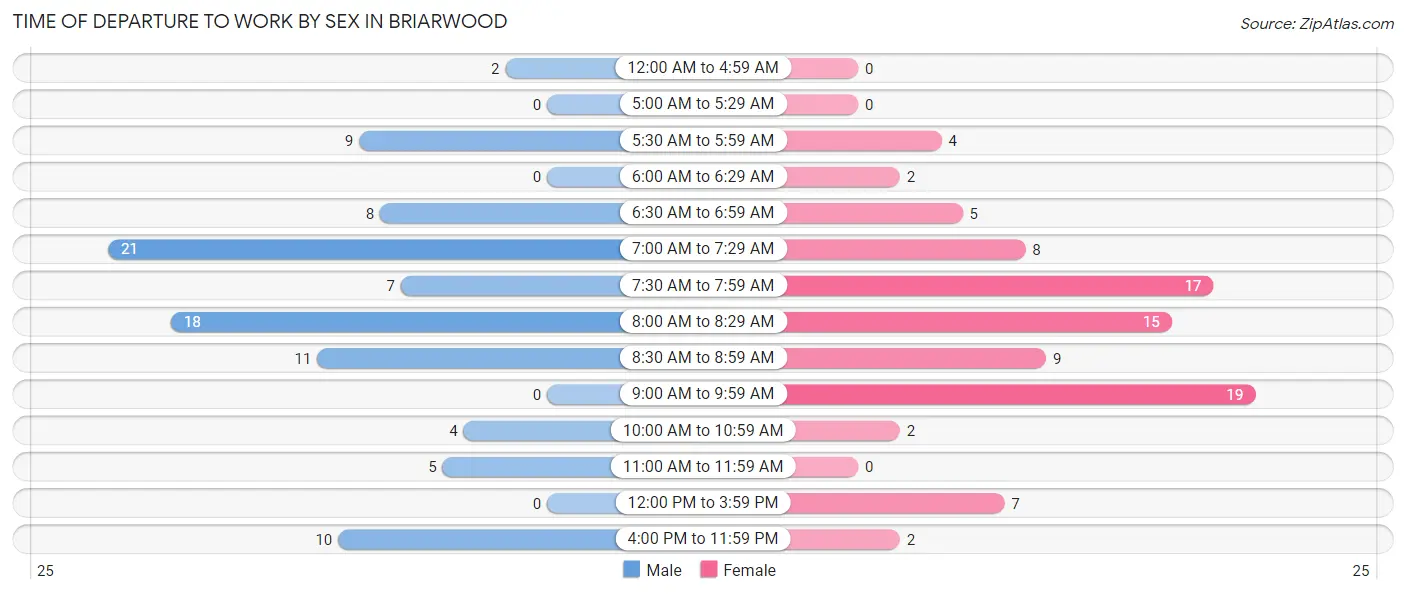
| Time of Departure | Male | Female |
| 12:00 AM to 4:59 AM | 2 (2.1%) | 0 (0.0%) |
| 5:00 AM to 5:29 AM | 0 (0.0%) | 0 (0.0%) |
| 5:30 AM to 5:59 AM | 9 (9.5%) | 4 (4.4%) |
| 6:00 AM to 6:29 AM | 0 (0.0%) | 2 (2.2%) |
| 6:30 AM to 6:59 AM | 8 (8.4%) | 5 (5.6%) |
| 7:00 AM to 7:29 AM | 21 (22.1%) | 8 (8.9%) |
| 7:30 AM to 7:59 AM | 7 (7.4%) | 17 (18.9%) |
| 8:00 AM to 8:29 AM | 18 (19.0%) | 15 (16.7%) |
| 8:30 AM to 8:59 AM | 11 (11.6%) | 9 (10.0%) |
| 9:00 AM to 9:59 AM | 0 (0.0%) | 19 (21.1%) |
| 10:00 AM to 10:59 AM | 4 (4.2%) | 2 (2.2%) |
| 11:00 AM to 11:59 AM | 5 (5.3%) | 0 (0.0%) |
| 12:00 PM to 3:59 PM | 0 (0.0%) | 7 (7.8%) |
| 4:00 PM to 11:59 PM | 10 (10.5%) | 2 (2.2%) |
| Total | 95 (100.0%) | 90 (100.0%) |
Housing Occupancy in Briarwood
Occupancy by Ownership in Briarwood
Of the total 202 dwellings in Briarwood, owner-occupied units account for 176 (87.1%), while renter-occupied units make up 26 (12.9%).
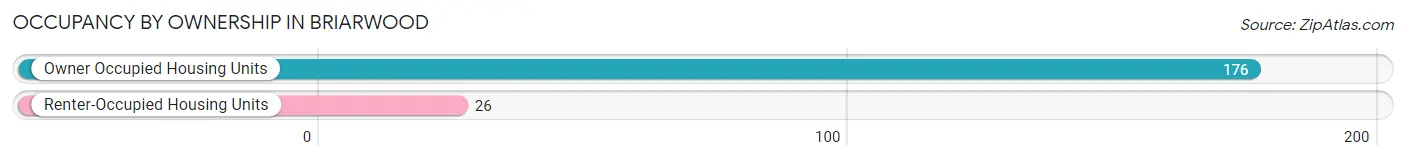
| Occupancy | # Housing Units | % Housing Units |
| Owner Occupied Housing Units | 176 | 87.1% |
| Renter-Occupied Housing Units | 26 | 12.9% |
| Total Occupied Housing Units | 202 | 100.0% |
Occupancy by Household Size in Briarwood
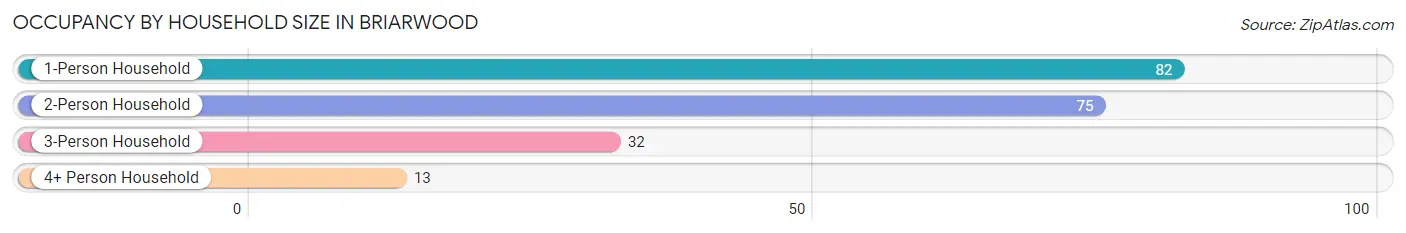
| Household Size | # Housing Units | % Housing Units |
| 1-Person Household | 82 | 40.6% |
| 2-Person Household | 75 | 37.1% |
| 3-Person Household | 32 | 15.8% |
| 4+ Person Household | 13 | 6.4% |
| Total Housing Units | 202 | 100.0% |
Occupancy by Ownership by Household Size in Briarwood
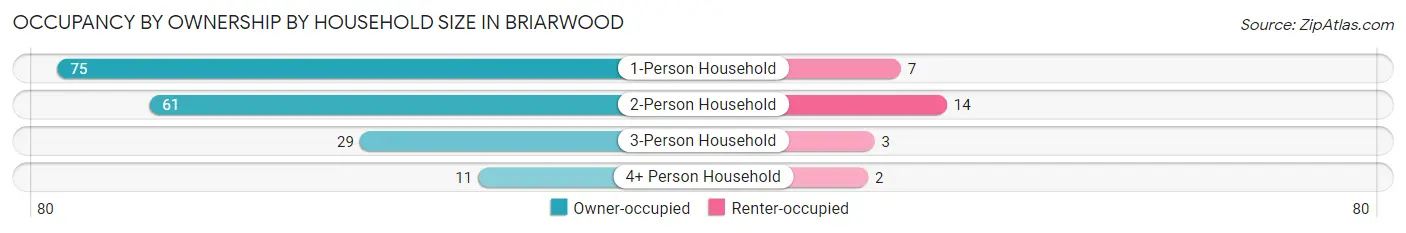
| Household Size | Owner-occupied | Renter-occupied |
| 1-Person Household | 75 (91.5%) | 7 (8.5%) |
| 2-Person Household | 61 (81.3%) | 14 (18.7%) |
| 3-Person Household | 29 (90.6%) | 3 (9.4%) |
| 4+ Person Household | 11 (84.6%) | 2 (15.4%) |
| Total Housing Units | 176 (87.1%) | 26 (12.9%) |
Occupancy by Educational Attainment in Briarwood
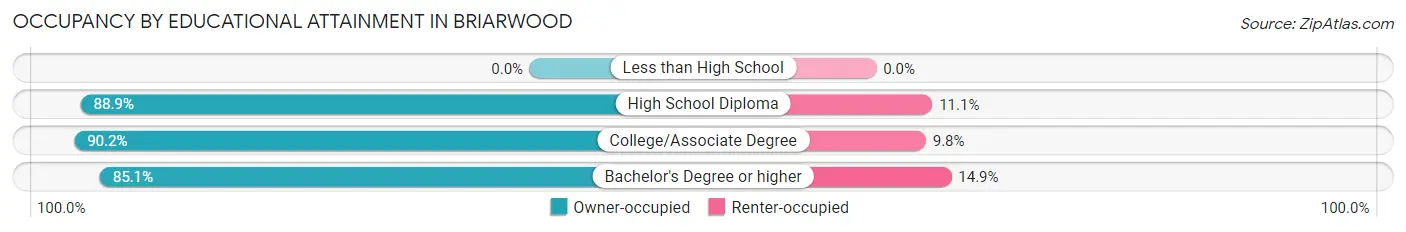
| Household Size | Owner-occupied | Renter-occupied |
| Less than High School | 0 (0.0%) | 0 (0.0%) |
| High School Diploma | 24 (88.9%) | 3 (11.1%) |
| College/Associate Degree | 55 (90.2%) | 6 (9.8%) |
| Bachelor's Degree or higher | 97 (85.1%) | 17 (14.9%) |
Occupancy by Age of Householder in Briarwood
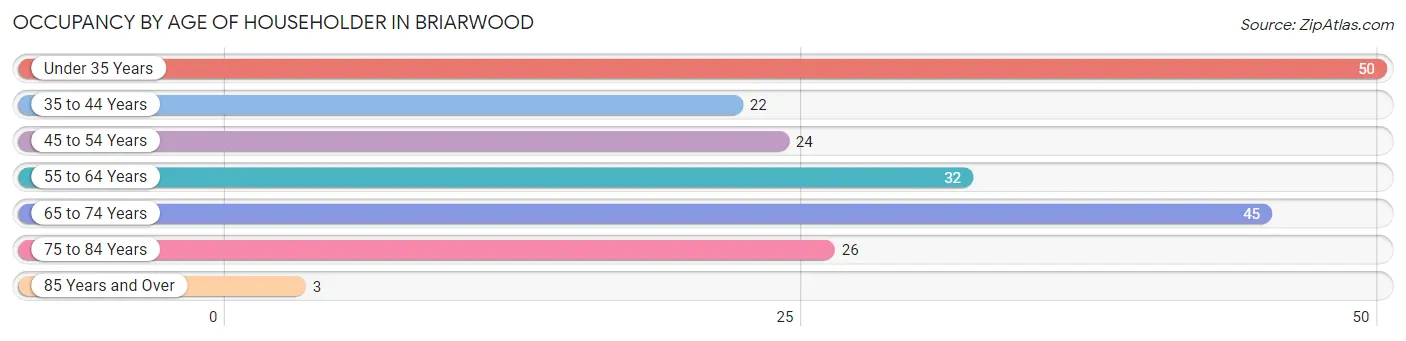
| Age Bracket | # Households | % Households |
| Under 35 Years | 50 | 24.7% |
| 35 to 44 Years | 22 | 10.9% |
| 45 to 54 Years | 24 | 11.9% |
| 55 to 64 Years | 32 | 15.8% |
| 65 to 74 Years | 45 | 22.3% |
| 75 to 84 Years | 26 | 12.9% |
| 85 Years and Over | 3 | 1.5% |
| Total | 202 | 100.0% |
Housing Finances in Briarwood
Median Income by Occupancy in Briarwood
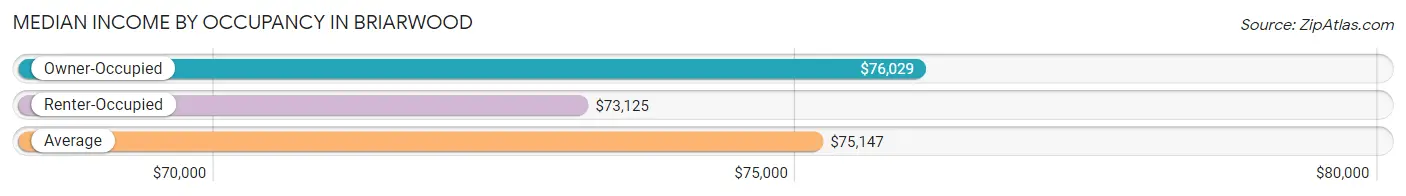
| Occupancy Type | # Households | Median Income |
| Owner-Occupied | 176 (87.1%) | $76,029 |
| Renter-Occupied | 26 (12.9%) | $73,125 |
| Average | 202 (100.0%) | $75,147 |
Occupancy by Householder Income Bracket in Briarwood
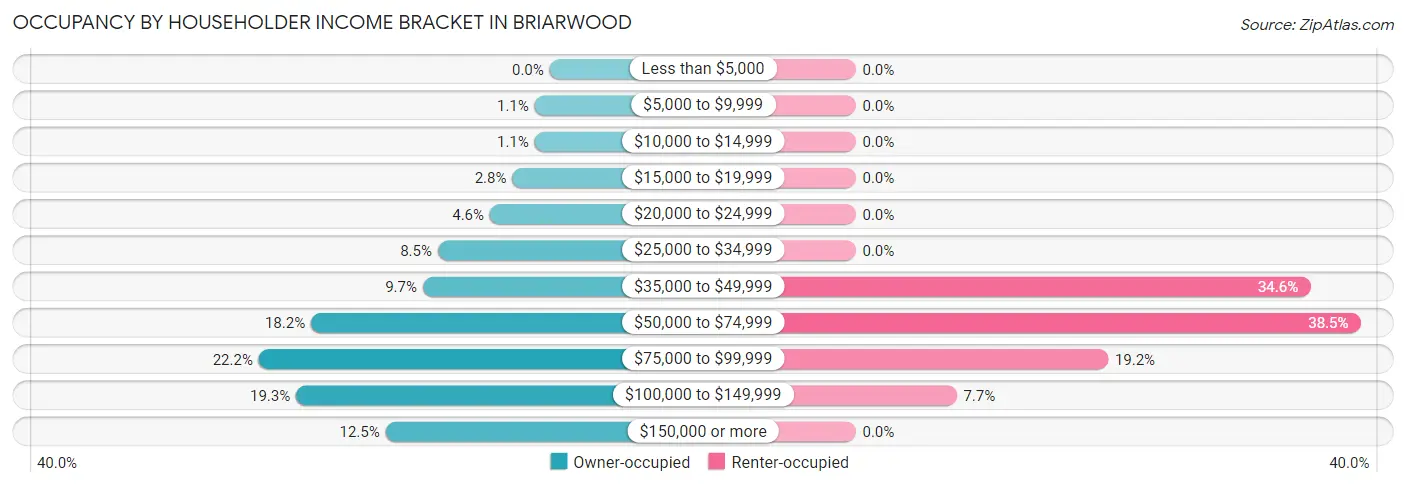
| Income Bracket | Owner-occupied | Renter-occupied |
| Less than $5,000 | 0 (0.0%) | 0 (0.0%) |
| $5,000 to $9,999 | 2 (1.1%) | 0 (0.0%) |
| $10,000 to $14,999 | 2 (1.1%) | 0 (0.0%) |
| $15,000 to $19,999 | 5 (2.8%) | 0 (0.0%) |
| $20,000 to $24,999 | 8 (4.5%) | 0 (0.0%) |
| $25,000 to $34,999 | 15 (8.5%) | 0 (0.0%) |
| $35,000 to $49,999 | 17 (9.7%) | 9 (34.6%) |
| $50,000 to $74,999 | 32 (18.2%) | 10 (38.5%) |
| $75,000 to $99,999 | 39 (22.2%) | 5 (19.2%) |
| $100,000 to $149,999 | 34 (19.3%) | 2 (7.7%) |
| $150,000 or more | 22 (12.5%) | 0 (0.0%) |
| Total | 176 (100.0%) | 26 (100.0%) |
Monthly Housing Cost Tiers in Briarwood
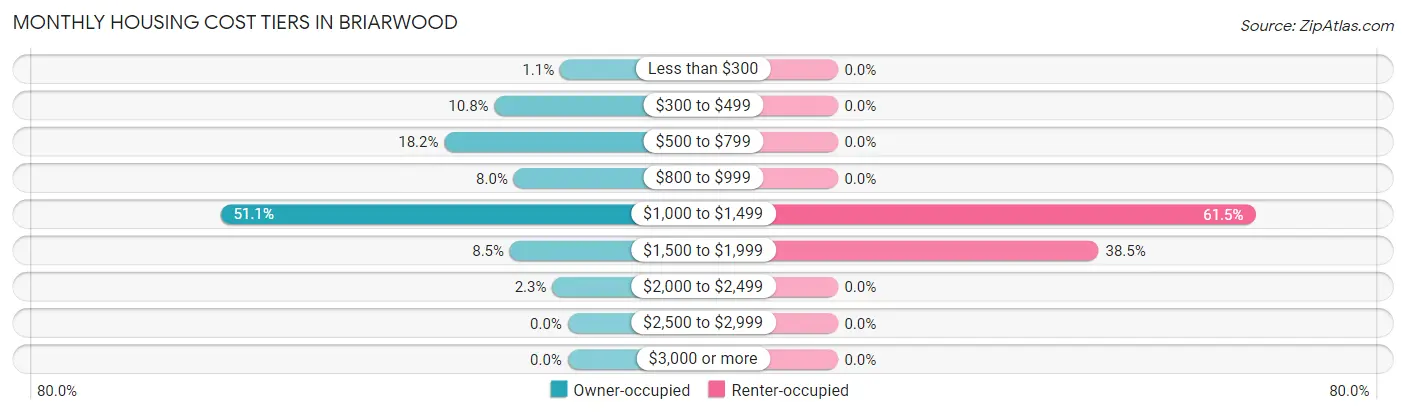
| Monthly Cost | Owner-occupied | Renter-occupied |
| Less than $300 | 2 (1.1%) | 0 (0.0%) |
| $300 to $499 | 19 (10.8%) | 0 (0.0%) |
| $500 to $799 | 32 (18.2%) | 0 (0.0%) |
| $800 to $999 | 14 (8.0%) | 0 (0.0%) |
| $1,000 to $1,499 | 90 (51.1%) | 16 (61.5%) |
| $1,500 to $1,999 | 15 (8.5%) | 10 (38.5%) |
| $2,000 to $2,499 | 4 (2.3%) | 0 (0.0%) |
| $2,500 to $2,999 | 0 (0.0%) | 0 (0.0%) |
| $3,000 or more | 0 (0.0%) | 0 (0.0%) |
| Total | 176 (100.0%) | 26 (100.0%) |
Physical Housing Characteristics in Briarwood
Housing Structures in Briarwood
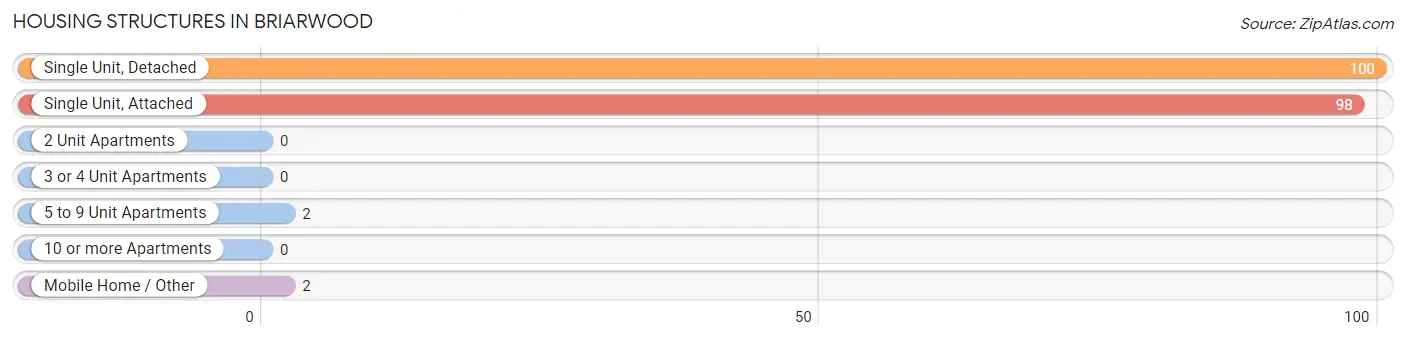
| Structure Type | # Housing Units | % Housing Units |
| Single Unit, Detached | 100 | 49.5% |
| Single Unit, Attached | 98 | 48.5% |
| 2 Unit Apartments | 0 | 0.0% |
| 3 or 4 Unit Apartments | 0 | 0.0% |
| 5 to 9 Unit Apartments | 2 | 1.0% |
| 10 or more Apartments | 0 | 0.0% |
| Mobile Home / Other | 2 | 1.0% |
| Total | 202 | 100.0% |
Housing Structures by Occupancy in Briarwood
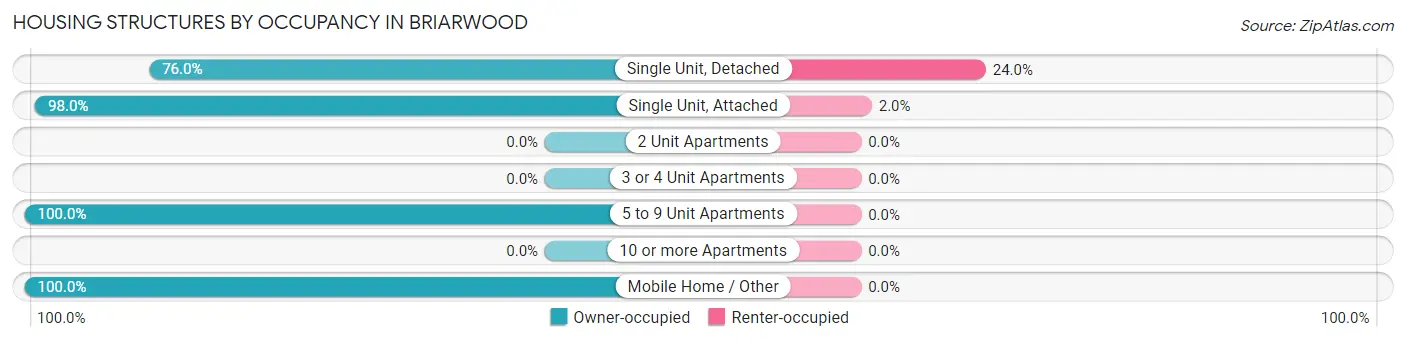
| Structure Type | Owner-occupied | Renter-occupied |
| Single Unit, Detached | 76 (76.0%) | 24 (24.0%) |
| Single Unit, Attached | 96 (98.0%) | 2 (2.0%) |
| 2 Unit Apartments | 0 (0.0%) | 0 (0.0%) |
| 3 or 4 Unit Apartments | 0 (0.0%) | 0 (0.0%) |
| 5 to 9 Unit Apartments | 2 (100.0%) | 0 (0.0%) |
| 10 or more Apartments | 0 (0.0%) | 0 (0.0%) |
| Mobile Home / Other | 2 (100.0%) | 0 (0.0%) |
| Total | 176 (87.1%) | 26 (12.9%) |
Housing Structures by Number of Rooms in Briarwood
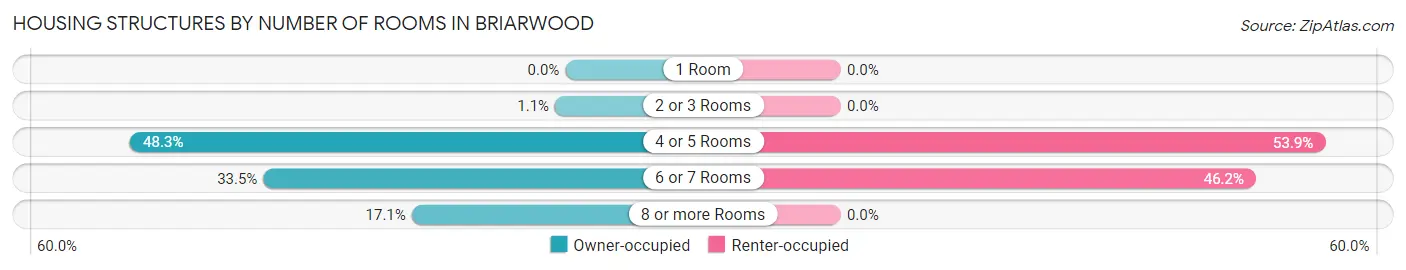
| Number of Rooms | Owner-occupied | Renter-occupied |
| 1 Room | 0 (0.0%) | 0 (0.0%) |
| 2 or 3 Rooms | 2 (1.1%) | 0 (0.0%) |
| 4 or 5 Rooms | 85 (48.3%) | 14 (53.8%) |
| 6 or 7 Rooms | 59 (33.5%) | 12 (46.2%) |
| 8 or more Rooms | 30 (17.1%) | 0 (0.0%) |
| Total | 176 (100.0%) | 26 (100.0%) |
Housing Structure by Heating Type in Briarwood
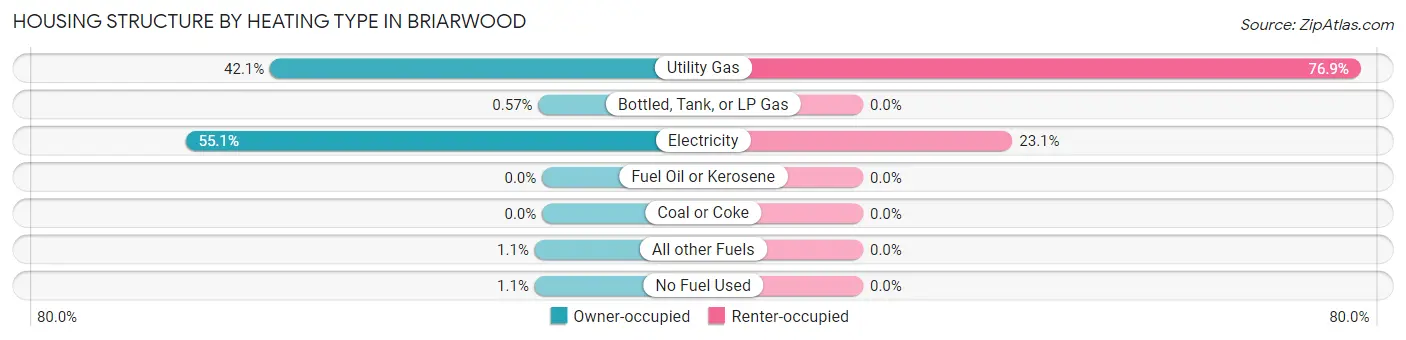
| Heating Type | Owner-occupied | Renter-occupied |
| Utility Gas | 74 (42.0%) | 20 (76.9%) |
| Bottled, Tank, or LP Gas | 1 (0.6%) | 0 (0.0%) |
| Electricity | 97 (55.1%) | 6 (23.1%) |
| Fuel Oil or Kerosene | 0 (0.0%) | 0 (0.0%) |
| Coal or Coke | 0 (0.0%) | 0 (0.0%) |
| All other Fuels | 2 (1.1%) | 0 (0.0%) |
| No Fuel Used | 2 (1.1%) | 0 (0.0%) |
| Total | 176 (100.0%) | 26 (100.0%) |
Household Vehicle Usage in Briarwood
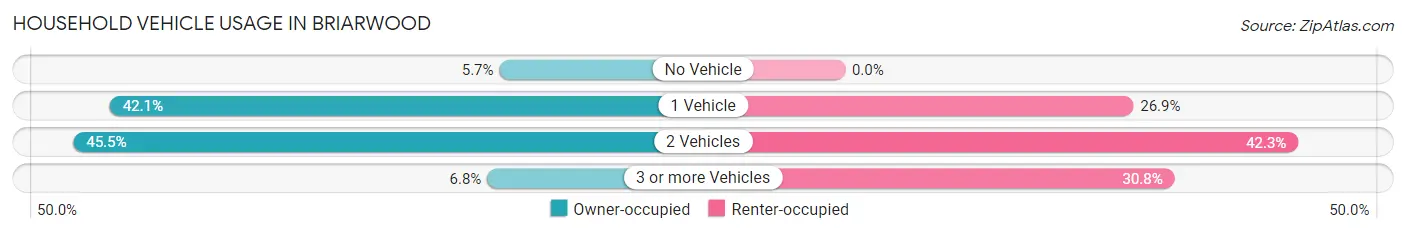
| Vehicles per Household | Owner-occupied | Renter-occupied |
| No Vehicle | 10 (5.7%) | 0 (0.0%) |
| 1 Vehicle | 74 (42.0%) | 7 (26.9%) |
| 2 Vehicles | 80 (45.5%) | 11 (42.3%) |
| 3 or more Vehicles | 12 (6.8%) | 8 (30.8%) |
| Total | 176 (100.0%) | 26 (100.0%) |
Real Estate & Mortgages in Briarwood
Real Estate and Mortgage Overview in Briarwood
| Characteristic | Without Mortgage | With Mortgage |
| Housing Units | 55 | 121 |
| Median Property Value | $179,500 | $191,800 |
| Median Household Income | $69,375 | $11 |
| Monthly Housing Costs | $550 | $0 |
| Real Estate Taxes | $1,542 | $4 |
Property Value by Mortgage Status in Briarwood
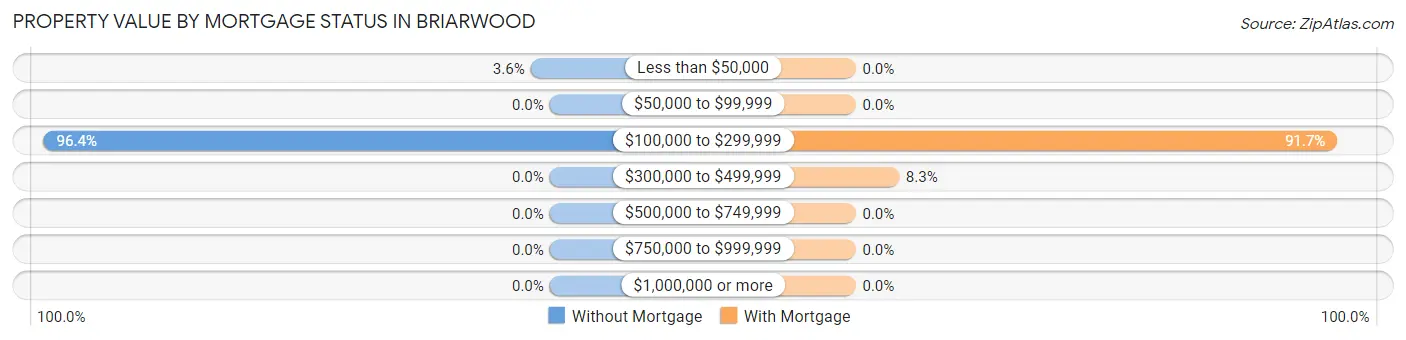
| Property Value | Without Mortgage | With Mortgage |
| Less than $50,000 | 2 (3.6%) | 0 (0.0%) |
| $50,000 to $99,999 | 0 (0.0%) | 0 (0.0%) |
| $100,000 to $299,999 | 53 (96.4%) | 111 (91.7%) |
| $300,000 to $499,999 | 0 (0.0%) | 10 (8.3%) |
| $500,000 to $749,999 | 0 (0.0%) | 0 (0.0%) |
| $750,000 to $999,999 | 0 (0.0%) | 0 (0.0%) |
| $1,000,000 or more | 0 (0.0%) | 0 (0.0%) |
| Total | 55 (100.0%) | 121 (100.0%) |
Household Income by Mortgage Status in Briarwood
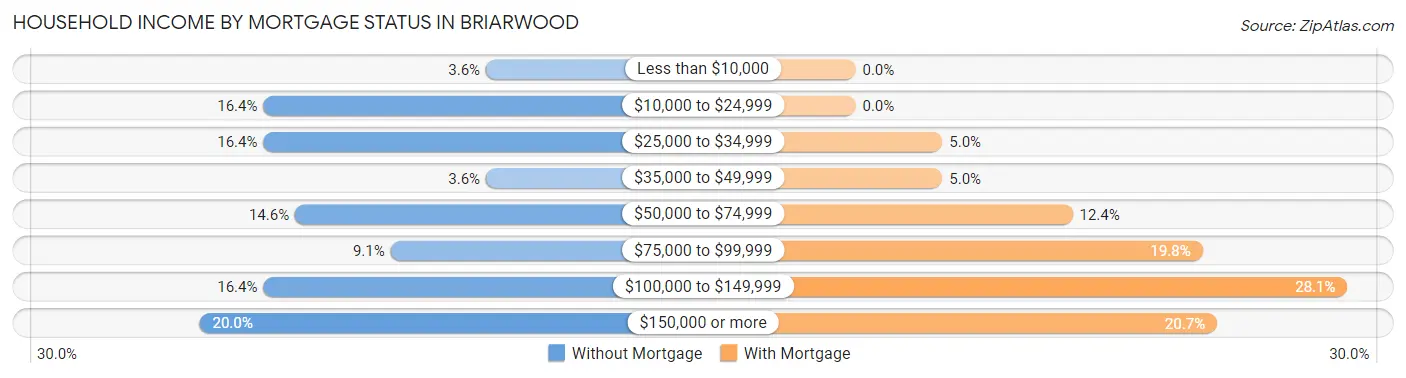
| Household Income | Without Mortgage | With Mortgage |
| Less than $10,000 | 2 (3.6%) | 0 (0.0%) |
| $10,000 to $24,999 | 9 (16.4%) | 0 (0.0%) |
| $25,000 to $34,999 | 9 (16.4%) | 6 (5.0%) |
| $35,000 to $49,999 | 2 (3.6%) | 6 (5.0%) |
| $50,000 to $74,999 | 8 (14.5%) | 15 (12.4%) |
| $75,000 to $99,999 | 5 (9.1%) | 24 (19.8%) |
| $100,000 to $149,999 | 9 (16.4%) | 34 (28.1%) |
| $150,000 or more | 11 (20.0%) | 25 (20.7%) |
| Total | 55 (100.0%) | 121 (100.0%) |
Property Value to Household Income Ratio in Briarwood
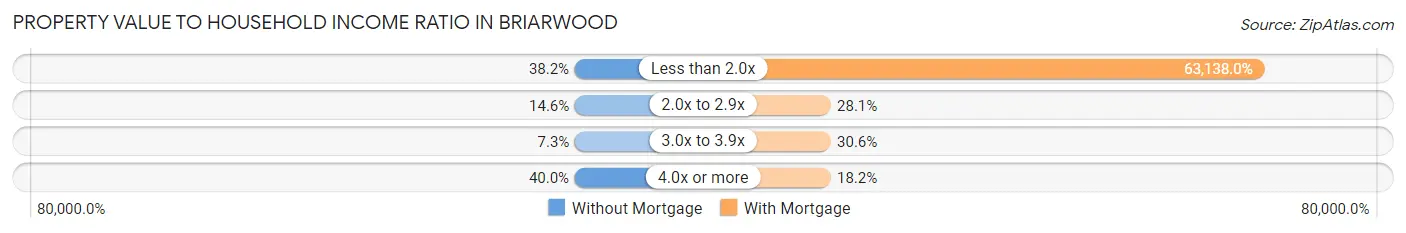
| Value-to-Income Ratio | Without Mortgage | With Mortgage |
| Less than 2.0x | 21 (38.2%) | 76,397 (63,138.0%) |
| 2.0x to 2.9x | 8 (14.5%) | 34 (28.1%) |
| 3.0x to 3.9x | 4 (7.3%) | 37 (30.6%) |
| 4.0x or more | 22 (40.0%) | 22 (18.2%) |
| Total | 55 (100.0%) | 121 (100.0%) |
Real Estate Taxes by Mortgage Status in Briarwood
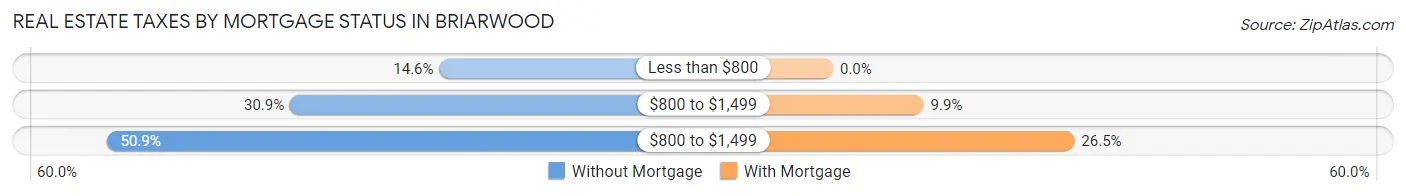
| Property Taxes | Without Mortgage | With Mortgage |
| Less than $800 | 8 (14.5%) | 0 (0.0%) |
| $800 to $1,499 | 17 (30.9%) | 12 (9.9%) |
| $800 to $1,499 | 28 (50.9%) | 32 (26.5%) |
| Total | 55 (100.0%) | 121 (100.0%) |
Health & Disability in Briarwood
Health Insurance Coverage by Age in Briarwood
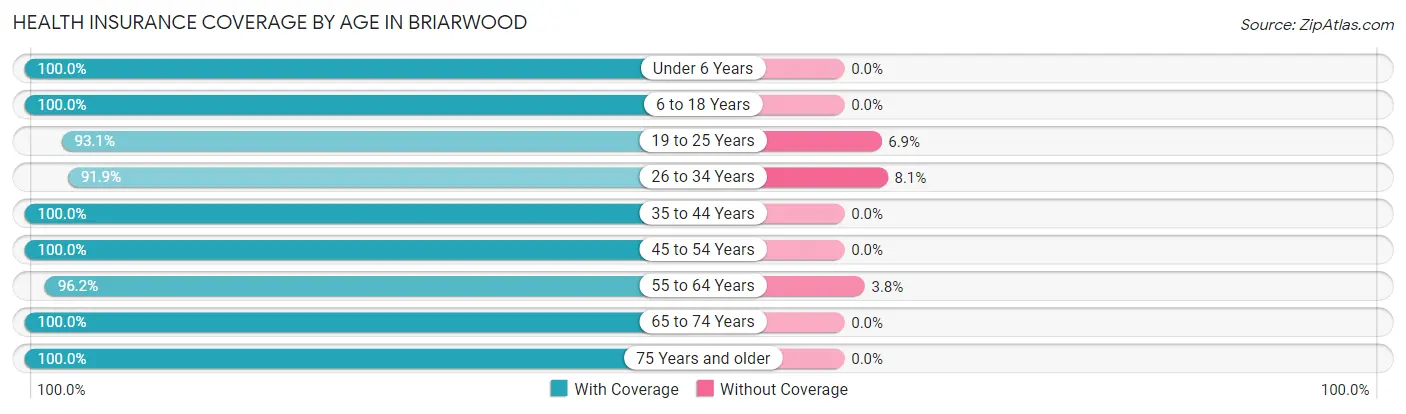
| Age Bracket | With Coverage | Without Coverage |
| Under 6 Years | 31 (100.0%) | 0 (0.0%) |
| 6 to 18 Years | 21 (100.0%) | 0 (0.0%) |
| 19 to 25 Years | 27 (93.1%) | 2 (6.9%) |
| 26 to 34 Years | 57 (91.9%) | 5 (8.1%) |
| 35 to 44 Years | 42 (100.0%) | 0 (0.0%) |
| 45 to 54 Years | 42 (100.0%) | 0 (0.0%) |
| 55 to 64 Years | 51 (96.2%) | 2 (3.8%) |
| 65 to 74 Years | 74 (100.0%) | 0 (0.0%) |
| 75 Years and older | 31 (100.0%) | 0 (0.0%) |
| Total | 376 (97.7%) | 9 (2.3%) |
Health Insurance Coverage by Citizenship Status in Briarwood
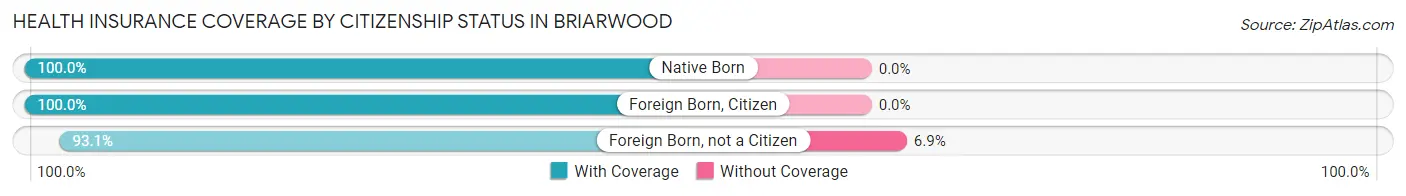
| Citizenship Status | With Coverage | Without Coverage |
| Native Born | 31 (100.0%) | 0 (0.0%) |
| Foreign Born, Citizen | 21 (100.0%) | 0 (0.0%) |
| Foreign Born, not a Citizen | 27 (93.1%) | 2 (6.9%) |
Health Insurance Coverage by Household Income in Briarwood
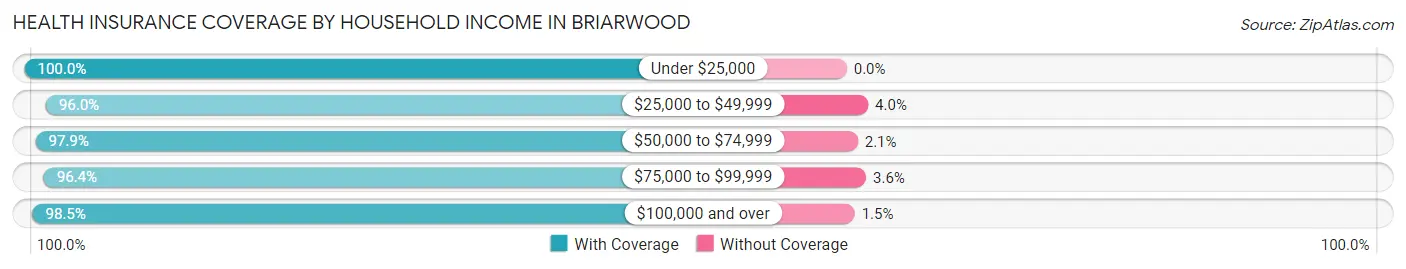
| Household Income | With Coverage | Without Coverage |
| Under $25,000 | 21 (100.0%) | 0 (0.0%) |
| $25,000 to $49,999 | 48 (96.0%) | 2 (4.0%) |
| $50,000 to $74,999 | 95 (97.9%) | 2 (2.1%) |
| $75,000 to $99,999 | 80 (96.4%) | 3 (3.6%) |
| $100,000 and over | 132 (98.5%) | 2 (1.5%) |
Public vs Private Health Insurance Coverage by Age in Briarwood
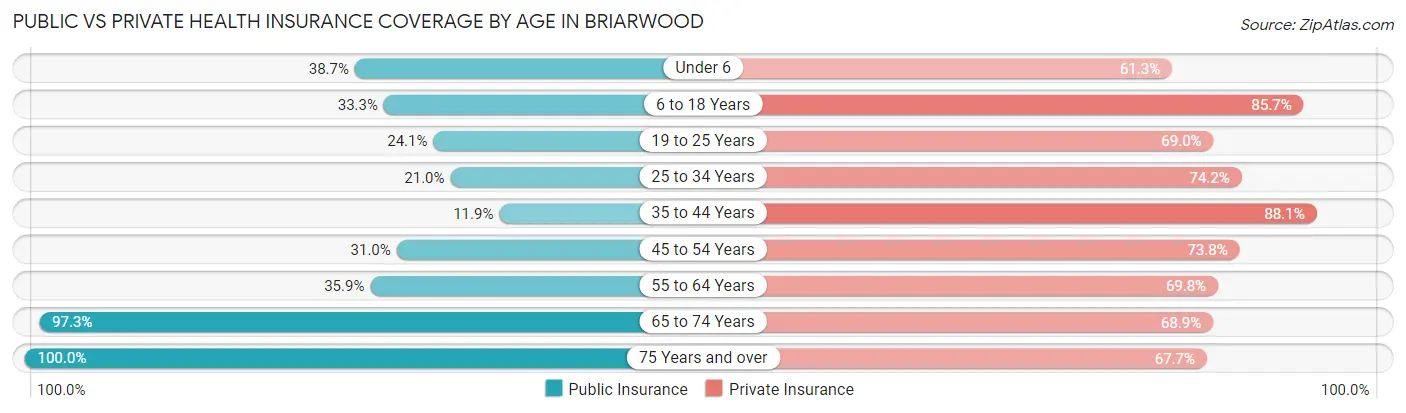
| Age Bracket | Public Insurance | Private Insurance |
| Under 6 | 12 (38.7%) | 19 (61.3%) |
| 6 to 18 Years | 7 (33.3%) | 18 (85.7%) |
| 19 to 25 Years | 7 (24.1%) | 20 (69.0%) |
| 25 to 34 Years | 13 (21.0%) | 46 (74.2%) |
| 35 to 44 Years | 5 (11.9%) | 37 (88.1%) |
| 45 to 54 Years | 13 (30.9%) | 31 (73.8%) |
| 55 to 64 Years | 19 (35.8%) | 37 (69.8%) |
| 65 to 74 Years | 72 (97.3%) | 51 (68.9%) |
| 75 Years and over | 31 (100.0%) | 21 (67.7%) |
| Total | 179 (46.5%) | 280 (72.7%) |
Disability Status by Sex by Age in Briarwood
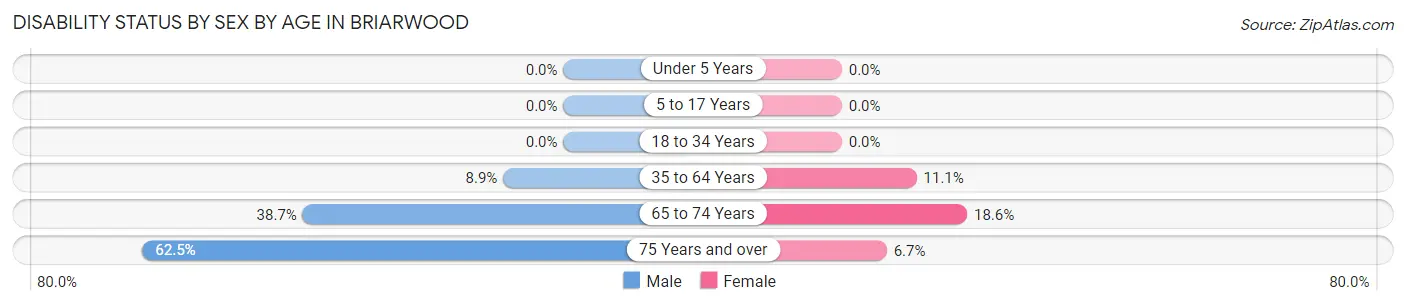
| Age Bracket | Male | Female |
| Under 5 Years | 0 (0.0%) | 0 (0.0%) |
| 5 to 17 Years | 0 (0.0%) | 0 (0.0%) |
| 18 to 34 Years | 0 (0.0%) | 0 (0.0%) |
| 35 to 64 Years | 5 (8.9%) | 9 (11.1%) |
| 65 to 74 Years | 12 (38.7%) | 8 (18.6%) |
| 75 Years and over | 10 (62.5%) | 1 (6.7%) |
Disability Class by Sex by Age in Briarwood
Disability Class: Hearing Difficulty
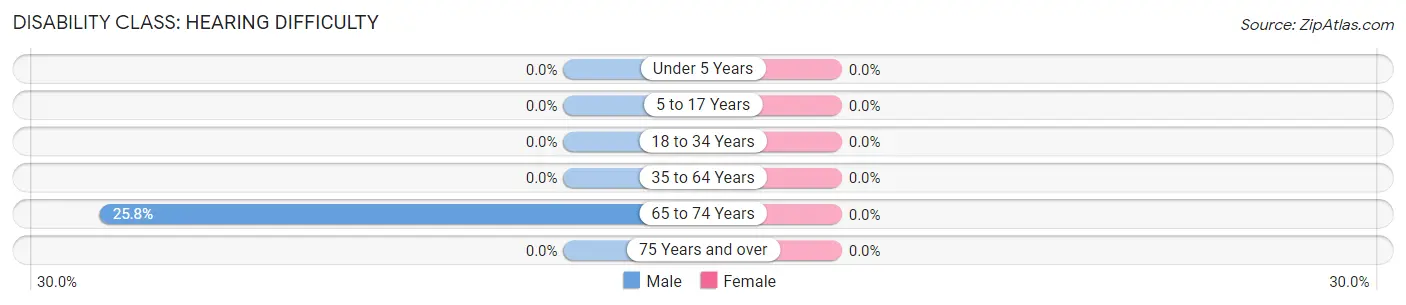
| Age Bracket | Male | Female |
| Under 5 Years | 0 (0.0%) | 0 (0.0%) |
| 5 to 17 Years | 0 (0.0%) | 0 (0.0%) |
| 18 to 34 Years | 0 (0.0%) | 0 (0.0%) |
| 35 to 64 Years | 0 (0.0%) | 0 (0.0%) |
| 65 to 74 Years | 8 (25.8%) | 0 (0.0%) |
| 75 Years and over | 0 (0.0%) | 0 (0.0%) |
Disability Class: Vision Difficulty
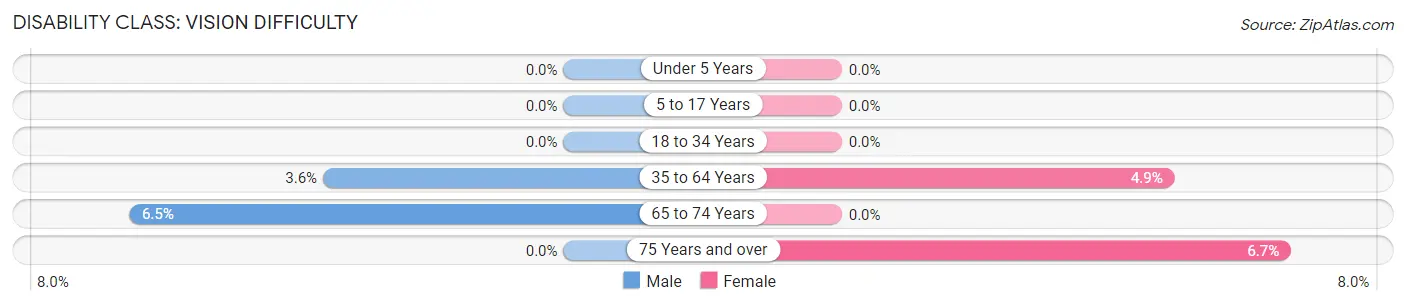
| Age Bracket | Male | Female |
| Under 5 Years | 0 (0.0%) | 0 (0.0%) |
| 5 to 17 Years | 0 (0.0%) | 0 (0.0%) |
| 18 to 34 Years | 0 (0.0%) | 0 (0.0%) |
| 35 to 64 Years | 2 (3.6%) | 4 (4.9%) |
| 65 to 74 Years | 2 (6.5%) | 0 (0.0%) |
| 75 Years and over | 0 (0.0%) | 1 (6.7%) |
Disability Class: Cognitive Difficulty
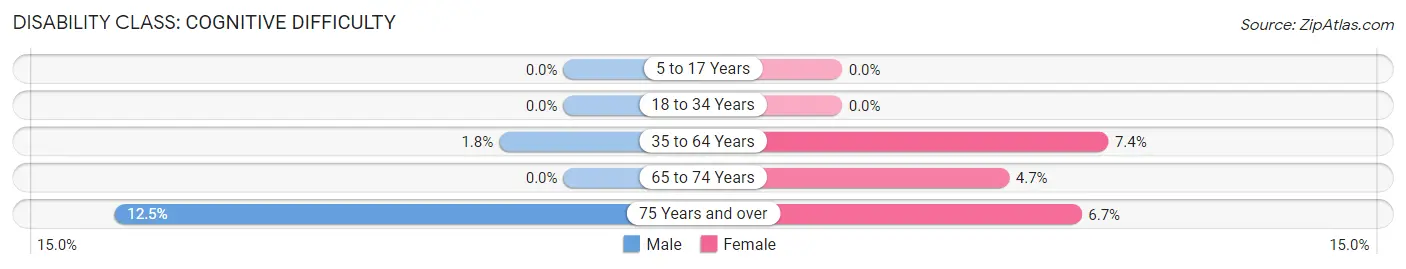
| Age Bracket | Male | Female |
| 5 to 17 Years | 0 (0.0%) | 0 (0.0%) |
| 18 to 34 Years | 0 (0.0%) | 0 (0.0%) |
| 35 to 64 Years | 1 (1.8%) | 6 (7.4%) |
| 65 to 74 Years | 0 (0.0%) | 2 (4.6%) |
| 75 Years and over | 2 (12.5%) | 1 (6.7%) |
Disability Class: Ambulatory Difficulty
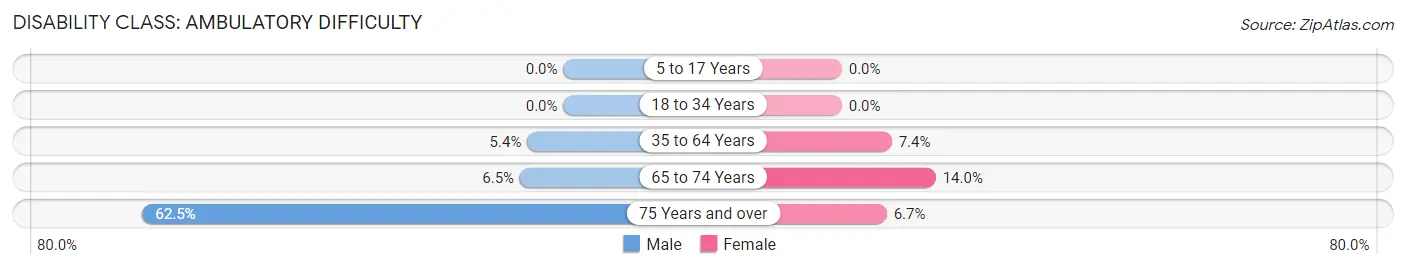
| Age Bracket | Male | Female |
| 5 to 17 Years | 0 (0.0%) | 0 (0.0%) |
| 18 to 34 Years | 0 (0.0%) | 0 (0.0%) |
| 35 to 64 Years | 3 (5.4%) | 6 (7.4%) |
| 65 to 74 Years | 2 (6.5%) | 6 (14.0%) |
| 75 Years and over | 10 (62.5%) | 1 (6.7%) |
Disability Class: Self-Care Difficulty
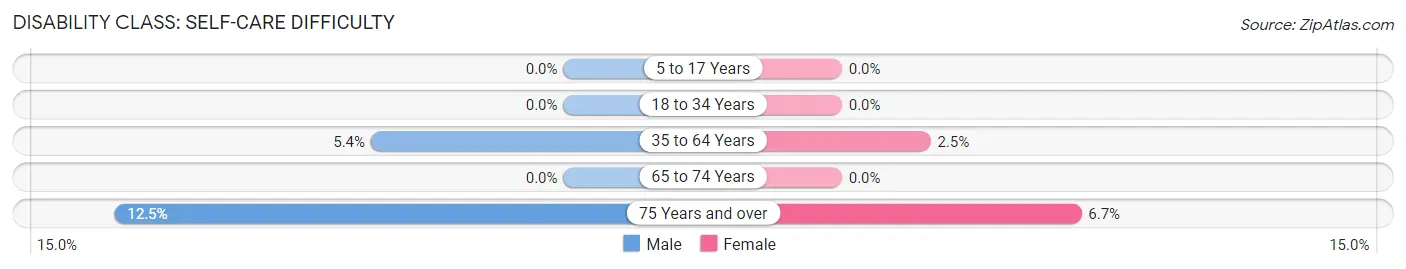
| Age Bracket | Male | Female |
| 5 to 17 Years | 0 (0.0%) | 0 (0.0%) |
| 18 to 34 Years | 0 (0.0%) | 0 (0.0%) |
| 35 to 64 Years | 3 (5.4%) | 2 (2.5%) |
| 65 to 74 Years | 0 (0.0%) | 0 (0.0%) |
| 75 Years and over | 2 (12.5%) | 1 (6.7%) |
Technology Access in Briarwood
Computing Device Access in Briarwood
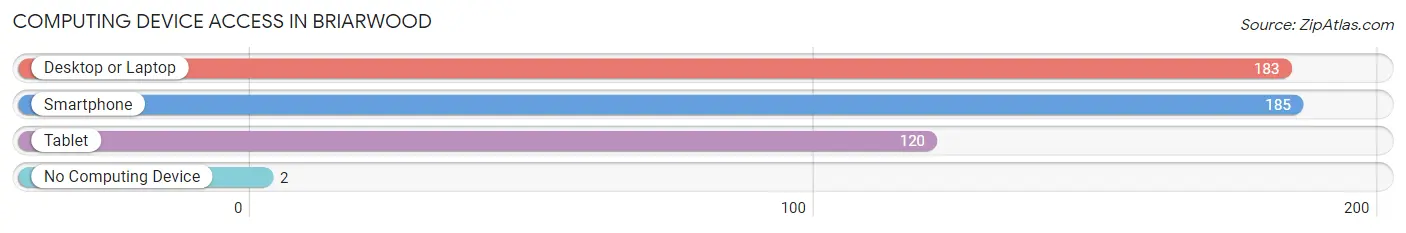
| Device Type | # Households | % Households |
| Desktop or Laptop | 183 | 90.6% |
| Smartphone | 185 | 91.6% |
| Tablet | 120 | 59.4% |
| No Computing Device | 2 | 1.0% |
| Total | 202 | 100.0% |
Internet Access in Briarwood
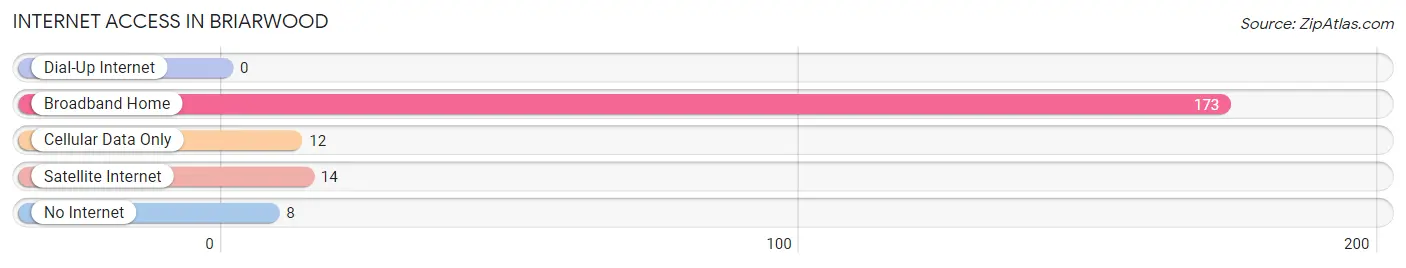
| Internet Type | # Households | % Households |
| Dial-Up Internet | 0 | 0.0% |
| Broadband Home | 173 | 85.6% |
| Cellular Data Only | 12 | 5.9% |
| Satellite Internet | 14 | 6.9% |
| No Internet | 8 | 4.0% |
| Total | 202 | 100.0% |
Briarwood Summary
Briarwood, Kentucky is a small unincorporated community located in the southeastern corner of the state, in the foothills of the Appalachian Mountains. It is situated in the heart of the Daniel Boone National Forest, and is surrounded by the towns of London, Corbin, and Somerset. The population of Briarwood is estimated to be around 500 people.
History
Briarwood was first settled in the early 1800s by a group of settlers from Virginia. The town was originally known as “Briarwood Station”, and was a stop on the Louisville and Nashville Railroad. The town was officially incorporated in 1883, and the name was changed to Briarwood.
The town was a popular destination for tourists in the late 19th and early 20th centuries, due to its proximity to the Daniel Boone National Forest. The town was also home to a number of resorts, including the Briarwood Hotel, which was built in the late 1800s and was a popular destination for wealthy visitors.
Geography
Briarwood is located in the southeastern corner of Kentucky, in the foothills of the Appalachian Mountains. The town is situated in the heart of the Daniel Boone National Forest, and is surrounded by the towns of London, Corbin, and Somerset. The town is located at an elevation of 1,000 feet above sea level, and has a total area of 0.6 square miles.
The climate in Briarwood is humid subtropical, with hot summers and mild winters. The average annual temperature is around 60 degrees Fahrenheit, and the average annual precipitation is around 45 inches.
Economy
The economy of Briarwood is largely based on tourism and agriculture. The town is home to a number of resorts and hotels, as well as several farms and ranches. The town is also home to a number of small businesses, including restaurants, shops, and other services.
Demographics
As of the 2010 census, the population of Briarwood was estimated to be around 500 people. The racial makeup of the town was 97.2% White, 0.8% African American, 0.2% Native American, 0.2% Asian, and 1.4% from other races. The median household income was estimated to be around $30,000, and the median home value was estimated to be around $90,000. The town is served by the London Independent School District.
Common Questions
What is Per Capita Income in Briarwood?
Per Capita income in Briarwood is $43,860.
What is the Median Family Income in Briarwood?
Median Family Income in Briarwood is $78,750.
What is the Median Household income in Briarwood?
Median Household Income in Briarwood is $75,147.
What is Income or Wage Gap in Briarwood?
Income or Wage Gap in Briarwood is 17.1%.
Women in Briarwood earn 82.9 cents for every dollar earned by a man.
What is Inequality or Gini Index in Briarwood?
Inequality or Gini Index in Briarwood is 0.33.
What is the Total Population of Briarwood?
Total Population of Briarwood is 385.
What is the Total Male Population of Briarwood?
Total Male Population of Briarwood is 185.
What is the Total Female Population of Briarwood?
Total Female Population of Briarwood is 200.
What is the Ratio of Males per 100 Females in Briarwood?
There are 92.50 Males per 100 Females in Briarwood.
What is the Ratio of Females per 100 Males in Briarwood?
There are 108.11 Females per 100 Males in Briarwood.
What is the Median Population Age in Briarwood?
Median Population Age in Briarwood is 47.1 Years.
What is the Average Family Size in Briarwood
Average Family Size in Briarwood is 2.5 People.
What is the Average Household Size in Briarwood
Average Household Size in Briarwood is 1.9 People.
How Large is the Labor Force in Briarwood?
There are 220 People in the Labor Forcein in Briarwood.
What is the Percentage of People in the Labor Force in Briarwood?
65.7% of People are in the Labor Force in Briarwood.
What is the Unemployment Rate in Briarwood?
Unemployment Rate in Briarwood is 5.0%.