Hanson, KY Map & Demographics
Hanson Map
Hanson Overview
$32,064
PER CAPITA INCOME
$89,107
AVG FAMILY INCOME
$84,063
AVG HOUSEHOLD INCOME
45.0%
WAGE / INCOME GAP [ % ]
55.0¢/ $1
WAGE / INCOME GAP [ $ ]
0.40
INEQUALITY / GINI INDEX
1,015
TOTAL POPULATION
505
MALE POPULATION
510
FEMALE POPULATION
99.02
MALES / 100 FEMALES
100.99
FEMALES / 100 MALES
45.7
MEDIAN AGE
2.6
AVG FAMILY SIZE
2.3
AVG HOUSEHOLD SIZE
378
LABOR FORCE [ PEOPLE ]
45.1%
PERCENT IN LABOR FORCE
4.0%
UNEMPLOYMENT RATE
Hanson Zip Codes
Hanson Area Codes
Income in Hanson
Income Overview in Hanson
Per Capita Income in Hanson is $32,064, while median incomes of families and households are $89,107 and $84,063 respectively.
| Characteristic | Number | Measure |
| Per Capita Income | 1,015 | $32,064 |
| Median Family Income | 287 | $89,107 |
| Mean Family Income | 287 | $103,611 |
| Median Household Income | 409 | $84,063 |
| Mean Household Income | 409 | $85,152 |
| Income Deficit | 287 | $0 |
| Wage / Income Gap (%) | 1,015 | 44.96% |
| Wage / Income Gap ($) | 1,015 | 55.04¢ per $1 |
| Gini / Inequality Index | 1,015 | 0.40 |
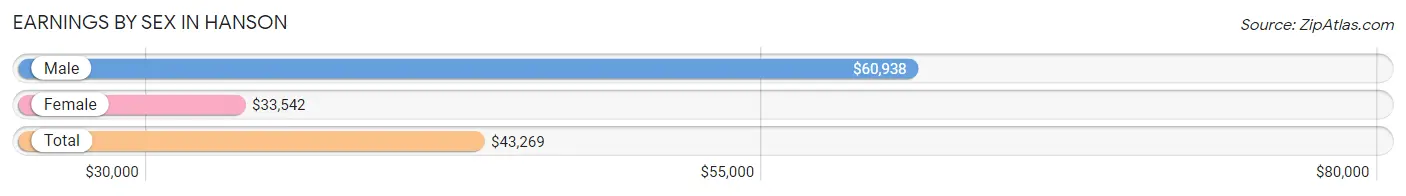
Earnings by Sex in Hanson
Average Earnings in Hanson are $43,269, $60,938 for men and $33,542 for women, a difference of 45.0%.
| Sex | Number | Average Earnings |
| Male | 143 (37.8%) | $60,938 |
| Female | 235 (62.2%) | $33,542 |
| Total | 378 (100.0%) | $43,269 |
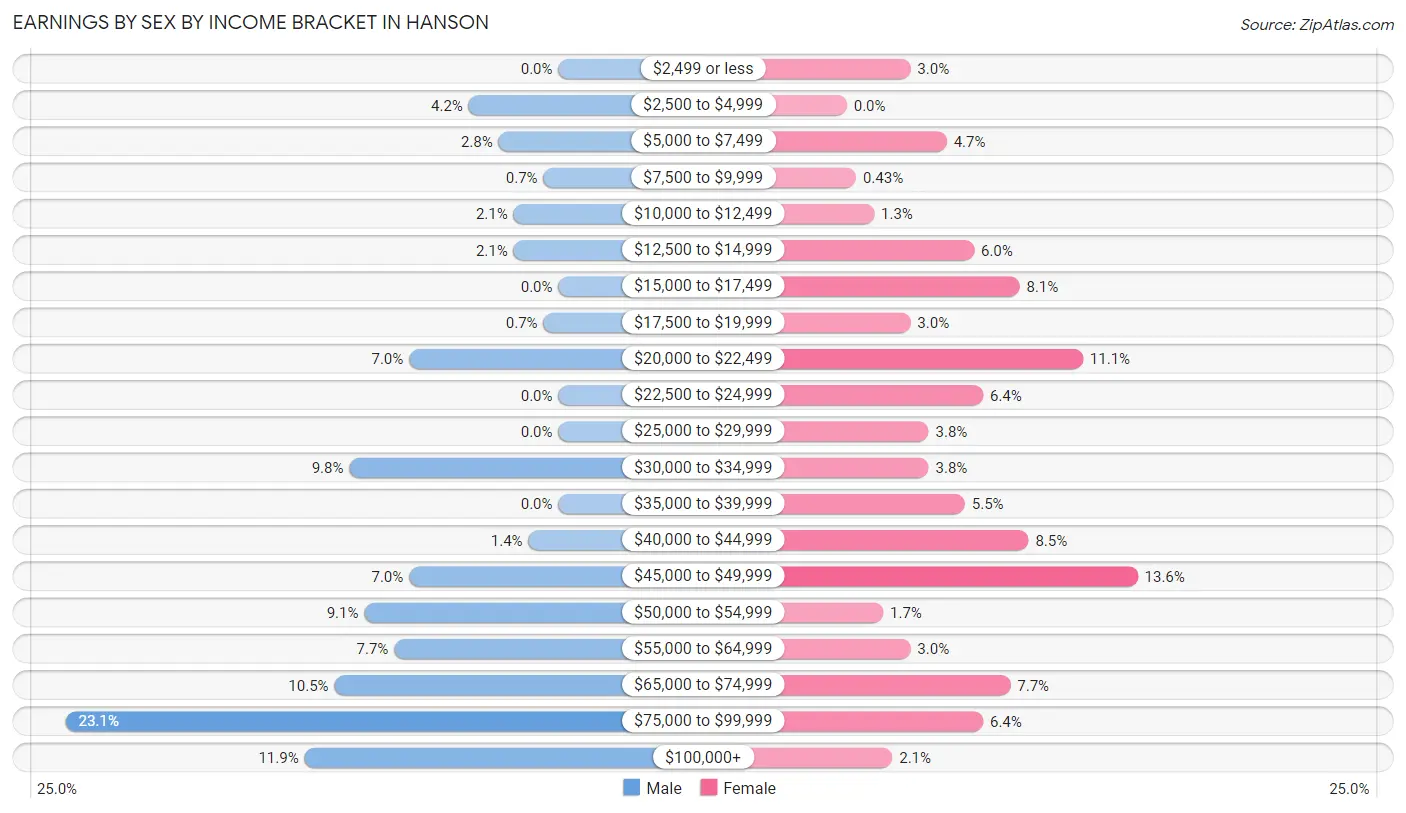
Earnings by Sex by Income Bracket in Hanson
The most common earnings brackets in Hanson are $75,000 to $99,999 for men (33 | 23.1%) and $45,000 to $49,999 for women (32 | 13.6%).
| Income | Male | Female |
| $2,499 or less | 0 (0.0%) | 7 (3.0%) |
| $2,500 to $4,999 | 6 (4.2%) | 0 (0.0%) |
| $5,000 to $7,499 | 4 (2.8%) | 11 (4.7%) |
| $7,500 to $9,999 | 1 (0.7%) | 1 (0.4%) |
| $10,000 to $12,499 | 3 (2.1%) | 3 (1.3%) |
| $12,500 to $14,999 | 3 (2.1%) | 14 (6.0%) |
| $15,000 to $17,499 | 0 (0.0%) | 19 (8.1%) |
| $17,500 to $19,999 | 1 (0.7%) | 7 (3.0%) |
| $20,000 to $22,499 | 10 (7.0%) | 26 (11.1%) |
| $22,500 to $24,999 | 0 (0.0%) | 15 (6.4%) |
| $25,000 to $29,999 | 0 (0.0%) | 9 (3.8%) |
| $30,000 to $34,999 | 14 (9.8%) | 9 (3.8%) |
| $35,000 to $39,999 | 0 (0.0%) | 13 (5.5%) |
| $40,000 to $44,999 | 2 (1.4%) | 20 (8.5%) |
| $45,000 to $49,999 | 10 (7.0%) | 32 (13.6%) |
| $50,000 to $54,999 | 13 (9.1%) | 4 (1.7%) |
| $55,000 to $64,999 | 11 (7.7%) | 7 (3.0%) |
| $65,000 to $74,999 | 15 (10.5%) | 18 (7.7%) |
| $75,000 to $99,999 | 33 (23.1%) | 15 (6.4%) |
| $100,000+ | 17 (11.9%) | 5 (2.1%) |
| Total | 143 (100.0%) | 235 (100.0%) |
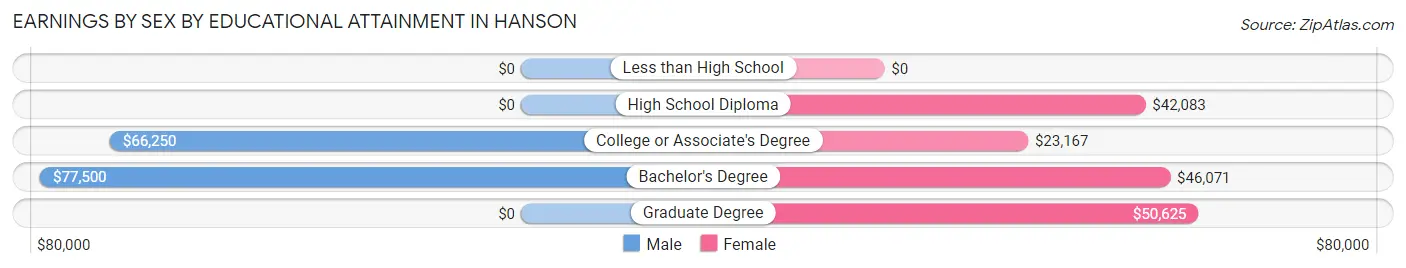
Earnings by Sex by Educational Attainment in Hanson
Average earnings in Hanson are $64,688 for men and $39,167 for women, a difference of 39.5%. Men with an educational attainment of bachelor's degree enjoy the highest average annual earnings of $77,500, while those with college or associate's degree education earn the least with $66,250. Women with an educational attainment of graduate degree earn the most with the average annual earnings of $50,625, while those with college or associate's degree education have the smallest earnings of $23,167.
| Educational Attainment | Male Income | Female Income |
| Less than High School | - | - |
| High School Diploma | - | - |
| College or Associate's Degree | $66,250 | $23,167 |
| Bachelor's Degree | $77,500 | $46,071 |
| Graduate Degree | - | - |
| Total | $64,688 | $39,167 |
Family Income in Hanson
Family Income Brackets in Hanson
According to the Hanson family income data, there are 98 families falling into the $75,000 to $99,999 income range, which is the most common income bracket and makes up 34.2% of all families. Conversely, the less than $10,000 income bracket is the least frequent group with only 2 families (0.7%) belonging to this category.
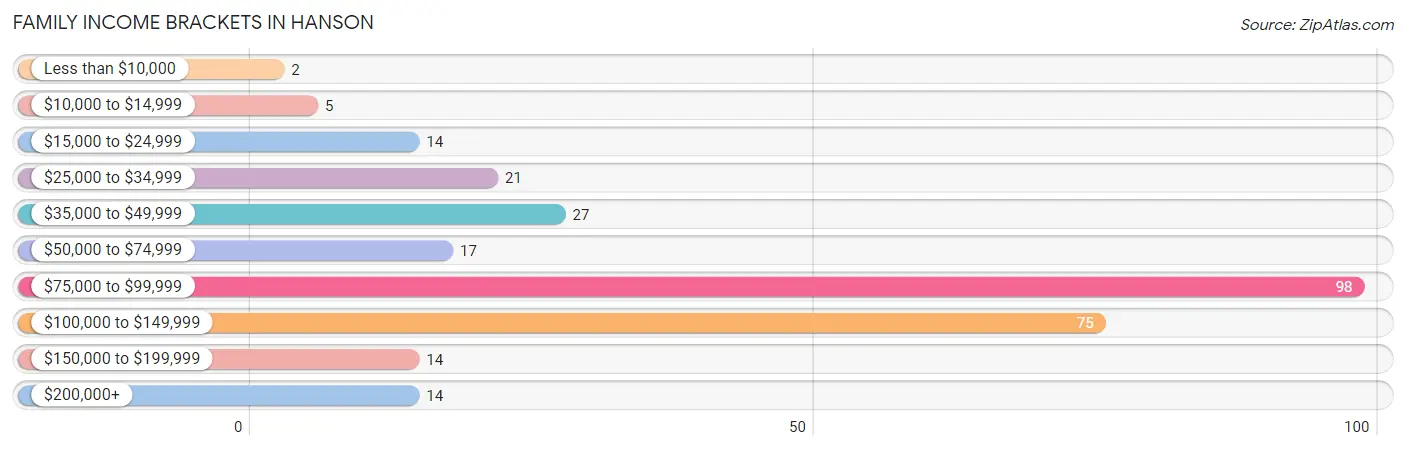
| Income Bracket | # Families | % Families |
| Less than $10,000 | 2 | 0.7% |
| $10,000 to $14,999 | 5 | 1.7% |
| $15,000 to $24,999 | 14 | 4.9% |
| $25,000 to $34,999 | 21 | 7.3% |
| $35,000 to $49,999 | 27 | 9.4% |
| $50,000 to $74,999 | 17 | 5.9% |
| $75,000 to $99,999 | 98 | 34.1% |
| $100,000 to $149,999 | 75 | 26.1% |
| $150,000 to $199,999 | 14 | 4.9% |
| $200,000+ | 14 | 4.9% |
Family Income by Famaliy Size in Hanson
4-person families (67 | 23.3%) account for the highest median family income in Hanson with $142,344 per family, while 2-person families (158 | 55.0%) have the highest median income of $44,250 per family member.
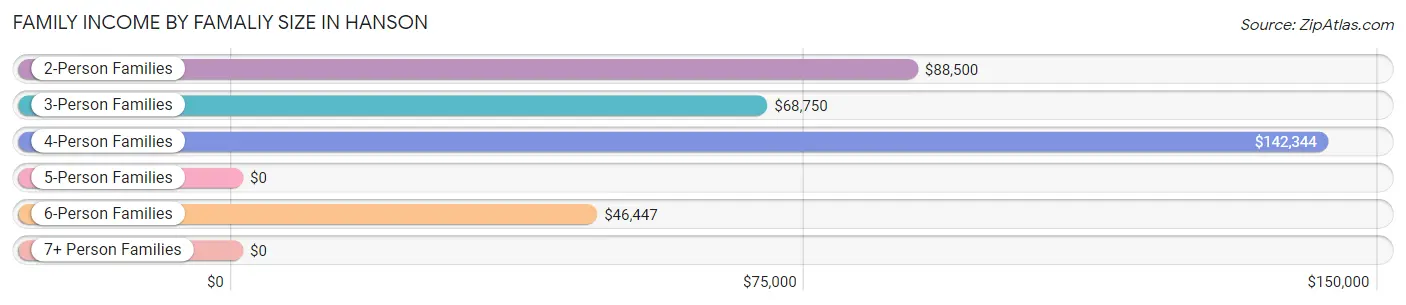
| Income Bracket | # Families | Median Income |
| 2-Person Families | 158 (55.0%) | $88,500 |
| 3-Person Families | 31 (10.8%) | $68,750 |
| 4-Person Families | 67 (23.3%) | $142,344 |
| 5-Person Families | 9 (3.1%) | $0 |
| 6-Person Families | 22 (7.7%) | $46,447 |
| 7+ Person Families | 0 (0.0%) | $0 |
| Total | 287 (100.0%) | $89,107 |
Family Income by Number of Earners in Hanson
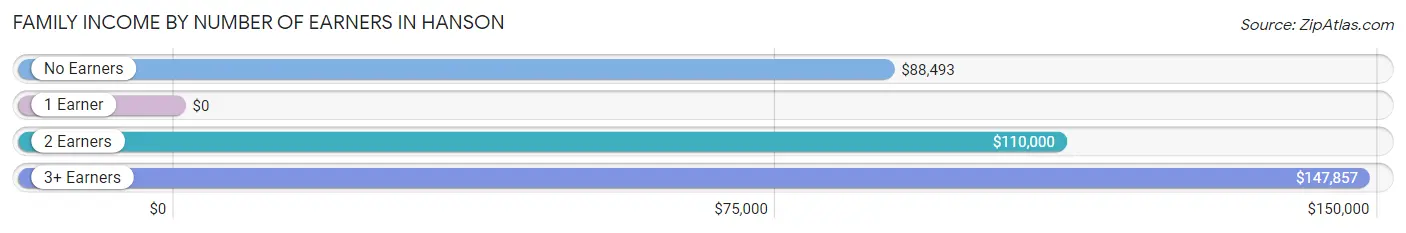
| Number of Earners | # Families | Median Income |
| No Earners | 98 (34.2%) | $88,493 |
| 1 Earner | 79 (27.5%) | $0 |
| 2 Earners | 90 (31.4%) | $110,000 |
| 3+ Earners | 20 (7.0%) | $147,857 |
| Total | 287 (100.0%) | $89,107 |
Household Income in Hanson
Household Income Brackets in Hanson
With 105 households falling in the category, the $75,000 to $99,999 income range is the most frequent in Hanson, accounting for 25.7% of all households. In contrast, only 7 households (1.7%) fall into the $10,000 to $14,999 income bracket, making it the least populous group.
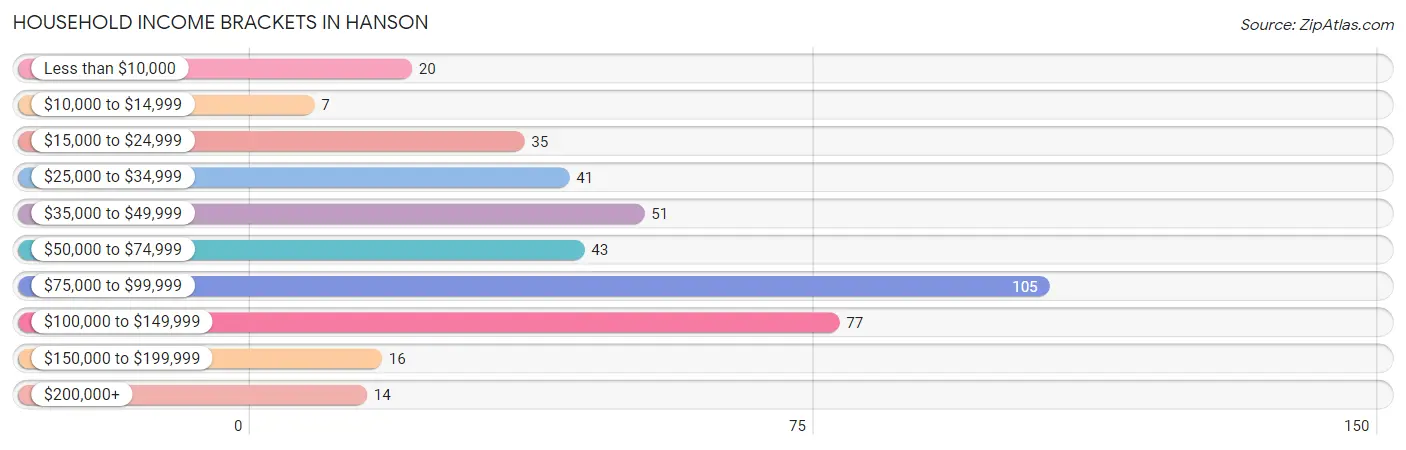
| Income Bracket | # Households | % Households |
| Less than $10,000 | 20 | 4.9% |
| $10,000 to $14,999 | 7 | 1.7% |
| $15,000 to $24,999 | 35 | 8.6% |
| $25,000 to $34,999 | 41 | 10.0% |
| $35,000 to $49,999 | 51 | 12.5% |
| $50,000 to $74,999 | 43 | 10.5% |
| $75,000 to $99,999 | 105 | 25.7% |
| $100,000 to $149,999 | 77 | 18.8% |
| $150,000 to $199,999 | 16 | 3.9% |
| $200,000+ | 14 | 3.4% |
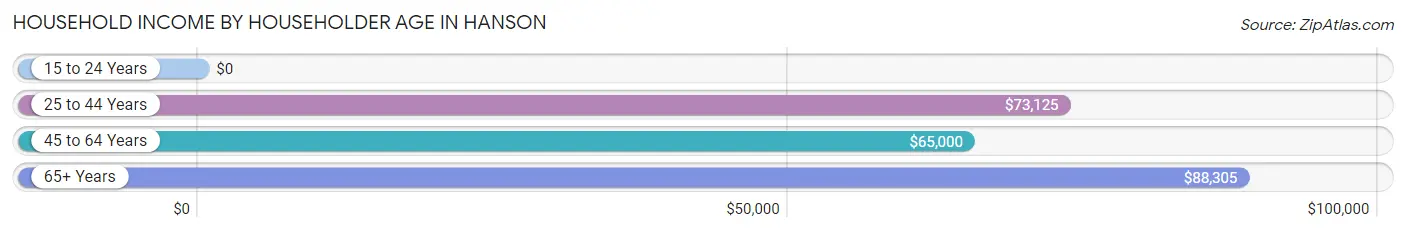
Household Income by Householder Age in Hanson
The median household income in Hanson is $84,063, with the highest median household income of $88,305 found in the 65+ years age bracket for the primary householder. A total of 175 households (42.8%) fall into this category. Meanwhile, the 15 to 24 years age bracket for the primary householder has the lowest median household income of $0, with 7 households (1.7%) in this group.
| Income Bracket | # Households | Median Income |
| 15 to 24 Years | 7 (1.7%) | $0 |
| 25 to 44 Years | 119 (29.1%) | $73,125 |
| 45 to 64 Years | 108 (26.4%) | $65,000 |
| 65+ Years | 175 (42.8%) | $88,305 |
| Total | 409 (100.0%) | $84,063 |
Poverty in Hanson
Income Below Poverty by Sex and Age in Hanson
With 6.8% poverty level for males and 11.7% for females among the residents of Hanson, 15 year old males and 55 to 64 year old females are the most vulnerable to poverty, with 11 males (78.6%) and 17 females (48.6%) in their respective age groups living below the poverty level.
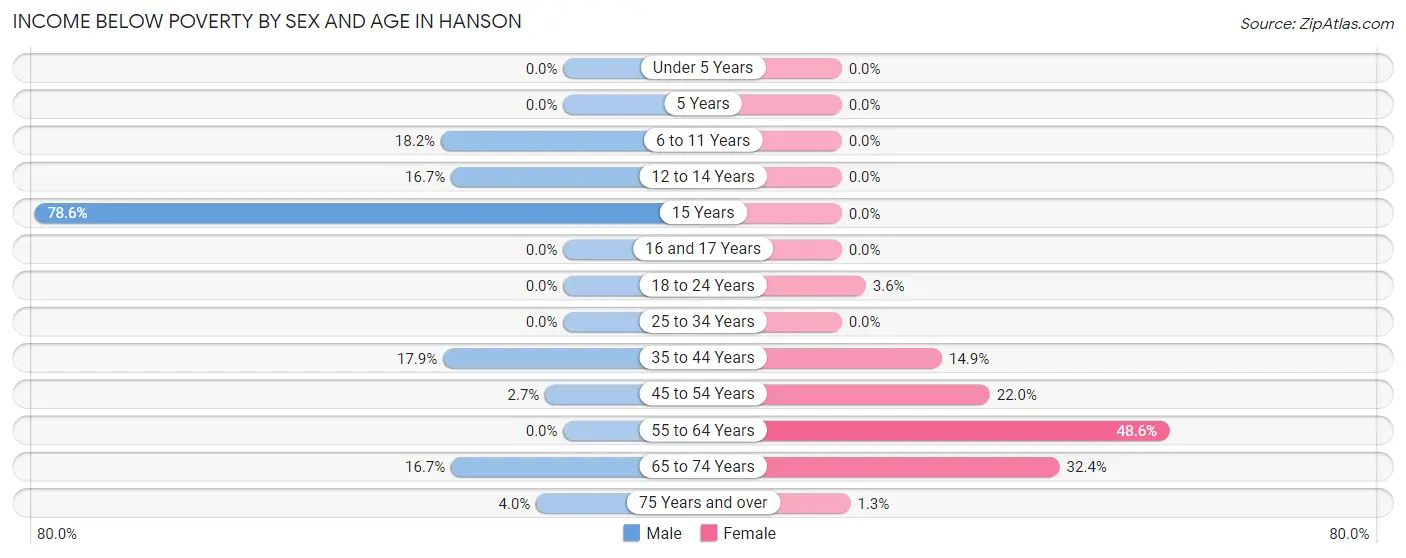
| Age Bracket | Male | Female |
| Under 5 Years | 0 (0.0%) | 0 (0.0%) |
| 5 Years | 0 (0.0%) | 0 (0.0%) |
| 6 to 11 Years | 2 (18.2%) | 0 (0.0%) |
| 12 to 14 Years | 2 (16.7%) | 0 (0.0%) |
| 15 Years | 11 (78.6%) | 0 (0.0%) |
| 16 and 17 Years | 0 (0.0%) | 0 (0.0%) |
| 18 to 24 Years | 0 (0.0%) | 2 (3.6%) |
| 25 to 34 Years | 0 (0.0%) | 0 (0.0%) |
| 35 to 44 Years | 5 (17.9%) | 7 (14.9%) |
| 45 to 54 Years | 1 (2.7%) | 20 (22.0%) |
| 55 to 64 Years | 0 (0.0%) | 17 (48.6%) |
| 65 to 74 Years | 2 (16.7%) | 11 (32.4%) |
| 75 Years and over | 5 (4.0%) | 1 (1.3%) |
| Total | 28 (6.8%) | 58 (11.7%) |
Income Above Poverty by Sex and Age in Hanson
According to the poverty statistics in Hanson, males aged under 5 years and females aged under 5 years are the age groups that are most secure financially, with 100.0% of males and 100.0% of females in these age groups living above the poverty line.
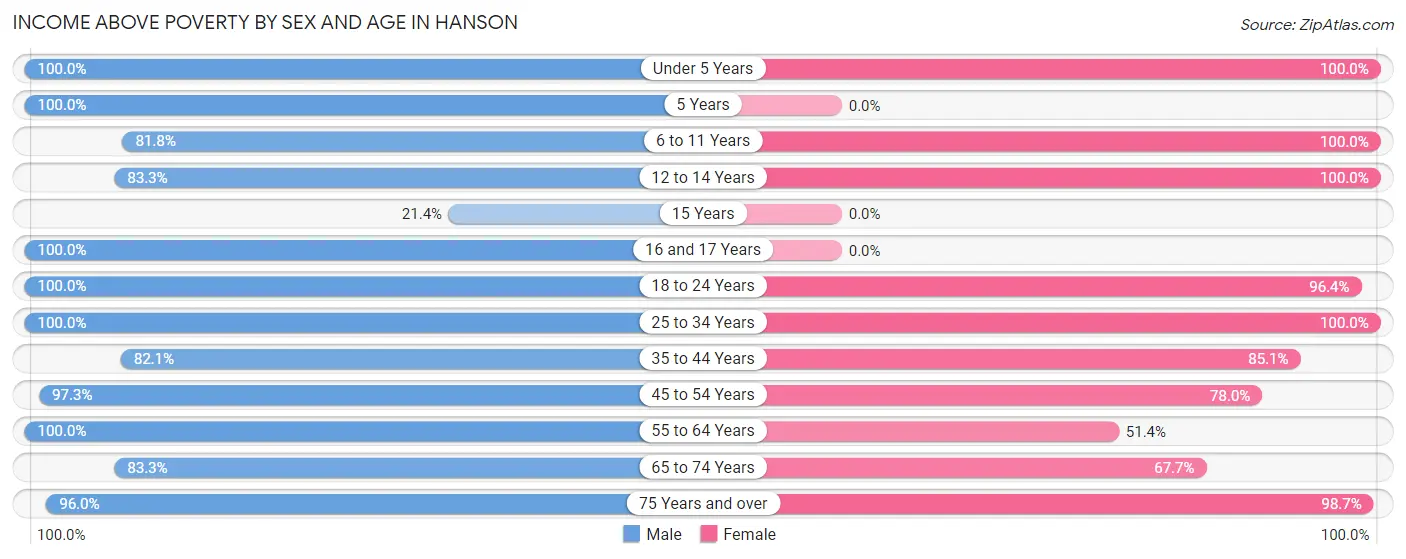
| Age Bracket | Male | Female |
| Under 5 Years | 12 (100.0%) | 30 (100.0%) |
| 5 Years | 30 (100.0%) | 0 (0.0%) |
| 6 to 11 Years | 9 (81.8%) | 13 (100.0%) |
| 12 to 14 Years | 10 (83.3%) | 40 (100.0%) |
| 15 Years | 3 (21.4%) | 0 (0.0%) |
| 16 and 17 Years | 17 (100.0%) | 0 (0.0%) |
| 18 to 24 Years | 21 (100.0%) | 54 (96.4%) |
| 25 to 34 Years | 71 (100.0%) | 72 (100.0%) |
| 35 to 44 Years | 23 (82.1%) | 40 (85.1%) |
| 45 to 54 Years | 36 (97.3%) | 71 (78.0%) |
| 55 to 64 Years | 25 (100.0%) | 18 (51.4%) |
| 65 to 74 Years | 10 (83.3%) | 23 (67.6%) |
| 75 Years and over | 119 (96.0%) | 76 (98.7%) |
| Total | 386 (93.2%) | 437 (88.3%) |
Income Below Poverty Among Married-Couple Families in Hanson
The poverty statistics for married-couple families in Hanson show that 3.0% or 7 of the total 235 families live below the poverty line. Families with 3 or 4 children have the highest poverty rate of 12.5%, comprising of 1 families. On the other hand, families with no children have the lowest poverty rate of 2.4%, which includes 4 families.
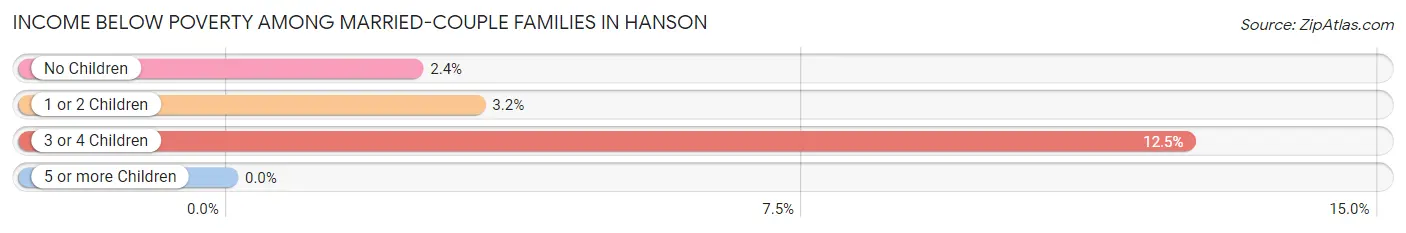
| Children | Above Poverty | Below Poverty |
| No Children | 161 (97.6%) | 4 (2.4%) |
| 1 or 2 Children | 60 (96.8%) | 2 (3.2%) |
| 3 or 4 Children | 7 (87.5%) | 1 (12.5%) |
| 5 or more Children | 0 (0.0%) | 0 (0.0%) |
| Total | 228 (97.0%) | 7 (3.0%) |
Income Below Poverty Among Single-Parent Households in Hanson
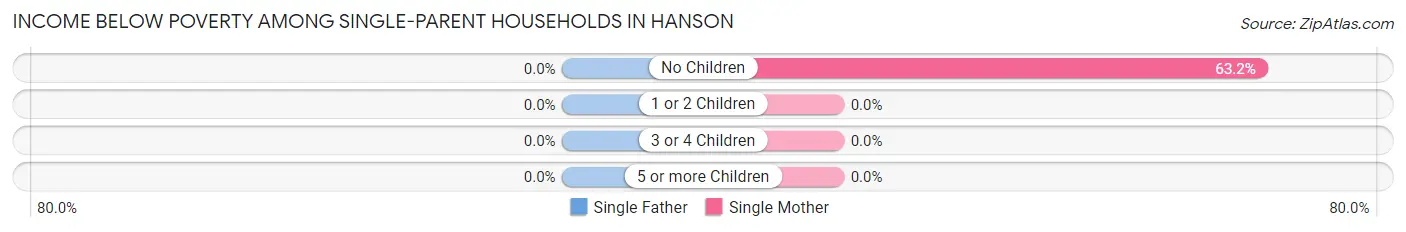
| Children | Single Father | Single Mother |
| No Children | 0 (0.0%) | 12 (63.2%) |
| 1 or 2 Children | 0 (0.0%) | 0 (0.0%) |
| 3 or 4 Children | 0 (0.0%) | 0 (0.0%) |
| 5 or more Children | 0 (0.0%) | 0 (0.0%) |
| Total | 0 (0.0%) | 12 (27.3%) |
Income Below Poverty Among Married-Couple vs Single-Parent Households in Hanson
The poverty data for Hanson shows that 7 of the married-couple family households (3.0%) and 12 of the single-parent households (23.1%) are living below the poverty level. Within the married-couple family households, those with 3 or 4 children have the highest poverty rate, with 1 households (12.5%) falling below the poverty line. Among the single-parent households, those with no children have the highest poverty rate, with 12 household (54.5%) living below poverty.
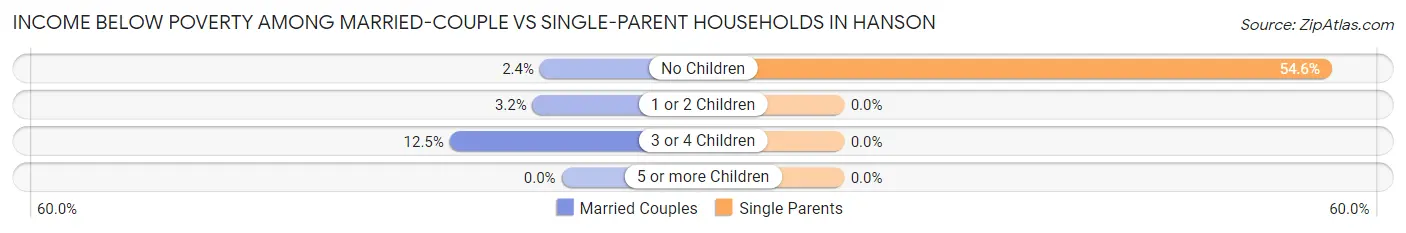
| Children | Married-Couple Families | Single-Parent Households |
| No Children | 4 (2.4%) | 12 (54.5%) |
| 1 or 2 Children | 2 (3.2%) | 0 (0.0%) |
| 3 or 4 Children | 1 (12.5%) | 0 (0.0%) |
| 5 or more Children | 0 (0.0%) | 0 (0.0%) |
| Total | 7 (3.0%) | 12 (23.1%) |
Race in Hanson
The most populous races in Hanson are White / Caucasian (973 | 95.9%), Hispanic or Latino (78 | 7.7%), and Two or more Races (24 | 2.4%).
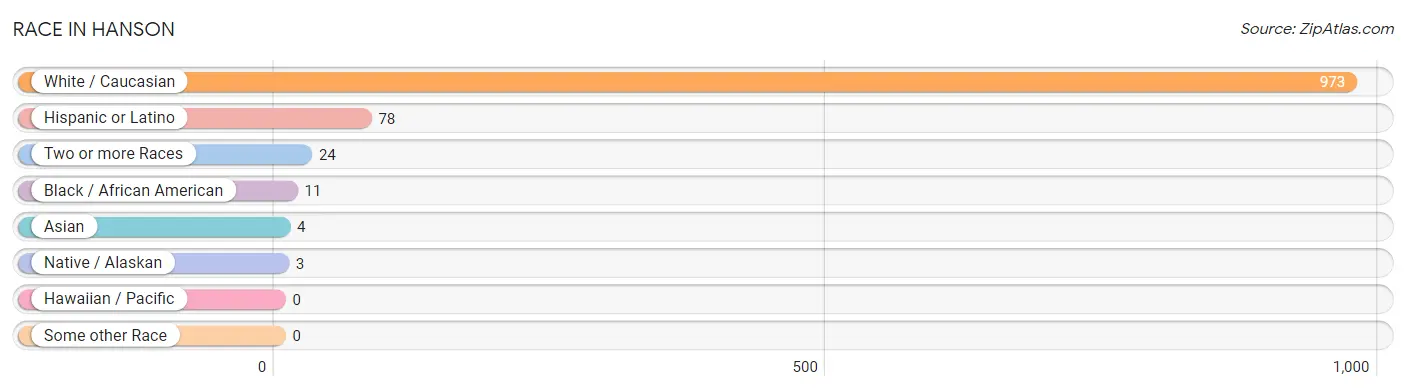
| Race | # Population | % Population |
| Asian | 4 | 0.4% |
| Black / African American | 11 | 1.1% |
| Hawaiian / Pacific | 0 | 0.0% |
| Hispanic or Latino | 78 | 7.7% |
| Native / Alaskan | 3 | 0.3% |
| White / Caucasian | 973 | 95.9% |
| Two or more Races | 24 | 2.4% |
| Some other Race | 0 | 0.0% |
| Total | 1,015 | 100.0% |
Ancestry in Hanson
The most populous ancestries reported in Hanson are English (106 | 10.4%), German (83 | 8.2%), American (79 | 7.8%), Irish (63 | 6.2%), and Mexican (50 | 4.9%), together accounting for 37.5% of all Hanson residents.
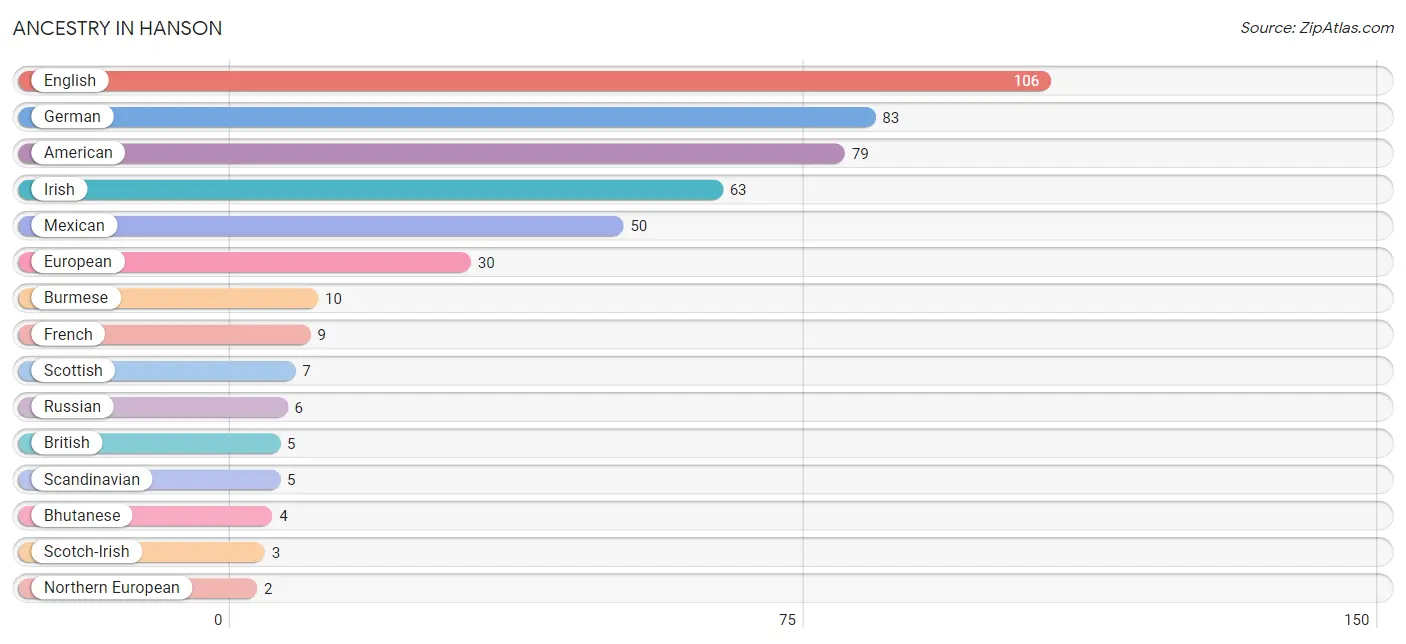
| Ancestry | # Population | % Population |
| American | 79 | 7.8% |
| Bhutanese | 4 | 0.4% |
| British | 5 | 0.5% |
| Burmese | 10 | 1.0% |
| English | 106 | 10.4% |
| European | 30 | 3.0% |
| French | 9 | 0.9% |
| German | 83 | 8.2% |
| Irish | 63 | 6.2% |
| Italian | 1 | 0.1% |
| Mexican | 50 | 4.9% |
| Northern European | 2 | 0.2% |
| Russian | 6 | 0.6% |
| Scandinavian | 5 | 0.5% |
| Scotch-Irish | 3 | 0.3% |
| Scottish | 7 | 0.7% | View All 16 Rows |
Immigrants in Hanson
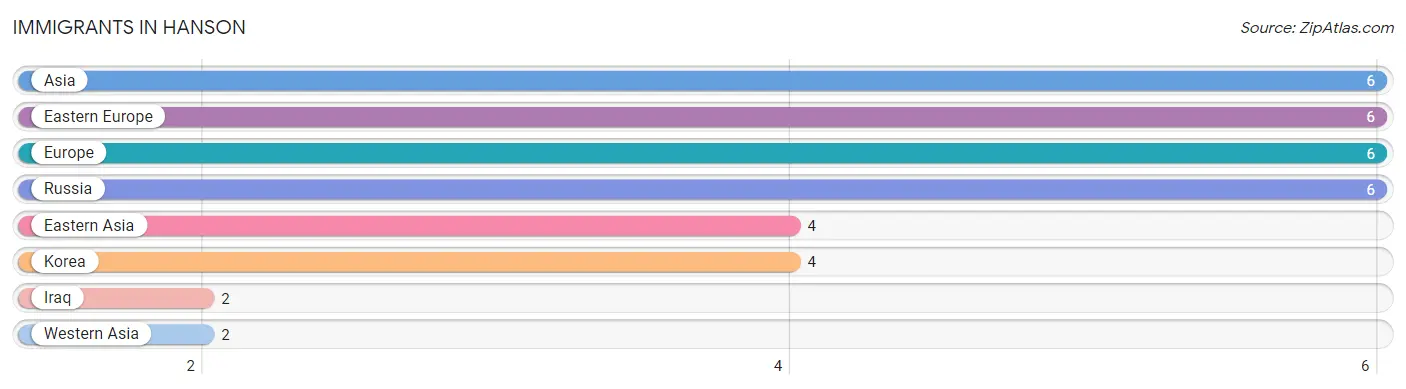
The most numerous immigrant groups reported in Hanson came from Asia (6 | 0.6%), Eastern Europe (6 | 0.6%), Europe (6 | 0.6%), Russia (6 | 0.6%), and Eastern Asia (4 | 0.4%), together accounting for 2.8% of all Hanson residents.
| Immigration Origin | # Population | % Population |
| Asia | 6 | 0.6% |
| Eastern Asia | 4 | 0.4% |
| Eastern Europe | 6 | 0.6% |
| Europe | 6 | 0.6% |
| Iraq | 2 | 0.2% |
| Korea | 4 | 0.4% |
| Russia | 6 | 0.6% |
| Western Asia | 2 | 0.2% | View All 8 Rows |
Sex and Age in Hanson
Sex and Age in Hanson
The most populous age groups in Hanson are 75 to 79 Years (96 | 19.0%) for men and 45 to 49 Years (65 | 12.8%) for women.
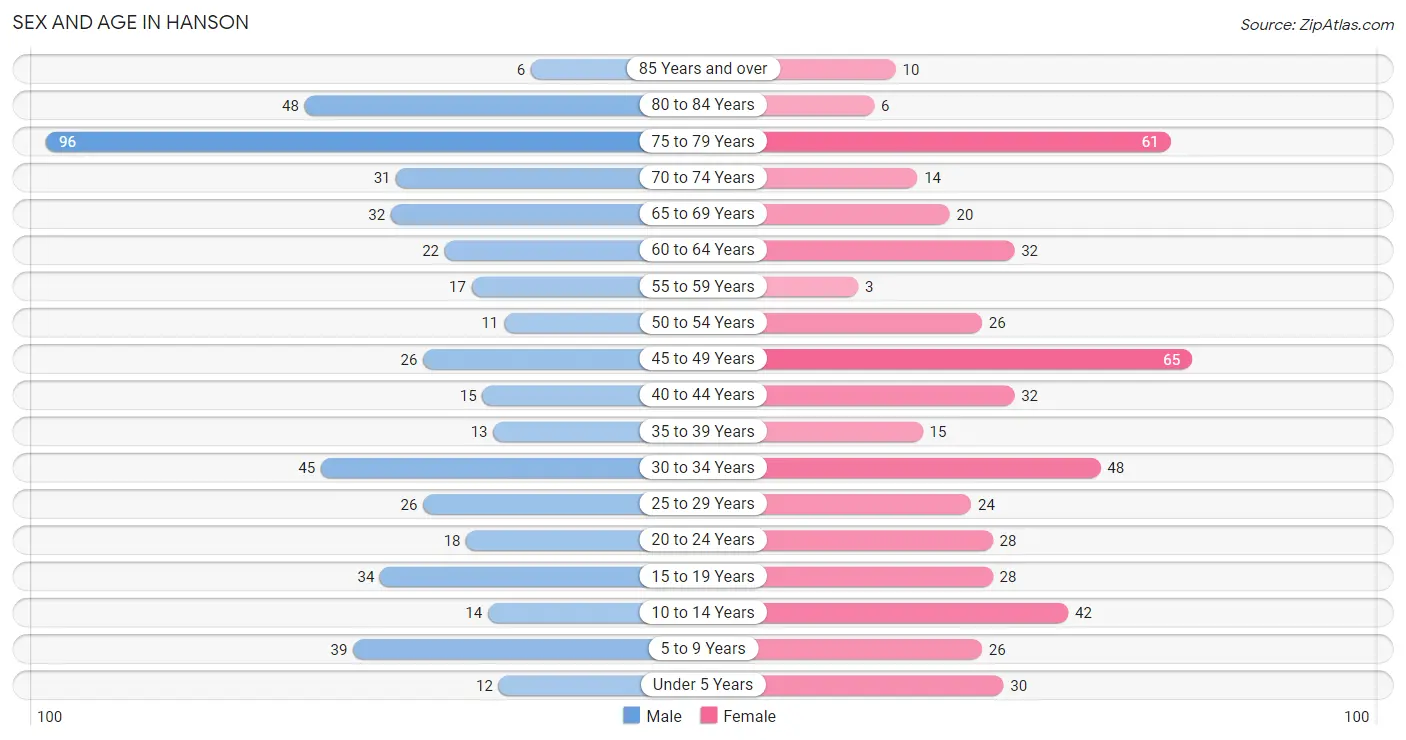
| Age Bracket | Male | Female |
| Under 5 Years | 12 (2.4%) | 30 (5.9%) |
| 5 to 9 Years | 39 (7.7%) | 26 (5.1%) |
| 10 to 14 Years | 14 (2.8%) | 42 (8.2%) |
| 15 to 19 Years | 34 (6.7%) | 28 (5.5%) |
| 20 to 24 Years | 18 (3.6%) | 28 (5.5%) |
| 25 to 29 Years | 26 (5.1%) | 24 (4.7%) |
| 30 to 34 Years | 45 (8.9%) | 48 (9.4%) |
| 35 to 39 Years | 13 (2.6%) | 15 (2.9%) |
| 40 to 44 Years | 15 (3.0%) | 32 (6.3%) |
| 45 to 49 Years | 26 (5.1%) | 65 (12.8%) |
| 50 to 54 Years | 11 (2.2%) | 26 (5.1%) |
| 55 to 59 Years | 17 (3.4%) | 3 (0.6%) |
| 60 to 64 Years | 22 (4.4%) | 32 (6.3%) |
| 65 to 69 Years | 32 (6.3%) | 20 (3.9%) |
| 70 to 74 Years | 31 (6.1%) | 14 (2.8%) |
| 75 to 79 Years | 96 (19.0%) | 61 (12.0%) |
| 80 to 84 Years | 48 (9.5%) | 6 (1.2%) |
| 85 Years and over | 6 (1.2%) | 10 (2.0%) |
| Total | 505 (100.0%) | 510 (100.0%) |
Families and Households in Hanson
Median Family Size in Hanson
The median family size in Hanson is 2.64 persons per family, with single male/father families (8 | 2.8%) accounting for the largest median family size of 3.13 persons per family. On the other hand, single female/mother families (44 | 15.3%) represent the smallest median family size with 2.41 persons per family.
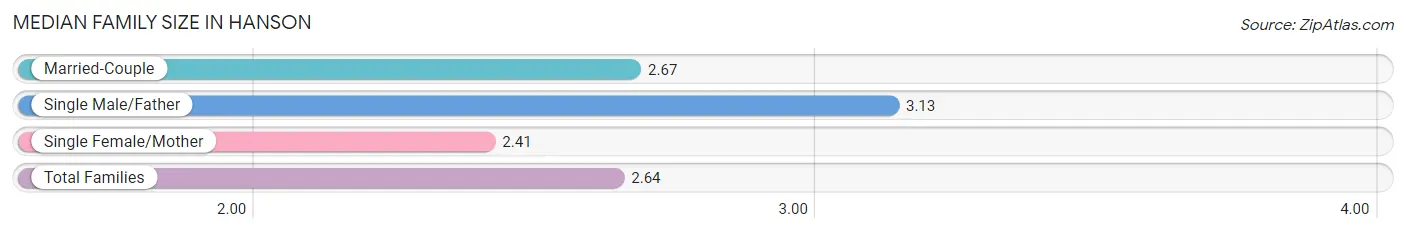
| Family Type | # Families | Family Size |
| Married-Couple | 235 (81.9%) | 2.67 |
| Single Male/Father | 8 (2.8%) | 3.13 |
| Single Female/Mother | 44 (15.3%) | 2.41 |
| Total Families | 287 (100.0%) | 2.64 |
Median Household Size in Hanson
The median household size in Hanson is 2.26 persons per household, with single male/father households (8 | 2.0%) accounting for the largest median household size of 3.63 persons per household. non-family households (122 | 29.8%) represent the smallest median household size with 1.33 persons per household.
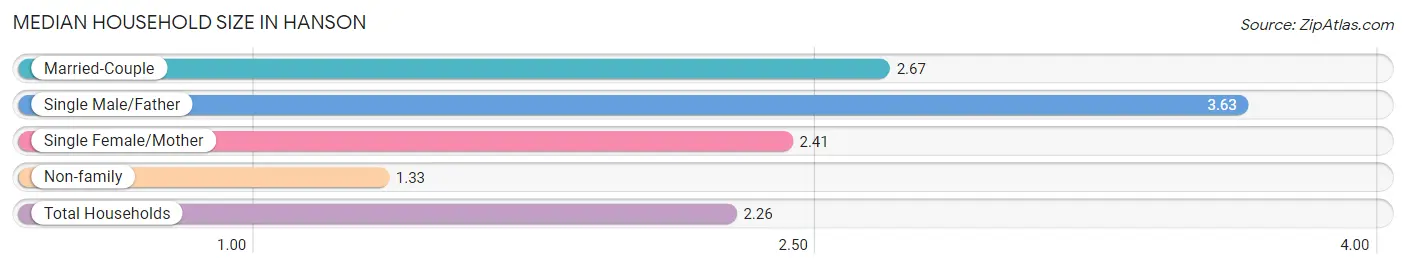
| Household Type | # Households | Household Size |
| Married-Couple | 235 (57.5%) | 2.67 |
| Single Male/Father | 8 (2.0%) | 3.63 |
| Single Female/Mother | 44 (10.8%) | 2.41 |
| Non-family | 122 (29.8%) | 1.33 |
| Total Households | 409 (100.0%) | 2.26 |
Household Size by Marriage Status in Hanson
Out of a total of 409 households in Hanson, 287 (70.2%) are family households, while 122 (29.8%) are nonfamily households. The most numerous type of family households are 2-person households, comprising 158, and the most common type of nonfamily households are 1-person households, comprising 105.
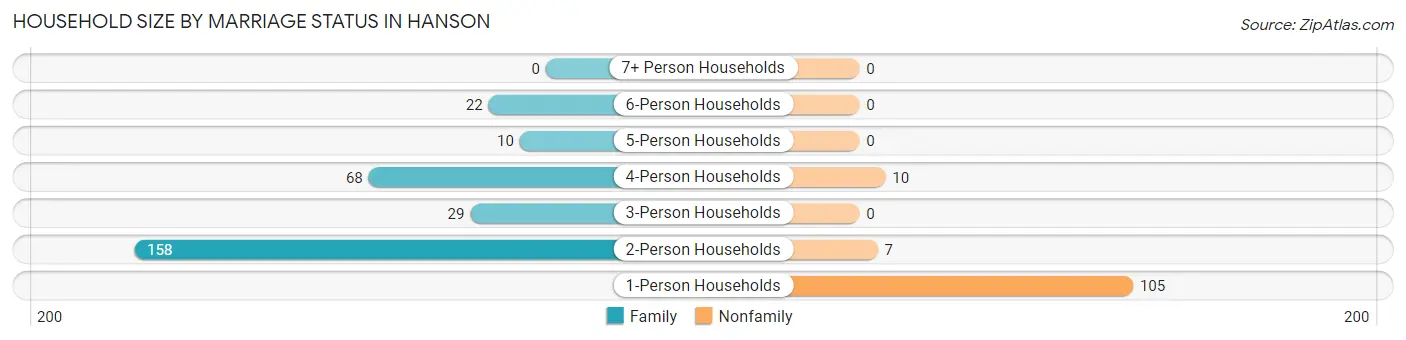
| Household Size | Family Households | Nonfamily Households |
| 1-Person Households | - | 105 (25.7%) |
| 2-Person Households | 158 (38.6%) | 7 (1.7%) |
| 3-Person Households | 29 (7.1%) | 0 (0.0%) |
| 4-Person Households | 68 (16.6%) | 10 (2.4%) |
| 5-Person Households | 10 (2.4%) | 0 (0.0%) |
| 6-Person Households | 22 (5.4%) | 0 (0.0%) |
| 7+ Person Households | 0 (0.0%) | 0 (0.0%) |
| Total | 287 (70.2%) | 122 (29.8%) |
Female Fertility in Hanson
Fertility by Age in Hanson
| Age Bracket | Women with Births | Births / 1,000 Women |
| 15 to 19 years | 0 (0.0%) | 0.0 |
| 20 to 34 years | 0 (0.0%) | 0.0 |
| 35 to 50 years | 0 (0.0%) | 0.0 |
| Total | 0 (0.0%) | 0.0 |
Fertility by Age by Marriage Status in Hanson
| Age Bracket | Married | Unmarried |
| 15 to 19 years | 0 (0.0%) | 0 (0.0%) |
| 20 to 34 years | 0 (0.0%) | 0 (0.0%) |
| 35 to 50 years | 0 (0.0%) | 0 (0.0%) |
| Total | 0 (0.0%) | 0 (0.0%) |
Fertility by Education in Hanson
| Educational Attainment | Women with Births | Births / 1,000 Women |
| Less than High School | 0 (0.0%) | 0.0 |
| High School Diploma | 0 (0.0%) | 0.0 |
| College or Associate's Degree | 0 (0.0%) | 0.0 |
| Bachelor's Degree | 0 (0.0%) | 0.0 |
| Graduate Degree | 0 (0.0%) | 0.0 |
| Total | 0 (0.0%) | 0.0 |
Fertility by Education by Marriage Status in Hanson
| Educational Attainment | Married | Unmarried |
| Less than High School | 0 (0.0%) | 0 (0.0%) |
| High School Diploma | 0 (0.0%) | 0 (0.0%) |
| College or Associate's Degree | 0 (0.0%) | 0 (0.0%) |
| Bachelor's Degree | 0 (0.0%) | 0 (0.0%) |
| Graduate Degree | 0 (0.0%) | 0 (0.0%) |
| Total | 0 (0.0%) | 0 (0.0%) |
Employment Characteristics in Hanson
Employment by Class of Employer in Hanson
Among the 361 employed individuals in Hanson, private company employees (237 | 65.6%), not-for-profit organizations (51 | 14.1%), and self-employed (not incorporated) (28 | 7.8%) make up the most common classes of employment.
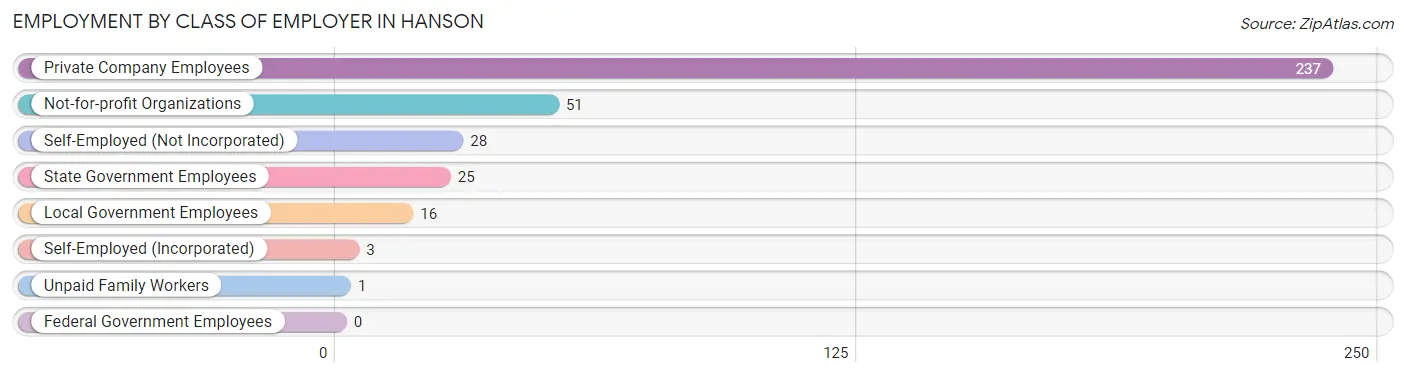
| Employer Class | # Employees | % Employees |
| Private Company Employees | 237 | 65.6% |
| Self-Employed (Incorporated) | 3 | 0.8% |
| Self-Employed (Not Incorporated) | 28 | 7.8% |
| Not-for-profit Organizations | 51 | 14.1% |
| Local Government Employees | 16 | 4.4% |
| State Government Employees | 25 | 6.9% |
| Federal Government Employees | 0 | 0.0% |
| Unpaid Family Workers | 1 | 0.3% |
| Total | 361 | 100.0% |
Employment Status by Age in Hanson
According to the labor force statistics for Hanson, out of the total population over 16 years of age (838), 45.1% or 378 individuals are in the labor force, with 4.0% or 15 of them unemployed. The age group with the highest labor force participation rate is 25 to 29 years, with 100.0% or 50 individuals in the labor force. Within the labor force, the 60 to 64 years age range has the highest percentage of unemployed individuals, with 18.8% or 3 of them being unemployed.
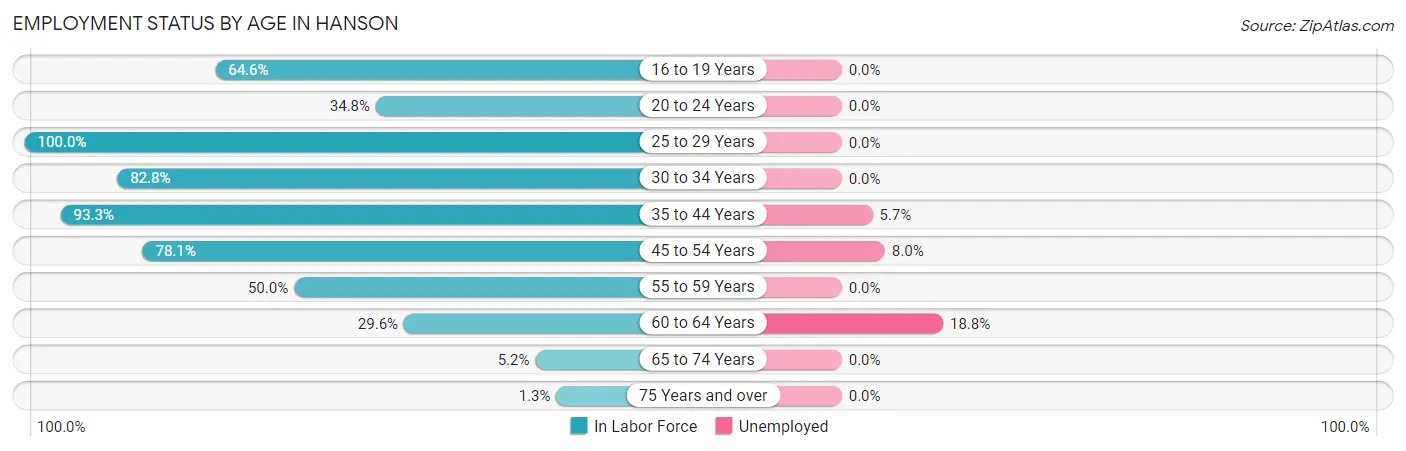
| Age Bracket | In Labor Force | Unemployed |
| 16 to 19 Years | 31 (64.6%) | 0 (0.0%) |
| 20 to 24 Years | 16 (34.8%) | 0 (0.0%) |
| 25 to 29 Years | 50 (100.0%) | 0 (0.0%) |
| 30 to 34 Years | 77 (82.8%) | 0 (0.0%) |
| 35 to 44 Years | 70 (93.3%) | 4 (5.7%) |
| 45 to 54 Years | 100 (78.1%) | 8 (8.0%) |
| 55 to 59 Years | 10 (50.0%) | 0 (0.0%) |
| 60 to 64 Years | 16 (29.6%) | 3 (18.8%) |
| 65 to 74 Years | 5 (5.2%) | 0 (0.0%) |
| 75 Years and over | 3 (1.3%) | 0 (0.0%) |
| Total | 378 (45.1%) | 15 (4.0%) |
Employment Status by Educational Attainment in Hanson
According to labor force statistics for Hanson, 76.9% of individuals (323) out of the total population between 25 and 64 years of age (420) are in the labor force, with 4.6% or 15 of them being unemployed. The group with the highest labor force participation rate are those with the educational attainment of bachelor's degree or higher, with 98.5% or 130 individuals in the labor force. Within the labor force, individuals with less than high school education have the highest percentage of unemployment, with 17.6% or 3 of them being unemployed.
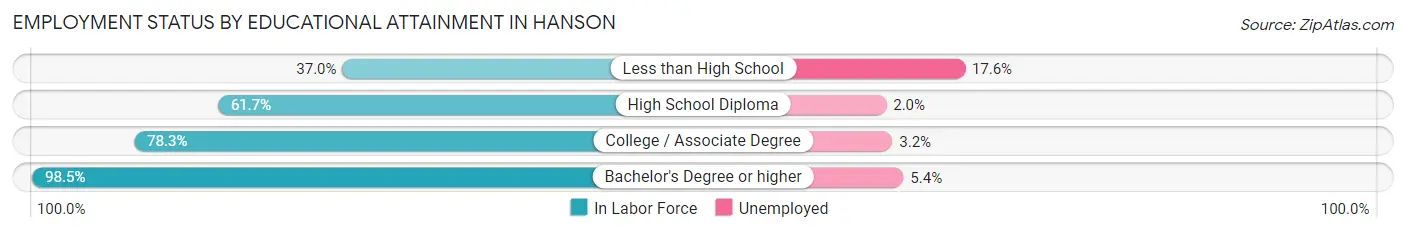
| Educational Attainment | In Labor Force | Unemployed |
| Less than High School | 17 (37.0%) | 8 (17.6%) |
| High School Diploma | 50 (61.7%) | 2 (2.0%) |
| College / Associate Degree | 126 (78.3%) | 5 (3.2%) |
| Bachelor's Degree or higher | 130 (98.5%) | 7 (5.4%) |
| Total | 323 (76.9%) | 19 (4.6%) |
Employment Occupations by Sex in Hanson
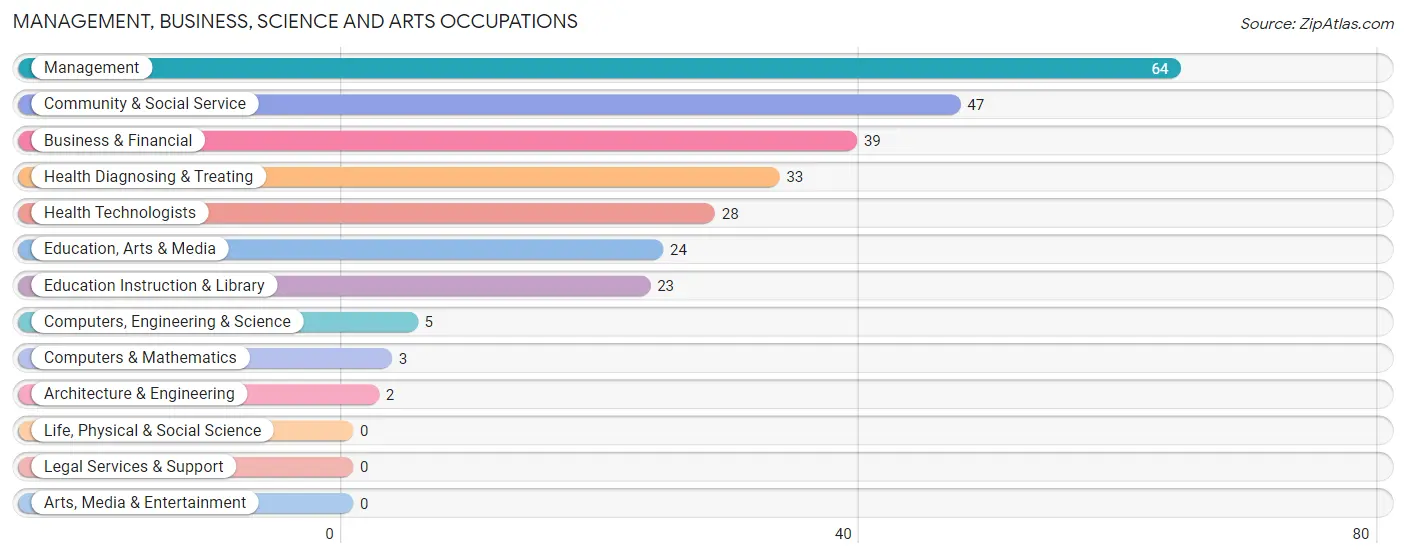
Management, Business, Science and Arts Occupations
The most common Management, Business, Science and Arts occupations in Hanson are Management (64 | 17.6%), Community & Social Service (47 | 13.0%), Business & Financial (39 | 10.7%), Health Diagnosing & Treating (33 | 9.1%), and Health Technologists (28 | 7.7%).
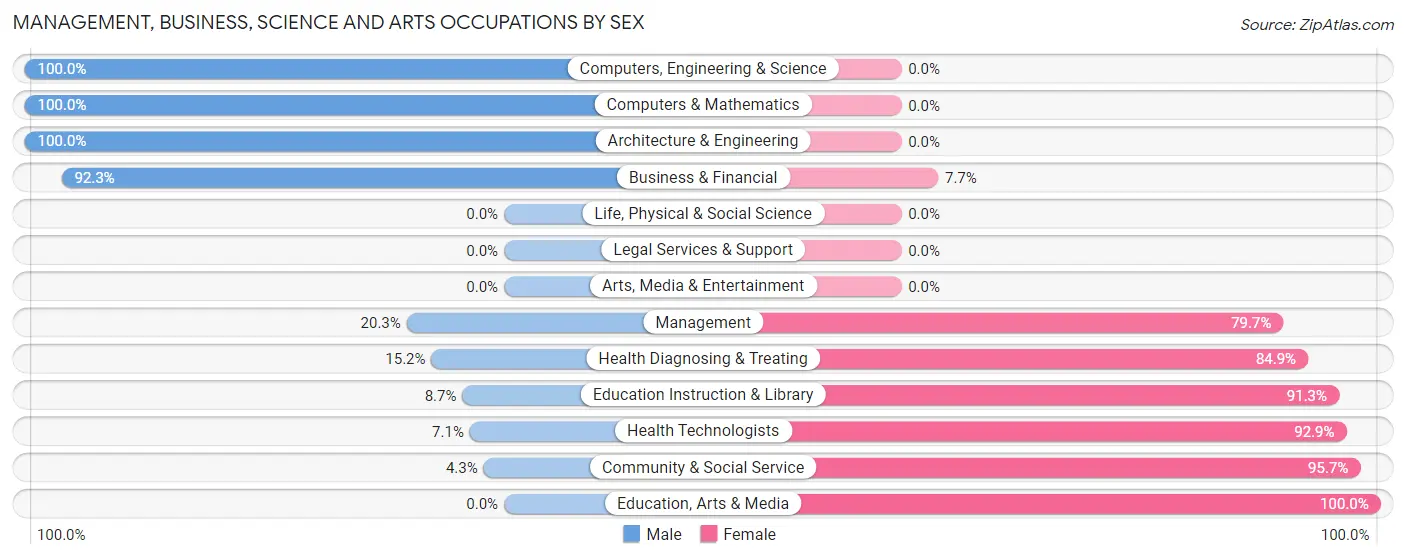
Management, Business, Science and Arts Occupations by Sex
Within the Management, Business, Science and Arts occupations in Hanson, the most male-oriented occupations are Computers, Engineering & Science (100.0%), Computers & Mathematics (100.0%), and Architecture & Engineering (100.0%), while the most female-oriented occupations are Education, Arts & Media (100.0%), Community & Social Service (95.7%), and Health Technologists (92.9%).
| Occupation | Male | Female |
| Management | 13 (20.3%) | 51 (79.7%) |
| Business & Financial | 36 (92.3%) | 3 (7.7%) |
| Computers, Engineering & Science | 5 (100.0%) | 0 (0.0%) |
| Computers & Mathematics | 3 (100.0%) | 0 (0.0%) |
| Architecture & Engineering | 2 (100.0%) | 0 (0.0%) |
| Life, Physical & Social Science | 0 (0.0%) | 0 (0.0%) |
| Community & Social Service | 2 (4.3%) | 45 (95.7%) |
| Education, Arts & Media | 0 (0.0%) | 24 (100.0%) |
| Legal Services & Support | 0 (0.0%) | 0 (0.0%) |
| Education Instruction & Library | 2 (8.7%) | 21 (91.3%) |
| Arts, Media & Entertainment | 0 (0.0%) | 0 (0.0%) |
| Health Diagnosing & Treating | 5 (15.1%) | 28 (84.9%) |
| Health Technologists | 2 (7.1%) | 26 (92.9%) |
| Total (Category) | 61 (32.5%) | 127 (67.5%) |
| Total (Overall) | 139 (38.3%) | 224 (61.7%) |
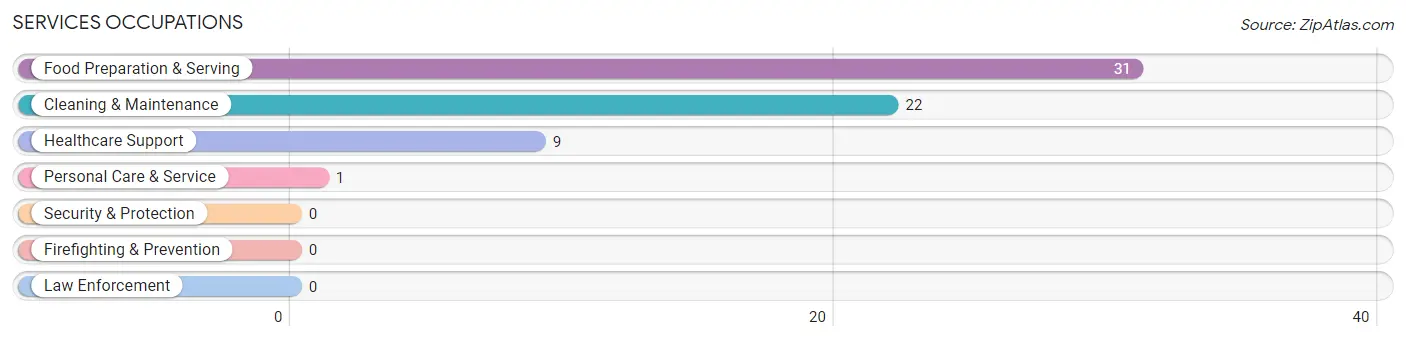
Services Occupations
The most common Services occupations in Hanson are Food Preparation & Serving (31 | 8.5%), Cleaning & Maintenance (22 | 6.1%), Healthcare Support (9 | 2.5%), and Personal Care & Service (1 | 0.3%).
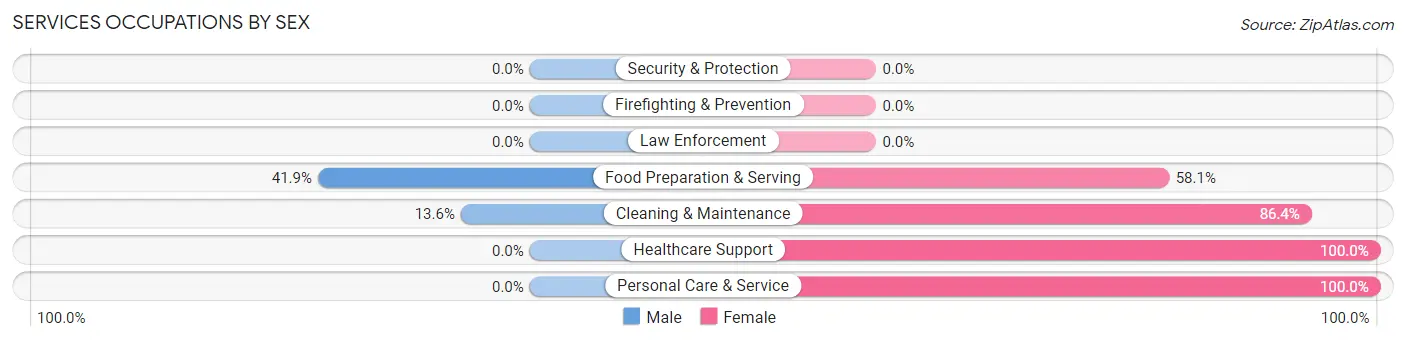
Services Occupations by Sex
Within the Services occupations in Hanson, the most male-oriented occupations are Food Preparation & Serving (41.9%), and Cleaning & Maintenance (13.6%), while the most female-oriented occupations are Healthcare Support (100.0%), Personal Care & Service (100.0%), and Cleaning & Maintenance (86.4%).
| Occupation | Male | Female |
| Healthcare Support | 0 (0.0%) | 9 (100.0%) |
| Security & Protection | 0 (0.0%) | 0 (0.0%) |
| Firefighting & Prevention | 0 (0.0%) | 0 (0.0%) |
| Law Enforcement | 0 (0.0%) | 0 (0.0%) |
| Food Preparation & Serving | 13 (41.9%) | 18 (58.1%) |
| Cleaning & Maintenance | 3 (13.6%) | 19 (86.4%) |
| Personal Care & Service | 0 (0.0%) | 1 (100.0%) |
| Total (Category) | 16 (25.4%) | 47 (74.6%) |
| Total (Overall) | 139 (38.3%) | 224 (61.7%) |
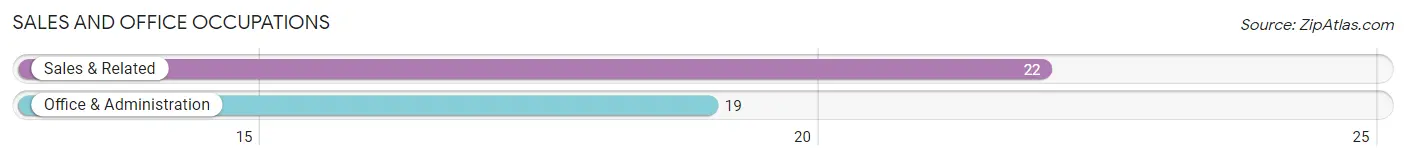
Sales and Office Occupations
The most common Sales and Office occupations in Hanson are Sales & Related (22 | 6.1%), and Office & Administration (19 | 5.2%).
Sales and Office Occupations by Sex
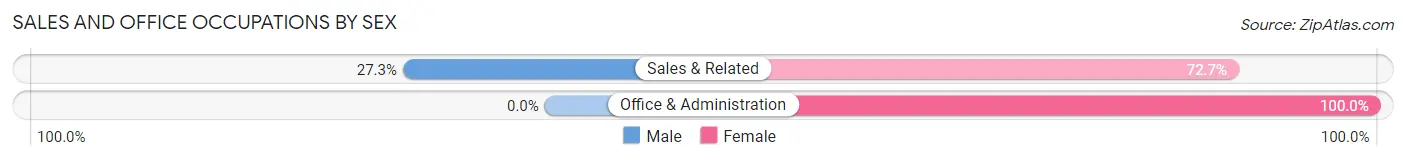
| Occupation | Male | Female |
| Sales & Related | 6 (27.3%) | 16 (72.7%) |
| Office & Administration | 0 (0.0%) | 19 (100.0%) |
| Total (Category) | 6 (14.6%) | 35 (85.4%) |
| Total (Overall) | 139 (38.3%) | 224 (61.7%) |
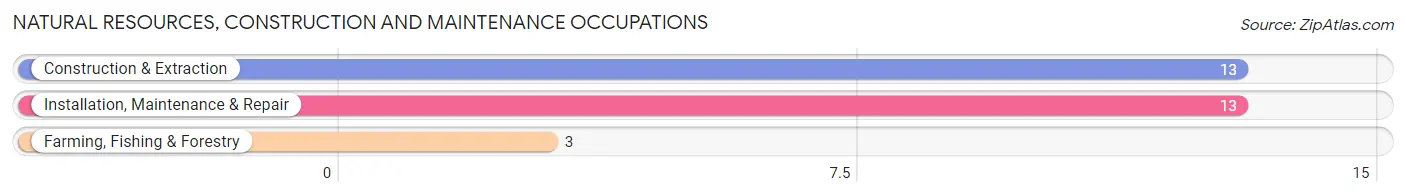
Natural Resources, Construction and Maintenance Occupations
The most common Natural Resources, Construction and Maintenance occupations in Hanson are Construction & Extraction (13 | 3.6%), Installation, Maintenance & Repair (13 | 3.6%), and Farming, Fishing & Forestry (3 | 0.8%).
Natural Resources, Construction and Maintenance Occupations by Sex
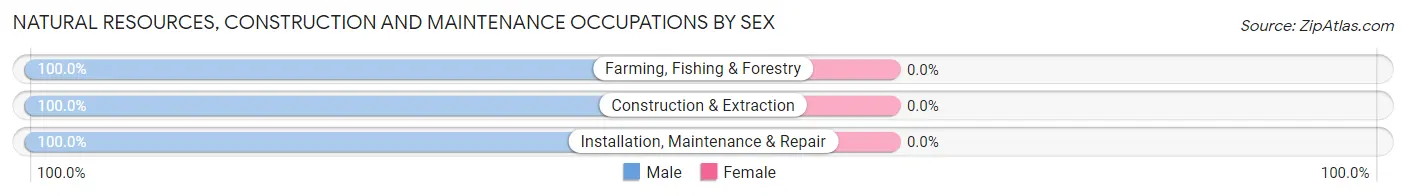
| Occupation | Male | Female |
| Farming, Fishing & Forestry | 3 (100.0%) | 0 (0.0%) |
| Construction & Extraction | 13 (100.0%) | 0 (0.0%) |
| Installation, Maintenance & Repair | 13 (100.0%) | 0 (0.0%) |
| Total (Category) | 29 (100.0%) | 0 (0.0%) |
| Total (Overall) | 139 (38.3%) | 224 (61.7%) |
Production, Transportation and Moving Occupations
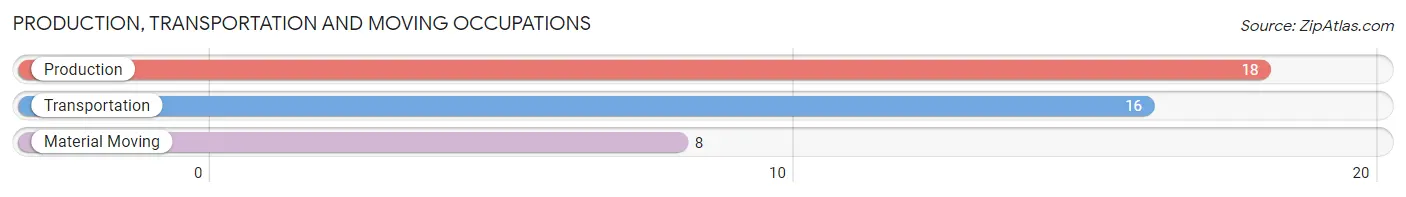
The most common Production, Transportation and Moving occupations in Hanson are Production (18 | 5.0%), Transportation (16 | 4.4%), and Material Moving (8 | 2.2%).
Production, Transportation and Moving Occupations by Sex
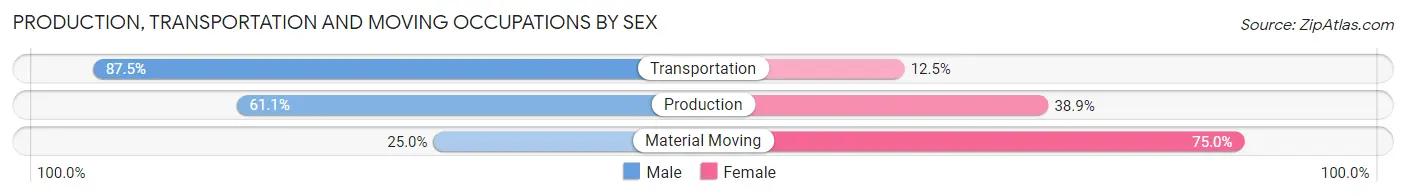
| Occupation | Male | Female |
| Production | 11 (61.1%) | 7 (38.9%) |
| Transportation | 14 (87.5%) | 2 (12.5%) |
| Material Moving | 2 (25.0%) | 6 (75.0%) |
| Total (Category) | 27 (64.3%) | 15 (35.7%) |
| Total (Overall) | 139 (38.3%) | 224 (61.7%) |
Employment Industries by Sex in Hanson
Employment Industries in Hanson
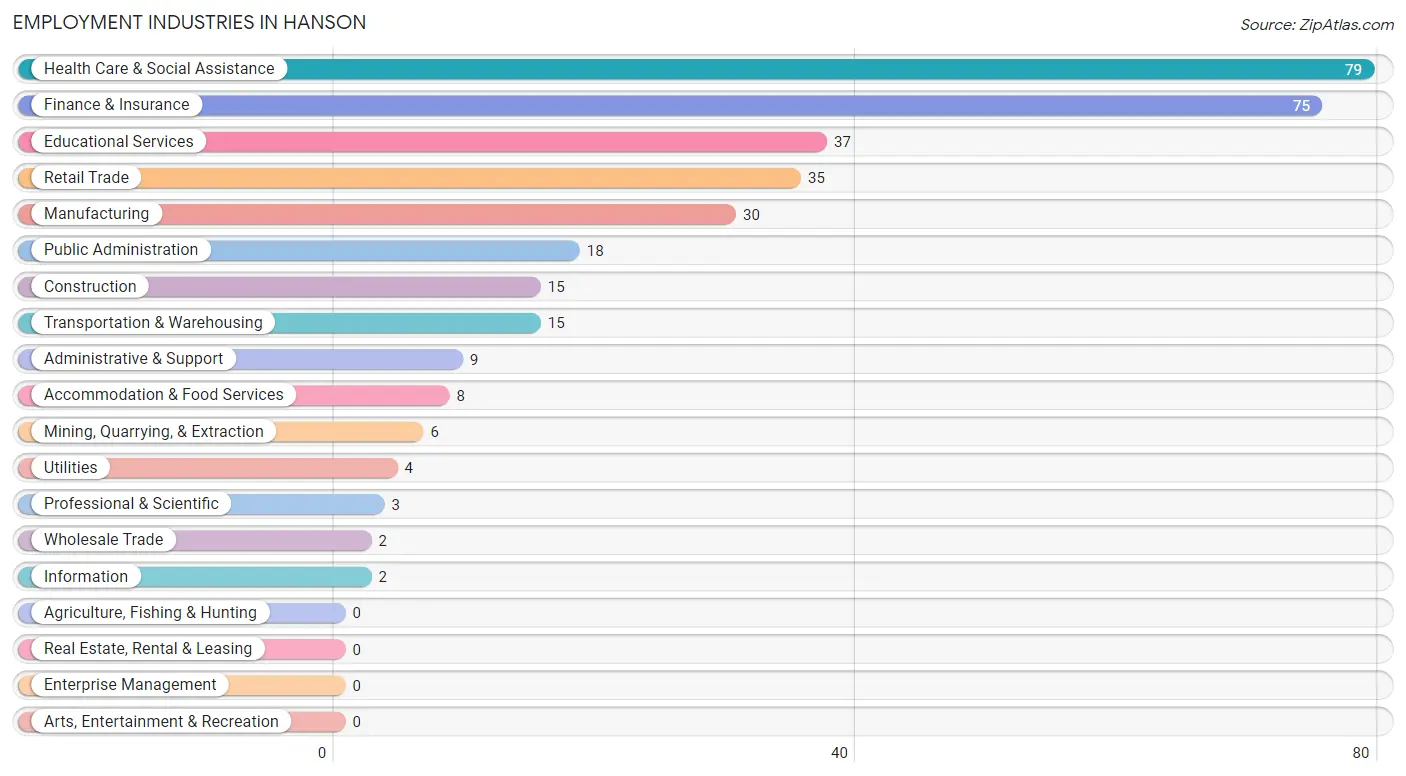
The major employment industries in Hanson include Health Care & Social Assistance (79 | 21.8%), Finance & Insurance (75 | 20.7%), Educational Services (37 | 10.2%), Retail Trade (35 | 9.6%), and Manufacturing (30 | 8.3%).
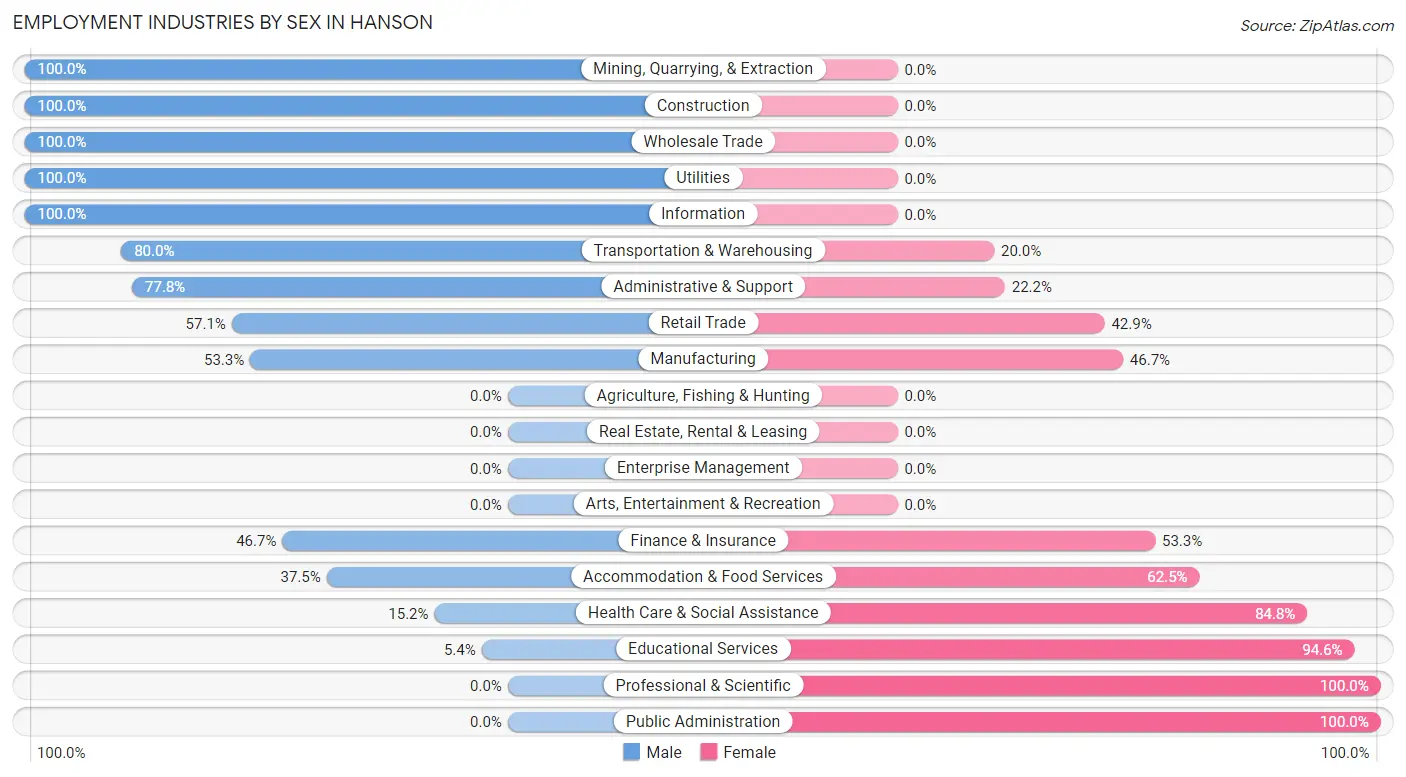
Employment Industries by Sex in Hanson
The Hanson industries that see more men than women are Mining, Quarrying, & Extraction (100.0%), Construction (100.0%), and Wholesale Trade (100.0%), whereas the industries that tend to have a higher number of women are Professional & Scientific (100.0%), Public Administration (100.0%), and Educational Services (94.6%).
| Industry | Male | Female |
| Agriculture, Fishing & Hunting | 0 (0.0%) | 0 (0.0%) |
| Mining, Quarrying, & Extraction | 6 (100.0%) | 0 (0.0%) |
| Construction | 15 (100.0%) | 0 (0.0%) |
| Manufacturing | 16 (53.3%) | 14 (46.7%) |
| Wholesale Trade | 2 (100.0%) | 0 (0.0%) |
| Retail Trade | 20 (57.1%) | 15 (42.9%) |
| Transportation & Warehousing | 12 (80.0%) | 3 (20.0%) |
| Utilities | 4 (100.0%) | 0 (0.0%) |
| Information | 2 (100.0%) | 0 (0.0%) |
| Finance & Insurance | 35 (46.7%) | 40 (53.3%) |
| Real Estate, Rental & Leasing | 0 (0.0%) | 0 (0.0%) |
| Professional & Scientific | 0 (0.0%) | 3 (100.0%) |
| Enterprise Management | 0 (0.0%) | 0 (0.0%) |
| Administrative & Support | 7 (77.8%) | 2 (22.2%) |
| Educational Services | 2 (5.4%) | 35 (94.6%) |
| Health Care & Social Assistance | 12 (15.2%) | 67 (84.8%) |
| Arts, Entertainment & Recreation | 0 (0.0%) | 0 (0.0%) |
| Accommodation & Food Services | 3 (37.5%) | 5 (62.5%) |
| Public Administration | 0 (0.0%) | 18 (100.0%) |
| Total | 139 (38.3%) | 224 (61.7%) |
Education in Hanson
School Enrollment in Hanson
The most common levels of schooling among the 209 students in Hanson are nursery / preschool (58 | 27.8%), middle school (49 | 23.4%), and college / undergraduate (47 | 22.5%).
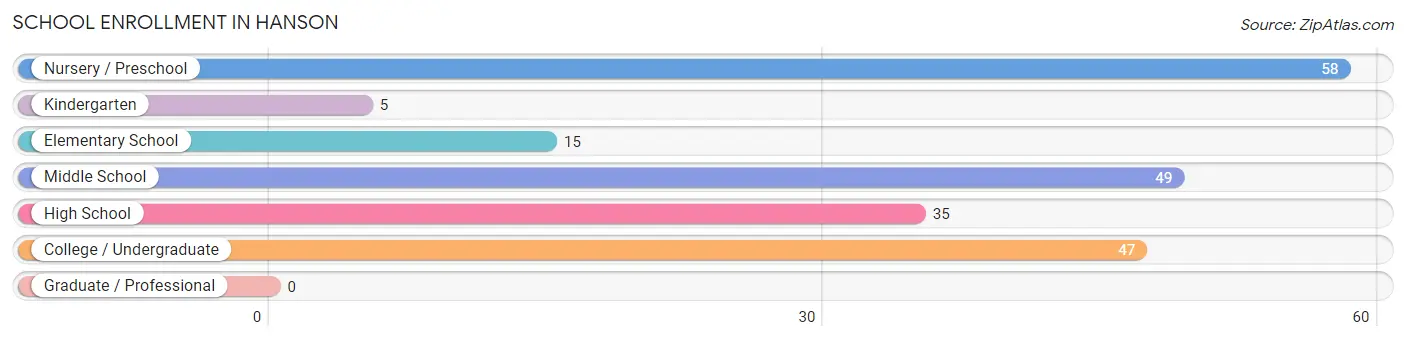
| School Level | # Students | % Students |
| Nursery / Preschool | 58 | 27.8% |
| Kindergarten | 5 | 2.4% |
| Elementary School | 15 | 7.2% |
| Middle School | 49 | 23.4% |
| High School | 35 | 16.8% |
| College / Undergraduate | 47 | 22.5% |
| Graduate / Professional | 0 | 0.0% |
| Total | 209 | 100.0% |
School Enrollment by Age by Funding Source in Hanson
Out of a total of 209 students who are enrolled in schools in Hanson, 61 (29.2%) attend a private institution, while the remaining 148 (70.8%) are enrolled in public schools. The age group of 3 to 4 year olds has the highest likelihood of being enrolled in private schools, with 28 (100.0% in the age bracket) enrolled. Conversely, the age group of 15 to 17 year olds has the lowest likelihood of being enrolled in a private school, with 31 (100.0% in the age bracket) attending a public institution.
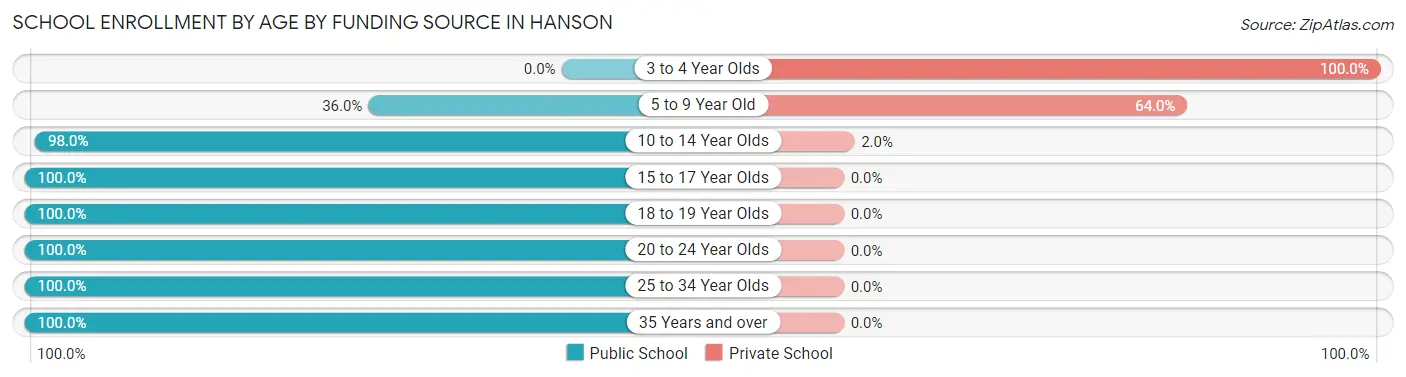
| Age Bracket | Public School | Private School |
| 3 to 4 Year Olds | 0 (0.0%) | 28 (100.0%) |
| 5 to 9 Year Old | 18 (36.0%) | 32 (64.0%) |
| 10 to 14 Year Olds | 50 (98.0%) | 1 (2.0%) |
| 15 to 17 Year Olds | 31 (100.0%) | 0 (0.0%) |
| 18 to 19 Year Olds | 31 (100.0%) | 0 (0.0%) |
| 20 to 24 Year Olds | 7 (100.0%) | 0 (0.0%) |
| 25 to 34 Year Olds | 1 (100.0%) | 0 (0.0%) |
| 35 Years and over | 10 (100.0%) | 0 (0.0%) |
| Total | 148 (70.8%) | 61 (29.2%) |
Educational Attainment by Field of Study in Hanson
Business (51 | 31.7%), arts & humanities (29 | 18.0%), science & technology (25 | 15.5%), visual & performing arts (19 | 11.8%), and education (14 | 8.7%) are the most common fields of study among 161 individuals in Hanson who have obtained a bachelor's degree or higher.
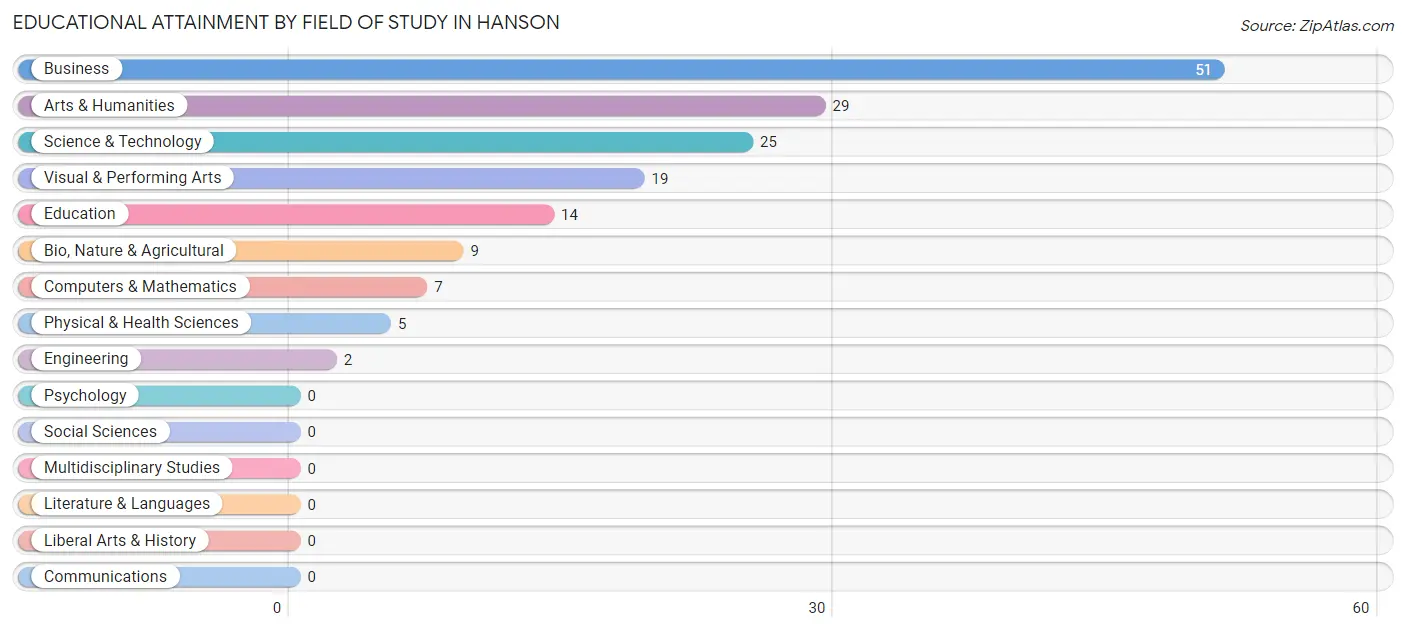
| Field of Study | # Graduates | % Graduates |
| Computers & Mathematics | 7 | 4.3% |
| Bio, Nature & Agricultural | 9 | 5.6% |
| Physical & Health Sciences | 5 | 3.1% |
| Psychology | 0 | 0.0% |
| Social Sciences | 0 | 0.0% |
| Engineering | 2 | 1.2% |
| Multidisciplinary Studies | 0 | 0.0% |
| Science & Technology | 25 | 15.5% |
| Business | 51 | 31.7% |
| Education | 14 | 8.7% |
| Literature & Languages | 0 | 0.0% |
| Liberal Arts & History | 0 | 0.0% |
| Visual & Performing Arts | 19 | 11.8% |
| Communications | 0 | 0.0% |
| Arts & Humanities | 29 | 18.0% |
| Total | 161 | 100.0% |
Transportation & Commute in Hanson
Vehicle Availability by Sex in Hanson
The most prevalent vehicle ownership categories in Hanson are males with 2 vehicles (62, accounting for 45.3%) and females with 2 vehicles (67, making up 27.7%).
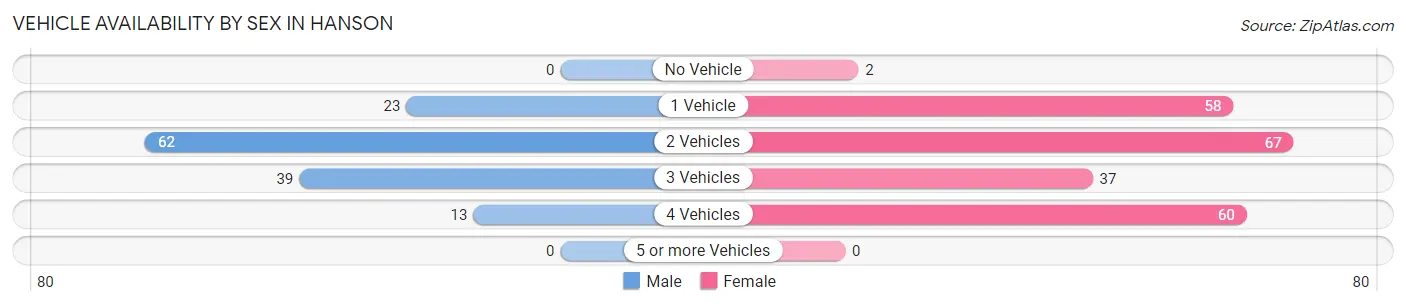
| Vehicles Available | Male | Female |
| No Vehicle | 0 (0.0%) | 2 (0.9%) |
| 1 Vehicle | 23 (16.8%) | 58 (25.9%) |
| 2 Vehicles | 62 (45.3%) | 67 (29.9%) |
| 3 Vehicles | 39 (28.5%) | 37 (16.5%) |
| 4 Vehicles | 13 (9.5%) | 60 (26.8%) |
| 5 or more Vehicles | 0 (0.0%) | 0 (0.0%) |
| Total | 137 (100.0%) | 224 (100.0%) |
Commute Time in Hanson
The most frequently occuring commute durations in Hanson are 10 to 14 minutes (110 commuters, 33.0%), 15 to 19 minutes (106 commuters, 31.8%), and 5 to 9 minutes (35 commuters, 10.5%).
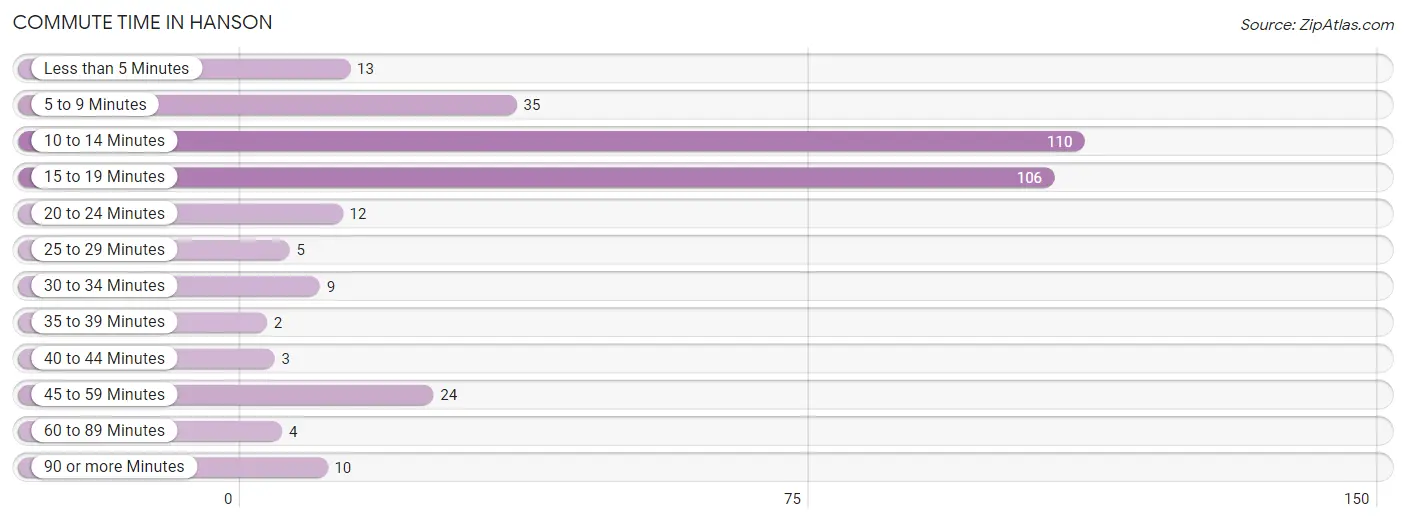
| Commute Time | # Commuters | % Commuters |
| Less than 5 Minutes | 13 | 3.9% |
| 5 to 9 Minutes | 35 | 10.5% |
| 10 to 14 Minutes | 110 | 33.0% |
| 15 to 19 Minutes | 106 | 31.8% |
| 20 to 24 Minutes | 12 | 3.6% |
| 25 to 29 Minutes | 5 | 1.5% |
| 30 to 34 Minutes | 9 | 2.7% |
| 35 to 39 Minutes | 2 | 0.6% |
| 40 to 44 Minutes | 3 | 0.9% |
| 45 to 59 Minutes | 24 | 7.2% |
| 60 to 89 Minutes | 4 | 1.2% |
| 90 or more Minutes | 10 | 3.0% |
Commute Time by Sex in Hanson
The most common commute times in Hanson are 15 to 19 minutes (39 commuters, 33.9%) for males and 10 to 14 minutes (75 commuters, 34.4%) for females.
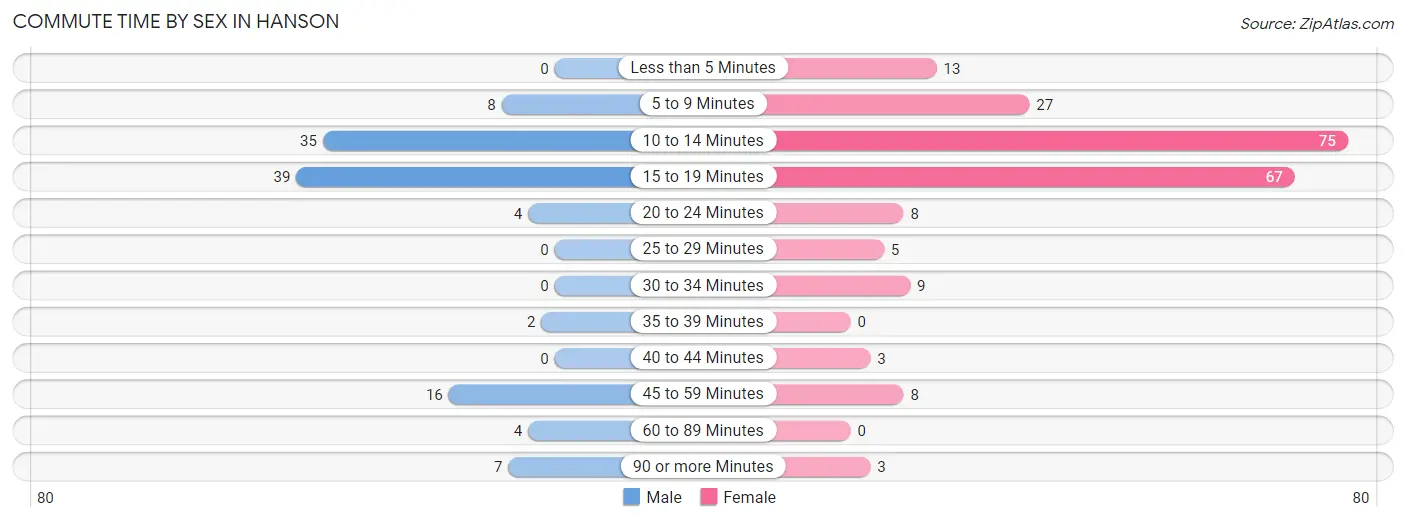
| Commute Time | Male | Female |
| Less than 5 Minutes | 0 (0.0%) | 13 (6.0%) |
| 5 to 9 Minutes | 8 (7.0%) | 27 (12.4%) |
| 10 to 14 Minutes | 35 (30.4%) | 75 (34.4%) |
| 15 to 19 Minutes | 39 (33.9%) | 67 (30.7%) |
| 20 to 24 Minutes | 4 (3.5%) | 8 (3.7%) |
| 25 to 29 Minutes | 0 (0.0%) | 5 (2.3%) |
| 30 to 34 Minutes | 0 (0.0%) | 9 (4.1%) |
| 35 to 39 Minutes | 2 (1.7%) | 0 (0.0%) |
| 40 to 44 Minutes | 0 (0.0%) | 3 (1.4%) |
| 45 to 59 Minutes | 16 (13.9%) | 8 (3.7%) |
| 60 to 89 Minutes | 4 (3.5%) | 0 (0.0%) |
| 90 or more Minutes | 7 (6.1%) | 3 (1.4%) |
Time of Departure to Work by Sex in Hanson
The most frequent times of departure to work in Hanson are 7:30 AM to 7:59 AM (24, 20.9%) for males and 7:30 AM to 7:59 AM (89, 40.8%) for females.
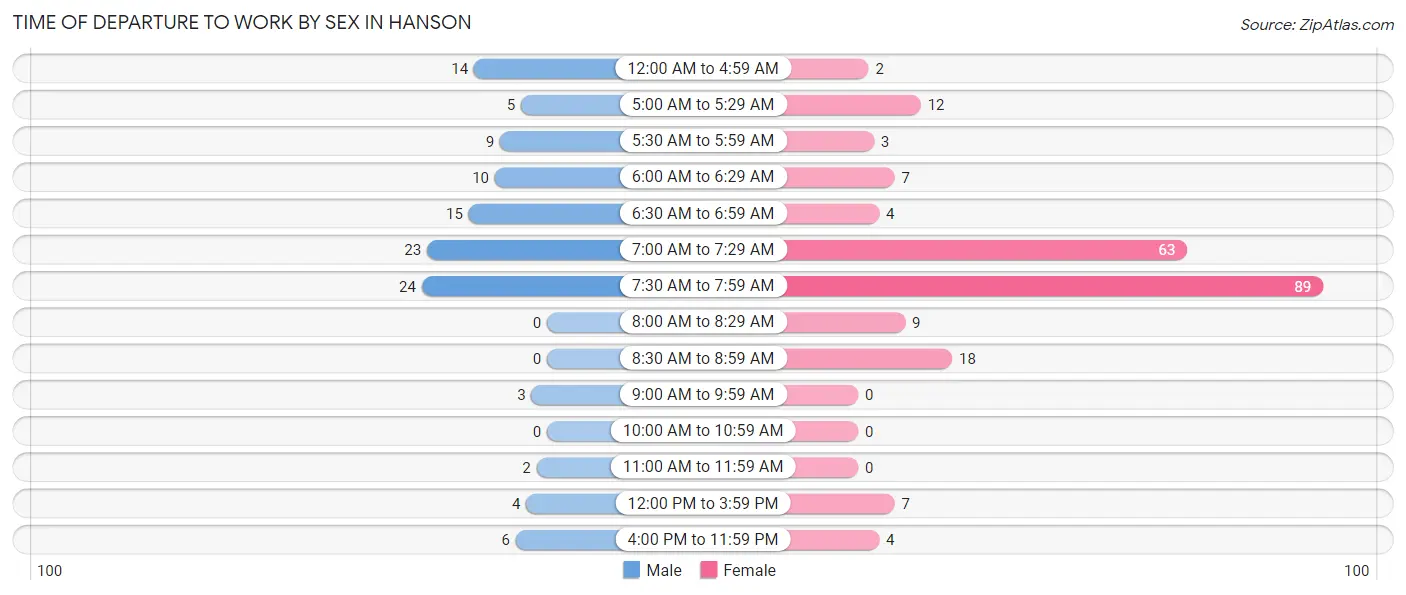
| Time of Departure | Male | Female |
| 12:00 AM to 4:59 AM | 14 (12.2%) | 2 (0.9%) |
| 5:00 AM to 5:29 AM | 5 (4.3%) | 12 (5.5%) |
| 5:30 AM to 5:59 AM | 9 (7.8%) | 3 (1.4%) |
| 6:00 AM to 6:29 AM | 10 (8.7%) | 7 (3.2%) |
| 6:30 AM to 6:59 AM | 15 (13.0%) | 4 (1.8%) |
| 7:00 AM to 7:29 AM | 23 (20.0%) | 63 (28.9%) |
| 7:30 AM to 7:59 AM | 24 (20.9%) | 89 (40.8%) |
| 8:00 AM to 8:29 AM | 0 (0.0%) | 9 (4.1%) |
| 8:30 AM to 8:59 AM | 0 (0.0%) | 18 (8.3%) |
| 9:00 AM to 9:59 AM | 3 (2.6%) | 0 (0.0%) |
| 10:00 AM to 10:59 AM | 0 (0.0%) | 0 (0.0%) |
| 11:00 AM to 11:59 AM | 2 (1.7%) | 0 (0.0%) |
| 12:00 PM to 3:59 PM | 4 (3.5%) | 7 (3.2%) |
| 4:00 PM to 11:59 PM | 6 (5.2%) | 4 (1.8%) |
| Total | 115 (100.0%) | 218 (100.0%) |
Housing Occupancy in Hanson
Occupancy by Ownership in Hanson
Of the total 409 dwellings in Hanson, owner-occupied units account for 375 (91.7%), while renter-occupied units make up 34 (8.3%).
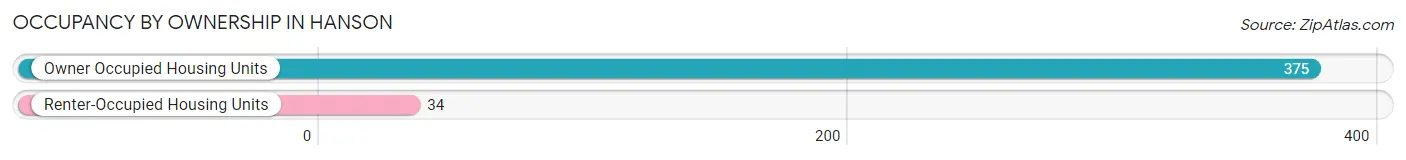
| Occupancy | # Housing Units | % Housing Units |
| Owner Occupied Housing Units | 375 | 91.7% |
| Renter-Occupied Housing Units | 34 | 8.3% |
| Total Occupied Housing Units | 409 | 100.0% |
Occupancy by Household Size in Hanson
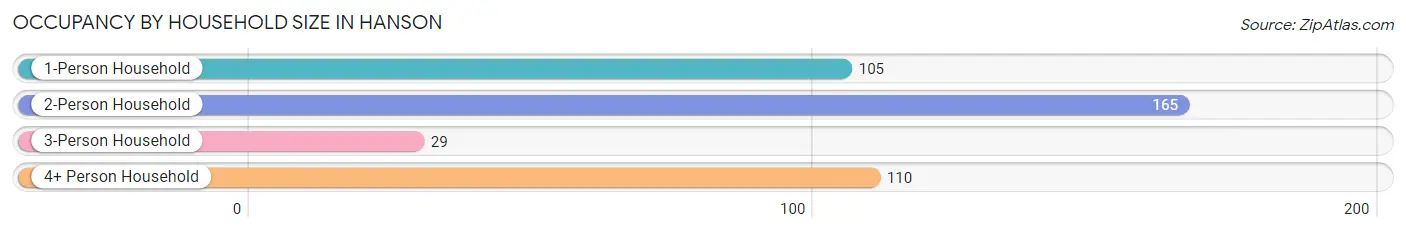
| Household Size | # Housing Units | % Housing Units |
| 1-Person Household | 105 | 25.7% |
| 2-Person Household | 165 | 40.3% |
| 3-Person Household | 29 | 7.1% |
| 4+ Person Household | 110 | 26.9% |
| Total Housing Units | 409 | 100.0% |
Occupancy by Ownership by Household Size in Hanson
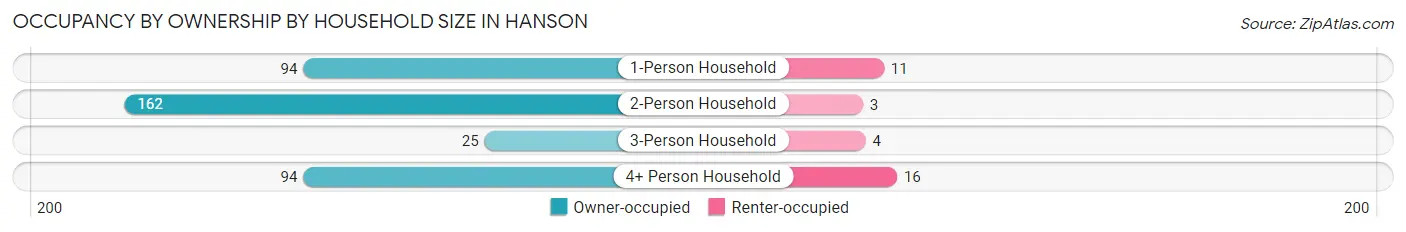
| Household Size | Owner-occupied | Renter-occupied |
| 1-Person Household | 94 (89.5%) | 11 (10.5%) |
| 2-Person Household | 162 (98.2%) | 3 (1.8%) |
| 3-Person Household | 25 (86.2%) | 4 (13.8%) |
| 4+ Person Household | 94 (85.5%) | 16 (14.5%) |
| Total Housing Units | 375 (91.7%) | 34 (8.3%) |
Occupancy by Educational Attainment in Hanson
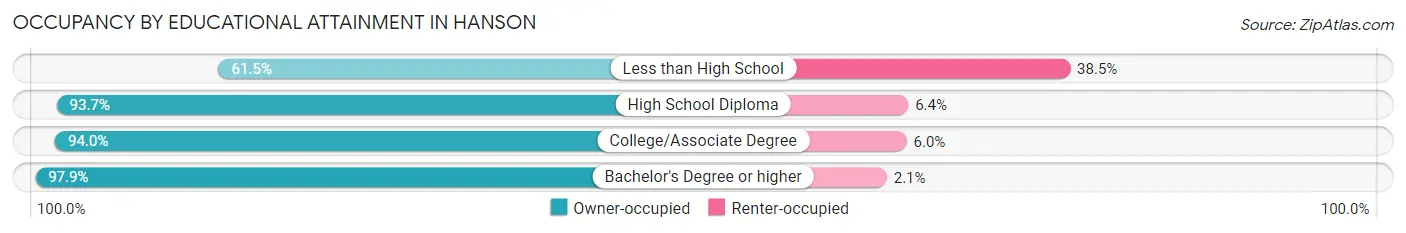
| Household Size | Owner-occupied | Renter-occupied |
| Less than High School | 24 (61.5%) | 15 (38.5%) |
| High School Diploma | 118 (93.6%) | 8 (6.4%) |
| College/Associate Degree | 140 (94.0%) | 9 (6.0%) |
| Bachelor's Degree or higher | 93 (97.9%) | 2 (2.1%) |
Occupancy by Age of Householder in Hanson
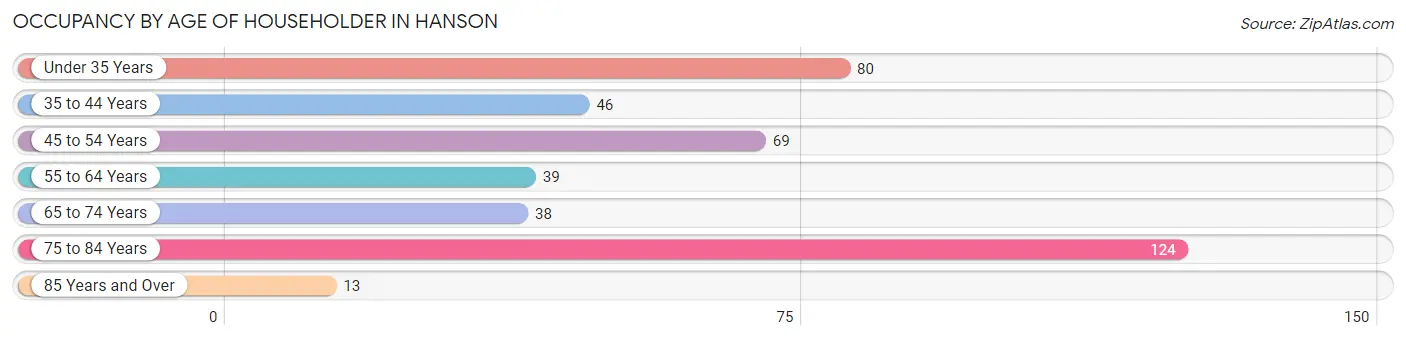
| Age Bracket | # Households | % Households |
| Under 35 Years | 80 | 19.6% |
| 35 to 44 Years | 46 | 11.3% |
| 45 to 54 Years | 69 | 16.9% |
| 55 to 64 Years | 39 | 9.5% |
| 65 to 74 Years | 38 | 9.3% |
| 75 to 84 Years | 124 | 30.3% |
| 85 Years and Over | 13 | 3.2% |
| Total | 409 | 100.0% |
Housing Finances in Hanson
Median Income by Occupancy in Hanson
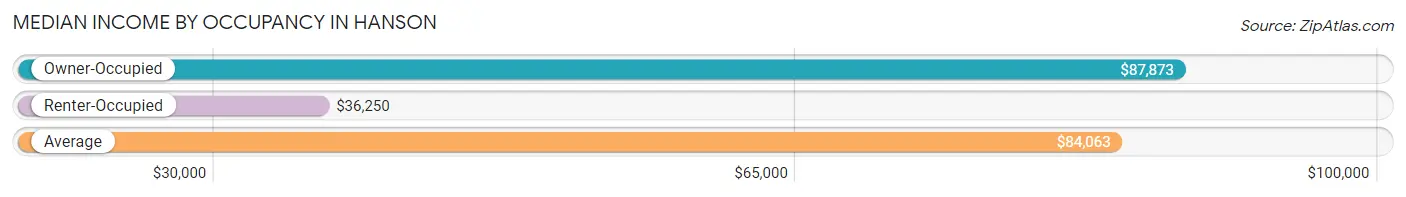
| Occupancy Type | # Households | Median Income |
| Owner-Occupied | 375 (91.7%) | $87,873 |
| Renter-Occupied | 34 (8.3%) | $36,250 |
| Average | 409 (100.0%) | $84,063 |
Occupancy by Householder Income Bracket in Hanson
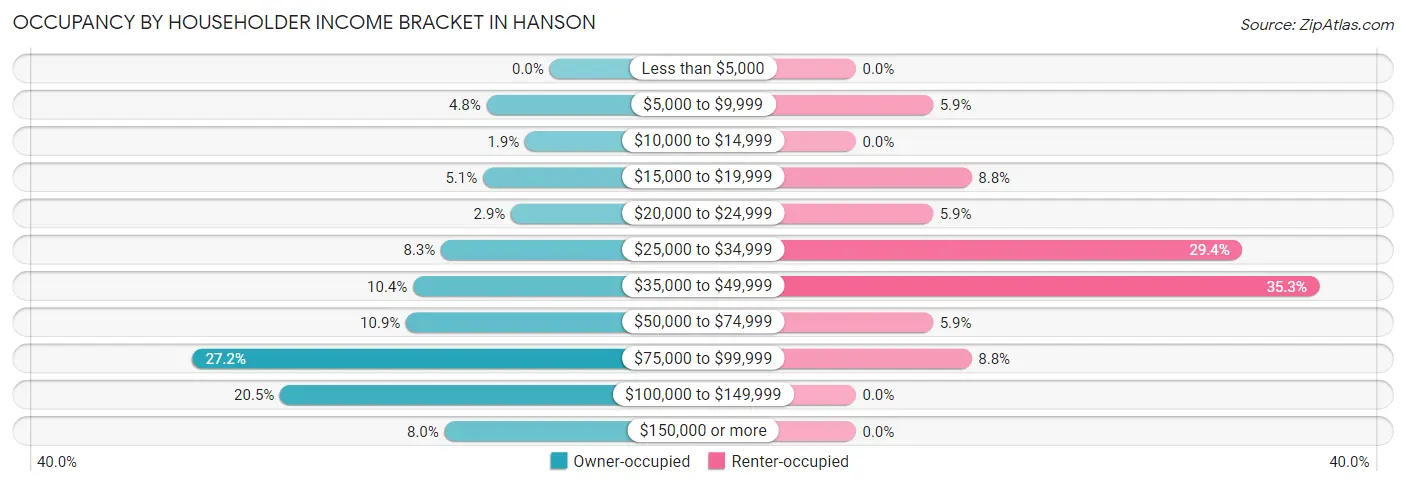
| Income Bracket | Owner-occupied | Renter-occupied |
| Less than $5,000 | 0 (0.0%) | 0 (0.0%) |
| $5,000 to $9,999 | 18 (4.8%) | 2 (5.9%) |
| $10,000 to $14,999 | 7 (1.9%) | 0 (0.0%) |
| $15,000 to $19,999 | 19 (5.1%) | 3 (8.8%) |
| $20,000 to $24,999 | 11 (2.9%) | 2 (5.9%) |
| $25,000 to $34,999 | 31 (8.3%) | 10 (29.4%) |
| $35,000 to $49,999 | 39 (10.4%) | 12 (35.3%) |
| $50,000 to $74,999 | 41 (10.9%) | 2 (5.9%) |
| $75,000 to $99,999 | 102 (27.2%) | 3 (8.8%) |
| $100,000 to $149,999 | 77 (20.5%) | 0 (0.0%) |
| $150,000 or more | 30 (8.0%) | 0 (0.0%) |
| Total | 375 (100.0%) | 34 (100.0%) |
Monthly Housing Cost Tiers in Hanson
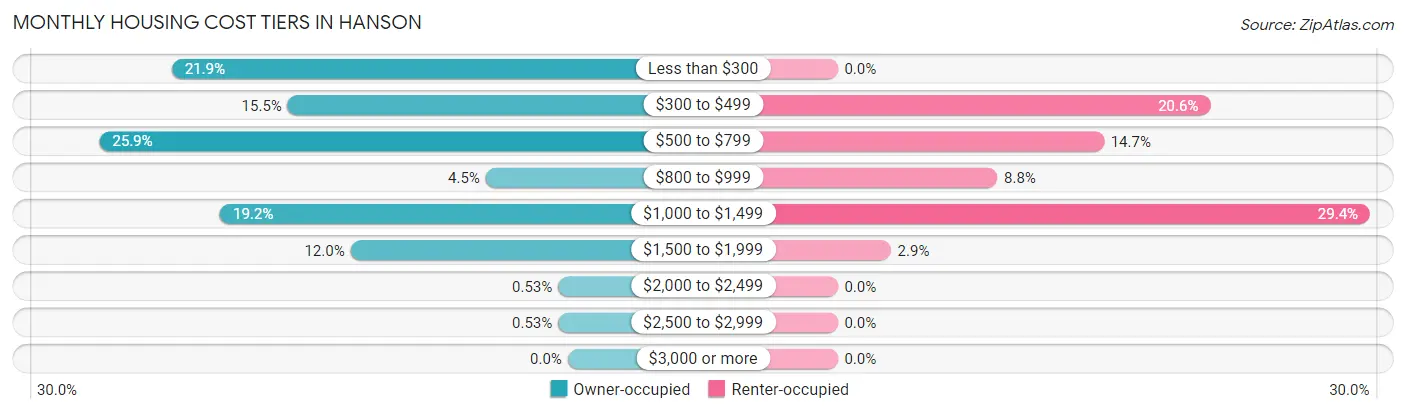
| Monthly Cost | Owner-occupied | Renter-occupied |
| Less than $300 | 82 (21.9%) | 0 (0.0%) |
| $300 to $499 | 58 (15.5%) | 7 (20.6%) |
| $500 to $799 | 97 (25.9%) | 5 (14.7%) |
| $800 to $999 | 17 (4.5%) | 3 (8.8%) |
| $1,000 to $1,499 | 72 (19.2%) | 10 (29.4%) |
| $1,500 to $1,999 | 45 (12.0%) | 1 (2.9%) |
| $2,000 to $2,499 | 2 (0.5%) | 0 (0.0%) |
| $2,500 to $2,999 | 2 (0.5%) | 0 (0.0%) |
| $3,000 or more | 0 (0.0%) | 0 (0.0%) |
| Total | 375 (100.0%) | 34 (100.0%) |
Physical Housing Characteristics in Hanson
Housing Structures in Hanson
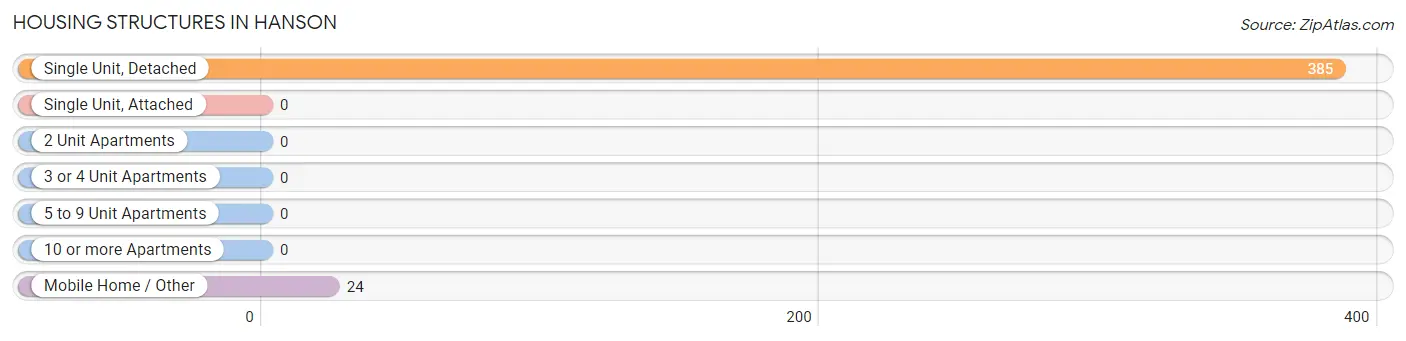
| Structure Type | # Housing Units | % Housing Units |
| Single Unit, Detached | 385 | 94.1% |
| Single Unit, Attached | 0 | 0.0% |
| 2 Unit Apartments | 0 | 0.0% |
| 3 or 4 Unit Apartments | 0 | 0.0% |
| 5 to 9 Unit Apartments | 0 | 0.0% |
| 10 or more Apartments | 0 | 0.0% |
| Mobile Home / Other | 24 | 5.9% |
| Total | 409 | 100.0% |
Housing Structures by Occupancy in Hanson
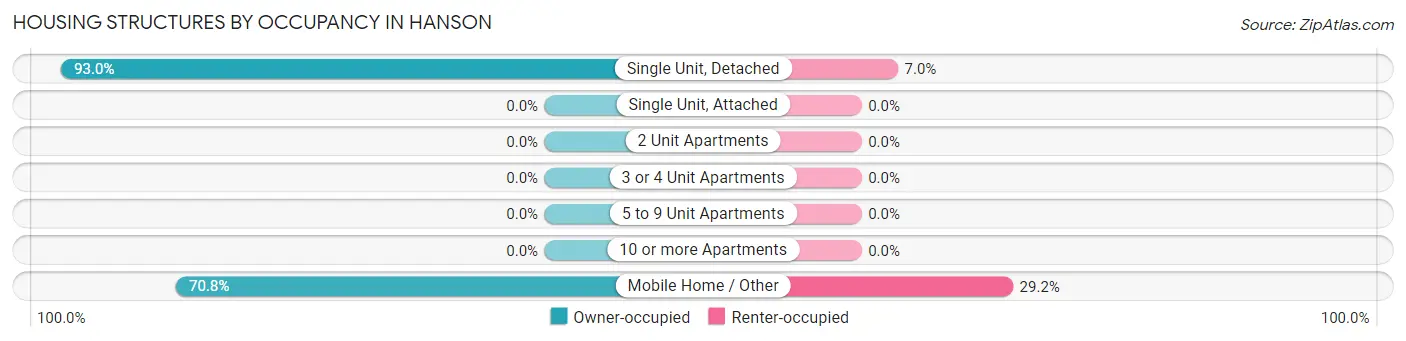
| Structure Type | Owner-occupied | Renter-occupied |
| Single Unit, Detached | 358 (93.0%) | 27 (7.0%) |
| Single Unit, Attached | 0 (0.0%) | 0 (0.0%) |
| 2 Unit Apartments | 0 (0.0%) | 0 (0.0%) |
| 3 or 4 Unit Apartments | 0 (0.0%) | 0 (0.0%) |
| 5 to 9 Unit Apartments | 0 (0.0%) | 0 (0.0%) |
| 10 or more Apartments | 0 (0.0%) | 0 (0.0%) |
| Mobile Home / Other | 17 (70.8%) | 7 (29.2%) |
| Total | 375 (91.7%) | 34 (8.3%) |
Housing Structures by Number of Rooms in Hanson
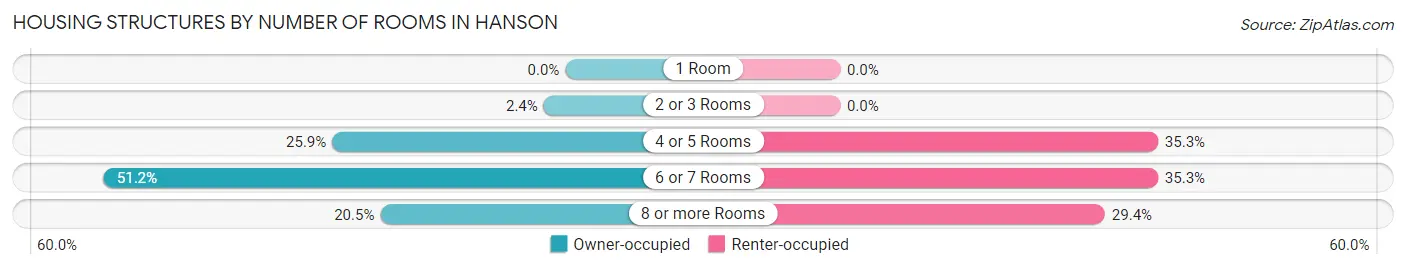
| Number of Rooms | Owner-occupied | Renter-occupied |
| 1 Room | 0 (0.0%) | 0 (0.0%) |
| 2 or 3 Rooms | 9 (2.4%) | 0 (0.0%) |
| 4 or 5 Rooms | 97 (25.9%) | 12 (35.3%) |
| 6 or 7 Rooms | 192 (51.2%) | 12 (35.3%) |
| 8 or more Rooms | 77 (20.5%) | 10 (29.4%) |
| Total | 375 (100.0%) | 34 (100.0%) |
Housing Structure by Heating Type in Hanson
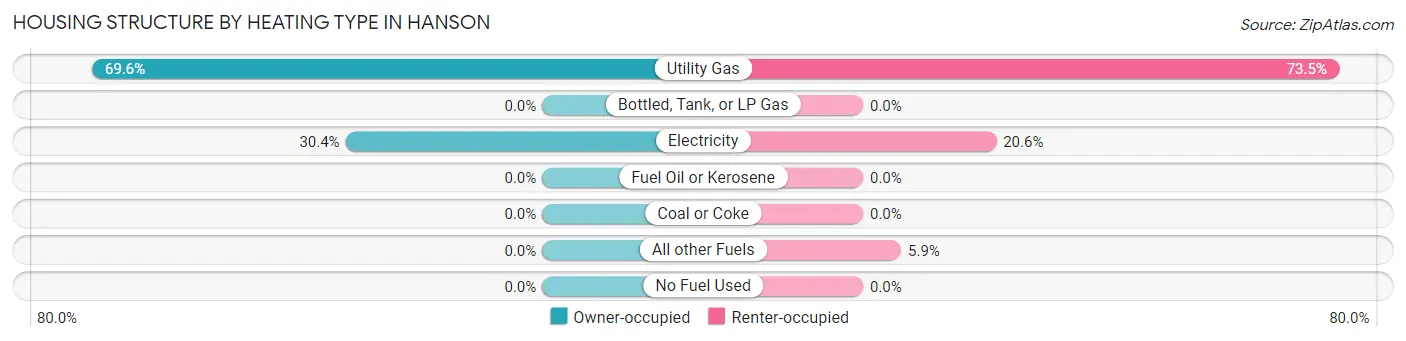
| Heating Type | Owner-occupied | Renter-occupied |
| Utility Gas | 261 (69.6%) | 25 (73.5%) |
| Bottled, Tank, or LP Gas | 0 (0.0%) | 0 (0.0%) |
| Electricity | 114 (30.4%) | 7 (20.6%) |
| Fuel Oil or Kerosene | 0 (0.0%) | 0 (0.0%) |
| Coal or Coke | 0 (0.0%) | 0 (0.0%) |
| All other Fuels | 0 (0.0%) | 2 (5.9%) |
| No Fuel Used | 0 (0.0%) | 0 (0.0%) |
| Total | 375 (100.0%) | 34 (100.0%) |
Household Vehicle Usage in Hanson
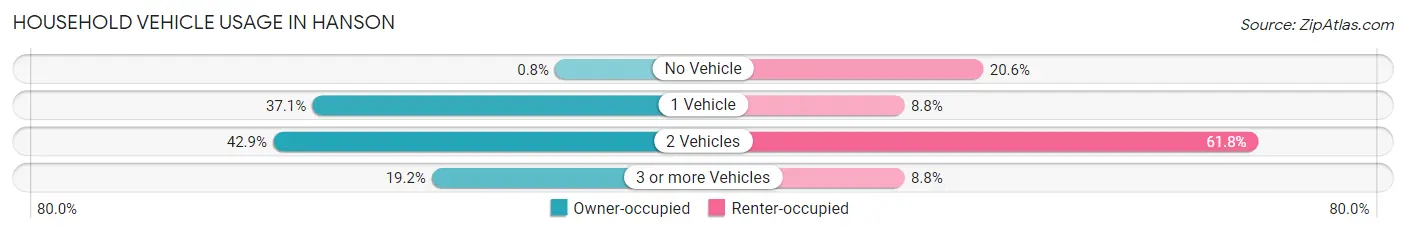
| Vehicles per Household | Owner-occupied | Renter-occupied |
| No Vehicle | 3 (0.8%) | 7 (20.6%) |
| 1 Vehicle | 139 (37.1%) | 3 (8.8%) |
| 2 Vehicles | 161 (42.9%) | 21 (61.8%) |
| 3 or more Vehicles | 72 (19.2%) | 3 (8.8%) |
| Total | 375 (100.0%) | 34 (100.0%) |
Real Estate & Mortgages in Hanson
Real Estate and Mortgage Overview in Hanson
| Characteristic | Without Mortgage | With Mortgage |
| Housing Units | 194 | 181 |
| Median Property Value | $138,400 | $146,000 |
| Median Household Income | $88,219 | $28 |
| Monthly Housing Costs | $334 | $0 |
| Real Estate Taxes | - | - |
Property Value by Mortgage Status in Hanson
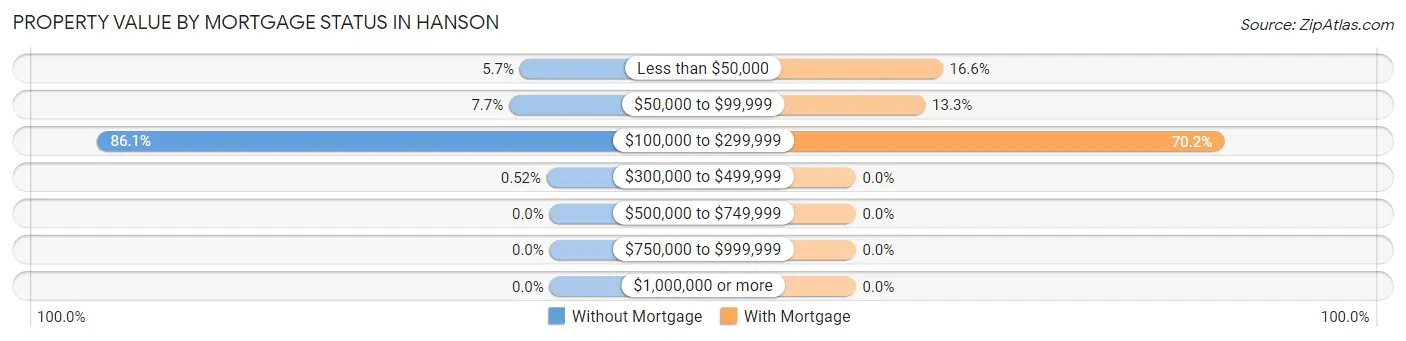
| Property Value | Without Mortgage | With Mortgage |
| Less than $50,000 | 11 (5.7%) | 30 (16.6%) |
| $50,000 to $99,999 | 15 (7.7%) | 24 (13.3%) |
| $100,000 to $299,999 | 167 (86.1%) | 127 (70.2%) |
| $300,000 to $499,999 | 1 (0.5%) | 0 (0.0%) |
| $500,000 to $749,999 | 0 (0.0%) | 0 (0.0%) |
| $750,000 to $999,999 | 0 (0.0%) | 0 (0.0%) |
| $1,000,000 or more | 0 (0.0%) | 0 (0.0%) |
| Total | 194 (100.0%) | 181 (100.0%) |
Household Income by Mortgage Status in Hanson
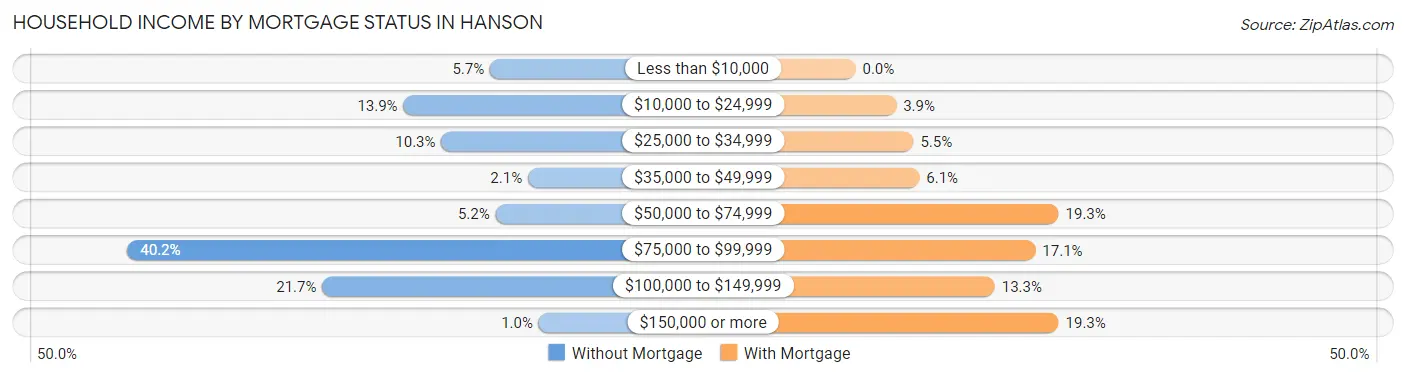
| Household Income | Without Mortgage | With Mortgage |
| Less than $10,000 | 11 (5.7%) | 0 (0.0%) |
| $10,000 to $24,999 | 27 (13.9%) | 7 (3.9%) |
| $25,000 to $34,999 | 20 (10.3%) | 10 (5.5%) |
| $35,000 to $49,999 | 4 (2.1%) | 11 (6.1%) |
| $50,000 to $74,999 | 10 (5.1%) | 35 (19.3%) |
| $75,000 to $99,999 | 78 (40.2%) | 31 (17.1%) |
| $100,000 to $149,999 | 42 (21.6%) | 24 (13.3%) |
| $150,000 or more | 2 (1.0%) | 35 (19.3%) |
| Total | 194 (100.0%) | 181 (100.0%) |
Property Value to Household Income Ratio in Hanson
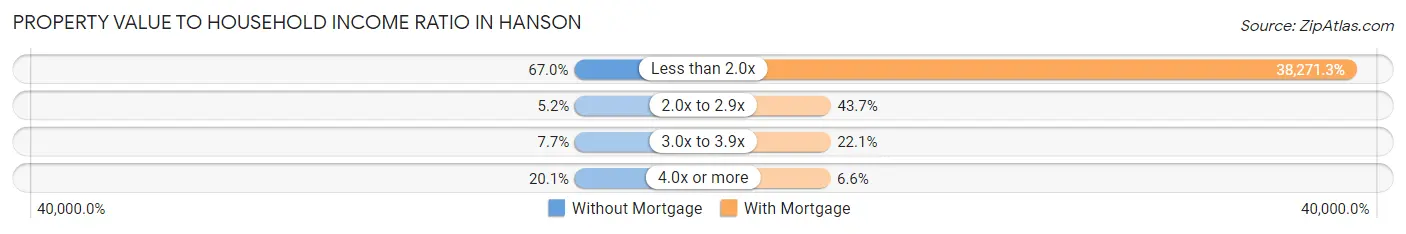
| Value-to-Income Ratio | Without Mortgage | With Mortgage |
| Less than 2.0x | 130 (67.0%) | 69,271 (38,271.3%) |
| 2.0x to 2.9x | 10 (5.1%) | 79 (43.6%) |
| 3.0x to 3.9x | 15 (7.7%) | 40 (22.1%) |
| 4.0x or more | 39 (20.1%) | 12 (6.6%) |
| Total | 194 (100.0%) | 181 (100.0%) |
Real Estate Taxes by Mortgage Status in Hanson
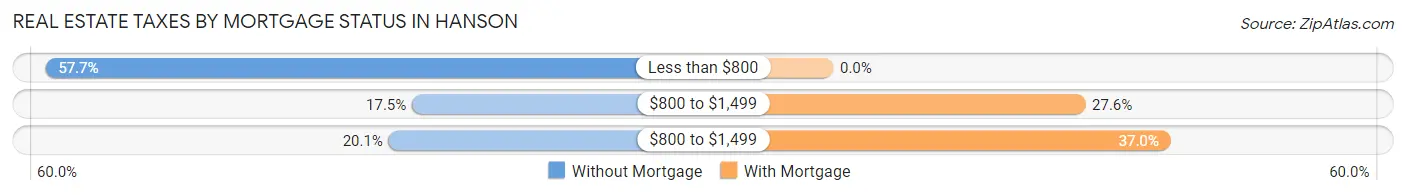
| Property Taxes | Without Mortgage | With Mortgage |
| Less than $800 | 112 (57.7%) | 0 (0.0%) |
| $800 to $1,499 | 34 (17.5%) | 50 (27.6%) |
| $800 to $1,499 | 39 (20.1%) | 67 (37.0%) |
| Total | 194 (100.0%) | 181 (100.0%) |
Health & Disability in Hanson
Health Insurance Coverage by Age in Hanson
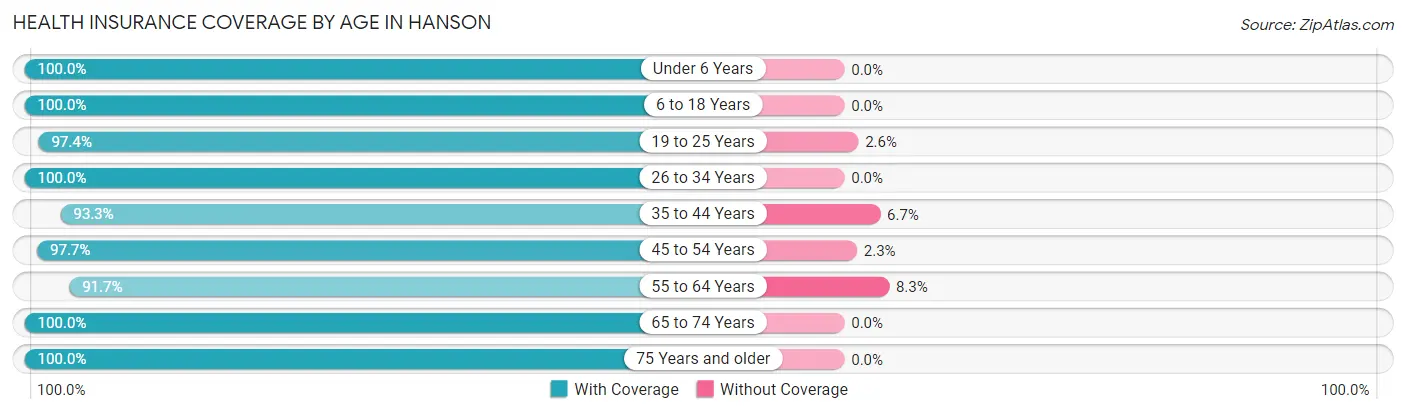
| Age Bracket | With Coverage | Without Coverage |
| Under 6 Years | 72 (100.0%) | 0 (0.0%) |
| 6 to 18 Years | 124 (100.0%) | 0 (0.0%) |
| 19 to 25 Years | 75 (97.4%) | 2 (2.6%) |
| 26 to 34 Years | 141 (100.0%) | 0 (0.0%) |
| 35 to 44 Years | 70 (93.3%) | 5 (6.7%) |
| 45 to 54 Years | 125 (97.7%) | 3 (2.3%) |
| 55 to 64 Years | 55 (91.7%) | 5 (8.3%) |
| 65 to 74 Years | 46 (100.0%) | 0 (0.0%) |
| 75 Years and older | 201 (100.0%) | 0 (0.0%) |
| Total | 909 (98.4%) | 15 (1.6%) |
Health Insurance Coverage by Citizenship Status in Hanson
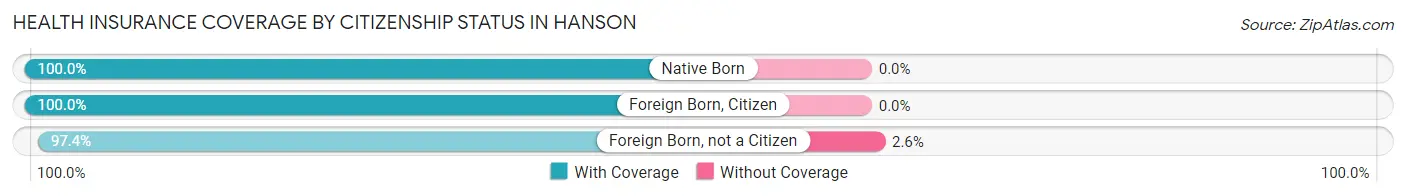
| Citizenship Status | With Coverage | Without Coverage |
| Native Born | 72 (100.0%) | 0 (0.0%) |
| Foreign Born, Citizen | 124 (100.0%) | 0 (0.0%) |
| Foreign Born, not a Citizen | 75 (97.4%) | 2 (2.6%) |
Health Insurance Coverage by Household Income in Hanson
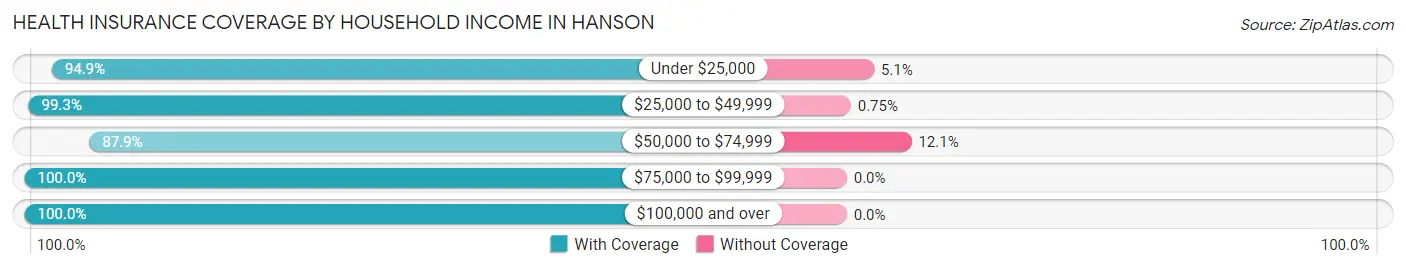
| Household Income | With Coverage | Without Coverage |
| Under $25,000 | 93 (94.9%) | 5 (5.1%) |
| $25,000 to $49,999 | 264 (99.3%) | 2 (0.7%) |
| $50,000 to $74,999 | 58 (87.9%) | 8 (12.1%) |
| $75,000 to $99,999 | 206 (100.0%) | 0 (0.0%) |
| $100,000 and over | 288 (100.0%) | 0 (0.0%) |
Public vs Private Health Insurance Coverage by Age in Hanson
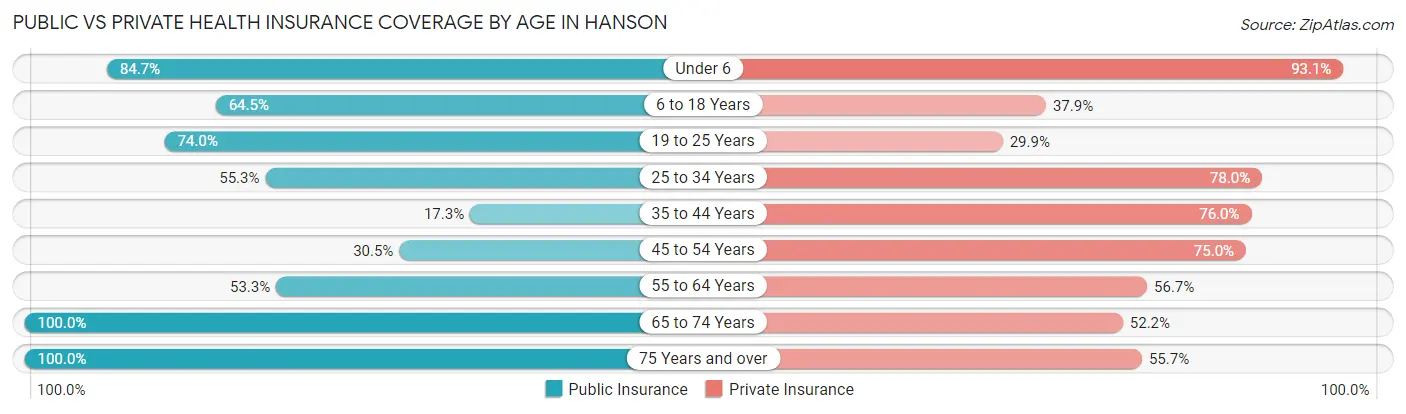
| Age Bracket | Public Insurance | Private Insurance |
| Under 6 | 61 (84.7%) | 67 (93.1%) |
| 6 to 18 Years | 80 (64.5%) | 47 (37.9%) |
| 19 to 25 Years | 57 (74.0%) | 23 (29.9%) |
| 25 to 34 Years | 78 (55.3%) | 110 (78.0%) |
| 35 to 44 Years | 13 (17.3%) | 57 (76.0%) |
| 45 to 54 Years | 39 (30.5%) | 96 (75.0%) |
| 55 to 64 Years | 32 (53.3%) | 34 (56.7%) |
| 65 to 74 Years | 46 (100.0%) | 24 (52.2%) |
| 75 Years and over | 201 (100.0%) | 112 (55.7%) |
| Total | 607 (65.7%) | 570 (61.7%) |
Disability Status by Sex by Age in Hanson
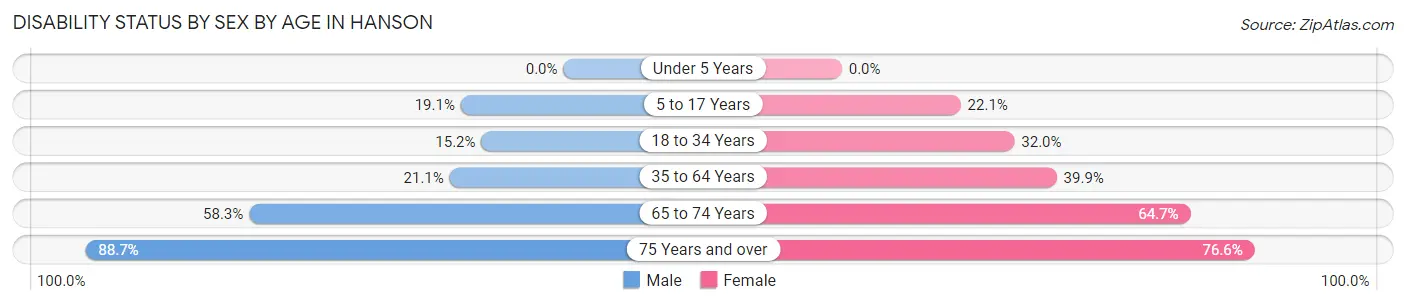
| Age Bracket | Male | Female |
| Under 5 Years | 0 (0.0%) | 0 (0.0%) |
| 5 to 17 Years | 16 (19.1%) | 15 (22.1%) |
| 18 to 34 Years | 14 (15.2%) | 41 (32.0%) |
| 35 to 64 Years | 19 (21.1%) | 69 (39.9%) |
| 65 to 74 Years | 7 (58.3%) | 22 (64.7%) |
| 75 Years and over | 110 (88.7%) | 59 (76.6%) |
Disability Class by Sex by Age in Hanson
Disability Class: Hearing Difficulty
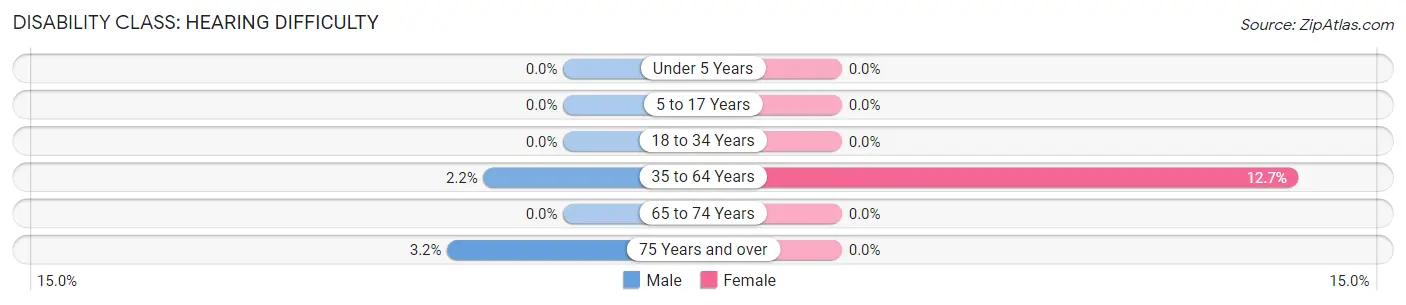
| Age Bracket | Male | Female |
| Under 5 Years | 0 (0.0%) | 0 (0.0%) |
| 5 to 17 Years | 0 (0.0%) | 0 (0.0%) |
| 18 to 34 Years | 0 (0.0%) | 0 (0.0%) |
| 35 to 64 Years | 2 (2.2%) | 22 (12.7%) |
| 65 to 74 Years | 0 (0.0%) | 0 (0.0%) |
| 75 Years and over | 4 (3.2%) | 0 (0.0%) |
Disability Class: Vision Difficulty
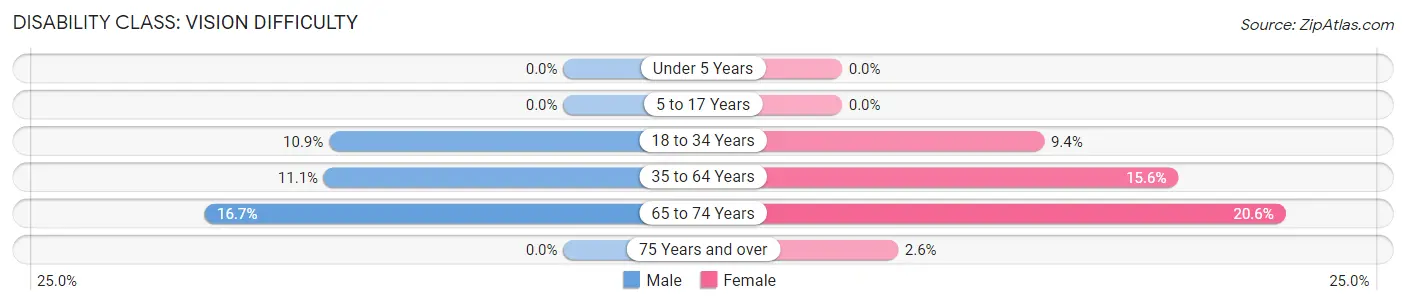
| Age Bracket | Male | Female |
| Under 5 Years | 0 (0.0%) | 0 (0.0%) |
| 5 to 17 Years | 0 (0.0%) | 0 (0.0%) |
| 18 to 34 Years | 10 (10.9%) | 12 (9.4%) |
| 35 to 64 Years | 10 (11.1%) | 27 (15.6%) |
| 65 to 74 Years | 2 (16.7%) | 7 (20.6%) |
| 75 Years and over | 0 (0.0%) | 2 (2.6%) |
Disability Class: Cognitive Difficulty
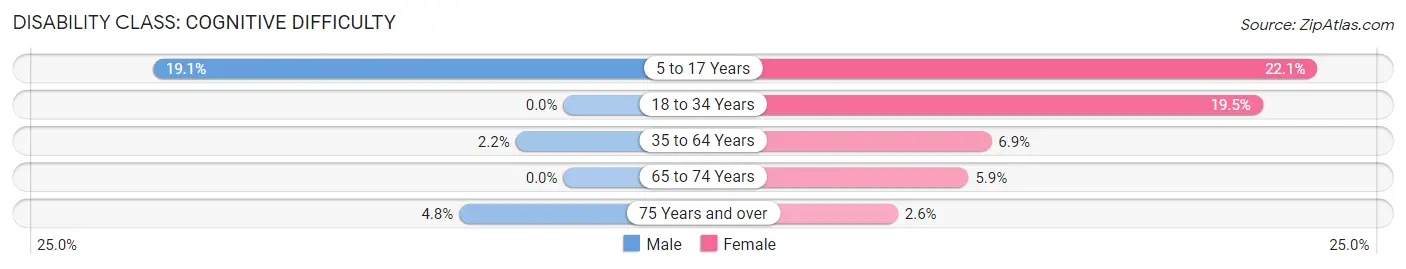
| Age Bracket | Male | Female |
| 5 to 17 Years | 16 (19.1%) | 15 (22.1%) |
| 18 to 34 Years | 0 (0.0%) | 25 (19.5%) |
| 35 to 64 Years | 2 (2.2%) | 12 (6.9%) |
| 65 to 74 Years | 0 (0.0%) | 2 (5.9%) |
| 75 Years and over | 6 (4.8%) | 2 (2.6%) |
Disability Class: Ambulatory Difficulty
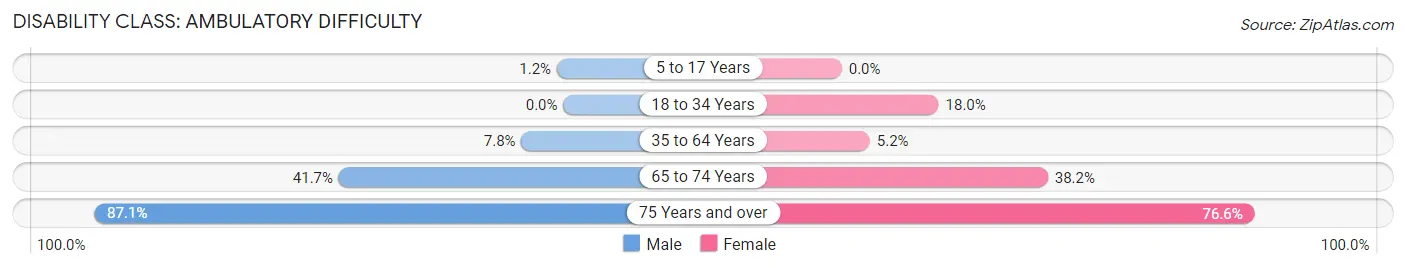
| Age Bracket | Male | Female |
| 5 to 17 Years | 1 (1.2%) | 0 (0.0%) |
| 18 to 34 Years | 0 (0.0%) | 23 (18.0%) |
| 35 to 64 Years | 7 (7.8%) | 9 (5.2%) |
| 65 to 74 Years | 5 (41.7%) | 13 (38.2%) |
| 75 Years and over | 108 (87.1%) | 59 (76.6%) |
Disability Class: Self-Care Difficulty
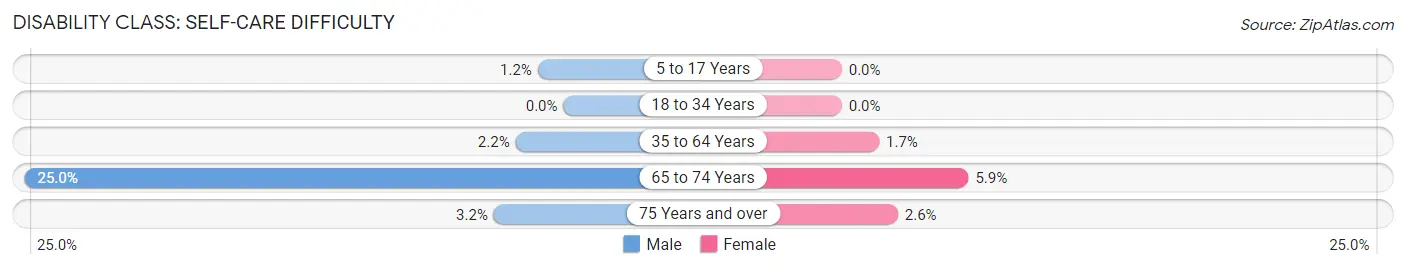
| Age Bracket | Male | Female |
| 5 to 17 Years | 1 (1.2%) | 0 (0.0%) |
| 18 to 34 Years | 0 (0.0%) | 0 (0.0%) |
| 35 to 64 Years | 2 (2.2%) | 3 (1.7%) |
| 65 to 74 Years | 3 (25.0%) | 2 (5.9%) |
| 75 Years and over | 4 (3.2%) | 2 (2.6%) |
Technology Access in Hanson
Computing Device Access in Hanson
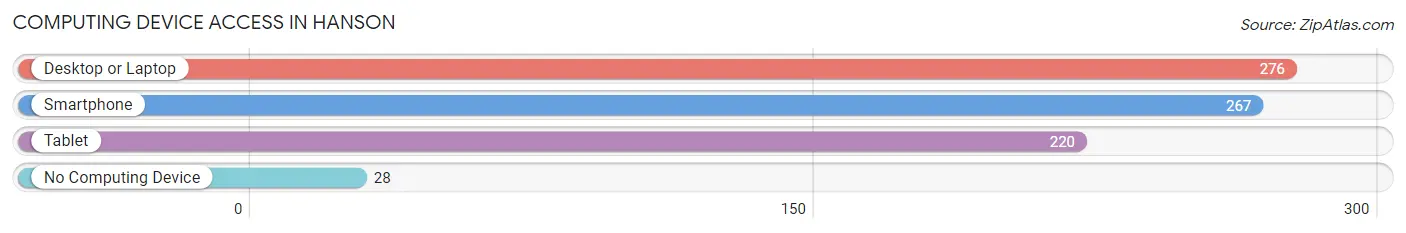
| Device Type | # Households | % Households |
| Desktop or Laptop | 276 | 67.5% |
| Smartphone | 267 | 65.3% |
| Tablet | 220 | 53.8% |
| No Computing Device | 28 | 6.9% |
| Total | 409 | 100.0% |
Internet Access in Hanson

| Internet Type | # Households | % Households |
| Dial-Up Internet | 0 | 0.0% |
| Broadband Home | 279 | 68.2% |
| Cellular Data Only | 49 | 12.0% |
| Satellite Internet | 61 | 14.9% |
| No Internet | 21 | 5.1% |
| Total | 409 | 100.0% |
Hanson Summary
Hanson is a small town located in Hopkins County, Kentucky. It is situated on the banks of the Green River and is part of the Madisonville-Hopkins County Metropolitan Statistical Area. The town has a population of approximately 1,000 people and is known for its rural charm and friendly atmosphere.
History
Hanson was founded in 1883 by William Hanson, a former Confederate soldier. He named the town after himself and it quickly grew into a thriving community. The town was incorporated in 1891 and soon became a hub for the surrounding agricultural area. The town was also home to a number of businesses, including a sawmill, a gristmill, a blacksmith shop, and a general store.
In the early 1900s, the town began to decline as the railroad bypassed it and the population began to dwindle. However, in the 1950s, the town experienced a resurgence as the nearby city of Madisonville began to grow. This growth brought new businesses and industry to the area, and Hanson began to experience a period of growth and prosperity.
Geography
Hanson is located in western Kentucky, approximately 30 miles from the state capital of Frankfort. The town is situated on the banks of the Green River and is surrounded by rolling hills and farmland. The climate in Hanson is humid and subtropical, with hot summers and mild winters.
Economy
Hanson’s economy is largely based on agriculture and manufacturing. The town is home to a number of small businesses, including a grocery store, a hardware store, and a few restaurants. The town is also home to a number of manufacturing plants, including a furniture factory and a plastics plant.
Demographics
As of the 2010 census, the population of Hanson was 1,000 people. The racial makeup of the town was 95.2% White, 2.2% African American, 0.2% Native American, 0.2% Asian, and 2.2% from other races. The median household income was $31,250 and the median family income was $37,500.
Hanson is a small town with a rich history and a friendly atmosphere. The town is home to a number of businesses and industries, and the population is diverse and welcoming. The town is a great place to live and work, and it is a great example of rural Kentucky life.
Common Questions
What is Per Capita Income in Hanson?
Per Capita income in Hanson is $32,064.
What is the Median Family Income in Hanson?
Median Family Income in Hanson is $89,107.
What is the Median Household income in Hanson?
Median Household Income in Hanson is $84,063.
What is Income or Wage Gap in Hanson?
Income or Wage Gap in Hanson is 45.0%.
Women in Hanson earn 55.0 cents for every dollar earned by a man.
What is Inequality or Gini Index in Hanson?
Inequality or Gini Index in Hanson is 0.40.
What is the Total Population of Hanson?
Total Population of Hanson is 1,015.
What is the Total Male Population of Hanson?
Total Male Population of Hanson is 505.
What is the Total Female Population of Hanson?
Total Female Population of Hanson is 510.
What is the Ratio of Males per 100 Females in Hanson?
There are 99.02 Males per 100 Females in Hanson.
What is the Ratio of Females per 100 Males in Hanson?
There are 100.99 Females per 100 Males in Hanson.
What is the Median Population Age in Hanson?
Median Population Age in Hanson is 45.7 Years.
What is the Average Family Size in Hanson
Average Family Size in Hanson is 2.6 People.
What is the Average Household Size in Hanson
Average Household Size in Hanson is 2.3 People.
How Large is the Labor Force in Hanson?
There are 378 People in the Labor Forcein in Hanson.
What is the Percentage of People in the Labor Force in Hanson?
45.1% of People are in the Labor Force in Hanson.
What is the Unemployment Rate in Hanson?
Unemployment Rate in Hanson is 4.0%.