Middlesborough, KY Map & Demographics
Middlesborough Map
Middlesborough Overview
$20,123
PER CAPITA INCOME
$46,476
AVG FAMILY INCOME
$35,798
AVG HOUSEHOLD INCOME
10.8%
WAGE / INCOME GAP [ % ]
89.2¢/ $1
WAGE / INCOME GAP [ $ ]
$7,404
FAMILY INCOME DEFICIT
0.48
INEQUALITY / GINI INDEX
9,383
TOTAL POPULATION
4,702
MALE POPULATION
4,681
FEMALE POPULATION
100.45
MALES / 100 FEMALES
99.55
FEMALES / 100 MALES
42.1
MEDIAN AGE
3.1
AVG FAMILY SIZE
2.4
AVG HOUSEHOLD SIZE
3,115
LABOR FORCE [ PEOPLE ]
41.6%
PERCENT IN LABOR FORCE
8.8%
UNEMPLOYMENT RATE
Income in Middlesborough
Income Overview in Middlesborough
Per Capita Income in Middlesborough is $20,123, while median incomes of families and households are $46,476 and $35,798 respectively.
| Characteristic | Number | Measure |
| Per Capita Income | 9,383 | $20,123 |
| Median Family Income | 2,414 | $46,476 |
| Mean Family Income | 2,414 | $58,286 |
| Median Household Income | 3,862 | $35,798 |
| Mean Household Income | 3,862 | $47,571 |
| Income Deficit | 2,414 | $7,404 |
| Wage / Income Gap (%) | 9,383 | 10.80% |
| Wage / Income Gap ($) | 9,383 | 89.20¢ per $1 |
| Gini / Inequality Index | 9,383 | 0.48 |
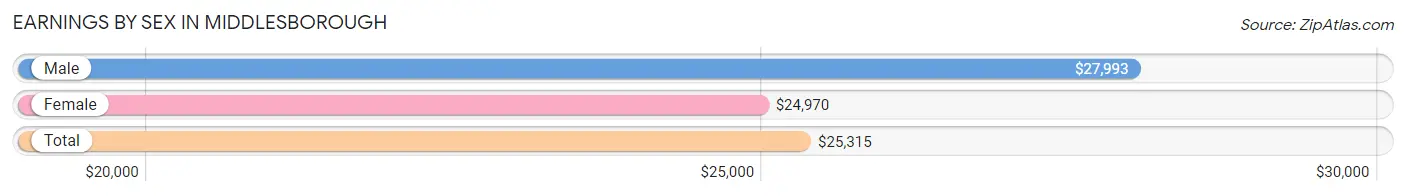
Earnings by Sex in Middlesborough
Average Earnings in Middlesborough are $25,315, $27,993 for men and $24,970 for women, a difference of 10.8%.
| Sex | Number | Average Earnings |
| Male | 1,698 (50.9%) | $27,993 |
| Female | 1,640 (49.1%) | $24,970 |
| Total | 3,338 (100.0%) | $25,315 |
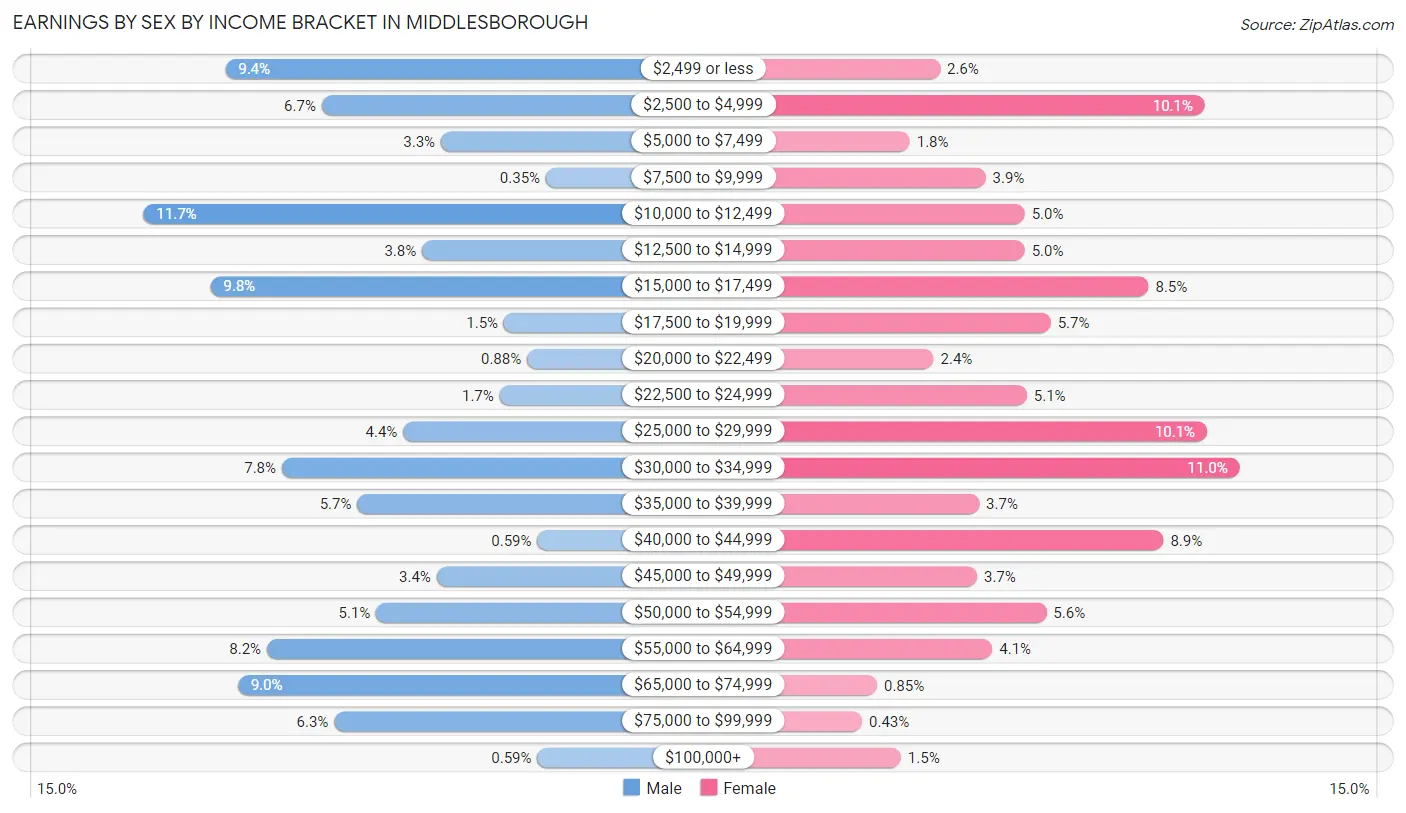
Earnings by Sex by Income Bracket in Middlesborough
The most common earnings brackets in Middlesborough are $10,000 to $12,499 for men (198 | 11.7%) and $30,000 to $34,999 for women (181 | 11.0%).
| Income | Male | Female |
| $2,499 or less | 159 (9.4%) | 43 (2.6%) |
| $2,500 to $4,999 | 113 (6.7%) | 165 (10.1%) |
| $5,000 to $7,499 | 56 (3.3%) | 29 (1.8%) |
| $7,500 to $9,999 | 6 (0.4%) | 64 (3.9%) |
| $10,000 to $12,499 | 198 (11.7%) | 82 (5.0%) |
| $12,500 to $14,999 | 65 (3.8%) | 82 (5.0%) |
| $15,000 to $17,499 | 166 (9.8%) | 139 (8.5%) |
| $17,500 to $19,999 | 26 (1.5%) | 94 (5.7%) |
| $20,000 to $22,499 | 15 (0.9%) | 40 (2.4%) |
| $22,500 to $24,999 | 28 (1.7%) | 83 (5.1%) |
| $25,000 to $29,999 | 74 (4.4%) | 166 (10.1%) |
| $30,000 to $34,999 | 132 (7.8%) | 181 (11.0%) |
| $35,000 to $39,999 | 96 (5.7%) | 61 (3.7%) |
| $40,000 to $44,999 | 10 (0.6%) | 146 (8.9%) |
| $45,000 to $49,999 | 58 (3.4%) | 60 (3.7%) |
| $50,000 to $54,999 | 87 (5.1%) | 92 (5.6%) |
| $55,000 to $64,999 | 139 (8.2%) | 67 (4.1%) |
| $65,000 to $74,999 | 153 (9.0%) | 14 (0.9%) |
| $75,000 to $99,999 | 107 (6.3%) | 7 (0.4%) |
| $100,000+ | 10 (0.6%) | 25 (1.5%) |
| Total | 1,698 (100.0%) | 1,640 (100.0%) |
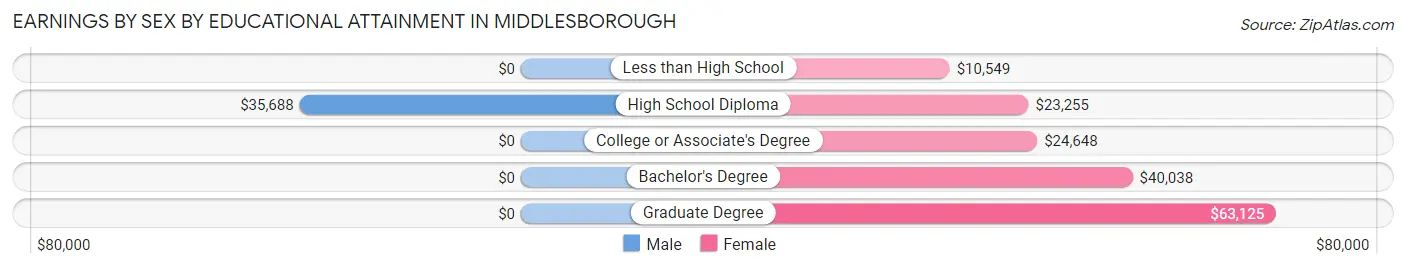
Earnings by Sex by Educational Attainment in Middlesborough
Average earnings in Middlesborough are $31,343 for men and $24,969 for women, a difference of 20.3%. Men with an educational attainment of high school diploma enjoy the highest average annual earnings of $35,688, while those with high school diploma education earn the least with $35,688. Women with an educational attainment of graduate degree earn the most with the average annual earnings of $63,125, while those with less than high school education have the smallest earnings of $10,549.
| Educational Attainment | Male Income | Female Income |
| Less than High School | - | - |
| High School Diploma | $35,688 | $23,255 |
| College or Associate's Degree | - | - |
| Bachelor's Degree | - | - |
| Graduate Degree | - | - |
| Total | $31,343 | $24,969 |
Family Income in Middlesborough
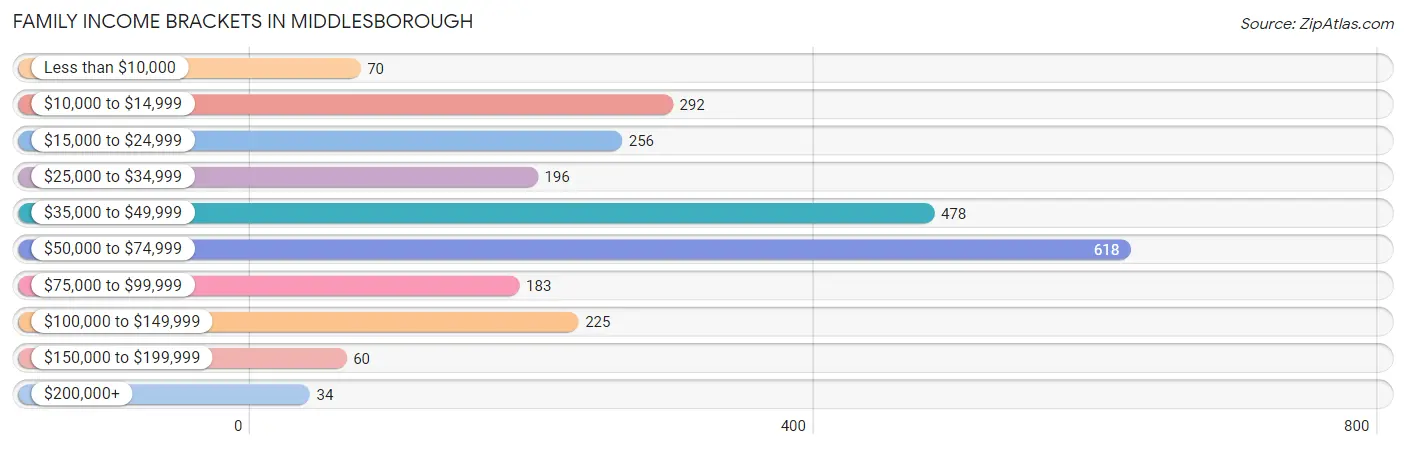
Family Income Brackets in Middlesborough
According to the Middlesborough family income data, there are 618 families falling into the $50,000 to $74,999 income range, which is the most common income bracket and makes up 25.6% of all families. Conversely, the $200,000+ income bracket is the least frequent group with only 34 families (1.4%) belonging to this category.
| Income Bracket | # Families | % Families |
| Less than $10,000 | 70 | 2.9% |
| $10,000 to $14,999 | 292 | 12.1% |
| $15,000 to $24,999 | 256 | 10.6% |
| $25,000 to $34,999 | 196 | 8.1% |
| $35,000 to $49,999 | 478 | 19.8% |
| $50,000 to $74,999 | 618 | 25.6% |
| $75,000 to $99,999 | 183 | 7.6% |
| $100,000 to $149,999 | 225 | 9.3% |
| $150,000 to $199,999 | 60 | 2.5% |
| $200,000+ | 34 | 1.4% |
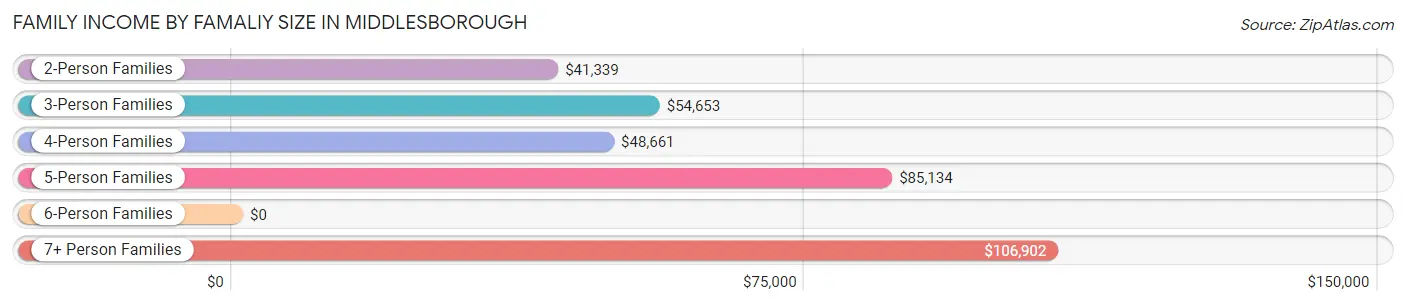
Family Income by Famaliy Size in Middlesborough
7+ person families (63 | 2.6%) account for the highest median family income in Middlesborough with $106,902 per family, while 2-person families (1,459 | 60.4%) have the highest median income of $20,670 per family member.
| Income Bracket | # Families | Median Income |
| 2-Person Families | 1,459 (60.4%) | $41,339 |
| 3-Person Families | 357 (14.8%) | $54,653 |
| 4-Person Families | 352 (14.6%) | $48,661 |
| 5-Person Families | 141 (5.8%) | $85,134 |
| 6-Person Families | 42 (1.7%) | $0 |
| 7+ Person Families | 63 (2.6%) | $106,902 |
| Total | 2,414 (100.0%) | $46,476 |
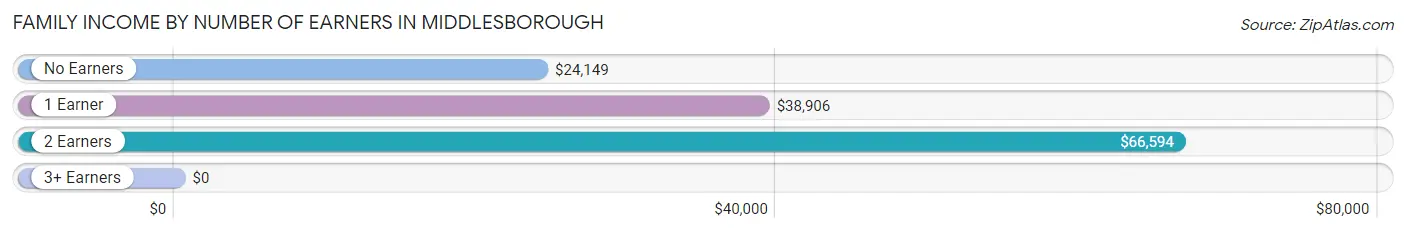
Family Income by Number of Earners in Middlesborough
| Number of Earners | # Families | Median Income |
| No Earners | 748 (31.0%) | $24,149 |
| 1 Earner | 916 (38.0%) | $38,906 |
| 2 Earners | 607 (25.1%) | $66,594 |
| 3+ Earners | 143 (5.9%) | $0 |
| Total | 2,414 (100.0%) | $46,476 |
Household Income in Middlesborough
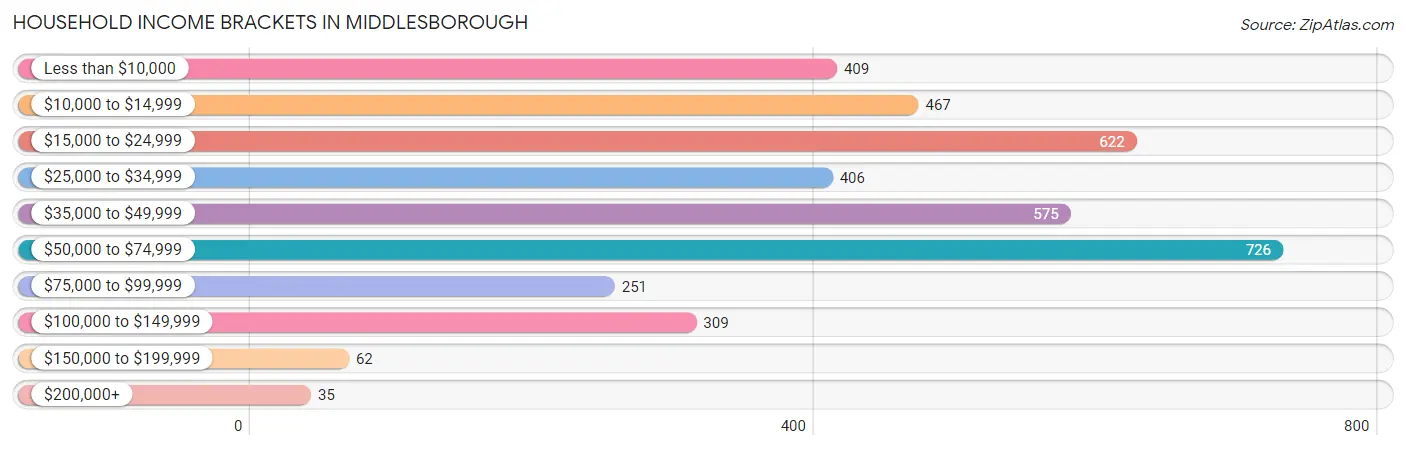
Household Income Brackets in Middlesborough
With 726 households falling in the category, the $50,000 to $74,999 income range is the most frequent in Middlesborough, accounting for 18.8% of all households. In contrast, only 35 households (0.9%) fall into the $200,000+ income bracket, making it the least populous group.
| Income Bracket | # Households | % Households |
| Less than $10,000 | 409 | 10.6% |
| $10,000 to $14,999 | 467 | 12.1% |
| $15,000 to $24,999 | 622 | 16.1% |
| $25,000 to $34,999 | 406 | 10.5% |
| $35,000 to $49,999 | 575 | 14.9% |
| $50,000 to $74,999 | 726 | 18.8% |
| $75,000 to $99,999 | 251 | 6.5% |
| $100,000 to $149,999 | 309 | 8.0% |
| $150,000 to $199,999 | 62 | 1.6% |
| $200,000+ | 35 | 0.9% |
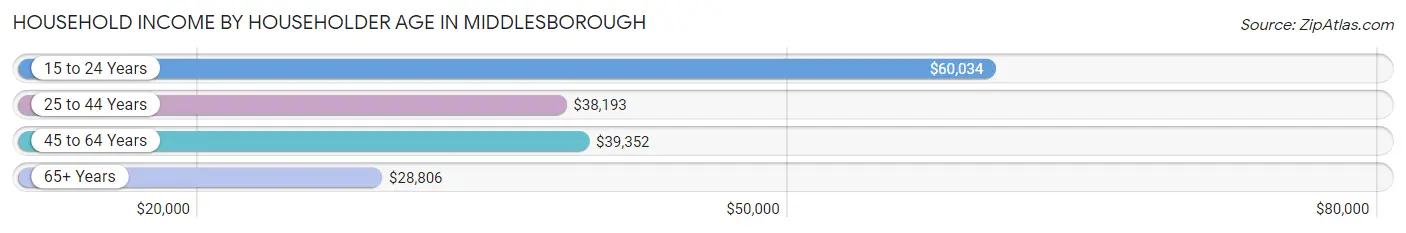
Household Income by Householder Age in Middlesborough
The median household income in Middlesborough is $35,798, with the highest median household income of $60,034 found in the 15 to 24 years age bracket for the primary householder. A total of 146 households (3.8%) fall into this category. Meanwhile, the 65+ years age bracket for the primary householder has the lowest median household income of $28,806, with 1,456 households (37.7%) in this group.
| Income Bracket | # Households | Median Income |
| 15 to 24 Years | 146 (3.8%) | $60,034 |
| 25 to 44 Years | 946 (24.5%) | $38,193 |
| 45 to 64 Years | 1,314 (34.0%) | $39,352 |
| 65+ Years | 1,456 (37.7%) | $28,806 |
| Total | 3,862 (100.0%) | $35,798 |
Poverty in Middlesborough
Income Below Poverty by Sex and Age in Middlesborough
With 30.2% poverty level for males and 28.1% for females among the residents of Middlesborough, 6 to 11 year old males and 15 year old females are the most vulnerable to poverty, with 271 males (54.1%) and 37 females (77.1%) in their respective age groups living below the poverty level.
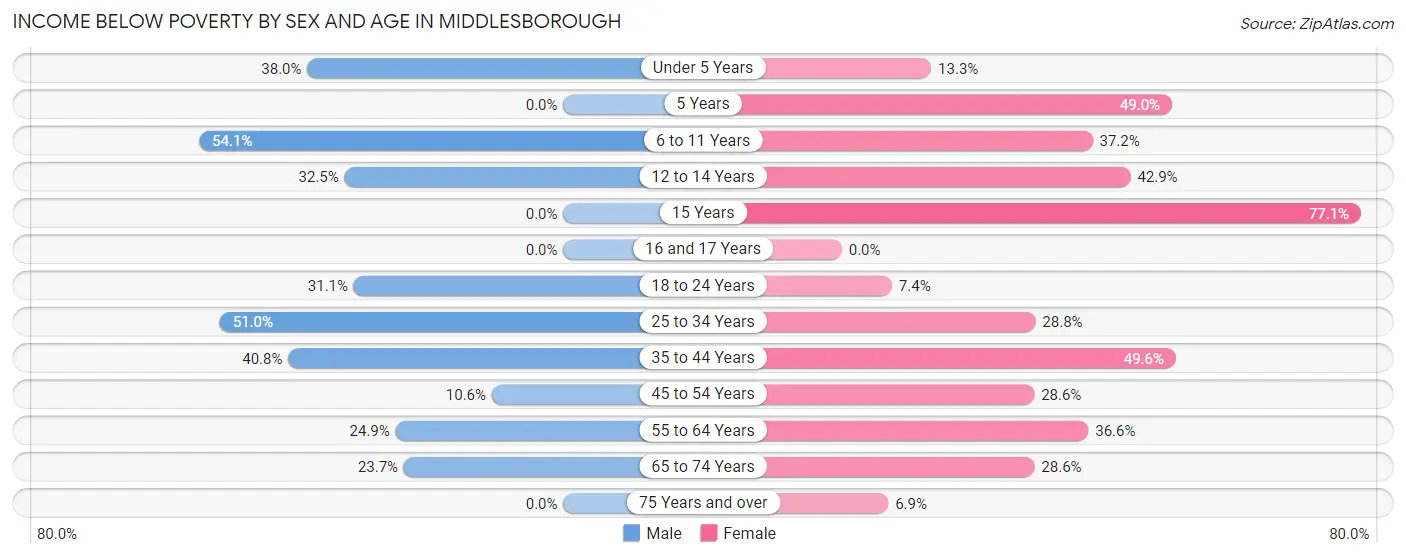
| Age Bracket | Male | Female |
| Under 5 Years | 149 (38.0%) | 28 (13.3%) |
| 5 Years | 0 (0.0%) | 25 (49.0%) |
| 6 to 11 Years | 271 (54.1%) | 105 (37.2%) |
| 12 to 14 Years | 38 (32.5%) | 39 (42.9%) |
| 15 Years | 0 (0.0%) | 37 (77.1%) |
| 16 and 17 Years | 0 (0.0%) | 0 (0.0%) |
| 18 to 24 Years | 121 (31.1%) | 32 (7.4%) |
| 25 to 34 Years | 328 (51.0%) | 161 (28.7%) |
| 35 to 44 Years | 194 (40.8%) | 239 (49.6%) |
| 45 to 54 Years | 48 (10.6%) | 166 (28.6%) |
| 55 to 64 Years | 162 (24.9%) | 250 (36.6%) |
| 65 to 74 Years | 102 (23.7%) | 163 (28.6%) |
| 75 Years and over | 0 (0.0%) | 37 (6.9%) |
| Total | 1,413 (30.2%) | 1,282 (28.1%) |
Income Above Poverty by Sex and Age in Middlesborough
According to the poverty statistics in Middlesborough, males aged 5 years and females aged 16 and 17 years are the age groups that are most secure financially, with 100.0% of males and 100.0% of females in these age groups living above the poverty line.
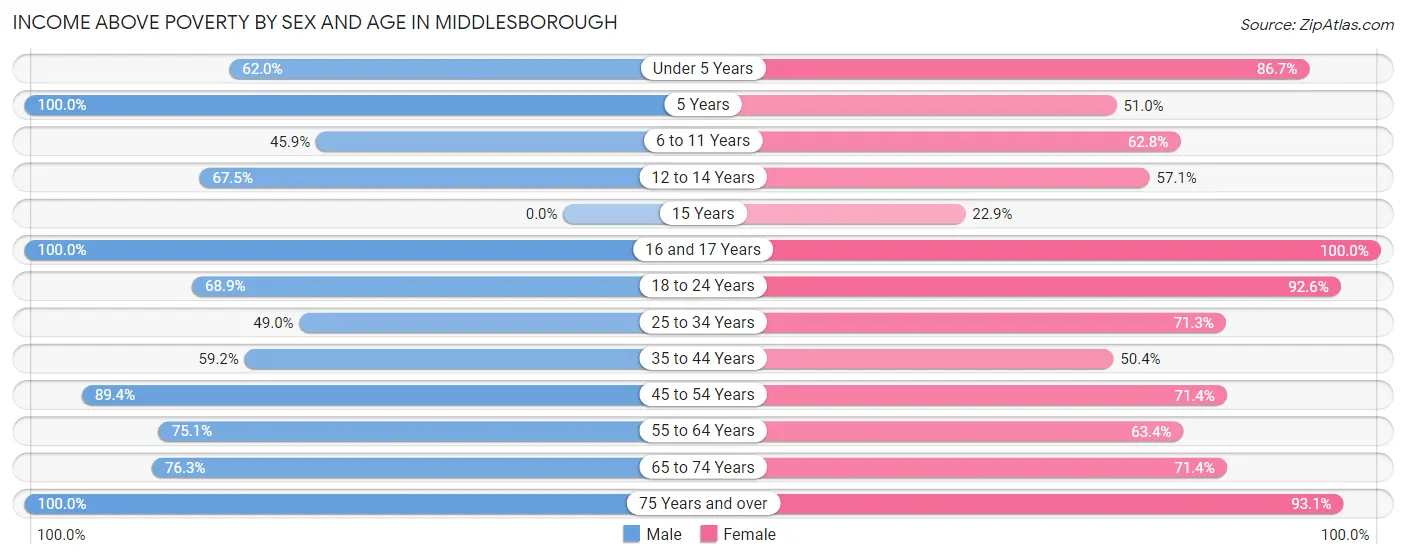
| Age Bracket | Male | Female |
| Under 5 Years | 243 (62.0%) | 183 (86.7%) |
| 5 Years | 166 (100.0%) | 26 (51.0%) |
| 6 to 11 Years | 230 (45.9%) | 177 (62.8%) |
| 12 to 14 Years | 79 (67.5%) | 52 (57.1%) |
| 15 Years | 0 (0.0%) | 11 (22.9%) |
| 16 and 17 Years | 151 (100.0%) | 44 (100.0%) |
| 18 to 24 Years | 268 (68.9%) | 398 (92.6%) |
| 25 to 34 Years | 315 (49.0%) | 399 (71.3%) |
| 35 to 44 Years | 281 (59.2%) | 243 (50.4%) |
| 45 to 54 Years | 404 (89.4%) | 415 (71.4%) |
| 55 to 64 Years | 488 (75.1%) | 433 (63.4%) |
| 65 to 74 Years | 329 (76.3%) | 407 (71.4%) |
| 75 Years and over | 308 (100.0%) | 500 (93.1%) |
| Total | 3,262 (69.8%) | 3,288 (72.0%) |
Income Below Poverty Among Married-Couple Families in Middlesborough
The poverty statistics for married-couple families in Middlesborough show that 14.5% or 195 of the total 1,344 families live below the poverty line. Families with 3 or 4 children have the highest poverty rate of 49.6%, comprising of 68 families. On the other hand, families with 1 or 2 children have the lowest poverty rate of 5.2%, which includes 24 families.
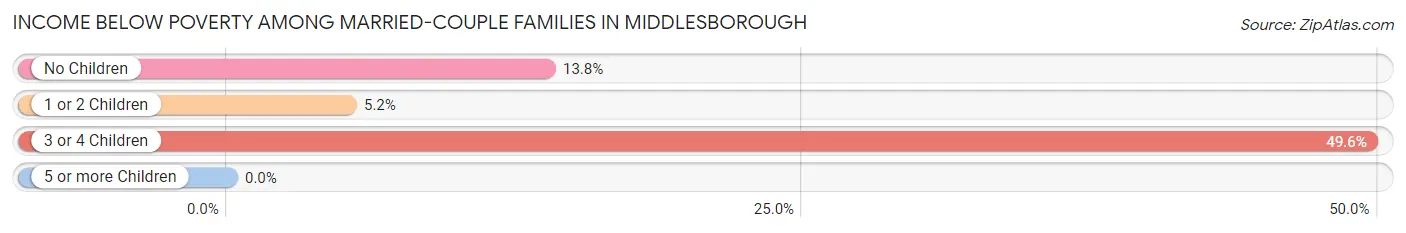
| Children | Above Poverty | Below Poverty |
| No Children | 641 (86.2%) | 103 (13.8%) |
| 1 or 2 Children | 439 (94.8%) | 24 (5.2%) |
| 3 or 4 Children | 69 (50.4%) | 68 (49.6%) |
| 5 or more Children | 0 (0.0%) | 0 (0.0%) |
| Total | 1,149 (85.5%) | 195 (14.5%) |
Income Below Poverty Among Single-Parent Households in Middlesborough
According to the poverty data in Middlesborough, 32.4% or 106 single-father households and 35.0% or 260 single-mother households are living below the poverty line. Among single-father households, those with 3 or 4 children have the highest poverty rate, with 11 households (100.0%) experiencing poverty. Likewise, among single-mother households, those with 3 or 4 children have the highest poverty rate, with 43 households (64.2%) falling below the poverty line.
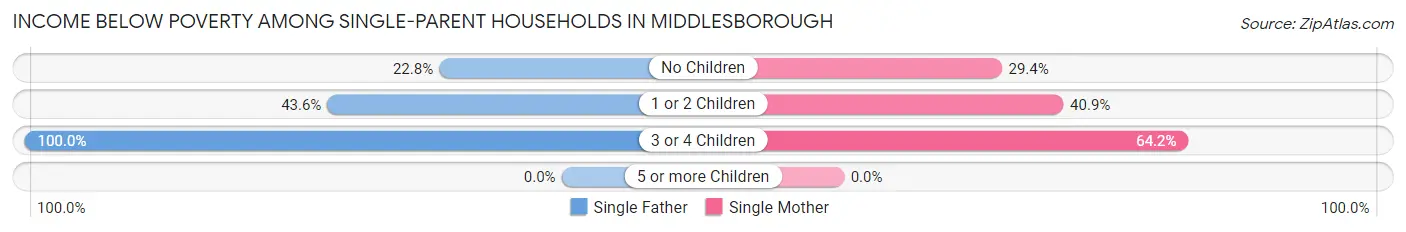
| Children | Single Father | Single Mother |
| No Children | 47 (22.8%) | 152 (29.4%) |
| 1 or 2 Children | 48 (43.6%) | 65 (40.9%) |
| 3 or 4 Children | 11 (100.0%) | 43 (64.2%) |
| 5 or more Children | 0 (0.0%) | 0 (0.0%) |
| Total | 106 (32.4%) | 260 (35.0%) |
Income Below Poverty Among Married-Couple vs Single-Parent Households in Middlesborough
The poverty data for Middlesborough shows that 195 of the married-couple family households (14.5%) and 366 of the single-parent households (34.2%) are living below the poverty level. Within the married-couple family households, those with 3 or 4 children have the highest poverty rate, with 68 households (49.6%) falling below the poverty line. Among the single-parent households, those with 3 or 4 children have the highest poverty rate, with 54 household (69.2%) living below poverty.
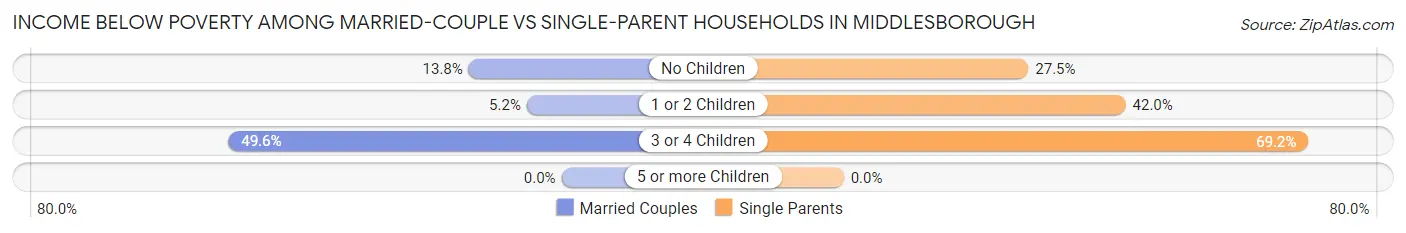
| Children | Married-Couple Families | Single-Parent Households |
| No Children | 103 (13.8%) | 199 (27.5%) |
| 1 or 2 Children | 24 (5.2%) | 113 (42.0%) |
| 3 or 4 Children | 68 (49.6%) | 54 (69.2%) |
| 5 or more Children | 0 (0.0%) | 0 (0.0%) |
| Total | 195 (14.5%) | 366 (34.2%) |
Race in Middlesborough
The most populous races in Middlesborough are White / Caucasian (8,655 | 92.2%), Two or more Races (370 | 3.9%), and Black / African American (310 | 3.3%).
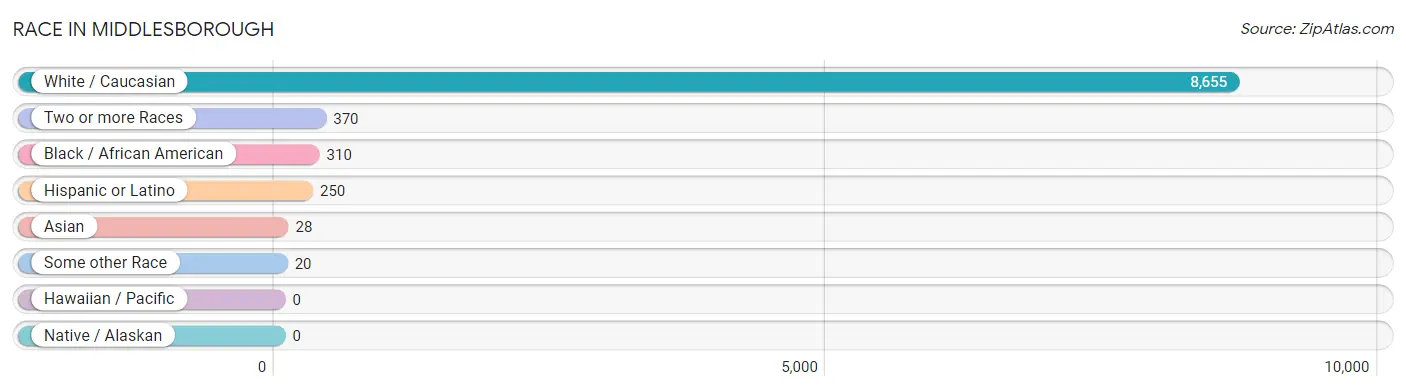
| Race | # Population | % Population |
| Asian | 28 | 0.3% |
| Black / African American | 310 | 3.3% |
| Hawaiian / Pacific | 0 | 0.0% |
| Hispanic or Latino | 250 | 2.7% |
| Native / Alaskan | 0 | 0.0% |
| White / Caucasian | 8,655 | 92.2% |
| Two or more Races | 370 | 3.9% |
| Some other Race | 20 | 0.2% |
| Total | 9,383 | 100.0% |
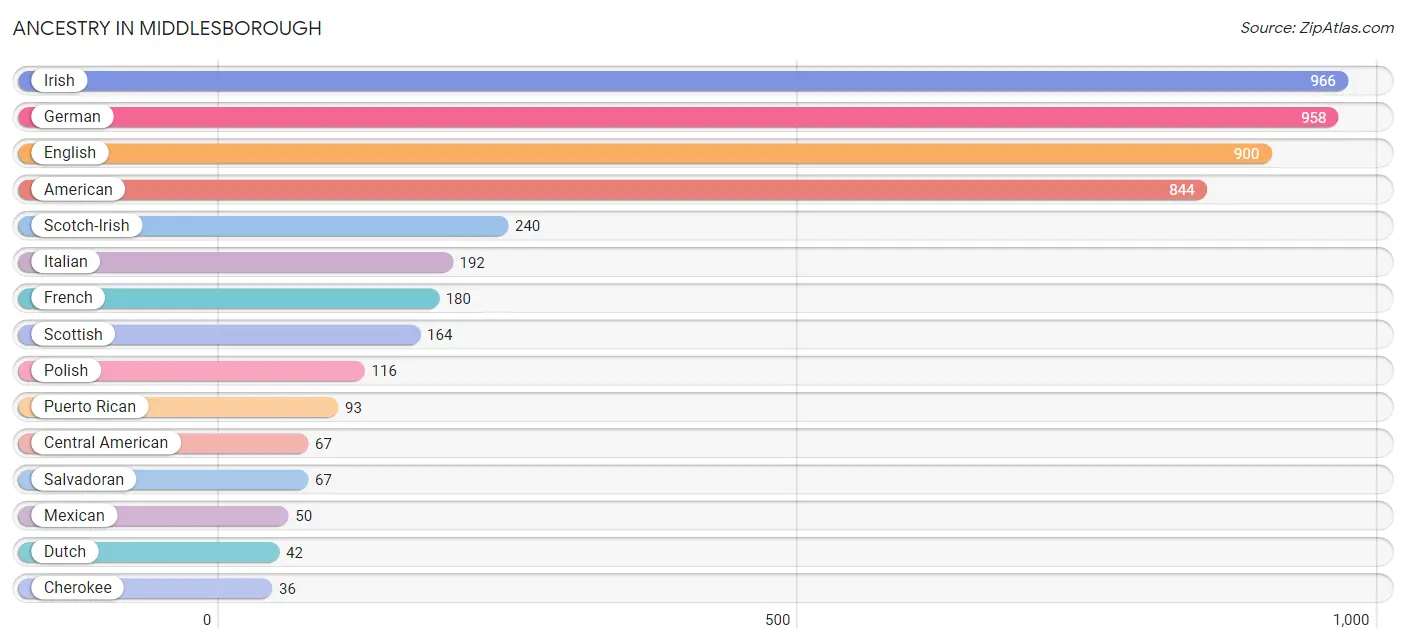
Ancestry in Middlesborough
The most populous ancestries reported in Middlesborough are Irish (966 | 10.3%), German (958 | 10.2%), English (900 | 9.6%), American (844 | 9.0%), and Scotch-Irish (240 | 2.6%), together accounting for 41.6% of all Middlesborough residents.
| Ancestry | # Population | % Population |
| American | 844 | 9.0% |
| British | 3 | 0.0% |
| Burmese | 5 | 0.1% |
| Central American | 67 | 0.7% |
| Cherokee | 36 | 0.4% |
| Dutch | 42 | 0.4% |
| English | 900 | 9.6% |
| European | 27 | 0.3% |
| French | 180 | 1.9% |
| German | 958 | 10.2% |
| Irish | 966 | 10.3% |
| Italian | 192 | 2.1% |
| Korean | 23 | 0.3% |
| Mexican | 50 | 0.5% |
| Norwegian | 18 | 0.2% |
| Polish | 116 | 1.2% |
| Portuguese | 1 | 0.0% |
| Puerto Rican | 93 | 1.0% |
| Salvadoran | 67 | 0.7% |
| Scandinavian | 16 | 0.2% |
| Scotch-Irish | 240 | 2.6% |
| Scottish | 164 | 1.8% |
| Subsaharan African | 10 | 0.1% |
| Swedish | 29 | 0.3% |
| Welsh | 11 | 0.1% | View All 25 Rows |
Immigrants in Middlesborough
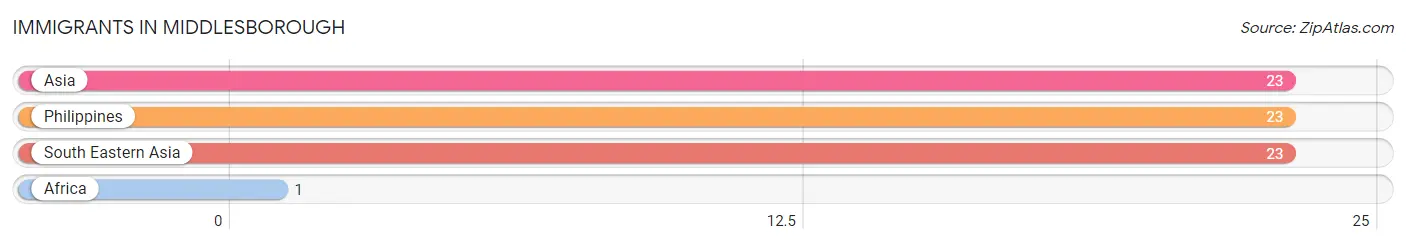
The most numerous immigrant groups reported in Middlesborough came from Asia (23 | 0.3%), Philippines (23 | 0.3%), South Eastern Asia (23 | 0.3%), and Africa (1 | 0.0%), together accounting for 0.8% of all Middlesborough residents.
| Immigration Origin | # Population | % Population |
| Africa | 1 | 0.0% |
| Asia | 23 | 0.3% |
| Philippines | 23 | 0.3% |
| South Eastern Asia | 23 | 0.3% | View All 4 Rows |
Sex and Age in Middlesborough
Sex and Age in Middlesborough
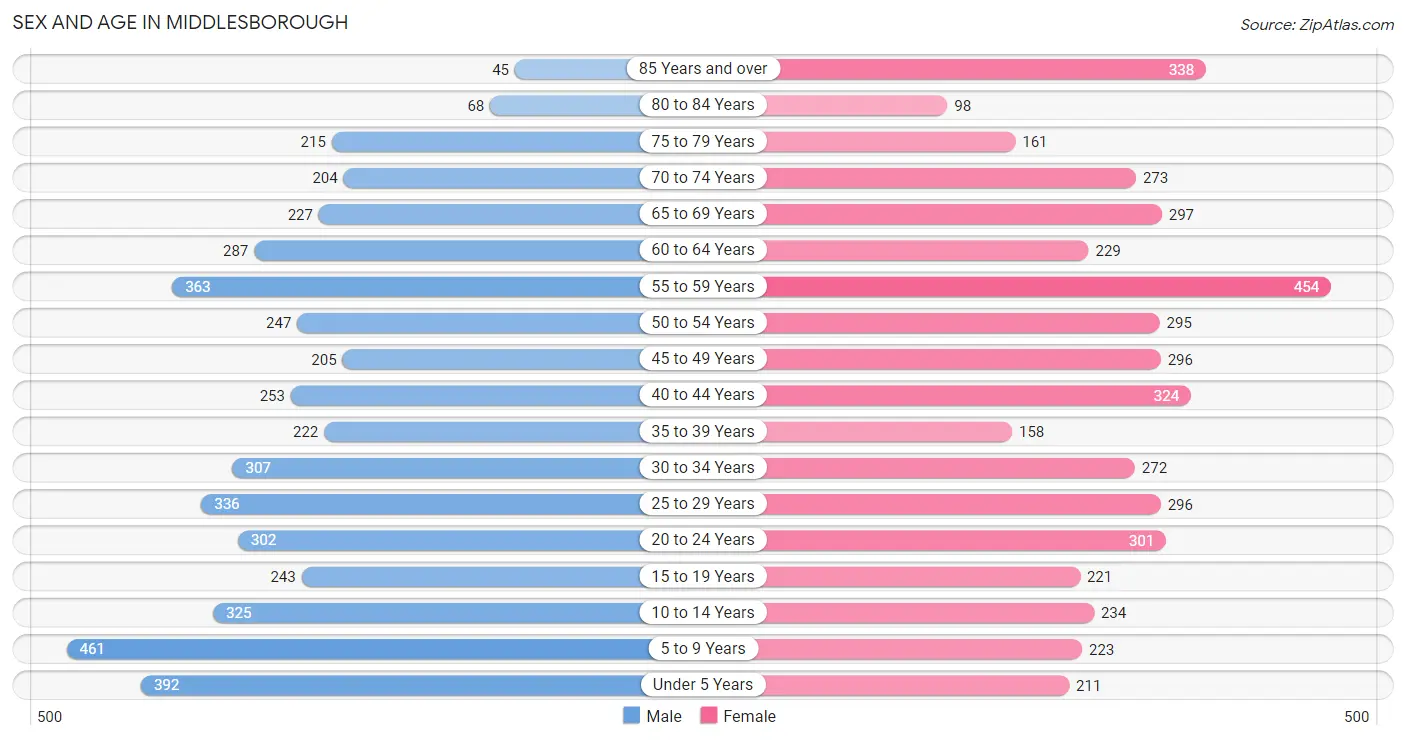
The most populous age groups in Middlesborough are 5 to 9 Years (461 | 9.8%) for men and 55 to 59 Years (454 | 9.7%) for women.
| Age Bracket | Male | Female |
| Under 5 Years | 392 (8.3%) | 211 (4.5%) |
| 5 to 9 Years | 461 (9.8%) | 223 (4.8%) |
| 10 to 14 Years | 325 (6.9%) | 234 (5.0%) |
| 15 to 19 Years | 243 (5.2%) | 221 (4.7%) |
| 20 to 24 Years | 302 (6.4%) | 301 (6.4%) |
| 25 to 29 Years | 336 (7.1%) | 296 (6.3%) |
| 30 to 34 Years | 307 (6.5%) | 272 (5.8%) |
| 35 to 39 Years | 222 (4.7%) | 158 (3.4%) |
| 40 to 44 Years | 253 (5.4%) | 324 (6.9%) |
| 45 to 49 Years | 205 (4.4%) | 296 (6.3%) |
| 50 to 54 Years | 247 (5.2%) | 295 (6.3%) |
| 55 to 59 Years | 363 (7.7%) | 454 (9.7%) |
| 60 to 64 Years | 287 (6.1%) | 229 (4.9%) |
| 65 to 69 Years | 227 (4.8%) | 297 (6.3%) |
| 70 to 74 Years | 204 (4.3%) | 273 (5.8%) |
| 75 to 79 Years | 215 (4.6%) | 161 (3.4%) |
| 80 to 84 Years | 68 (1.5%) | 98 (2.1%) |
| 85 Years and over | 45 (1.0%) | 338 (7.2%) |
| Total | 4,702 (100.0%) | 4,681 (100.0%) |
Families and Households in Middlesborough
Median Family Size in Middlesborough
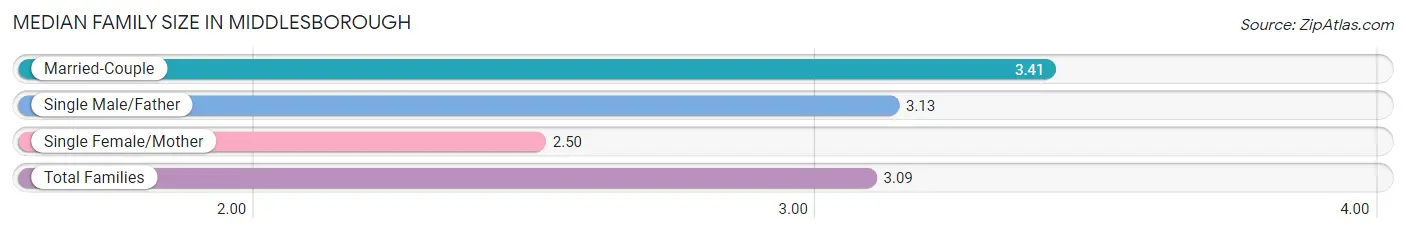
The median family size in Middlesborough is 3.09 persons per family, with married-couple families (1,344 | 55.7%) accounting for the largest median family size of 3.41 persons per family. On the other hand, single female/mother families (743 | 30.8%) represent the smallest median family size with 2.50 persons per family.
| Family Type | # Families | Family Size |
| Married-Couple | 1,344 (55.7%) | 3.41 |
| Single Male/Father | 327 (13.6%) | 3.13 |
| Single Female/Mother | 743 (30.8%) | 2.50 |
| Total Families | 2,414 (100.0%) | 3.09 |
Median Household Size in Middlesborough
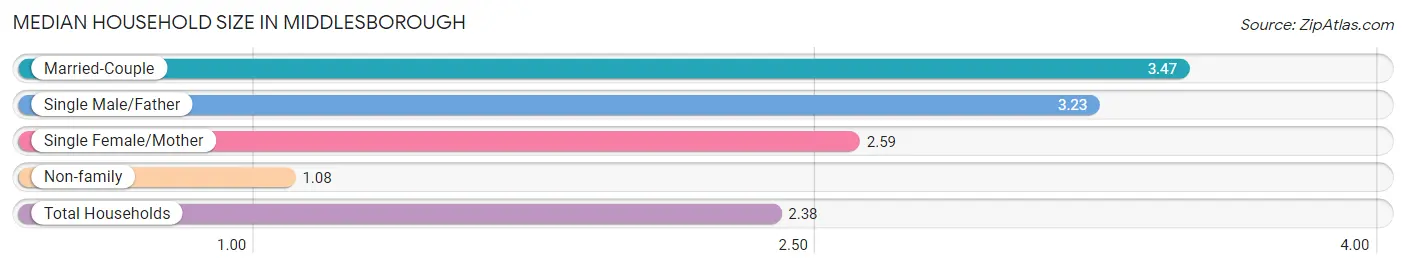
The median household size in Middlesborough is 2.38 persons per household, with married-couple households (1,344 | 34.8%) accounting for the largest median household size of 3.47 persons per household. non-family households (1,448 | 37.5%) represent the smallest median household size with 1.08 persons per household.
| Household Type | # Households | Household Size |
| Married-Couple | 1,344 (34.8%) | 3.47 |
| Single Male/Father | 327 (8.5%) | 3.23 |
| Single Female/Mother | 743 (19.2%) | 2.59 |
| Non-family | 1,448 (37.5%) | 1.08 |
| Total Households | 3,862 (100.0%) | 2.38 |
Household Size by Marriage Status in Middlesborough
Out of a total of 3,862 households in Middlesborough, 2,414 (62.5%) are family households, while 1,448 (37.5%) are nonfamily households. The most numerous type of family households are 2-person households, comprising 1,437, and the most common type of nonfamily households are 1-person households, comprising 1,357.
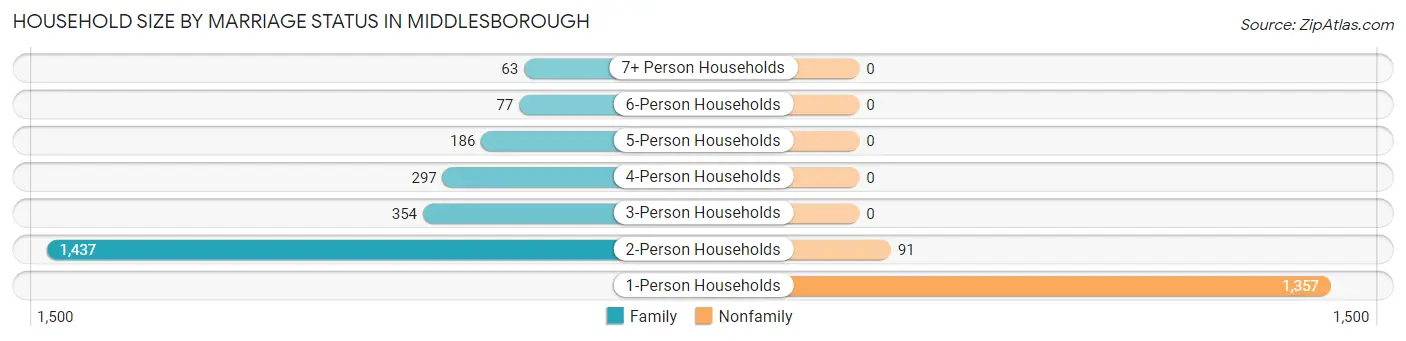
| Household Size | Family Households | Nonfamily Households |
| 1-Person Households | - | 1,357 (35.1%) |
| 2-Person Households | 1,437 (37.2%) | 91 (2.4%) |
| 3-Person Households | 354 (9.2%) | 0 (0.0%) |
| 4-Person Households | 297 (7.7%) | 0 (0.0%) |
| 5-Person Households | 186 (4.8%) | 0 (0.0%) |
| 6-Person Households | 77 (2.0%) | 0 (0.0%) |
| 7+ Person Households | 63 (1.6%) | 0 (0.0%) |
| Total | 2,414 (62.5%) | 1,448 (37.5%) |
Female Fertility in Middlesborough
Fertility by Age in Middlesborough
Average fertility rate in Middlesborough is 52.0 births per 1,000 women. Women in the age bracket of 20 to 34 years have the highest fertility rate with 108.0 births per 1,000 women. Women in the age bracket of 20 to 34 years acount for 92.2% of all women with births.
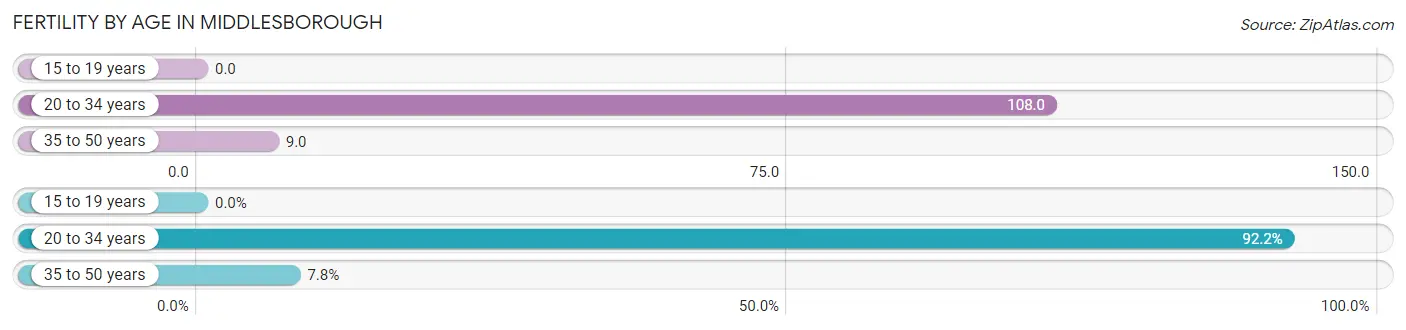
| Age Bracket | Women with Births | Births / 1,000 Women |
| 15 to 19 years | 0 (0.0%) | 0.0 |
| 20 to 34 years | 94 (92.2%) | 108.0 |
| 35 to 50 years | 8 (7.8%) | 9.0 |
| Total | 102 (100.0%) | 52.0 |
Fertility by Age by Marriage Status in Middlesborough
75.5% of women with births (102) in Middlesborough are married. The highest percentage of unmarried women with births falls into 35 to 50 years age bracket with 62.5% of them unmarried at the time of birth, while the lowest percentage of unmarried women with births belong to 20 to 34 years age bracket with 21.3% of them unmarried.
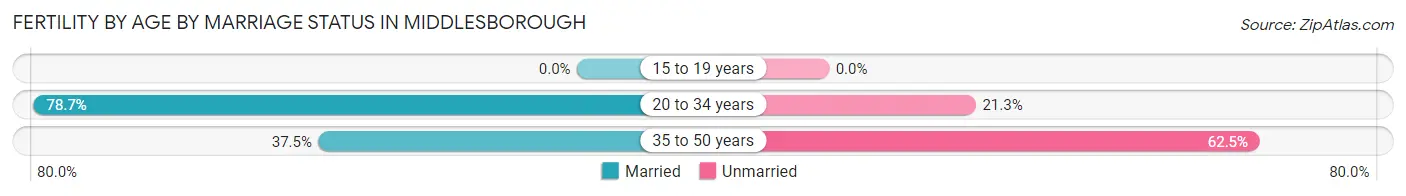
| Age Bracket | Married | Unmarried |
| 15 to 19 years | 0 (0.0%) | 0 (0.0%) |
| 20 to 34 years | 74 (78.7%) | 20 (21.3%) |
| 35 to 50 years | 3 (37.5%) | 5 (62.5%) |
| Total | 77 (75.5%) | 25 (24.5%) |
Fertility by Education in Middlesborough
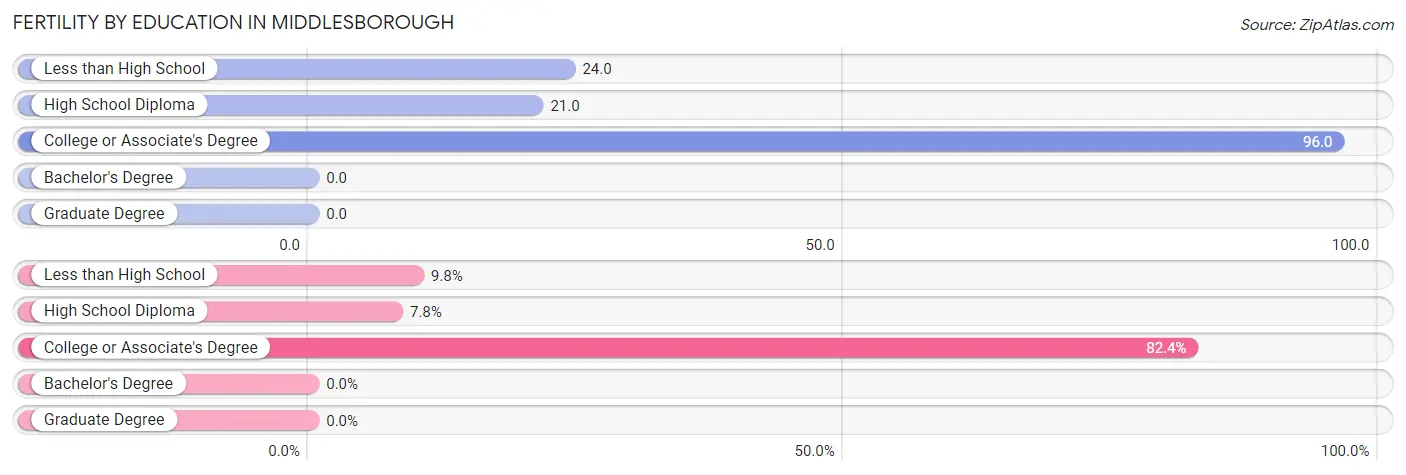
| Educational Attainment | Women with Births | Births / 1,000 Women |
| Less than High School | 10 (9.8%) | 24.0 |
| High School Diploma | 8 (7.8%) | 21.0 |
| College or Associate's Degree | 84 (82.4%) | 96.0 |
| Bachelor's Degree | 0 (0.0%) | 0.0 |
| Graduate Degree | 0 (0.0%) | 0.0 |
| Total | 102 (100.0%) | 52.0 |
Fertility by Education by Marriage Status in Middlesborough
24.5% of women with births in Middlesborough are unmarried. Women with the educational attainment of college or associate's degree are most likely to be married with 88.1% of them married at childbirth, while women with the educational attainment of less than high school are least likely to be married with 100.0% of them unmarried at childbirth.
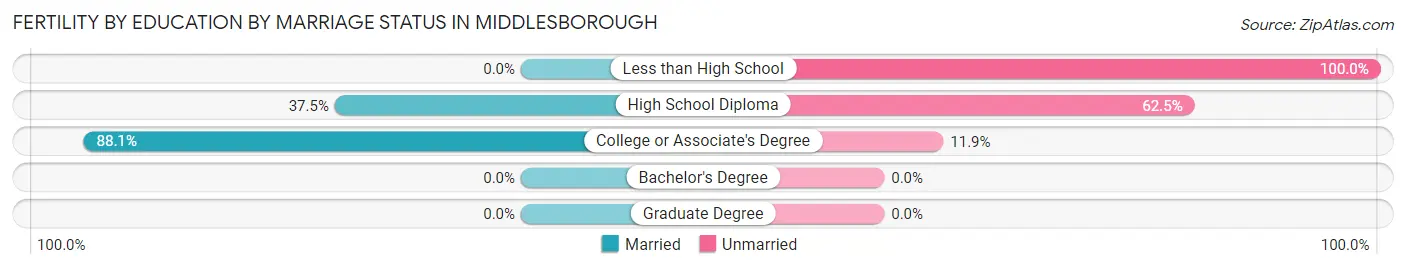
| Educational Attainment | Married | Unmarried |
| Less than High School | 0 (0.0%) | 10 (100.0%) |
| High School Diploma | 3 (37.5%) | 5 (62.5%) |
| College or Associate's Degree | 74 (88.1%) | 10 (11.9%) |
| Bachelor's Degree | 0 (0.0%) | 0 (0.0%) |
| Graduate Degree | 0 (0.0%) | 0 (0.0%) |
| Total | 77 (75.5%) | 25 (24.5%) |
Employment Characteristics in Middlesborough
Employment by Class of Employer in Middlesborough
Among the 2,601 employed individuals in Middlesborough, private company employees (1,516 | 58.3%), local government employees (386 | 14.8%), and not-for-profit organizations (322 | 12.4%) make up the most common classes of employment.
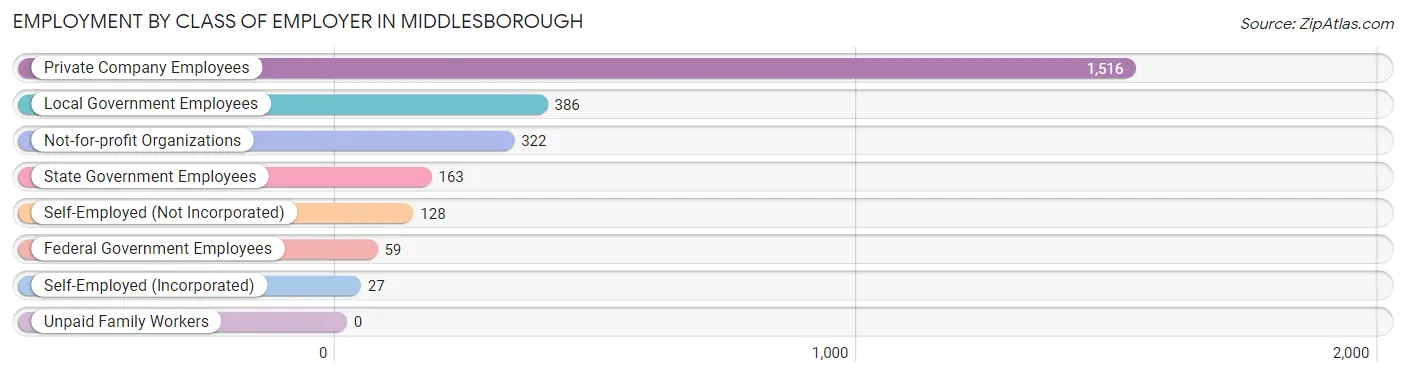
| Employer Class | # Employees | % Employees |
| Private Company Employees | 1,516 | 58.3% |
| Self-Employed (Incorporated) | 27 | 1.0% |
| Self-Employed (Not Incorporated) | 128 | 4.9% |
| Not-for-profit Organizations | 322 | 12.4% |
| Local Government Employees | 386 | 14.8% |
| State Government Employees | 163 | 6.3% |
| Federal Government Employees | 59 | 2.3% |
| Unpaid Family Workers | 0 | 0.0% |
| Total | 2,601 | 100.0% |
Employment Status by Age in Middlesborough
According to the labor force statistics for Middlesborough, out of the total population over 16 years of age (7,489), 41.6% or 3,115 individuals are in the labor force, with 8.8% or 274 of them unemployed. The age group with the highest labor force participation rate is 25 to 29 years, with 74.4% or 470 individuals in the labor force. Within the labor force, the 25 to 29 years age range has the highest percentage of unemployed individuals, with 24.9% or 117 of them being unemployed.
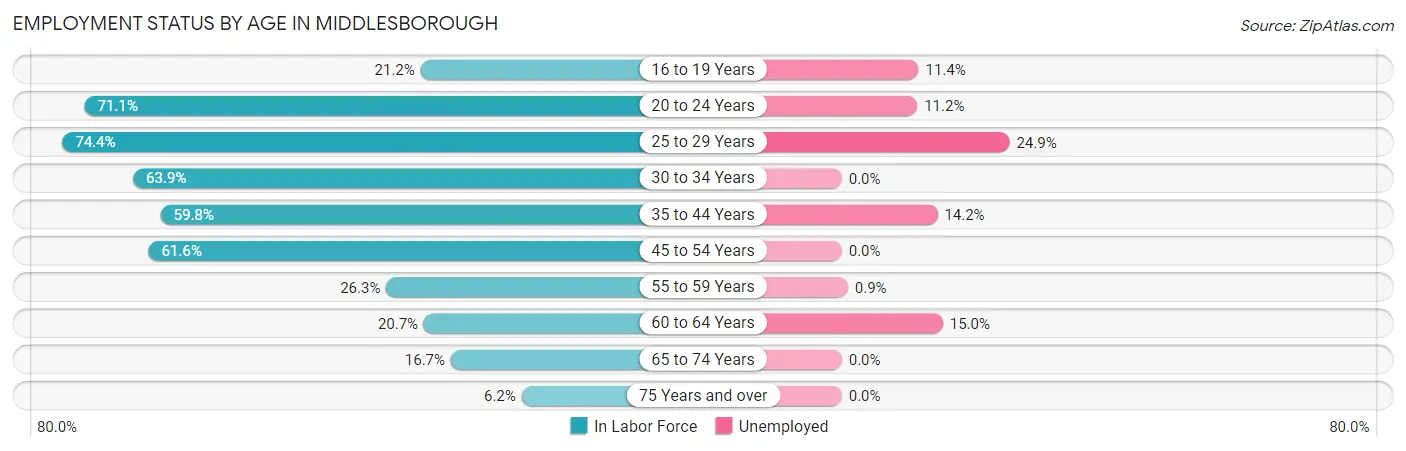
| Age Bracket | In Labor Force | Unemployed |
| 16 to 19 Years | 88 (21.2%) | 10 (11.4%) |
| 20 to 24 Years | 429 (71.1%) | 48 (11.2%) |
| 25 to 29 Years | 470 (74.4%) | 117 (24.9%) |
| 30 to 34 Years | 370 (63.9%) | 0 (0.0%) |
| 35 to 44 Years | 572 (59.8%) | 81 (14.2%) |
| 45 to 54 Years | 642 (61.6%) | 0 (0.0%) |
| 55 to 59 Years | 215 (26.3%) | 2 (0.9%) |
| 60 to 64 Years | 107 (20.7%) | 16 (15.0%) |
| 65 to 74 Years | 167 (16.7%) | 0 (0.0%) |
| 75 Years and over | 57 (6.2%) | 0 (0.0%) |
| Total | 3,115 (41.6%) | 274 (8.8%) |
Employment Status by Educational Attainment in Middlesborough
According to labor force statistics for Middlesborough, 52.3% of individuals (2,377) out of the total population between 25 and 64 years of age (4,544) are in the labor force, with 9.1% or 216 of them being unemployed. The group with the highest labor force participation rate are those with the educational attainment of bachelor's degree or higher, with 77.6% or 447 individuals in the labor force. Within the labor force, individuals with college / associate degree education have the highest percentage of unemployment, with 16.1% or 169 of them being unemployed.
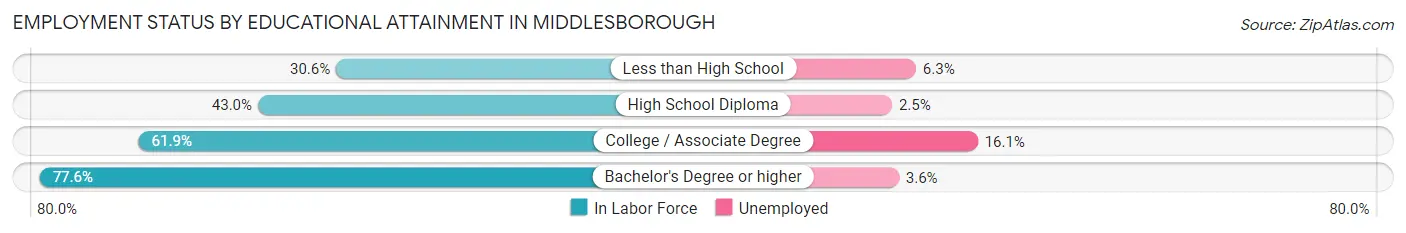
| Educational Attainment | In Labor Force | Unemployed |
| Less than High School | 239 (30.6%) | 49 (6.3%) |
| High School Diploma | 639 (43.0%) | 37 (2.5%) |
| College / Associate Degree | 1,052 (61.9%) | 274 (16.1%) |
| Bachelor's Degree or higher | 447 (77.6%) | 21 (3.6%) |
| Total | 2,377 (52.3%) | 414 (9.1%) |
Employment Occupations by Sex in Middlesborough
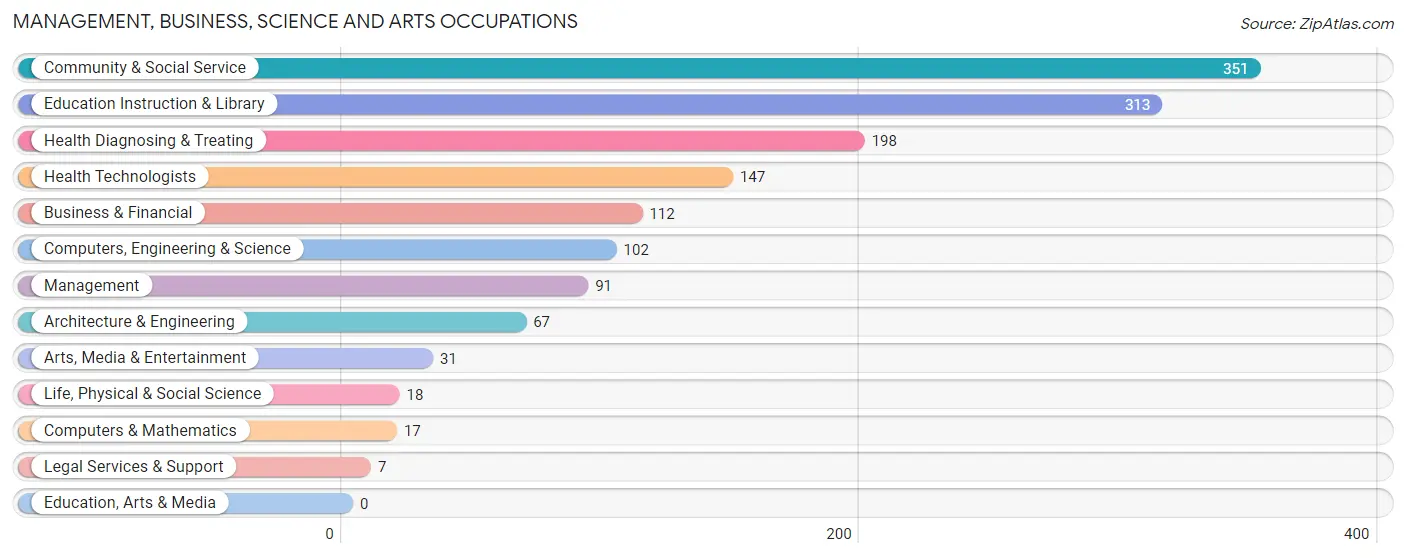
Management, Business, Science and Arts Occupations
The most common Management, Business, Science and Arts occupations in Middlesborough are Community & Social Service (351 | 12.3%), Education Instruction & Library (313 | 11.0%), Health Diagnosing & Treating (198 | 7.0%), Health Technologists (147 | 5.2%), and Business & Financial (112 | 3.9%).
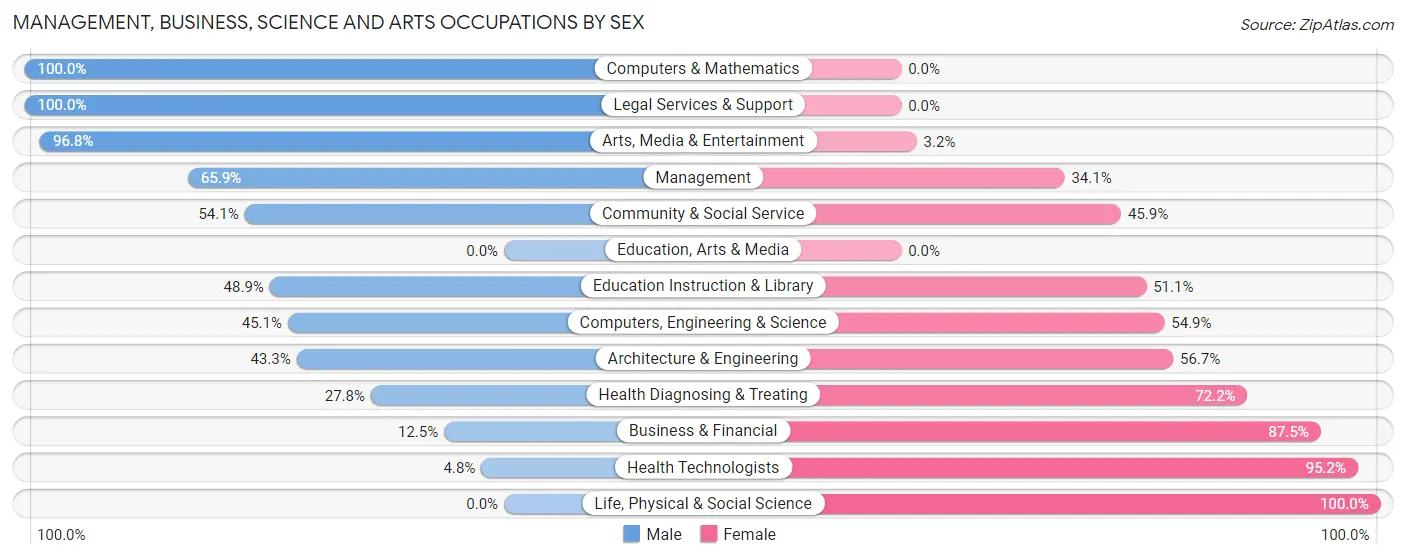
Management, Business, Science and Arts Occupations by Sex
Within the Management, Business, Science and Arts occupations in Middlesborough, the most male-oriented occupations are Computers & Mathematics (100.0%), Legal Services & Support (100.0%), and Arts, Media & Entertainment (96.8%), while the most female-oriented occupations are Life, Physical & Social Science (100.0%), Health Technologists (95.2%), and Business & Financial (87.5%).
| Occupation | Male | Female |
| Management | 60 (65.9%) | 31 (34.1%) |
| Business & Financial | 14 (12.5%) | 98 (87.5%) |
| Computers, Engineering & Science | 46 (45.1%) | 56 (54.9%) |
| Computers & Mathematics | 17 (100.0%) | 0 (0.0%) |
| Architecture & Engineering | 29 (43.3%) | 38 (56.7%) |
| Life, Physical & Social Science | 0 (0.0%) | 18 (100.0%) |
| Community & Social Service | 190 (54.1%) | 161 (45.9%) |
| Education, Arts & Media | 0 (0.0%) | 0 (0.0%) |
| Legal Services & Support | 7 (100.0%) | 0 (0.0%) |
| Education Instruction & Library | 153 (48.9%) | 160 (51.1%) |
| Arts, Media & Entertainment | 30 (96.8%) | 1 (3.2%) |
| Health Diagnosing & Treating | 55 (27.8%) | 143 (72.2%) |
| Health Technologists | 7 (4.8%) | 140 (95.2%) |
| Total (Category) | 365 (42.7%) | 489 (57.3%) |
| Total (Overall) | 1,401 (49.3%) | 1,443 (50.7%) |
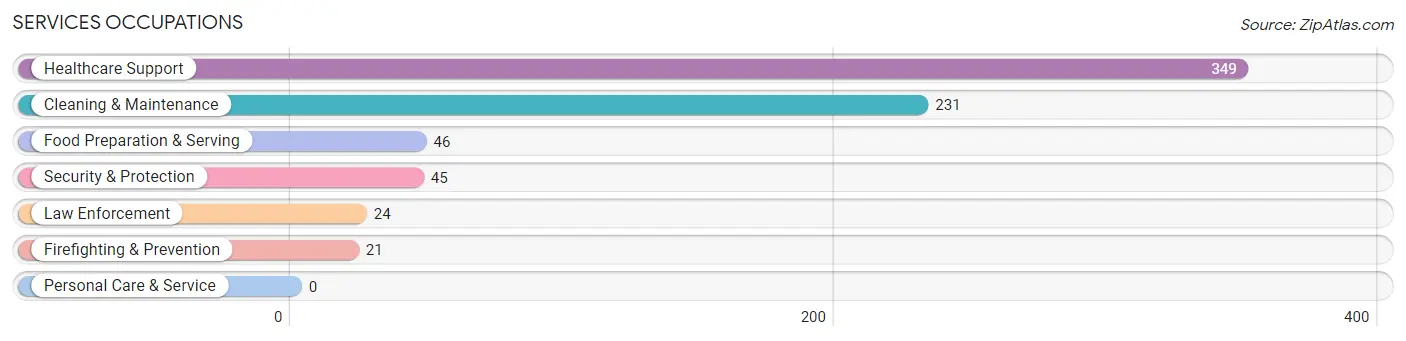
Services Occupations
The most common Services occupations in Middlesborough are Healthcare Support (349 | 12.3%), Cleaning & Maintenance (231 | 8.1%), Food Preparation & Serving (46 | 1.6%), Security & Protection (45 | 1.6%), and Law Enforcement (24 | 0.8%).
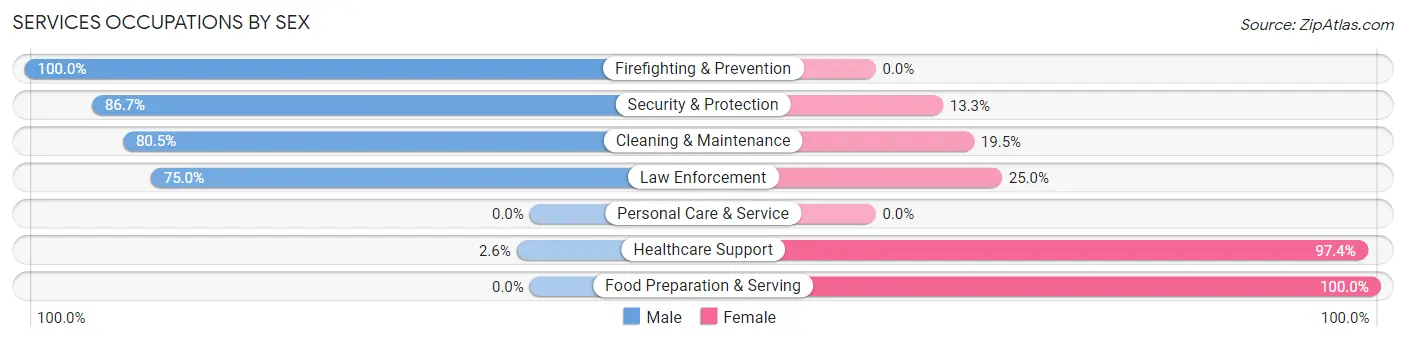
Services Occupations by Sex
Within the Services occupations in Middlesborough, the most male-oriented occupations are Firefighting & Prevention (100.0%), Security & Protection (86.7%), and Cleaning & Maintenance (80.5%), while the most female-oriented occupations are Food Preparation & Serving (100.0%), Healthcare Support (97.4%), and Law Enforcement (25.0%).
| Occupation | Male | Female |
| Healthcare Support | 9 (2.6%) | 340 (97.4%) |
| Security & Protection | 39 (86.7%) | 6 (13.3%) |
| Firefighting & Prevention | 21 (100.0%) | 0 (0.0%) |
| Law Enforcement | 18 (75.0%) | 6 (25.0%) |
| Food Preparation & Serving | 0 (0.0%) | 46 (100.0%) |
| Cleaning & Maintenance | 186 (80.5%) | 45 (19.5%) |
| Personal Care & Service | 0 (0.0%) | 0 (0.0%) |
| Total (Category) | 234 (34.9%) | 437 (65.1%) |
| Total (Overall) | 1,401 (49.3%) | 1,443 (50.7%) |
Sales and Office Occupations
The most common Sales and Office occupations in Middlesborough are Sales & Related (346 | 12.2%), and Office & Administration (266 | 9.3%).
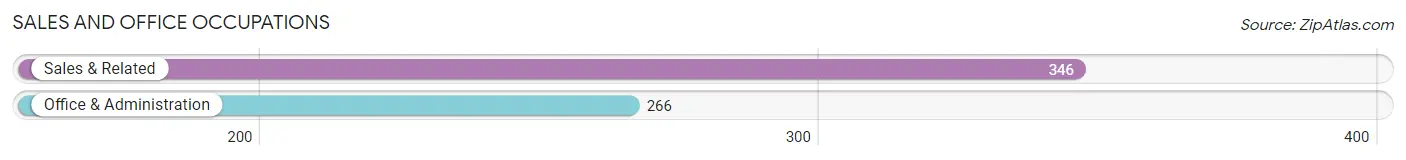
Sales and Office Occupations by Sex
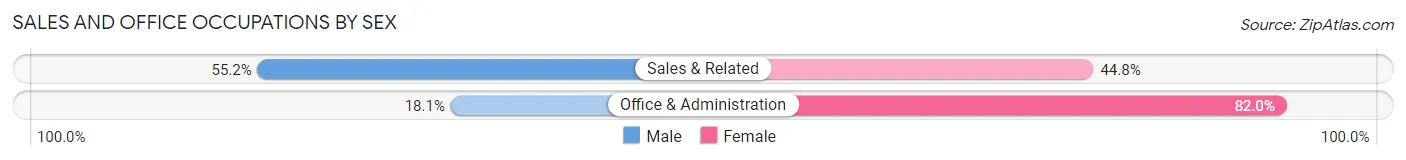
| Occupation | Male | Female |
| Sales & Related | 191 (55.2%) | 155 (44.8%) |
| Office & Administration | 48 (18.0%) | 218 (82.0%) |
| Total (Category) | 239 (39.1%) | 373 (61.0%) |
| Total (Overall) | 1,401 (49.3%) | 1,443 (50.7%) |
Natural Resources, Construction and Maintenance Occupations
The most common Natural Resources, Construction and Maintenance occupations in Middlesborough are Construction & Extraction (138 | 4.9%), and Installation, Maintenance & Repair (56 | 2.0%).
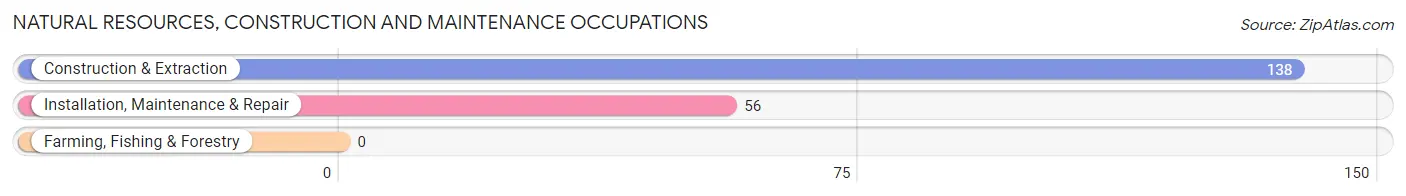
Natural Resources, Construction and Maintenance Occupations by Sex
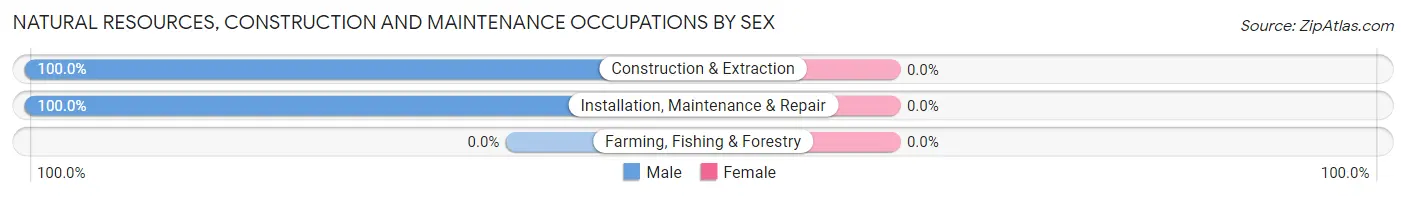
| Occupation | Male | Female |
| Farming, Fishing & Forestry | 0 (0.0%) | 0 (0.0%) |
| Construction & Extraction | 138 (100.0%) | 0 (0.0%) |
| Installation, Maintenance & Repair | 56 (100.0%) | 0 (0.0%) |
| Total (Category) | 194 (100.0%) | 0 (0.0%) |
| Total (Overall) | 1,401 (49.3%) | 1,443 (50.7%) |
Production, Transportation and Moving Occupations
The most common Production, Transportation and Moving occupations in Middlesborough are Production (226 | 8.0%), Transportation (149 | 5.2%), and Material Moving (138 | 4.9%).
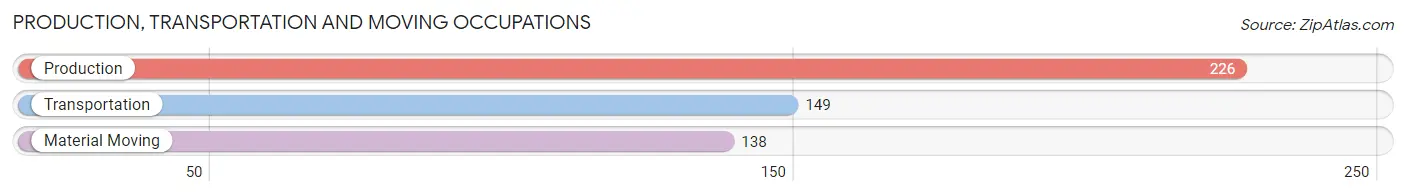
Production, Transportation and Moving Occupations by Sex
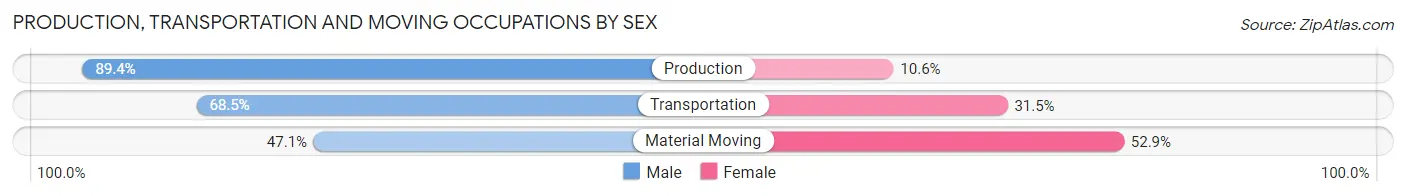
| Occupation | Male | Female |
| Production | 202 (89.4%) | 24 (10.6%) |
| Transportation | 102 (68.5%) | 47 (31.5%) |
| Material Moving | 65 (47.1%) | 73 (52.9%) |
| Total (Category) | 369 (71.9%) | 144 (28.1%) |
| Total (Overall) | 1,401 (49.3%) | 1,443 (50.7%) |
Employment Industries by Sex in Middlesborough
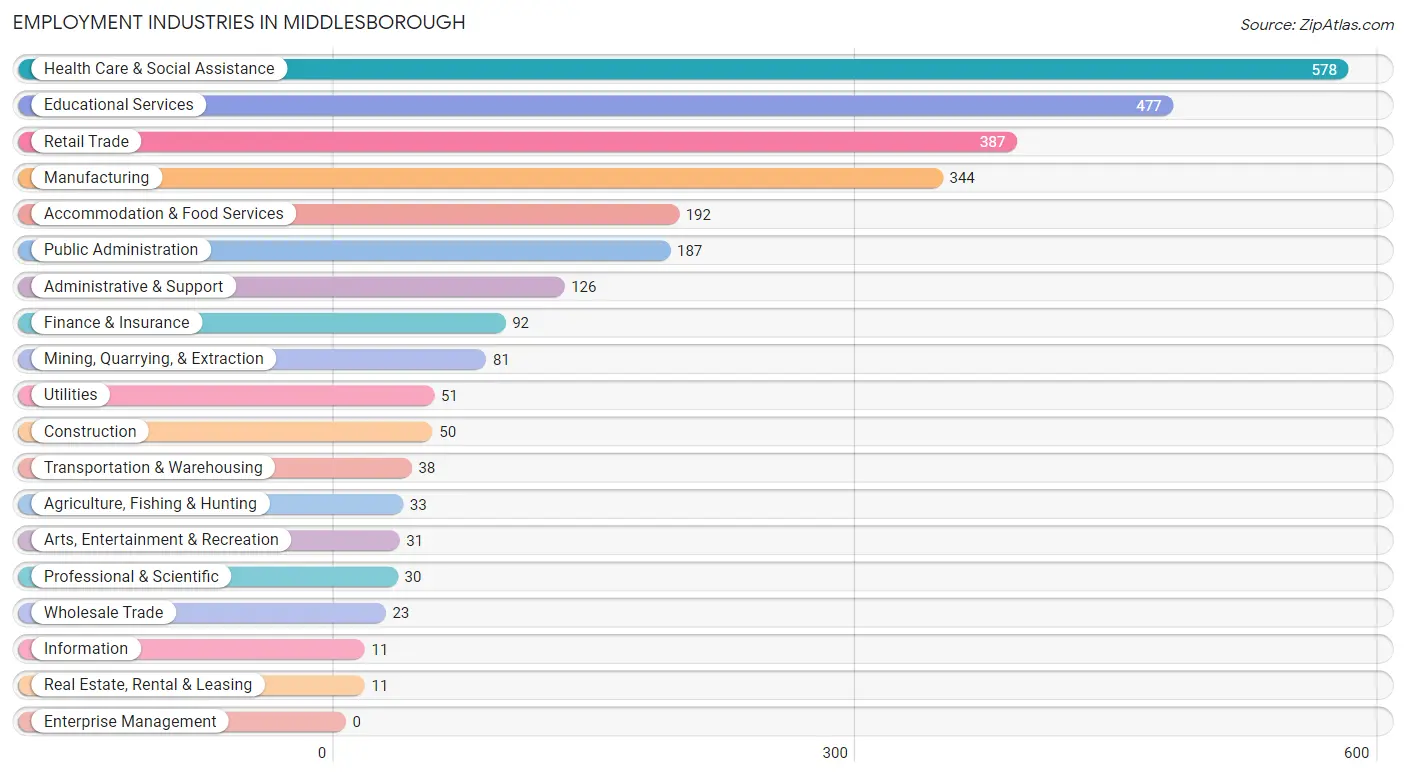
Employment Industries in Middlesborough
The major employment industries in Middlesborough include Health Care & Social Assistance (578 | 20.3%), Educational Services (477 | 16.8%), Retail Trade (387 | 13.6%), Manufacturing (344 | 12.1%), and Accommodation & Food Services (192 | 6.8%).
Employment Industries by Sex in Middlesborough
The Middlesborough industries that see more men than women are Agriculture, Fishing & Hunting (100.0%), Wholesale Trade (100.0%), and Transportation & Warehousing (100.0%), whereas the industries that tend to have a higher number of women are Real Estate, Rental & Leasing (100.0%), Professional & Scientific (100.0%), and Health Care & Social Assistance (83.7%).
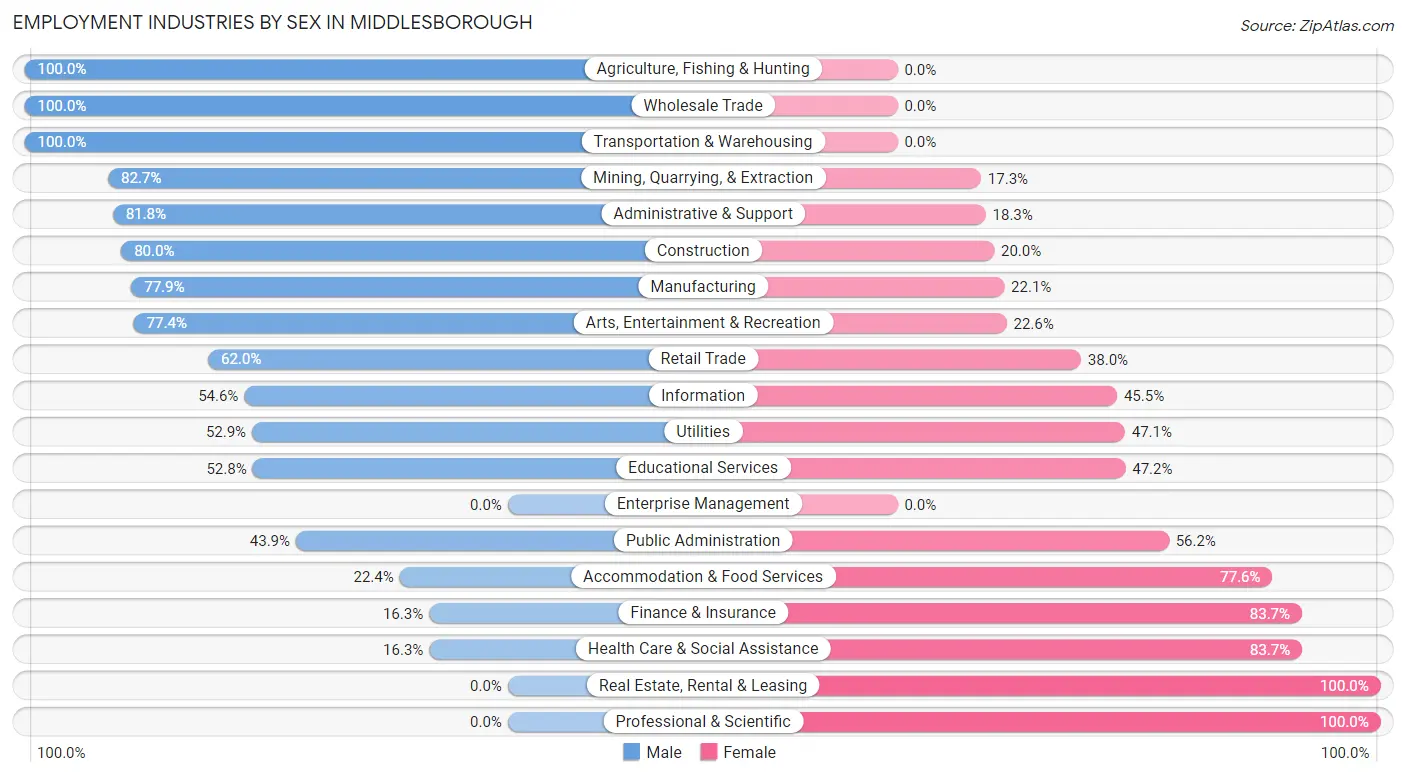
| Industry | Male | Female |
| Agriculture, Fishing & Hunting | 33 (100.0%) | 0 (0.0%) |
| Mining, Quarrying, & Extraction | 67 (82.7%) | 14 (17.3%) |
| Construction | 40 (80.0%) | 10 (20.0%) |
| Manufacturing | 268 (77.9%) | 76 (22.1%) |
| Wholesale Trade | 23 (100.0%) | 0 (0.0%) |
| Retail Trade | 240 (62.0%) | 147 (38.0%) |
| Transportation & Warehousing | 38 (100.0%) | 0 (0.0%) |
| Utilities | 27 (52.9%) | 24 (47.1%) |
| Information | 6 (54.5%) | 5 (45.5%) |
| Finance & Insurance | 15 (16.3%) | 77 (83.7%) |
| Real Estate, Rental & Leasing | 0 (0.0%) | 11 (100.0%) |
| Professional & Scientific | 0 (0.0%) | 30 (100.0%) |
| Enterprise Management | 0 (0.0%) | 0 (0.0%) |
| Administrative & Support | 103 (81.8%) | 23 (18.2%) |
| Educational Services | 252 (52.8%) | 225 (47.2%) |
| Health Care & Social Assistance | 94 (16.3%) | 484 (83.7%) |
| Arts, Entertainment & Recreation | 24 (77.4%) | 7 (22.6%) |
| Accommodation & Food Services | 43 (22.4%) | 149 (77.6%) |
| Public Administration | 82 (43.9%) | 105 (56.1%) |
| Total | 1,401 (49.3%) | 1,443 (50.7%) |
Education in Middlesborough
School Enrollment in Middlesborough
The most common levels of schooling among the 2,037 students in Middlesborough are elementary school (534 | 26.2%), high school (457 | 22.4%), and middle school (318 | 15.6%).
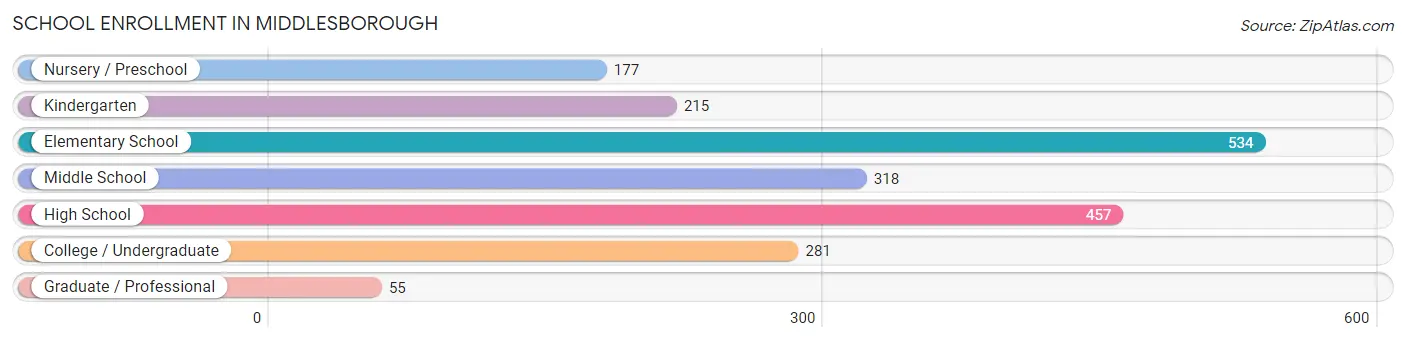
| School Level | # Students | % Students |
| Nursery / Preschool | 177 | 8.7% |
| Kindergarten | 215 | 10.5% |
| Elementary School | 534 | 26.2% |
| Middle School | 318 | 15.6% |
| High School | 457 | 22.4% |
| College / Undergraduate | 281 | 13.8% |
| Graduate / Professional | 55 | 2.7% |
| Total | 2,037 | 100.0% |
School Enrollment by Age by Funding Source in Middlesborough
Out of a total of 2,037 students who are enrolled in schools in Middlesborough, 212 (10.4%) attend a private institution, while the remaining 1,825 (89.6%) are enrolled in public schools. The age group of 20 to 24 year olds has the highest likelihood of being enrolled in private schools, with 10 (35.7% in the age bracket) enrolled. Conversely, the age group of 15 to 17 year olds has the lowest likelihood of being enrolled in a private school, with 239 (100.0% in the age bracket) attending a public institution.
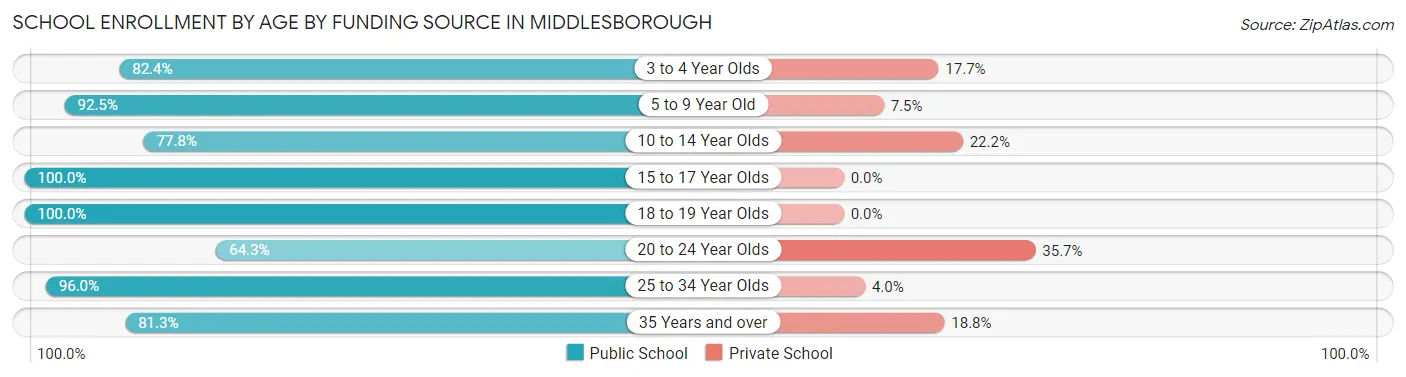
| Age Bracket | Public School | Private School |
| 3 to 4 Year Olds | 56 (82.4%) | 12 (17.6%) |
| 5 to 9 Year Old | 633 (92.5%) | 51 (7.5%) |
| 10 to 14 Year Olds | 428 (77.8%) | 122 (22.2%) |
| 15 to 17 Year Olds | 239 (100.0%) | 0 (0.0%) |
| 18 to 19 Year Olds | 184 (100.0%) | 0 (0.0%) |
| 20 to 24 Year Olds | 18 (64.3%) | 10 (35.7%) |
| 25 to 34 Year Olds | 242 (96.0%) | 10 (4.0%) |
| 35 Years and over | 26 (81.2%) | 6 (18.8%) |
| Total | 1,825 (89.6%) | 212 (10.4%) |
Educational Attainment by Field of Study in Middlesborough
Education (181 | 20.2%), business (173 | 19.3%), science & technology (131 | 14.6%), arts & humanities (82 | 9.2%), and psychology (76 | 8.5%) are the most common fields of study among 895 individuals in Middlesborough who have obtained a bachelor's degree or higher.
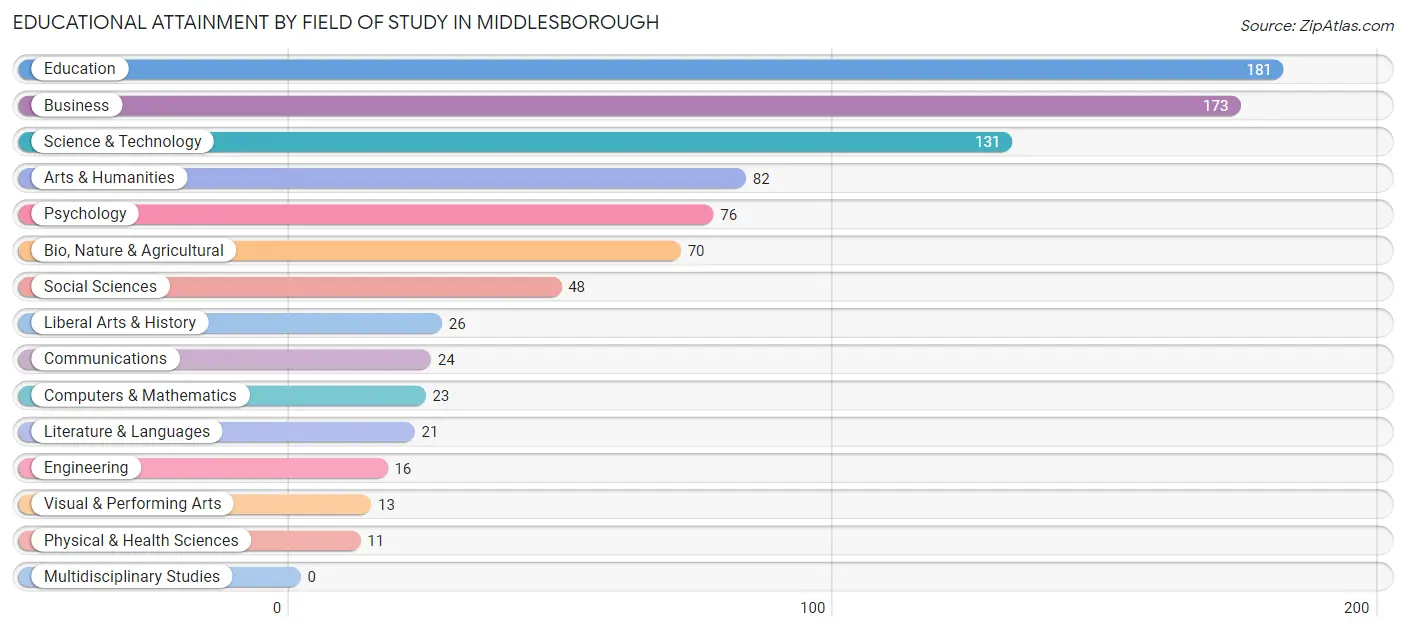
| Field of Study | # Graduates | % Graduates |
| Computers & Mathematics | 23 | 2.6% |
| Bio, Nature & Agricultural | 70 | 7.8% |
| Physical & Health Sciences | 11 | 1.2% |
| Psychology | 76 | 8.5% |
| Social Sciences | 48 | 5.4% |
| Engineering | 16 | 1.8% |
| Multidisciplinary Studies | 0 | 0.0% |
| Science & Technology | 131 | 14.6% |
| Business | 173 | 19.3% |
| Education | 181 | 20.2% |
| Literature & Languages | 21 | 2.4% |
| Liberal Arts & History | 26 | 2.9% |
| Visual & Performing Arts | 13 | 1.5% |
| Communications | 24 | 2.7% |
| Arts & Humanities | 82 | 9.2% |
| Total | 895 | 100.0% |
Transportation & Commute in Middlesborough
Vehicle Availability by Sex in Middlesborough
The most prevalent vehicle ownership categories in Middlesborough are males with 2 vehicles (500, accounting for 37.3%) and females with 2 vehicles (639, making up 39.7%).
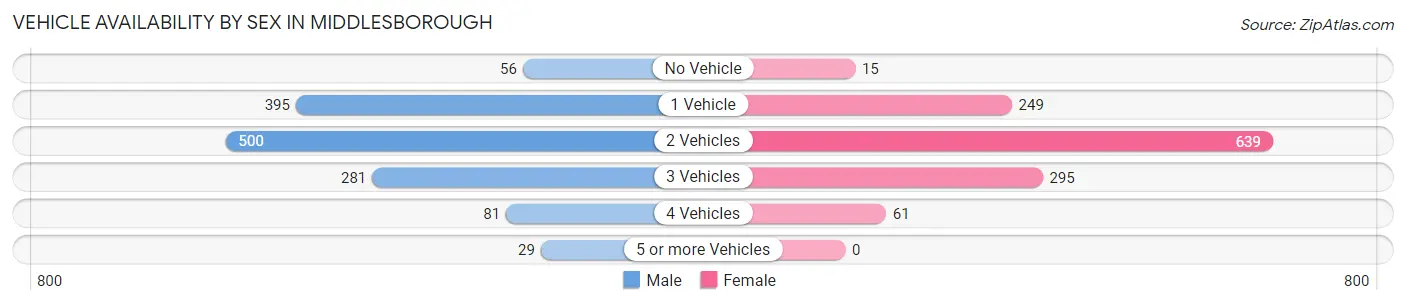
| Vehicles Available | Male | Female |
| No Vehicle | 56 (4.2%) | 15 (1.2%) |
| 1 Vehicle | 395 (29.4%) | 249 (19.8%) |
| 2 Vehicles | 500 (37.3%) | 639 (50.7%) |
| 3 Vehicles | 281 (20.9%) | 295 (23.4%) |
| 4 Vehicles | 81 (6.0%) | 61 (4.9%) |
| 5 or more Vehicles | 29 (2.2%) | 0 (0.0%) |
| Total | 1,342 (100.0%) | 1,259 (100.0%) |
Commute Time in Middlesborough
The most frequently occuring commute durations in Middlesborough are 5 to 9 minutes (900 commuters, 37.0%), 10 to 14 minutes (300 commuters, 12.3%), and 30 to 34 minutes (288 commuters, 11.8%).
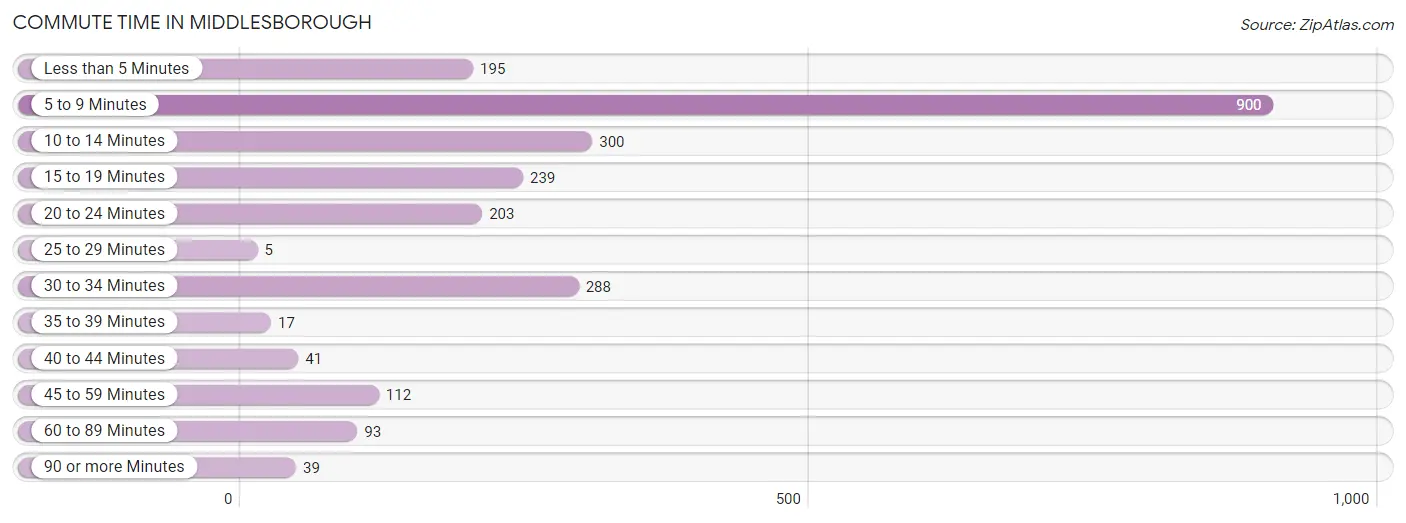
| Commute Time | # Commuters | % Commuters |
| Less than 5 Minutes | 195 | 8.0% |
| 5 to 9 Minutes | 900 | 37.0% |
| 10 to 14 Minutes | 300 | 12.3% |
| 15 to 19 Minutes | 239 | 9.8% |
| 20 to 24 Minutes | 203 | 8.4% |
| 25 to 29 Minutes | 5 | 0.2% |
| 30 to 34 Minutes | 288 | 11.8% |
| 35 to 39 Minutes | 17 | 0.7% |
| 40 to 44 Minutes | 41 | 1.7% |
| 45 to 59 Minutes | 112 | 4.6% |
| 60 to 89 Minutes | 93 | 3.8% |
| 90 or more Minutes | 39 | 1.6% |
Commute Time by Sex in Middlesborough
The most common commute times in Middlesborough are 5 to 9 minutes (416 commuters, 34.2%) for males and 5 to 9 minutes (484 commuters, 39.8%) for females.
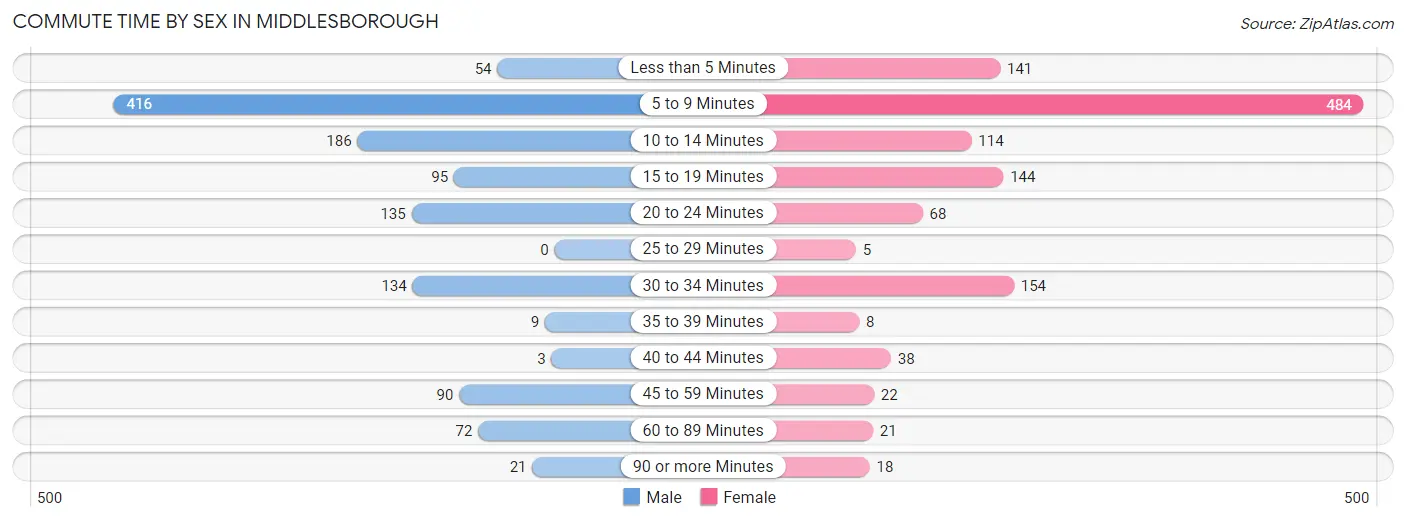
| Commute Time | Male | Female |
| Less than 5 Minutes | 54 (4.4%) | 141 (11.6%) |
| 5 to 9 Minutes | 416 (34.2%) | 484 (39.8%) |
| 10 to 14 Minutes | 186 (15.3%) | 114 (9.4%) |
| 15 to 19 Minutes | 95 (7.8%) | 144 (11.8%) |
| 20 to 24 Minutes | 135 (11.1%) | 68 (5.6%) |
| 25 to 29 Minutes | 0 (0.0%) | 5 (0.4%) |
| 30 to 34 Minutes | 134 (11.0%) | 154 (12.7%) |
| 35 to 39 Minutes | 9 (0.7%) | 8 (0.7%) |
| 40 to 44 Minutes | 3 (0.3%) | 38 (3.1%) |
| 45 to 59 Minutes | 90 (7.4%) | 22 (1.8%) |
| 60 to 89 Minutes | 72 (5.9%) | 21 (1.7%) |
| 90 or more Minutes | 21 (1.7%) | 18 (1.5%) |
Time of Departure to Work by Sex in Middlesborough
The most frequent times of departure to work in Middlesborough are 7:00 AM to 7:29 AM (238, 19.6%) for males and 5:30 AM to 5:59 AM (214, 17.6%) for females.
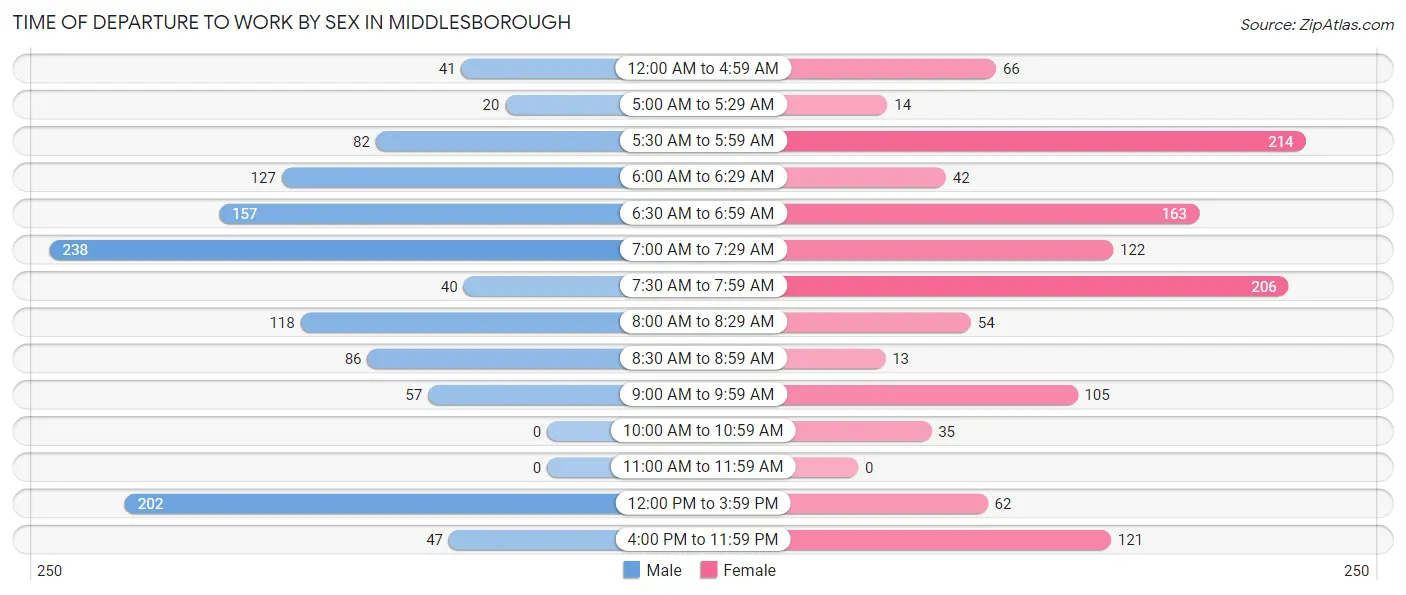
| Time of Departure | Male | Female |
| 12:00 AM to 4:59 AM | 41 (3.4%) | 66 (5.4%) |
| 5:00 AM to 5:29 AM | 20 (1.7%) | 14 (1.1%) |
| 5:30 AM to 5:59 AM | 82 (6.8%) | 214 (17.6%) |
| 6:00 AM to 6:29 AM | 127 (10.4%) | 42 (3.5%) |
| 6:30 AM to 6:59 AM | 157 (12.9%) | 163 (13.4%) |
| 7:00 AM to 7:29 AM | 238 (19.6%) | 122 (10.0%) |
| 7:30 AM to 7:59 AM | 40 (3.3%) | 206 (16.9%) |
| 8:00 AM to 8:29 AM | 118 (9.7%) | 54 (4.4%) |
| 8:30 AM to 8:59 AM | 86 (7.1%) | 13 (1.1%) |
| 9:00 AM to 9:59 AM | 57 (4.7%) | 105 (8.6%) |
| 10:00 AM to 10:59 AM | 0 (0.0%) | 35 (2.9%) |
| 11:00 AM to 11:59 AM | 0 (0.0%) | 0 (0.0%) |
| 12:00 PM to 3:59 PM | 202 (16.6%) | 62 (5.1%) |
| 4:00 PM to 11:59 PM | 47 (3.9%) | 121 (9.9%) |
| Total | 1,215 (100.0%) | 1,217 (100.0%) |
Housing Occupancy in Middlesborough
Occupancy by Ownership in Middlesborough
Of the total 3,862 dwellings in Middlesborough, owner-occupied units account for 2,214 (57.3%), while renter-occupied units make up 1,648 (42.7%).
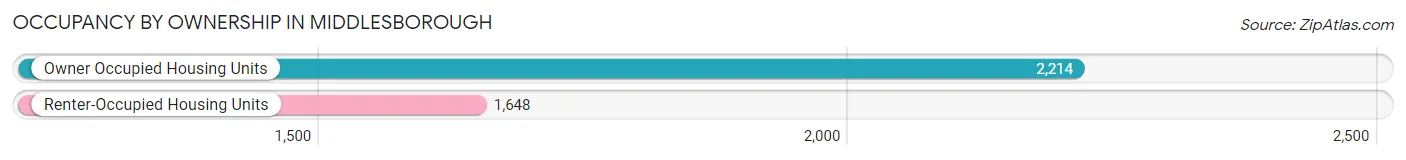
| Occupancy | # Housing Units | % Housing Units |
| Owner Occupied Housing Units | 2,214 | 57.3% |
| Renter-Occupied Housing Units | 1,648 | 42.7% |
| Total Occupied Housing Units | 3,862 | 100.0% |
Occupancy by Household Size in Middlesborough
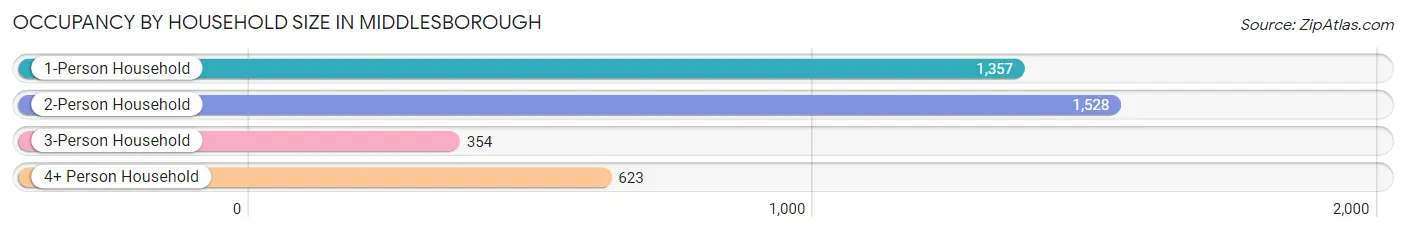
| Household Size | # Housing Units | % Housing Units |
| 1-Person Household | 1,357 | 35.1% |
| 2-Person Household | 1,528 | 39.6% |
| 3-Person Household | 354 | 9.2% |
| 4+ Person Household | 623 | 16.1% |
| Total Housing Units | 3,862 | 100.0% |
Occupancy by Ownership by Household Size in Middlesborough
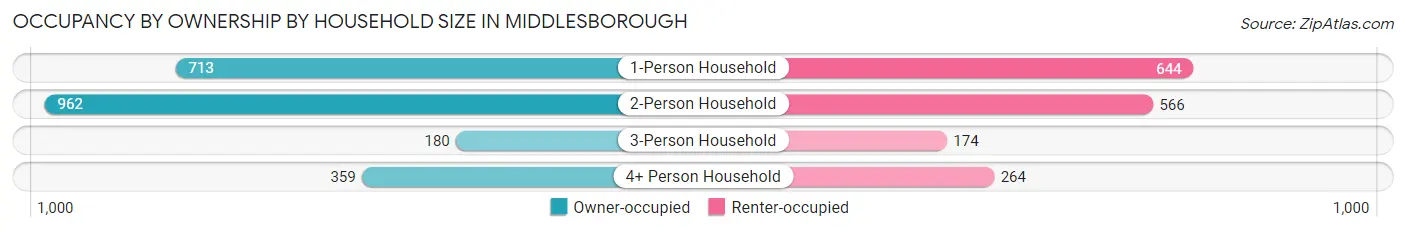
| Household Size | Owner-occupied | Renter-occupied |
| 1-Person Household | 713 (52.5%) | 644 (47.5%) |
| 2-Person Household | 962 (63.0%) | 566 (37.0%) |
| 3-Person Household | 180 (50.8%) | 174 (49.1%) |
| 4+ Person Household | 359 (57.6%) | 264 (42.4%) |
| Total Housing Units | 2,214 (57.3%) | 1,648 (42.7%) |
Occupancy by Educational Attainment in Middlesborough
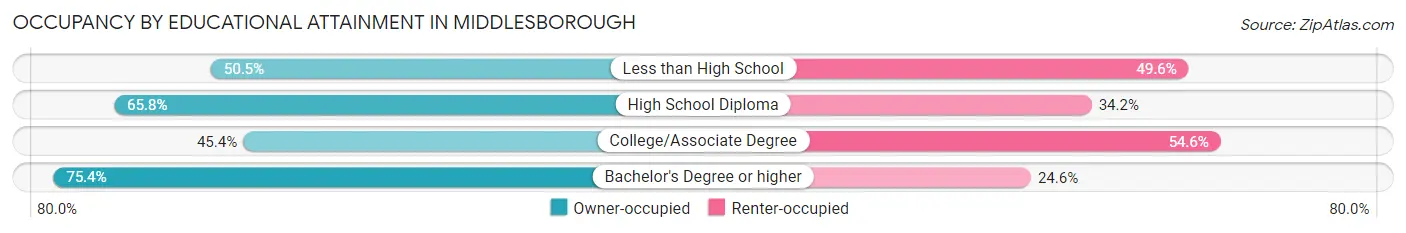
| Household Size | Owner-occupied | Renter-occupied |
| Less than High School | 451 (50.4%) | 443 (49.5%) |
| High School Diploma | 797 (65.8%) | 414 (34.2%) |
| College/Associate Degree | 542 (45.4%) | 653 (54.6%) |
| Bachelor's Degree or higher | 424 (75.4%) | 138 (24.6%) |
Occupancy by Age of Householder in Middlesborough
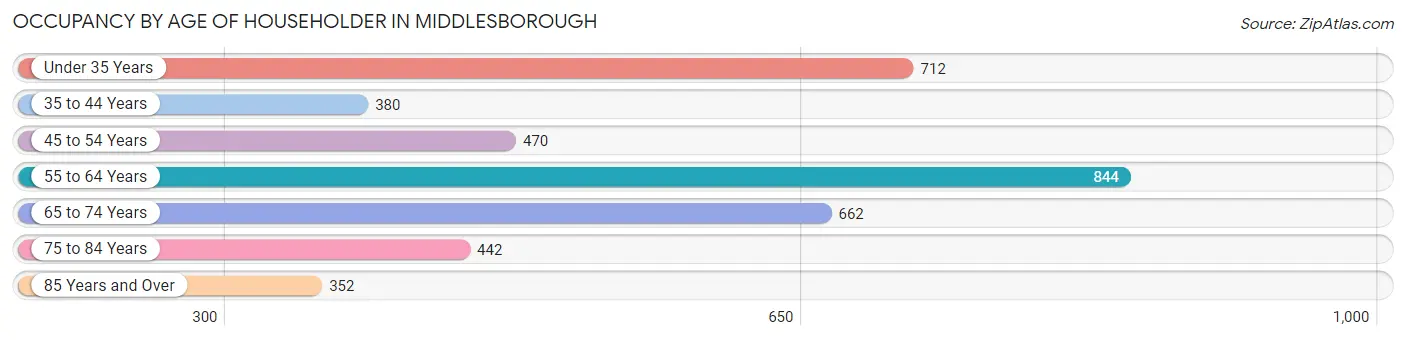
| Age Bracket | # Households | % Households |
| Under 35 Years | 712 | 18.4% |
| 35 to 44 Years | 380 | 9.8% |
| 45 to 54 Years | 470 | 12.2% |
| 55 to 64 Years | 844 | 21.8% |
| 65 to 74 Years | 662 | 17.1% |
| 75 to 84 Years | 442 | 11.4% |
| 85 Years and Over | 352 | 9.1% |
| Total | 3,862 | 100.0% |
Housing Finances in Middlesborough
Median Income by Occupancy in Middlesborough
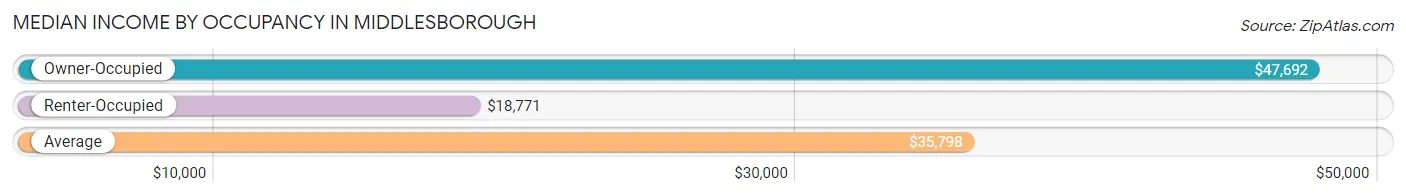
| Occupancy Type | # Households | Median Income |
| Owner-Occupied | 2,214 (57.3%) | $47,692 |
| Renter-Occupied | 1,648 (42.7%) | $18,771 |
| Average | 3,862 (100.0%) | $35,798 |
Occupancy by Householder Income Bracket in Middlesborough
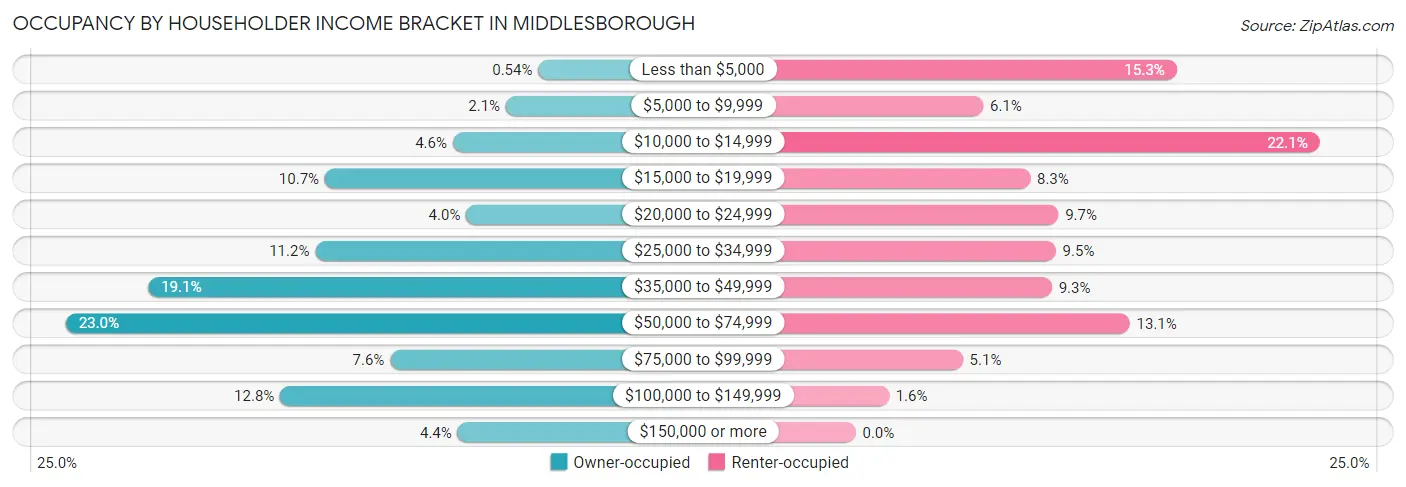
| Income Bracket | Owner-occupied | Renter-occupied |
| Less than $5,000 | 12 (0.5%) | 252 (15.3%) |
| $5,000 to $9,999 | 46 (2.1%) | 100 (6.1%) |
| $10,000 to $14,999 | 102 (4.6%) | 364 (22.1%) |
| $15,000 to $19,999 | 237 (10.7%) | 137 (8.3%) |
| $20,000 to $24,999 | 88 (4.0%) | 159 (9.7%) |
| $25,000 to $34,999 | 247 (11.2%) | 157 (9.5%) |
| $35,000 to $49,999 | 423 (19.1%) | 154 (9.3%) |
| $50,000 to $74,999 | 510 (23.0%) | 215 (13.1%) |
| $75,000 to $99,999 | 168 (7.6%) | 84 (5.1%) |
| $100,000 to $149,999 | 284 (12.8%) | 26 (1.6%) |
| $150,000 or more | 97 (4.4%) | 0 (0.0%) |
| Total | 2,214 (100.0%) | 1,648 (100.0%) |
Monthly Housing Cost Tiers in Middlesborough
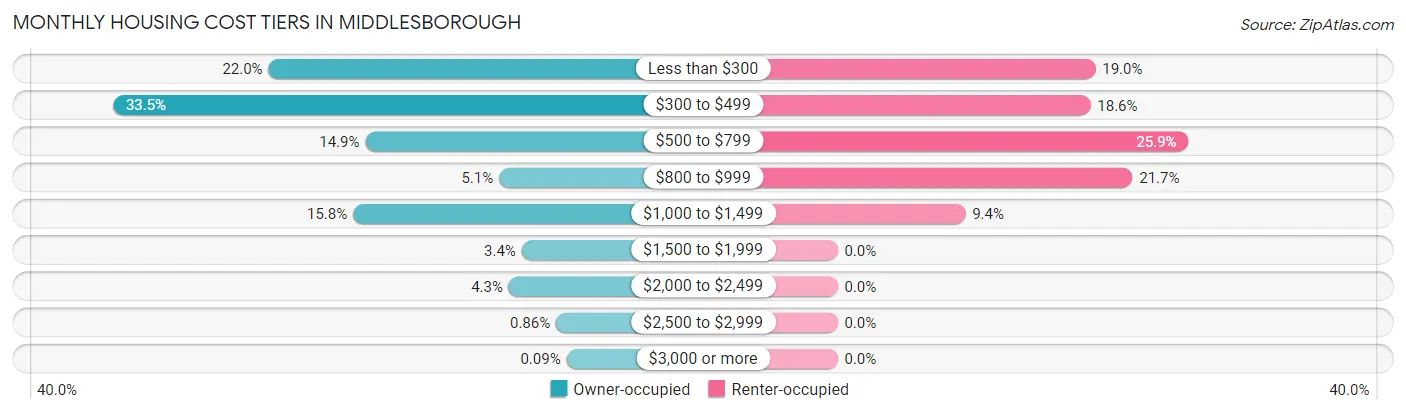
| Monthly Cost | Owner-occupied | Renter-occupied |
| Less than $300 | 488 (22.0%) | 313 (19.0%) |
| $300 to $499 | 742 (33.5%) | 307 (18.6%) |
| $500 to $799 | 330 (14.9%) | 426 (25.9%) |
| $800 to $999 | 112 (5.1%) | 358 (21.7%) |
| $1,000 to $1,499 | 350 (15.8%) | 155 (9.4%) |
| $1,500 to $1,999 | 75 (3.4%) | 0 (0.0%) |
| $2,000 to $2,499 | 96 (4.3%) | 0 (0.0%) |
| $2,500 to $2,999 | 19 (0.9%) | 0 (0.0%) |
| $3,000 or more | 2 (0.1%) | 0 (0.0%) |
| Total | 2,214 (100.0%) | 1,648 (100.0%) |
Physical Housing Characteristics in Middlesborough
Housing Structures in Middlesborough
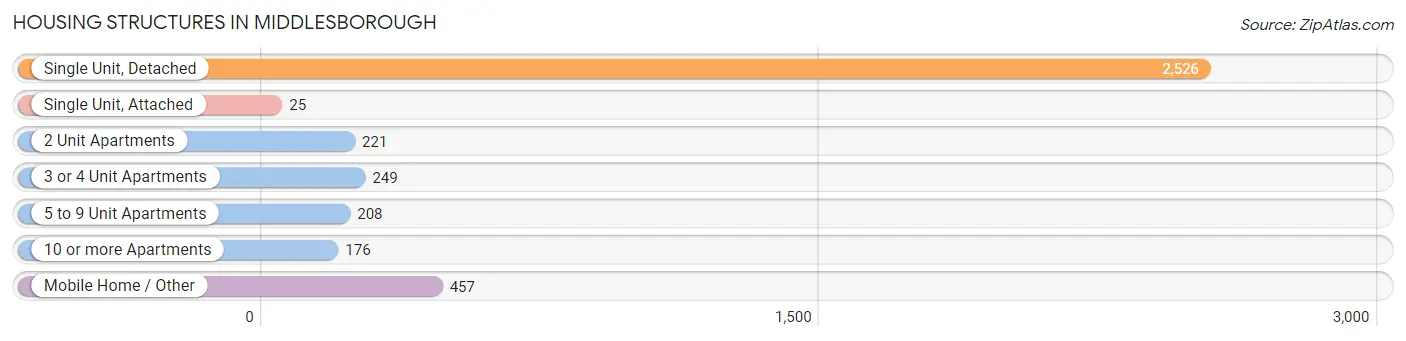
| Structure Type | # Housing Units | % Housing Units |
| Single Unit, Detached | 2,526 | 65.4% |
| Single Unit, Attached | 25 | 0.6% |
| 2 Unit Apartments | 221 | 5.7% |
| 3 or 4 Unit Apartments | 249 | 6.5% |
| 5 to 9 Unit Apartments | 208 | 5.4% |
| 10 or more Apartments | 176 | 4.6% |
| Mobile Home / Other | 457 | 11.8% |
| Total | 3,862 | 100.0% |
Housing Structures by Occupancy in Middlesborough
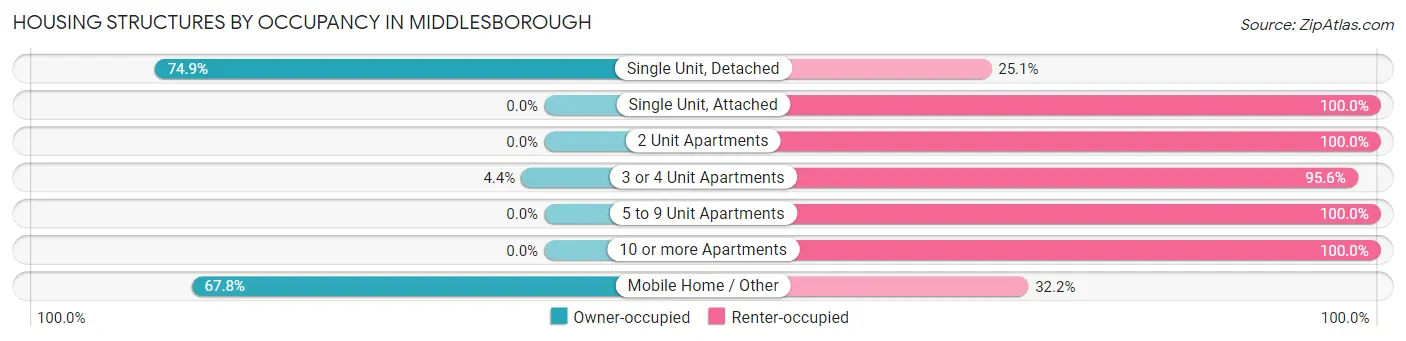
| Structure Type | Owner-occupied | Renter-occupied |
| Single Unit, Detached | 1,893 (74.9%) | 633 (25.1%) |
| Single Unit, Attached | 0 (0.0%) | 25 (100.0%) |
| 2 Unit Apartments | 0 (0.0%) | 221 (100.0%) |
| 3 or 4 Unit Apartments | 11 (4.4%) | 238 (95.6%) |
| 5 to 9 Unit Apartments | 0 (0.0%) | 208 (100.0%) |
| 10 or more Apartments | 0 (0.0%) | 176 (100.0%) |
| Mobile Home / Other | 310 (67.8%) | 147 (32.2%) |
| Total | 2,214 (57.3%) | 1,648 (42.7%) |
Housing Structures by Number of Rooms in Middlesborough
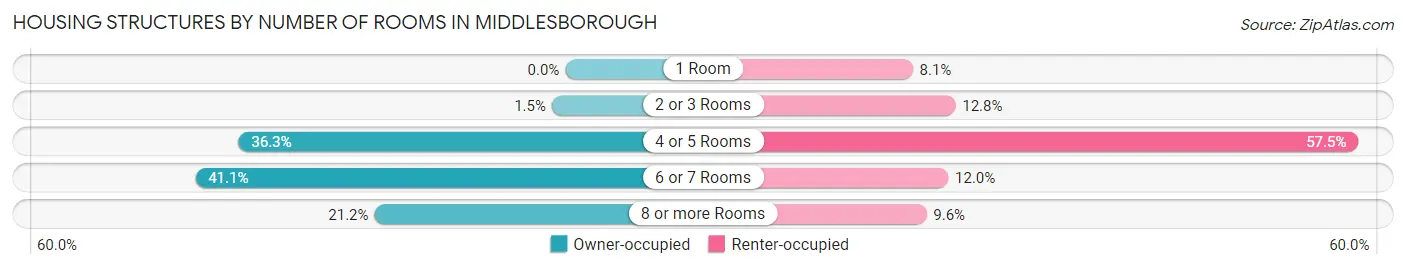
| Number of Rooms | Owner-occupied | Renter-occupied |
| 1 Room | 0 (0.0%) | 133 (8.1%) |
| 2 or 3 Rooms | 33 (1.5%) | 211 (12.8%) |
| 4 or 5 Rooms | 803 (36.3%) | 948 (57.5%) |
| 6 or 7 Rooms | 909 (41.1%) | 198 (12.0%) |
| 8 or more Rooms | 469 (21.2%) | 158 (9.6%) |
| Total | 2,214 (100.0%) | 1,648 (100.0%) |
Housing Structure by Heating Type in Middlesborough
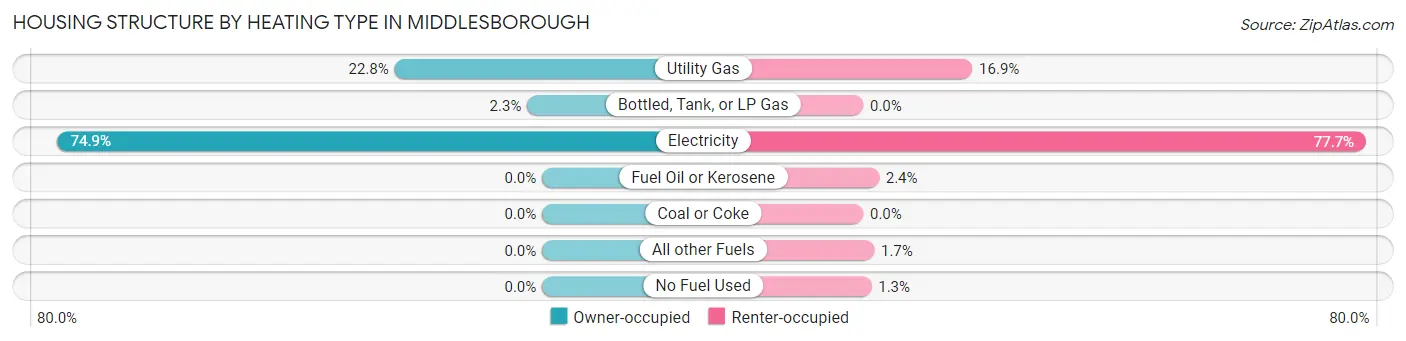
| Heating Type | Owner-occupied | Renter-occupied |
| Utility Gas | 505 (22.8%) | 278 (16.9%) |
| Bottled, Tank, or LP Gas | 51 (2.3%) | 0 (0.0%) |
| Electricity | 1,658 (74.9%) | 1,281 (77.7%) |
| Fuel Oil or Kerosene | 0 (0.0%) | 40 (2.4%) |
| Coal or Coke | 0 (0.0%) | 0 (0.0%) |
| All other Fuels | 0 (0.0%) | 28 (1.7%) |
| No Fuel Used | 0 (0.0%) | 21 (1.3%) |
| Total | 2,214 (100.0%) | 1,648 (100.0%) |
Household Vehicle Usage in Middlesborough
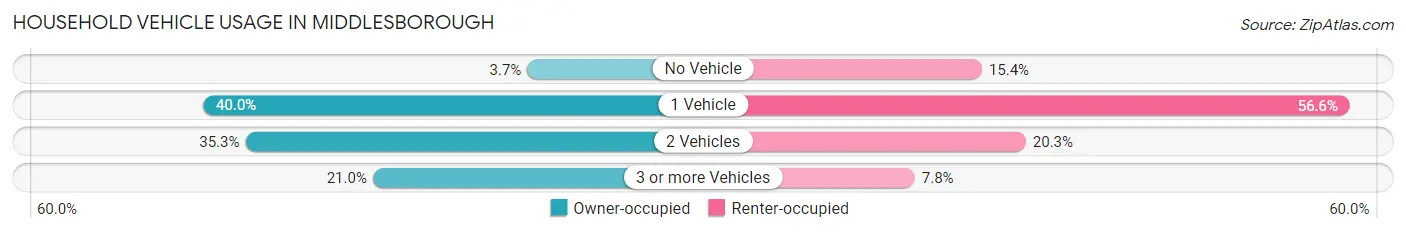
| Vehicles per Household | Owner-occupied | Renter-occupied |
| No Vehicle | 82 (3.7%) | 253 (15.3%) |
| 1 Vehicle | 886 (40.0%) | 932 (56.6%) |
| 2 Vehicles | 781 (35.3%) | 334 (20.3%) |
| 3 or more Vehicles | 465 (21.0%) | 129 (7.8%) |
| Total | 2,214 (100.0%) | 1,648 (100.0%) |
Real Estate & Mortgages in Middlesborough
Real Estate and Mortgage Overview in Middlesborough
| Characteristic | Without Mortgage | With Mortgage |
| Housing Units | 1,390 | 824 |
| Median Property Value | $72,700 | $143,200 |
| Median Household Income | $43,286 | $54 |
| Monthly Housing Costs | $322 | $2 |
| Real Estate Taxes | $585 | $16 |
Property Value by Mortgage Status in Middlesborough
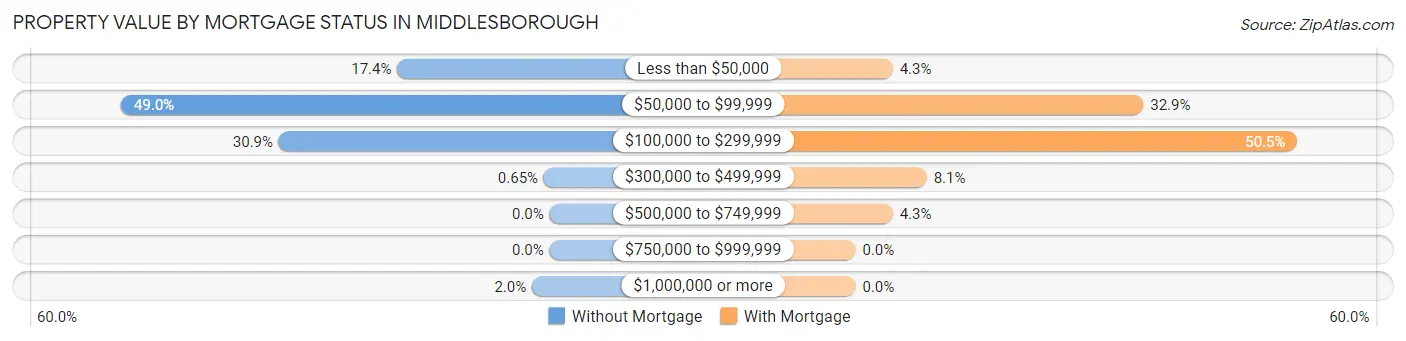
| Property Value | Without Mortgage | With Mortgage |
| Less than $50,000 | 242 (17.4%) | 35 (4.3%) |
| $50,000 to $99,999 | 681 (49.0%) | 271 (32.9%) |
| $100,000 to $299,999 | 430 (30.9%) | 416 (50.5%) |
| $300,000 to $499,999 | 9 (0.6%) | 67 (8.1%) |
| $500,000 to $749,999 | 0 (0.0%) | 35 (4.3%) |
| $750,000 to $999,999 | 0 (0.0%) | 0 (0.0%) |
| $1,000,000 or more | 28 (2.0%) | 0 (0.0%) |
| Total | 1,390 (100.0%) | 824 (100.0%) |
Household Income by Mortgage Status in Middlesborough
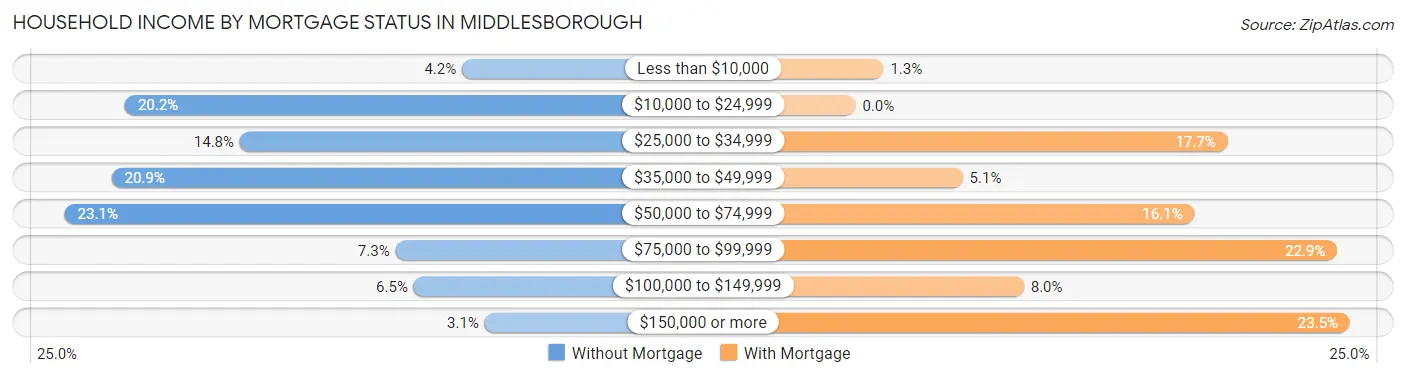
| Household Income | Without Mortgage | With Mortgage |
| Less than $10,000 | 58 (4.2%) | 11 (1.3%) |
| $10,000 to $24,999 | 281 (20.2%) | 0 (0.0%) |
| $25,000 to $34,999 | 205 (14.7%) | 146 (17.7%) |
| $35,000 to $49,999 | 290 (20.9%) | 42 (5.1%) |
| $50,000 to $74,999 | 321 (23.1%) | 133 (16.1%) |
| $75,000 to $99,999 | 102 (7.3%) | 189 (22.9%) |
| $100,000 to $149,999 | 90 (6.5%) | 66 (8.0%) |
| $150,000 or more | 43 (3.1%) | 194 (23.5%) |
| Total | 1,390 (100.0%) | 824 (100.0%) |
Property Value to Household Income Ratio in Middlesborough
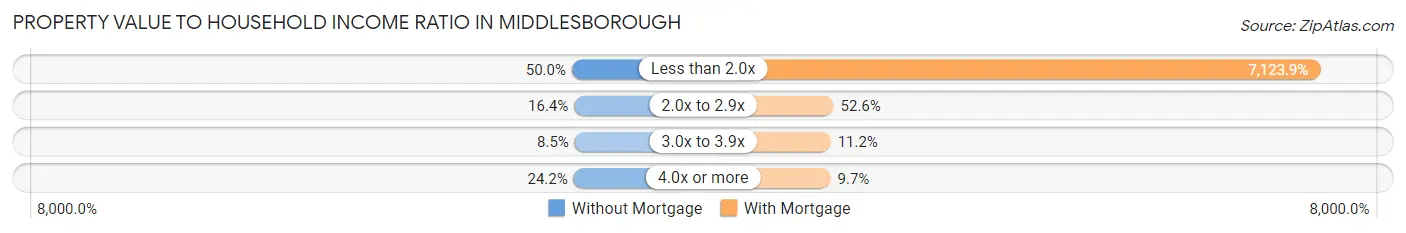
| Value-to-Income Ratio | Without Mortgage | With Mortgage |
| Less than 2.0x | 695 (50.0%) | 58,701 (7,123.9%) |
| 2.0x to 2.9x | 228 (16.4%) | 433 (52.5%) |
| 3.0x to 3.9x | 118 (8.5%) | 92 (11.2%) |
| 4.0x or more | 337 (24.2%) | 80 (9.7%) |
| Total | 1,390 (100.0%) | 824 (100.0%) |
Real Estate Taxes by Mortgage Status in Middlesborough
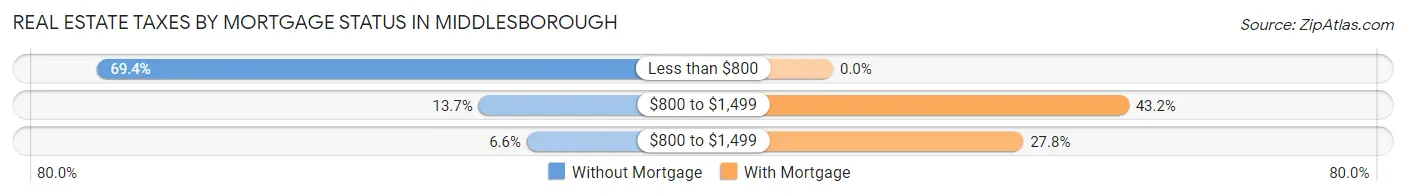
| Property Taxes | Without Mortgage | With Mortgage |
| Less than $800 | 964 (69.4%) | 0 (0.0%) |
| $800 to $1,499 | 190 (13.7%) | 356 (43.2%) |
| $800 to $1,499 | 92 (6.6%) | 229 (27.8%) |
| Total | 1,390 (100.0%) | 824 (100.0%) |
Health & Disability in Middlesborough
Health Insurance Coverage by Age in Middlesborough
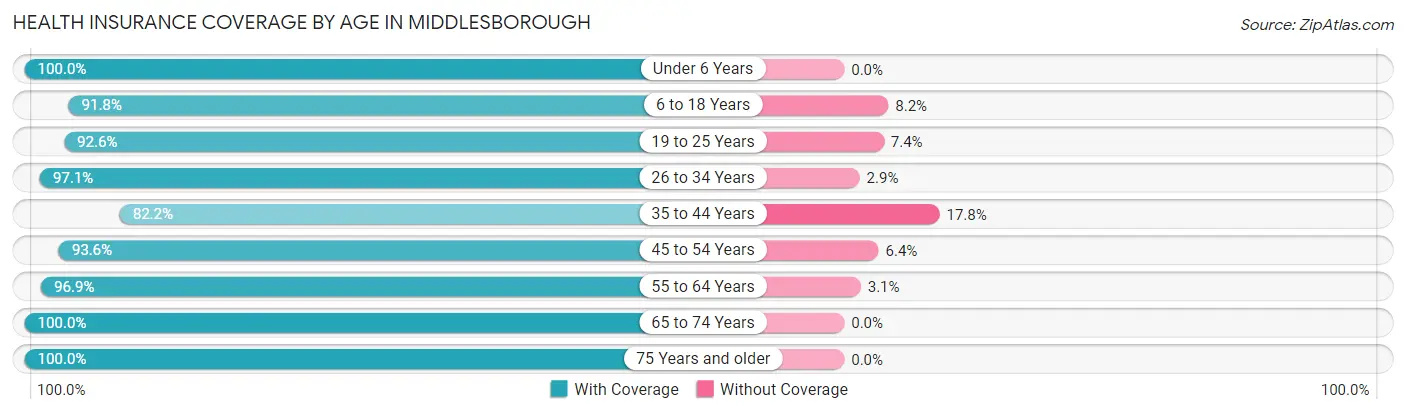
| Age Bracket | With Coverage | Without Coverage |
| Under 6 Years | 820 (100.0%) | 0 (0.0%) |
| 6 to 18 Years | 1,330 (91.8%) | 119 (8.2%) |
| 19 to 25 Years | 602 (92.6%) | 48 (7.4%) |
| 26 to 34 Years | 1,156 (97.1%) | 34 (2.9%) |
| 35 to 44 Years | 787 (82.2%) | 170 (17.8%) |
| 45 to 54 Years | 967 (93.6%) | 66 (6.4%) |
| 55 to 64 Years | 1,292 (96.9%) | 41 (3.1%) |
| 65 to 74 Years | 1,001 (100.0%) | 0 (0.0%) |
| 75 Years and older | 845 (100.0%) | 0 (0.0%) |
| Total | 8,800 (94.9%) | 478 (5.1%) |
Health Insurance Coverage by Citizenship Status in Middlesborough
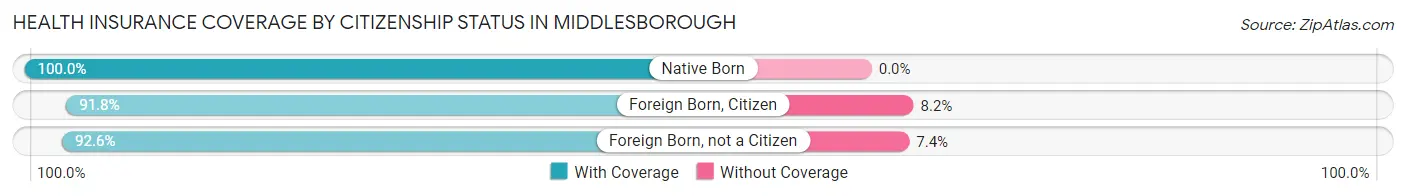
| Citizenship Status | With Coverage | Without Coverage |
| Native Born | 820 (100.0%) | 0 (0.0%) |
| Foreign Born, Citizen | 1,330 (91.8%) | 119 (8.2%) |
| Foreign Born, not a Citizen | 602 (92.6%) | 48 (7.4%) |
Health Insurance Coverage by Household Income in Middlesborough
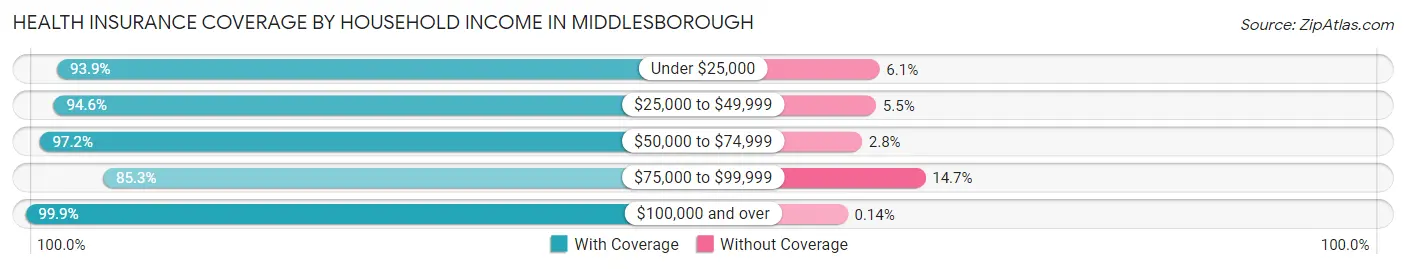
| Household Income | With Coverage | Without Coverage |
| Under $25,000 | 2,428 (93.9%) | 158 (6.1%) |
| $25,000 to $49,999 | 2,500 (94.6%) | 144 (5.4%) |
| $50,000 to $74,999 | 1,688 (97.2%) | 49 (2.8%) |
| $75,000 to $99,999 | 725 (85.3%) | 125 (14.7%) |
| $100,000 and over | 1,385 (99.9%) | 2 (0.1%) |
Public vs Private Health Insurance Coverage by Age in Middlesborough
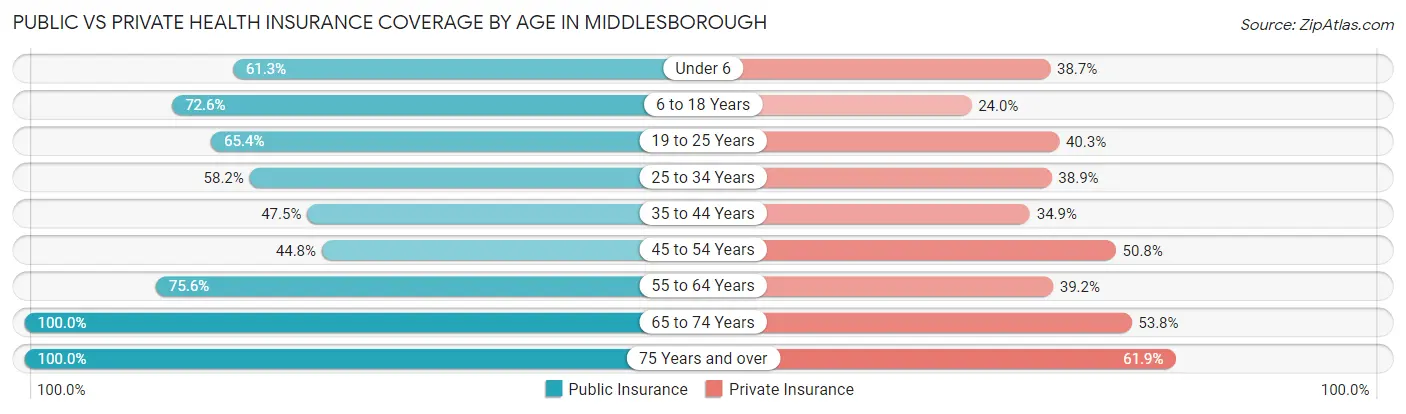
| Age Bracket | Public Insurance | Private Insurance |
| Under 6 | 503 (61.3%) | 317 (38.7%) |
| 6 to 18 Years | 1,052 (72.6%) | 348 (24.0%) |
| 19 to 25 Years | 425 (65.4%) | 262 (40.3%) |
| 25 to 34 Years | 693 (58.2%) | 463 (38.9%) |
| 35 to 44 Years | 455 (47.5%) | 334 (34.9%) |
| 45 to 54 Years | 463 (44.8%) | 525 (50.8%) |
| 55 to 64 Years | 1,008 (75.6%) | 522 (39.2%) |
| 65 to 74 Years | 1,001 (100.0%) | 538 (53.7%) |
| 75 Years and over | 845 (100.0%) | 523 (61.9%) |
| Total | 6,445 (69.5%) | 3,832 (41.3%) |
Disability Status by Sex by Age in Middlesborough
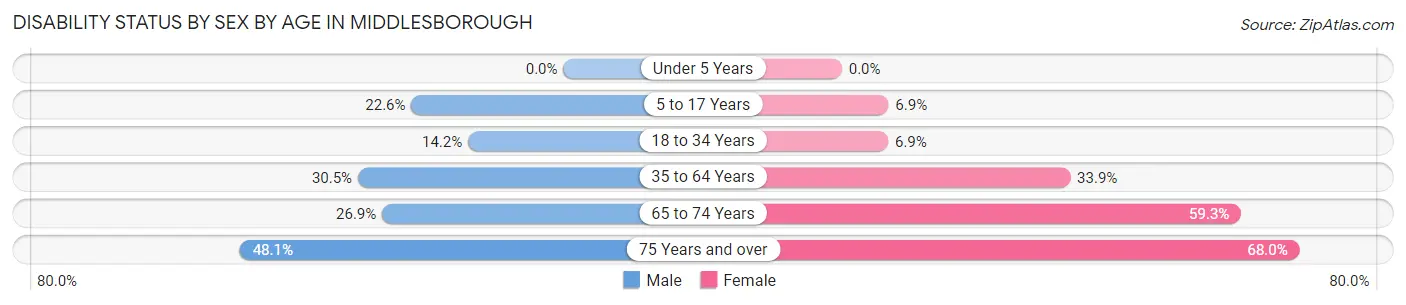
| Age Bracket | Male | Female |
| Under 5 Years | 0 (0.0%) | 0 (0.0%) |
| 5 to 17 Years | 211 (22.6%) | 38 (6.9%) |
| 18 to 34 Years | 146 (14.1%) | 68 (6.9%) |
| 35 to 64 Years | 481 (30.5%) | 592 (33.9%) |
| 65 to 74 Years | 116 (26.9%) | 338 (59.3%) |
| 75 Years and over | 148 (48.0%) | 365 (68.0%) |
Disability Class by Sex by Age in Middlesborough
Disability Class: Hearing Difficulty
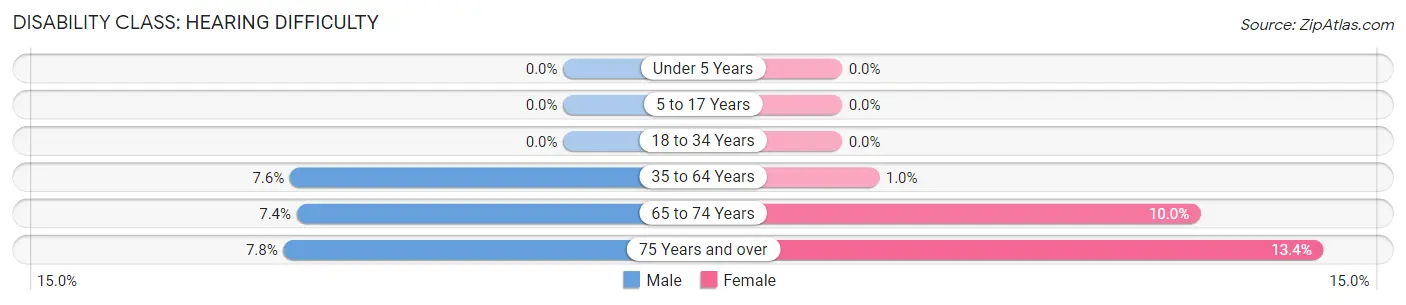
| Age Bracket | Male | Female |
| Under 5 Years | 0 (0.0%) | 0 (0.0%) |
| 5 to 17 Years | 0 (0.0%) | 0 (0.0%) |
| 18 to 34 Years | 0 (0.0%) | 0 (0.0%) |
| 35 to 64 Years | 120 (7.6%) | 18 (1.0%) |
| 65 to 74 Years | 32 (7.4%) | 57 (10.0%) |
| 75 Years and over | 24 (7.8%) | 72 (13.4%) |
Disability Class: Vision Difficulty
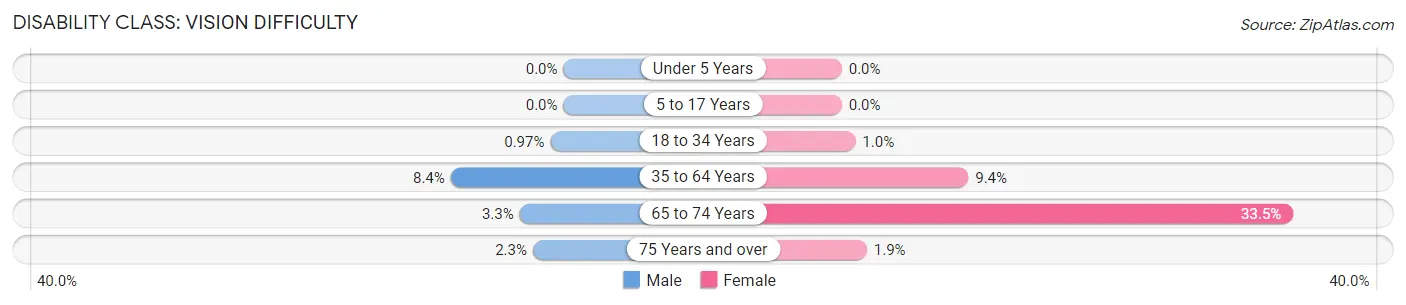
| Age Bracket | Male | Female |
| Under 5 Years | 0 (0.0%) | 0 (0.0%) |
| 5 to 17 Years | 0 (0.0%) | 0 (0.0%) |
| 18 to 34 Years | 10 (1.0%) | 10 (1.0%) |
| 35 to 64 Years | 132 (8.4%) | 164 (9.4%) |
| 65 to 74 Years | 14 (3.3%) | 191 (33.5%) |
| 75 Years and over | 7 (2.3%) | 10 (1.9%) |
Disability Class: Cognitive Difficulty
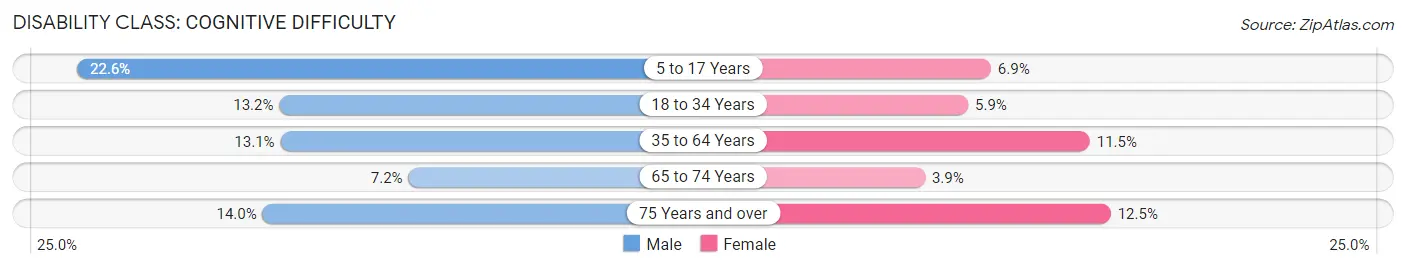
| Age Bracket | Male | Female |
| 5 to 17 Years | 211 (22.6%) | 38 (6.9%) |
| 18 to 34 Years | 136 (13.2%) | 58 (5.9%) |
| 35 to 64 Years | 207 (13.1%) | 201 (11.5%) |
| 65 to 74 Years | 31 (7.2%) | 22 (3.9%) |
| 75 Years and over | 43 (14.0%) | 67 (12.5%) |
Disability Class: Ambulatory Difficulty
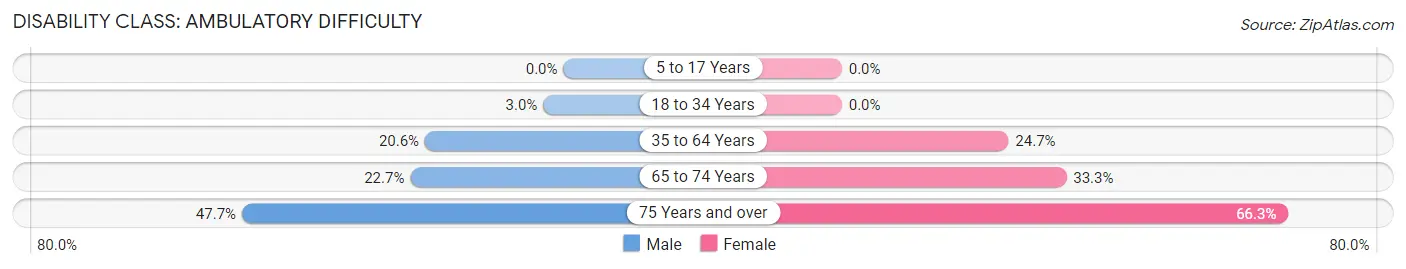
| Age Bracket | Male | Female |
| 5 to 17 Years | 0 (0.0%) | 0 (0.0%) |
| 18 to 34 Years | 31 (3.0%) | 0 (0.0%) |
| 35 to 64 Years | 324 (20.5%) | 432 (24.7%) |
| 65 to 74 Years | 98 (22.7%) | 190 (33.3%) |
| 75 Years and over | 147 (47.7%) | 356 (66.3%) |
Disability Class: Self-Care Difficulty
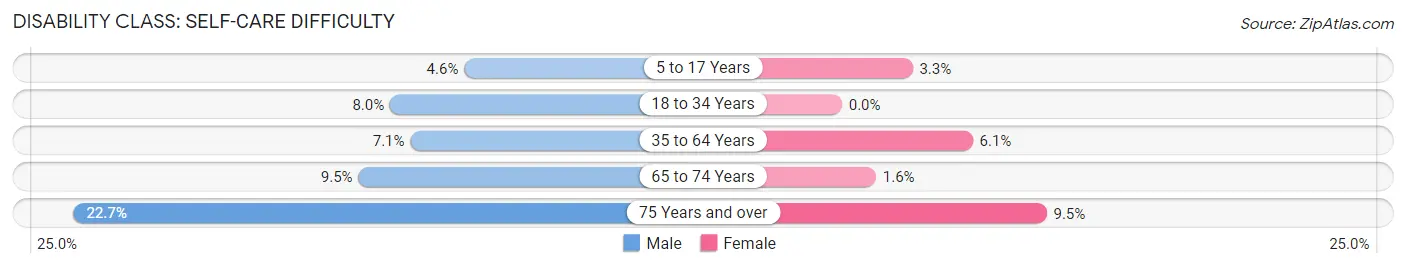
| Age Bracket | Male | Female |
| 5 to 17 Years | 43 (4.6%) | 18 (3.3%) |
| 18 to 34 Years | 83 (8.0%) | 0 (0.0%) |
| 35 to 64 Years | 112 (7.1%) | 106 (6.1%) |
| 65 to 74 Years | 41 (9.5%) | 9 (1.6%) |
| 75 Years and over | 70 (22.7%) | 51 (9.5%) |
Technology Access in Middlesborough
Computing Device Access in Middlesborough
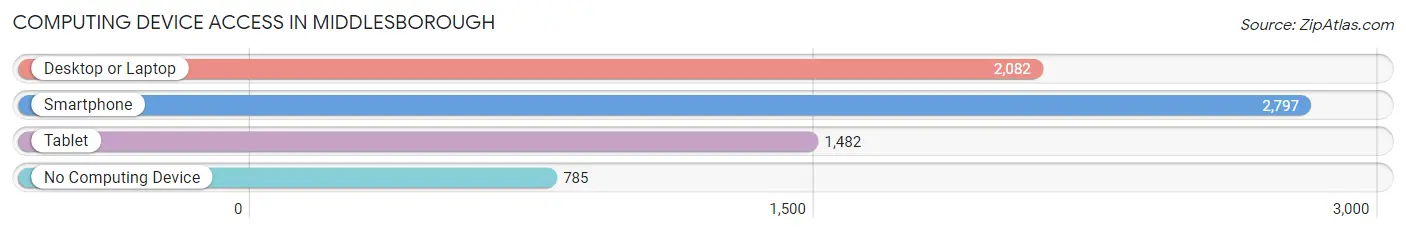
| Device Type | # Households | % Households |
| Desktop or Laptop | 2,082 | 53.9% |
| Smartphone | 2,797 | 72.4% |
| Tablet | 1,482 | 38.4% |
| No Computing Device | 785 | 20.3% |
| Total | 3,862 | 100.0% |
Internet Access in Middlesborough
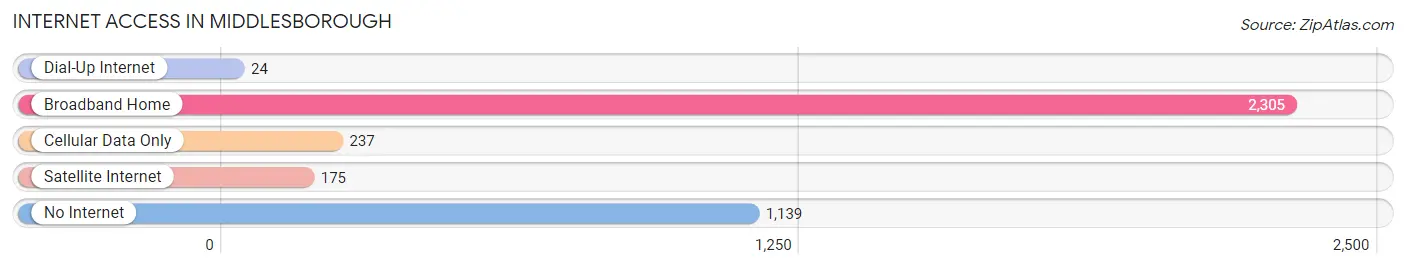
| Internet Type | # Households | % Households |
| Dial-Up Internet | 24 | 0.6% |
| Broadband Home | 2,305 | 59.7% |
| Cellular Data Only | 237 | 6.1% |
| Satellite Internet | 175 | 4.5% |
| No Internet | 1,139 | 29.5% |
| Total | 3,862 | 100.0% |
Middlesborough Summary
Middlesborough, Kentucky is a small city located in Bell County, Kentucky. It is the county seat of Bell County and is situated in the Appalachian Mountains. The city has a population of around 10,000 people and is the largest city in the county. The city is known for its rich history, beautiful geography, and vibrant economy.
History
Middlesborough was founded in 1888 by the Middlesborough Coal and Iron Company. The company was formed to exploit the coal and iron ore deposits in the area. The city was named after the company’s president, John C. Middleton. The city was incorporated in 1889 and quickly grew to become the largest city in the county.
The city was a major center of coal mining and iron production in the late 19th and early 20th centuries. The city was also home to a large number of immigrants from Europe, particularly from Italy and Poland. The city was also home to a large number of African Americans who worked in the coal mines and iron factories.
The city was also home to a large number of labor unions, which helped to improve working conditions in the mines and factories. The city was also home to a number of cultural and educational institutions, including the University of Kentucky’s Appalachian Center.
Geography
Middlesborough is located in the Appalachian Mountains in southeastern Kentucky. The city is situated in a valley between two mountain ranges, the Cumberland Mountains to the east and the Pine Mountain Range to the west. The city is located at the confluence of the Cumberland River and the Clear Fork of the Cumberland River.
The city is surrounded by a number of small towns and villages, including Pineville, Harlan, and Barbourville. The city is also located near the Daniel Boone National Forest and the Big South Fork National River and Recreation Area.
Economy
Middlesborough’s economy is largely based on the coal and iron industries. The city is home to a number of coal mines and iron factories. The city is also home to a number of other industries, including manufacturing, healthcare, and tourism.
The city is home to a number of large employers, including the Middlesborough Coal and Iron Company, the University of Kentucky’s Appalachian Center, and the Middlesborough Medical Center. The city is also home to a number of small businesses, including restaurants, retail stores, and service providers.
Demographics
As of the 2010 census, the population of Middlesborough was 10,334. The city has a population that is largely white (90.2%), with a small African American population (4.2%) and a small Hispanic population (2.2%). The city also has a small Asian population (1.2%).
The median household income in Middlesborough is $30,945, which is lower than the national median of $50,046. The median age in the city is 41.7 years, which is slightly higher than the national median of 37.7 years. The city has a poverty rate of 22.2%, which is higher than the national poverty rate of 15.1%.
Conclusion
Middlesborough, Kentucky is a small city located in Bell County, Kentucky. The city has a rich history, beautiful geography, and vibrant economy. The city is home to a number of large employers, including the Middlesborough Coal and Iron Company, the University of Kentucky’s Appalachian Center, and the Middlesborough Medical Center. The city has a population that is largely white, with a small African American population and a small Hispanic population. The median household income in Middlesborough is lower than the national median, and the city has a higher poverty rate than the national average.
Common Questions
What is Per Capita Income in Middlesborough?
Per Capita income in Middlesborough is $20,123.
What is the Median Family Income in Middlesborough?
Median Family Income in Middlesborough is $46,476.
What is the Median Household income in Middlesborough?
Median Household Income in Middlesborough is $35,798.
What is Income or Wage Gap in Middlesborough?
Income or Wage Gap in Middlesborough is 10.8%.
Women in Middlesborough earn 89.2 cents for every dollar earned by a man.
What is Family Income Deficit in Middlesborough?
Family Income Deficit in Middlesborough is $7,404.
Families that are below poverty line in Middlesborough earn $7,404 less on average than the poverty threshold level.
What is Inequality or Gini Index in Middlesborough?
Inequality or Gini Index in Middlesborough is 0.48.
What is the Total Population of Middlesborough?
Total Population of Middlesborough is 9,383.
What is the Total Male Population of Middlesborough?
Total Male Population of Middlesborough is 4,702.
What is the Total Female Population of Middlesborough?
Total Female Population of Middlesborough is 4,681.
What is the Ratio of Males per 100 Females in Middlesborough?
There are 100.45 Males per 100 Females in Middlesborough.
What is the Ratio of Females per 100 Males in Middlesborough?
There are 99.55 Females per 100 Males in Middlesborough.
What is the Median Population Age in Middlesborough?
Median Population Age in Middlesborough is 42.1 Years.
What is the Average Family Size in Middlesborough
Average Family Size in Middlesborough is 3.1 People.
What is the Average Household Size in Middlesborough
Average Household Size in Middlesborough is 2.4 People.
How Large is the Labor Force in Middlesborough?
There are 3,115 People in the Labor Forcein in Middlesborough.
What is the Percentage of People in the Labor Force in Middlesborough?
41.6% of People are in the Labor Force in Middlesborough.
What is the Unemployment Rate in Middlesborough?
Unemployment Rate in Middlesborough is 8.8%.