Brownsboro Village, KY Map & Demographics
Brownsboro Village Map
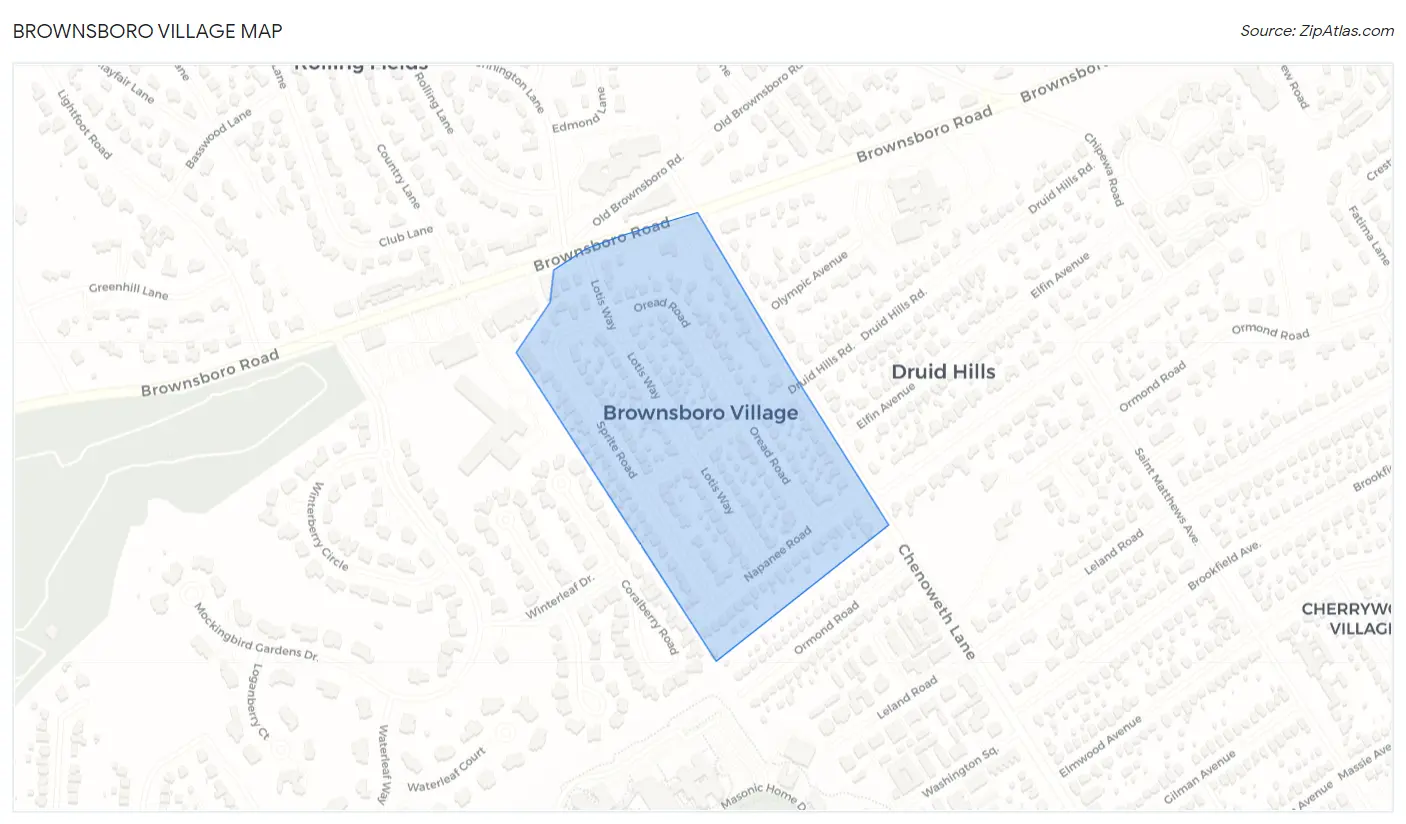
Brownsboro Village Overview
$70,908
PER CAPITA INCOME
$158,750
AVG FAMILY INCOME
$89,688
AVG HOUSEHOLD INCOME
29.6%
WAGE / INCOME GAP [ % ]
70.4¢/ $1
WAGE / INCOME GAP [ $ ]
0.51
INEQUALITY / GINI INDEX
326
TOTAL POPULATION
147
MALE POPULATION
179
FEMALE POPULATION
82.12
MALES / 100 FEMALES
121.77
FEMALES / 100 MALES
52.3
MEDIAN AGE
2.9
AVG FAMILY SIZE
1.8
AVG HOUSEHOLD SIZE
173
LABOR FORCE [ PEOPLE ]
64.1%
PERCENT IN LABOR FORCE
2.9%
UNEMPLOYMENT RATE
Brownsboro Village Area Codes
Income in Brownsboro Village
Income Overview in Brownsboro Village
Per Capita Income in Brownsboro Village is $70,908, while median incomes of families and households are $158,750 and $89,688 respectively.
| Characteristic | Number | Measure |
| Per Capita Income | 326 | $70,908 |
| Median Family Income | 69 | $158,750 |
| Mean Family Income | 69 | $192,433 |
| Median Household Income | 177 | $89,688 |
| Mean Household Income | 177 | $128,183 |
| Income Deficit | 69 | $0 |
| Wage / Income Gap (%) | 326 | 29.59% |
| Wage / Income Gap ($) | 326 | 70.41¢ per $1 |
| Gini / Inequality Index | 326 | 0.51 |
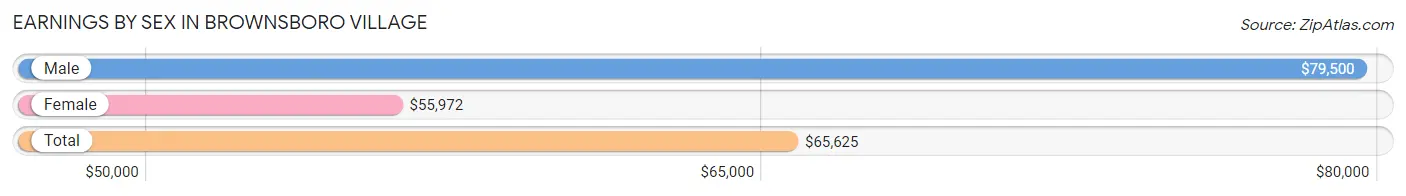
Earnings by Sex in Brownsboro Village
Average Earnings in Brownsboro Village are $65,625, $79,500 for men and $55,972 for women, a difference of 29.6%.
| Sex | Number | Average Earnings |
| Male | 86 (45.0%) | $79,500 |
| Female | 105 (55.0%) | $55,972 |
| Total | 191 (100.0%) | $65,625 |
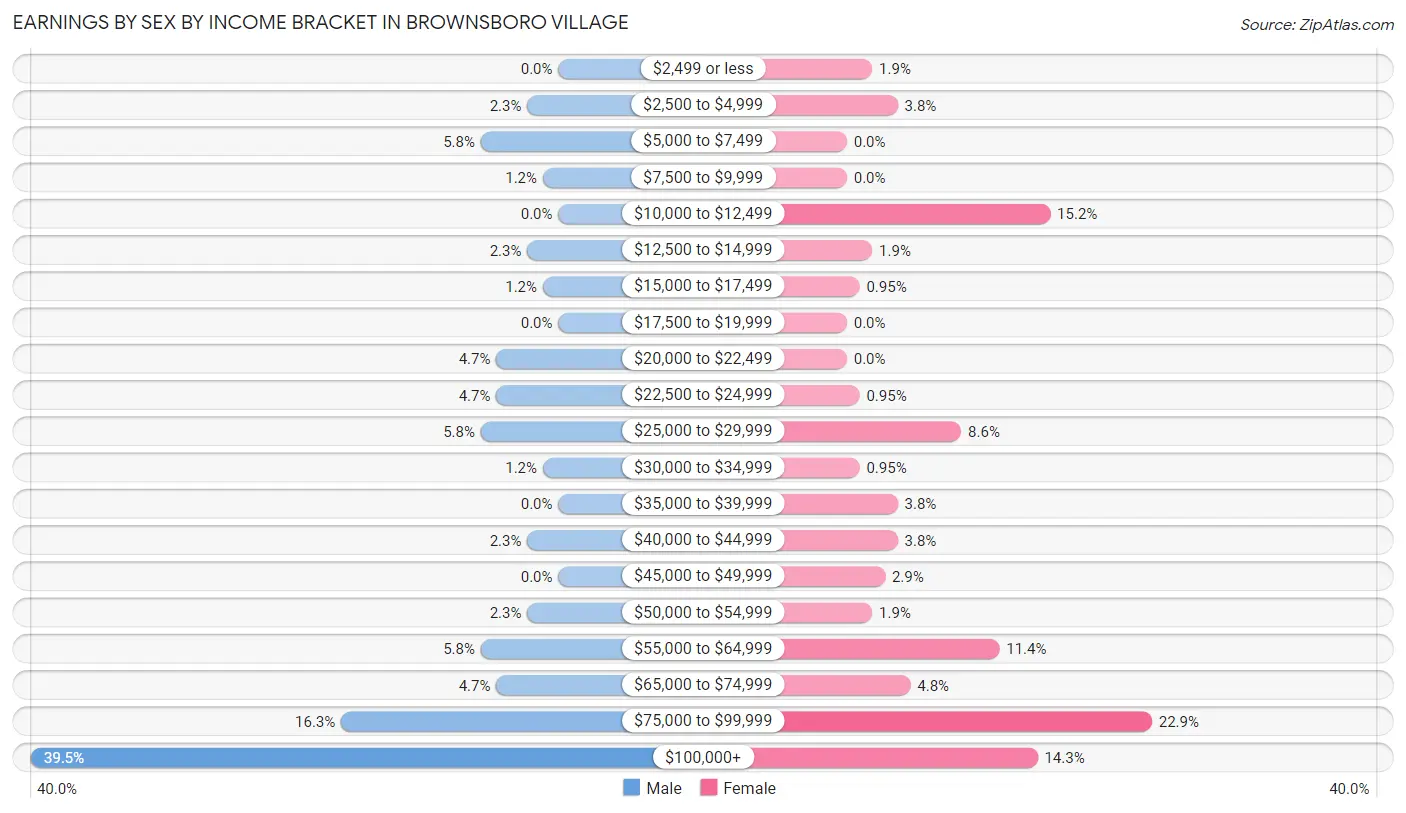
Earnings by Sex by Income Bracket in Brownsboro Village
The most common earnings brackets in Brownsboro Village are $100,000+ for men (34 | 39.5%) and $75,000 to $99,999 for women (24 | 22.9%).
| Income | Male | Female |
| $2,499 or less | 0 (0.0%) | 2 (1.9%) |
| $2,500 to $4,999 | 2 (2.3%) | 4 (3.8%) |
| $5,000 to $7,499 | 5 (5.8%) | 0 (0.0%) |
| $7,500 to $9,999 | 1 (1.2%) | 0 (0.0%) |
| $10,000 to $12,499 | 0 (0.0%) | 16 (15.2%) |
| $12,500 to $14,999 | 2 (2.3%) | 2 (1.9%) |
| $15,000 to $17,499 | 1 (1.2%) | 1 (0.9%) |
| $17,500 to $19,999 | 0 (0.0%) | 0 (0.0%) |
| $20,000 to $22,499 | 4 (4.6%) | 0 (0.0%) |
| $22,500 to $24,999 | 4 (4.6%) | 1 (0.9%) |
| $25,000 to $29,999 | 5 (5.8%) | 9 (8.6%) |
| $30,000 to $34,999 | 1 (1.2%) | 1 (0.9%) |
| $35,000 to $39,999 | 0 (0.0%) | 4 (3.8%) |
| $40,000 to $44,999 | 2 (2.3%) | 4 (3.8%) |
| $45,000 to $49,999 | 0 (0.0%) | 3 (2.9%) |
| $50,000 to $54,999 | 2 (2.3%) | 2 (1.9%) |
| $55,000 to $64,999 | 5 (5.8%) | 12 (11.4%) |
| $65,000 to $74,999 | 4 (4.6%) | 5 (4.8%) |
| $75,000 to $99,999 | 14 (16.3%) | 24 (22.9%) |
| $100,000+ | 34 (39.5%) | 15 (14.3%) |
| Total | 86 (100.0%) | 105 (100.0%) |
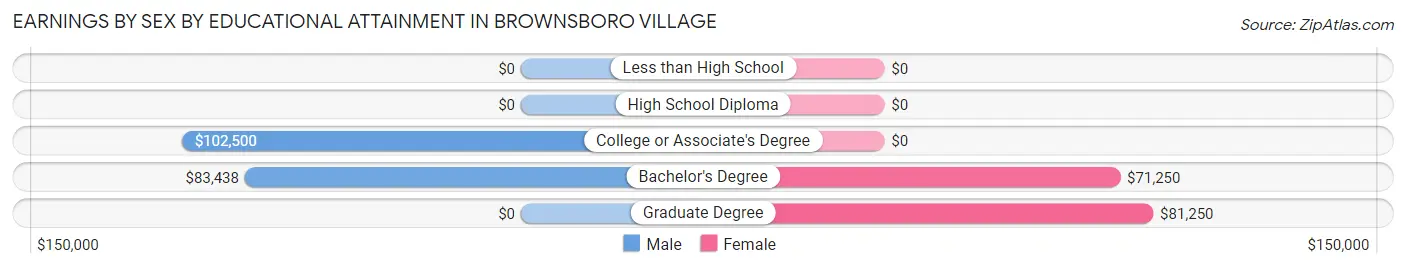
Earnings by Sex by Educational Attainment in Brownsboro Village
Average earnings in Brownsboro Village are $82,750 for men and $56,389 for women, a difference of 31.9%. Men with an educational attainment of college or associate's degree enjoy the highest average annual earnings of $102,500, while those with bachelor's degree education earn the least with $83,438. Women with an educational attainment of graduate degree earn the most with the average annual earnings of $81,250, while those with bachelor's degree education have the smallest earnings of $71,250.
| Educational Attainment | Male Income | Female Income |
| Less than High School | - | - |
| High School Diploma | - | - |
| College or Associate's Degree | $102,500 | $0 |
| Bachelor's Degree | $83,438 | $71,250 |
| Graduate Degree | - | - |
| Total | $82,750 | $56,389 |
Family Income in Brownsboro Village
Family Income Brackets in Brownsboro Village
According to the Brownsboro Village family income data, there are 21 families falling into the $200,000+ income range, which is the most common income bracket and makes up 30.4% of all families.
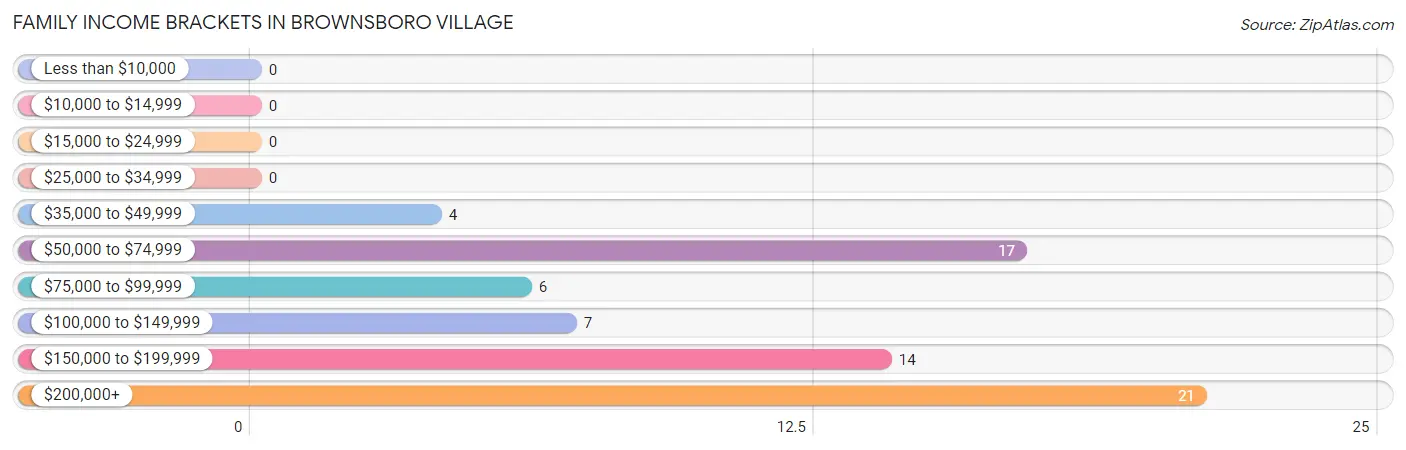
| Income Bracket | # Families | % Families |
| Less than $10,000 | 0 | 0.0% |
| $10,000 to $14,999 | 0 | 0.0% |
| $15,000 to $24,999 | 0 | 0.0% |
| $25,000 to $34,999 | 0 | 0.0% |
| $35,000 to $49,999 | 4 | 5.8% |
| $50,000 to $74,999 | 17 | 24.6% |
| $75,000 to $99,999 | 6 | 8.7% |
| $100,000 to $149,999 | 7 | 10.1% |
| $150,000 to $199,999 | 14 | 20.3% |
| $200,000+ | 21 | 30.4% |
Family Income by Famaliy Size in Brownsboro Village
4-person families (15 | 21.7%) account for the highest median family income in Brownsboro Village with $197,813 per family, while 2-person families (33 | 47.8%) have the highest median income of $79,375 per family member.
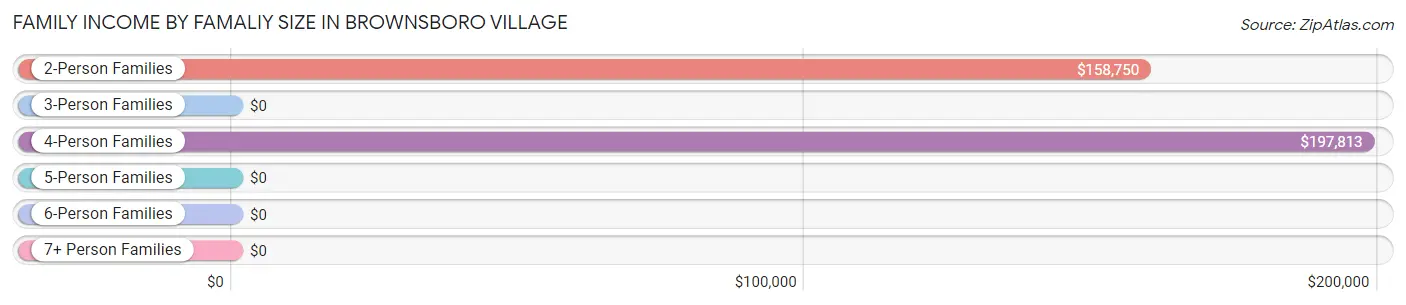
| Income Bracket | # Families | Median Income |
| 2-Person Families | 33 (47.8%) | $158,750 |
| 3-Person Families | 17 (24.6%) | $0 |
| 4-Person Families | 15 (21.7%) | $197,813 |
| 5-Person Families | 4 (5.8%) | $0 |
| 6-Person Families | 0 (0.0%) | $0 |
| 7+ Person Families | 0 (0.0%) | $0 |
| Total | 69 (100.0%) | $158,750 |
Family Income by Number of Earners in Brownsboro Village
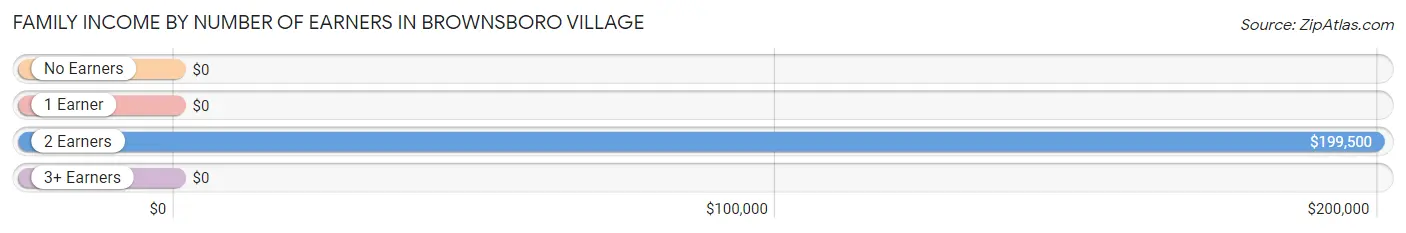
| Number of Earners | # Families | Median Income |
| No Earners | 5 (7.2%) | $0 |
| 1 Earner | 30 (43.5%) | $0 |
| 2 Earners | 30 (43.5%) | $199,500 |
| 3+ Earners | 4 (5.8%) | $0 |
| Total | 69 (100.0%) | $158,750 |
Household Income in Brownsboro Village
Household Income Brackets in Brownsboro Village
With 35 households falling in the category, the $200,000+ income range is the most frequent in Brownsboro Village, accounting for 19.8% of all households. In contrast, only 8 households (4.5%) fall into the $15,000 to $24,999 income bracket, making it the least populous group.
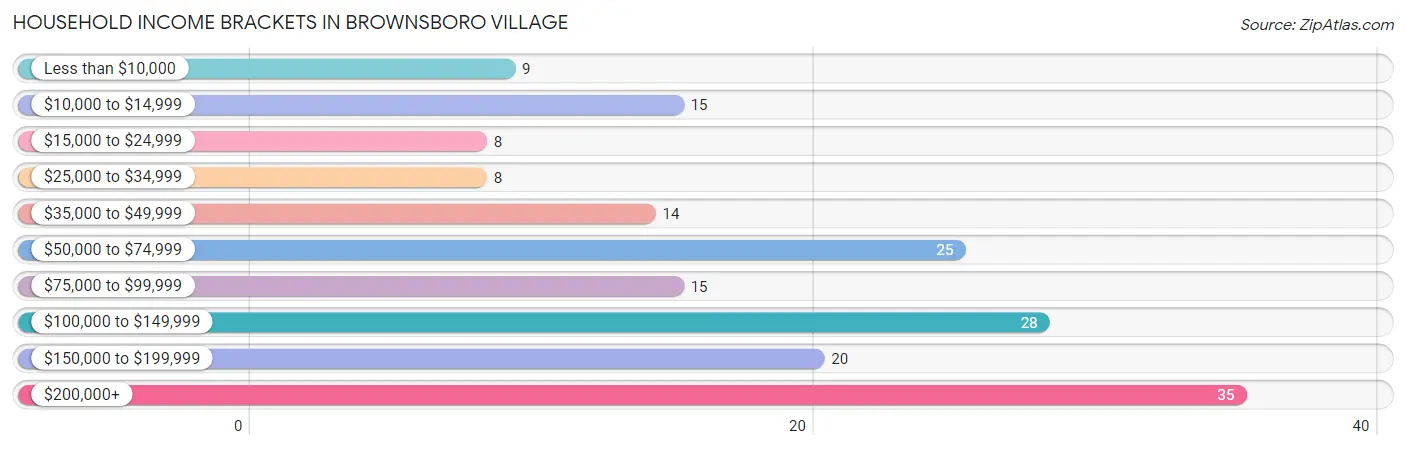
| Income Bracket | # Households | % Households |
| Less than $10,000 | 9 | 5.1% |
| $10,000 to $14,999 | 15 | 8.5% |
| $15,000 to $24,999 | 8 | 4.5% |
| $25,000 to $34,999 | 8 | 4.5% |
| $35,000 to $49,999 | 14 | 7.9% |
| $50,000 to $74,999 | 25 | 14.1% |
| $75,000 to $99,999 | 15 | 8.5% |
| $100,000 to $149,999 | 28 | 15.8% |
| $150,000 to $199,999 | 20 | 11.3% |
| $200,000+ | 35 | 19.8% |
Household Income by Householder Age in Brownsboro Village
The median household income in Brownsboro Village is $89,688, with the highest median household income of $149,375 found in the 25 to 44 years age bracket for the primary householder. A total of 43 households (24.3%) fall into this category.
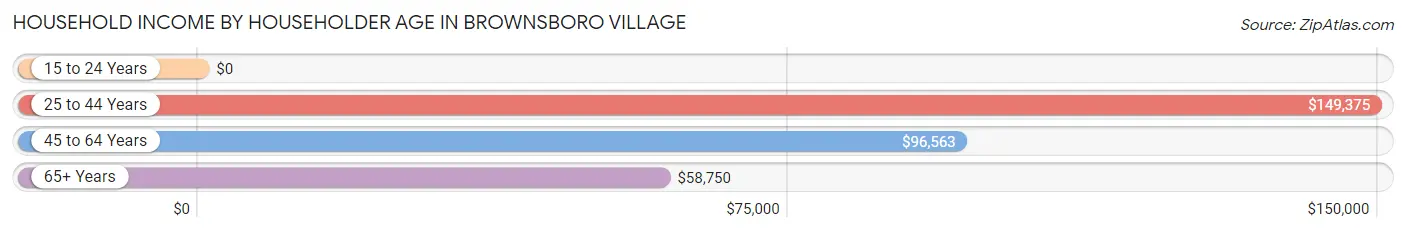
| Income Bracket | # Households | Median Income |
| 15 to 24 Years | 0 (0.0%) | $0 |
| 25 to 44 Years | 43 (24.3%) | $149,375 |
| 45 to 64 Years | 79 (44.6%) | $96,563 |
| 65+ Years | 55 (31.1%) | $58,750 |
| Total | 177 (100.0%) | $89,688 |
Poverty in Brownsboro Village
Income Below Poverty by Sex and Age in Brownsboro Village
With 4.1% poverty level for males and 10.1% for females among the residents of Brownsboro Village, 25 to 34 year old males and 45 to 54 year old females are the most vulnerable to poverty, with 5 males (20.8%) and 15 females (39.5%) in their respective age groups living below the poverty level.
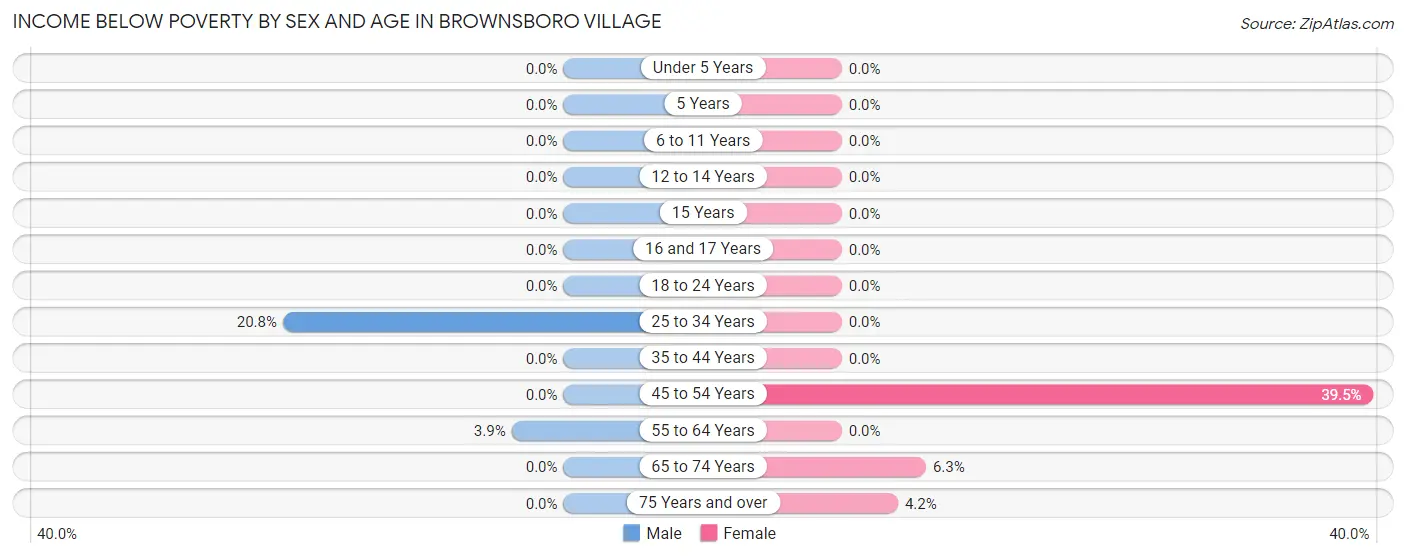
| Age Bracket | Male | Female |
| Under 5 Years | 0 (0.0%) | 0 (0.0%) |
| 5 Years | 0 (0.0%) | 0 (0.0%) |
| 6 to 11 Years | 0 (0.0%) | 0 (0.0%) |
| 12 to 14 Years | 0 (0.0%) | 0 (0.0%) |
| 15 Years | 0 (0.0%) | 0 (0.0%) |
| 16 and 17 Years | 0 (0.0%) | 0 (0.0%) |
| 18 to 24 Years | 0 (0.0%) | 0 (0.0%) |
| 25 to 34 Years | 5 (20.8%) | 0 (0.0%) |
| 35 to 44 Years | 0 (0.0%) | 0 (0.0%) |
| 45 to 54 Years | 0 (0.0%) | 15 (39.5%) |
| 55 to 64 Years | 1 (3.8%) | 0 (0.0%) |
| 65 to 74 Years | 0 (0.0%) | 2 (6.2%) |
| 75 Years and over | 0 (0.0%) | 1 (4.2%) |
| Total | 6 (4.1%) | 18 (10.1%) |
Income Above Poverty by Sex and Age in Brownsboro Village
According to the poverty statistics in Brownsboro Village, males aged under 5 years and females aged under 5 years are the age groups that are most secure financially, with 100.0% of males and 100.0% of females in these age groups living above the poverty line.
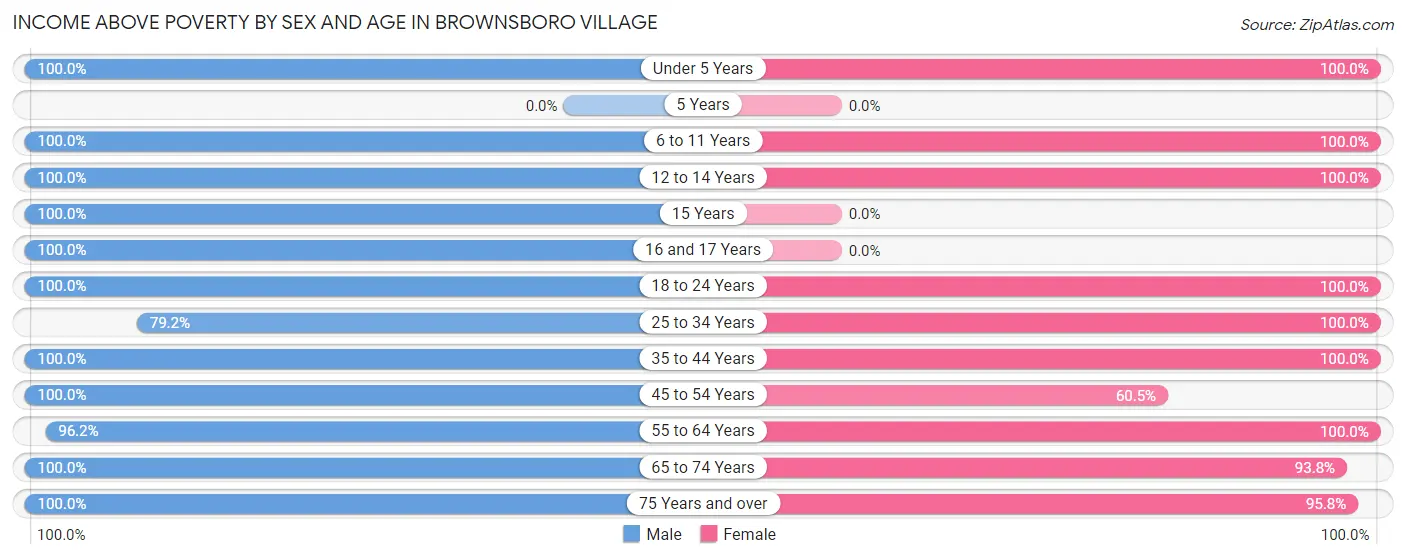
| Age Bracket | Male | Female |
| Under 5 Years | 8 (100.0%) | 4 (100.0%) |
| 5 Years | 0 (0.0%) | 0 (0.0%) |
| 6 to 11 Years | 20 (100.0%) | 9 (100.0%) |
| 12 to 14 Years | 10 (100.0%) | 4 (100.0%) |
| 15 Years | 1 (100.0%) | 0 (0.0%) |
| 16 and 17 Years | 1 (100.0%) | 0 (0.0%) |
| 18 to 24 Years | 7 (100.0%) | 3 (100.0%) |
| 25 to 34 Years | 19 (79.2%) | 25 (100.0%) |
| 35 to 44 Years | 14 (100.0%) | 11 (100.0%) |
| 45 to 54 Years | 11 (100.0%) | 23 (60.5%) |
| 55 to 64 Years | 25 (96.2%) | 29 (100.0%) |
| 65 to 74 Years | 13 (100.0%) | 30 (93.8%) |
| 75 Years and over | 12 (100.0%) | 23 (95.8%) |
| Total | 141 (95.9%) | 161 (89.9%) |
Income Below Poverty Among Married-Couple Families in Brownsboro Village
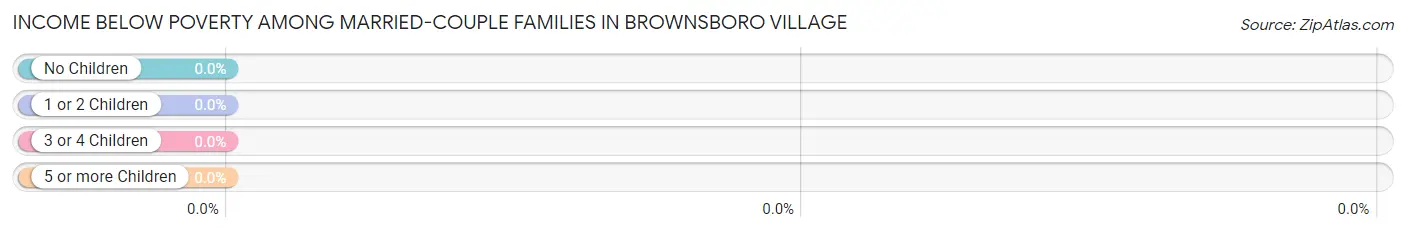
| Children | Above Poverty | Below Poverty |
| No Children | 33 (100.0%) | 0 (0.0%) |
| 1 or 2 Children | 17 (100.0%) | 0 (0.0%) |
| 3 or 4 Children | 2 (100.0%) | 0 (0.0%) |
| 5 or more Children | 0 (0.0%) | 0 (0.0%) |
| Total | 52 (100.0%) | 0 (0.0%) |
Income Below Poverty Among Single-Parent Households in Brownsboro Village
| Children | Single Father | Single Mother |
| No Children | 0 (0.0%) | 0 (0.0%) |
| 1 or 2 Children | 0 (0.0%) | 0 (0.0%) |
| 3 or 4 Children | 0 (0.0%) | 0 (0.0%) |
| 5 or more Children | 0 (0.0%) | 0 (0.0%) |
| Total | 0 (0.0%) | 0 (0.0%) |
Income Below Poverty Among Married-Couple vs Single-Parent Households in Brownsboro Village
| Children | Married-Couple Families | Single-Parent Households |
| No Children | 0 (0.0%) | 0 (0.0%) |
| 1 or 2 Children | 0 (0.0%) | 0 (0.0%) |
| 3 or 4 Children | 0 (0.0%) | 0 (0.0%) |
| 5 or more Children | 0 (0.0%) | 0 (0.0%) |
| Total | 0 (0.0%) | 0 (0.0%) |
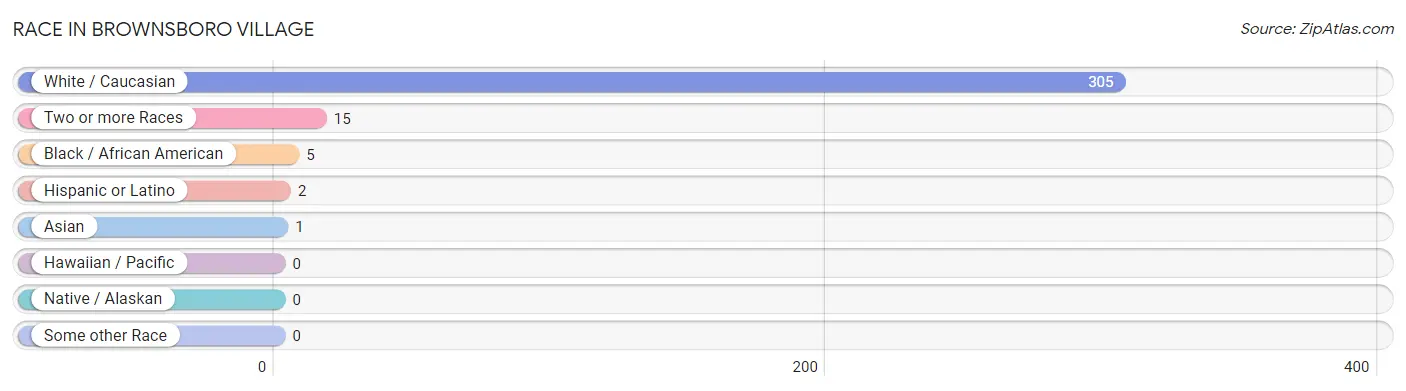
Race in Brownsboro Village
The most populous races in Brownsboro Village are White / Caucasian (305 | 93.6%), Two or more Races (15 | 4.6%), and Black / African American (5 | 1.5%).
| Race | # Population | % Population |
| Asian | 1 | 0.3% |
| Black / African American | 5 | 1.5% |
| Hawaiian / Pacific | 0 | 0.0% |
| Hispanic or Latino | 2 | 0.6% |
| Native / Alaskan | 0 | 0.0% |
| White / Caucasian | 305 | 93.6% |
| Two or more Races | 15 | 4.6% |
| Some other Race | 0 | 0.0% |
| Total | 326 | 100.0% |
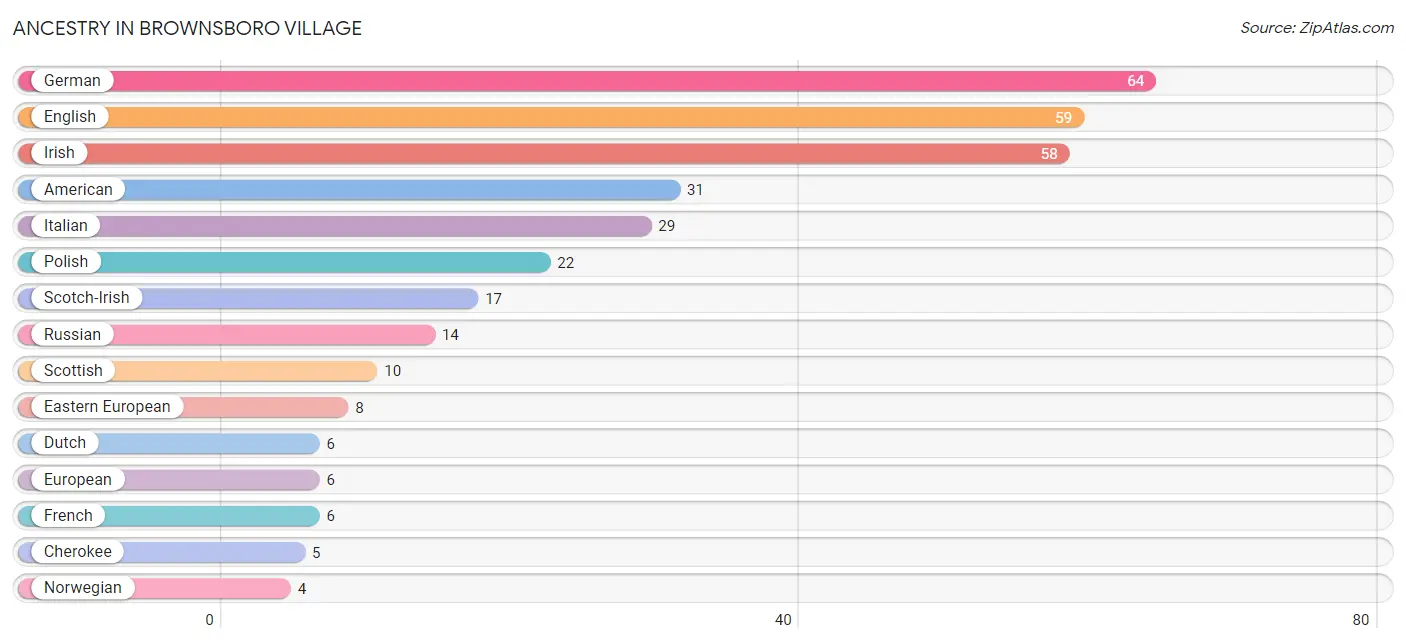
Ancestry in Brownsboro Village
The most populous ancestries reported in Brownsboro Village are German (64 | 19.6%), English (59 | 18.1%), Irish (58 | 17.8%), American (31 | 9.5%), and Italian (29 | 8.9%), together accounting for 73.9% of all Brownsboro Village residents.
| Ancestry | # Population | % Population |
| American | 31 | 9.5% |
| Arab | 3 | 0.9% |
| Austrian | 1 | 0.3% |
| Cherokee | 5 | 1.5% |
| Chickasaw | 3 | 0.9% |
| Colombian | 1 | 0.3% |
| Croatian | 2 | 0.6% |
| Czech | 2 | 0.6% |
| Danish | 1 | 0.3% |
| Dutch | 6 | 1.8% |
| Eastern European | 8 | 2.5% |
| English | 59 | 18.1% |
| European | 6 | 1.8% |
| French | 6 | 1.8% |
| German | 64 | 19.6% |
| Irish | 58 | 17.8% |
| Italian | 29 | 8.9% |
| Lebanese | 3 | 0.9% |
| Norwegian | 4 | 1.2% |
| Polish | 22 | 6.8% |
| Russian | 14 | 4.3% |
| Scandinavian | 2 | 0.6% |
| Scotch-Irish | 17 | 5.2% |
| Scottish | 10 | 3.1% |
| Slovak | 3 | 0.9% |
| South American | 1 | 0.3% |
| Spanish | 1 | 0.3% |
| Swiss | 4 | 1.2% |
| Thai | 1 | 0.3% |
| Welsh | 1 | 0.3% | View All 30 Rows |
Immigrants in Brownsboro Village
The most numerous immigrant groups reported in Brownsboro Village came from Europe (3 | 0.9%), Czechoslovakia (2 | 0.6%), Eastern Europe (2 | 0.6%), Canada (1 | 0.3%), and Colombia (1 | 0.3%), together accounting for 2.8% of all Brownsboro Village residents.
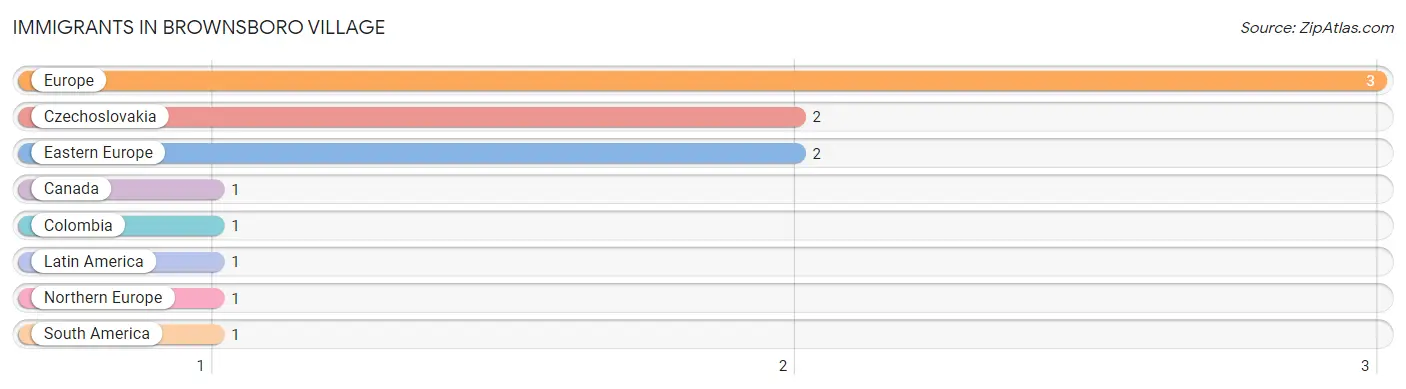
| Immigration Origin | # Population | % Population |
| Canada | 1 | 0.3% |
| Colombia | 1 | 0.3% |
| Czechoslovakia | 2 | 0.6% |
| Eastern Europe | 2 | 0.6% |
| Europe | 3 | 0.9% |
| Latin America | 1 | 0.3% |
| Northern Europe | 1 | 0.3% |
| South America | 1 | 0.3% | View All 8 Rows |
Sex and Age in Brownsboro Village
Sex and Age in Brownsboro Village
The most populous age groups in Brownsboro Village are 10 to 14 Years (26 | 17.7%) for men and 50 to 54 Years (23 | 12.9%) for women.
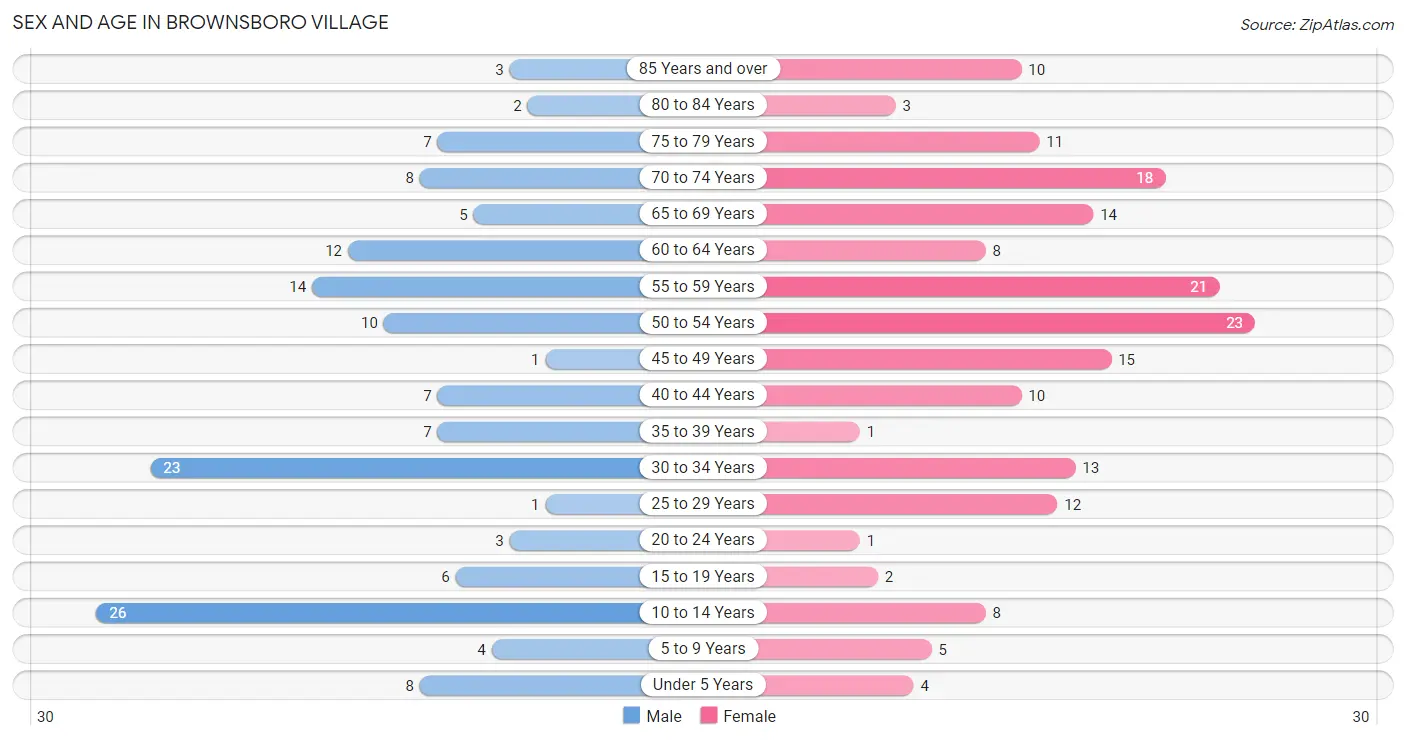
| Age Bracket | Male | Female |
| Under 5 Years | 8 (5.4%) | 4 (2.2%) |
| 5 to 9 Years | 4 (2.7%) | 5 (2.8%) |
| 10 to 14 Years | 26 (17.7%) | 8 (4.5%) |
| 15 to 19 Years | 6 (4.1%) | 2 (1.1%) |
| 20 to 24 Years | 3 (2.0%) | 1 (0.6%) |
| 25 to 29 Years | 1 (0.7%) | 12 (6.7%) |
| 30 to 34 Years | 23 (15.7%) | 13 (7.3%) |
| 35 to 39 Years | 7 (4.8%) | 1 (0.6%) |
| 40 to 44 Years | 7 (4.8%) | 10 (5.6%) |
| 45 to 49 Years | 1 (0.7%) | 15 (8.4%) |
| 50 to 54 Years | 10 (6.8%) | 23 (12.9%) |
| 55 to 59 Years | 14 (9.5%) | 21 (11.7%) |
| 60 to 64 Years | 12 (8.2%) | 8 (4.5%) |
| 65 to 69 Years | 5 (3.4%) | 14 (7.8%) |
| 70 to 74 Years | 8 (5.4%) | 18 (10.1%) |
| 75 to 79 Years | 7 (4.8%) | 11 (6.1%) |
| 80 to 84 Years | 2 (1.4%) | 3 (1.7%) |
| 85 Years and over | 3 (2.0%) | 10 (5.6%) |
| Total | 147 (100.0%) | 179 (100.0%) |
Families and Households in Brownsboro Village
Median Family Size in Brownsboro Village
The median family size in Brownsboro Village is 2.93 persons per family, with married-couple families (52 | 75.4%) accounting for the largest median family size of 3.04 persons per family. On the other hand, single male/father families (5 | 7.2%) represent the smallest median family size with 2.40 persons per family.
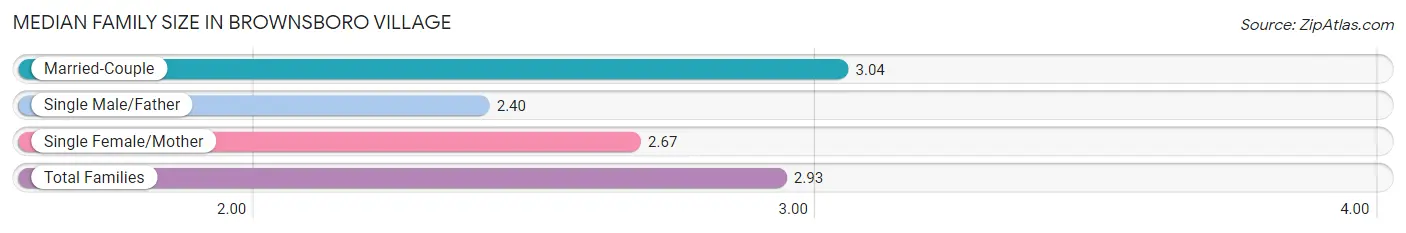
| Family Type | # Families | Family Size |
| Married-Couple | 52 (75.4%) | 3.04 |
| Single Male/Father | 5 (7.2%) | 2.40 |
| Single Female/Mother | 12 (17.4%) | 2.67 |
| Total Families | 69 (100.0%) | 2.93 |
Median Household Size in Brownsboro Village
The median household size in Brownsboro Village is 1.84 persons per household, with married-couple households (52 | 29.4%) accounting for the largest median household size of 3.04 persons per household. non-family households (108 | 61.0%) represent the smallest median household size with 1.15 persons per household.
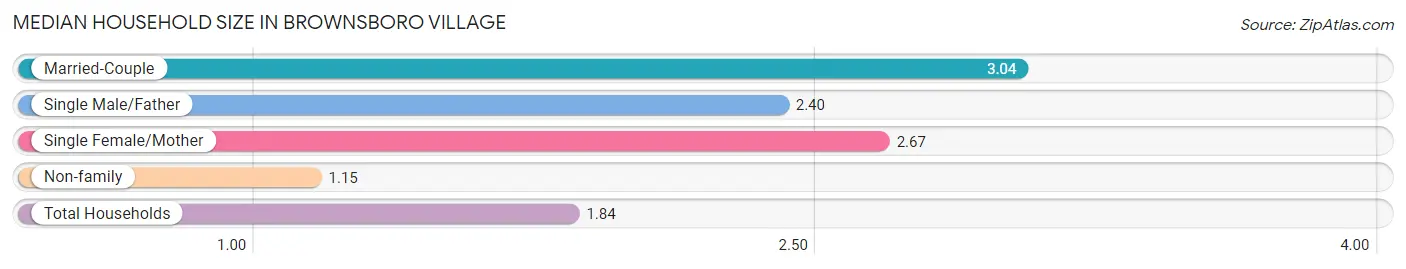
| Household Type | # Households | Household Size |
| Married-Couple | 52 (29.4%) | 3.04 |
| Single Male/Father | 5 (2.8%) | 2.40 |
| Single Female/Mother | 12 (6.8%) | 2.67 |
| Non-family | 108 (61.0%) | 1.15 |
| Total Households | 177 (100.0%) | 1.84 |
Household Size by Marriage Status in Brownsboro Village
Out of a total of 177 households in Brownsboro Village, 69 (39.0%) are family households, while 108 (61.0%) are nonfamily households. The most numerous type of family households are 2-person households, comprising 33, and the most common type of nonfamily households are 1-person households, comprising 97.
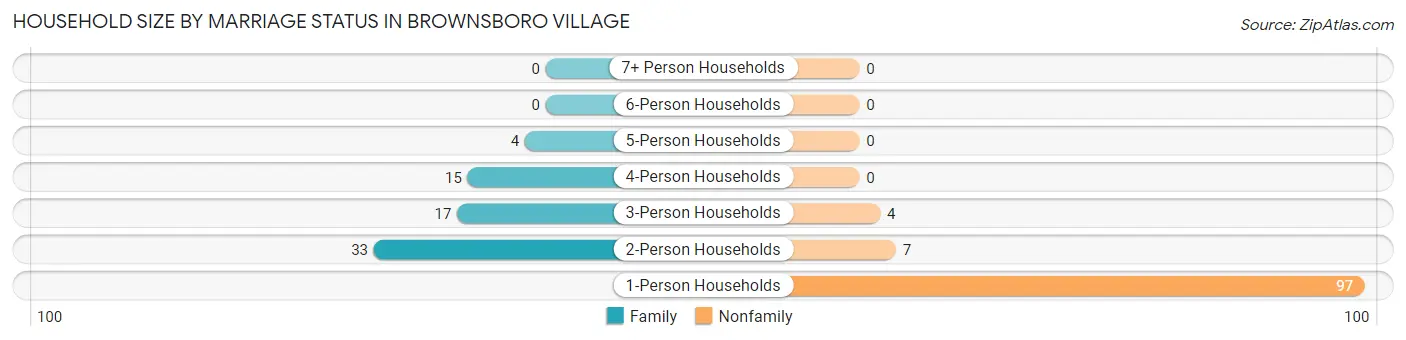
| Household Size | Family Households | Nonfamily Households |
| 1-Person Households | - | 97 (54.8%) |
| 2-Person Households | 33 (18.6%) | 7 (4.0%) |
| 3-Person Households | 17 (9.6%) | 4 (2.3%) |
| 4-Person Households | 15 (8.5%) | 0 (0.0%) |
| 5-Person Households | 4 (2.3%) | 0 (0.0%) |
| 6-Person Households | 0 (0.0%) | 0 (0.0%) |
| 7+ Person Households | 0 (0.0%) | 0 (0.0%) |
| Total | 69 (39.0%) | 108 (61.0%) |
Female Fertility in Brownsboro Village
Fertility by Age in Brownsboro Village
Average fertility rate in Brownsboro Village is 93.0 births per 1,000 women. Women in the age bracket of 20 to 34 years have the highest fertility rate with 192.0 births per 1,000 women. Women in the age bracket of 20 to 34 years acount for 100.0% of all women with births.
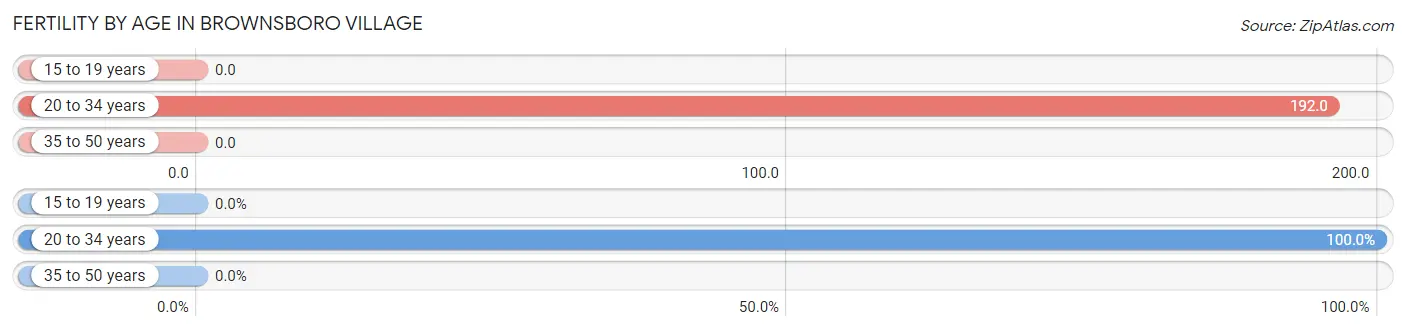
| Age Bracket | Women with Births | Births / 1,000 Women |
| 15 to 19 years | 0 (0.0%) | 0.0 |
| 20 to 34 years | 5 (100.0%) | 192.0 |
| 35 to 50 years | 0 (0.0%) | 0.0 |
| Total | 5 (100.0%) | 93.0 |
Fertility by Age by Marriage Status in Brownsboro Village
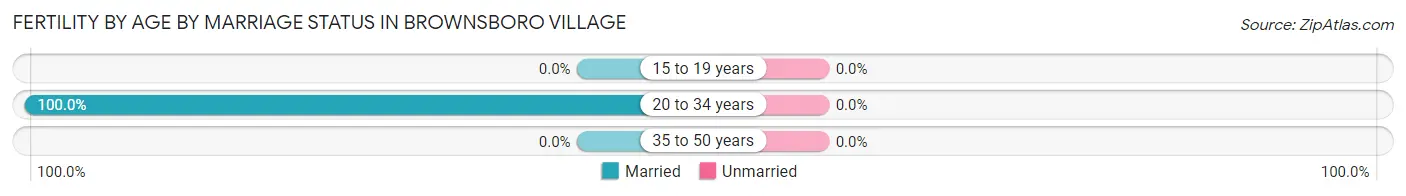
| Age Bracket | Married | Unmarried |
| 15 to 19 years | 0 (0.0%) | 0 (0.0%) |
| 20 to 34 years | 5 (100.0%) | 0 (0.0%) |
| 35 to 50 years | 0 (0.0%) | 0 (0.0%) |
| Total | 5 (100.0%) | 0 (0.0%) |
Fertility by Education in Brownsboro Village
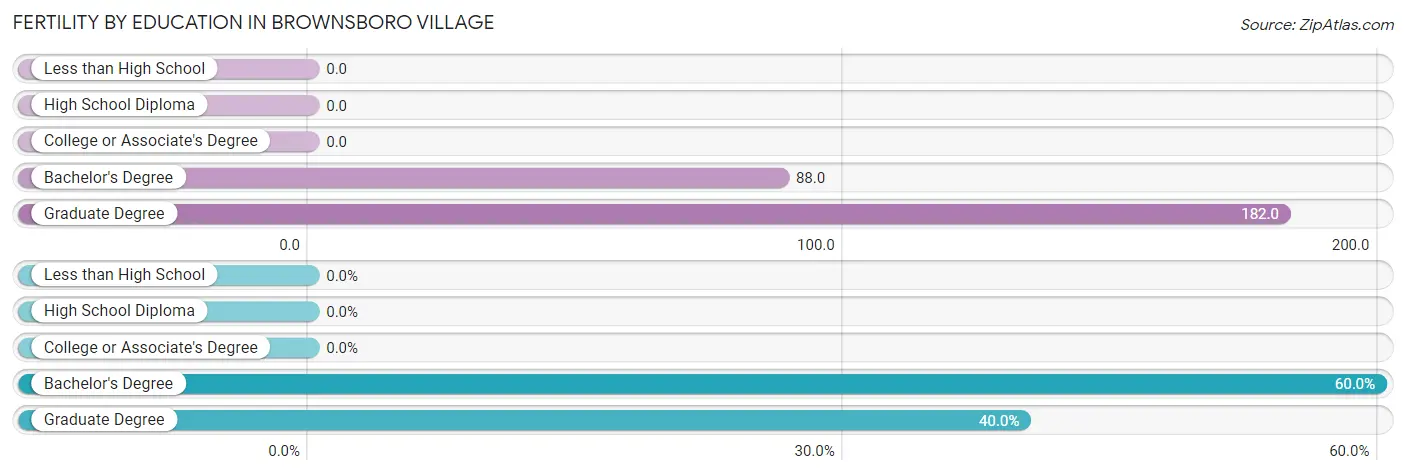
| Educational Attainment | Women with Births | Births / 1,000 Women |
| Less than High School | 0 (0.0%) | 0.0 |
| High School Diploma | 0 (0.0%) | 0.0 |
| College or Associate's Degree | 0 (0.0%) | 0.0 |
| Bachelor's Degree | 3 (60.0%) | 88.0 |
| Graduate Degree | 2 (40.0%) | 182.0 |
| Total | 5 (100.0%) | 93.0 |
Fertility by Education by Marriage Status in Brownsboro Village
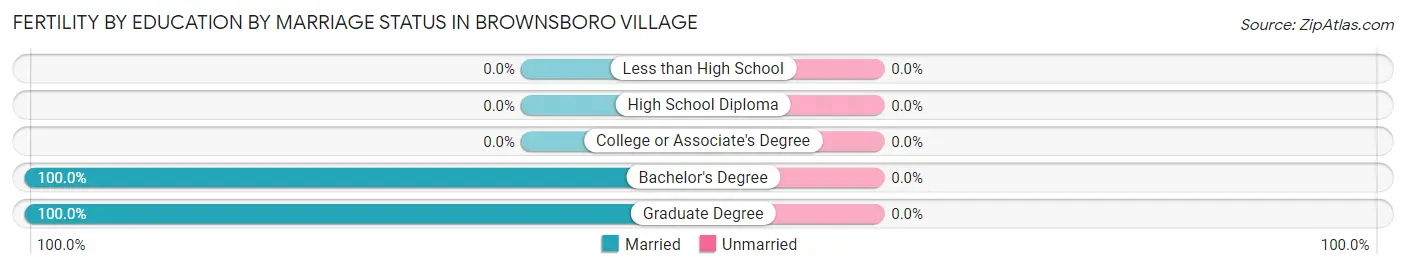
| Educational Attainment | Married | Unmarried |
| Less than High School | 0 (0.0%) | 0 (0.0%) |
| High School Diploma | 0 (0.0%) | 0 (0.0%) |
| College or Associate's Degree | 0 (0.0%) | 0 (0.0%) |
| Bachelor's Degree | 3 (100.0%) | 0 (0.0%) |
| Graduate Degree | 2 (100.0%) | 0 (0.0%) |
| Total | 5 (100.0%) | 0 (0.0%) |
Employment Characteristics in Brownsboro Village
Employment by Class of Employer in Brownsboro Village
Among the 168 employed individuals in Brownsboro Village, private company employees (108 | 64.3%), self-employed (not incorporated) (20 | 11.9%), and not-for-profit organizations (14 | 8.3%) make up the most common classes of employment.
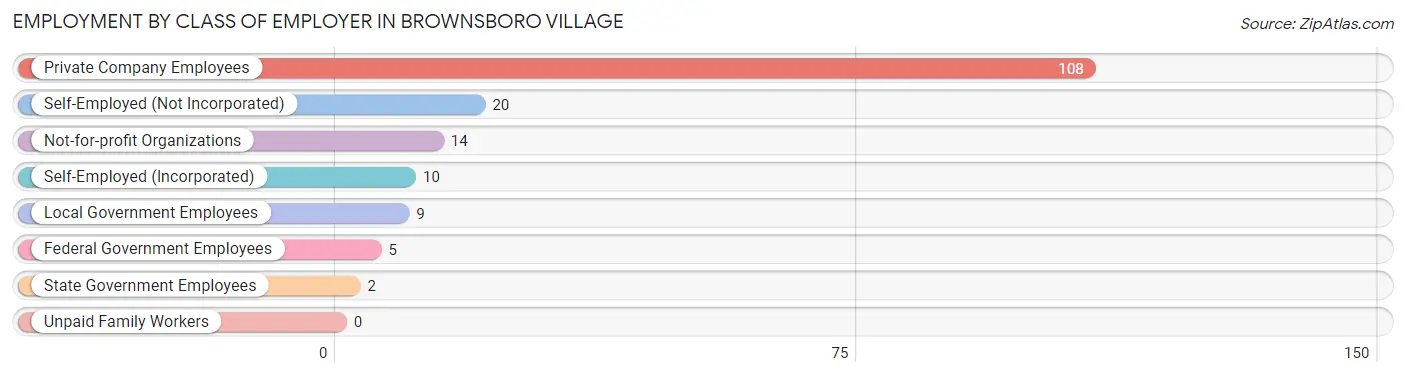
| Employer Class | # Employees | % Employees |
| Private Company Employees | 108 | 64.3% |
| Self-Employed (Incorporated) | 10 | 5.9% |
| Self-Employed (Not Incorporated) | 20 | 11.9% |
| Not-for-profit Organizations | 14 | 8.3% |
| Local Government Employees | 9 | 5.4% |
| State Government Employees | 2 | 1.2% |
| Federal Government Employees | 5 | 3.0% |
| Unpaid Family Workers | 0 | 0.0% |
| Total | 168 | 100.0% |
Employment Status by Age in Brownsboro Village
According to the labor force statistics for Brownsboro Village, out of the total population over 16 years of age (270), 64.1% or 173 individuals are in the labor force, with 2.9% or 5 of them unemployed. The age group with the highest labor force participation rate is 20 to 24 years, with 100.0% or 4 individuals in the labor force. Within the labor force, the 16 to 19 years age range has the highest percentage of unemployed individuals, with 50.0% or 2 of them being unemployed.
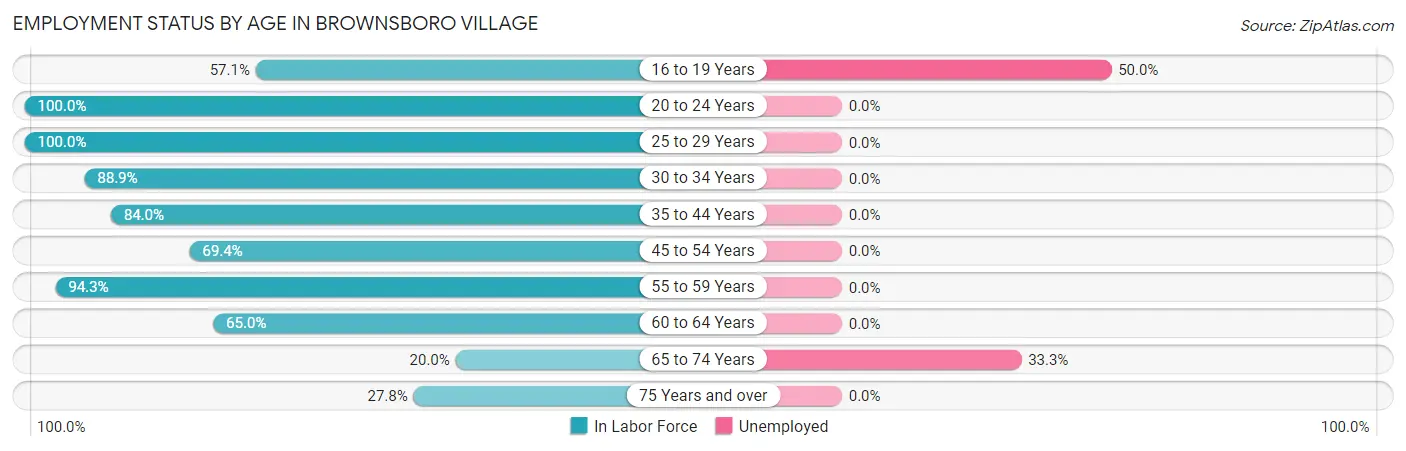
| Age Bracket | In Labor Force | Unemployed |
| 16 to 19 Years | 4 (57.1%) | 2 (50.0%) |
| 20 to 24 Years | 4 (100.0%) | 0 (0.0%) |
| 25 to 29 Years | 13 (100.0%) | 0 (0.0%) |
| 30 to 34 Years | 32 (88.9%) | 0 (0.0%) |
| 35 to 44 Years | 21 (84.0%) | 0 (0.0%) |
| 45 to 54 Years | 34 (69.4%) | 0 (0.0%) |
| 55 to 59 Years | 33 (94.3%) | 0 (0.0%) |
| 60 to 64 Years | 13 (65.0%) | 0 (0.0%) |
| 65 to 74 Years | 9 (20.0%) | 3 (33.3%) |
| 75 Years and over | 10 (27.8%) | 0 (0.0%) |
| Total | 173 (64.1%) | 5 (2.9%) |
Employment Status by Educational Attainment in Brownsboro Village
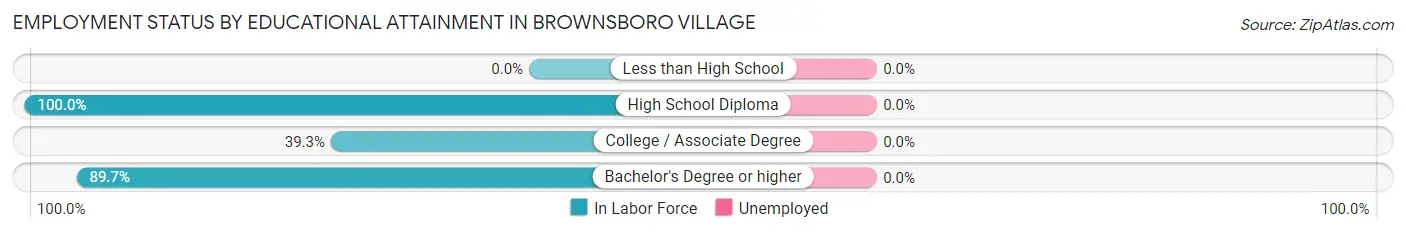
| Educational Attainment | In Labor Force | Unemployed |
| Less than High School | 0 (0.0%) | 0 (0.0%) |
| High School Diploma | 5 (100.0%) | 0 (0.0%) |
| College / Associate Degree | 11 (39.3%) | 0 (0.0%) |
| Bachelor's Degree or higher | 130 (89.7%) | 0 (0.0%) |
| Total | 146 (82.0%) | 0 (0.0%) |
Employment Occupations by Sex in Brownsboro Village
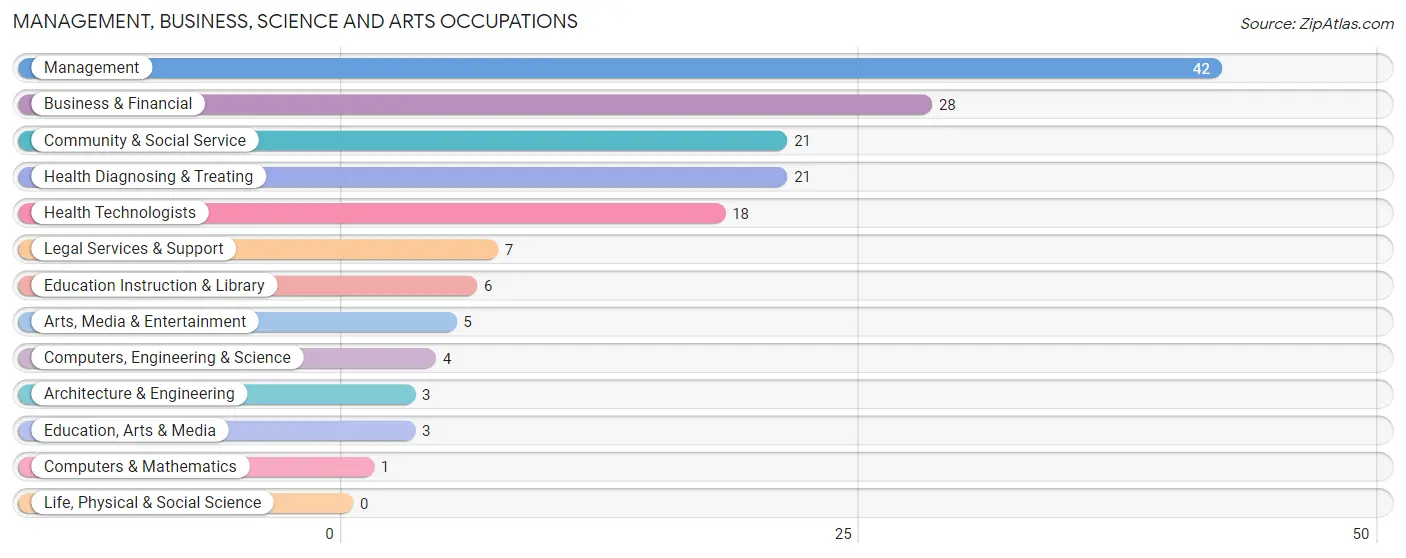
Management, Business, Science and Arts Occupations
The most common Management, Business, Science and Arts occupations in Brownsboro Village are Management (42 | 25.0%), Business & Financial (28 | 16.7%), Community & Social Service (21 | 12.5%), Health Diagnosing & Treating (21 | 12.5%), and Health Technologists (18 | 10.7%).
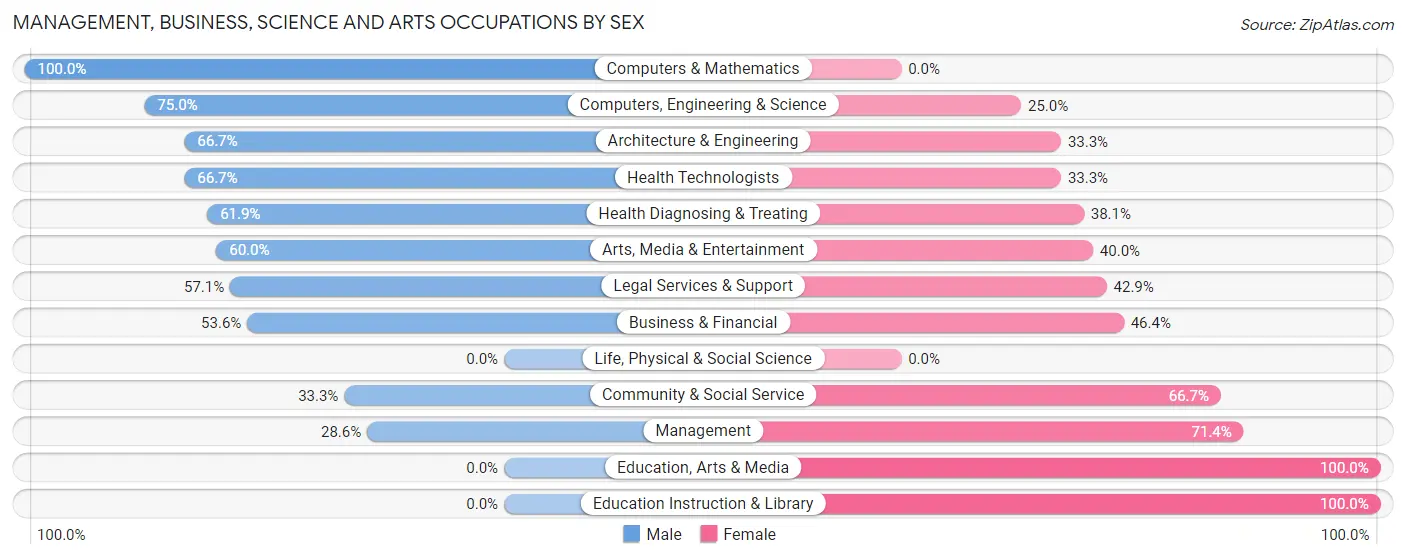
Management, Business, Science and Arts Occupations by Sex
Within the Management, Business, Science and Arts occupations in Brownsboro Village, the most male-oriented occupations are Computers & Mathematics (100.0%), Computers, Engineering & Science (75.0%), and Architecture & Engineering (66.7%), while the most female-oriented occupations are Education, Arts & Media (100.0%), Education Instruction & Library (100.0%), and Management (71.4%).
| Occupation | Male | Female |
| Management | 12 (28.6%) | 30 (71.4%) |
| Business & Financial | 15 (53.6%) | 13 (46.4%) |
| Computers, Engineering & Science | 3 (75.0%) | 1 (25.0%) |
| Computers & Mathematics | 1 (100.0%) | 0 (0.0%) |
| Architecture & Engineering | 2 (66.7%) | 1 (33.3%) |
| Life, Physical & Social Science | 0 (0.0%) | 0 (0.0%) |
| Community & Social Service | 7 (33.3%) | 14 (66.7%) |
| Education, Arts & Media | 0 (0.0%) | 3 (100.0%) |
| Legal Services & Support | 4 (57.1%) | 3 (42.9%) |
| Education Instruction & Library | 0 (0.0%) | 6 (100.0%) |
| Arts, Media & Entertainment | 3 (60.0%) | 2 (40.0%) |
| Health Diagnosing & Treating | 13 (61.9%) | 8 (38.1%) |
| Health Technologists | 12 (66.7%) | 6 (33.3%) |
| Total (Category) | 50 (43.1%) | 66 (56.9%) |
| Total (Overall) | 84 (50.0%) | 84 (50.0%) |
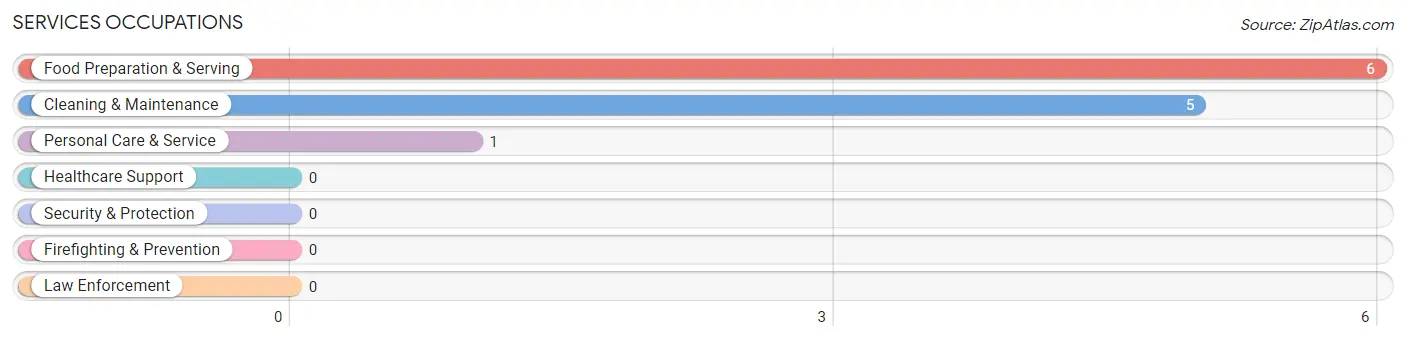
Services Occupations
The most common Services occupations in Brownsboro Village are Food Preparation & Serving (6 | 3.6%), Cleaning & Maintenance (5 | 3.0%), and Personal Care & Service (1 | 0.6%).
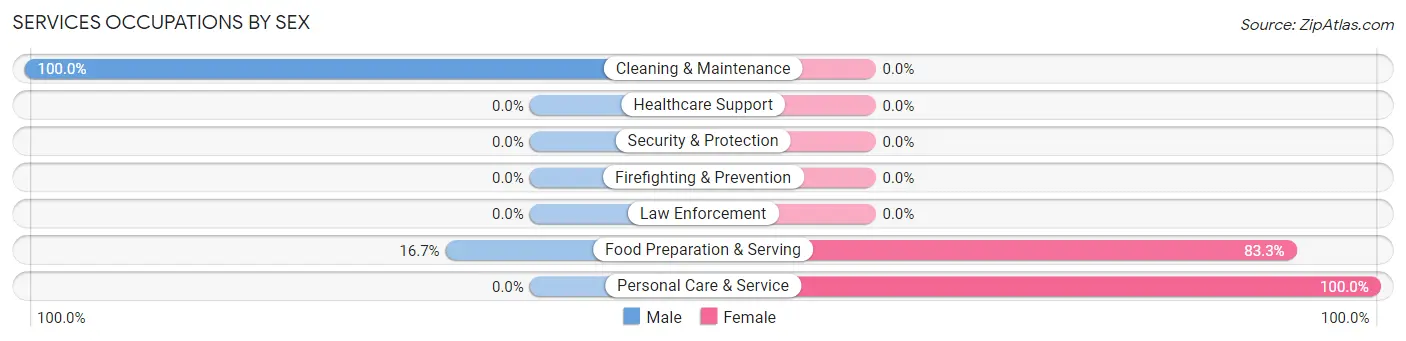
Services Occupations by Sex
Within the Services occupations in Brownsboro Village, the most male-oriented occupations are Cleaning & Maintenance (100.0%), and Food Preparation & Serving (16.7%), while the most female-oriented occupations are Personal Care & Service (100.0%), and Food Preparation & Serving (83.3%).
| Occupation | Male | Female |
| Healthcare Support | 0 (0.0%) | 0 (0.0%) |
| Security & Protection | 0 (0.0%) | 0 (0.0%) |
| Firefighting & Prevention | 0 (0.0%) | 0 (0.0%) |
| Law Enforcement | 0 (0.0%) | 0 (0.0%) |
| Food Preparation & Serving | 1 (16.7%) | 5 (83.3%) |
| Cleaning & Maintenance | 5 (100.0%) | 0 (0.0%) |
| Personal Care & Service | 0 (0.0%) | 1 (100.0%) |
| Total (Category) | 6 (50.0%) | 6 (50.0%) |
| Total (Overall) | 84 (50.0%) | 84 (50.0%) |
Sales and Office Occupations
The most common Sales and Office occupations in Brownsboro Village are Sales & Related (25 | 14.9%), and Office & Administration (6 | 3.6%).
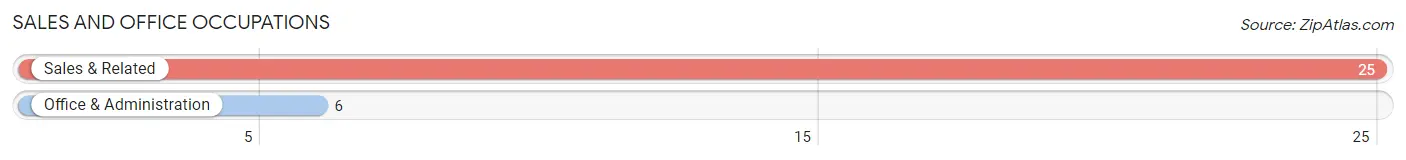
Sales and Office Occupations by Sex
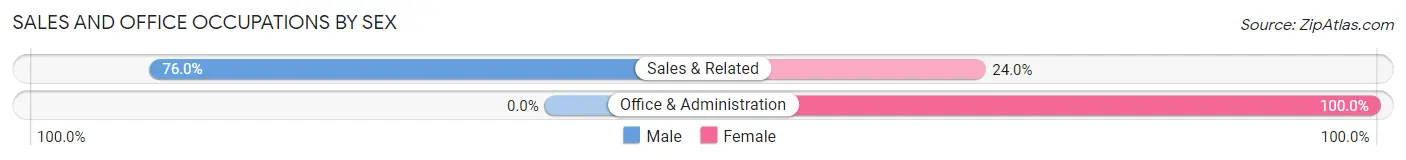
| Occupation | Male | Female |
| Sales & Related | 19 (76.0%) | 6 (24.0%) |
| Office & Administration | 0 (0.0%) | 6 (100.0%) |
| Total (Category) | 19 (61.3%) | 12 (38.7%) |
| Total (Overall) | 84 (50.0%) | 84 (50.0%) |
Natural Resources, Construction and Maintenance Occupations
The most common Natural Resources, Construction and Maintenance occupations in Brownsboro Village are , and Construction & Extraction (2 | 1.2%).
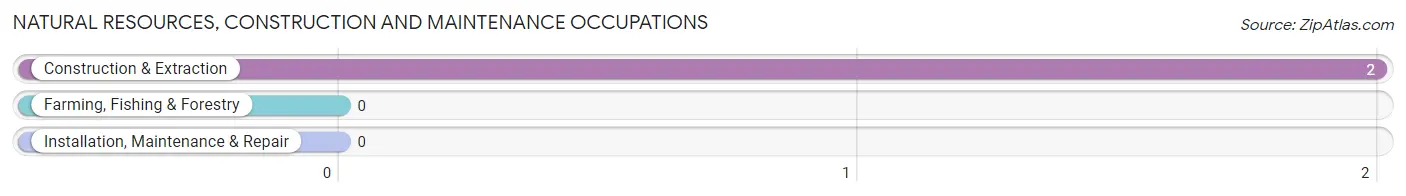
Natural Resources, Construction and Maintenance Occupations by Sex
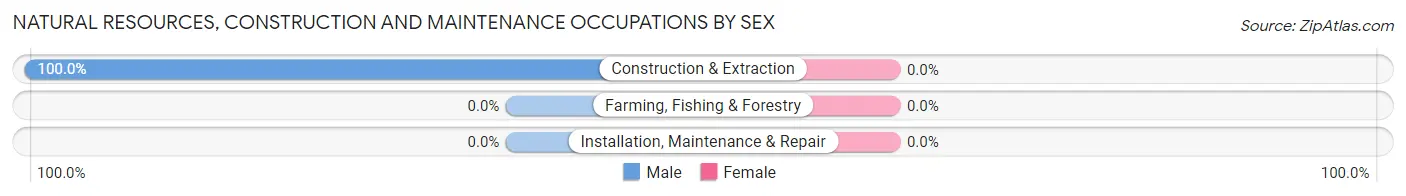
| Occupation | Male | Female |
| Farming, Fishing & Forestry | 0 (0.0%) | 0 (0.0%) |
| Construction & Extraction | 2 (100.0%) | 0 (0.0%) |
| Installation, Maintenance & Repair | 0 (0.0%) | 0 (0.0%) |
| Total (Category) | 2 (100.0%) | 0 (0.0%) |
| Total (Overall) | 84 (50.0%) | 84 (50.0%) |
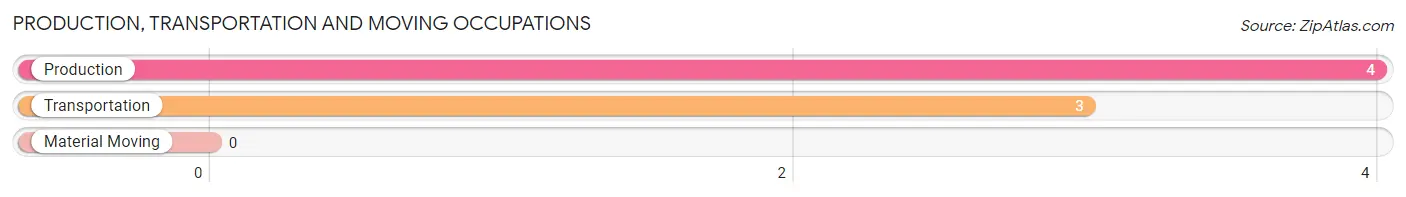
Production, Transportation and Moving Occupations
The most common Production, Transportation and Moving occupations in Brownsboro Village are Production (4 | 2.4%), and Transportation (3 | 1.8%).
Production, Transportation and Moving Occupations by Sex
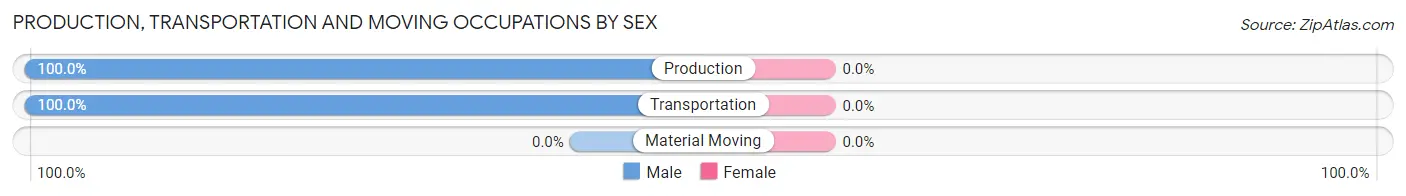
| Occupation | Male | Female |
| Production | 4 (100.0%) | 0 (0.0%) |
| Transportation | 3 (100.0%) | 0 (0.0%) |
| Material Moving | 0 (0.0%) | 0 (0.0%) |
| Total (Category) | 7 (100.0%) | 0 (0.0%) |
| Total (Overall) | 84 (50.0%) | 84 (50.0%) |
Employment Industries by Sex in Brownsboro Village
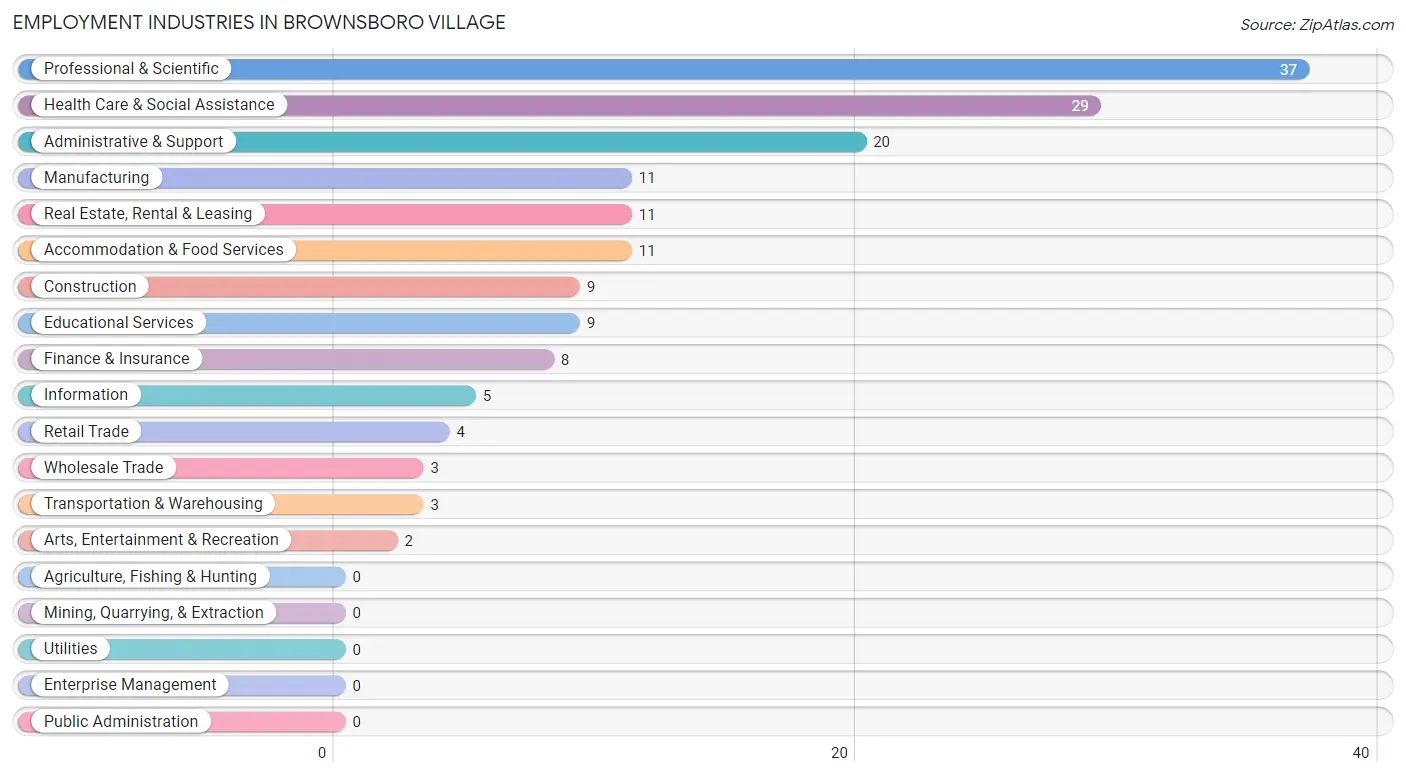
Employment Industries in Brownsboro Village
The major employment industries in Brownsboro Village include Professional & Scientific (37 | 22.0%), Health Care & Social Assistance (29 | 17.3%), Administrative & Support (20 | 11.9%), Manufacturing (11 | 6.6%), and Real Estate, Rental & Leasing (11 | 6.6%).
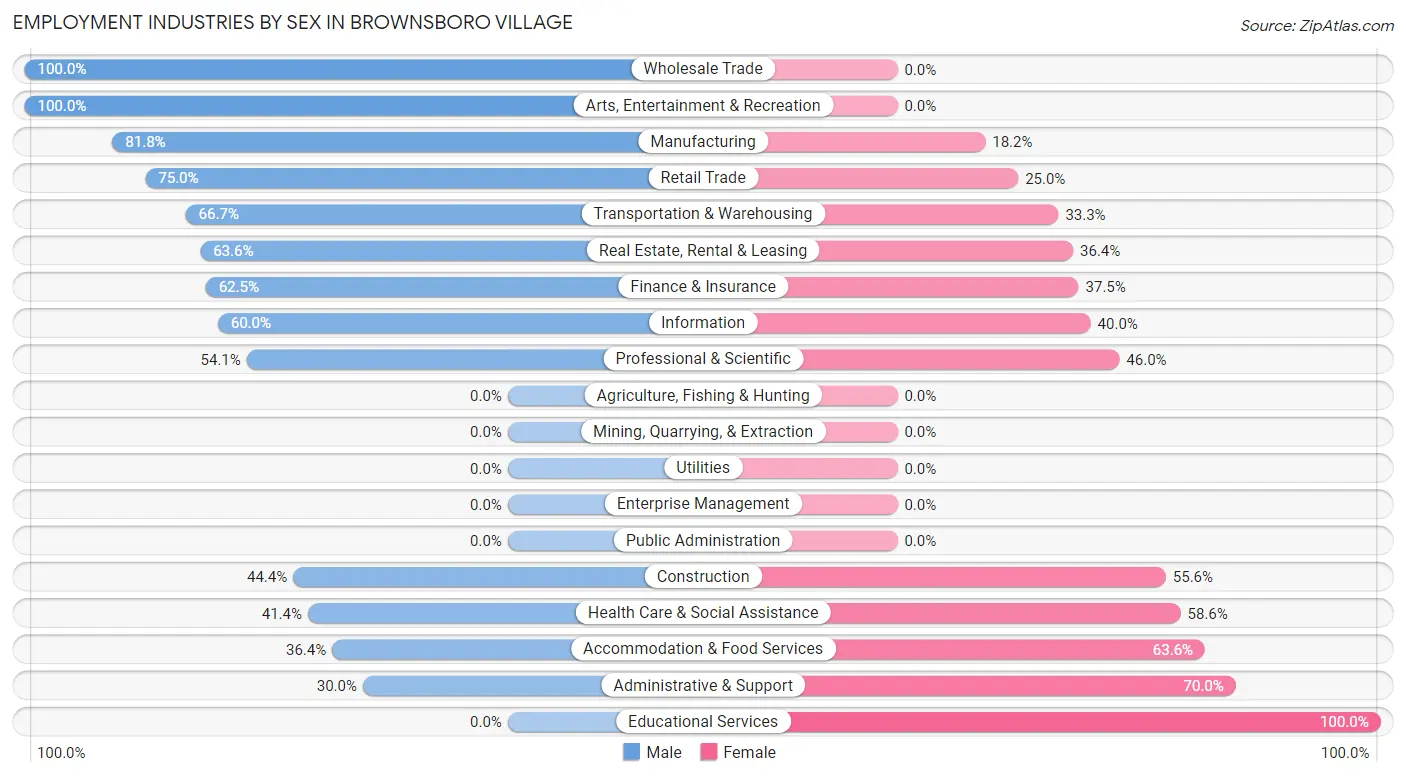
Employment Industries by Sex in Brownsboro Village
The Brownsboro Village industries that see more men than women are Wholesale Trade (100.0%), Arts, Entertainment & Recreation (100.0%), and Manufacturing (81.8%), whereas the industries that tend to have a higher number of women are Educational Services (100.0%), Administrative & Support (70.0%), and Accommodation & Food Services (63.6%).
| Industry | Male | Female |
| Agriculture, Fishing & Hunting | 0 (0.0%) | 0 (0.0%) |
| Mining, Quarrying, & Extraction | 0 (0.0%) | 0 (0.0%) |
| Construction | 4 (44.4%) | 5 (55.6%) |
| Manufacturing | 9 (81.8%) | 2 (18.2%) |
| Wholesale Trade | 3 (100.0%) | 0 (0.0%) |
| Retail Trade | 3 (75.0%) | 1 (25.0%) |
| Transportation & Warehousing | 2 (66.7%) | 1 (33.3%) |
| Utilities | 0 (0.0%) | 0 (0.0%) |
| Information | 3 (60.0%) | 2 (40.0%) |
| Finance & Insurance | 5 (62.5%) | 3 (37.5%) |
| Real Estate, Rental & Leasing | 7 (63.6%) | 4 (36.4%) |
| Professional & Scientific | 20 (54.0%) | 17 (46.0%) |
| Enterprise Management | 0 (0.0%) | 0 (0.0%) |
| Administrative & Support | 6 (30.0%) | 14 (70.0%) |
| Educational Services | 0 (0.0%) | 9 (100.0%) |
| Health Care & Social Assistance | 12 (41.4%) | 17 (58.6%) |
| Arts, Entertainment & Recreation | 2 (100.0%) | 0 (0.0%) |
| Accommodation & Food Services | 4 (36.4%) | 7 (63.6%) |
| Public Administration | 0 (0.0%) | 0 (0.0%) |
| Total | 84 (50.0%) | 84 (50.0%) |
Education in Brownsboro Village
School Enrollment in Brownsboro Village
The most common levels of schooling among the 60 students in Brownsboro Village are middle school (32 | 53.3%), elementary school (9 | 15.0%), and high school (8 | 13.3%).
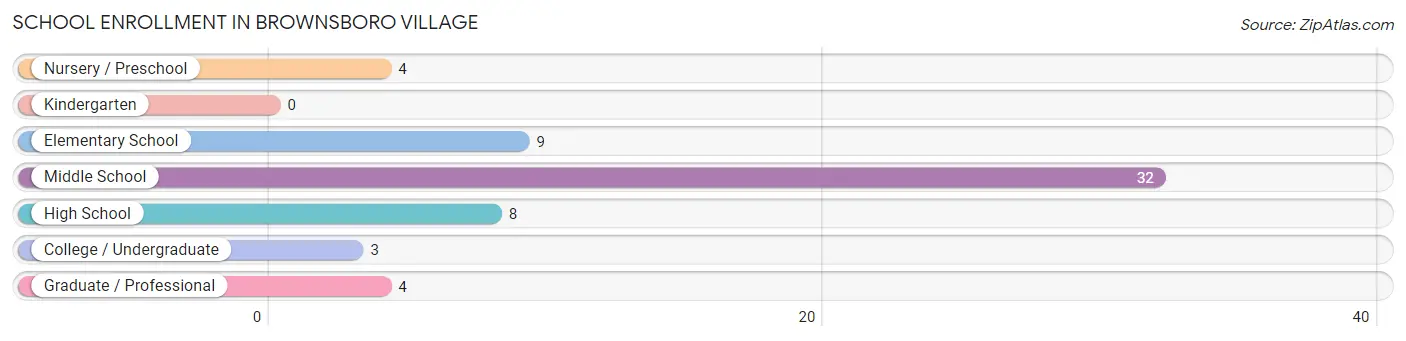
| School Level | # Students | % Students |
| Nursery / Preschool | 4 | 6.7% |
| Kindergarten | 0 | 0.0% |
| Elementary School | 9 | 15.0% |
| Middle School | 32 | 53.3% |
| High School | 8 | 13.3% |
| College / Undergraduate | 3 | 5.0% |
| Graduate / Professional | 4 | 6.7% |
| Total | 60 | 100.0% |
School Enrollment by Age by Funding Source in Brownsboro Village
Out of a total of 60 students who are enrolled in schools in Brownsboro Village, 25 (41.7%) attend a private institution, while the remaining 35 (58.3%) are enrolled in public schools. The age group of 3 to 4 year olds has the highest likelihood of being enrolled in private schools, with 4 (100.0% in the age bracket) enrolled. Conversely, the age group of 5 to 9 year old has the lowest likelihood of being enrolled in a private school, with 9 (100.0% in the age bracket) attending a public institution.
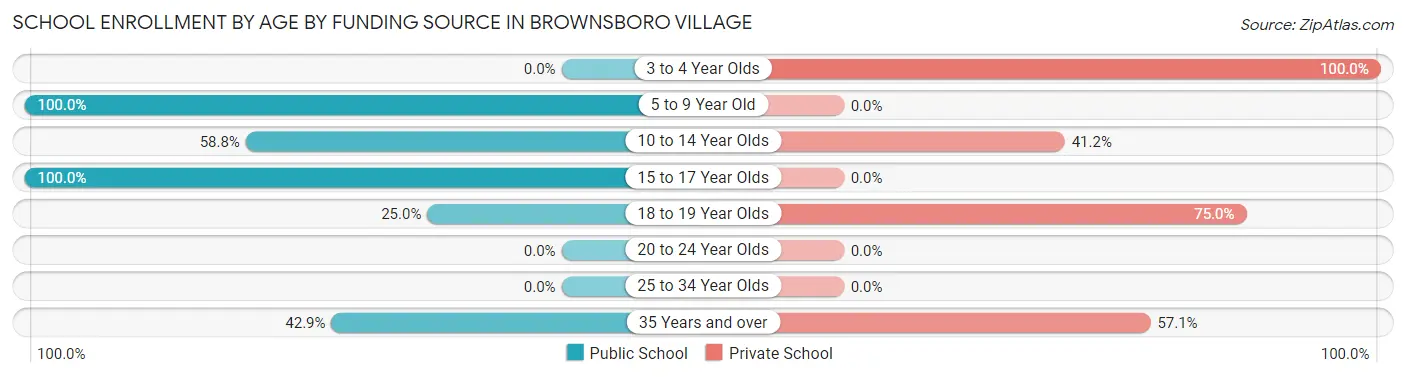
| Age Bracket | Public School | Private School |
| 3 to 4 Year Olds | 0 (0.0%) | 4 (100.0%) |
| 5 to 9 Year Old | 9 (100.0%) | 0 (0.0%) |
| 10 to 14 Year Olds | 20 (58.8%) | 14 (41.2%) |
| 15 to 17 Year Olds | 2 (100.0%) | 0 (0.0%) |
| 18 to 19 Year Olds | 1 (25.0%) | 3 (75.0%) |
| 20 to 24 Year Olds | 0 (0.0%) | 0 (0.0%) |
| 25 to 34 Year Olds | 0 (0.0%) | 0 (0.0%) |
| 35 Years and over | 3 (42.9%) | 4 (57.1%) |
| Total | 35 (58.3%) | 25 (41.7%) |
Educational Attainment by Field of Study in Brownsboro Village
Business (31 | 14.0%), literature & languages (30 | 13.5%), social sciences (27 | 12.2%), education (26 | 11.7%), and visual & performing arts (24 | 10.8%) are the most common fields of study among 222 individuals in Brownsboro Village who have obtained a bachelor's degree or higher.
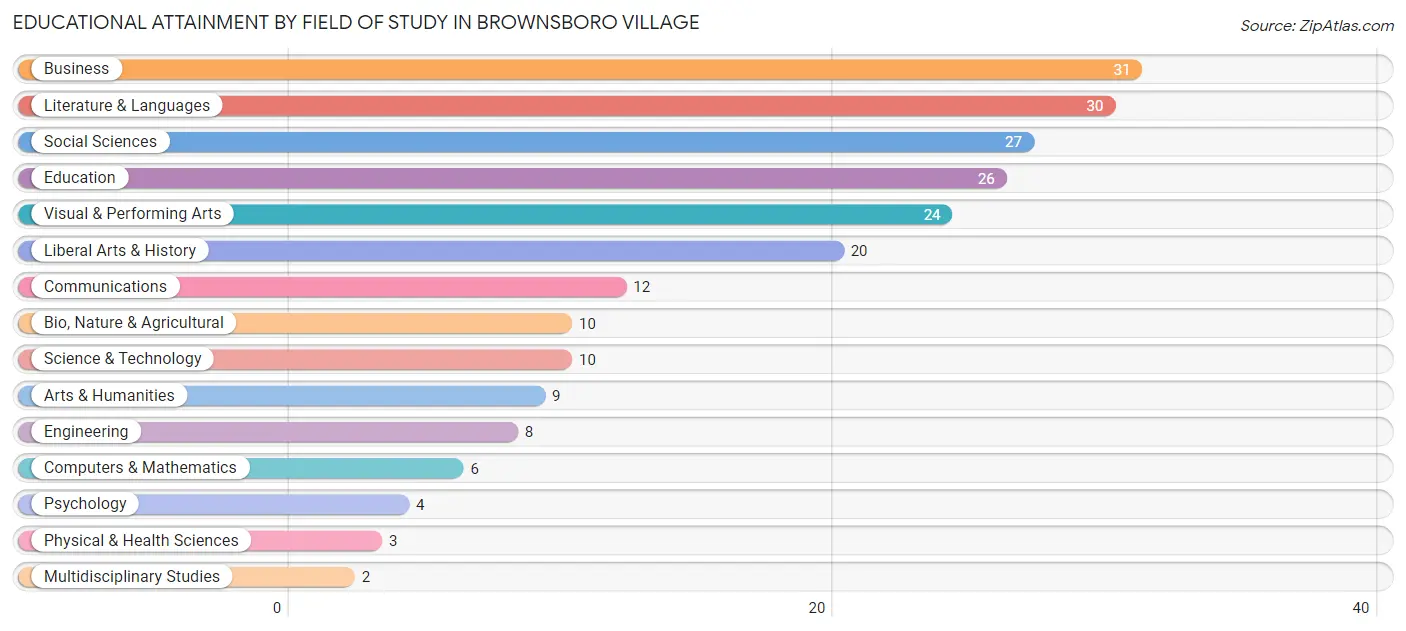
| Field of Study | # Graduates | % Graduates |
| Computers & Mathematics | 6 | 2.7% |
| Bio, Nature & Agricultural | 10 | 4.5% |
| Physical & Health Sciences | 3 | 1.3% |
| Psychology | 4 | 1.8% |
| Social Sciences | 27 | 12.2% |
| Engineering | 8 | 3.6% |
| Multidisciplinary Studies | 2 | 0.9% |
| Science & Technology | 10 | 4.5% |
| Business | 31 | 14.0% |
| Education | 26 | 11.7% |
| Literature & Languages | 30 | 13.5% |
| Liberal Arts & History | 20 | 9.0% |
| Visual & Performing Arts | 24 | 10.8% |
| Communications | 12 | 5.4% |
| Arts & Humanities | 9 | 4.1% |
| Total | 222 | 100.0% |
Transportation & Commute in Brownsboro Village
Vehicle Availability by Sex in Brownsboro Village
The most prevalent vehicle ownership categories in Brownsboro Village are males with 2 vehicles (45, accounting for 53.6%) and females with 2 vehicles (41, making up 53.6%).
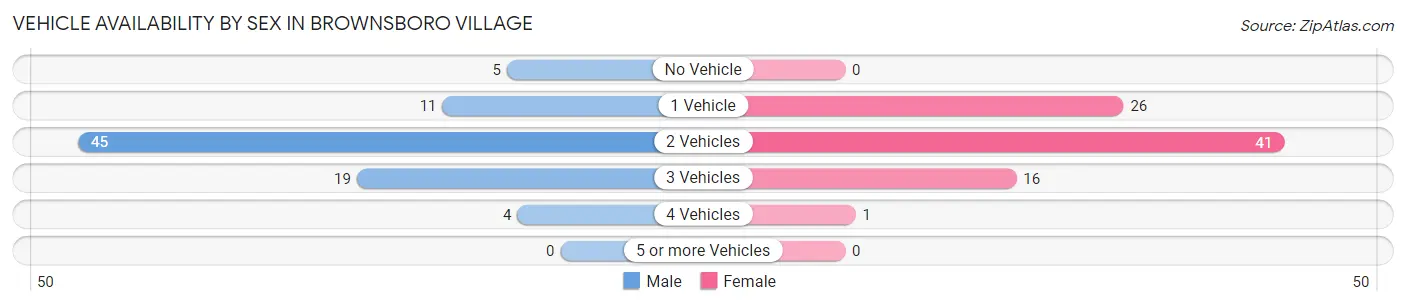
| Vehicles Available | Male | Female |
| No Vehicle | 5 (5.9%) | 0 (0.0%) |
| 1 Vehicle | 11 (13.1%) | 26 (30.9%) |
| 2 Vehicles | 45 (53.6%) | 41 (48.8%) |
| 3 Vehicles | 19 (22.6%) | 16 (19.1%) |
| 4 Vehicles | 4 (4.8%) | 1 (1.2%) |
| 5 or more Vehicles | 0 (0.0%) | 0 (0.0%) |
| Total | 84 (100.0%) | 84 (100.0%) |
Commute Time in Brownsboro Village
The most frequently occuring commute durations in Brownsboro Village are 15 to 19 minutes (49 commuters, 35.0%), 20 to 24 minutes (26 commuters, 18.6%), and 10 to 14 minutes (23 commuters, 16.4%).
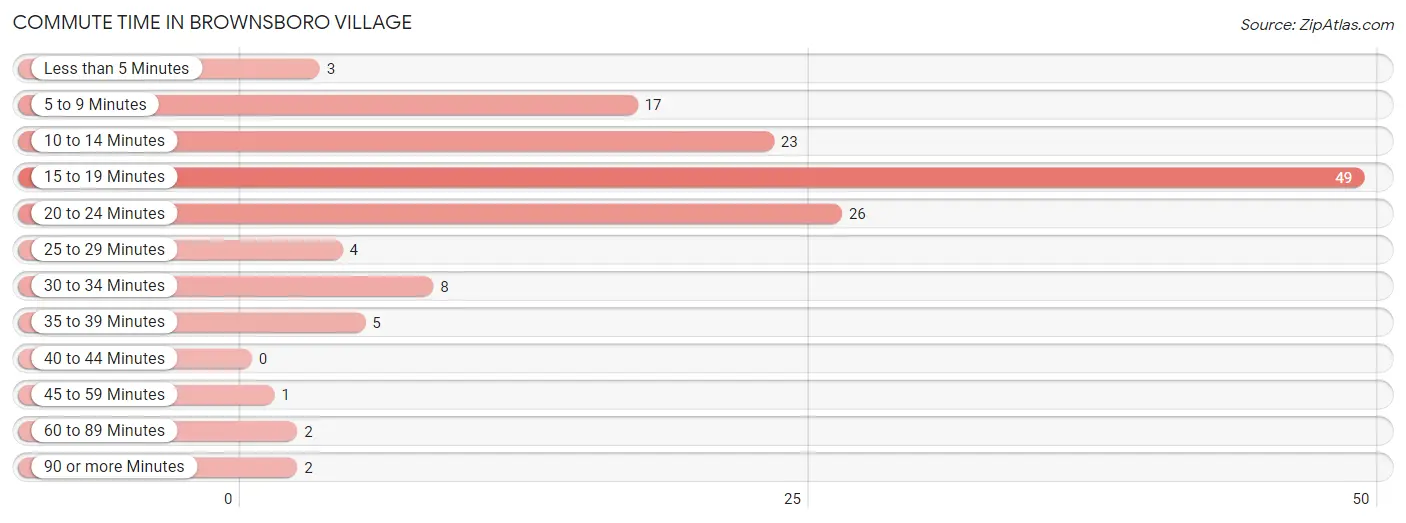
| Commute Time | # Commuters | % Commuters |
| Less than 5 Minutes | 3 | 2.1% |
| 5 to 9 Minutes | 17 | 12.1% |
| 10 to 14 Minutes | 23 | 16.4% |
| 15 to 19 Minutes | 49 | 35.0% |
| 20 to 24 Minutes | 26 | 18.6% |
| 25 to 29 Minutes | 4 | 2.9% |
| 30 to 34 Minutes | 8 | 5.7% |
| 35 to 39 Minutes | 5 | 3.6% |
| 40 to 44 Minutes | 0 | 0.0% |
| 45 to 59 Minutes | 1 | 0.7% |
| 60 to 89 Minutes | 2 | 1.4% |
| 90 or more Minutes | 2 | 1.4% |
Commute Time by Sex in Brownsboro Village
The most common commute times in Brownsboro Village are 15 to 19 minutes (20 commuters, 26.7%) for males and 15 to 19 minutes (29 commuters, 44.6%) for females.
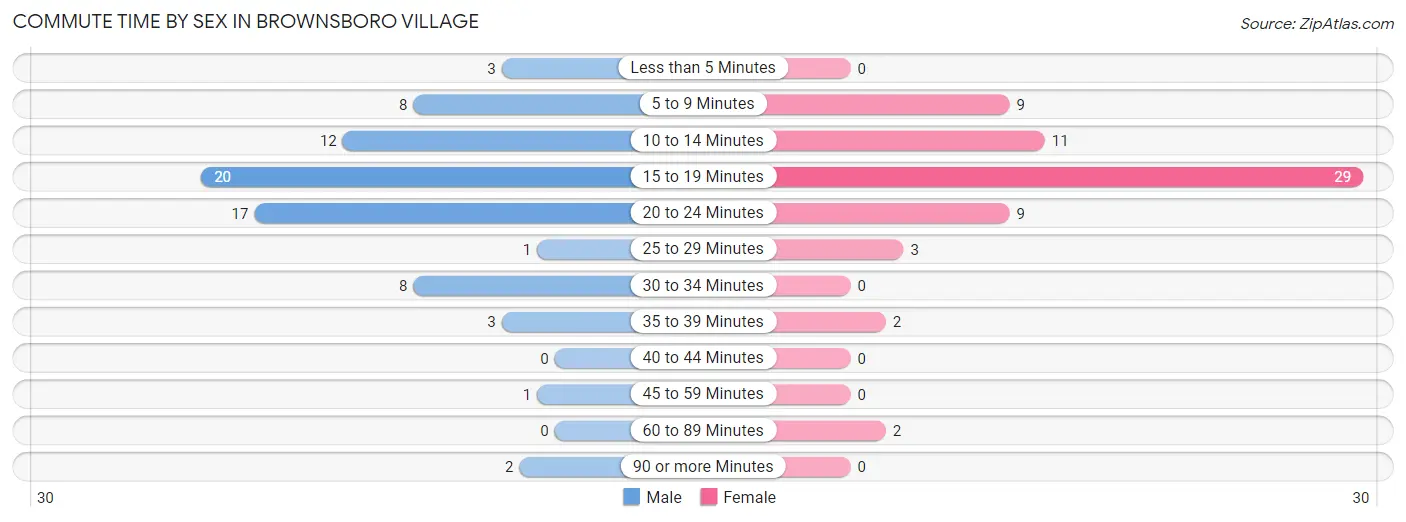
| Commute Time | Male | Female |
| Less than 5 Minutes | 3 (4.0%) | 0 (0.0%) |
| 5 to 9 Minutes | 8 (10.7%) | 9 (13.9%) |
| 10 to 14 Minutes | 12 (16.0%) | 11 (16.9%) |
| 15 to 19 Minutes | 20 (26.7%) | 29 (44.6%) |
| 20 to 24 Minutes | 17 (22.7%) | 9 (13.9%) |
| 25 to 29 Minutes | 1 (1.3%) | 3 (4.6%) |
| 30 to 34 Minutes | 8 (10.7%) | 0 (0.0%) |
| 35 to 39 Minutes | 3 (4.0%) | 2 (3.1%) |
| 40 to 44 Minutes | 0 (0.0%) | 0 (0.0%) |
| 45 to 59 Minutes | 1 (1.3%) | 0 (0.0%) |
| 60 to 89 Minutes | 0 (0.0%) | 2 (3.1%) |
| 90 or more Minutes | 2 (2.7%) | 0 (0.0%) |
Time of Departure to Work by Sex in Brownsboro Village
The most frequent times of departure to work in Brownsboro Village are 7:00 AM to 7:29 AM (15, 20.0%) for males and 8:00 AM to 8:29 AM (16, 24.6%) for females.
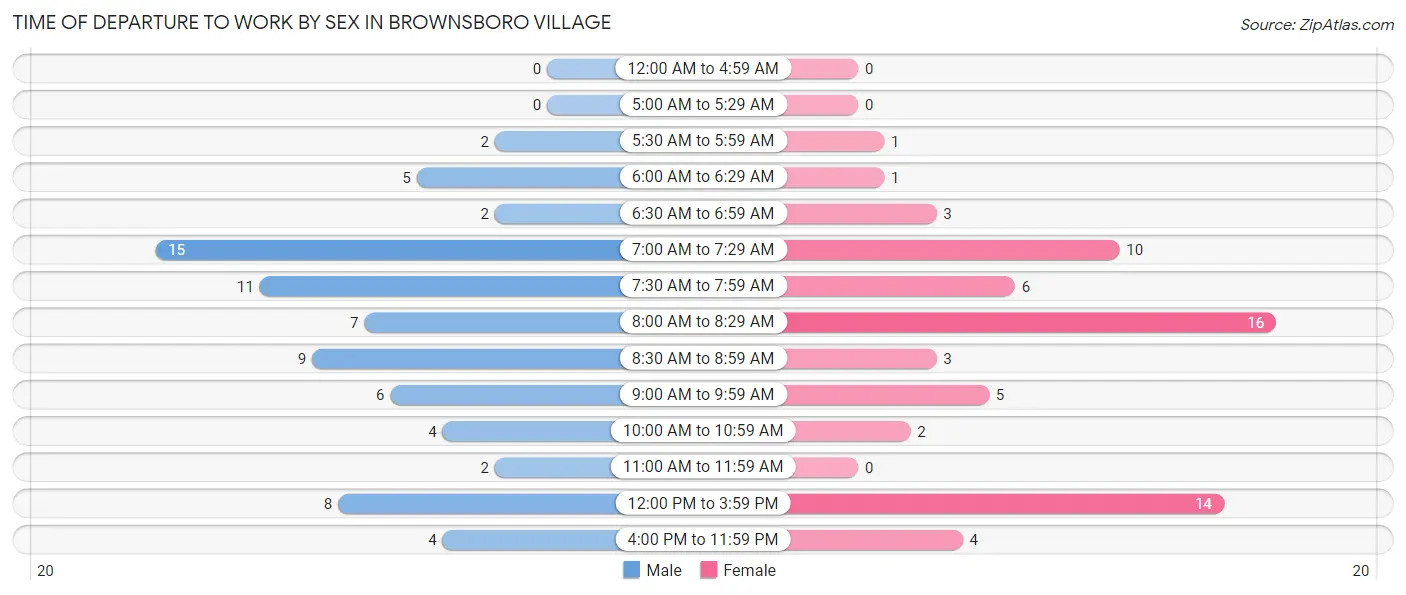
| Time of Departure | Male | Female |
| 12:00 AM to 4:59 AM | 0 (0.0%) | 0 (0.0%) |
| 5:00 AM to 5:29 AM | 0 (0.0%) | 0 (0.0%) |
| 5:30 AM to 5:59 AM | 2 (2.7%) | 1 (1.5%) |
| 6:00 AM to 6:29 AM | 5 (6.7%) | 1 (1.5%) |
| 6:30 AM to 6:59 AM | 2 (2.7%) | 3 (4.6%) |
| 7:00 AM to 7:29 AM | 15 (20.0%) | 10 (15.4%) |
| 7:30 AM to 7:59 AM | 11 (14.7%) | 6 (9.2%) |
| 8:00 AM to 8:29 AM | 7 (9.3%) | 16 (24.6%) |
| 8:30 AM to 8:59 AM | 9 (12.0%) | 3 (4.6%) |
| 9:00 AM to 9:59 AM | 6 (8.0%) | 5 (7.7%) |
| 10:00 AM to 10:59 AM | 4 (5.3%) | 2 (3.1%) |
| 11:00 AM to 11:59 AM | 2 (2.7%) | 0 (0.0%) |
| 12:00 PM to 3:59 PM | 8 (10.7%) | 14 (21.5%) |
| 4:00 PM to 11:59 PM | 4 (5.3%) | 4 (6.1%) |
| Total | 75 (100.0%) | 65 (100.0%) |
Housing Occupancy in Brownsboro Village
Occupancy by Ownership in Brownsboro Village
Of the total 177 dwellings in Brownsboro Village, owner-occupied units account for 154 (87.0%), while renter-occupied units make up 23 (13.0%).
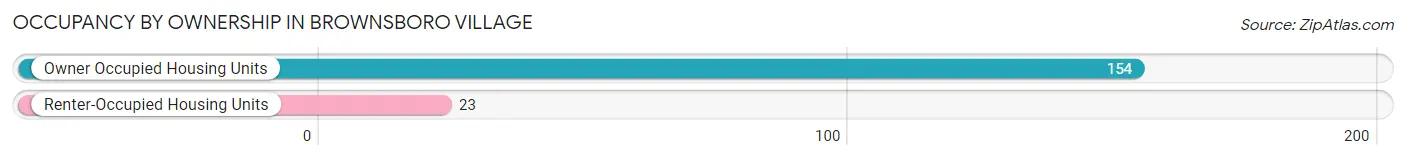
| Occupancy | # Housing Units | % Housing Units |
| Owner Occupied Housing Units | 154 | 87.0% |
| Renter-Occupied Housing Units | 23 | 13.0% |
| Total Occupied Housing Units | 177 | 100.0% |
Occupancy by Household Size in Brownsboro Village
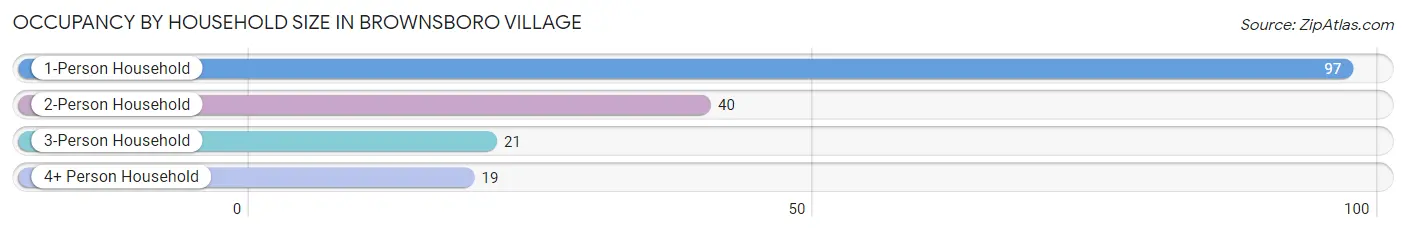
| Household Size | # Housing Units | % Housing Units |
| 1-Person Household | 97 | 54.8% |
| 2-Person Household | 40 | 22.6% |
| 3-Person Household | 21 | 11.9% |
| 4+ Person Household | 19 | 10.7% |
| Total Housing Units | 177 | 100.0% |
Occupancy by Ownership by Household Size in Brownsboro Village
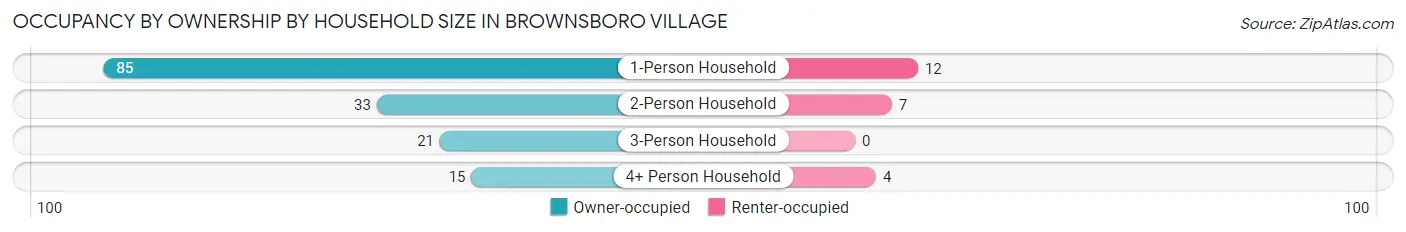
| Household Size | Owner-occupied | Renter-occupied |
| 1-Person Household | 85 (87.6%) | 12 (12.4%) |
| 2-Person Household | 33 (82.5%) | 7 (17.5%) |
| 3-Person Household | 21 (100.0%) | 0 (0.0%) |
| 4+ Person Household | 15 (78.9%) | 4 (21.0%) |
| Total Housing Units | 154 (87.0%) | 23 (13.0%) |
Occupancy by Educational Attainment in Brownsboro Village
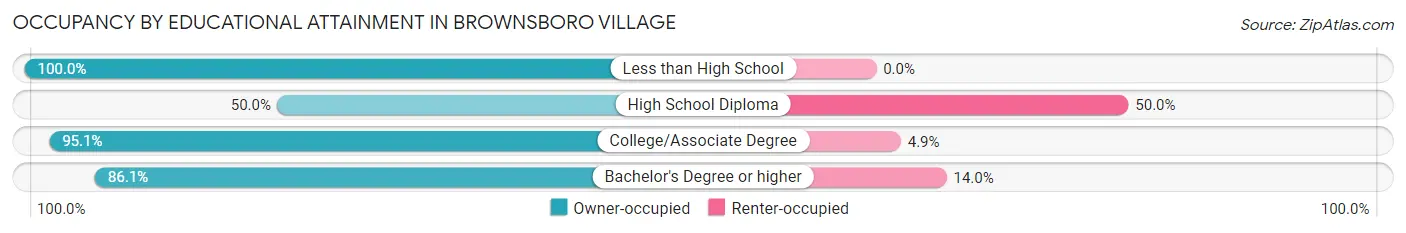
| Household Size | Owner-occupied | Renter-occupied |
| Less than High School | 1 (100.0%) | 0 (0.0%) |
| High School Diploma | 3 (50.0%) | 3 (50.0%) |
| College/Associate Degree | 39 (95.1%) | 2 (4.9%) |
| Bachelor's Degree or higher | 111 (86.1%) | 18 (14.0%) |
Occupancy by Age of Householder in Brownsboro Village
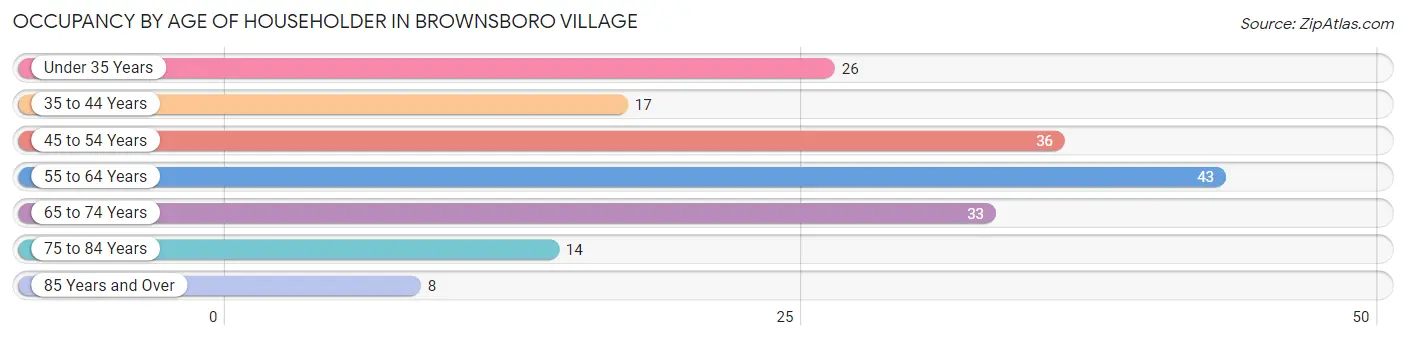
| Age Bracket | # Households | % Households |
| Under 35 Years | 26 | 14.7% |
| 35 to 44 Years | 17 | 9.6% |
| 45 to 54 Years | 36 | 20.3% |
| 55 to 64 Years | 43 | 24.3% |
| 65 to 74 Years | 33 | 18.6% |
| 75 to 84 Years | 14 | 7.9% |
| 85 Years and Over | 8 | 4.5% |
| Total | 177 | 100.0% |
Housing Finances in Brownsboro Village
Median Income by Occupancy in Brownsboro Village
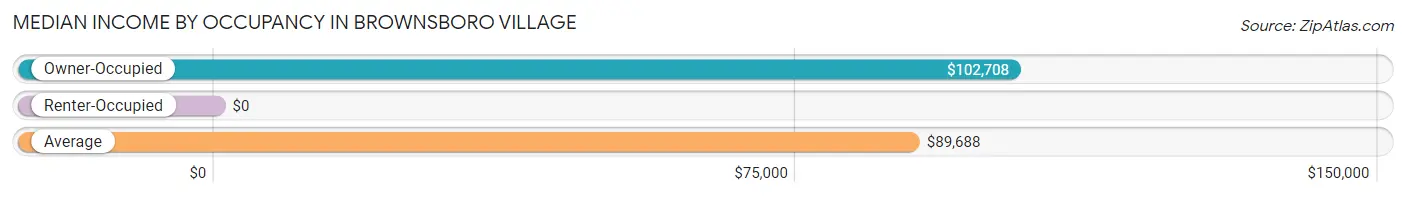
| Occupancy Type | # Households | Median Income |
| Owner-Occupied | 154 (87.0%) | $102,708 |
| Renter-Occupied | 23 (13.0%) | $0 |
| Average | 177 (100.0%) | $89,688 |
Occupancy by Householder Income Bracket in Brownsboro Village
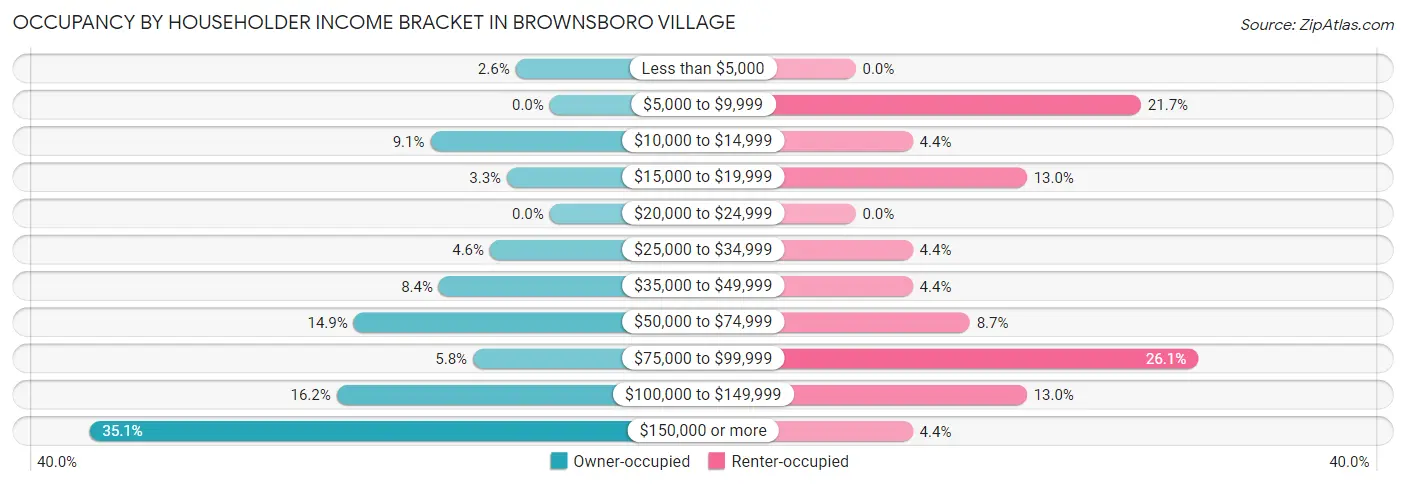
| Income Bracket | Owner-occupied | Renter-occupied |
| Less than $5,000 | 4 (2.6%) | 0 (0.0%) |
| $5,000 to $9,999 | 0 (0.0%) | 5 (21.7%) |
| $10,000 to $14,999 | 14 (9.1%) | 1 (4.3%) |
| $15,000 to $19,999 | 5 (3.3%) | 3 (13.0%) |
| $20,000 to $24,999 | 0 (0.0%) | 0 (0.0%) |
| $25,000 to $34,999 | 7 (4.5%) | 1 (4.3%) |
| $35,000 to $49,999 | 13 (8.4%) | 1 (4.3%) |
| $50,000 to $74,999 | 23 (14.9%) | 2 (8.7%) |
| $75,000 to $99,999 | 9 (5.8%) | 6 (26.1%) |
| $100,000 to $149,999 | 25 (16.2%) | 3 (13.0%) |
| $150,000 or more | 54 (35.1%) | 1 (4.3%) |
| Total | 154 (100.0%) | 23 (100.0%) |
Monthly Housing Cost Tiers in Brownsboro Village
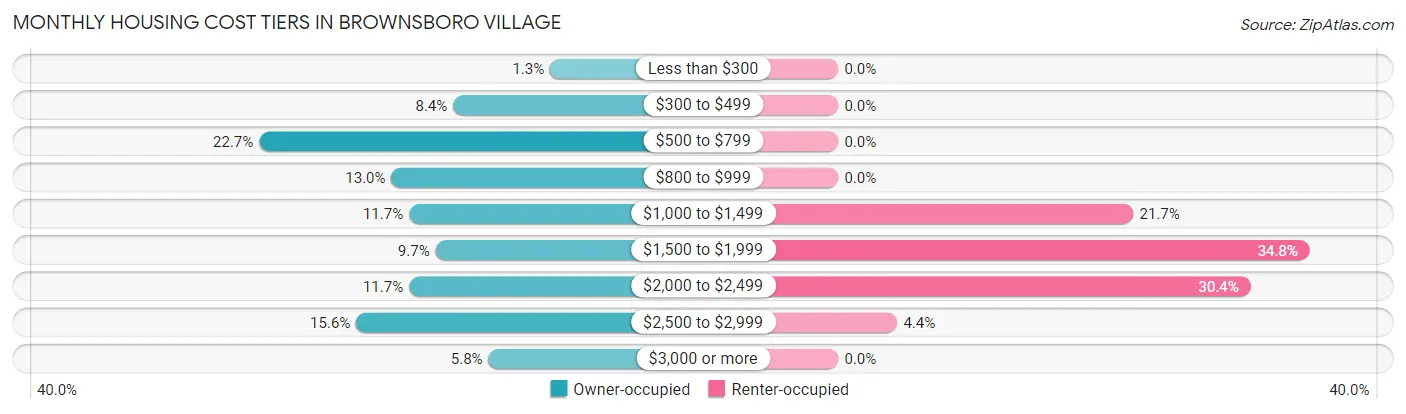
| Monthly Cost | Owner-occupied | Renter-occupied |
| Less than $300 | 2 (1.3%) | 0 (0.0%) |
| $300 to $499 | 13 (8.4%) | 0 (0.0%) |
| $500 to $799 | 35 (22.7%) | 0 (0.0%) |
| $800 to $999 | 20 (13.0%) | 0 (0.0%) |
| $1,000 to $1,499 | 18 (11.7%) | 5 (21.7%) |
| $1,500 to $1,999 | 15 (9.7%) | 8 (34.8%) |
| $2,000 to $2,499 | 18 (11.7%) | 7 (30.4%) |
| $2,500 to $2,999 | 24 (15.6%) | 1 (4.3%) |
| $3,000 or more | 9 (5.8%) | 0 (0.0%) |
| Total | 154 (100.0%) | 23 (100.0%) |
Physical Housing Characteristics in Brownsboro Village
Housing Structures in Brownsboro Village
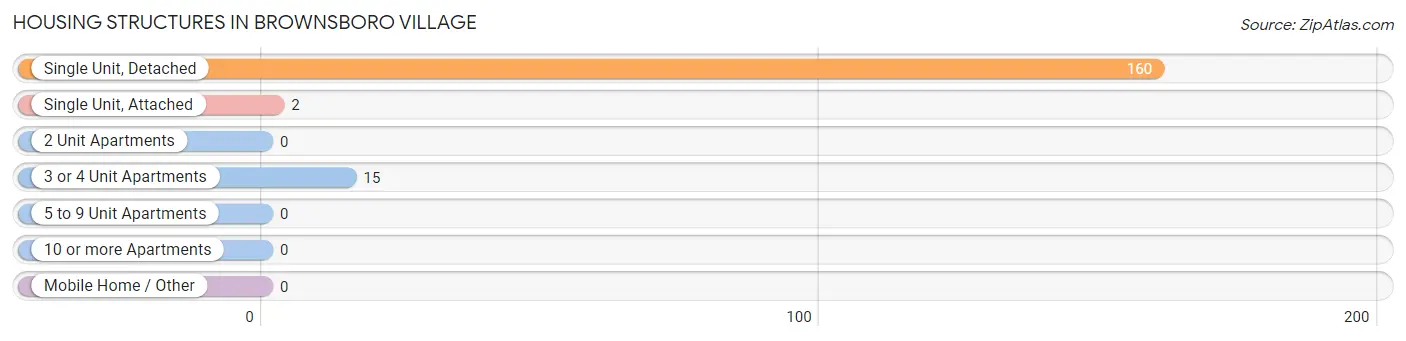
| Structure Type | # Housing Units | % Housing Units |
| Single Unit, Detached | 160 | 90.4% |
| Single Unit, Attached | 2 | 1.1% |
| 2 Unit Apartments | 0 | 0.0% |
| 3 or 4 Unit Apartments | 15 | 8.5% |
| 5 to 9 Unit Apartments | 0 | 0.0% |
| 10 or more Apartments | 0 | 0.0% |
| Mobile Home / Other | 0 | 0.0% |
| Total | 177 | 100.0% |
Housing Structures by Occupancy in Brownsboro Village
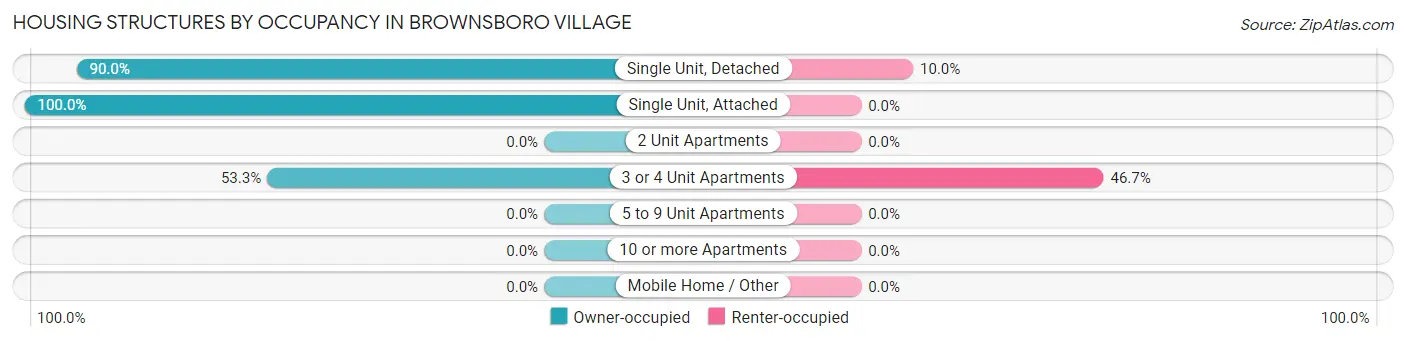
| Structure Type | Owner-occupied | Renter-occupied |
| Single Unit, Detached | 144 (90.0%) | 16 (10.0%) |
| Single Unit, Attached | 2 (100.0%) | 0 (0.0%) |
| 2 Unit Apartments | 0 (0.0%) | 0 (0.0%) |
| 3 or 4 Unit Apartments | 8 (53.3%) | 7 (46.7%) |
| 5 to 9 Unit Apartments | 0 (0.0%) | 0 (0.0%) |
| 10 or more Apartments | 0 (0.0%) | 0 (0.0%) |
| Mobile Home / Other | 0 (0.0%) | 0 (0.0%) |
| Total | 154 (87.0%) | 23 (13.0%) |
Housing Structures by Number of Rooms in Brownsboro Village
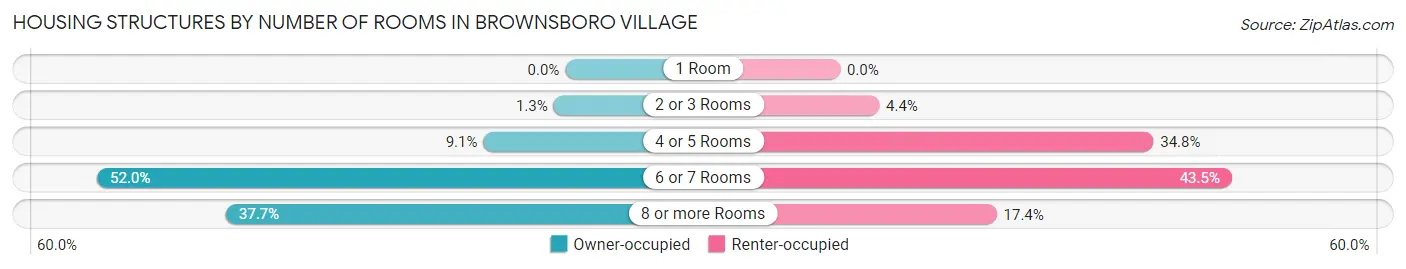
| Number of Rooms | Owner-occupied | Renter-occupied |
| 1 Room | 0 (0.0%) | 0 (0.0%) |
| 2 or 3 Rooms | 2 (1.3%) | 1 (4.3%) |
| 4 or 5 Rooms | 14 (9.1%) | 8 (34.8%) |
| 6 or 7 Rooms | 80 (51.9%) | 10 (43.5%) |
| 8 or more Rooms | 58 (37.7%) | 4 (17.4%) |
| Total | 154 (100.0%) | 23 (100.0%) |
Housing Structure by Heating Type in Brownsboro Village
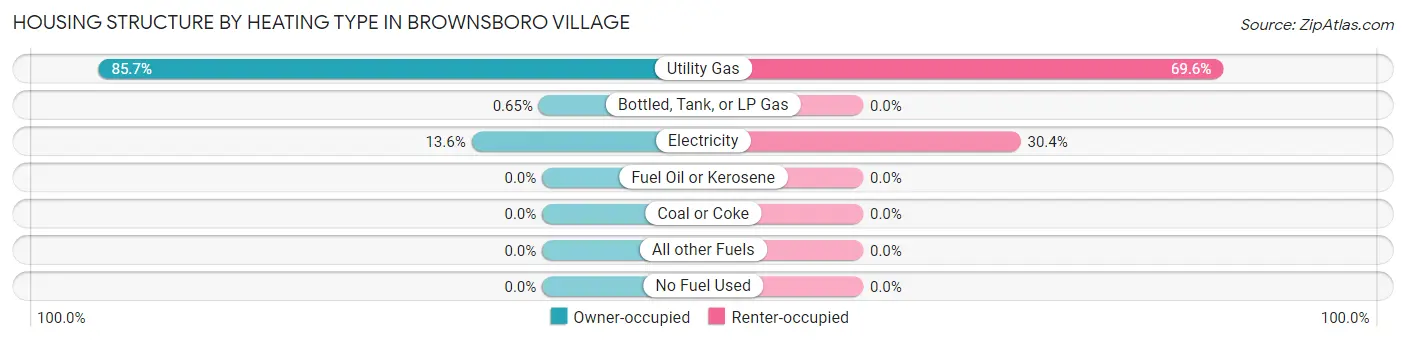
| Heating Type | Owner-occupied | Renter-occupied |
| Utility Gas | 132 (85.7%) | 16 (69.6%) |
| Bottled, Tank, or LP Gas | 1 (0.6%) | 0 (0.0%) |
| Electricity | 21 (13.6%) | 7 (30.4%) |
| Fuel Oil or Kerosene | 0 (0.0%) | 0 (0.0%) |
| Coal or Coke | 0 (0.0%) | 0 (0.0%) |
| All other Fuels | 0 (0.0%) | 0 (0.0%) |
| No Fuel Used | 0 (0.0%) | 0 (0.0%) |
| Total | 154 (100.0%) | 23 (100.0%) |
Household Vehicle Usage in Brownsboro Village
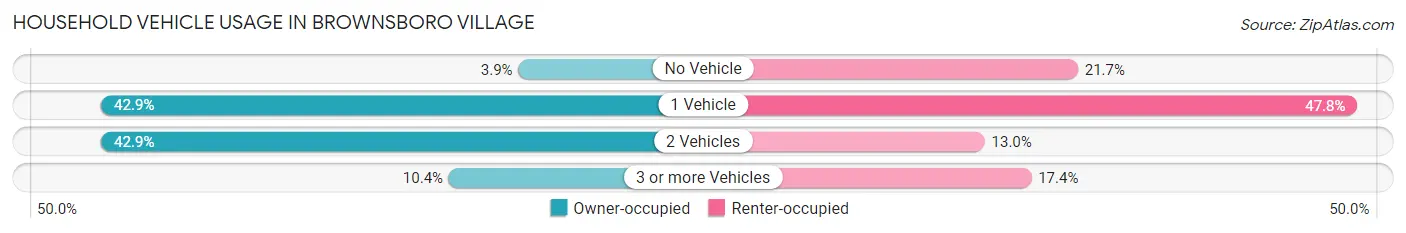
| Vehicles per Household | Owner-occupied | Renter-occupied |
| No Vehicle | 6 (3.9%) | 5 (21.7%) |
| 1 Vehicle | 66 (42.9%) | 11 (47.8%) |
| 2 Vehicles | 66 (42.9%) | 3 (13.0%) |
| 3 or more Vehicles | 16 (10.4%) | 4 (17.4%) |
| Total | 154 (100.0%) | 23 (100.0%) |
Real Estate & Mortgages in Brownsboro Village
Real Estate and Mortgage Overview in Brownsboro Village
| Characteristic | Without Mortgage | With Mortgage |
| Housing Units | 71 | 83 |
| Median Property Value | $340,500 | $353,000 |
| Median Household Income | $61,875 | $37 |
| Monthly Housing Costs | $696 | $7 |
| Real Estate Taxes | $2,750 | $1 |
Property Value by Mortgage Status in Brownsboro Village
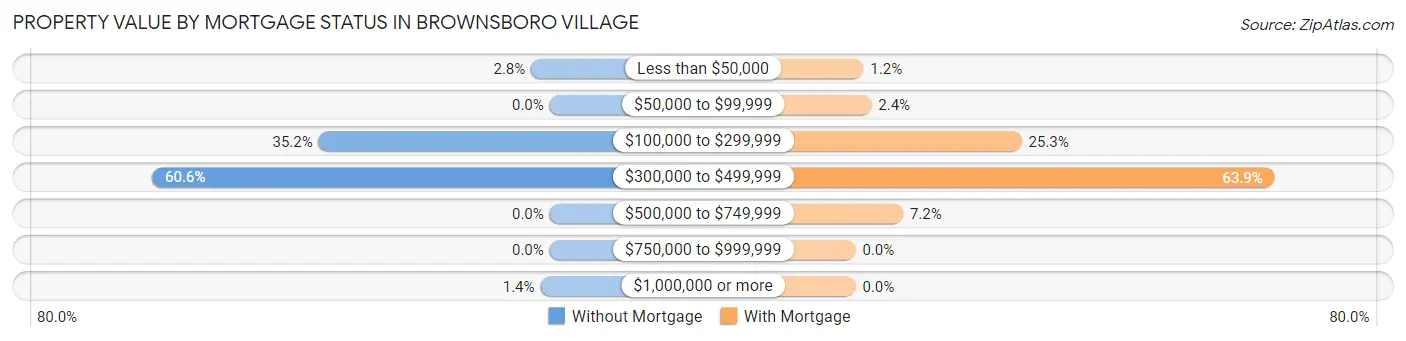
| Property Value | Without Mortgage | With Mortgage |
| Less than $50,000 | 2 (2.8%) | 1 (1.2%) |
| $50,000 to $99,999 | 0 (0.0%) | 2 (2.4%) |
| $100,000 to $299,999 | 25 (35.2%) | 21 (25.3%) |
| $300,000 to $499,999 | 43 (60.6%) | 53 (63.9%) |
| $500,000 to $749,999 | 0 (0.0%) | 6 (7.2%) |
| $750,000 to $999,999 | 0 (0.0%) | 0 (0.0%) |
| $1,000,000 or more | 1 (1.4%) | 0 (0.0%) |
| Total | 71 (100.0%) | 83 (100.0%) |
Household Income by Mortgage Status in Brownsboro Village
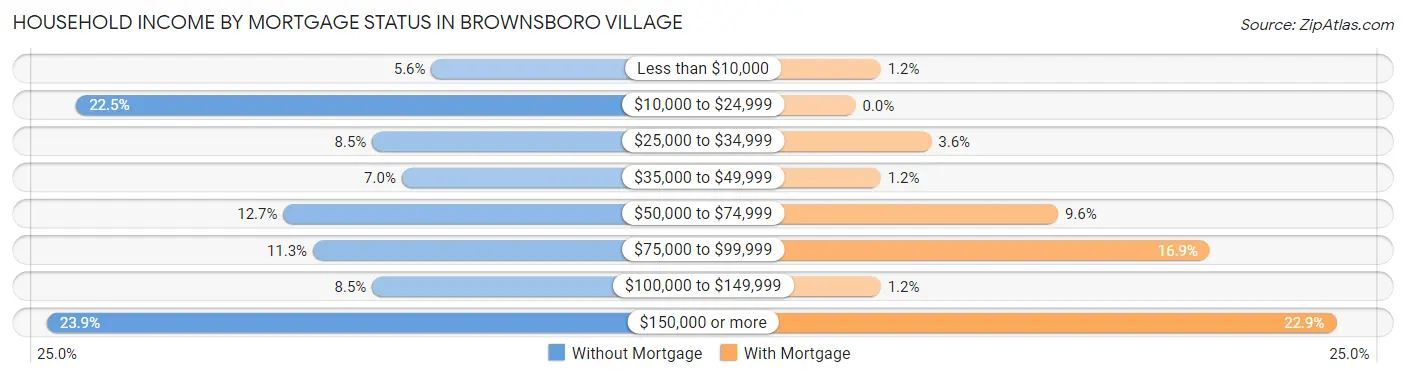
| Household Income | Without Mortgage | With Mortgage |
| Less than $10,000 | 4 (5.6%) | 1 (1.2%) |
| $10,000 to $24,999 | 16 (22.5%) | 0 (0.0%) |
| $25,000 to $34,999 | 6 (8.5%) | 3 (3.6%) |
| $35,000 to $49,999 | 5 (7.0%) | 1 (1.2%) |
| $50,000 to $74,999 | 9 (12.7%) | 8 (9.6%) |
| $75,000 to $99,999 | 8 (11.3%) | 14 (16.9%) |
| $100,000 to $149,999 | 6 (8.5%) | 1 (1.2%) |
| $150,000 or more | 17 (23.9%) | 19 (22.9%) |
| Total | 71 (100.0%) | 83 (100.0%) |
Property Value to Household Income Ratio in Brownsboro Village
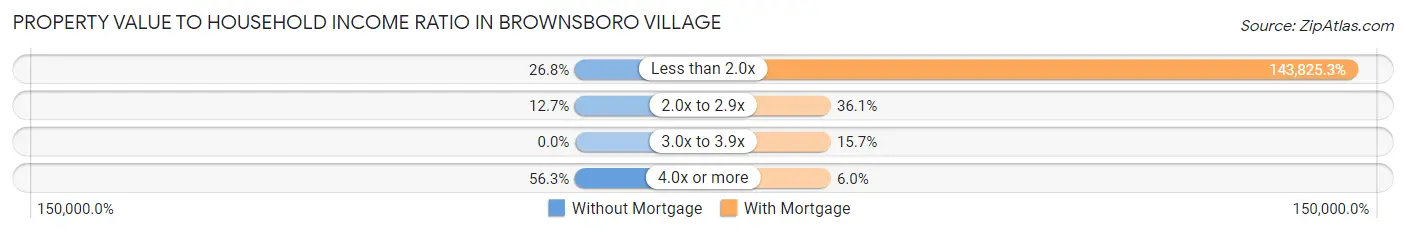
| Value-to-Income Ratio | Without Mortgage | With Mortgage |
| Less than 2.0x | 19 (26.8%) | 119,375 (143,825.3%) |
| 2.0x to 2.9x | 9 (12.7%) | 30 (36.1%) |
| 3.0x to 3.9x | 0 (0.0%) | 13 (15.7%) |
| 4.0x or more | 40 (56.3%) | 5 (6.0%) |
| Total | 71 (100.0%) | 83 (100.0%) |
Real Estate Taxes by Mortgage Status in Brownsboro Village
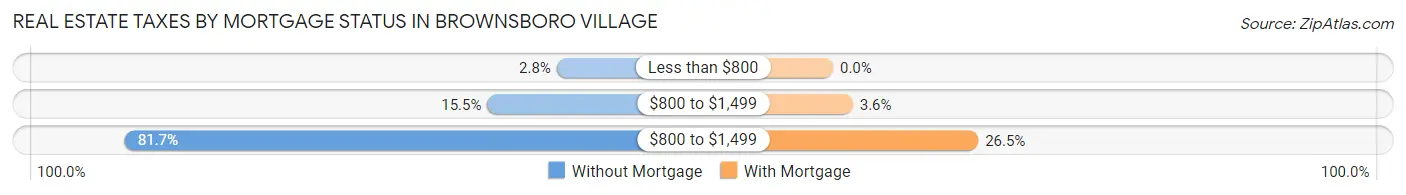
| Property Taxes | Without Mortgage | With Mortgage |
| Less than $800 | 2 (2.8%) | 0 (0.0%) |
| $800 to $1,499 | 11 (15.5%) | 3 (3.6%) |
| $800 to $1,499 | 58 (81.7%) | 22 (26.5%) |
| Total | 71 (100.0%) | 83 (100.0%) |
Health & Disability in Brownsboro Village
Health Insurance Coverage by Age in Brownsboro Village
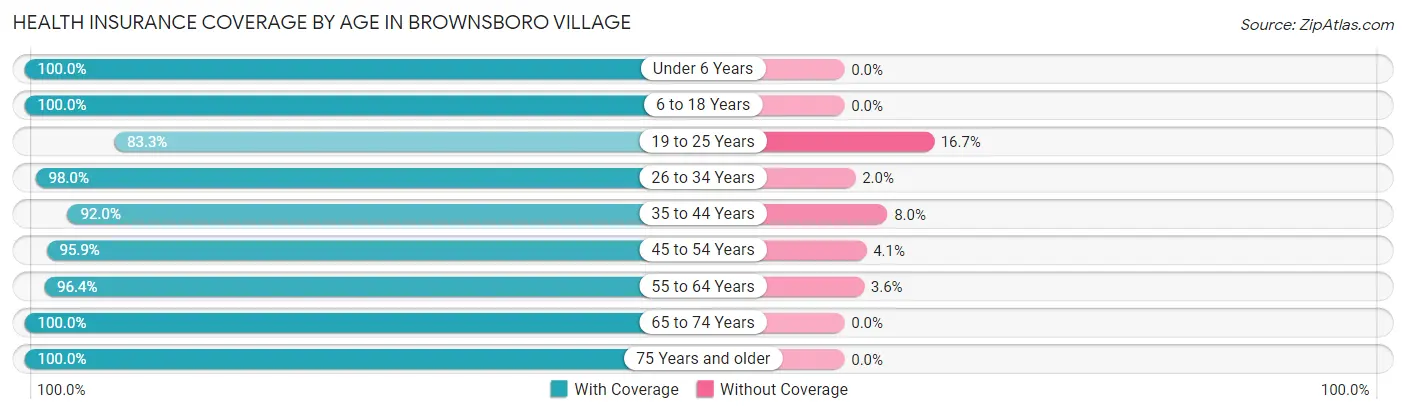
| Age Bracket | With Coverage | Without Coverage |
| Under 6 Years | 12 (100.0%) | 0 (0.0%) |
| 6 to 18 Years | 49 (100.0%) | 0 (0.0%) |
| 19 to 25 Years | 5 (83.3%) | 1 (16.7%) |
| 26 to 34 Years | 48 (98.0%) | 1 (2.0%) |
| 35 to 44 Years | 23 (92.0%) | 2 (8.0%) |
| 45 to 54 Years | 47 (95.9%) | 2 (4.1%) |
| 55 to 64 Years | 53 (96.4%) | 2 (3.6%) |
| 65 to 74 Years | 45 (100.0%) | 0 (0.0%) |
| 75 Years and older | 36 (100.0%) | 0 (0.0%) |
| Total | 318 (97.6%) | 8 (2.5%) |
Health Insurance Coverage by Citizenship Status in Brownsboro Village
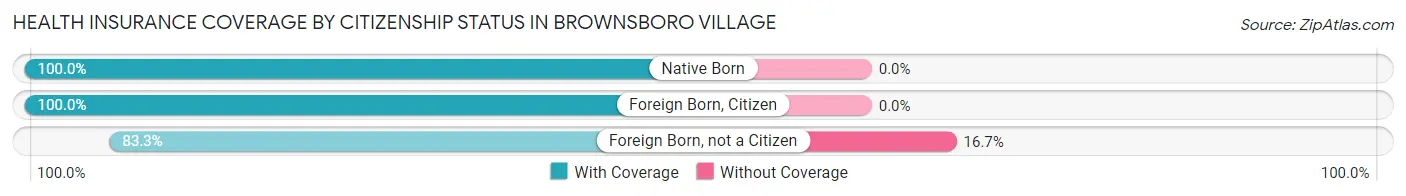
| Citizenship Status | With Coverage | Without Coverage |
| Native Born | 12 (100.0%) | 0 (0.0%) |
| Foreign Born, Citizen | 49 (100.0%) | 0 (0.0%) |
| Foreign Born, not a Citizen | 5 (83.3%) | 1 (16.7%) |
Health Insurance Coverage by Household Income in Brownsboro Village
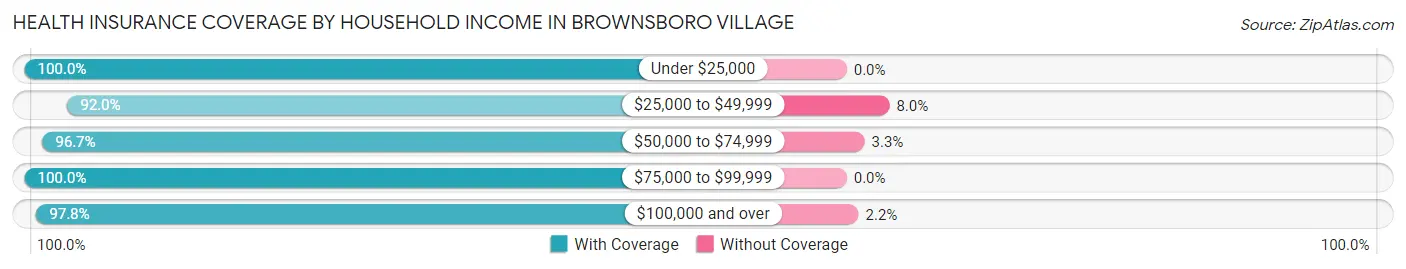
| Household Income | With Coverage | Without Coverage |
| Under $25,000 | 32 (100.0%) | 0 (0.0%) |
| $25,000 to $49,999 | 23 (92.0%) | 2 (8.0%) |
| $50,000 to $74,999 | 58 (96.7%) | 2 (3.3%) |
| $75,000 to $99,999 | 28 (100.0%) | 0 (0.0%) |
| $100,000 and over | 177 (97.8%) | 4 (2.2%) |
Public vs Private Health Insurance Coverage by Age in Brownsboro Village
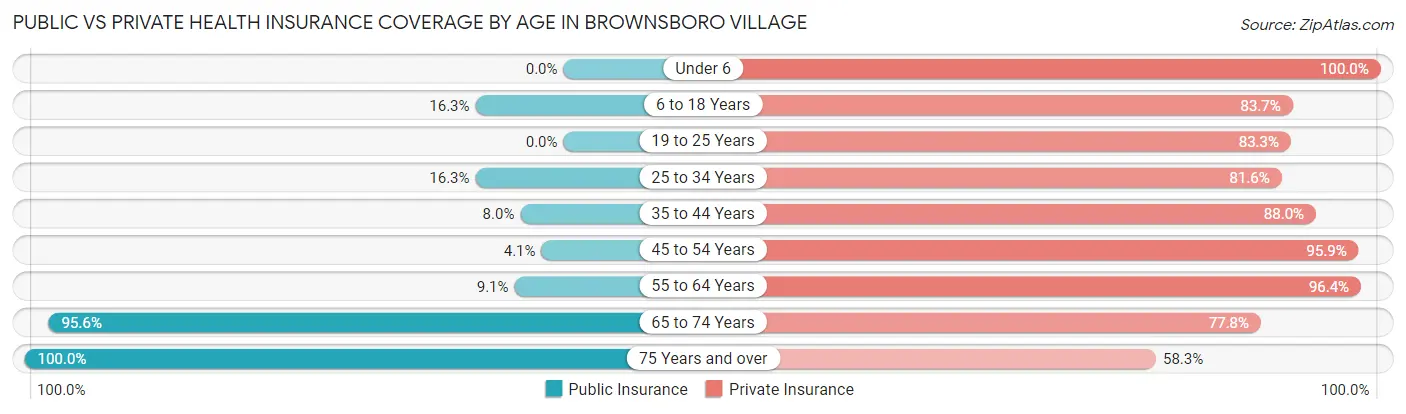
| Age Bracket | Public Insurance | Private Insurance |
| Under 6 | 0 (0.0%) | 12 (100.0%) |
| 6 to 18 Years | 8 (16.3%) | 41 (83.7%) |
| 19 to 25 Years | 0 (0.0%) | 5 (83.3%) |
| 25 to 34 Years | 8 (16.3%) | 40 (81.6%) |
| 35 to 44 Years | 2 (8.0%) | 22 (88.0%) |
| 45 to 54 Years | 2 (4.1%) | 47 (95.9%) |
| 55 to 64 Years | 5 (9.1%) | 53 (96.4%) |
| 65 to 74 Years | 43 (95.6%) | 35 (77.8%) |
| 75 Years and over | 36 (100.0%) | 21 (58.3%) |
| Total | 104 (31.9%) | 276 (84.7%) |
Disability Status by Sex by Age in Brownsboro Village
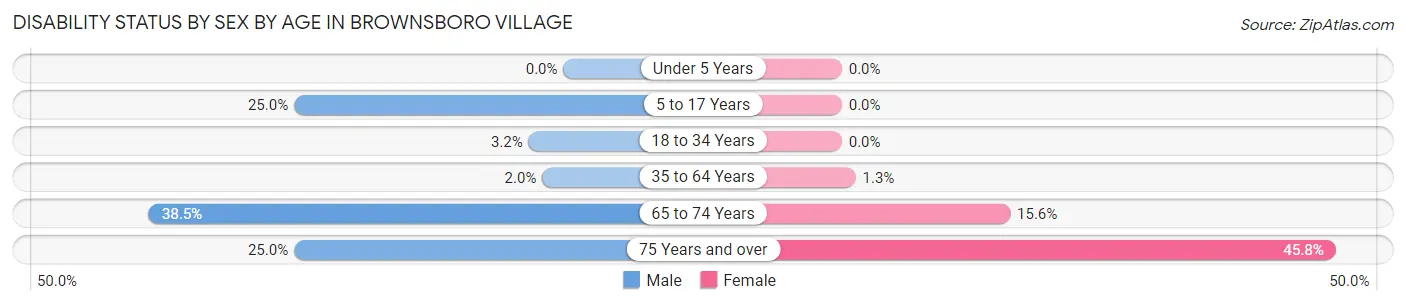
| Age Bracket | Male | Female |
| Under 5 Years | 0 (0.0%) | 0 (0.0%) |
| 5 to 17 Years | 8 (25.0%) | 0 (0.0%) |
| 18 to 34 Years | 1 (3.2%) | 0 (0.0%) |
| 35 to 64 Years | 1 (2.0%) | 1 (1.3%) |
| 65 to 74 Years | 5 (38.5%) | 5 (15.6%) |
| 75 Years and over | 3 (25.0%) | 11 (45.8%) |
Disability Class by Sex by Age in Brownsboro Village
Disability Class: Hearing Difficulty
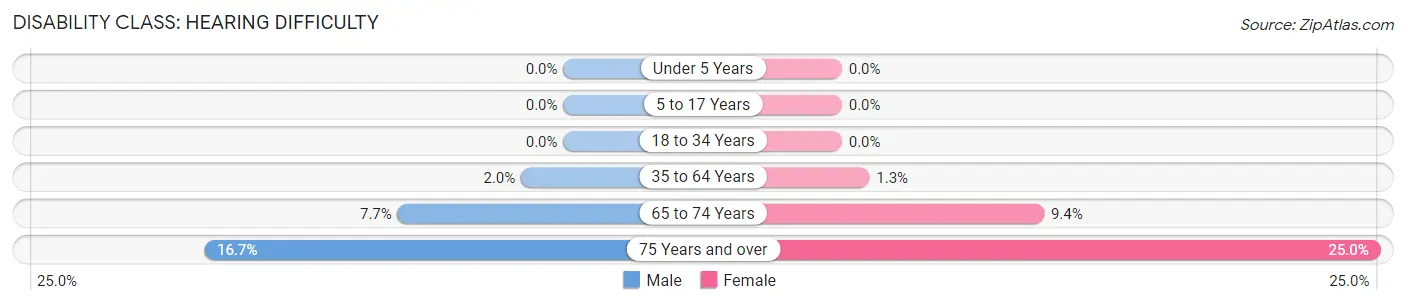
| Age Bracket | Male | Female |
| Under 5 Years | 0 (0.0%) | 0 (0.0%) |
| 5 to 17 Years | 0 (0.0%) | 0 (0.0%) |
| 18 to 34 Years | 0 (0.0%) | 0 (0.0%) |
| 35 to 64 Years | 1 (2.0%) | 1 (1.3%) |
| 65 to 74 Years | 1 (7.7%) | 3 (9.4%) |
| 75 Years and over | 2 (16.7%) | 6 (25.0%) |
Disability Class: Vision Difficulty
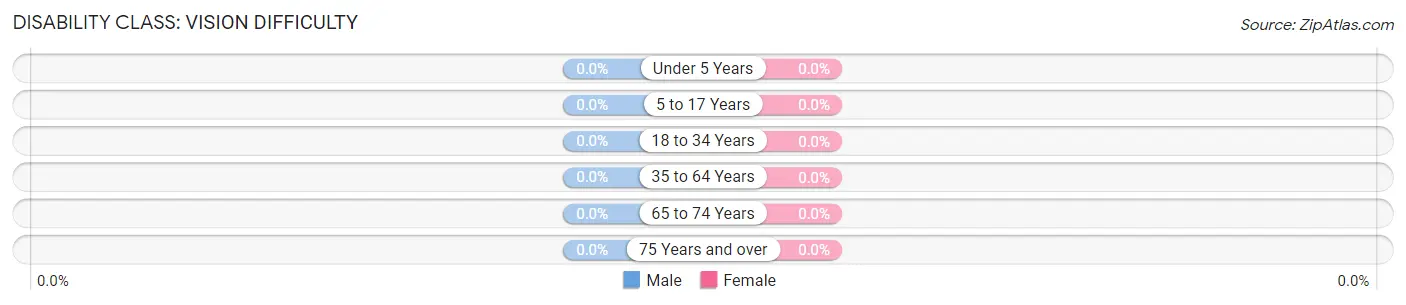
| Age Bracket | Male | Female |
| Under 5 Years | 0 (0.0%) | 0 (0.0%) |
| 5 to 17 Years | 0 (0.0%) | 0 (0.0%) |
| 18 to 34 Years | 0 (0.0%) | 0 (0.0%) |
| 35 to 64 Years | 0 (0.0%) | 0 (0.0%) |
| 65 to 74 Years | 0 (0.0%) | 0 (0.0%) |
| 75 Years and over | 0 (0.0%) | 0 (0.0%) |
Disability Class: Cognitive Difficulty
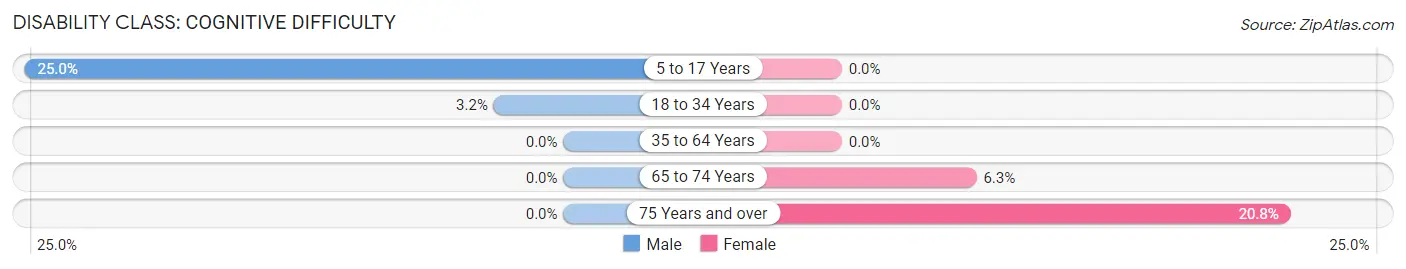
| Age Bracket | Male | Female |
| 5 to 17 Years | 8 (25.0%) | 0 (0.0%) |
| 18 to 34 Years | 1 (3.2%) | 0 (0.0%) |
| 35 to 64 Years | 0 (0.0%) | 0 (0.0%) |
| 65 to 74 Years | 0 (0.0%) | 2 (6.2%) |
| 75 Years and over | 0 (0.0%) | 5 (20.8%) |
Disability Class: Ambulatory Difficulty
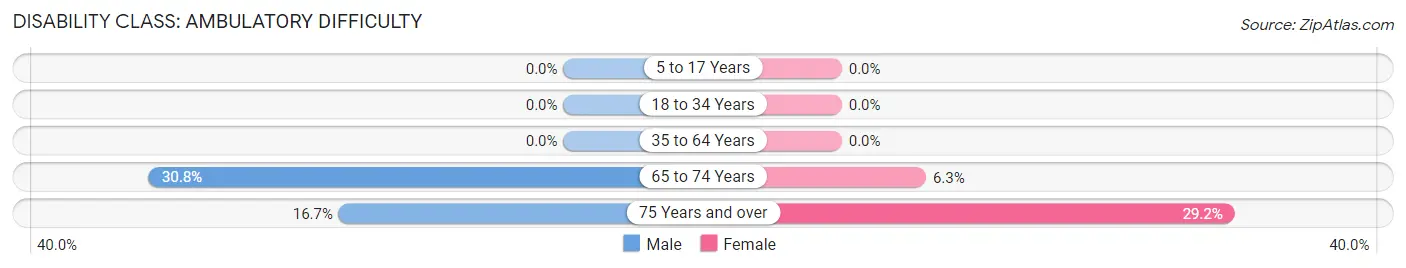
| Age Bracket | Male | Female |
| 5 to 17 Years | 0 (0.0%) | 0 (0.0%) |
| 18 to 34 Years | 0 (0.0%) | 0 (0.0%) |
| 35 to 64 Years | 0 (0.0%) | 0 (0.0%) |
| 65 to 74 Years | 4 (30.8%) | 2 (6.2%) |
| 75 Years and over | 2 (16.7%) | 7 (29.2%) |
Disability Class: Self-Care Difficulty
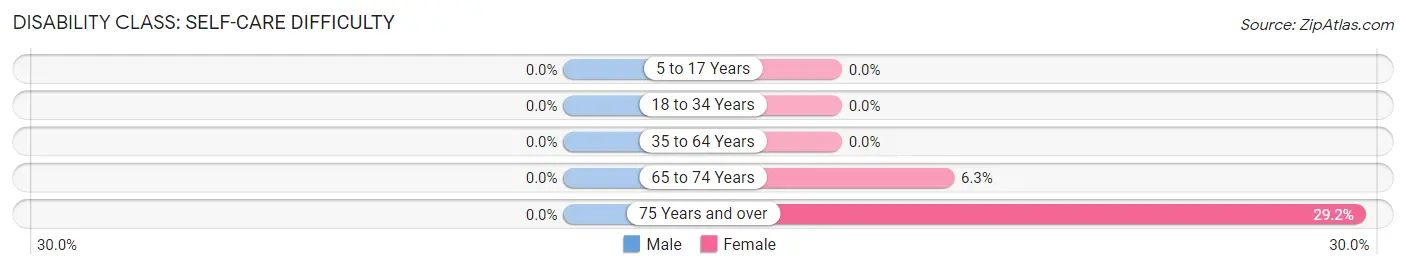
| Age Bracket | Male | Female |
| 5 to 17 Years | 0 (0.0%) | 0 (0.0%) |
| 18 to 34 Years | 0 (0.0%) | 0 (0.0%) |
| 35 to 64 Years | 0 (0.0%) | 0 (0.0%) |
| 65 to 74 Years | 0 (0.0%) | 2 (6.2%) |
| 75 Years and over | 0 (0.0%) | 7 (29.2%) |
Technology Access in Brownsboro Village
Computing Device Access in Brownsboro Village
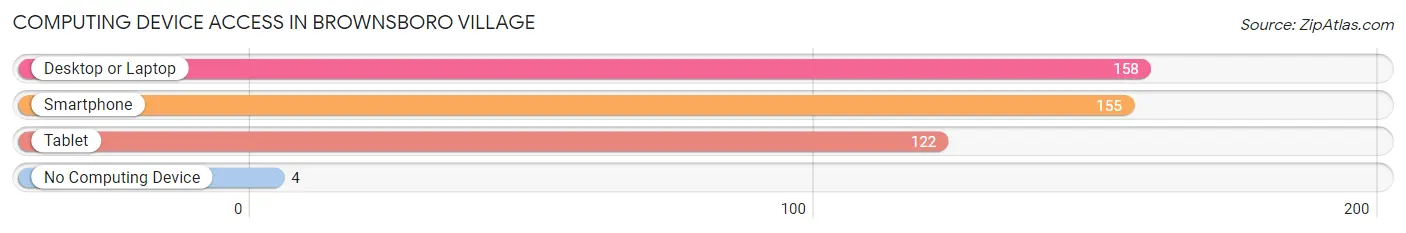
| Device Type | # Households | % Households |
| Desktop or Laptop | 158 | 89.3% |
| Smartphone | 155 | 87.6% |
| Tablet | 122 | 68.9% |
| No Computing Device | 4 | 2.3% |
| Total | 177 | 100.0% |
Internet Access in Brownsboro Village
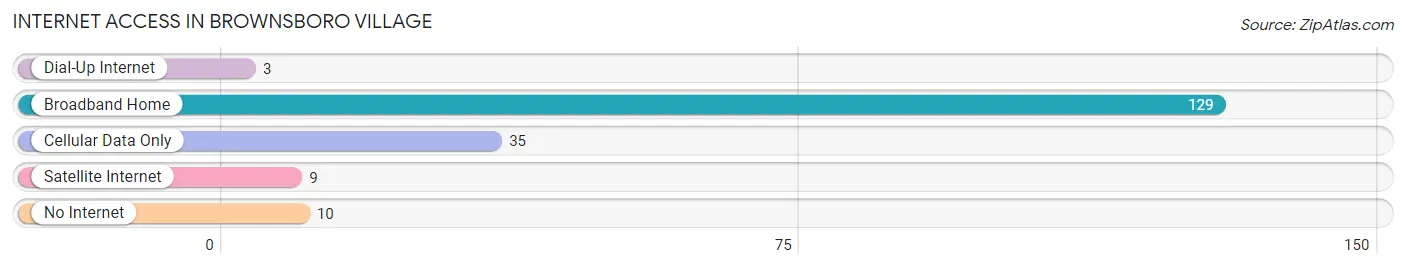
| Internet Type | # Households | % Households |
| Dial-Up Internet | 3 | 1.7% |
| Broadband Home | 129 | 72.9% |
| Cellular Data Only | 35 | 19.8% |
| Satellite Internet | 9 | 5.1% |
| No Internet | 10 | 5.7% |
| Total | 177 | 100.0% |
Brownsboro Village Summary
Brownsboro Village is a small city located in the eastern part of Jefferson County, Kentucky. It is situated on the banks of the Ohio River, just north of the city of Louisville. The population of Brownsboro Village was 2,845 at the 2010 census.
History
Brownsboro Village was founded in 1817 by William Brown, a Revolutionary War veteran. Brown purchased the land from the local Native Americans and named the settlement after himself. The village was incorporated in 1867 and was the first village in Jefferson County to be incorporated.
In the late 19th century, Brownsboro Village was a popular destination for wealthy Louisvillians who wanted to escape the hustle and bustle of the city. The village was known for its beautiful scenery and its many resorts and hotels.
In the early 20th century, Brownsboro Village began to decline as the wealthy Louisvillians moved away and the village became a working-class neighborhood. The village was annexed by the city of Louisville in 1954.
Geography
Brownsboro Village is located at 38°17'25" North, 85°41'17" West (38.290278, -85.688056). The village is situated on the banks of the Ohio River, just north of the city of Louisville. The village is bordered by the cities of Prospect and Harrods Creek to the north, and the city of St. Matthews to the south.
The total area of Brownsboro Village is 1.2 square miles, all of which is land. The village is located in a hilly area and is surrounded by woods and farmland.
Economy
The economy of Brownsboro Village is largely based on the service industry. The village is home to several restaurants, bars, and retail stores. There are also several small businesses located in the village, including a printing shop, a florist, and a pet store.
The village is also home to several medical facilities, including a hospital, a nursing home, and a rehabilitation center.
Demographics
As of the 2010 census, the population of Brownsboro Village was 2,845. The racial makeup of the village was 87.3% White, 8.2% African American, 0.7% Asian, 0.3% Native American, and 3.5% from other races.
The median household income in Brownsboro Village was $50,945, and the median family income was $60,945. The per capita income was $25,945. About 8.2% of the population was below the poverty line.
The village is served by the Jefferson County Public Schools system. The village is home to two elementary schools, a middle school, and a high school.
Common Questions
What is Per Capita Income in Brownsboro Village?
Per Capita income in Brownsboro Village is $70,908.
What is the Median Family Income in Brownsboro Village?
Median Family Income in Brownsboro Village is $158,750.
What is the Median Household income in Brownsboro Village?
Median Household Income in Brownsboro Village is $89,688.
What is Income or Wage Gap in Brownsboro Village?
Income or Wage Gap in Brownsboro Village is 29.6%.
Women in Brownsboro Village earn 70.4 cents for every dollar earned by a man.
What is Inequality or Gini Index in Brownsboro Village?
Inequality or Gini Index in Brownsboro Village is 0.51.
What is the Total Population of Brownsboro Village?
Total Population of Brownsboro Village is 326.
What is the Total Male Population of Brownsboro Village?
Total Male Population of Brownsboro Village is 147.
What is the Total Female Population of Brownsboro Village?
Total Female Population of Brownsboro Village is 179.
What is the Ratio of Males per 100 Females in Brownsboro Village?
There are 82.12 Males per 100 Females in Brownsboro Village.
What is the Ratio of Females per 100 Males in Brownsboro Village?
There are 121.77 Females per 100 Males in Brownsboro Village.
What is the Median Population Age in Brownsboro Village?
Median Population Age in Brownsboro Village is 52.3 Years.
What is the Average Family Size in Brownsboro Village
Average Family Size in Brownsboro Village is 2.9 People.
What is the Average Household Size in Brownsboro Village
Average Household Size in Brownsboro Village is 1.8 People.
How Large is the Labor Force in Brownsboro Village?
There are 173 People in the Labor Forcein in Brownsboro Village.
What is the Percentage of People in the Labor Force in Brownsboro Village?
64.1% of People are in the Labor Force in Brownsboro Village.
What is the Unemployment Rate in Brownsboro Village?
Unemployment Rate in Brownsboro Village is 2.9%.