Oakbrook, KY Map & Demographics
Oakbrook Map
Oakbrook Overview
$46,857
PER CAPITA INCOME
$111,452
AVG FAMILY INCOME
$91,282
AVG HOUSEHOLD INCOME
27.6%
WAGE / INCOME GAP [ % ]
72.4¢/ $1
WAGE / INCOME GAP [ $ ]
0.35
INEQUALITY / GINI INDEX
10,045
TOTAL POPULATION
4,977
MALE POPULATION
5,068
FEMALE POPULATION
98.20
MALES / 100 FEMALES
101.83
FEMALES / 100 MALES
41.1
MEDIAN AGE
2.9
AVG FAMILY SIZE
2.4
AVG HOUSEHOLD SIZE
6,083
LABOR FORCE [ PEOPLE ]
72.2%
PERCENT IN LABOR FORCE
2.6%
UNEMPLOYMENT RATE
Income in Oakbrook
Income Overview in Oakbrook
Per Capita Income in Oakbrook is $46,857, while median incomes of families and households are $111,452 and $91,282 respectively.
| Characteristic | Number | Measure |
| Per Capita Income | 10,045 | $46,857 |
| Median Family Income | 2,842 | $111,452 |
| Mean Family Income | 2,842 | $128,500 |
| Median Household Income | 4,172 | $91,282 |
| Mean Household Income | 4,172 | $113,015 |
| Income Deficit | 2,842 | $0 |
| Wage / Income Gap (%) | 10,045 | 27.64% |
| Wage / Income Gap ($) | 10,045 | 72.36¢ per $1 |
| Gini / Inequality Index | 10,045 | 0.35 |
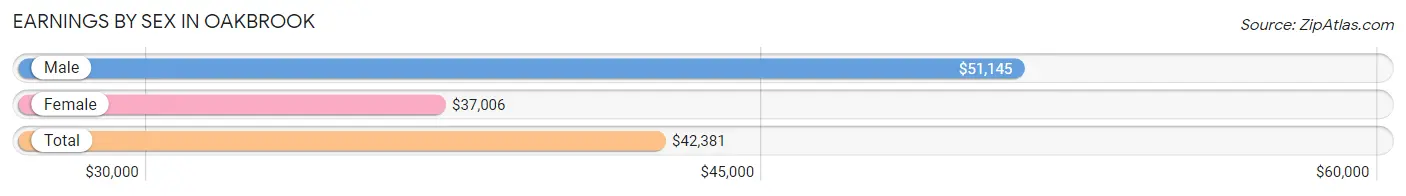
Earnings by Sex in Oakbrook
Average Earnings in Oakbrook are $42,381, $51,145 for men and $37,006 for women, a difference of 27.6%.
| Sex | Number | Average Earnings |
| Male | 3,336 (52.3%) | $51,145 |
| Female | 3,039 (47.7%) | $37,006 |
| Total | 6,375 (100.0%) | $42,381 |
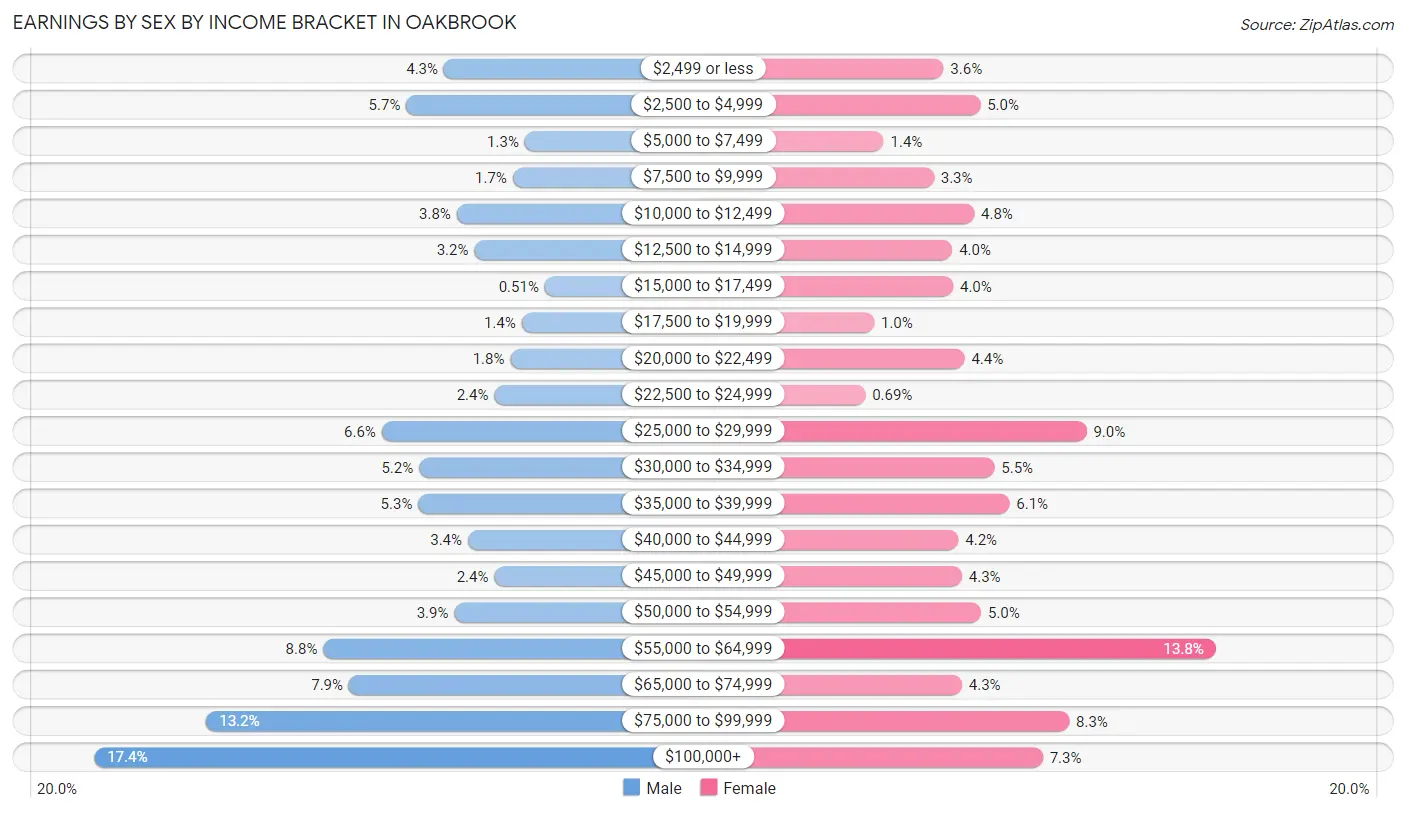
Earnings by Sex by Income Bracket in Oakbrook
The most common earnings brackets in Oakbrook are $100,000+ for men (580 | 17.4%) and $55,000 to $64,999 for women (420 | 13.8%).
| Income | Male | Female |
| $2,499 or less | 143 (4.3%) | 110 (3.6%) |
| $2,500 to $4,999 | 190 (5.7%) | 152 (5.0%) |
| $5,000 to $7,499 | 42 (1.3%) | 42 (1.4%) |
| $7,500 to $9,999 | 57 (1.7%) | 99 (3.3%) |
| $10,000 to $12,499 | 127 (3.8%) | 145 (4.8%) |
| $12,500 to $14,999 | 105 (3.2%) | 120 (4.0%) |
| $15,000 to $17,499 | 17 (0.5%) | 121 (4.0%) |
| $17,500 to $19,999 | 46 (1.4%) | 31 (1.0%) |
| $20,000 to $22,499 | 60 (1.8%) | 134 (4.4%) |
| $22,500 to $24,999 | 80 (2.4%) | 21 (0.7%) |
| $25,000 to $29,999 | 221 (6.6%) | 273 (9.0%) |
| $30,000 to $34,999 | 174 (5.2%) | 168 (5.5%) |
| $35,000 to $39,999 | 175 (5.2%) | 185 (6.1%) |
| $40,000 to $44,999 | 113 (3.4%) | 127 (4.2%) |
| $45,000 to $49,999 | 80 (2.4%) | 131 (4.3%) |
| $50,000 to $54,999 | 130 (3.9%) | 153 (5.0%) |
| $55,000 to $64,999 | 294 (8.8%) | 420 (13.8%) |
| $65,000 to $74,999 | 262 (7.9%) | 131 (4.3%) |
| $75,000 to $99,999 | 440 (13.2%) | 253 (8.3%) |
| $100,000+ | 580 (17.4%) | 223 (7.3%) |
| Total | 3,336 (100.0%) | 3,039 (100.0%) |
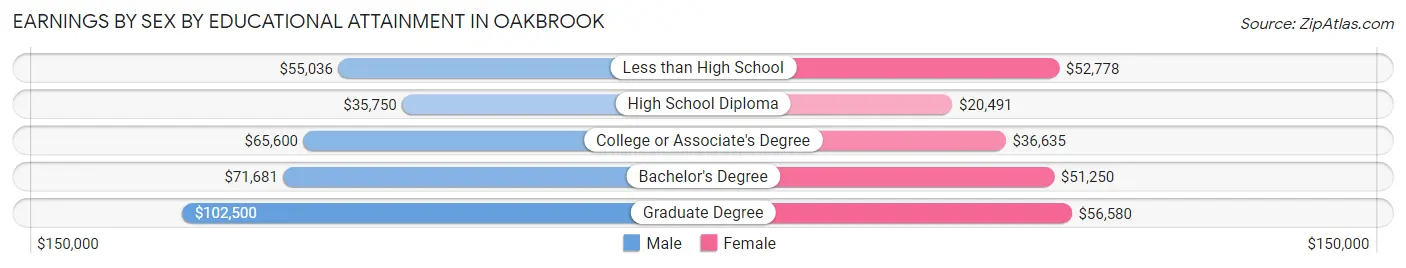
Earnings by Sex by Educational Attainment in Oakbrook
Average earnings in Oakbrook are $59,485 for men and $42,389 for women, a difference of 28.7%. Men with an educational attainment of graduate degree enjoy the highest average annual earnings of $102,500, while those with high school diploma education earn the least with $35,750. Women with an educational attainment of graduate degree earn the most with the average annual earnings of $56,580, while those with high school diploma education have the smallest earnings of $20,491.
| Educational Attainment | Male Income | Female Income |
| Less than High School | $55,036 | $52,778 |
| High School Diploma | $35,750 | $20,491 |
| College or Associate's Degree | $65,600 | $36,635 |
| Bachelor's Degree | $71,681 | $51,250 |
| Graduate Degree | $102,500 | $56,580 |
| Total | $59,485 | $42,389 |
Family Income in Oakbrook
Family Income Brackets in Oakbrook
According to the Oakbrook family income data, there are 878 families falling into the $100,000 to $149,999 income range, which is the most common income bracket and makes up 30.9% of all families.
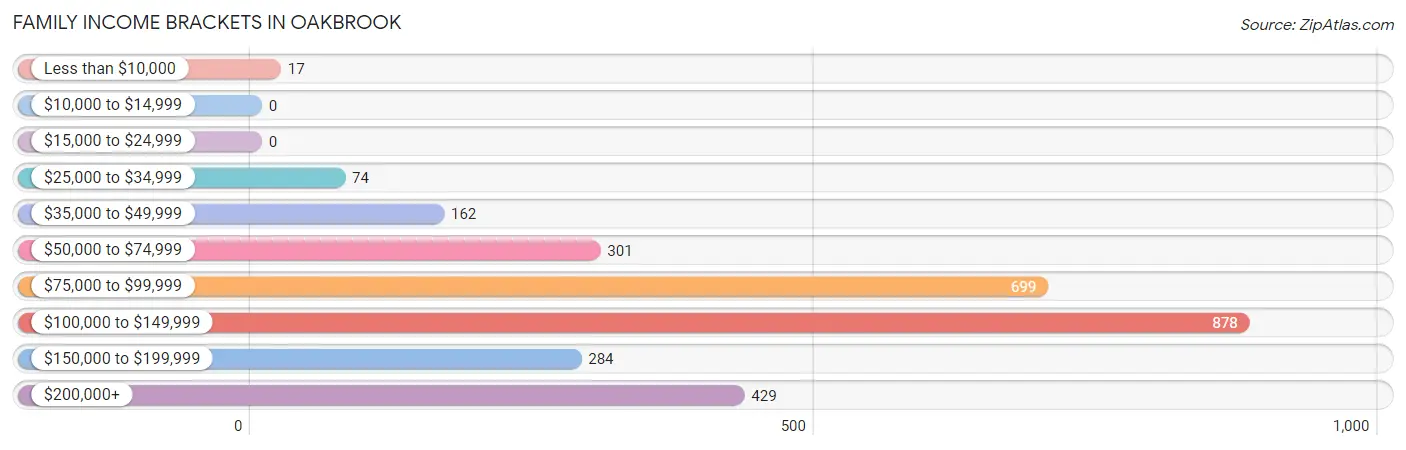
| Income Bracket | # Families | % Families |
| Less than $10,000 | 17 | 0.6% |
| $10,000 to $14,999 | 0 | 0.0% |
| $15,000 to $24,999 | 0 | 0.0% |
| $25,000 to $34,999 | 74 | 2.6% |
| $35,000 to $49,999 | 162 | 5.7% |
| $50,000 to $74,999 | 301 | 10.6% |
| $75,000 to $99,999 | 699 | 24.6% |
| $100,000 to $149,999 | 878 | 30.9% |
| $150,000 to $199,999 | 284 | 10.0% |
| $200,000+ | 429 | 15.1% |
Family Income by Famaliy Size in Oakbrook
5-person families (148 | 5.2%) account for the highest median family income in Oakbrook with $250,001 per family, while 5-person families (148 | 5.2%) have the highest median income of $50,000 per family member.
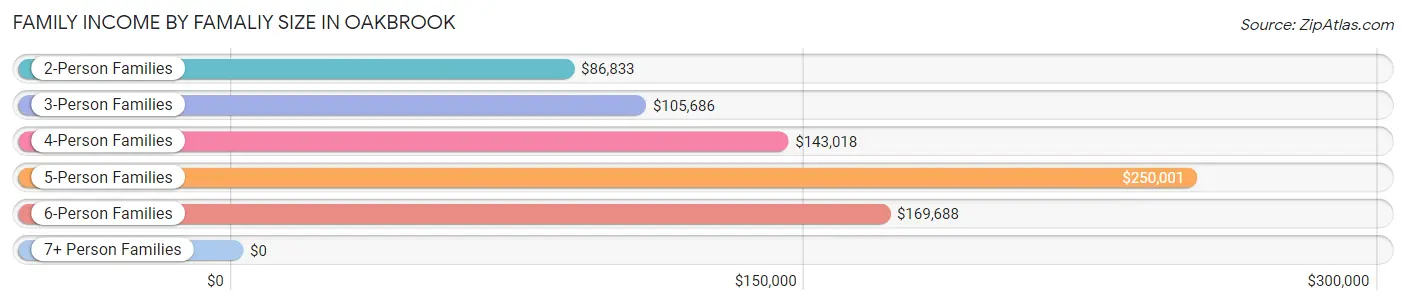
| Income Bracket | # Families | Median Income |
| 2-Person Families | 1,430 (50.3%) | $86,833 |
| 3-Person Families | 687 (24.2%) | $105,686 |
| 4-Person Families | 481 (16.9%) | $143,018 |
| 5-Person Families | 148 (5.2%) | $250,001 |
| 6-Person Families | 83 (2.9%) | $169,688 |
| 7+ Person Families | 13 (0.5%) | $0 |
| Total | 2,842 (100.0%) | $111,452 |
Family Income by Number of Earners in Oakbrook
The median family income in Oakbrook is $111,452, with families comprising 2 earners (1,185) having the highest median family income of $122,421, while families with no earners (248) have the lowest median family income of $54,688, accounting for 41.7% and 8.7% of families, respectively.
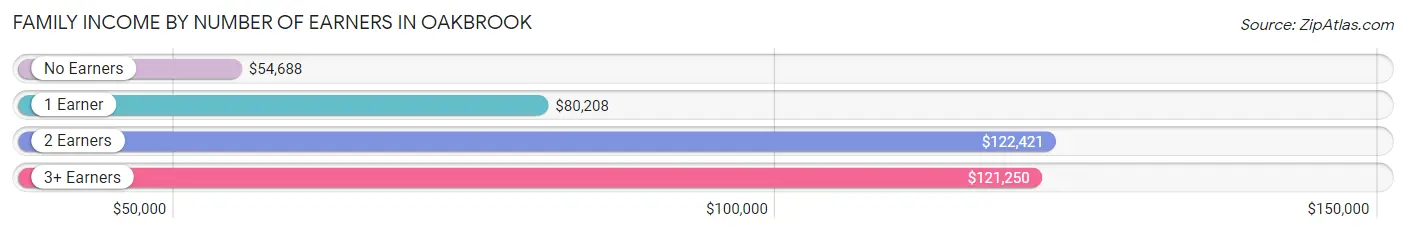
| Number of Earners | # Families | Median Income |
| No Earners | 248 (8.7%) | $54,688 |
| 1 Earner | 944 (33.2%) | $80,208 |
| 2 Earners | 1,185 (41.7%) | $122,421 |
| 3+ Earners | 465 (16.4%) | $121,250 |
| Total | 2,842 (100.0%) | $111,452 |
Household Income in Oakbrook
Household Income Brackets in Oakbrook
With 1,076 households falling in the category, the $100,000 to $149,999 income range is the most frequent in Oakbrook, accounting for 25.8% of all households. In contrast, only 8 households (0.2%) fall into the $10,000 to $14,999 income bracket, making it the least populous group.
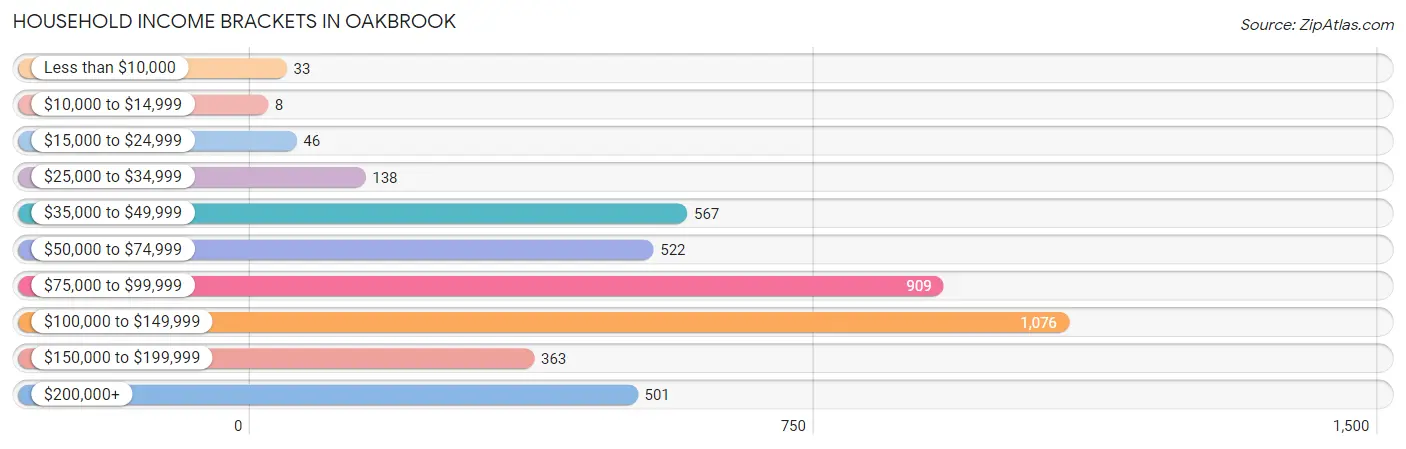
| Income Bracket | # Households | % Households |
| Less than $10,000 | 33 | 0.8% |
| $10,000 to $14,999 | 8 | 0.2% |
| $15,000 to $24,999 | 46 | 1.1% |
| $25,000 to $34,999 | 138 | 3.3% |
| $35,000 to $49,999 | 567 | 13.6% |
| $50,000 to $74,999 | 522 | 12.5% |
| $75,000 to $99,999 | 909 | 21.8% |
| $100,000 to $149,999 | 1,076 | 25.8% |
| $150,000 to $199,999 | 363 | 8.7% |
| $200,000+ | 501 | 12.0% |
Household Income by Householder Age in Oakbrook
The median household income in Oakbrook is $91,282, with the highest median household income of $118,554 found in the 45 to 64 years age bracket for the primary householder. A total of 1,496 households (35.9%) fall into this category. Meanwhile, the 15 to 24 years age bracket for the primary householder has the lowest median household income of $80,074, with 63 households (1.5%) in this group.
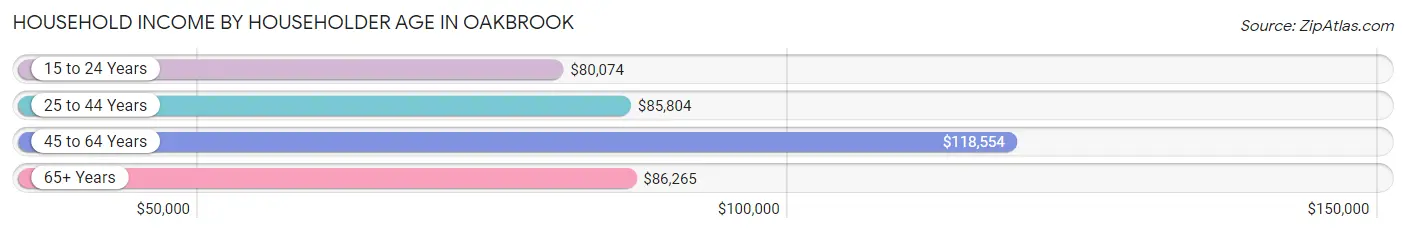
| Income Bracket | # Households | Median Income |
| 15 to 24 Years | 63 (1.5%) | $80,074 |
| 25 to 44 Years | 1,477 (35.4%) | $85,804 |
| 45 to 64 Years | 1,496 (35.9%) | $118,554 |
| 65+ Years | 1,136 (27.2%) | $86,265 |
| Total | 4,172 (100.0%) | $91,282 |
Poverty in Oakbrook
Income Below Poverty by Sex and Age in Oakbrook
With 1.2% poverty level for males and 2.5% for females among the residents of Oakbrook, 18 to 24 year old males and 25 to 34 year old females are the most vulnerable to poverty, with 22 males (4.4%) and 77 females (13.6%) in their respective age groups living below the poverty level.
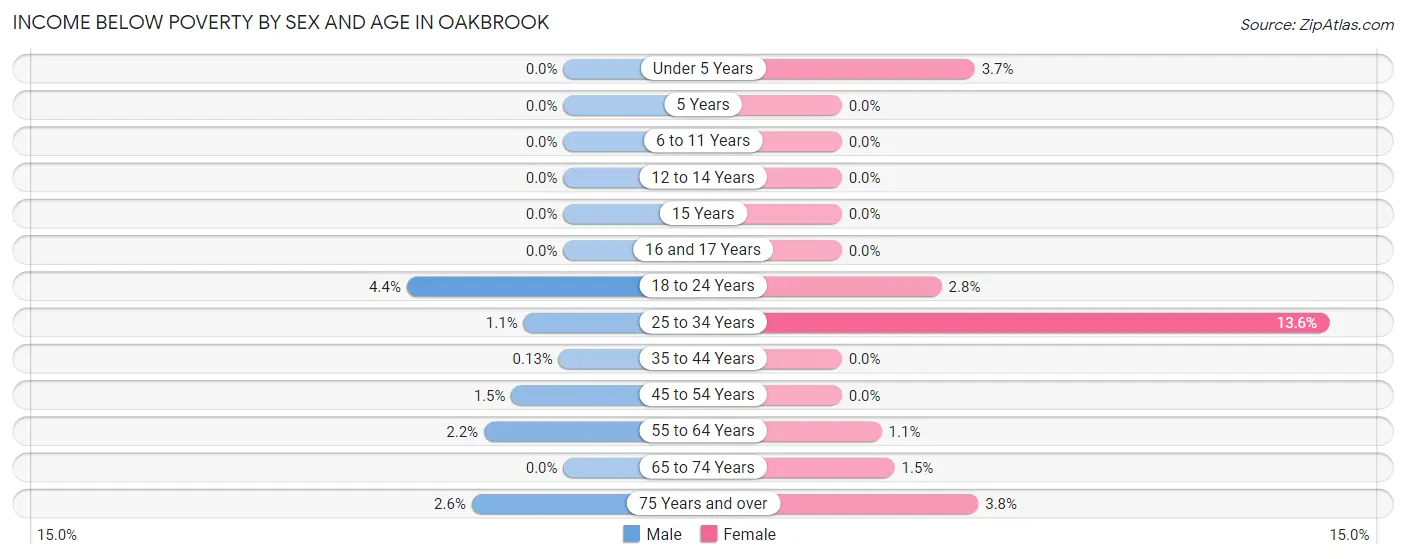
| Age Bracket | Male | Female |
| Under 5 Years | 0 (0.0%) | 9 (3.7%) |
| 5 Years | 0 (0.0%) | 0 (0.0%) |
| 6 to 11 Years | 0 (0.0%) | 0 (0.0%) |
| 12 to 14 Years | 0 (0.0%) | 0 (0.0%) |
| 15 Years | 0 (0.0%) | 0 (0.0%) |
| 16 and 17 Years | 0 (0.0%) | 0 (0.0%) |
| 18 to 24 Years | 22 (4.4%) | 10 (2.8%) |
| 25 to 34 Years | 9 (1.1%) | 77 (13.6%) |
| 35 to 44 Years | 1 (0.1%) | 0 (0.0%) |
| 45 to 54 Years | 9 (1.5%) | 0 (0.0%) |
| 55 to 64 Years | 13 (2.2%) | 9 (1.1%) |
| 65 to 74 Years | 0 (0.0%) | 11 (1.5%) |
| 75 Years and over | 7 (2.5%) | 10 (3.8%) |
| Total | 61 (1.2%) | 126 (2.5%) |
Income Above Poverty by Sex and Age in Oakbrook
According to the poverty statistics in Oakbrook, males aged under 5 years and females aged 5 years are the age groups that are most secure financially, with 100.0% of males and 100.0% of females in these age groups living above the poverty line.
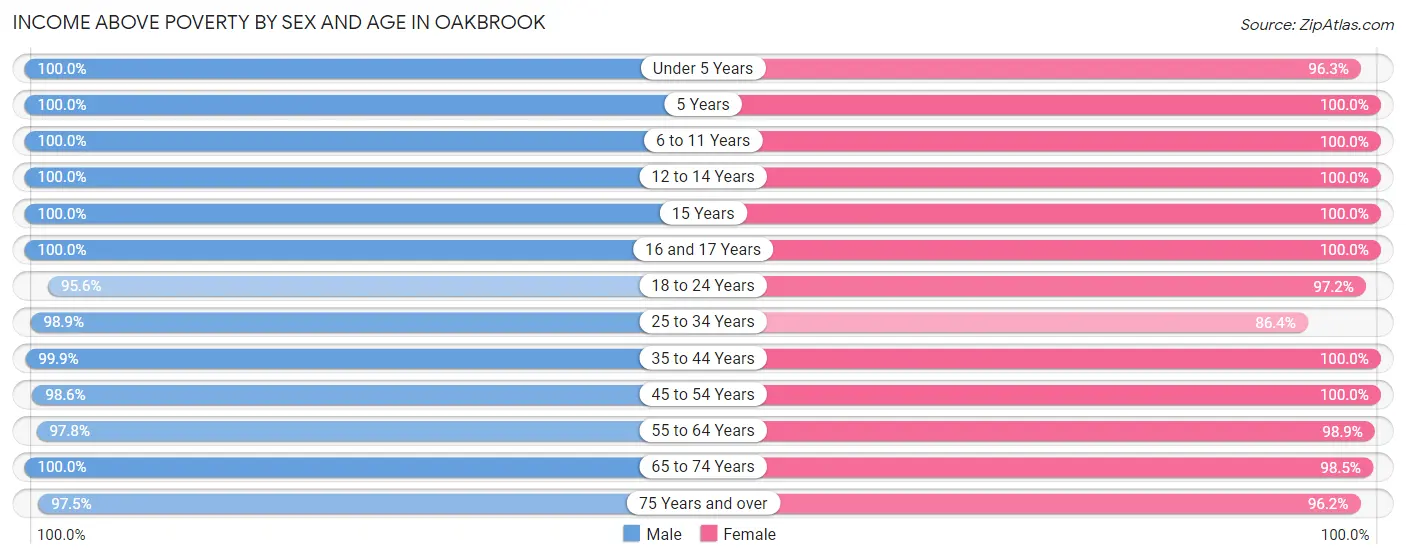
| Age Bracket | Male | Female |
| Under 5 Years | 217 (100.0%) | 234 (96.3%) |
| 5 Years | 165 (100.0%) | 9 (100.0%) |
| 6 to 11 Years | 187 (100.0%) | 236 (100.0%) |
| 12 to 14 Years | 70 (100.0%) | 160 (100.0%) |
| 15 Years | 87 (100.0%) | 176 (100.0%) |
| 16 and 17 Years | 108 (100.0%) | 174 (100.0%) |
| 18 to 24 Years | 483 (95.6%) | 350 (97.2%) |
| 25 to 34 Years | 799 (98.9%) | 491 (86.4%) |
| 35 to 44 Years | 770 (99.9%) | 746 (100.0%) |
| 45 to 54 Years | 613 (98.6%) | 535 (100.0%) |
| 55 to 64 Years | 575 (97.8%) | 803 (98.9%) |
| 65 to 74 Years | 544 (100.0%) | 735 (98.5%) |
| 75 Years and over | 268 (97.5%) | 253 (96.2%) |
| Total | 4,886 (98.8%) | 4,902 (97.5%) |
Income Below Poverty Among Married-Couple Families in Oakbrook
The poverty statistics for married-couple families in Oakbrook show that 0.4% or 9 of the total 2,300 families live below the poverty line. Families with 1 or 2 children have the highest poverty rate of 1.3%, comprising of 9 families. On the other hand, families with no children have the lowest poverty rate of 0.0%, which includes 0 families.
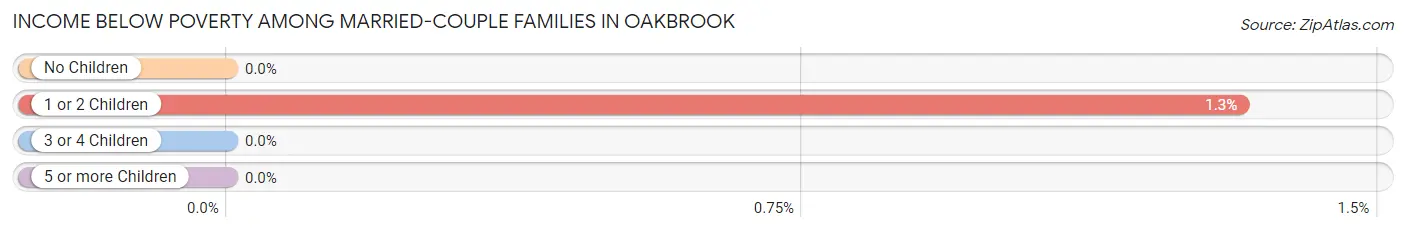
| Children | Above Poverty | Below Poverty |
| No Children | 1,480 (100.0%) | 0 (0.0%) |
| 1 or 2 Children | 675 (98.7%) | 9 (1.3%) |
| 3 or 4 Children | 136 (100.0%) | 0 (0.0%) |
| 5 or more Children | 0 (0.0%) | 0 (0.0%) |
| Total | 2,291 (99.6%) | 9 (0.4%) |
Income Below Poverty Among Single-Parent Households in Oakbrook
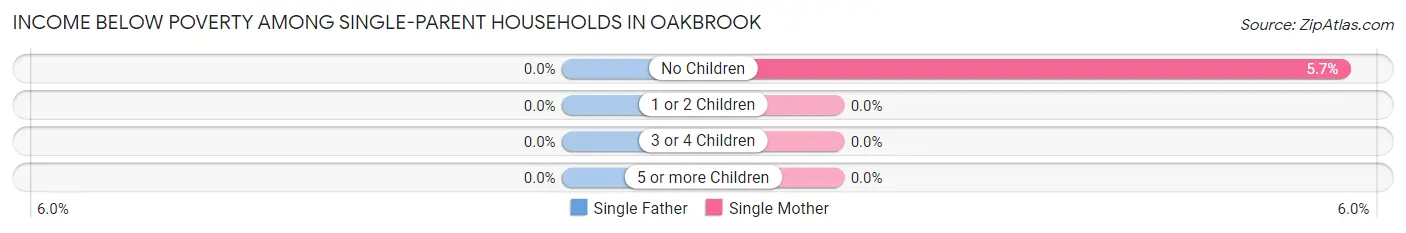
| Children | Single Father | Single Mother |
| No Children | 0 (0.0%) | 9 (5.7%) |
| 1 or 2 Children | 0 (0.0%) | 0 (0.0%) |
| 3 or 4 Children | 0 (0.0%) | 0 (0.0%) |
| 5 or more Children | 0 (0.0%) | 0 (0.0%) |
| Total | 0 (0.0%) | 9 (2.3%) |
Income Below Poverty Among Married-Couple vs Single-Parent Households in Oakbrook
The poverty data for Oakbrook shows that 9 of the married-couple family households (0.4%) and 9 of the single-parent households (1.7%) are living below the poverty level. Within the married-couple family households, those with 1 or 2 children have the highest poverty rate, with 9 households (1.3%) falling below the poverty line. Among the single-parent households, those with no children have the highest poverty rate, with 9 household (4.1%) living below poverty.
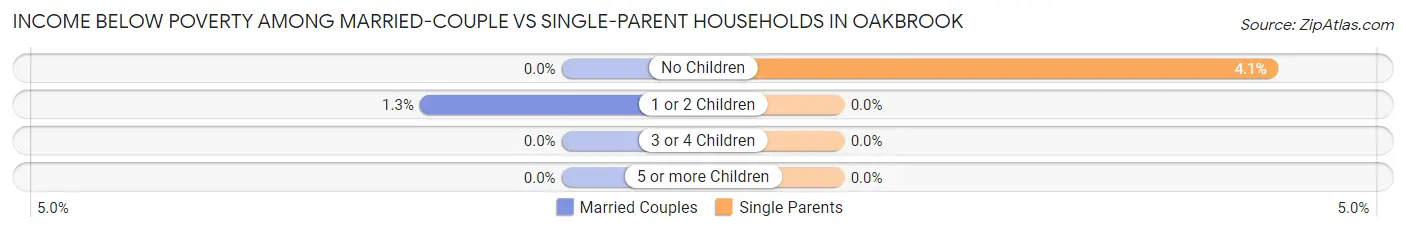
| Children | Married-Couple Families | Single-Parent Households |
| No Children | 0 (0.0%) | 9 (4.1%) |
| 1 or 2 Children | 9 (1.3%) | 0 (0.0%) |
| 3 or 4 Children | 0 (0.0%) | 0 (0.0%) |
| 5 or more Children | 0 (0.0%) | 0 (0.0%) |
| Total | 9 (0.4%) | 9 (1.7%) |
Race in Oakbrook
The most populous races in Oakbrook are White / Caucasian (8,539 | 85.0%), Black / African American (636 | 6.3%), and Hispanic or Latino (413 | 4.1%).
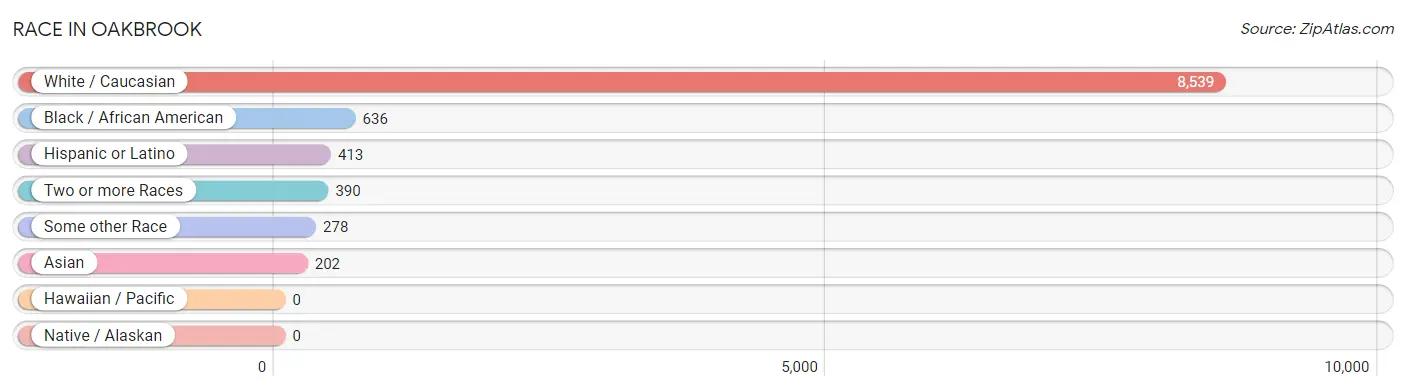
| Race | # Population | % Population |
| Asian | 202 | 2.0% |
| Black / African American | 636 | 6.3% |
| Hawaiian / Pacific | 0 | 0.0% |
| Hispanic or Latino | 413 | 4.1% |
| Native / Alaskan | 0 | 0.0% |
| White / Caucasian | 8,539 | 85.0% |
| Two or more Races | 390 | 3.9% |
| Some other Race | 278 | 2.8% |
| Total | 10,045 | 100.0% |
Ancestry in Oakbrook
The most populous ancestries reported in Oakbrook are German (2,694 | 26.8%), Irish (1,265 | 12.6%), English (1,144 | 11.4%), American (586 | 5.8%), and Scottish (567 | 5.6%), together accounting for 62.3% of all Oakbrook residents.
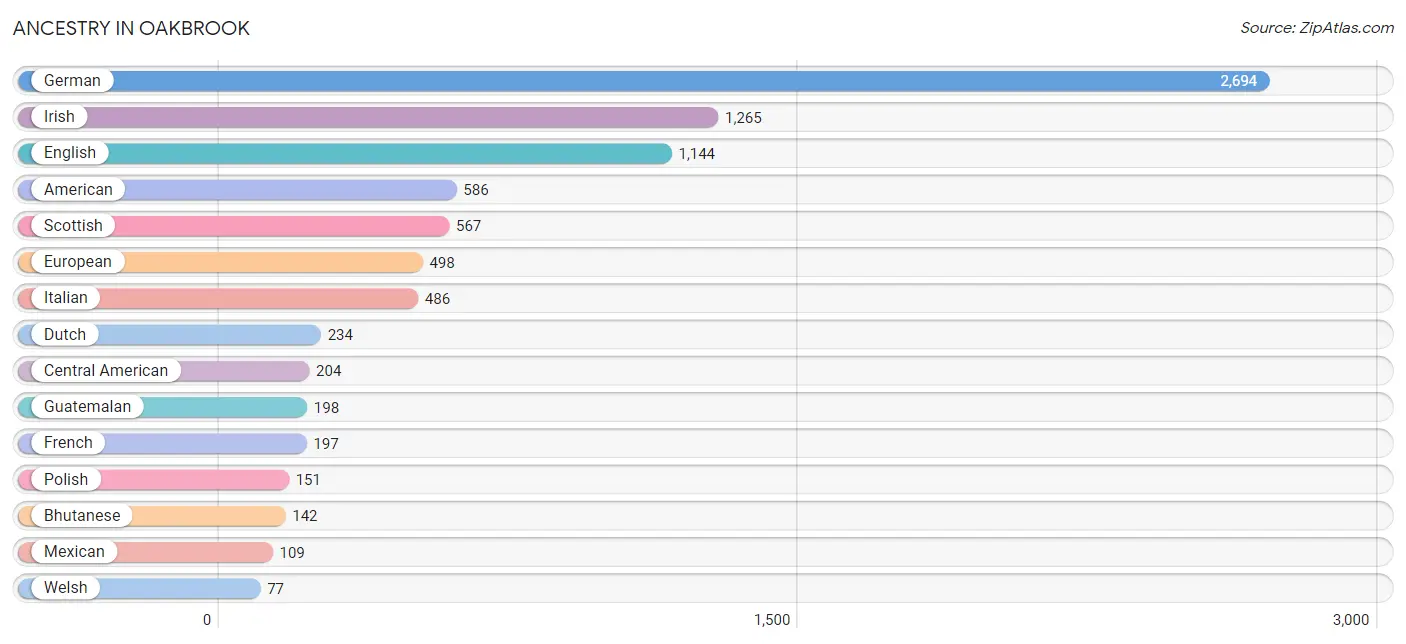
| Ancestry | # Population | % Population |
| African | 1 | 0.0% |
| American | 586 | 5.8% |
| Arab | 42 | 0.4% |
| Austrian | 14 | 0.1% |
| Bangladeshi | 18 | 0.2% |
| Bhutanese | 142 | 1.4% |
| Brazilian | 59 | 0.6% |
| British | 21 | 0.2% |
| Bulgarian | 22 | 0.2% |
| Burmese | 47 | 0.5% |
| Canadian | 11 | 0.1% |
| Central American | 204 | 2.0% |
| Cherokee | 46 | 0.5% |
| Cuban | 18 | 0.2% |
| Czech | 9 | 0.1% |
| Danish | 21 | 0.2% |
| Dutch | 234 | 2.3% |
| English | 1,144 | 11.4% |
| European | 498 | 5.0% |
| Finnish | 13 | 0.1% |
| French | 197 | 2.0% |
| French Canadian | 20 | 0.2% |
| German | 2,694 | 26.8% |
| Ghanaian | 35 | 0.4% |
| Greek | 8 | 0.1% |
| Guatemalan | 198 | 2.0% |
| Honduran | 2 | 0.0% |
| Hungarian | 54 | 0.5% |
| Indian (Asian) | 38 | 0.4% |
| Irish | 1,265 | 12.6% |
| Iroquois | 20 | 0.2% |
| Italian | 486 | 4.8% |
| Korean | 40 | 0.4% |
| Mexican | 109 | 1.1% |
| Nicaraguan | 4 | 0.0% |
| Palestinian | 19 | 0.2% |
| Polish | 151 | 1.5% |
| Portuguese | 8 | 0.1% |
| Puerto Rican | 53 | 0.5% |
| Russian | 38 | 0.4% |
| Scotch-Irish | 76 | 0.8% |
| Scottish | 567 | 5.6% |
| Slovene | 8 | 0.1% |
| Spaniard | 24 | 0.2% |
| Subsaharan African | 36 | 0.4% |
| Swedish | 58 | 0.6% |
| Swiss | 5 | 0.1% |
| Thai | 74 | 0.7% |
| Welsh | 77 | 0.8% |
| Yugoslavian | 22 | 0.2% | View All 50 Rows |
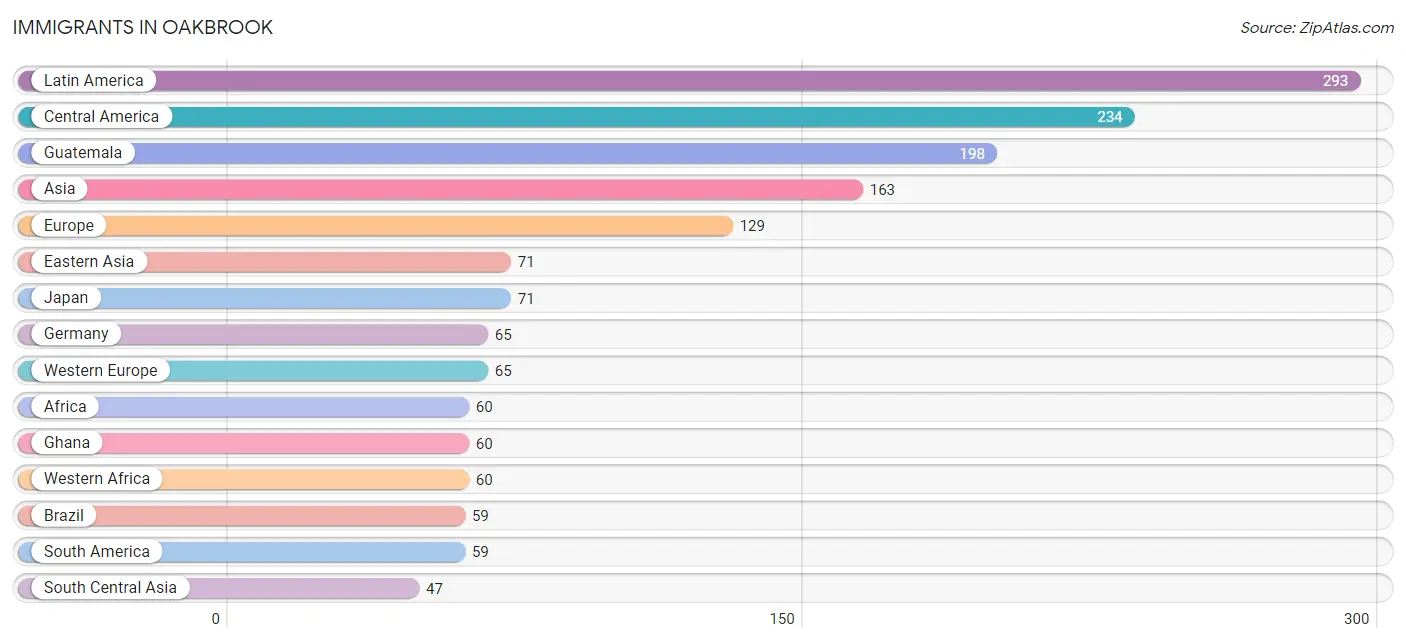
Immigrants in Oakbrook
The most numerous immigrant groups reported in Oakbrook came from Latin America (293 | 2.9%), Central America (234 | 2.3%), Guatemala (198 | 2.0%), Asia (163 | 1.6%), and Europe (129 | 1.3%), together accounting for 10.1% of all Oakbrook residents.
| Immigration Origin | # Population | % Population |
| Africa | 60 | 0.6% |
| Asia | 163 | 1.6% |
| Australia | 23 | 0.2% |
| Bosnia and Herzegovina | 15 | 0.2% |
| Brazil | 59 | 0.6% |
| Bulgaria | 11 | 0.1% |
| Canada | 46 | 0.5% |
| Central America | 234 | 2.3% |
| Eastern Asia | 71 | 0.7% |
| Eastern Europe | 26 | 0.3% |
| Europe | 129 | 1.3% |
| Germany | 65 | 0.6% |
| Ghana | 60 | 0.6% |
| Guatemala | 198 | 2.0% |
| Honduras | 2 | 0.0% |
| India | 5 | 0.1% |
| Italy | 17 | 0.2% |
| Japan | 71 | 0.7% |
| Laos | 18 | 0.2% |
| Latin America | 293 | 2.9% |
| Mexico | 31 | 0.3% |
| Nicaragua | 3 | 0.0% |
| Northern Europe | 13 | 0.1% |
| Oceania | 23 | 0.2% |
| Pakistan | 42 | 0.4% |
| Portugal | 8 | 0.1% |
| South America | 59 | 0.6% |
| South Central Asia | 47 | 0.5% |
| South Eastern Asia | 18 | 0.2% |
| Southern Europe | 25 | 0.3% |
| Western Africa | 60 | 0.6% |
| Western Asia | 27 | 0.3% |
| Western Europe | 65 | 0.6% | View All 33 Rows |
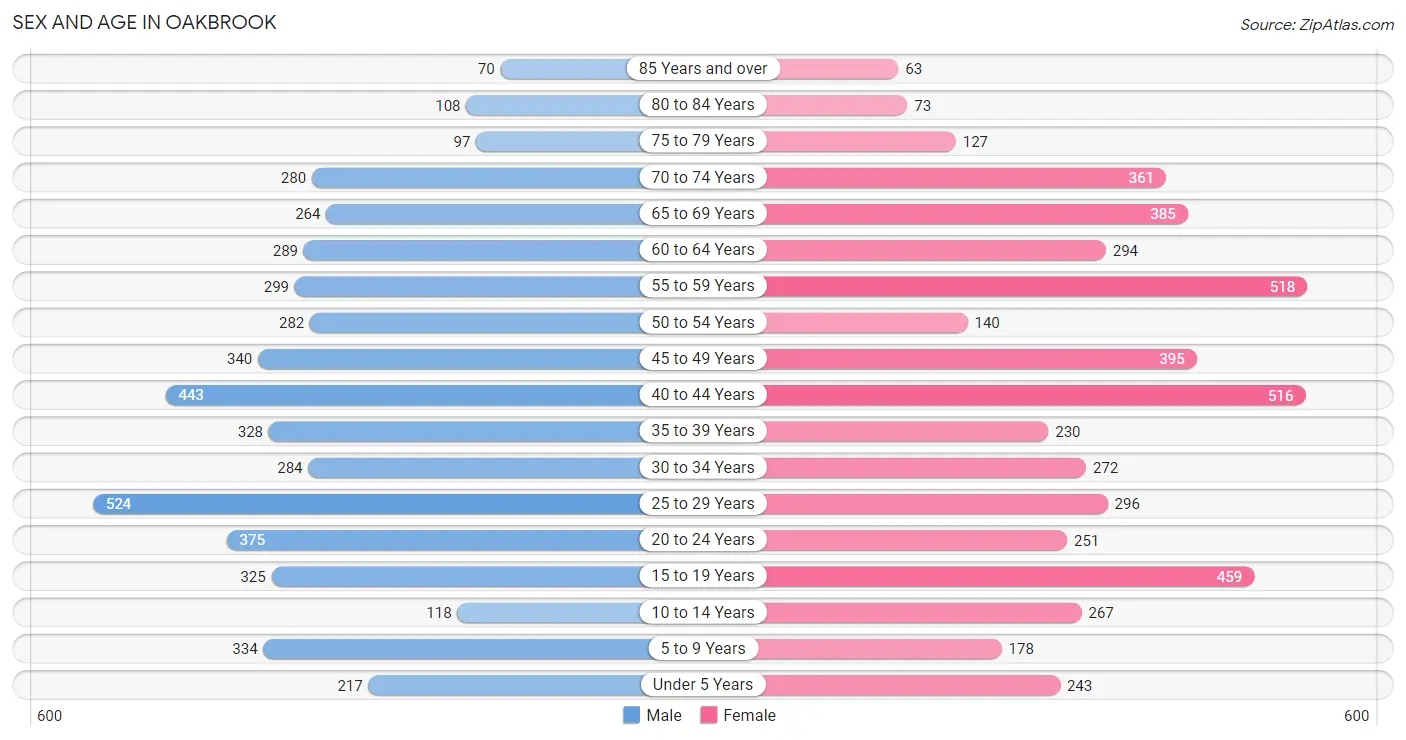
Sex and Age in Oakbrook
Sex and Age in Oakbrook
The most populous age groups in Oakbrook are 25 to 29 Years (524 | 10.5%) for men and 55 to 59 Years (518 | 10.2%) for women.
| Age Bracket | Male | Female |
| Under 5 Years | 217 (4.4%) | 243 (4.8%) |
| 5 to 9 Years | 334 (6.7%) | 178 (3.5%) |
| 10 to 14 Years | 118 (2.4%) | 267 (5.3%) |
| 15 to 19 Years | 325 (6.5%) | 459 (9.1%) |
| 20 to 24 Years | 375 (7.5%) | 251 (5.0%) |
| 25 to 29 Years | 524 (10.5%) | 296 (5.8%) |
| 30 to 34 Years | 284 (5.7%) | 272 (5.4%) |
| 35 to 39 Years | 328 (6.6%) | 230 (4.5%) |
| 40 to 44 Years | 443 (8.9%) | 516 (10.2%) |
| 45 to 49 Years | 340 (6.8%) | 395 (7.8%) |
| 50 to 54 Years | 282 (5.7%) | 140 (2.8%) |
| 55 to 59 Years | 299 (6.0%) | 518 (10.2%) |
| 60 to 64 Years | 289 (5.8%) | 294 (5.8%) |
| 65 to 69 Years | 264 (5.3%) | 385 (7.6%) |
| 70 to 74 Years | 280 (5.6%) | 361 (7.1%) |
| 75 to 79 Years | 97 (1.9%) | 127 (2.5%) |
| 80 to 84 Years | 108 (2.2%) | 73 (1.4%) |
| 85 Years and over | 70 (1.4%) | 63 (1.2%) |
| Total | 4,977 (100.0%) | 5,068 (100.0%) |
Families and Households in Oakbrook
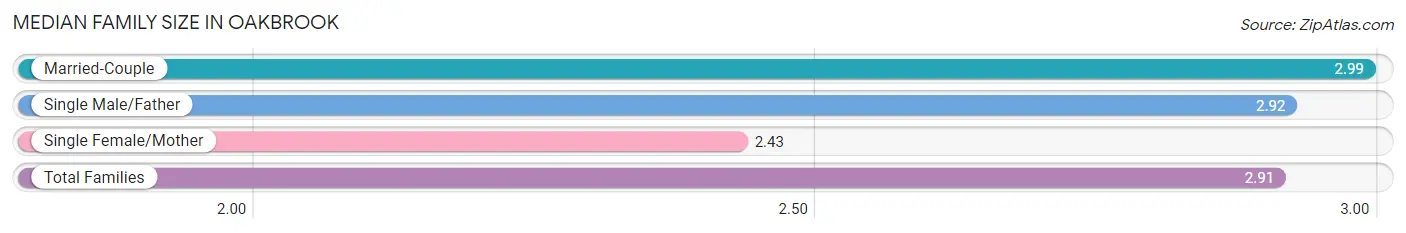
Median Family Size in Oakbrook
The median family size in Oakbrook is 2.91 persons per family, with married-couple families (2,300 | 80.9%) accounting for the largest median family size of 2.99 persons per family. On the other hand, single female/mother families (394 | 13.9%) represent the smallest median family size with 2.43 persons per family.
| Family Type | # Families | Family Size |
| Married-Couple | 2,300 (80.9%) | 2.99 |
| Single Male/Father | 148 (5.2%) | 2.92 |
| Single Female/Mother | 394 (13.9%) | 2.43 |
| Total Families | 2,842 (100.0%) | 2.91 |
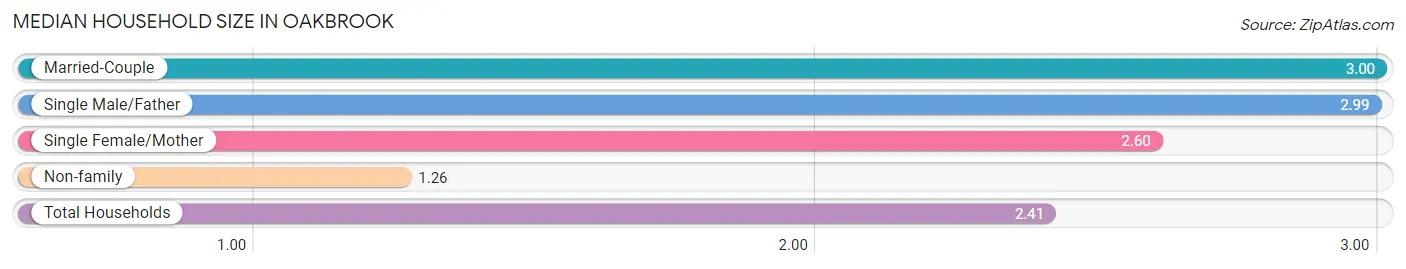
Median Household Size in Oakbrook
The median household size in Oakbrook is 2.41 persons per household, with married-couple households (2,300 | 55.1%) accounting for the largest median household size of 3 persons per household. non-family households (1,330 | 31.9%) represent the smallest median household size with 1.26 persons per household.
| Household Type | # Households | Household Size |
| Married-Couple | 2,300 (55.1%) | 3.00 |
| Single Male/Father | 148 (3.5%) | 2.99 |
| Single Female/Mother | 394 (9.4%) | 2.60 |
| Non-family | 1,330 (31.9%) | 1.26 |
| Total Households | 4,172 (100.0%) | 2.41 |
Household Size by Marriage Status in Oakbrook
Out of a total of 4,172 households in Oakbrook, 2,842 (68.1%) are family households, while 1,330 (31.9%) are nonfamily households. The most numerous type of family households are 2-person households, comprising 1,377, and the most common type of nonfamily households are 1-person households, comprising 1,015.
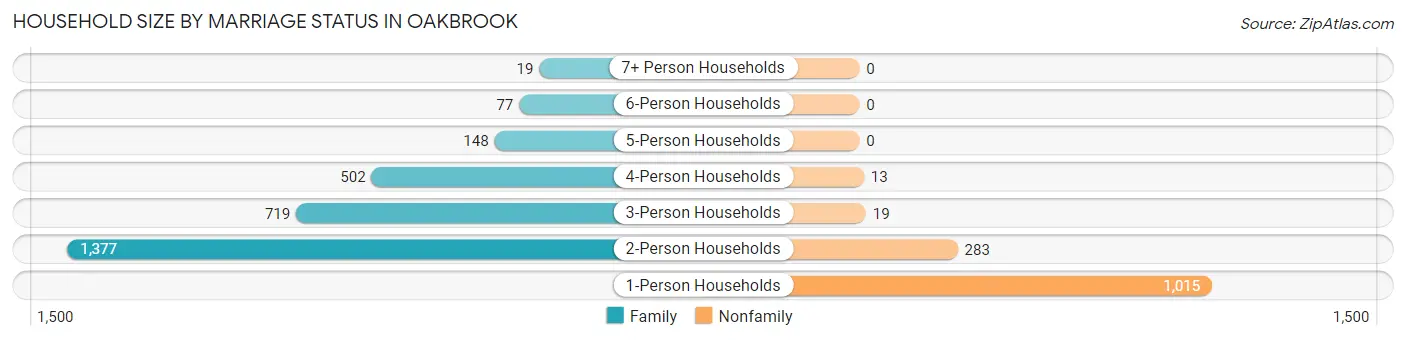
| Household Size | Family Households | Nonfamily Households |
| 1-Person Households | - | 1,015 (24.3%) |
| 2-Person Households | 1,377 (33.0%) | 283 (6.8%) |
| 3-Person Households | 719 (17.2%) | 19 (0.5%) |
| 4-Person Households | 502 (12.0%) | 13 (0.3%) |
| 5-Person Households | 148 (3.5%) | 0 (0.0%) |
| 6-Person Households | 77 (1.8%) | 0 (0.0%) |
| 7+ Person Households | 19 (0.5%) | 0 (0.0%) |
| Total | 2,842 (68.1%) | 1,330 (31.9%) |
Female Fertility in Oakbrook
Fertility by Age in Oakbrook
Average fertility rate in Oakbrook is 58.0 births per 1,000 women. Women in the age bracket of 20 to 34 years have the highest fertility rate with 100.0 births per 1,000 women. Women in the age bracket of 20 to 34 years acount for 58.2% of all women with births.
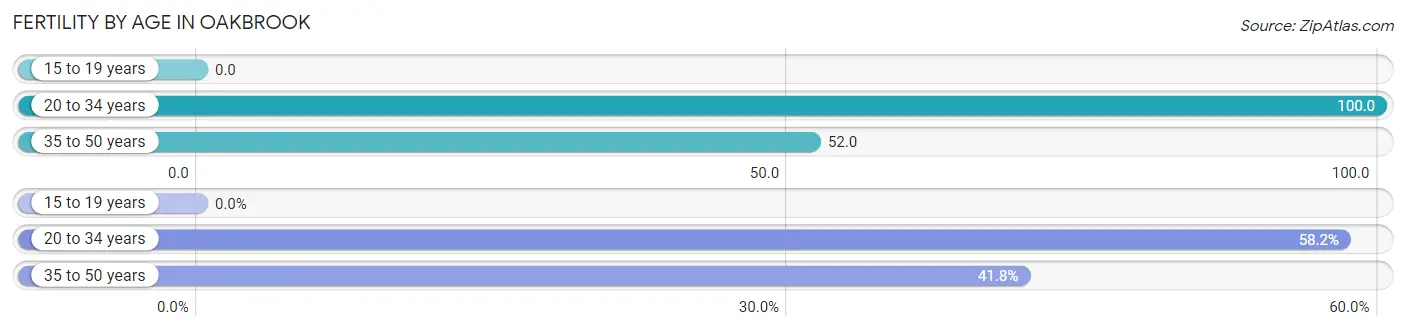
| Age Bracket | Women with Births | Births / 1,000 Women |
| 15 to 19 years | 0 (0.0%) | 0.0 |
| 20 to 34 years | 82 (58.2%) | 100.0 |
| 35 to 50 years | 59 (41.8%) | 52.0 |
| Total | 141 (100.0%) | 58.0 |
Fertility by Age by Marriage Status in Oakbrook
90.8% of women with births (141) in Oakbrook are married. The highest percentage of unmarried women with births falls into 20 to 34 years age bracket with 15.9% of them unmarried at the time of birth, while the lowest percentage of unmarried women with births belong to 35 to 50 years age bracket with 0.0% of them unmarried.
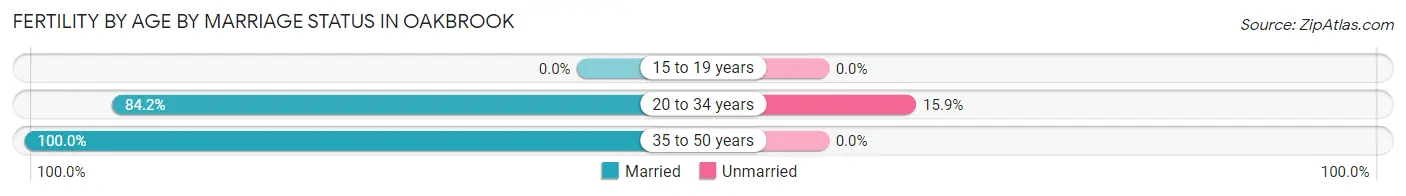
| Age Bracket | Married | Unmarried |
| 15 to 19 years | 0 (0.0%) | 0 (0.0%) |
| 20 to 34 years | 69 (84.2%) | 13 (15.9%) |
| 35 to 50 years | 59 (100.0%) | 0 (0.0%) |
| Total | 128 (90.8%) | 13 (9.2%) |
Fertility by Education in Oakbrook
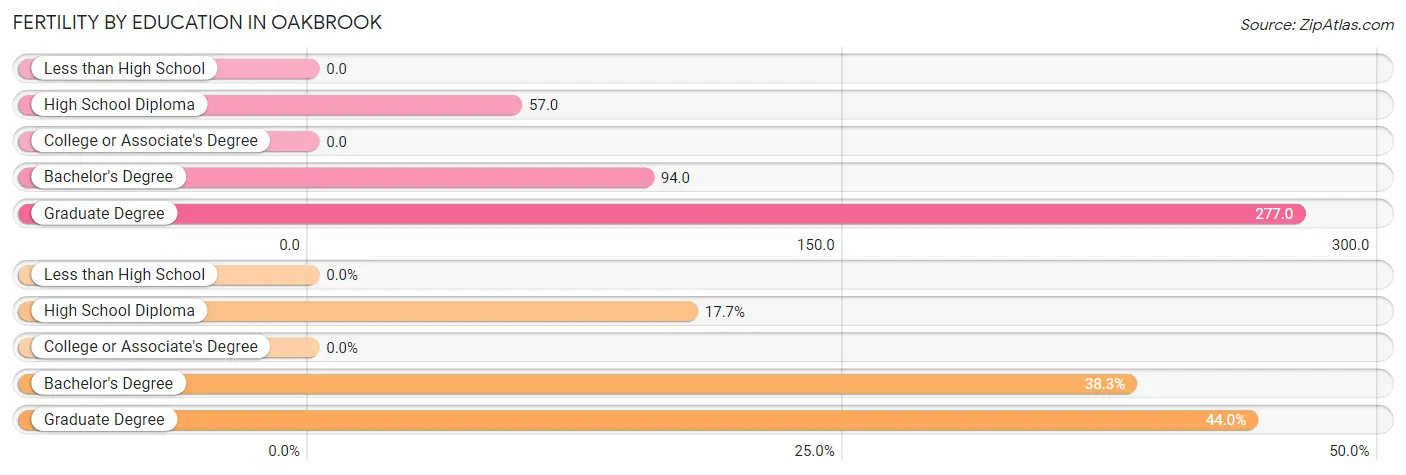
| Educational Attainment | Women with Births | Births / 1,000 Women |
| Less than High School | 0 (0.0%) | 0.0 |
| High School Diploma | 25 (17.7%) | 57.0 |
| College or Associate's Degree | 0 (0.0%) | 0.0 |
| Bachelor's Degree | 54 (38.3%) | 94.0 |
| Graduate Degree | 62 (44.0%) | 277.0 |
| Total | 141 (100.0%) | 58.0 |
Fertility by Education by Marriage Status in Oakbrook
9.2% of women with births in Oakbrook are unmarried. Women with the educational attainment of bachelor's degree are most likely to be married with 100.0% of them married at childbirth, while women with the educational attainment of high school diploma are least likely to be married with 52.0% of them unmarried at childbirth.
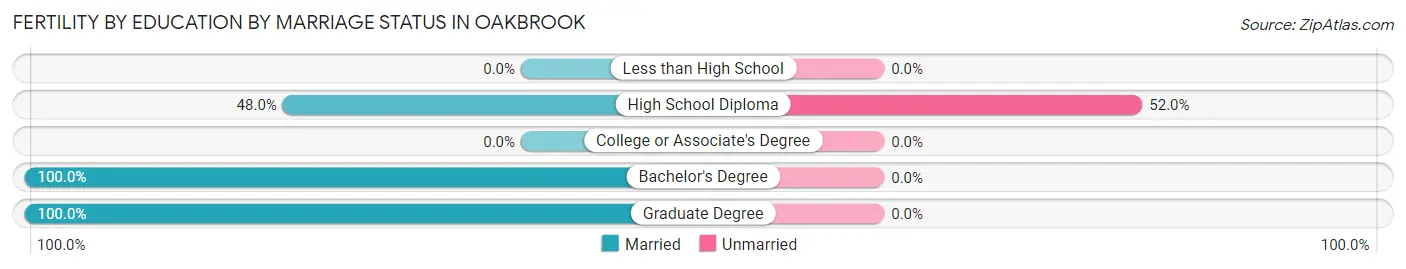
| Educational Attainment | Married | Unmarried |
| Less than High School | 0 (0.0%) | 0 (0.0%) |
| High School Diploma | 12 (48.0%) | 13 (52.0%) |
| College or Associate's Degree | 0 (0.0%) | 0 (0.0%) |
| Bachelor's Degree | 54 (100.0%) | 0 (0.0%) |
| Graduate Degree | 62 (100.0%) | 0 (0.0%) |
| Total | 128 (90.8%) | 13 (9.2%) |
Employment Characteristics in Oakbrook
Employment by Class of Employer in Oakbrook
Among the 5,851 employed individuals in Oakbrook, private company employees (4,034 | 69.0%), not-for-profit organizations (676 | 11.6%), and local government employees (357 | 6.1%) make up the most common classes of employment.
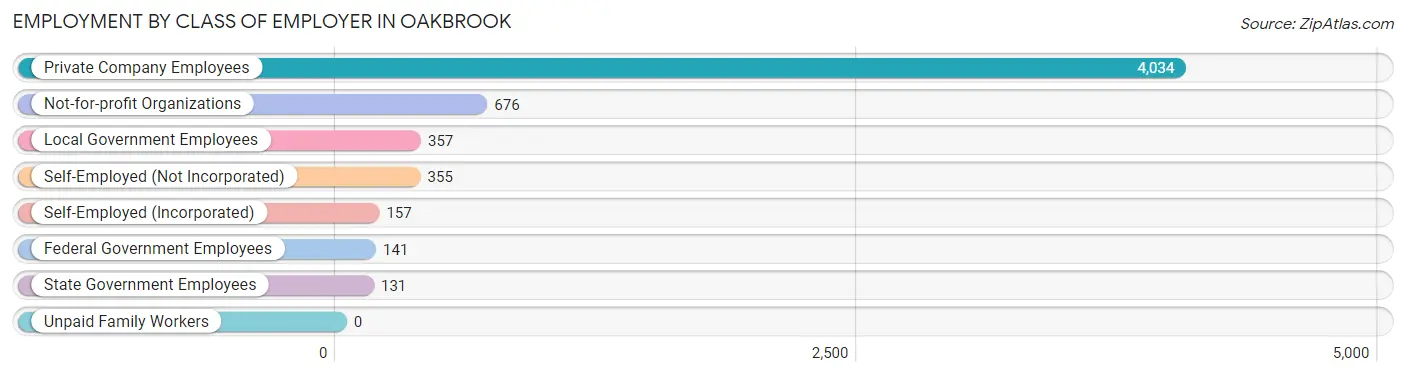
| Employer Class | # Employees | % Employees |
| Private Company Employees | 4,034 | 69.0% |
| Self-Employed (Incorporated) | 157 | 2.7% |
| Self-Employed (Not Incorporated) | 355 | 6.1% |
| Not-for-profit Organizations | 676 | 11.6% |
| Local Government Employees | 357 | 6.1% |
| State Government Employees | 131 | 2.2% |
| Federal Government Employees | 141 | 2.4% |
| Unpaid Family Workers | 0 | 0.0% |
| Total | 5,851 | 100.0% |
Employment Status by Age in Oakbrook
According to the labor force statistics for Oakbrook, out of the total population over 16 years of age (8,425), 72.2% or 6,083 individuals are in the labor force, with 2.6% or 158 of them unemployed. The age group with the highest labor force participation rate is 45 to 54 years, with 96.6% or 1,118 individuals in the labor force. Within the labor force, the 30 to 34 years age range has the highest percentage of unemployed individuals, with 13.0% or 65 of them being unemployed.
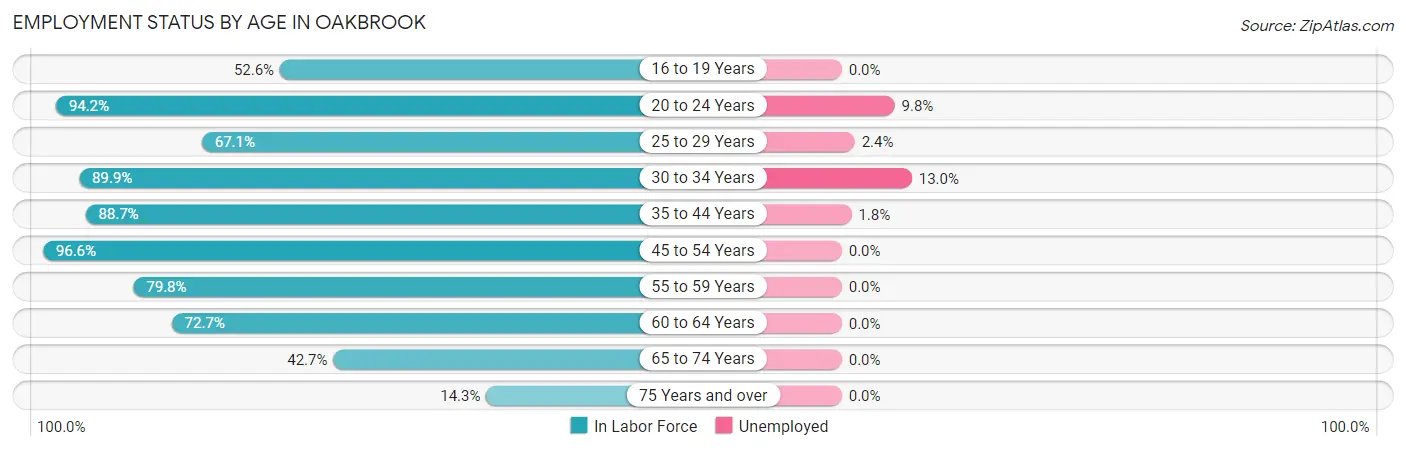
| Age Bracket | In Labor Force | Unemployed |
| 16 to 19 Years | 274 (52.6%) | 0 (0.0%) |
| 20 to 24 Years | 590 (94.2%) | 58 (9.8%) |
| 25 to 29 Years | 550 (67.1%) | 13 (2.4%) |
| 30 to 34 Years | 500 (89.9%) | 65 (13.0%) |
| 35 to 44 Years | 1,346 (88.7%) | 24 (1.8%) |
| 45 to 54 Years | 1,118 (96.6%) | 0 (0.0%) |
| 55 to 59 Years | 652 (79.8%) | 0 (0.0%) |
| 60 to 64 Years | 424 (72.7%) | 0 (0.0%) |
| 65 to 74 Years | 551 (42.7%) | 0 (0.0%) |
| 75 Years and over | 77 (14.3%) | 0 (0.0%) |
| Total | 6,083 (72.2%) | 158 (2.6%) |
Employment Status by Educational Attainment in Oakbrook
According to labor force statistics for Oakbrook, 84.2% of individuals (4,589) out of the total population between 25 and 64 years of age (5,450) are in the labor force, with 2.2% or 101 of them being unemployed. The group with the highest labor force participation rate are those with the educational attainment of less than high school, with 91.1% or 216 individuals in the labor force. Within the labor force, individuals with high school diploma education have the highest percentage of unemployment, with 2.8% or 24 of them being unemployed.
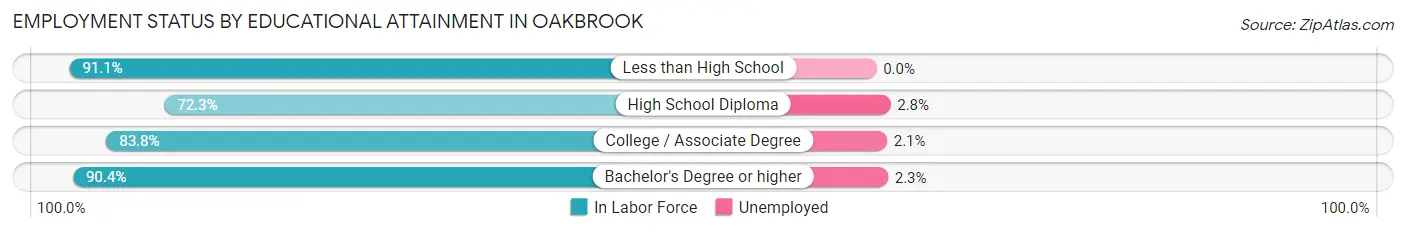
| Educational Attainment | In Labor Force | Unemployed |
| Less than High School | 216 (91.1%) | 0 (0.0%) |
| High School Diploma | 844 (72.3%) | 33 (2.8%) |
| College / Associate Degree | 1,599 (83.8%) | 40 (2.1%) |
| Bachelor's Degree or higher | 1,932 (90.4%) | 49 (2.3%) |
| Total | 4,589 (84.2%) | 120 (2.2%) |
Employment Occupations by Sex in Oakbrook
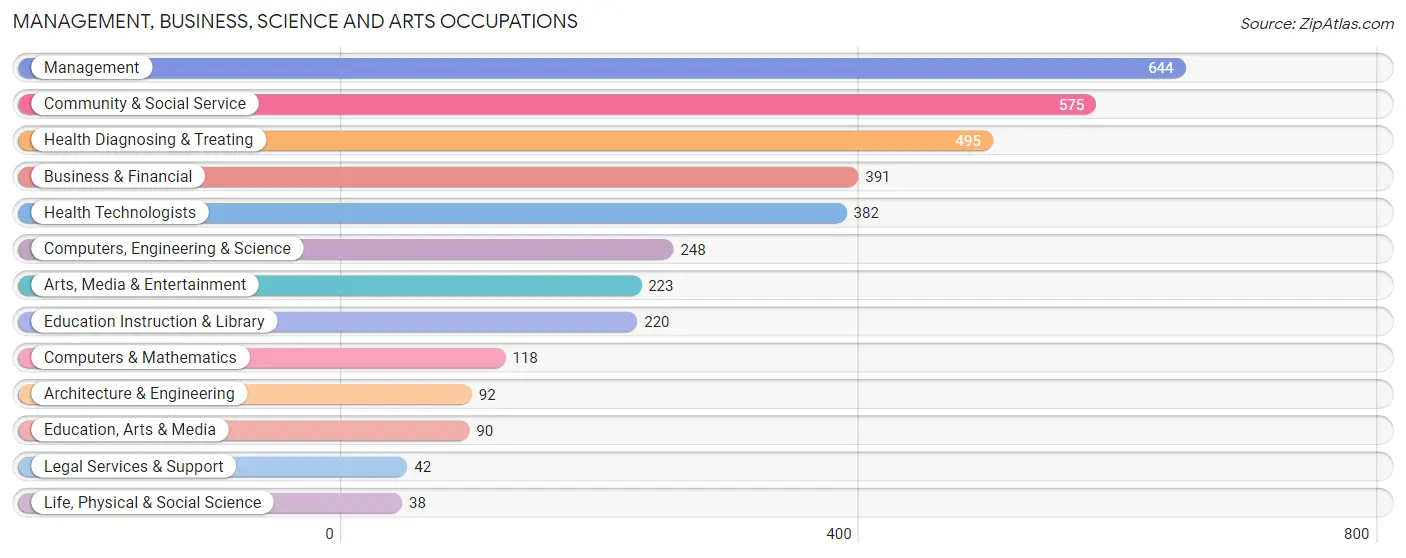
Management, Business, Science and Arts Occupations
The most common Management, Business, Science and Arts occupations in Oakbrook are Management (644 | 10.9%), Community & Social Service (575 | 9.7%), Health Diagnosing & Treating (495 | 8.4%), Business & Financial (391 | 6.6%), and Health Technologists (382 | 6.5%).
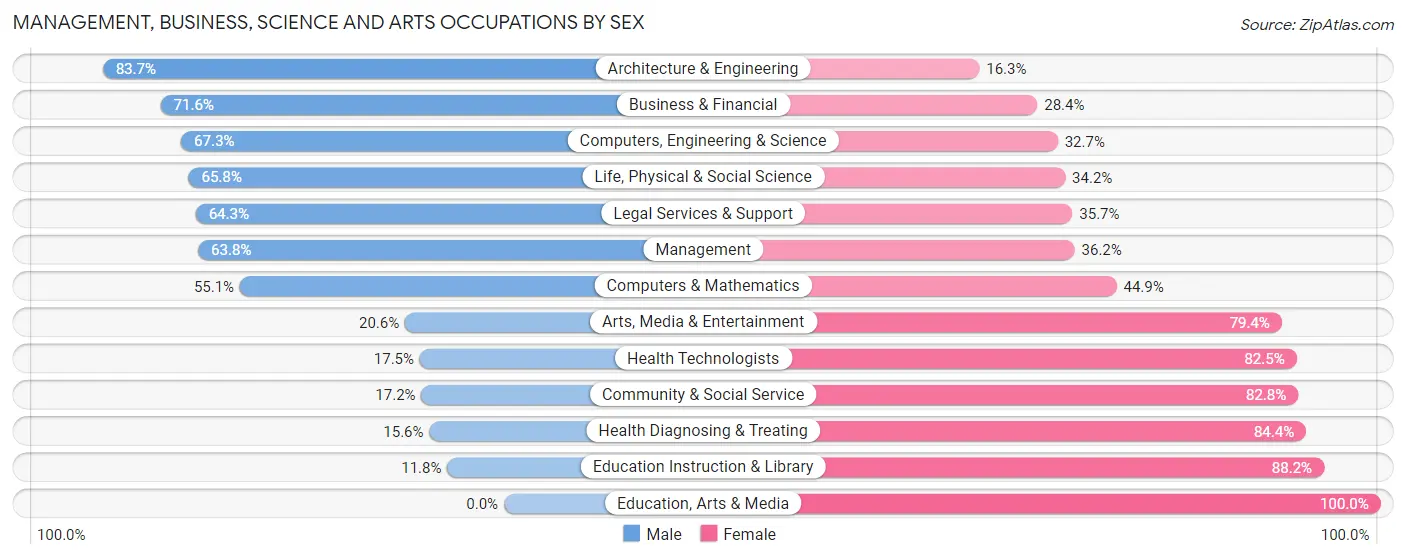
Management, Business, Science and Arts Occupations by Sex
Within the Management, Business, Science and Arts occupations in Oakbrook, the most male-oriented occupations are Architecture & Engineering (83.7%), Business & Financial (71.6%), and Computers, Engineering & Science (67.3%), while the most female-oriented occupations are Education, Arts & Media (100.0%), Education Instruction & Library (88.2%), and Health Diagnosing & Treating (84.4%).
| Occupation | Male | Female |
| Management | 411 (63.8%) | 233 (36.2%) |
| Business & Financial | 280 (71.6%) | 111 (28.4%) |
| Computers, Engineering & Science | 167 (67.3%) | 81 (32.7%) |
| Computers & Mathematics | 65 (55.1%) | 53 (44.9%) |
| Architecture & Engineering | 77 (83.7%) | 15 (16.3%) |
| Life, Physical & Social Science | 25 (65.8%) | 13 (34.2%) |
| Community & Social Service | 99 (17.2%) | 476 (82.8%) |
| Education, Arts & Media | 0 (0.0%) | 90 (100.0%) |
| Legal Services & Support | 27 (64.3%) | 15 (35.7%) |
| Education Instruction & Library | 26 (11.8%) | 194 (88.2%) |
| Arts, Media & Entertainment | 46 (20.6%) | 177 (79.4%) |
| Health Diagnosing & Treating | 77 (15.6%) | 418 (84.4%) |
| Health Technologists | 67 (17.5%) | 315 (82.5%) |
| Total (Category) | 1,034 (43.9%) | 1,319 (56.1%) |
| Total (Overall) | 3,043 (51.5%) | 2,863 (48.5%) |
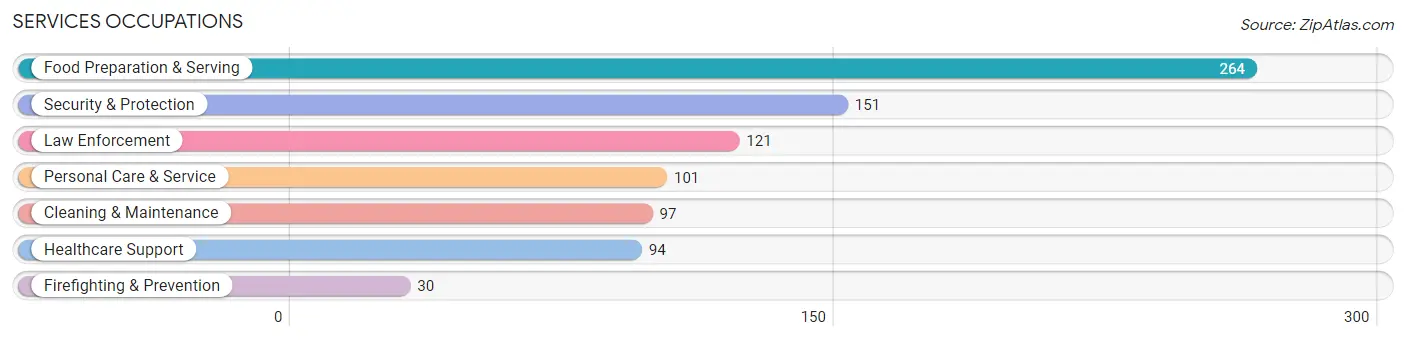
Services Occupations
The most common Services occupations in Oakbrook are Food Preparation & Serving (264 | 4.5%), Security & Protection (151 | 2.6%), Law Enforcement (121 | 2.1%), Personal Care & Service (101 | 1.7%), and Cleaning & Maintenance (97 | 1.6%).
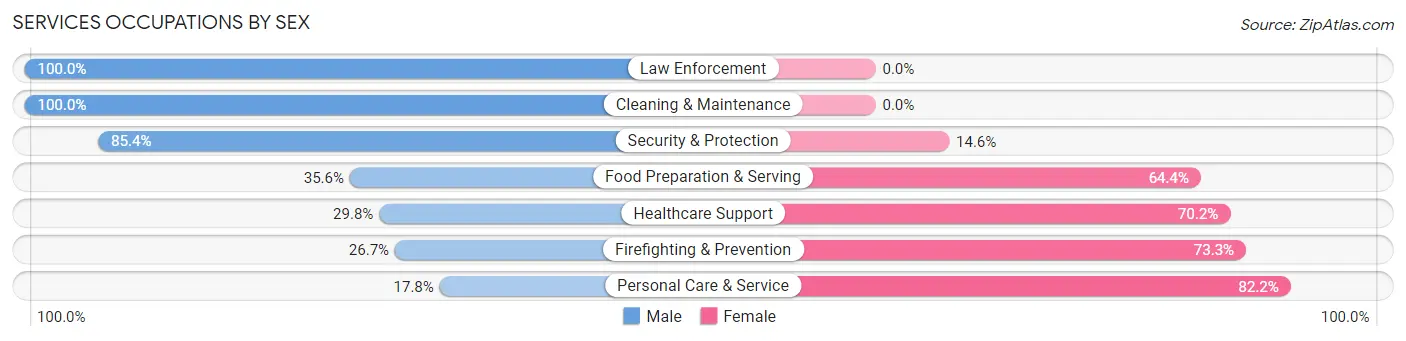
Services Occupations by Sex
Within the Services occupations in Oakbrook, the most male-oriented occupations are Law Enforcement (100.0%), Cleaning & Maintenance (100.0%), and Security & Protection (85.4%), while the most female-oriented occupations are Personal Care & Service (82.2%), Firefighting & Prevention (73.3%), and Healthcare Support (70.2%).
| Occupation | Male | Female |
| Healthcare Support | 28 (29.8%) | 66 (70.2%) |
| Security & Protection | 129 (85.4%) | 22 (14.6%) |
| Firefighting & Prevention | 8 (26.7%) | 22 (73.3%) |
| Law Enforcement | 121 (100.0%) | 0 (0.0%) |
| Food Preparation & Serving | 94 (35.6%) | 170 (64.4%) |
| Cleaning & Maintenance | 97 (100.0%) | 0 (0.0%) |
| Personal Care & Service | 18 (17.8%) | 83 (82.2%) |
| Total (Category) | 366 (51.8%) | 341 (48.2%) |
| Total (Overall) | 3,043 (51.5%) | 2,863 (48.5%) |
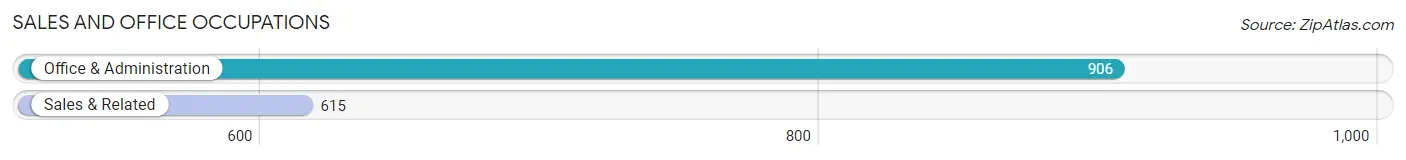
Sales and Office Occupations
The most common Sales and Office occupations in Oakbrook are Office & Administration (906 | 15.3%), and Sales & Related (615 | 10.4%).
Sales and Office Occupations by Sex
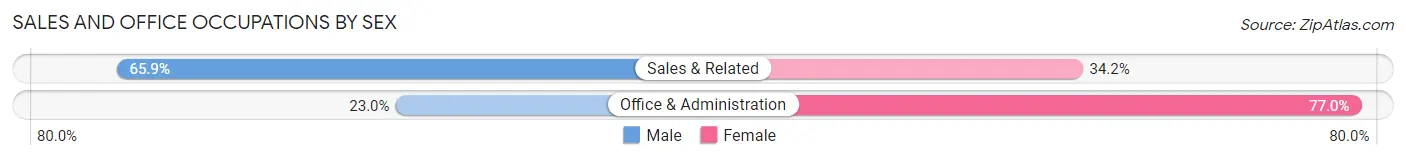
| Occupation | Male | Female |
| Sales & Related | 405 (65.8%) | 210 (34.2%) |
| Office & Administration | 208 (23.0%) | 698 (77.0%) |
| Total (Category) | 613 (40.3%) | 908 (59.7%) |
| Total (Overall) | 3,043 (51.5%) | 2,863 (48.5%) |
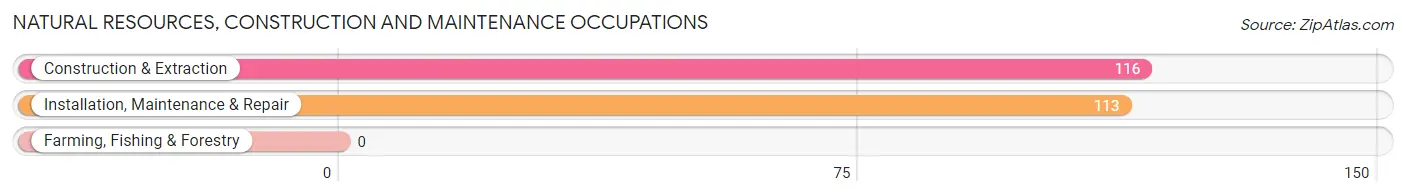
Natural Resources, Construction and Maintenance Occupations
The most common Natural Resources, Construction and Maintenance occupations in Oakbrook are Construction & Extraction (116 | 2.0%), and Installation, Maintenance & Repair (113 | 1.9%).
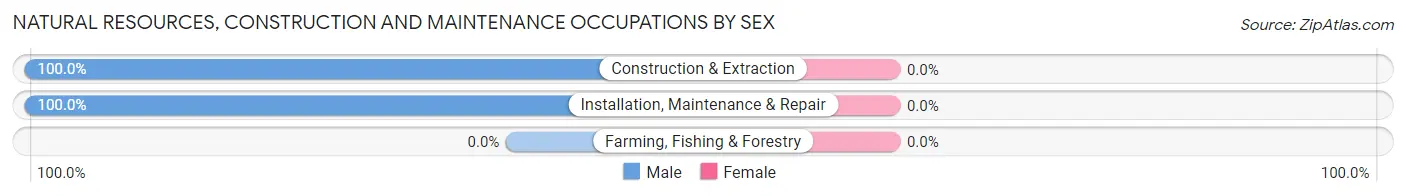
Natural Resources, Construction and Maintenance Occupations by Sex
| Occupation | Male | Female |
| Farming, Fishing & Forestry | 0 (0.0%) | 0 (0.0%) |
| Construction & Extraction | 116 (100.0%) | 0 (0.0%) |
| Installation, Maintenance & Repair | 113 (100.0%) | 0 (0.0%) |
| Total (Category) | 229 (100.0%) | 0 (0.0%) |
| Total (Overall) | 3,043 (51.5%) | 2,863 (48.5%) |
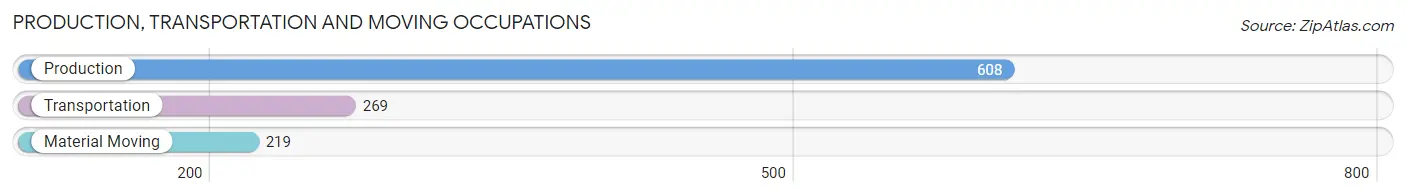
Production, Transportation and Moving Occupations
The most common Production, Transportation and Moving occupations in Oakbrook are Production (608 | 10.3%), Transportation (269 | 4.5%), and Material Moving (219 | 3.7%).
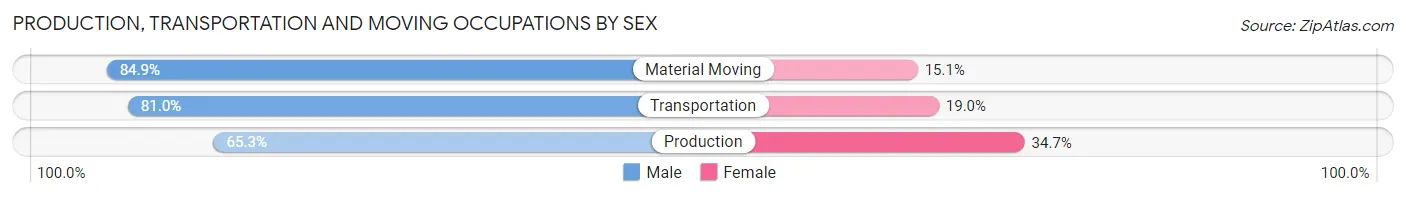
Production, Transportation and Moving Occupations by Sex
| Occupation | Male | Female |
| Production | 397 (65.3%) | 211 (34.7%) |
| Transportation | 218 (81.0%) | 51 (19.0%) |
| Material Moving | 186 (84.9%) | 33 (15.1%) |
| Total (Category) | 801 (73.1%) | 295 (26.9%) |
| Total (Overall) | 3,043 (51.5%) | 2,863 (48.5%) |
Employment Industries by Sex in Oakbrook
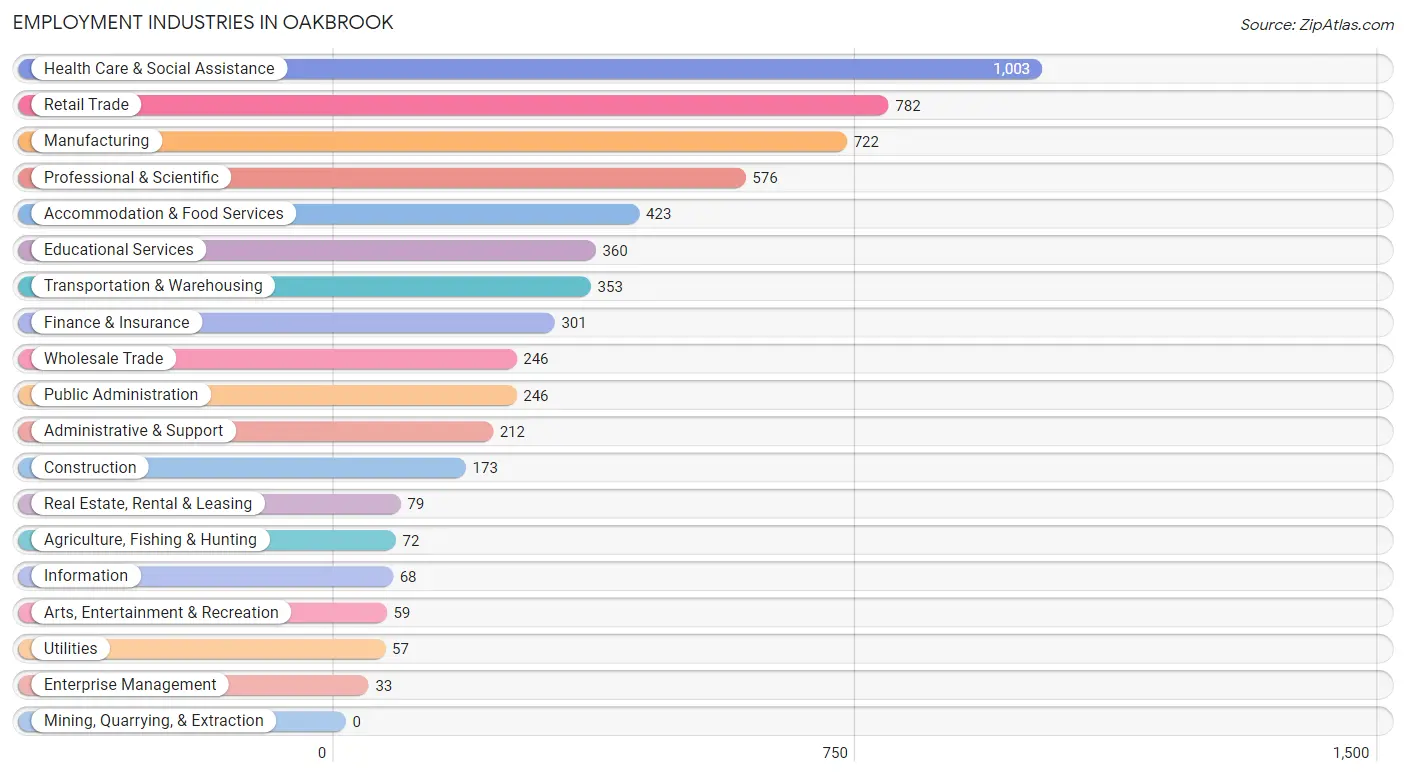
Employment Industries in Oakbrook
The major employment industries in Oakbrook include Health Care & Social Assistance (1,003 | 17.0%), Retail Trade (782 | 13.2%), Manufacturing (722 | 12.2%), Professional & Scientific (576 | 9.8%), and Accommodation & Food Services (423 | 7.2%).
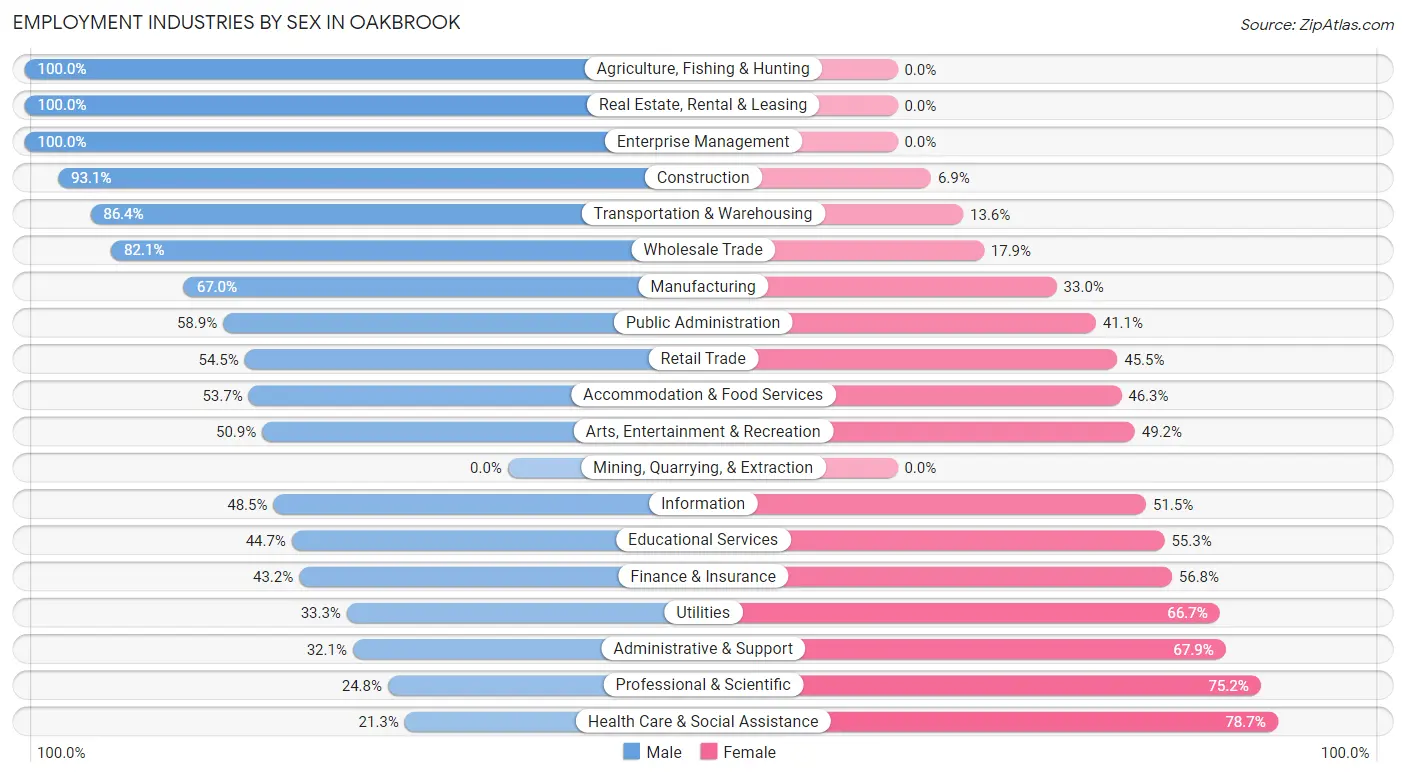
Employment Industries by Sex in Oakbrook
The Oakbrook industries that see more men than women are Agriculture, Fishing & Hunting (100.0%), Real Estate, Rental & Leasing (100.0%), and Enterprise Management (100.0%), whereas the industries that tend to have a higher number of women are Health Care & Social Assistance (78.7%), Professional & Scientific (75.2%), and Administrative & Support (67.9%).
| Industry | Male | Female |
| Agriculture, Fishing & Hunting | 72 (100.0%) | 0 (0.0%) |
| Mining, Quarrying, & Extraction | 0 (0.0%) | 0 (0.0%) |
| Construction | 161 (93.1%) | 12 (6.9%) |
| Manufacturing | 484 (67.0%) | 238 (33.0%) |
| Wholesale Trade | 202 (82.1%) | 44 (17.9%) |
| Retail Trade | 426 (54.5%) | 356 (45.5%) |
| Transportation & Warehousing | 305 (86.4%) | 48 (13.6%) |
| Utilities | 19 (33.3%) | 38 (66.7%) |
| Information | 33 (48.5%) | 35 (51.5%) |
| Finance & Insurance | 130 (43.2%) | 171 (56.8%) |
| Real Estate, Rental & Leasing | 79 (100.0%) | 0 (0.0%) |
| Professional & Scientific | 143 (24.8%) | 433 (75.2%) |
| Enterprise Management | 33 (100.0%) | 0 (0.0%) |
| Administrative & Support | 68 (32.1%) | 144 (67.9%) |
| Educational Services | 161 (44.7%) | 199 (55.3%) |
| Health Care & Social Assistance | 214 (21.3%) | 789 (78.7%) |
| Arts, Entertainment & Recreation | 30 (50.8%) | 29 (49.1%) |
| Accommodation & Food Services | 227 (53.7%) | 196 (46.3%) |
| Public Administration | 145 (58.9%) | 101 (41.1%) |
| Total | 3,043 (51.5%) | 2,863 (48.5%) |
Education in Oakbrook
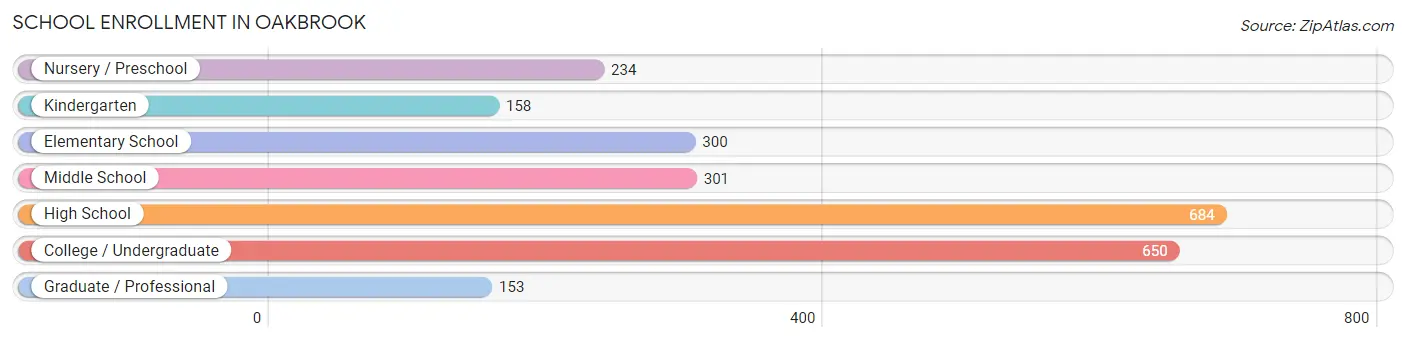
School Enrollment in Oakbrook
The most common levels of schooling among the 2,480 students in Oakbrook are high school (684 | 27.6%), college / undergraduate (650 | 26.2%), and middle school (301 | 12.1%).
| School Level | # Students | % Students |
| Nursery / Preschool | 234 | 9.4% |
| Kindergarten | 158 | 6.4% |
| Elementary School | 300 | 12.1% |
| Middle School | 301 | 12.1% |
| High School | 684 | 27.6% |
| College / Undergraduate | 650 | 26.2% |
| Graduate / Professional | 153 | 6.2% |
| Total | 2,480 | 100.0% |
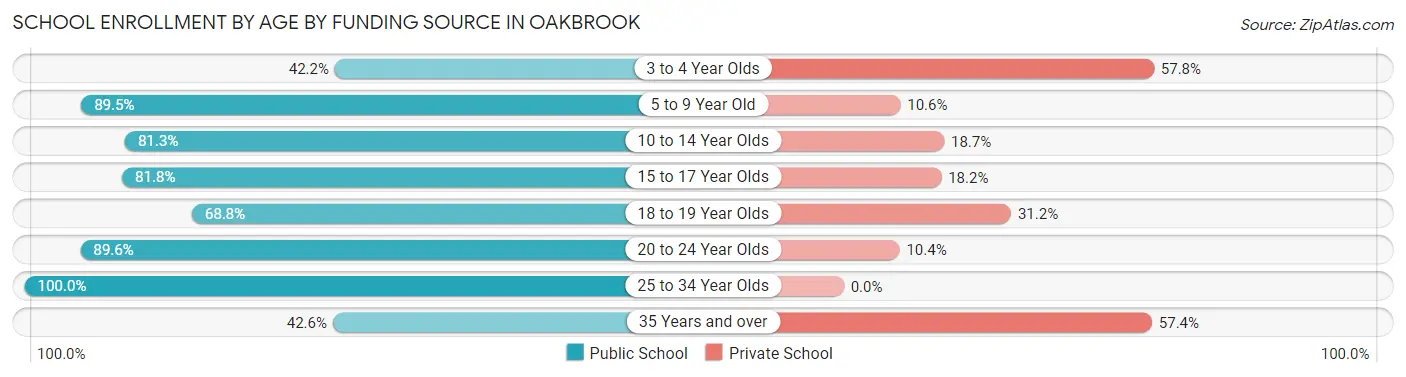
School Enrollment by Age by Funding Source in Oakbrook
Out of a total of 2,480 students who are enrolled in schools in Oakbrook, 481 (19.4%) attend a private institution, while the remaining 1,999 (80.6%) are enrolled in public schools. The age group of 3 to 4 year olds has the highest likelihood of being enrolled in private schools, with 78 (57.8% in the age bracket) enrolled. Conversely, the age group of 25 to 34 year olds has the lowest likelihood of being enrolled in a private school, with 353 (100.0% in the age bracket) attending a public institution.
| Age Bracket | Public School | Private School |
| 3 to 4 Year Olds | 57 (42.2%) | 78 (57.8%) |
| 5 to 9 Year Old | 458 (89.4%) | 54 (10.5%) |
| 10 to 14 Year Olds | 313 (81.3%) | 72 (18.7%) |
| 15 to 17 Year Olds | 446 (81.8%) | 99 (18.2%) |
| 18 to 19 Year Olds | 148 (68.8%) | 67 (31.2%) |
| 20 to 24 Year Olds | 155 (89.6%) | 18 (10.4%) |
| 25 to 34 Year Olds | 353 (100.0%) | 0 (0.0%) |
| 35 Years and over | 69 (42.6%) | 93 (57.4%) |
| Total | 1,999 (80.6%) | 481 (19.4%) |
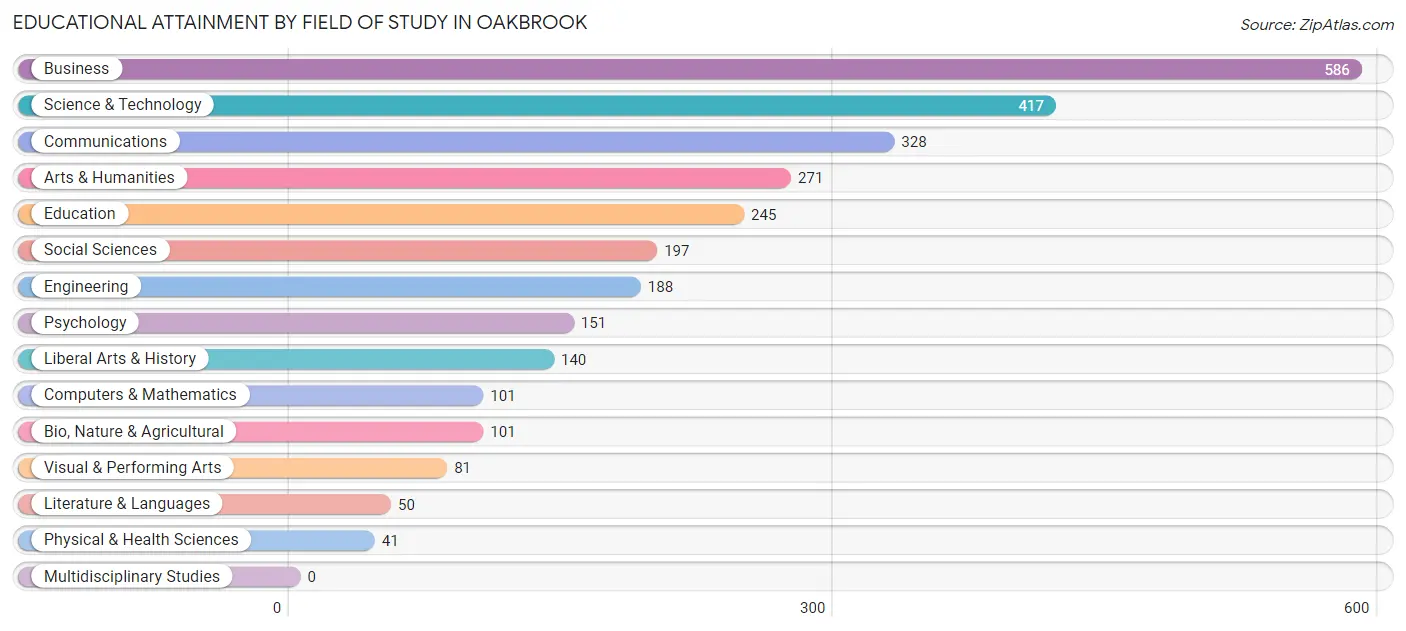
Educational Attainment by Field of Study in Oakbrook
Business (586 | 20.2%), science & technology (417 | 14.4%), communications (328 | 11.3%), arts & humanities (271 | 9.3%), and education (245 | 8.5%) are the most common fields of study among 2,897 individuals in Oakbrook who have obtained a bachelor's degree or higher.
| Field of Study | # Graduates | % Graduates |
| Computers & Mathematics | 101 | 3.5% |
| Bio, Nature & Agricultural | 101 | 3.5% |
| Physical & Health Sciences | 41 | 1.4% |
| Psychology | 151 | 5.2% |
| Social Sciences | 197 | 6.8% |
| Engineering | 188 | 6.5% |
| Multidisciplinary Studies | 0 | 0.0% |
| Science & Technology | 417 | 14.4% |
| Business | 586 | 20.2% |
| Education | 245 | 8.5% |
| Literature & Languages | 50 | 1.7% |
| Liberal Arts & History | 140 | 4.8% |
| Visual & Performing Arts | 81 | 2.8% |
| Communications | 328 | 11.3% |
| Arts & Humanities | 271 | 9.3% |
| Total | 2,897 | 100.0% |
Transportation & Commute in Oakbrook
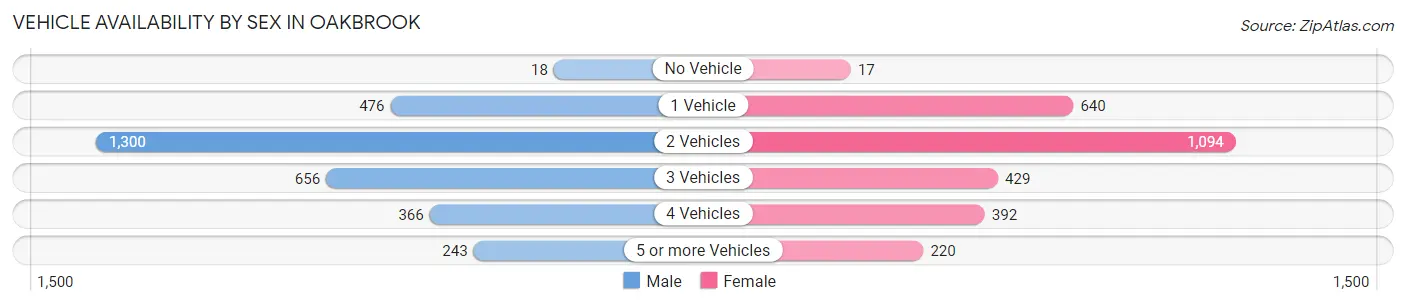
Vehicle Availability by Sex in Oakbrook
The most prevalent vehicle ownership categories in Oakbrook are males with 2 vehicles (1,300, accounting for 42.5%) and females with 2 vehicles (1,094, making up 46.6%).
| Vehicles Available | Male | Female |
| No Vehicle | 18 (0.6%) | 17 (0.6%) |
| 1 Vehicle | 476 (15.6%) | 640 (22.9%) |
| 2 Vehicles | 1,300 (42.5%) | 1,094 (39.2%) |
| 3 Vehicles | 656 (21.4%) | 429 (15.4%) |
| 4 Vehicles | 366 (12.0%) | 392 (14.0%) |
| 5 or more Vehicles | 243 (7.9%) | 220 (7.9%) |
| Total | 3,059 (100.0%) | 2,792 (100.0%) |
Commute Time in Oakbrook
The most frequently occuring commute durations in Oakbrook are 10 to 14 minutes (1,201 commuters, 23.0%), 15 to 19 minutes (1,079 commuters, 20.6%), and 30 to 34 minutes (834 commuters, 16.0%).
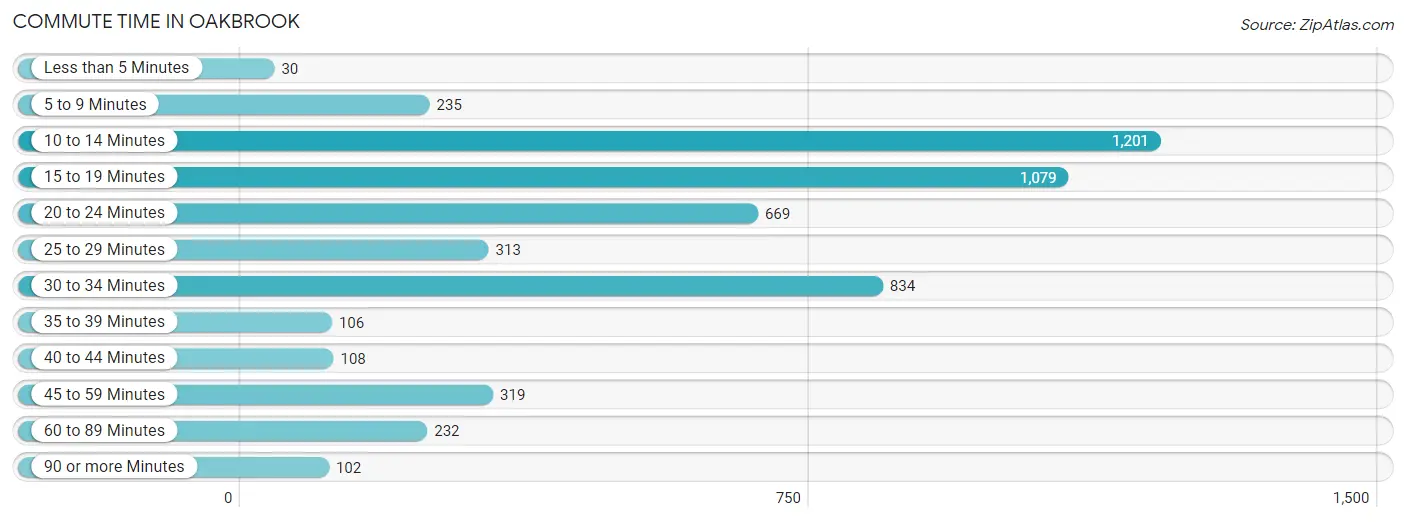
| Commute Time | # Commuters | % Commuters |
| Less than 5 Minutes | 30 | 0.6% |
| 5 to 9 Minutes | 235 | 4.5% |
| 10 to 14 Minutes | 1,201 | 23.0% |
| 15 to 19 Minutes | 1,079 | 20.6% |
| 20 to 24 Minutes | 669 | 12.8% |
| 25 to 29 Minutes | 313 | 6.0% |
| 30 to 34 Minutes | 834 | 16.0% |
| 35 to 39 Minutes | 106 | 2.0% |
| 40 to 44 Minutes | 108 | 2.1% |
| 45 to 59 Minutes | 319 | 6.1% |
| 60 to 89 Minutes | 232 | 4.4% |
| 90 or more Minutes | 102 | 1.9% |
Commute Time by Sex in Oakbrook
The most common commute times in Oakbrook are 15 to 19 minutes (643 commuters, 22.4%) for males and 10 to 14 minutes (574 commuters, 24.3%) for females.
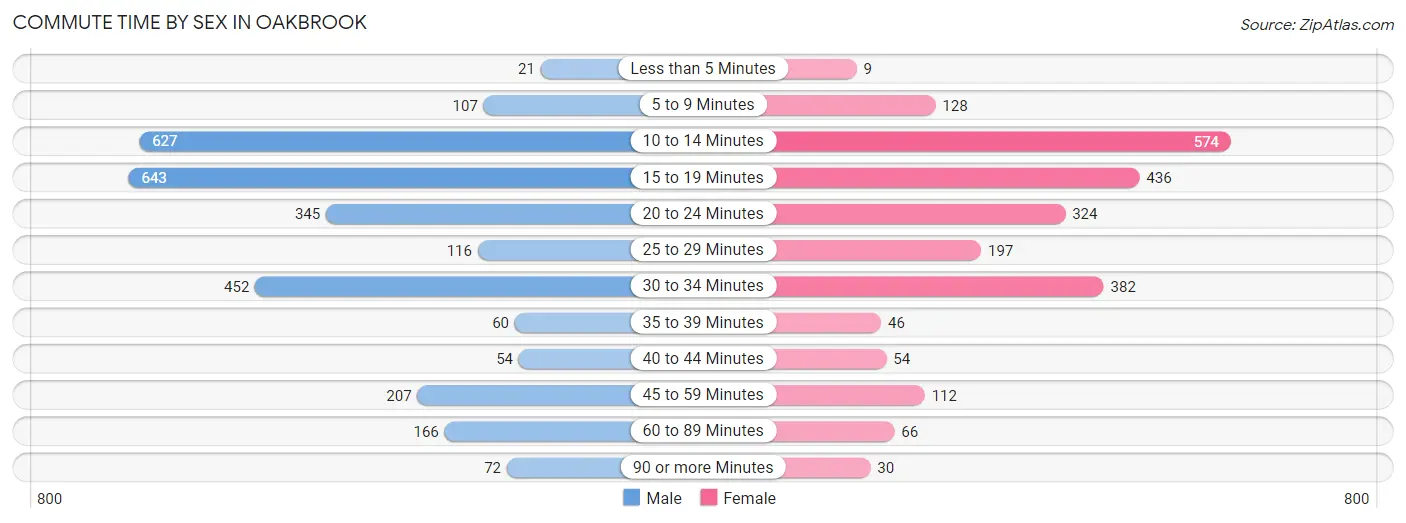
| Commute Time | Male | Female |
| Less than 5 Minutes | 21 (0.7%) | 9 (0.4%) |
| 5 to 9 Minutes | 107 (3.7%) | 128 (5.4%) |
| 10 to 14 Minutes | 627 (21.8%) | 574 (24.3%) |
| 15 to 19 Minutes | 643 (22.4%) | 436 (18.5%) |
| 20 to 24 Minutes | 345 (12.0%) | 324 (13.7%) |
| 25 to 29 Minutes | 116 (4.0%) | 197 (8.4%) |
| 30 to 34 Minutes | 452 (15.8%) | 382 (16.2%) |
| 35 to 39 Minutes | 60 (2.1%) | 46 (1.9%) |
| 40 to 44 Minutes | 54 (1.9%) | 54 (2.3%) |
| 45 to 59 Minutes | 207 (7.2%) | 112 (4.8%) |
| 60 to 89 Minutes | 166 (5.8%) | 66 (2.8%) |
| 90 or more Minutes | 72 (2.5%) | 30 (1.3%) |
Time of Departure to Work by Sex in Oakbrook
The most frequent times of departure to work in Oakbrook are 7:30 AM to 7:59 AM (465, 16.2%) for males and 7:00 AM to 7:29 AM (458, 19.4%) for females.
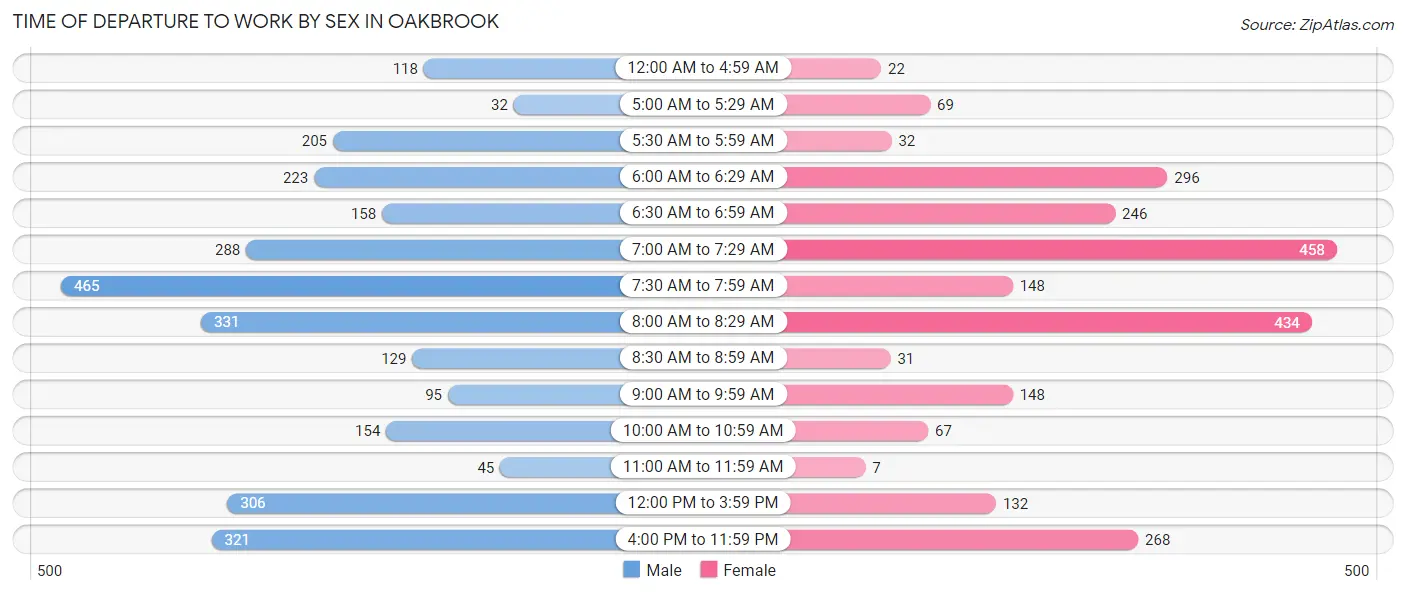
| Time of Departure | Male | Female |
| 12:00 AM to 4:59 AM | 118 (4.1%) | 22 (0.9%) |
| 5:00 AM to 5:29 AM | 32 (1.1%) | 69 (2.9%) |
| 5:30 AM to 5:59 AM | 205 (7.1%) | 32 (1.4%) |
| 6:00 AM to 6:29 AM | 223 (7.8%) | 296 (12.6%) |
| 6:30 AM to 6:59 AM | 158 (5.5%) | 246 (10.4%) |
| 7:00 AM to 7:29 AM | 288 (10.0%) | 458 (19.4%) |
| 7:30 AM to 7:59 AM | 465 (16.2%) | 148 (6.3%) |
| 8:00 AM to 8:29 AM | 331 (11.5%) | 434 (18.4%) |
| 8:30 AM to 8:59 AM | 129 (4.5%) | 31 (1.3%) |
| 9:00 AM to 9:59 AM | 95 (3.3%) | 148 (6.3%) |
| 10:00 AM to 10:59 AM | 154 (5.4%) | 67 (2.8%) |
| 11:00 AM to 11:59 AM | 45 (1.6%) | 7 (0.3%) |
| 12:00 PM to 3:59 PM | 306 (10.7%) | 132 (5.6%) |
| 4:00 PM to 11:59 PM | 321 (11.2%) | 268 (11.4%) |
| Total | 2,870 (100.0%) | 2,358 (100.0%) |
Housing Occupancy in Oakbrook
Occupancy by Ownership in Oakbrook
Of the total 4,172 dwellings in Oakbrook, owner-occupied units account for 3,413 (81.8%), while renter-occupied units make up 759 (18.2%).
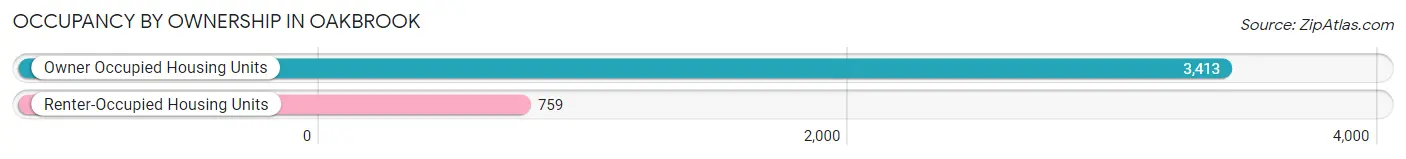
| Occupancy | # Housing Units | % Housing Units |
| Owner Occupied Housing Units | 3,413 | 81.8% |
| Renter-Occupied Housing Units | 759 | 18.2% |
| Total Occupied Housing Units | 4,172 | 100.0% |
Occupancy by Household Size in Oakbrook
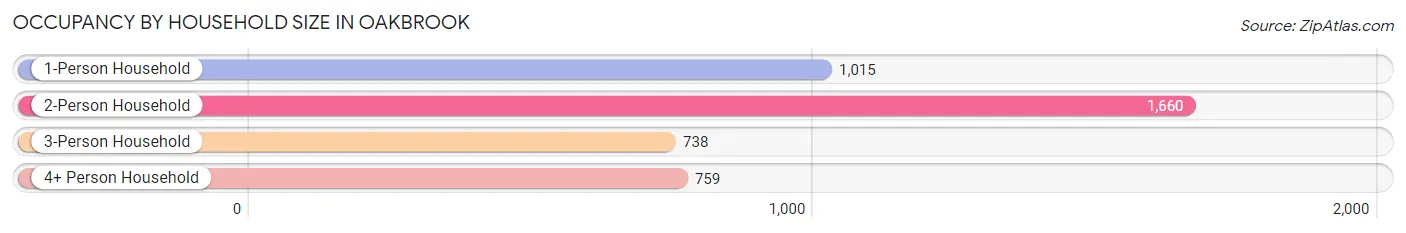
| Household Size | # Housing Units | % Housing Units |
| 1-Person Household | 1,015 | 24.3% |
| 2-Person Household | 1,660 | 39.8% |
| 3-Person Household | 738 | 17.7% |
| 4+ Person Household | 759 | 18.2% |
| Total Housing Units | 4,172 | 100.0% |
Occupancy by Ownership by Household Size in Oakbrook
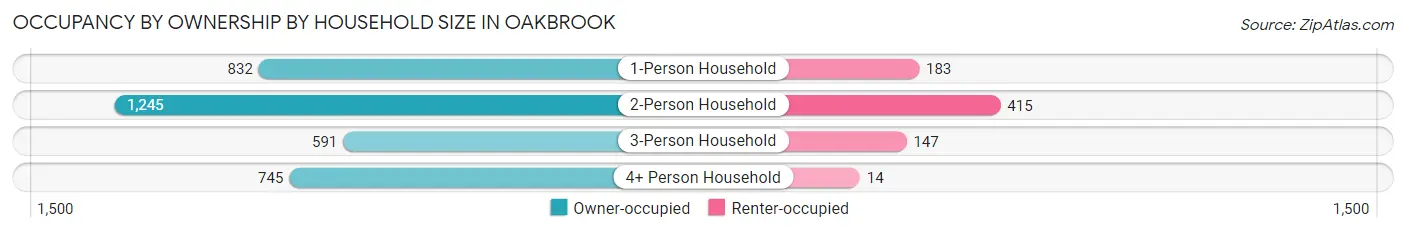
| Household Size | Owner-occupied | Renter-occupied |
| 1-Person Household | 832 (82.0%) | 183 (18.0%) |
| 2-Person Household | 1,245 (75.0%) | 415 (25.0%) |
| 3-Person Household | 591 (80.1%) | 147 (19.9%) |
| 4+ Person Household | 745 (98.2%) | 14 (1.8%) |
| Total Housing Units | 3,413 (81.8%) | 759 (18.2%) |
Occupancy by Educational Attainment in Oakbrook
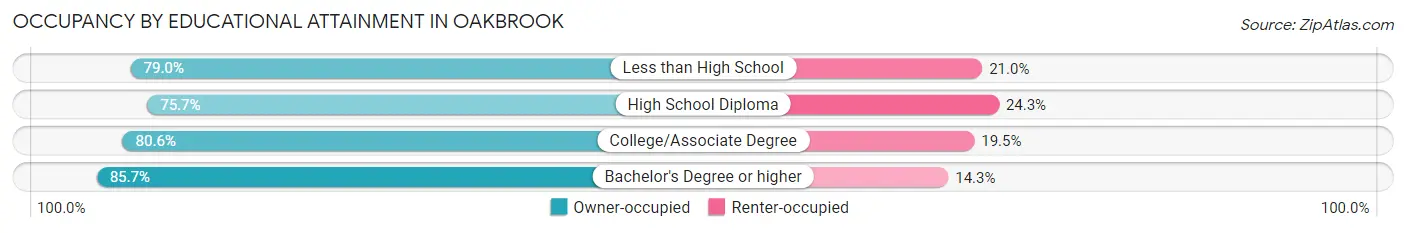
| Household Size | Owner-occupied | Renter-occupied |
| Less than High School | 169 (79.0%) | 45 (21.0%) |
| High School Diploma | 485 (75.7%) | 156 (24.3%) |
| College/Associate Degree | 1,309 (80.5%) | 316 (19.5%) |
| Bachelor's Degree or higher | 1,450 (85.7%) | 242 (14.3%) |
Occupancy by Age of Householder in Oakbrook
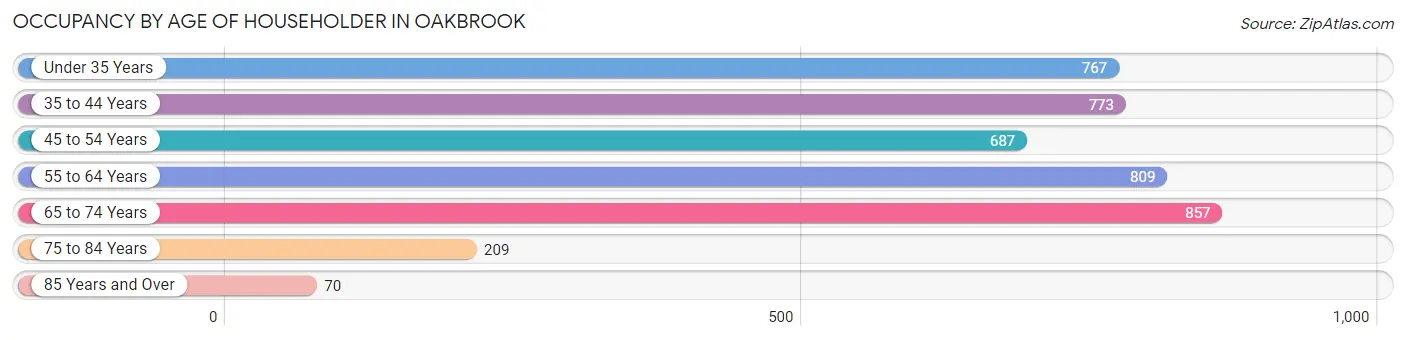
| Age Bracket | # Households | % Households |
| Under 35 Years | 767 | 18.4% |
| 35 to 44 Years | 773 | 18.5% |
| 45 to 54 Years | 687 | 16.5% |
| 55 to 64 Years | 809 | 19.4% |
| 65 to 74 Years | 857 | 20.5% |
| 75 to 84 Years | 209 | 5.0% |
| 85 Years and Over | 70 | 1.7% |
| Total | 4,172 | 100.0% |
Housing Finances in Oakbrook
Median Income by Occupancy in Oakbrook
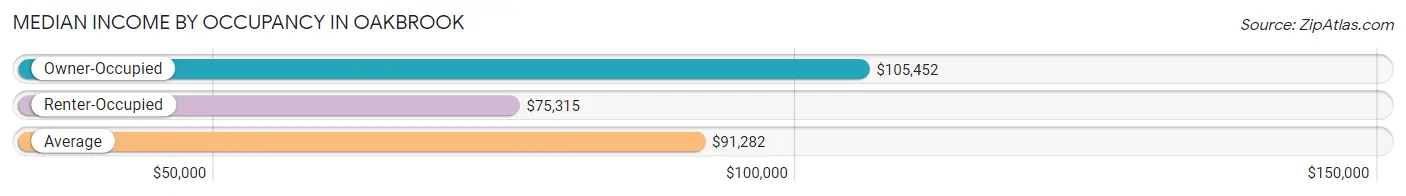
| Occupancy Type | # Households | Median Income |
| Owner-Occupied | 3,413 (81.8%) | $105,452 |
| Renter-Occupied | 759 (18.2%) | $75,315 |
| Average | 4,172 (100.0%) | $91,282 |
Occupancy by Householder Income Bracket in Oakbrook
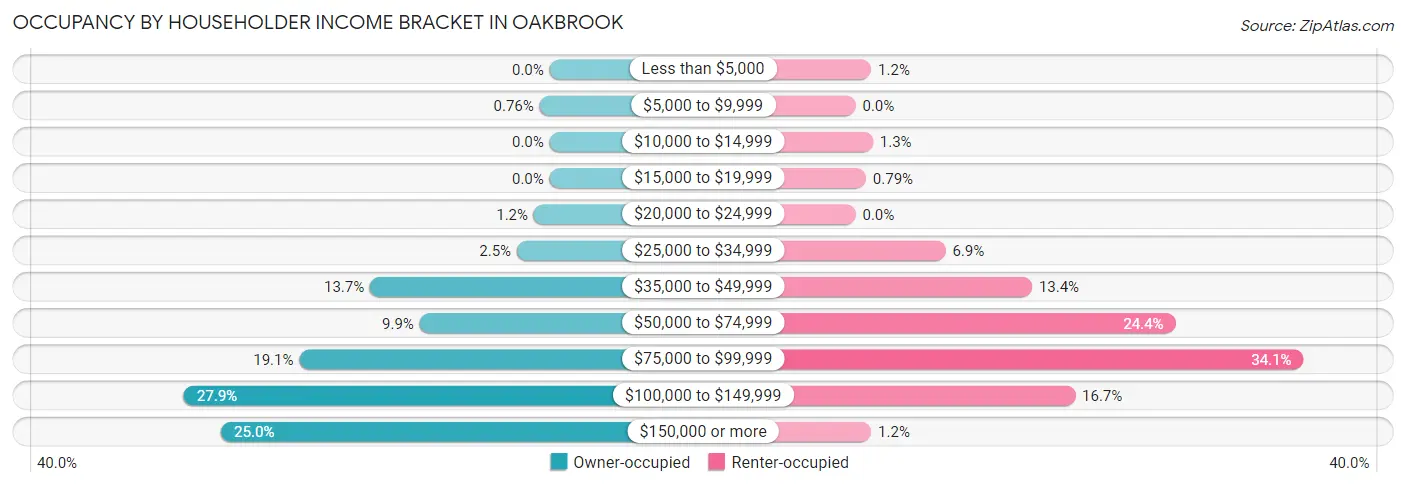
| Income Bracket | Owner-occupied | Renter-occupied |
| Less than $5,000 | 0 (0.0%) | 9 (1.2%) |
| $5,000 to $9,999 | 26 (0.8%) | 0 (0.0%) |
| $10,000 to $14,999 | 0 (0.0%) | 10 (1.3%) |
| $15,000 to $19,999 | 0 (0.0%) | 6 (0.8%) |
| $20,000 to $24,999 | 41 (1.2%) | 0 (0.0%) |
| $25,000 to $34,999 | 85 (2.5%) | 52 (6.9%) |
| $35,000 to $49,999 | 467 (13.7%) | 102 (13.4%) |
| $50,000 to $74,999 | 338 (9.9%) | 185 (24.4%) |
| $75,000 to $99,999 | 651 (19.1%) | 259 (34.1%) |
| $100,000 to $149,999 | 951 (27.9%) | 127 (16.7%) |
| $150,000 or more | 854 (25.0%) | 9 (1.2%) |
| Total | 3,413 (100.0%) | 759 (100.0%) |
Monthly Housing Cost Tiers in Oakbrook
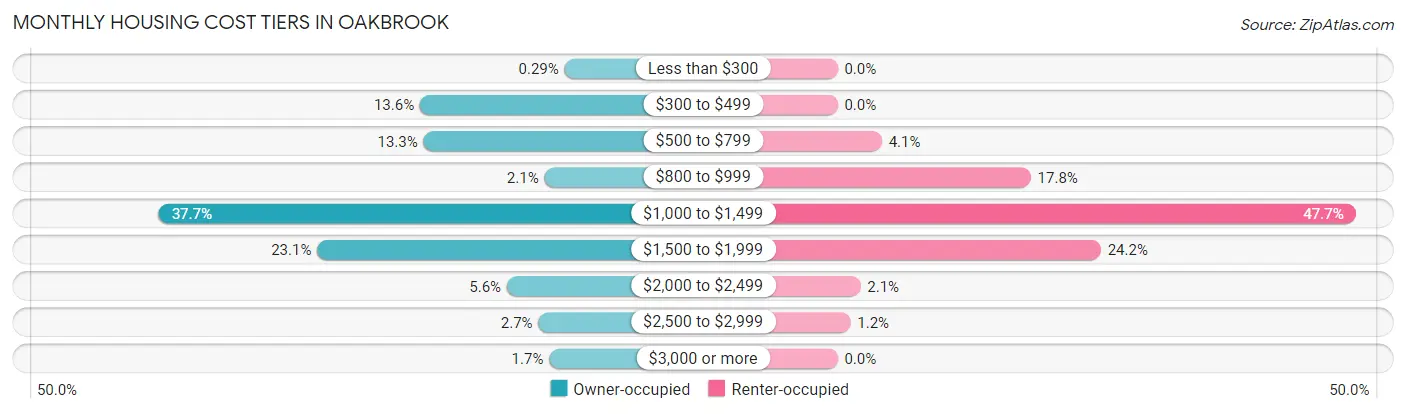
| Monthly Cost | Owner-occupied | Renter-occupied |
| Less than $300 | 10 (0.3%) | 0 (0.0%) |
| $300 to $499 | 464 (13.6%) | 0 (0.0%) |
| $500 to $799 | 453 (13.3%) | 31 (4.1%) |
| $800 to $999 | 73 (2.1%) | 135 (17.8%) |
| $1,000 to $1,499 | 1,285 (37.7%) | 362 (47.7%) |
| $1,500 to $1,999 | 787 (23.1%) | 184 (24.2%) |
| $2,000 to $2,499 | 191 (5.6%) | 16 (2.1%) |
| $2,500 to $2,999 | 92 (2.7%) | 9 (1.2%) |
| $3,000 or more | 58 (1.7%) | 0 (0.0%) |
| Total | 3,413 (100.0%) | 759 (100.0%) |
Physical Housing Characteristics in Oakbrook
Housing Structures in Oakbrook
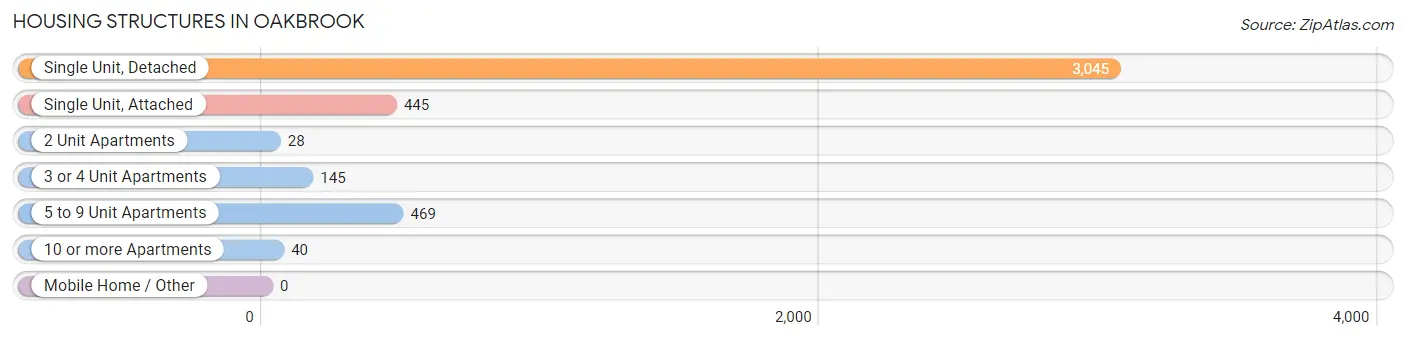
| Structure Type | # Housing Units | % Housing Units |
| Single Unit, Detached | 3,045 | 73.0% |
| Single Unit, Attached | 445 | 10.7% |
| 2 Unit Apartments | 28 | 0.7% |
| 3 or 4 Unit Apartments | 145 | 3.5% |
| 5 to 9 Unit Apartments | 469 | 11.2% |
| 10 or more Apartments | 40 | 1.0% |
| Mobile Home / Other | 0 | 0.0% |
| Total | 4,172 | 100.0% |
Housing Structures by Occupancy in Oakbrook
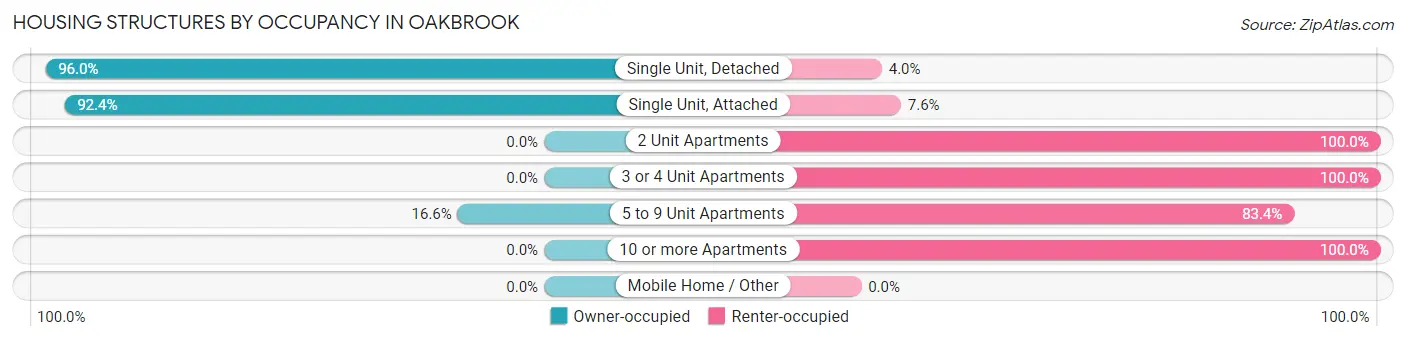
| Structure Type | Owner-occupied | Renter-occupied |
| Single Unit, Detached | 2,924 (96.0%) | 121 (4.0%) |
| Single Unit, Attached | 411 (92.4%) | 34 (7.6%) |
| 2 Unit Apartments | 0 (0.0%) | 28 (100.0%) |
| 3 or 4 Unit Apartments | 0 (0.0%) | 145 (100.0%) |
| 5 to 9 Unit Apartments | 78 (16.6%) | 391 (83.4%) |
| 10 or more Apartments | 0 (0.0%) | 40 (100.0%) |
| Mobile Home / Other | 0 (0.0%) | 0 (0.0%) |
| Total | 3,413 (81.8%) | 759 (18.2%) |
Housing Structures by Number of Rooms in Oakbrook
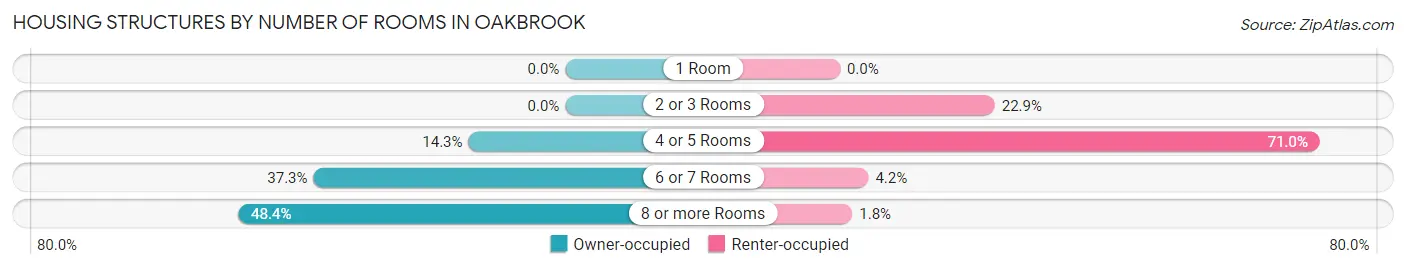
| Number of Rooms | Owner-occupied | Renter-occupied |
| 1 Room | 0 (0.0%) | 0 (0.0%) |
| 2 or 3 Rooms | 0 (0.0%) | 174 (22.9%) |
| 4 or 5 Rooms | 489 (14.3%) | 539 (71.0%) |
| 6 or 7 Rooms | 1,272 (37.3%) | 32 (4.2%) |
| 8 or more Rooms | 1,652 (48.4%) | 14 (1.8%) |
| Total | 3,413 (100.0%) | 759 (100.0%) |
Housing Structure by Heating Type in Oakbrook
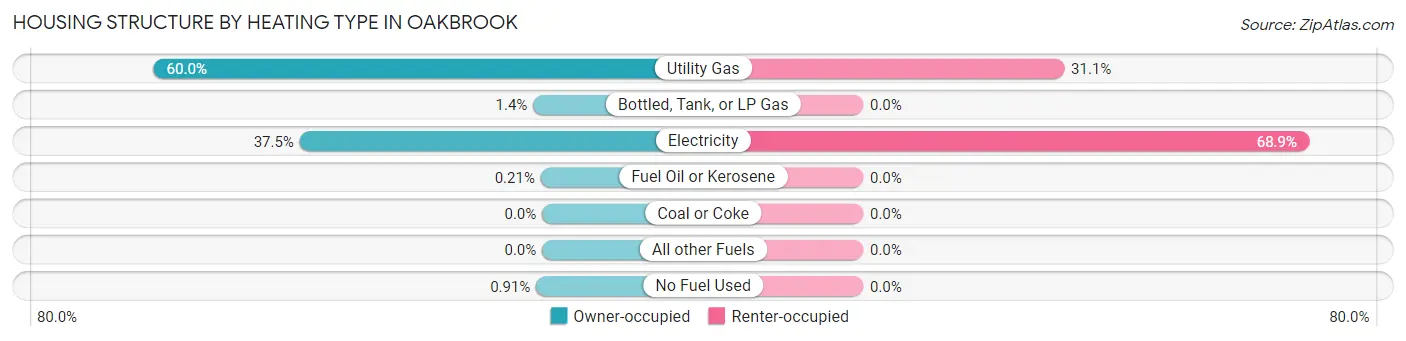
| Heating Type | Owner-occupied | Renter-occupied |
| Utility Gas | 2,049 (60.0%) | 236 (31.1%) |
| Bottled, Tank, or LP Gas | 47 (1.4%) | 0 (0.0%) |
| Electricity | 1,279 (37.5%) | 523 (68.9%) |
| Fuel Oil or Kerosene | 7 (0.2%) | 0 (0.0%) |
| Coal or Coke | 0 (0.0%) | 0 (0.0%) |
| All other Fuels | 0 (0.0%) | 0 (0.0%) |
| No Fuel Used | 31 (0.9%) | 0 (0.0%) |
| Total | 3,413 (100.0%) | 759 (100.0%) |
Household Vehicle Usage in Oakbrook
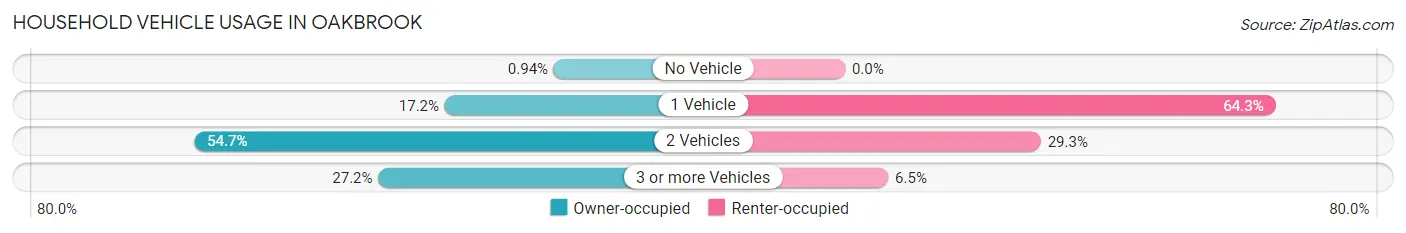
| Vehicles per Household | Owner-occupied | Renter-occupied |
| No Vehicle | 32 (0.9%) | 0 (0.0%) |
| 1 Vehicle | 588 (17.2%) | 488 (64.3%) |
| 2 Vehicles | 1,866 (54.7%) | 222 (29.2%) |
| 3 or more Vehicles | 927 (27.2%) | 49 (6.5%) |
| Total | 3,413 (100.0%) | 759 (100.0%) |
Real Estate & Mortgages in Oakbrook
Real Estate and Mortgage Overview in Oakbrook
| Characteristic | Without Mortgage | With Mortgage |
| Housing Units | 854 | 2,559 |
| Median Property Value | $218,500 | $243,500 |
| Median Household Income | $73,750 | $698 |
| Monthly Housing Costs | $497 | $58 |
| Real Estate Taxes | $1,664 | $34 |
Property Value by Mortgage Status in Oakbrook
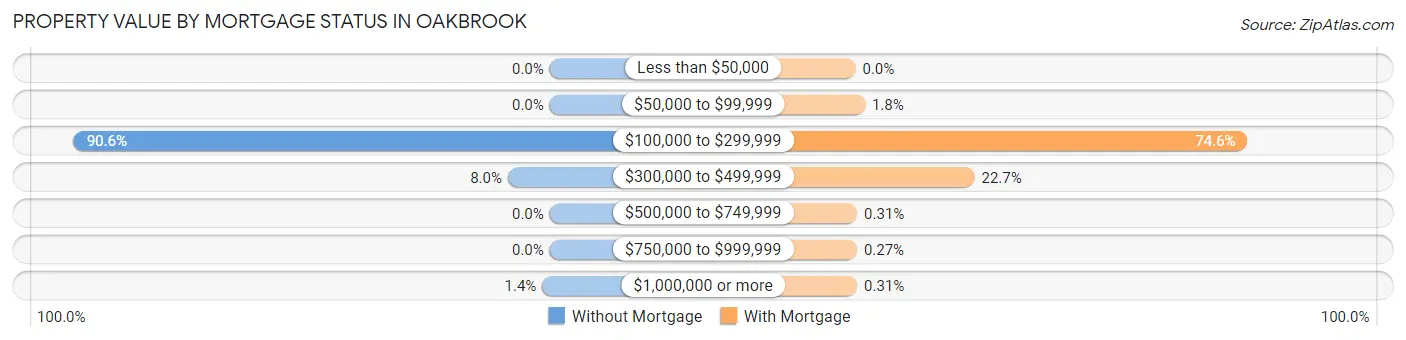
| Property Value | Without Mortgage | With Mortgage |
| Less than $50,000 | 0 (0.0%) | 0 (0.0%) |
| $50,000 to $99,999 | 0 (0.0%) | 46 (1.8%) |
| $100,000 to $299,999 | 774 (90.6%) | 1,910 (74.6%) |
| $300,000 to $499,999 | 68 (8.0%) | 580 (22.7%) |
| $500,000 to $749,999 | 0 (0.0%) | 8 (0.3%) |
| $750,000 to $999,999 | 0 (0.0%) | 7 (0.3%) |
| $1,000,000 or more | 12 (1.4%) | 8 (0.3%) |
| Total | 854 (100.0%) | 2,559 (100.0%) |
Household Income by Mortgage Status in Oakbrook
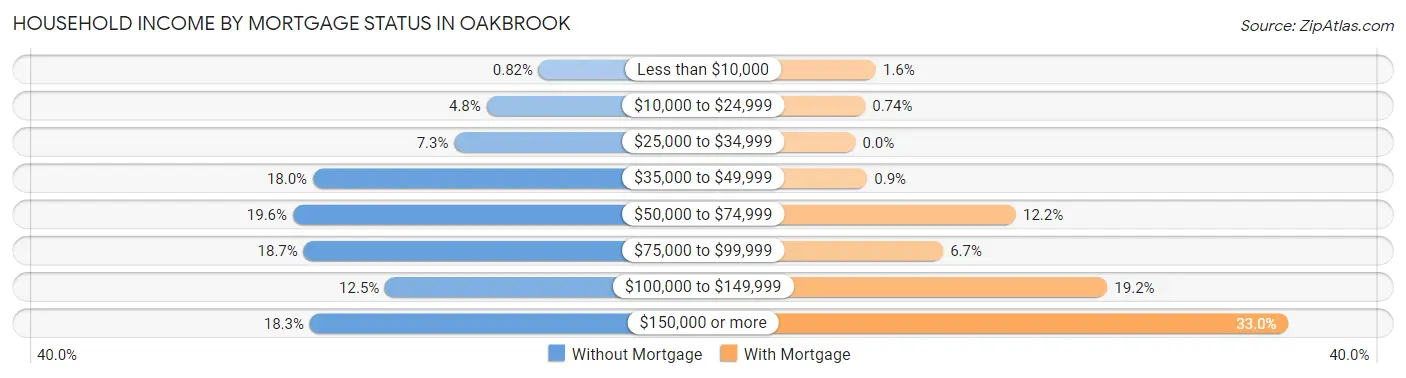
| Household Income | Without Mortgage | With Mortgage |
| Less than $10,000 | 7 (0.8%) | 40 (1.6%) |
| $10,000 to $24,999 | 41 (4.8%) | 19 (0.7%) |
| $25,000 to $34,999 | 62 (7.3%) | 0 (0.0%) |
| $35,000 to $49,999 | 154 (18.0%) | 23 (0.9%) |
| $50,000 to $74,999 | 167 (19.6%) | 313 (12.2%) |
| $75,000 to $99,999 | 160 (18.7%) | 171 (6.7%) |
| $100,000 to $149,999 | 107 (12.5%) | 491 (19.2%) |
| $150,000 or more | 156 (18.3%) | 844 (33.0%) |
| Total | 854 (100.0%) | 2,559 (100.0%) |
Property Value to Household Income Ratio in Oakbrook
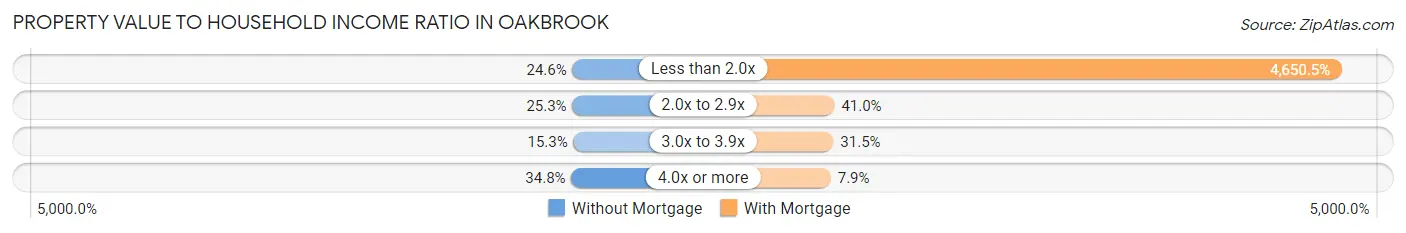
| Value-to-Income Ratio | Without Mortgage | With Mortgage |
| Less than 2.0x | 210 (24.6%) | 119,006 (4,650.5%) |
| 2.0x to 2.9x | 216 (25.3%) | 1,049 (41.0%) |
| 3.0x to 3.9x | 131 (15.3%) | 807 (31.5%) |
| 4.0x or more | 297 (34.8%) | 203 (7.9%) |
| Total | 854 (100.0%) | 2,559 (100.0%) |
Real Estate Taxes by Mortgage Status in Oakbrook
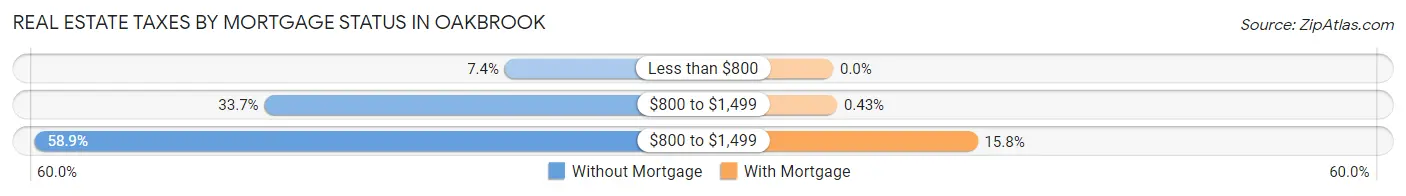
| Property Taxes | Without Mortgage | With Mortgage |
| Less than $800 | 63 (7.4%) | 0 (0.0%) |
| $800 to $1,499 | 288 (33.7%) | 11 (0.4%) |
| $800 to $1,499 | 503 (58.9%) | 405 (15.8%) |
| Total | 854 (100.0%) | 2,559 (100.0%) |
Health & Disability in Oakbrook
Health Insurance Coverage by Age in Oakbrook
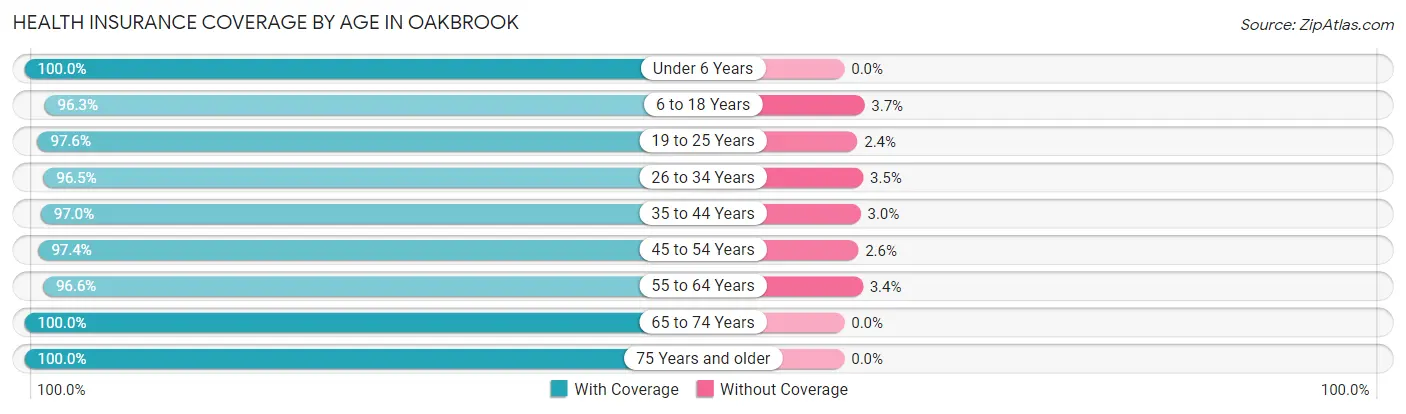
| Age Bracket | With Coverage | Without Coverage |
| Under 6 Years | 653 (100.0%) | 0 (0.0%) |
| 6 to 18 Years | 1,313 (96.3%) | 51 (3.7%) |
| 19 to 25 Years | 887 (97.6%) | 22 (2.4%) |
| 26 to 34 Years | 1,159 (96.5%) | 42 (3.5%) |
| 35 to 44 Years | 1,471 (97.0%) | 46 (3.0%) |
| 45 to 54 Years | 1,127 (97.4%) | 30 (2.6%) |
| 55 to 64 Years | 1,352 (96.6%) | 48 (3.4%) |
| 65 to 74 Years | 1,290 (100.0%) | 0 (0.0%) |
| 75 Years and older | 538 (100.0%) | 0 (0.0%) |
| Total | 9,790 (97.6%) | 239 (2.4%) |
Health Insurance Coverage by Citizenship Status in Oakbrook
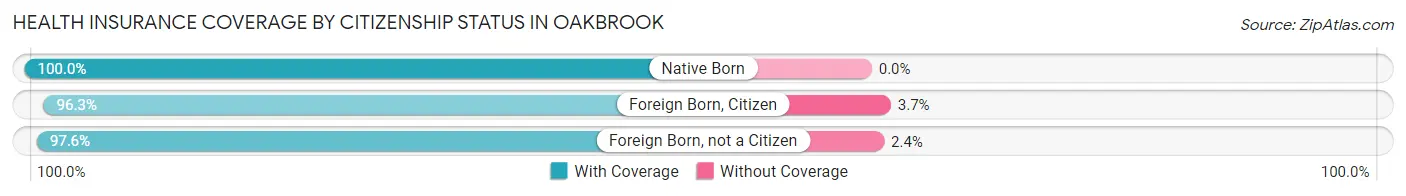
| Citizenship Status | With Coverage | Without Coverage |
| Native Born | 653 (100.0%) | 0 (0.0%) |
| Foreign Born, Citizen | 1,313 (96.3%) | 51 (3.7%) |
| Foreign Born, not a Citizen | 887 (97.6%) | 22 (2.4%) |
Health Insurance Coverage by Household Income in Oakbrook
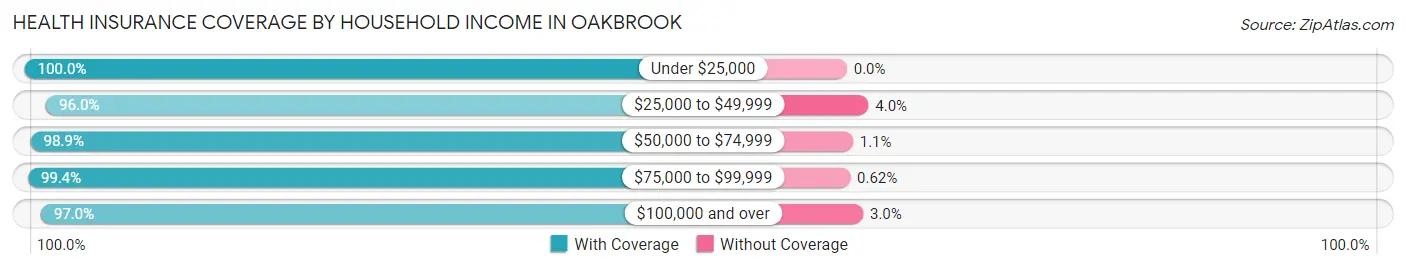
| Household Income | With Coverage | Without Coverage |
| Under $25,000 | 124 (100.0%) | 0 (0.0%) |
| $25,000 to $49,999 | 1,092 (96.0%) | 46 (4.0%) |
| $50,000 to $74,999 | 968 (98.9%) | 11 (1.1%) |
| $75,000 to $99,999 | 2,246 (99.4%) | 14 (0.6%) |
| $100,000 and over | 5,359 (97.0%) | 168 (3.0%) |
Public vs Private Health Insurance Coverage by Age in Oakbrook
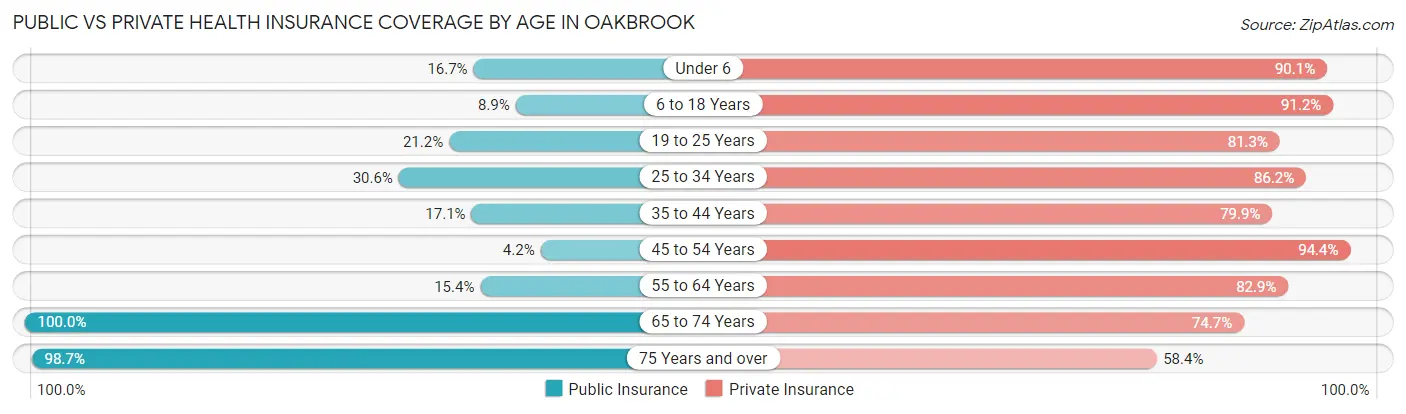
| Age Bracket | Public Insurance | Private Insurance |
| Under 6 | 109 (16.7%) | 588 (90.0%) |
| 6 to 18 Years | 121 (8.9%) | 1,244 (91.2%) |
| 19 to 25 Years | 193 (21.2%) | 739 (81.3%) |
| 25 to 34 Years | 367 (30.6%) | 1,035 (86.2%) |
| 35 to 44 Years | 259 (17.1%) | 1,212 (79.9%) |
| 45 to 54 Years | 49 (4.2%) | 1,092 (94.4%) |
| 55 to 64 Years | 216 (15.4%) | 1,160 (82.9%) |
| 65 to 74 Years | 1,290 (100.0%) | 963 (74.7%) |
| 75 Years and over | 531 (98.7%) | 314 (58.4%) |
| Total | 3,135 (31.3%) | 8,347 (83.2%) |
Disability Status by Sex by Age in Oakbrook
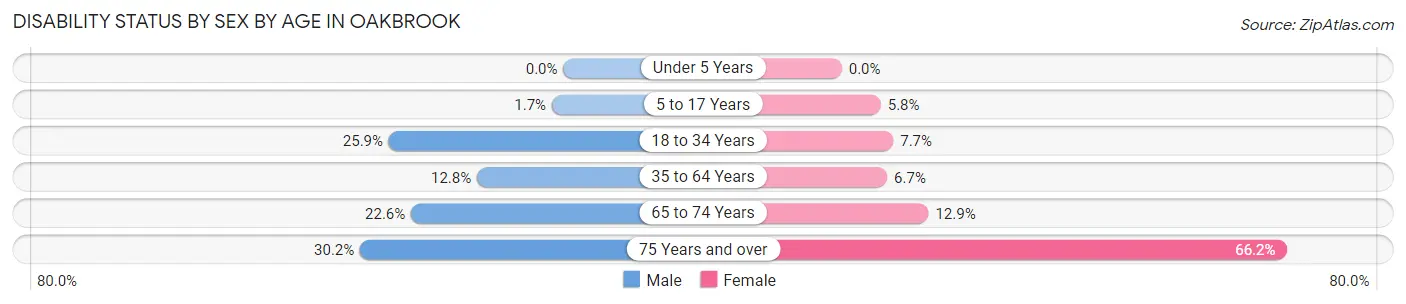
| Age Bracket | Male | Female |
| Under 5 Years | 0 (0.0%) | 0 (0.0%) |
| 5 to 17 Years | 11 (1.7%) | 46 (5.8%) |
| 18 to 34 Years | 336 (25.9%) | 71 (7.6%) |
| 35 to 64 Years | 254 (12.8%) | 141 (6.7%) |
| 65 to 74 Years | 123 (22.6%) | 96 (12.9%) |
| 75 Years and over | 83 (30.2%) | 174 (66.2%) |
Disability Class by Sex by Age in Oakbrook
Disability Class: Hearing Difficulty
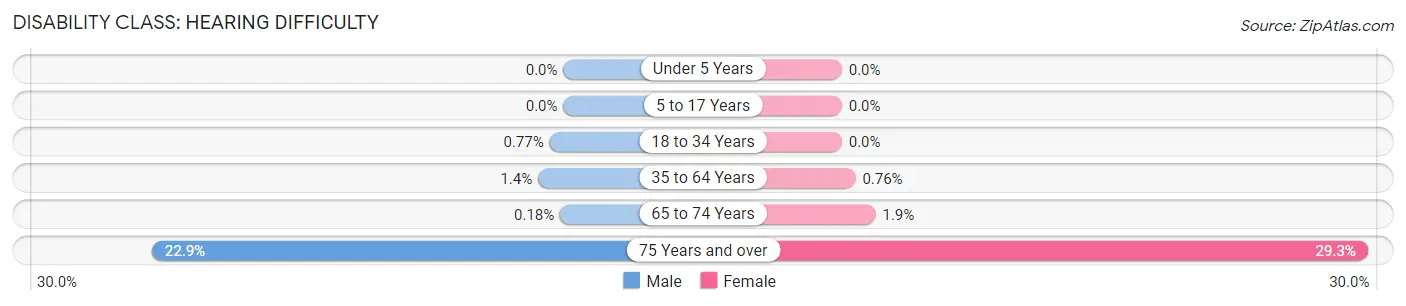
| Age Bracket | Male | Female |
| Under 5 Years | 0 (0.0%) | 0 (0.0%) |
| 5 to 17 Years | 0 (0.0%) | 0 (0.0%) |
| 18 to 34 Years | 10 (0.8%) | 0 (0.0%) |
| 35 to 64 Years | 28 (1.4%) | 16 (0.8%) |
| 65 to 74 Years | 1 (0.2%) | 14 (1.9%) |
| 75 Years and over | 63 (22.9%) | 77 (29.3%) |
Disability Class: Vision Difficulty
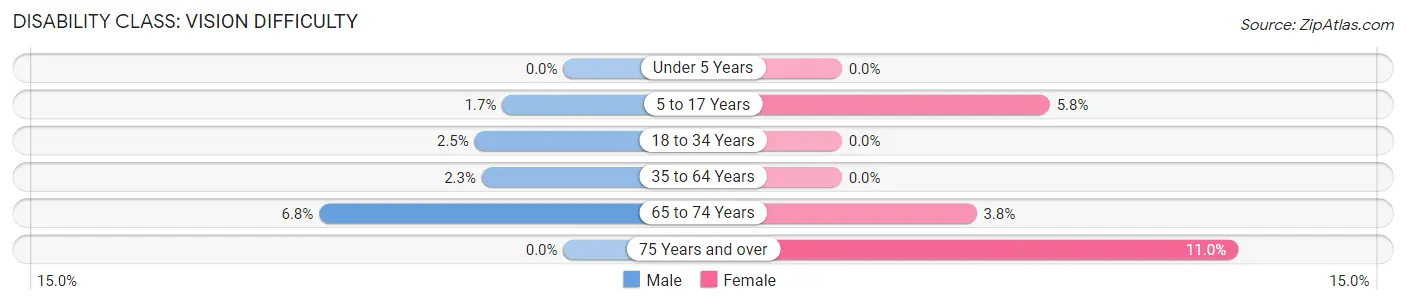
| Age Bracket | Male | Female |
| Under 5 Years | 0 (0.0%) | 0 (0.0%) |
| 5 to 17 Years | 11 (1.7%) | 46 (5.8%) |
| 18 to 34 Years | 32 (2.5%) | 0 (0.0%) |
| 35 to 64 Years | 45 (2.3%) | 0 (0.0%) |
| 65 to 74 Years | 37 (6.8%) | 28 (3.7%) |
| 75 Years and over | 0 (0.0%) | 29 (11.0%) |
Disability Class: Cognitive Difficulty
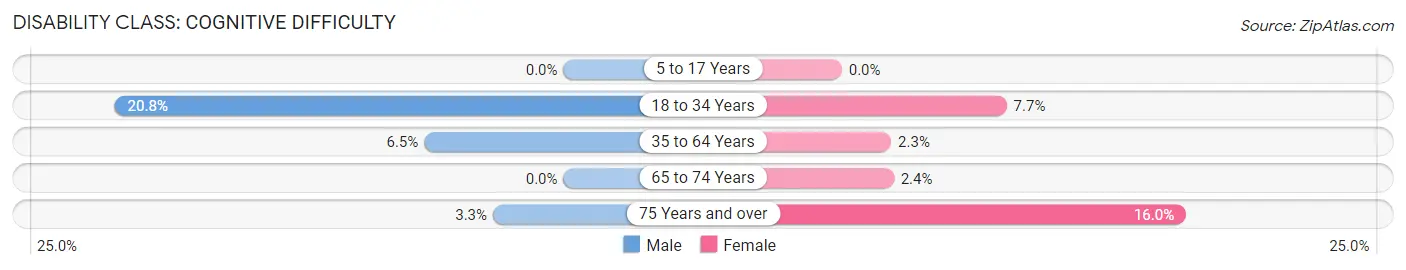
| Age Bracket | Male | Female |
| 5 to 17 Years | 0 (0.0%) | 0 (0.0%) |
| 18 to 34 Years | 270 (20.8%) | 71 (7.6%) |
| 35 to 64 Years | 128 (6.5%) | 48 (2.3%) |
| 65 to 74 Years | 0 (0.0%) | 18 (2.4%) |
| 75 Years and over | 9 (3.3%) | 42 (16.0%) |
Disability Class: Ambulatory Difficulty
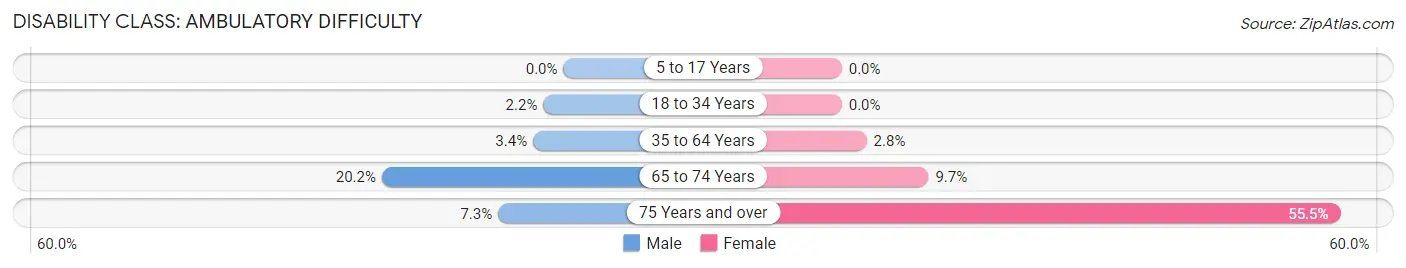
| Age Bracket | Male | Female |
| 5 to 17 Years | 0 (0.0%) | 0 (0.0%) |
| 18 to 34 Years | 29 (2.2%) | 0 (0.0%) |
| 35 to 64 Years | 67 (3.4%) | 58 (2.8%) |
| 65 to 74 Years | 110 (20.2%) | 72 (9.7%) |
| 75 Years and over | 20 (7.3%) | 146 (55.5%) |
Disability Class: Self-Care Difficulty
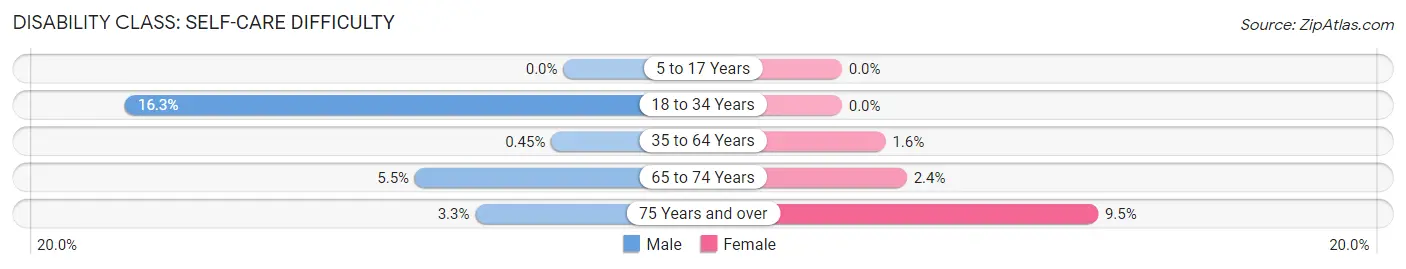
| Age Bracket | Male | Female |
| 5 to 17 Years | 0 (0.0%) | 0 (0.0%) |
| 18 to 34 Years | 211 (16.3%) | 0 (0.0%) |
| 35 to 64 Years | 9 (0.4%) | 34 (1.6%) |
| 65 to 74 Years | 30 (5.5%) | 18 (2.4%) |
| 75 Years and over | 9 (3.3%) | 25 (9.5%) |
Technology Access in Oakbrook
Computing Device Access in Oakbrook
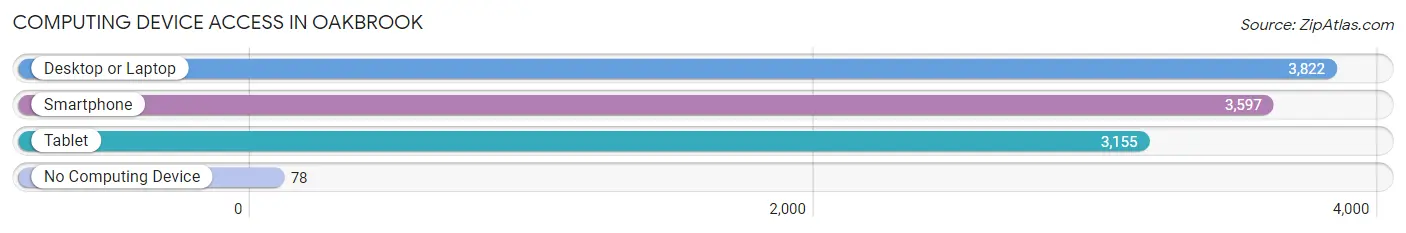
| Device Type | # Households | % Households |
| Desktop or Laptop | 3,822 | 91.6% |
| Smartphone | 3,597 | 86.2% |
| Tablet | 3,155 | 75.6% |
| No Computing Device | 78 | 1.9% |
| Total | 4,172 | 100.0% |
Internet Access in Oakbrook
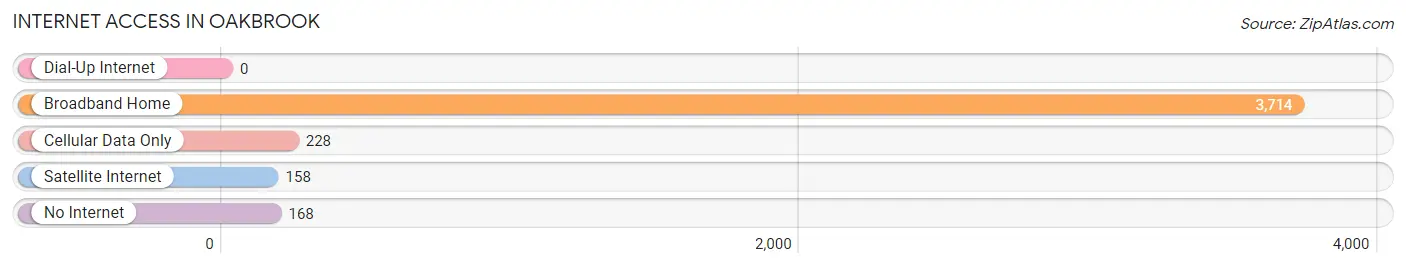
| Internet Type | # Households | % Households |
| Dial-Up Internet | 0 | 0.0% |
| Broadband Home | 3,714 | 89.0% |
| Cellular Data Only | 228 | 5.5% |
| Satellite Internet | 158 | 3.8% |
| No Internet | 168 | 4.0% |
| Total | 4,172 | 100.0% |
Oakbrook Summary
Oakbrook, Kentucky is a small town located in the southeastern corner of the state, in the foothills of the Appalachian Mountains. It is situated in the heart of the Cumberland Plateau, and is surrounded by the Daniel Boone National Forest. The town is home to a population of just over 1,000 people, and is known for its rural charm and small-town atmosphere.
History
Oakbrook was founded in 1820 by a group of settlers from Virginia and North Carolina. The town was originally known as “Oak Grove”, and was named after the abundance of oak trees in the area. The town was officially incorporated in 1845, and the name was changed to Oakbrook.
The town was an important stop on the stagecoach route between Lexington and Knoxville, and was a popular destination for travelers. The town was also home to a number of businesses, including a general store, a blacksmith shop, and a hotel.
In the late 19th century, the town began to decline as the railroad bypassed it. The town’s population dwindled, and many of the businesses closed. However, the town was revitalized in the early 20th century when the coal industry began to boom in the area. The town’s population grew, and new businesses opened.
Geography
Oakbrook is located in the southeastern corner of Kentucky, in the foothills of the Appalachian Mountains. The town is situated in the heart of the Cumberland Plateau, and is surrounded by the Daniel Boone National Forest. The town is located at the intersection of US Route 25 and Kentucky Route 7.
The town is situated at an elevation of 1,000 feet, and is located in a hilly region. The town is located near the headwaters of the Cumberland River, and is surrounded by a number of small creeks and streams.
Economy
Oakbrook’s economy is largely based on agriculture and tourism. The town is home to a number of small farms, and the surrounding area is known for its production of tobacco, corn, and hay. The town is also home to a number of small businesses, including restaurants, shops, and a hardware store.
The town is also a popular destination for tourists, who come to enjoy the town’s rural charm and small-town atmosphere. The town is home to a number of historic sites, including the Oakbrook Historic District, which is listed on the National Register of Historic Places.
Demographics
As of the 2010 census, the population of Oakbrook was 1,072. The town is predominantly white, with a small African American population. The median household income is $30,000, and the median home value is $90,000. The town has a poverty rate of 17.7%, and the unemployment rate is 6.2%.
Conclusion
Oakbrook, Kentucky is a small town located in the southeastern corner of the state, in the foothills of the Appalachian Mountains. The town is known for its rural charm and small-town atmosphere, and is home to a population of just over 1,000 people. The town’s economy is largely based on agriculture and tourism, and the town is a popular destination for tourists. The town is predominantly white, with a small African American population, and the median household income is $30,000.
Common Questions
What is Per Capita Income in Oakbrook?
Per Capita income in Oakbrook is $46,857.
What is the Median Family Income in Oakbrook?
Median Family Income in Oakbrook is $111,452.
What is the Median Household income in Oakbrook?
Median Household Income in Oakbrook is $91,282.
What is Income or Wage Gap in Oakbrook?
Income or Wage Gap in Oakbrook is 27.6%.
Women in Oakbrook earn 72.4 cents for every dollar earned by a man.
What is Inequality or Gini Index in Oakbrook?
Inequality or Gini Index in Oakbrook is 0.35.
What is the Total Population of Oakbrook?
Total Population of Oakbrook is 10,045.
What is the Total Male Population of Oakbrook?
Total Male Population of Oakbrook is 4,977.
What is the Total Female Population of Oakbrook?
Total Female Population of Oakbrook is 5,068.
What is the Ratio of Males per 100 Females in Oakbrook?
There are 98.20 Males per 100 Females in Oakbrook.
What is the Ratio of Females per 100 Males in Oakbrook?
There are 101.83 Females per 100 Males in Oakbrook.
What is the Median Population Age in Oakbrook?
Median Population Age in Oakbrook is 41.1 Years.
What is the Average Family Size in Oakbrook
Average Family Size in Oakbrook is 2.9 People.
What is the Average Household Size in Oakbrook
Average Household Size in Oakbrook is 2.4 People.
How Large is the Labor Force in Oakbrook?
There are 6,083 People in the Labor Forcein in Oakbrook.
What is the Percentage of People in the Labor Force in Oakbrook?
72.2% of People are in the Labor Force in Oakbrook.
What is the Unemployment Rate in Oakbrook?
Unemployment Rate in Oakbrook is 2.6%.