Radcliff, KY Map & Demographics
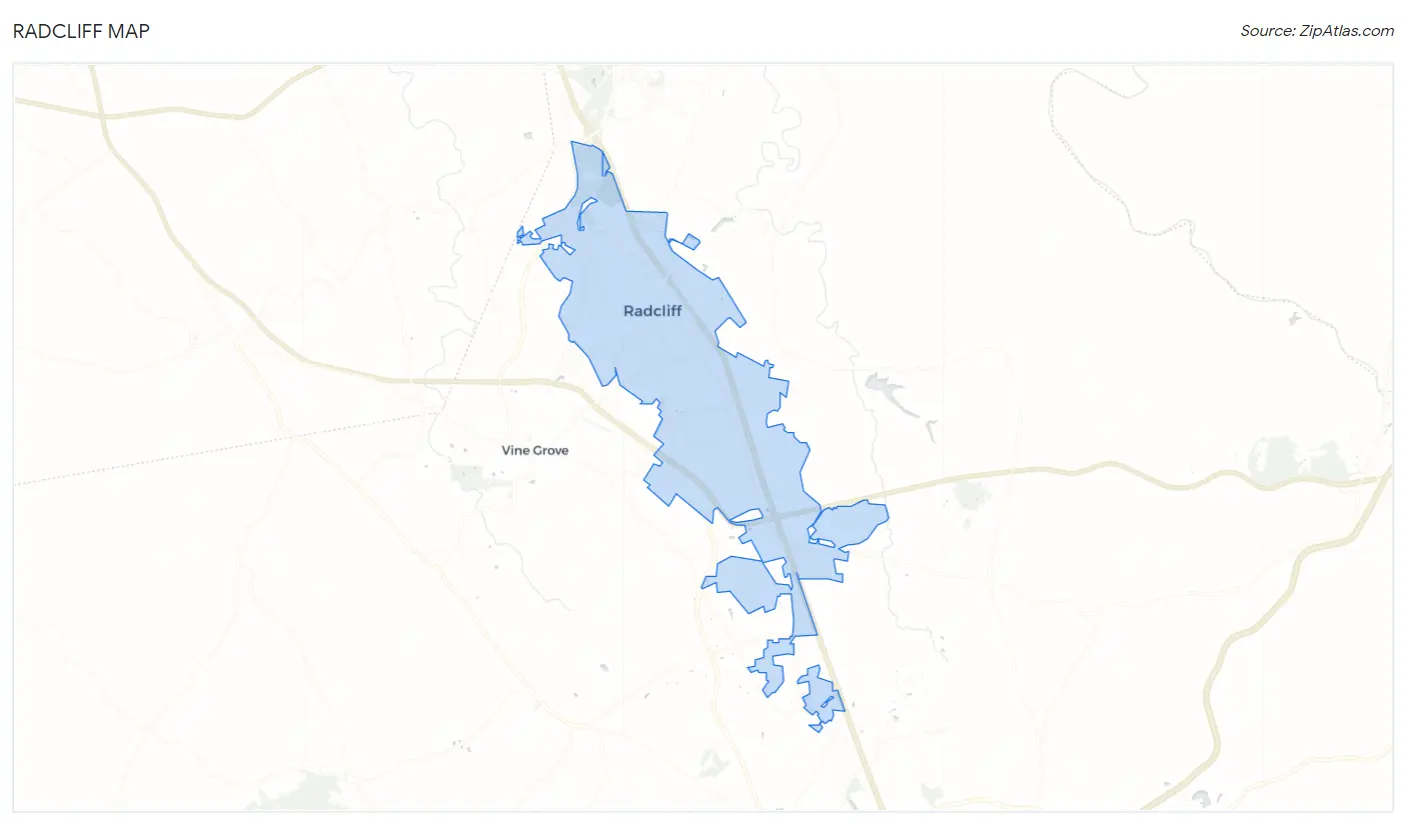
Radcliff Map
Radcliff Overview
$29,343
PER CAPITA INCOME
$61,927
AVG FAMILY INCOME
$54,558
AVG HOUSEHOLD INCOME
29.9%
WAGE / INCOME GAP [ % ]
70.1¢/ $1
WAGE / INCOME GAP [ $ ]
$7,254
FAMILY INCOME DEFICIT
0.45
INEQUALITY / GINI INDEX
22,981
TOTAL POPULATION
10,969
MALE POPULATION
12,012
FEMALE POPULATION
91.32
MALES / 100 FEMALES
109.51
FEMALES / 100 MALES
35.1
MEDIAN AGE
3.2
AVG FAMILY SIZE
2.6
AVG HOUSEHOLD SIZE
11,105
LABOR FORCE [ PEOPLE ]
63.1%
PERCENT IN LABOR FORCE
9.1%
UNEMPLOYMENT RATE
Radcliff Zip Codes
Income in Radcliff
Income Overview in Radcliff
Per Capita Income in Radcliff is $29,343, while median incomes of families and households are $61,927 and $54,558 respectively.
| Characteristic | Number | Measure |
| Per Capita Income | 22,981 | $29,343 |
| Median Family Income | 5,439 | $61,927 |
| Mean Family Income | 5,439 | $85,046 |
| Median Household Income | 8,847 | $54,558 |
| Mean Household Income | 8,847 | $76,177 |
| Income Deficit | 5,439 | $7,254 |
| Wage / Income Gap (%) | 22,981 | 29.94% |
| Wage / Income Gap ($) | 22,981 | 70.06¢ per $1 |
| Gini / Inequality Index | 22,981 | 0.45 |
Earnings by Sex in Radcliff
Average Earnings in Radcliff are $34,592, $40,875 for men and $28,637 for women, a difference of 29.9%.
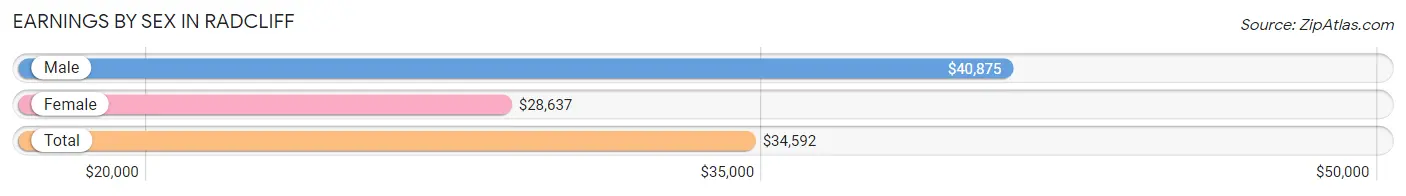
| Sex | Number | Average Earnings |
| Male | 5,580 (48.8%) | $40,875 |
| Female | 5,843 (51.1%) | $28,637 |
| Total | 11,423 (100.0%) | $34,592 |
Earnings by Sex by Income Bracket in Radcliff
The most common earnings brackets in Radcliff are $55,000 to $64,999 for men (554 | 9.9%) and $2,500 to $4,999 for women (563 | 9.6%).
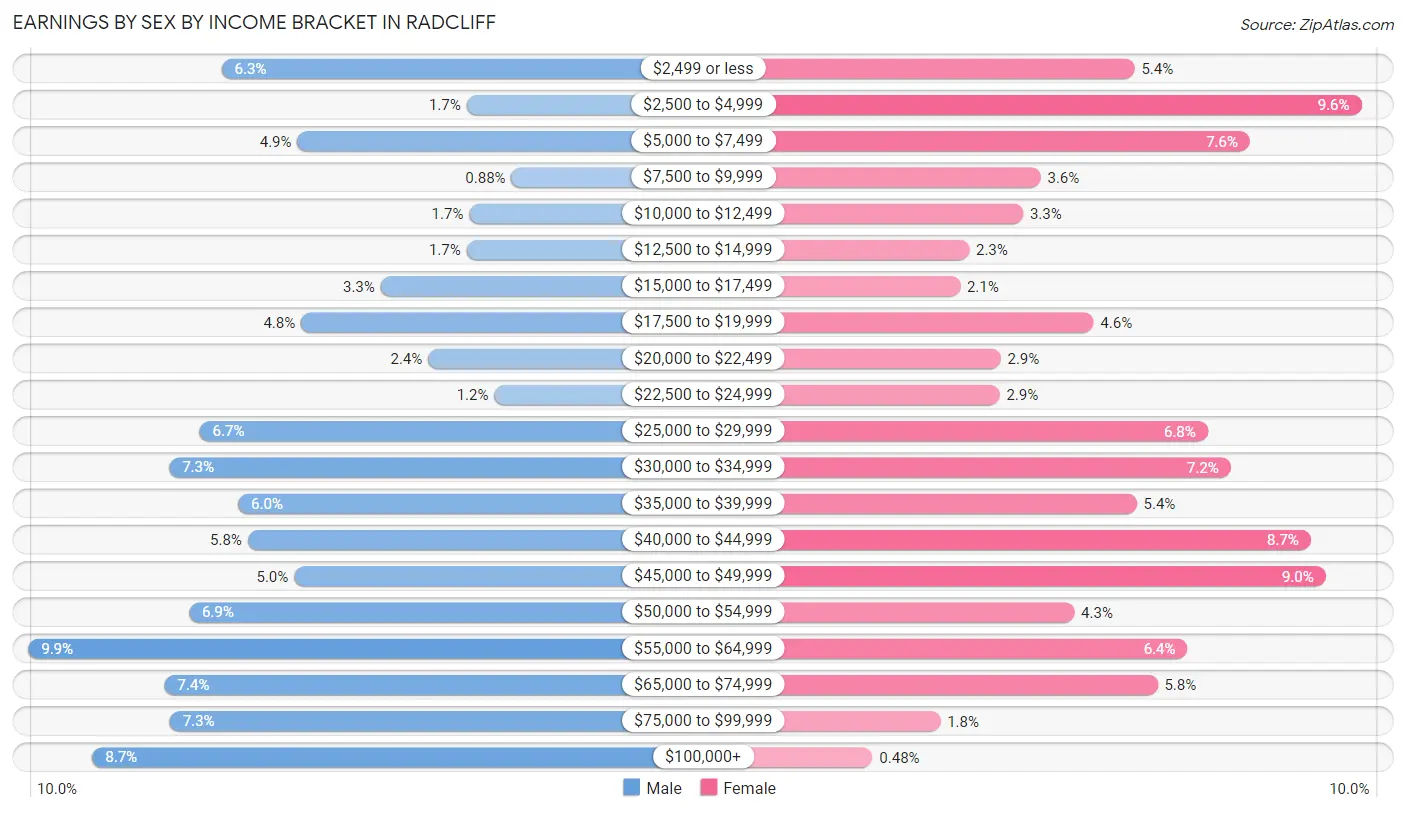
| Income | Male | Female |
| $2,499 or less | 352 (6.3%) | 315 (5.4%) |
| $2,500 to $4,999 | 96 (1.7%) | 563 (9.6%) |
| $5,000 to $7,499 | 273 (4.9%) | 441 (7.5%) |
| $7,500 to $9,999 | 49 (0.9%) | 212 (3.6%) |
| $10,000 to $12,499 | 93 (1.7%) | 193 (3.3%) |
| $12,500 to $14,999 | 96 (1.7%) | 134 (2.3%) |
| $15,000 to $17,499 | 186 (3.3%) | 124 (2.1%) |
| $17,500 to $19,999 | 269 (4.8%) | 270 (4.6%) |
| $20,000 to $22,499 | 136 (2.4%) | 168 (2.9%) |
| $22,500 to $24,999 | 67 (1.2%) | 167 (2.9%) |
| $25,000 to $29,999 | 375 (6.7%) | 395 (6.8%) |
| $30,000 to $34,999 | 407 (7.3%) | 420 (7.2%) |
| $35,000 to $39,999 | 335 (6.0%) | 317 (5.4%) |
| $40,000 to $44,999 | 325 (5.8%) | 508 (8.7%) |
| $45,000 to $49,999 | 276 (5.0%) | 524 (9.0%) |
| $50,000 to $54,999 | 386 (6.9%) | 249 (4.3%) |
| $55,000 to $64,999 | 554 (9.9%) | 373 (6.4%) |
| $65,000 to $74,999 | 412 (7.4%) | 340 (5.8%) |
| $75,000 to $99,999 | 406 (7.3%) | 102 (1.8%) |
| $100,000+ | 487 (8.7%) | 28 (0.5%) |
| Total | 5,580 (100.0%) | 5,843 (100.0%) |
Earnings by Sex by Educational Attainment in Radcliff
Average earnings in Radcliff are $45,749 for men and $35,065 for women, a difference of 23.4%. Men with an educational attainment of bachelor's degree enjoy the highest average annual earnings of $67,012, while those with less than high school education earn the least with $24,167. Women with an educational attainment of graduate degree earn the most with the average annual earnings of $50,331, while those with high school diploma education have the smallest earnings of $23,933.
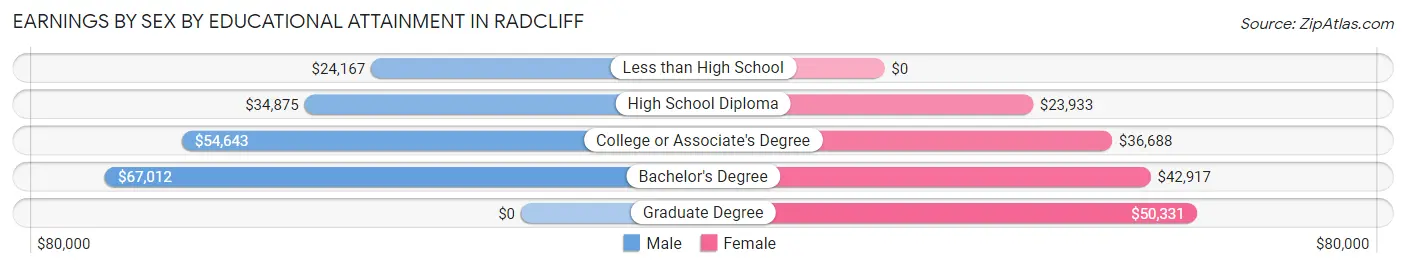
| Educational Attainment | Male Income | Female Income |
| Less than High School | $24,167 | $0 |
| High School Diploma | $34,875 | $23,933 |
| College or Associate's Degree | $54,643 | $36,688 |
| Bachelor's Degree | $67,012 | $42,917 |
| Graduate Degree | - | - |
| Total | $45,749 | $35,065 |
Family Income in Radcliff
Family Income Brackets in Radcliff
According to the Radcliff family income data, there are 1,115 families falling into the $50,000 to $74,999 income range, which is the most common income bracket and makes up 20.5% of all families. Conversely, the less than $10,000 income bracket is the least frequent group with only 92 families (1.7%) belonging to this category.
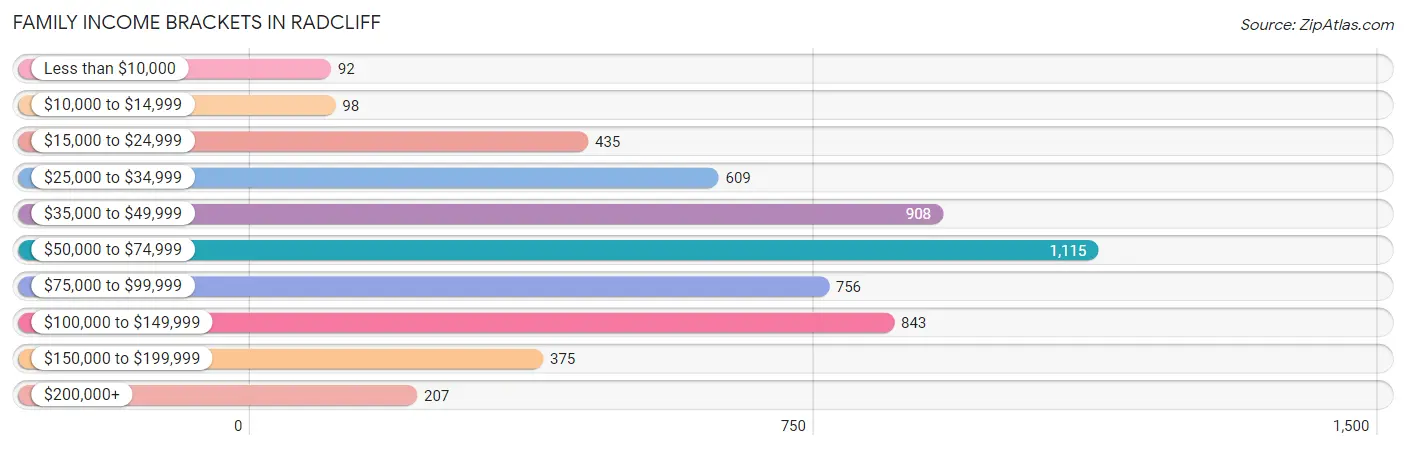
| Income Bracket | # Families | % Families |
| Less than $10,000 | 92 | 1.7% |
| $10,000 to $14,999 | 98 | 1.8% |
| $15,000 to $24,999 | 435 | 8.0% |
| $25,000 to $34,999 | 609 | 11.2% |
| $35,000 to $49,999 | 908 | 16.7% |
| $50,000 to $74,999 | 1,115 | 20.5% |
| $75,000 to $99,999 | 756 | 13.9% |
| $100,000 to $149,999 | 843 | 15.5% |
| $150,000 to $199,999 | 375 | 6.9% |
| $200,000+ | 207 | 3.8% |
Family Income by Famaliy Size in Radcliff
7+ person families (38 | 0.7%) account for the highest median family income in Radcliff with $250,001 per family, while 7+ person families (38 | 0.7%) have the highest median income of $35,714 per family member.
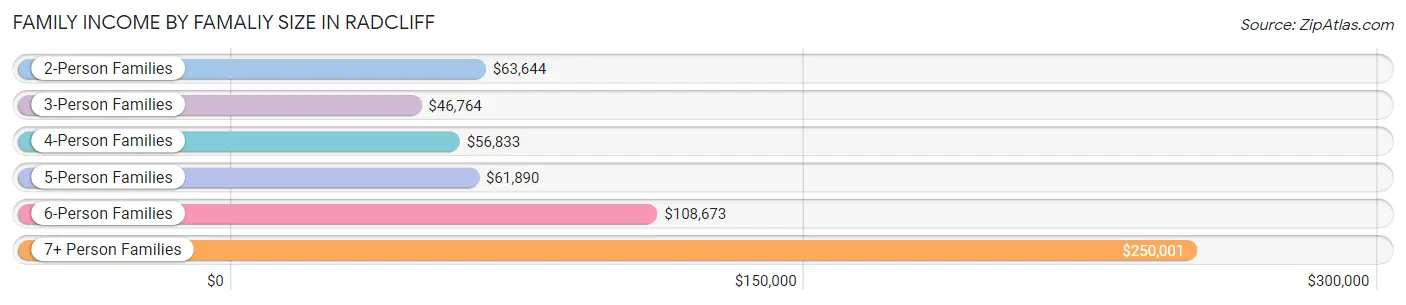
| Income Bracket | # Families | Median Income |
| 2-Person Families | 2,609 (48.0%) | $63,644 |
| 3-Person Families | 1,229 (22.6%) | $46,764 |
| 4-Person Families | 792 (14.6%) | $56,833 |
| 5-Person Families | 467 (8.6%) | $61,890 |
| 6-Person Families | 304 (5.6%) | $108,673 |
| 7+ Person Families | 38 (0.7%) | $250,001 |
| Total | 5,439 (100.0%) | $61,927 |
Family Income by Number of Earners in Radcliff
The median family income in Radcliff is $61,927, with families comprising 2 earners (1,807) having the highest median family income of $94,984, while families with 1 earner (2,313) have the lowest median family income of $46,830, accounting for 33.2% and 42.5% of families, respectively.
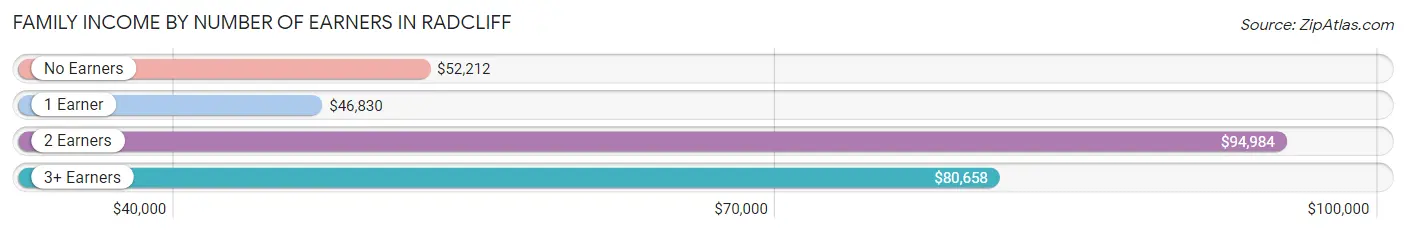
| Number of Earners | # Families | Median Income |
| No Earners | 757 (13.9%) | $52,212 |
| 1 Earner | 2,313 (42.5%) | $46,830 |
| 2 Earners | 1,807 (33.2%) | $94,984 |
| 3+ Earners | 562 (10.3%) | $80,658 |
| Total | 5,439 (100.0%) | $61,927 |
Household Income in Radcliff
Household Income Brackets in Radcliff
With 1,831 households falling in the category, the $50,000 to $74,999 income range is the most frequent in Radcliff, accounting for 20.7% of all households. In contrast, only 292 households (3.3%) fall into the $10,000 to $14,999 income bracket, making it the least populous group.
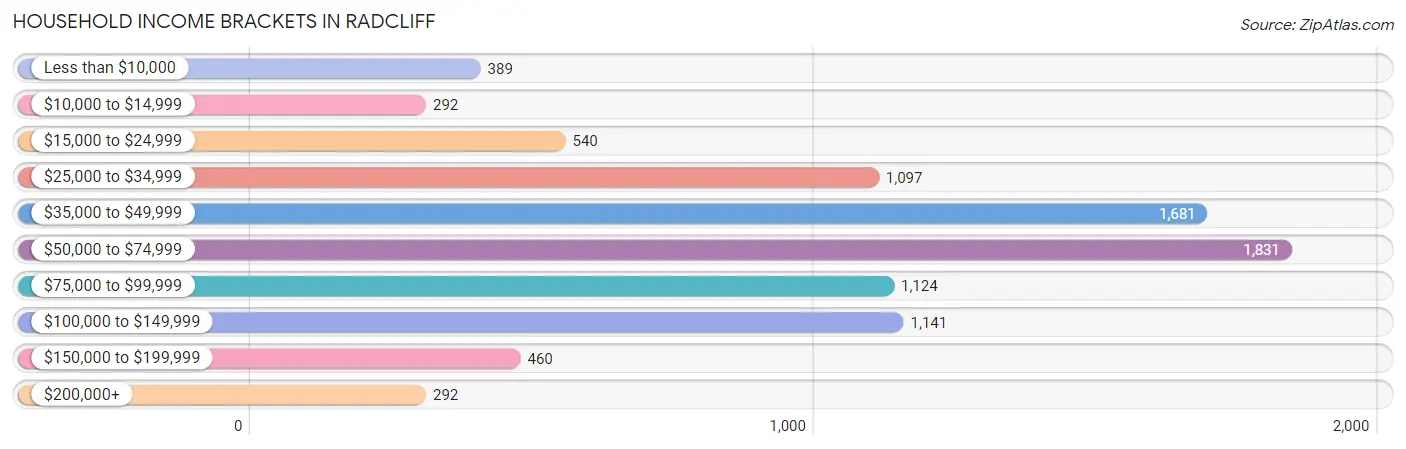
| Income Bracket | # Households | % Households |
| Less than $10,000 | 389 | 4.4% |
| $10,000 to $14,999 | 292 | 3.3% |
| $15,000 to $24,999 | 540 | 6.1% |
| $25,000 to $34,999 | 1,097 | 12.4% |
| $35,000 to $49,999 | 1,681 | 19.0% |
| $50,000 to $74,999 | 1,831 | 20.7% |
| $75,000 to $99,999 | 1,124 | 12.7% |
| $100,000 to $149,999 | 1,141 | 12.9% |
| $150,000 to $199,999 | 460 | 5.2% |
| $200,000+ | 292 | 3.3% |
Household Income by Householder Age in Radcliff
The median household income in Radcliff is $54,558, with the highest median household income of $60,829 found in the 45 to 64 years age bracket for the primary householder. A total of 3,139 households (35.5%) fall into this category. Meanwhile, the 15 to 24 years age bracket for the primary householder has the lowest median household income of $45,983, with 428 households (4.8%) in this group.
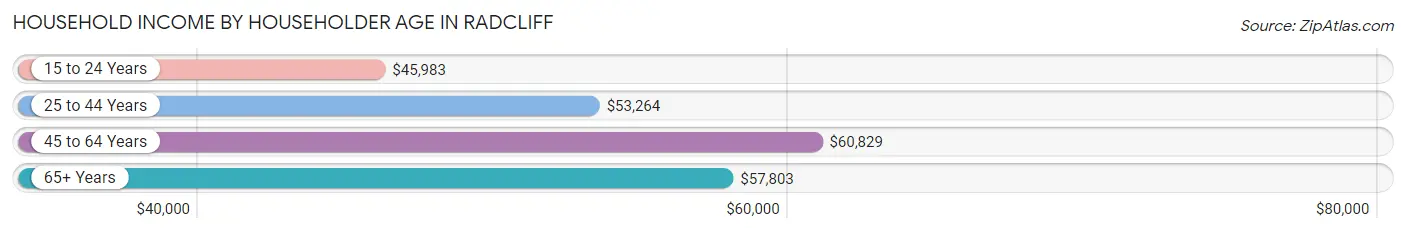
| Income Bracket | # Households | Median Income |
| 15 to 24 Years | 428 (4.8%) | $45,983 |
| 25 to 44 Years | 3,247 (36.7%) | $53,264 |
| 45 to 64 Years | 3,139 (35.5%) | $60,829 |
| 65+ Years | 2,033 (23.0%) | $57,803 |
| Total | 8,847 (100.0%) | $54,558 |
Poverty in Radcliff
Income Below Poverty by Sex and Age in Radcliff
With 17.2% poverty level for males and 16.3% for females among the residents of Radcliff, 6 to 11 year old males and 18 to 24 year old females are the most vulnerable to poverty, with 235 males (29.0%) and 530 females (44.7%) in their respective age groups living below the poverty level.
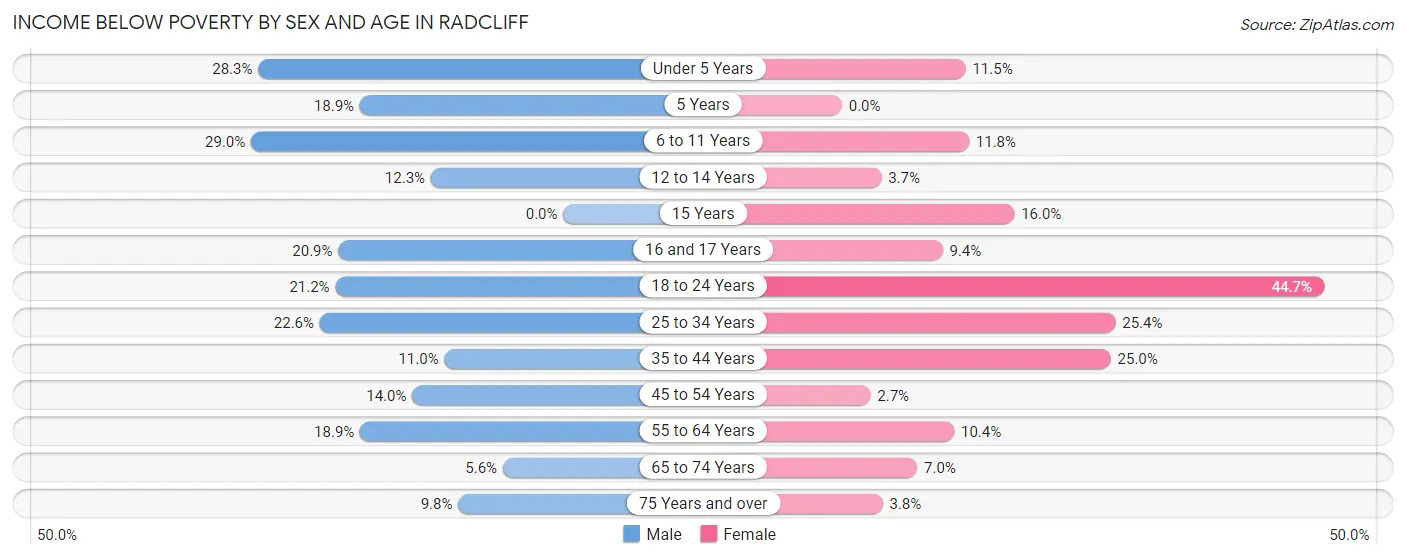
| Age Bracket | Male | Female |
| Under 5 Years | 186 (28.3%) | 103 (11.5%) |
| 5 Years | 44 (18.9%) | 0 (0.0%) |
| 6 to 11 Years | 235 (29.0%) | 140 (11.8%) |
| 12 to 14 Years | 81 (12.3%) | 12 (3.7%) |
| 15 Years | 0 (0.0%) | 32 (16.0%) |
| 16 and 17 Years | 76 (20.9%) | 33 (9.3%) |
| 18 to 24 Years | 192 (21.1%) | 530 (44.7%) |
| 25 to 34 Years | 367 (22.6%) | 414 (25.4%) |
| 35 to 44 Years | 193 (11.0%) | 350 (24.9%) |
| 45 to 54 Years | 157 (14.0%) | 33 (2.6%) |
| 55 to 64 Years | 236 (18.9%) | 176 (10.4%) |
| 65 to 74 Years | 58 (5.6%) | 70 (7.0%) |
| 75 Years and over | 35 (9.8%) | 20 (3.8%) |
| Total | 1,860 (17.2%) | 1,913 (16.3%) |
Income Above Poverty by Sex and Age in Radcliff
According to the poverty statistics in Radcliff, males aged 15 years and females aged 5 years are the age groups that are most secure financially, with 100.0% of males and 100.0% of females in these age groups living above the poverty line.
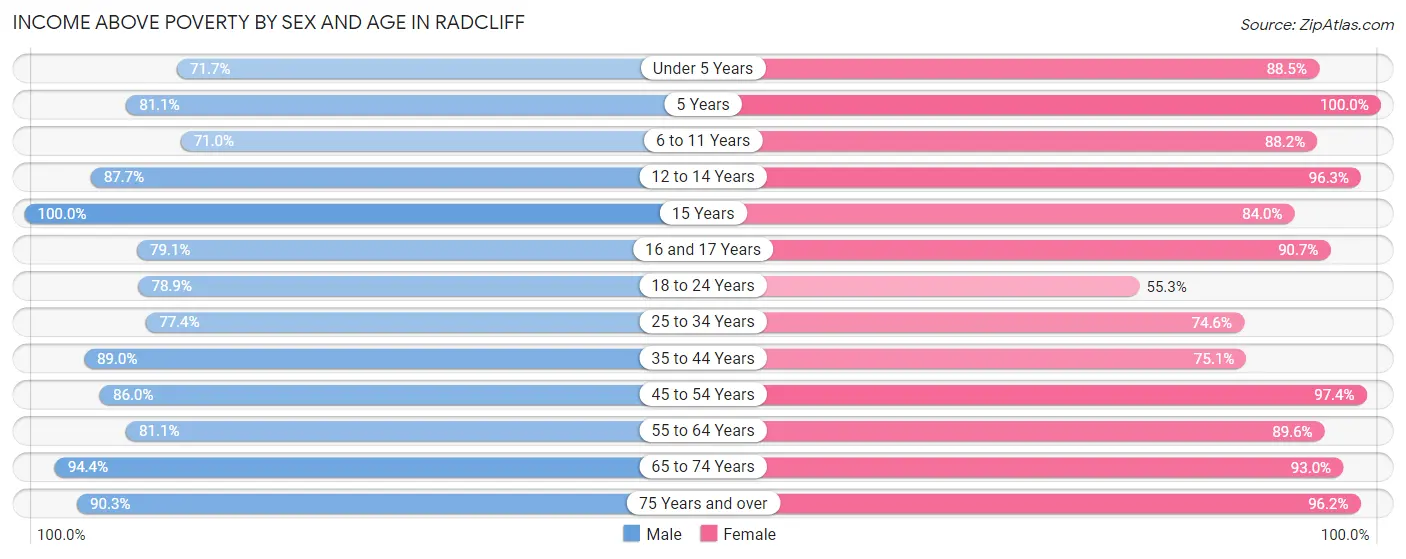
| Age Bracket | Male | Female |
| Under 5 Years | 471 (71.7%) | 794 (88.5%) |
| 5 Years | 189 (81.1%) | 99 (100.0%) |
| 6 to 11 Years | 576 (71.0%) | 1,047 (88.2%) |
| 12 to 14 Years | 578 (87.7%) | 316 (96.3%) |
| 15 Years | 77 (100.0%) | 168 (84.0%) |
| 16 and 17 Years | 288 (79.1%) | 320 (90.6%) |
| 18 to 24 Years | 716 (78.8%) | 655 (55.3%) |
| 25 to 34 Years | 1,257 (77.4%) | 1,217 (74.6%) |
| 35 to 44 Years | 1,557 (89.0%) | 1,053 (75.0%) |
| 45 to 54 Years | 963 (86.0%) | 1,212 (97.4%) |
| 55 to 64 Years | 1,015 (81.1%) | 1,513 (89.6%) |
| 65 to 74 Years | 976 (94.4%) | 932 (93.0%) |
| 75 Years and over | 324 (90.2%) | 509 (96.2%) |
| Total | 8,987 (82.9%) | 9,835 (83.7%) |
Income Below Poverty Among Married-Couple Families in Radcliff
The poverty statistics for married-couple families in Radcliff show that 3.9% or 120 of the total 3,057 families live below the poverty line. Families with 3 or 4 children have the highest poverty rate of 15.7%, comprising of 44 families. On the other hand, families with 5 or more children have the lowest poverty rate of 0.0%, which includes 0 families.
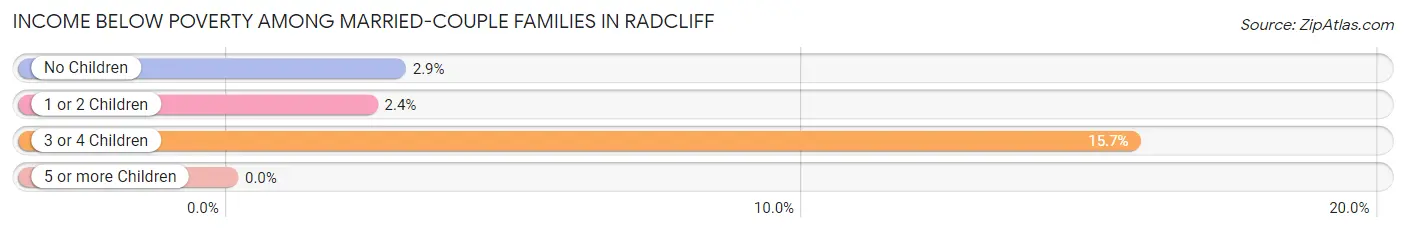
| Children | Above Poverty | Below Poverty |
| No Children | 1,798 (97.1%) | 54 (2.9%) |
| 1 or 2 Children | 885 (97.6%) | 22 (2.4%) |
| 3 or 4 Children | 236 (84.3%) | 44 (15.7%) |
| 5 or more Children | 18 (100.0%) | 0 (0.0%) |
| Total | 2,937 (96.1%) | 120 (3.9%) |
Income Below Poverty Among Single-Parent Households in Radcliff
According to the poverty data in Radcliff, 28.0% or 217 single-father households and 20.0% or 321 single-mother households are living below the poverty line. Among single-father households, those with no children have the highest poverty rate, with 36 households (29.3%) experiencing poverty. Likewise, among single-mother households, those with 3 or 4 children have the highest poverty rate, with 59 households (25.5%) falling below the poverty line.
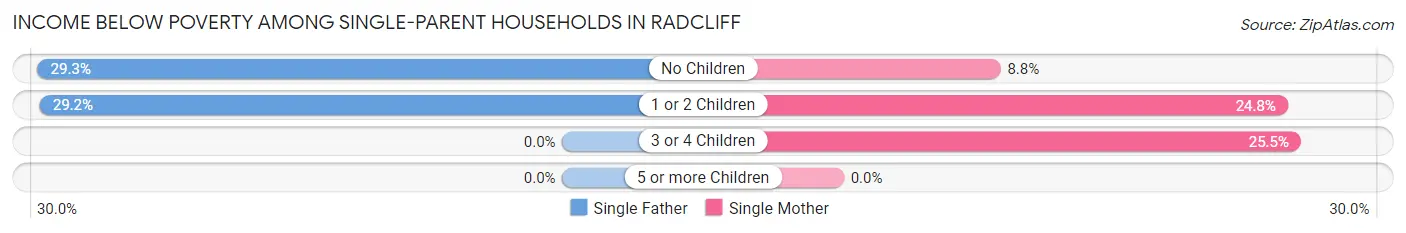
| Children | Single Father | Single Mother |
| No Children | 36 (29.3%) | 38 (8.8%) |
| 1 or 2 Children | 181 (29.1%) | 224 (24.8%) |
| 3 or 4 Children | 0 (0.0%) | 59 (25.5%) |
| 5 or more Children | 0 (0.0%) | 0 (0.0%) |
| Total | 217 (28.0%) | 321 (20.0%) |
Income Below Poverty Among Married-Couple vs Single-Parent Households in Radcliff
The poverty data for Radcliff shows that 120 of the married-couple family households (3.9%) and 538 of the single-parent households (22.6%) are living below the poverty level. Within the married-couple family households, those with 3 or 4 children have the highest poverty rate, with 44 households (15.7%) falling below the poverty line. Among the single-parent households, those with 1 or 2 children have the highest poverty rate, with 405 household (26.6%) living below poverty.
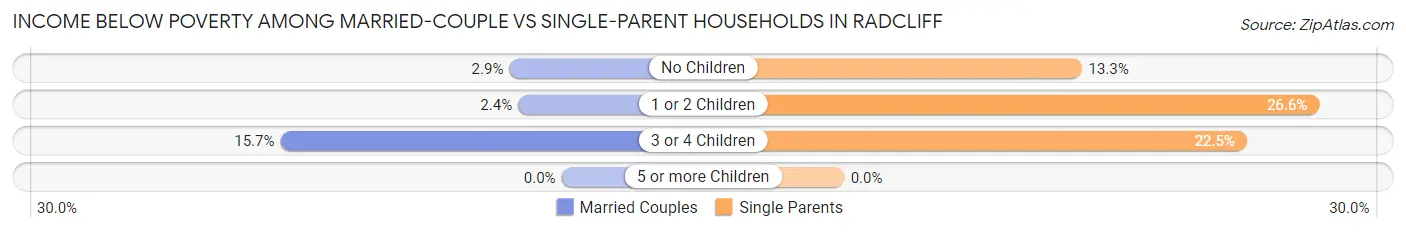
| Children | Married-Couple Families | Single-Parent Households |
| No Children | 54 (2.9%) | 74 (13.3%) |
| 1 or 2 Children | 22 (2.4%) | 405 (26.6%) |
| 3 or 4 Children | 44 (15.7%) | 59 (22.5%) |
| 5 or more Children | 0 (0.0%) | 0 (0.0%) |
| Total | 120 (3.9%) | 538 (22.6%) |
Race in Radcliff
The most populous races in Radcliff are White / Caucasian (13,038 | 56.7%), Black / African American (6,576 | 28.6%), and Two or more Races (1,982 | 8.6%).
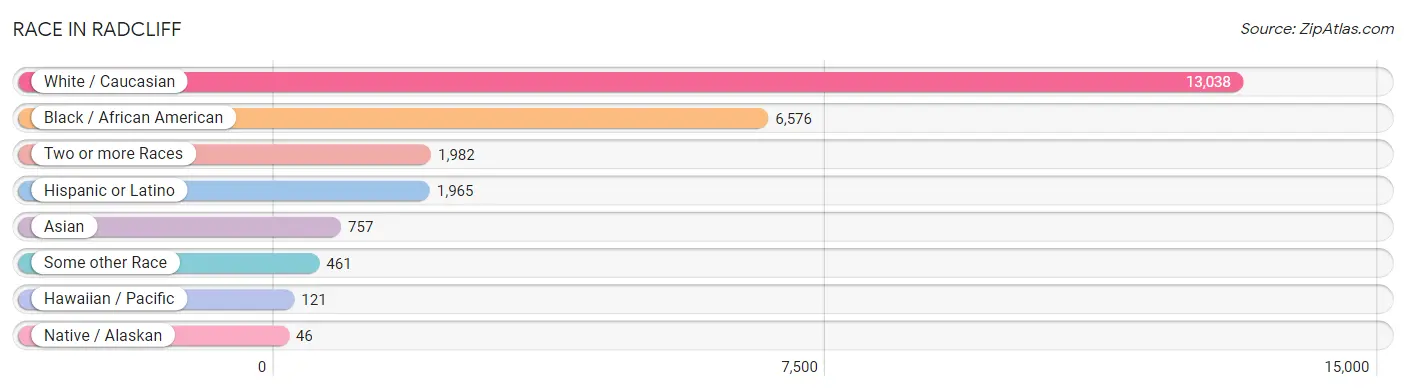
| Race | # Population | % Population |
| Asian | 757 | 3.3% |
| Black / African American | 6,576 | 28.6% |
| Hawaiian / Pacific | 121 | 0.5% |
| Hispanic or Latino | 1,965 | 8.6% |
| Native / Alaskan | 46 | 0.2% |
| White / Caucasian | 13,038 | 56.7% |
| Two or more Races | 1,982 | 8.6% |
| Some other Race | 461 | 2.0% |
| Total | 22,981 | 100.0% |
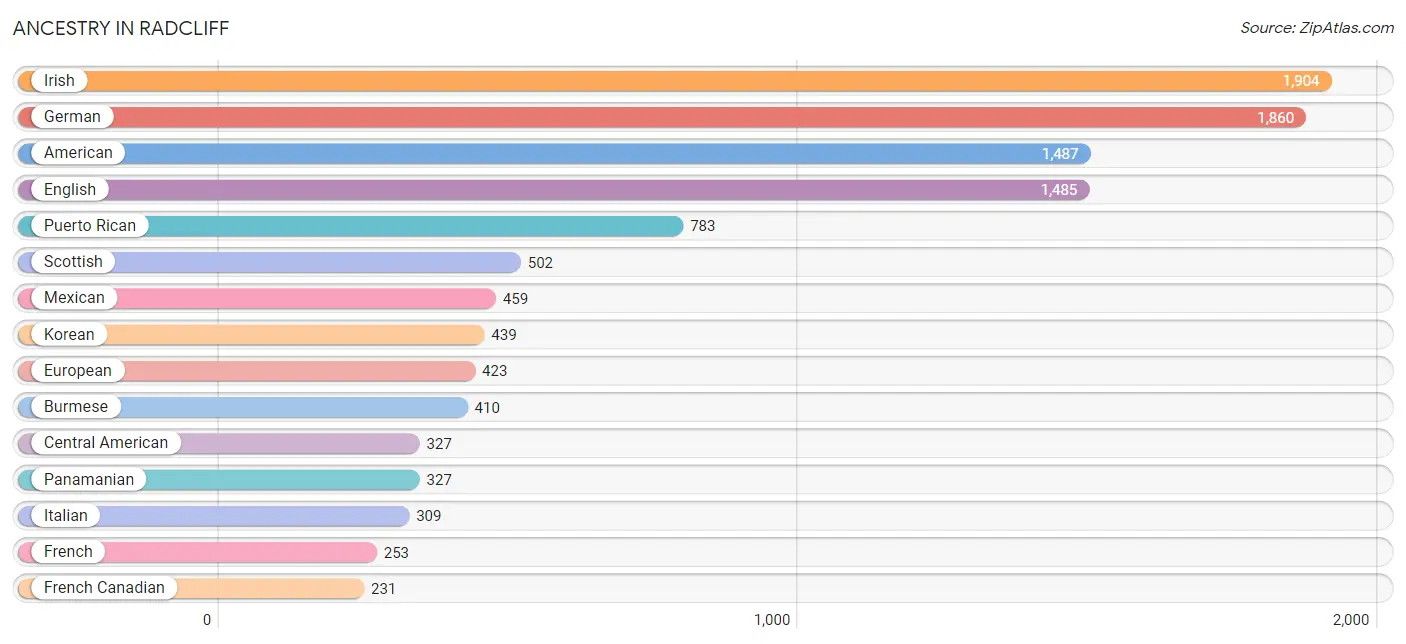
Ancestry in Radcliff
The most populous ancestries reported in Radcliff are Irish (1,904 | 8.3%), German (1,860 | 8.1%), American (1,487 | 6.5%), English (1,485 | 6.5%), and Puerto Rican (783 | 3.4%), together accounting for 32.7% of all Radcliff residents.
| Ancestry | # Population | % Population |
| African | 119 | 0.5% |
| American | 1,487 | 6.5% |
| Arab | 21 | 0.1% |
| Bhutanese | 169 | 0.7% |
| Blackfeet | 54 | 0.2% |
| British | 42 | 0.2% |
| British West Indian | 18 | 0.1% |
| Burmese | 410 | 1.8% |
| Cajun | 18 | 0.1% |
| Canadian | 25 | 0.1% |
| Central American | 327 | 1.4% |
| Central American Indian | 15 | 0.1% |
| Cherokee | 108 | 0.5% |
| Cheyenne | 1 | 0.0% |
| Chippewa | 4 | 0.0% |
| Colombian | 36 | 0.2% |
| Cuban | 69 | 0.3% |
| Czechoslovakian | 15 | 0.1% |
| Danish | 20 | 0.1% |
| Dominican | 60 | 0.3% |
| Dutch | 166 | 0.7% |
| Eastern European | 19 | 0.1% |
| English | 1,485 | 6.5% |
| European | 423 | 1.8% |
| French | 253 | 1.1% |
| French Canadian | 231 | 1.0% |
| German | 1,860 | 8.1% |
| Greek | 33 | 0.1% |
| Guamanian / Chamorro | 29 | 0.1% |
| Hungarian | 5 | 0.0% |
| Indian (Asian) | 58 | 0.3% |
| Irish | 1,904 | 8.3% |
| Italian | 309 | 1.3% |
| Korean | 439 | 1.9% |
| Lithuanian | 76 | 0.3% |
| Mexican | 459 | 2.0% |
| Mexican American Indian | 69 | 0.3% |
| Native Hawaiian | 31 | 0.1% |
| Norwegian | 60 | 0.3% |
| Pakistani | 6 | 0.0% |
| Panamanian | 327 | 1.4% |
| Pennsylvania German | 8 | 0.0% |
| Peruvian | 15 | 0.1% |
| Polish | 177 | 0.8% |
| Portuguese | 34 | 0.2% |
| Puerto Rican | 783 | 3.4% |
| Russian | 50 | 0.2% |
| Samoan | 2 | 0.0% |
| Scandinavian | 165 | 0.7% |
| Scotch-Irish | 78 | 0.3% |
| Scottish | 502 | 2.2% |
| Serbian | 16 | 0.1% |
| Slovak | 5 | 0.0% |
| South American | 68 | 0.3% |
| Spaniard | 128 | 0.6% |
| Spanish | 36 | 0.2% |
| Spanish American | 35 | 0.2% |
| Sri Lankan | 40 | 0.2% |
| Subsaharan African | 119 | 0.5% |
| Swedish | 26 | 0.1% |
| Swiss | 5 | 0.0% |
| Thai | 131 | 0.6% |
| Ukrainian | 29 | 0.1% |
| Venezuelan | 17 | 0.1% |
| Welsh | 57 | 0.3% |
| West Indian | 8 | 0.0% |
| Yugoslavian | 6 | 0.0% | View All 67 Rows |
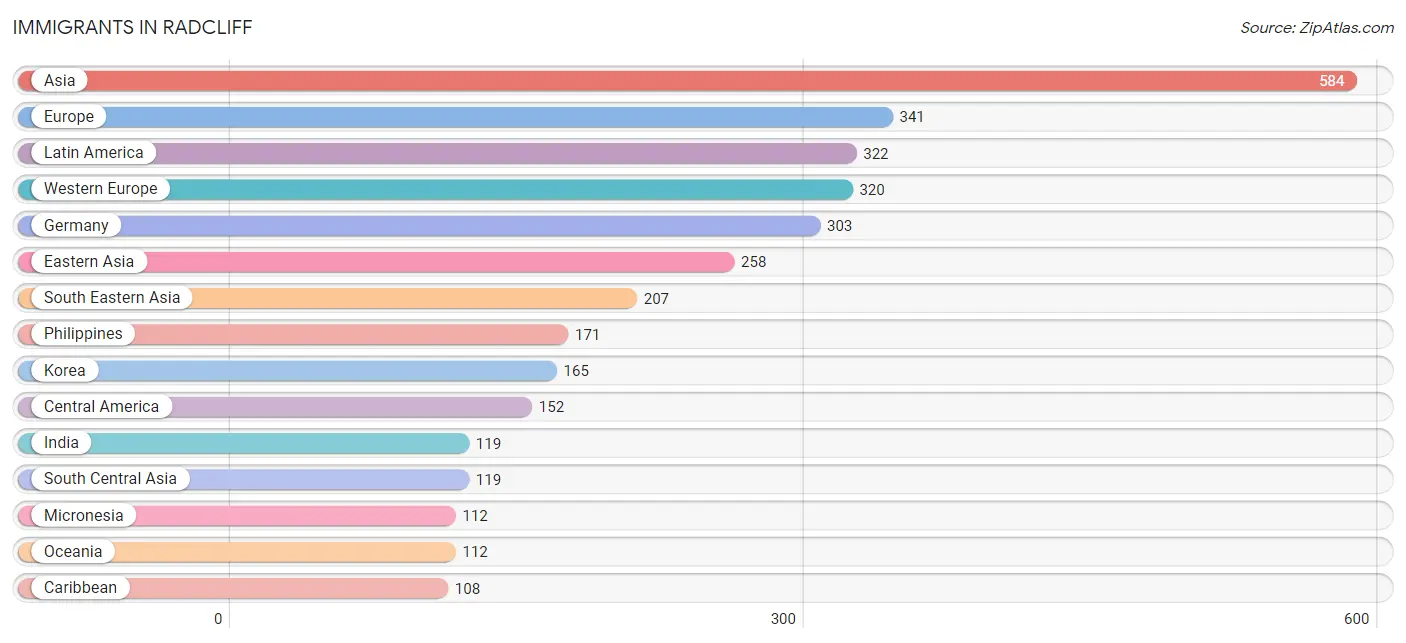
Immigrants in Radcliff
The most numerous immigrant groups reported in Radcliff came from Asia (584 | 2.5%), Europe (341 | 1.5%), Latin America (322 | 1.4%), Western Europe (320 | 1.4%), and Germany (303 | 1.3%), together accounting for 8.1% of all Radcliff residents.
| Immigration Origin | # Population | % Population |
| Asia | 584 | 2.5% |
| Austria | 3 | 0.0% |
| Canada | 10 | 0.0% |
| Caribbean | 108 | 0.5% |
| Central America | 152 | 0.7% |
| China | 60 | 0.3% |
| Colombia | 23 | 0.1% |
| Cuba | 40 | 0.2% |
| Dominican Republic | 37 | 0.2% |
| Eastern Asia | 258 | 1.1% |
| Eastern Europe | 17 | 0.1% |
| Europe | 341 | 1.5% |
| France | 14 | 0.1% |
| Germany | 303 | 1.3% |
| India | 119 | 0.5% |
| Jamaica | 10 | 0.0% |
| Japan | 33 | 0.1% |
| Korea | 165 | 0.7% |
| Latin America | 322 | 1.4% |
| Mexico | 98 | 0.4% |
| Micronesia | 112 | 0.5% |
| Northern Europe | 4 | 0.0% |
| Oceania | 112 | 0.5% |
| Panama | 54 | 0.2% |
| Peru | 15 | 0.1% |
| Philippines | 171 | 0.7% |
| Scotland | 4 | 0.0% |
| South America | 62 | 0.3% |
| South Central Asia | 119 | 0.5% |
| South Eastern Asia | 207 | 0.9% |
| Thailand | 6 | 0.0% |
| Trinidad and Tobago | 21 | 0.1% |
| Ukraine | 11 | 0.1% |
| Venezuela | 24 | 0.1% |
| Vietnam | 30 | 0.1% |
| Western Europe | 320 | 1.4% | View All 36 Rows |
Sex and Age in Radcliff
Sex and Age in Radcliff
The most populous age groups in Radcliff are 25 to 29 Years (1,116 | 10.2%) for men and Under 5 Years (964 | 8.0%) for women.
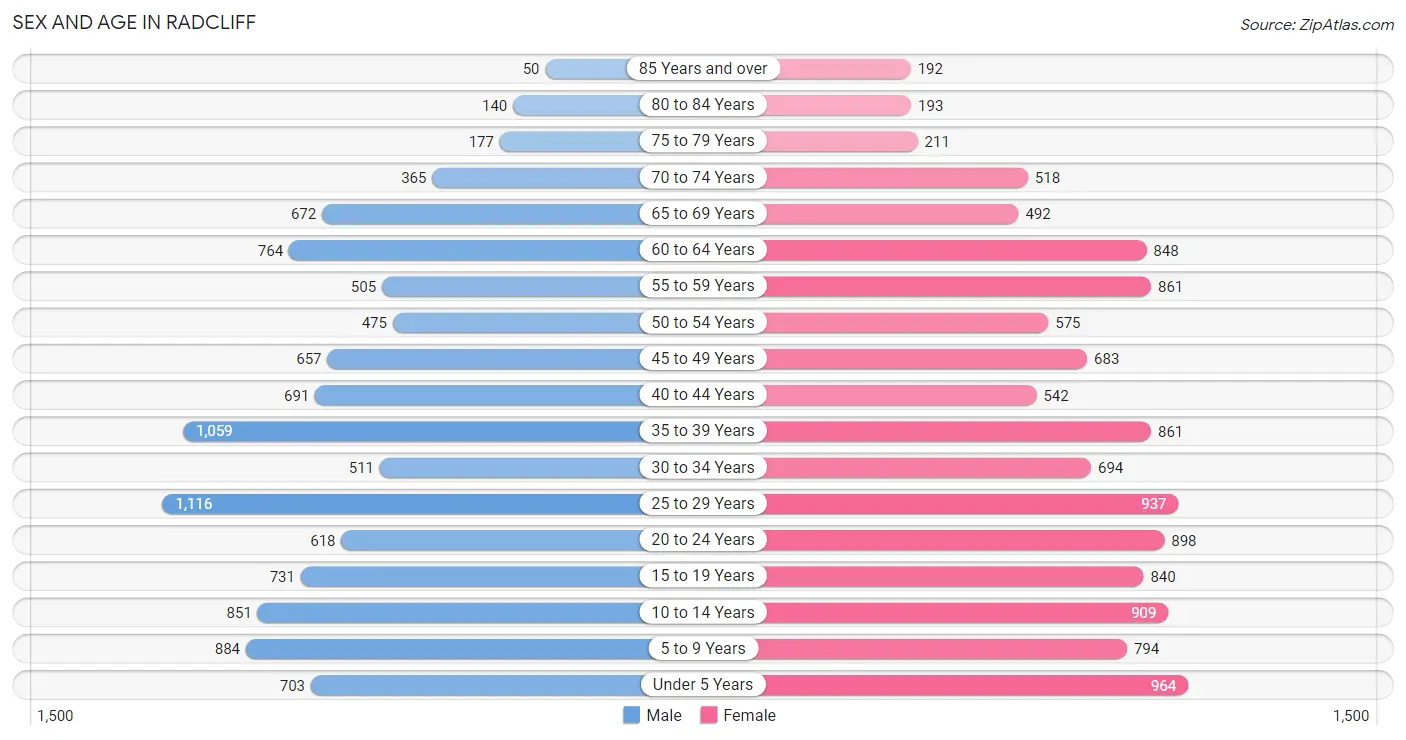
| Age Bracket | Male | Female |
| Under 5 Years | 703 (6.4%) | 964 (8.0%) |
| 5 to 9 Years | 884 (8.1%) | 794 (6.6%) |
| 10 to 14 Years | 851 (7.8%) | 909 (7.6%) |
| 15 to 19 Years | 731 (6.7%) | 840 (7.0%) |
| 20 to 24 Years | 618 (5.6%) | 898 (7.5%) |
| 25 to 29 Years | 1,116 (10.2%) | 937 (7.8%) |
| 30 to 34 Years | 511 (4.7%) | 694 (5.8%) |
| 35 to 39 Years | 1,059 (9.7%) | 861 (7.2%) |
| 40 to 44 Years | 691 (6.3%) | 542 (4.5%) |
| 45 to 49 Years | 657 (6.0%) | 683 (5.7%) |
| 50 to 54 Years | 475 (4.3%) | 575 (4.8%) |
| 55 to 59 Years | 505 (4.6%) | 861 (7.2%) |
| 60 to 64 Years | 764 (7.0%) | 848 (7.1%) |
| 65 to 69 Years | 672 (6.1%) | 492 (4.1%) |
| 70 to 74 Years | 365 (3.3%) | 518 (4.3%) |
| 75 to 79 Years | 177 (1.6%) | 211 (1.8%) |
| 80 to 84 Years | 140 (1.3%) | 193 (1.6%) |
| 85 Years and over | 50 (0.5%) | 192 (1.6%) |
| Total | 10,969 (100.0%) | 12,012 (100.0%) |
Families and Households in Radcliff
Median Family Size in Radcliff
The median family size in Radcliff is 3.17 persons per family, with married-couple families (3,057 | 56.2%) accounting for the largest median family size of 3.27 persons per family. On the other hand, single male/father families (775 | 14.2%) represent the smallest median family size with 2.84 persons per family.
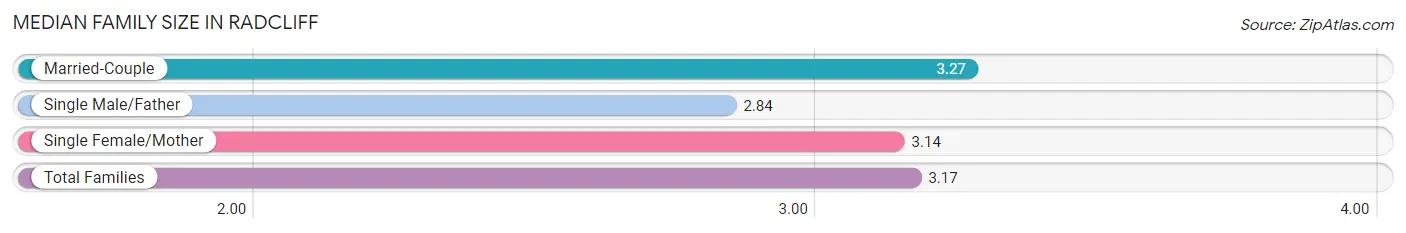
| Family Type | # Families | Family Size |
| Married-Couple | 3,057 (56.2%) | 3.27 |
| Single Male/Father | 775 (14.2%) | 2.84 |
| Single Female/Mother | 1,607 (29.5%) | 3.14 |
| Total Families | 5,439 (100.0%) | 3.17 |
Median Household Size in Radcliff
The median household size in Radcliff is 2.58 persons per household, with single female/mother households (1,607 | 18.2%) accounting for the largest median household size of 3.55 persons per household. non-family households (3,408 | 38.5%) represent the smallest median household size with 1.26 persons per household.
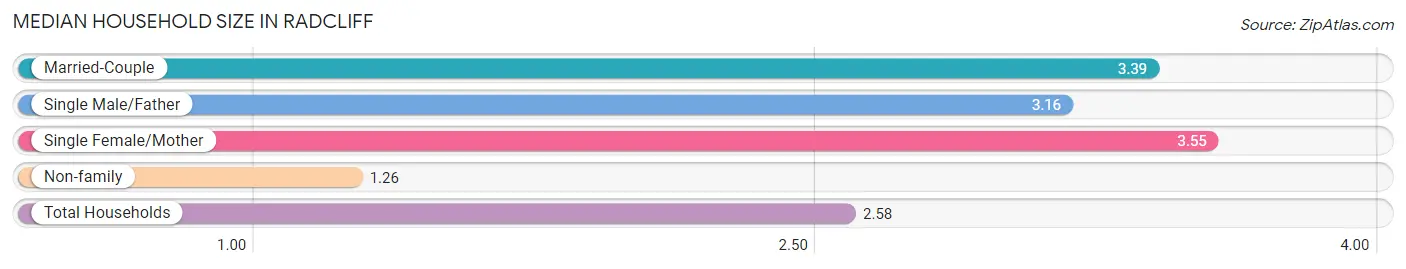
| Household Type | # Households | Household Size |
| Married-Couple | 3,057 (34.5%) | 3.39 |
| Single Male/Father | 775 (8.8%) | 3.16 |
| Single Female/Mother | 1,607 (18.2%) | 3.55 |
| Non-family | 3,408 (38.5%) | 1.26 |
| Total Households | 8,847 (100.0%) | 2.58 |
Household Size by Marriage Status in Radcliff
Out of a total of 8,847 households in Radcliff, 5,439 (61.5%) are family households, while 3,408 (38.5%) are nonfamily households. The most numerous type of family households are 2-person households, comprising 2,258, and the most common type of nonfamily households are 1-person households, comprising 2,810.
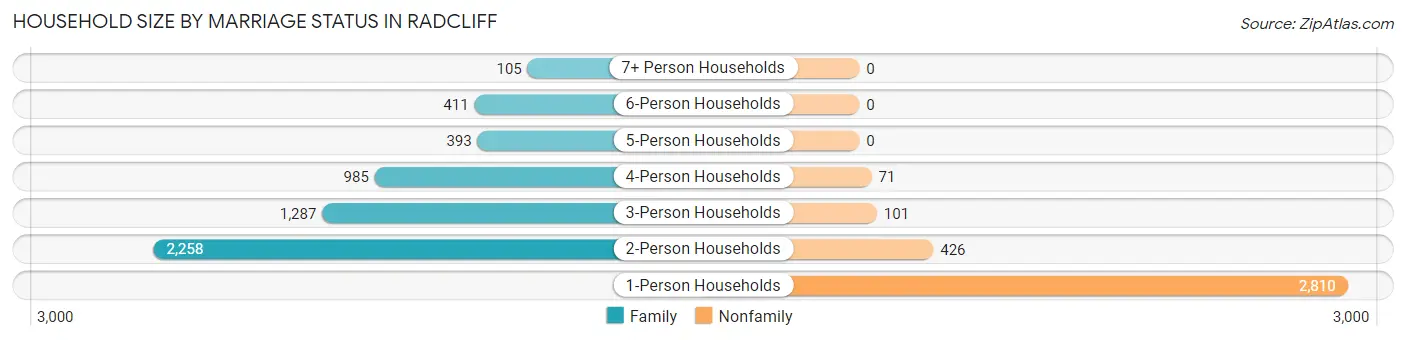
| Household Size | Family Households | Nonfamily Households |
| 1-Person Households | - | 2,810 (31.8%) |
| 2-Person Households | 2,258 (25.5%) | 426 (4.8%) |
| 3-Person Households | 1,287 (14.5%) | 101 (1.1%) |
| 4-Person Households | 985 (11.1%) | 71 (0.8%) |
| 5-Person Households | 393 (4.4%) | 0 (0.0%) |
| 6-Person Households | 411 (4.6%) | 0 (0.0%) |
| 7+ Person Households | 105 (1.2%) | 0 (0.0%) |
| Total | 5,439 (61.5%) | 3,408 (38.5%) |
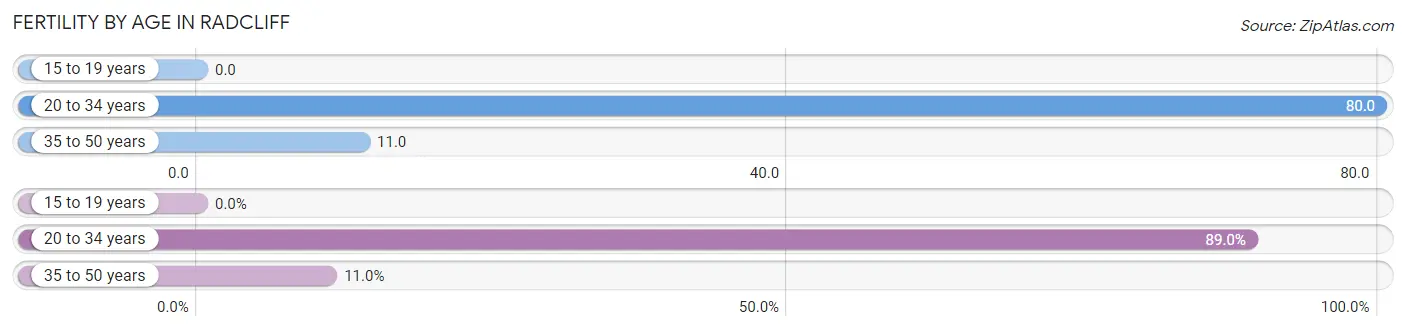
Female Fertility in Radcliff
Fertility by Age in Radcliff
Average fertility rate in Radcliff is 41.0 births per 1,000 women. Women in the age bracket of 20 to 34 years have the highest fertility rate with 80.0 births per 1,000 women. Women in the age bracket of 20 to 34 years acount for 89.0% of all women with births.
| Age Bracket | Women with Births | Births / 1,000 Women |
| 15 to 19 years | 0 (0.0%) | 0.0 |
| 20 to 34 years | 203 (89.0%) | 80.0 |
| 35 to 50 years | 25 (11.0%) | 11.0 |
| Total | 228 (100.0%) | 41.0 |
Fertility by Age by Marriage Status in Radcliff
63.2% of women with births (228) in Radcliff are married. The highest percentage of unmarried women with births falls into 35 to 50 years age bracket with 100.0% of them unmarried at the time of birth, while the lowest percentage of unmarried women with births belong to 20 to 34 years age bracket with 29.1% of them unmarried.
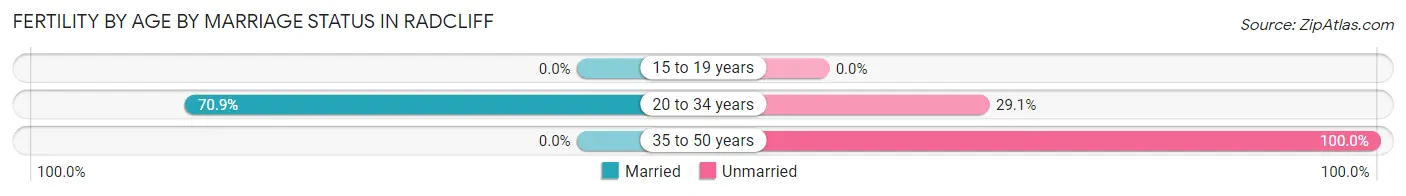
| Age Bracket | Married | Unmarried |
| 15 to 19 years | 0 (0.0%) | 0 (0.0%) |
| 20 to 34 years | 144 (70.9%) | 59 (29.1%) |
| 35 to 50 years | 0 (0.0%) | 25 (100.0%) |
| Total | 144 (63.2%) | 84 (36.8%) |
Fertility by Education in Radcliff
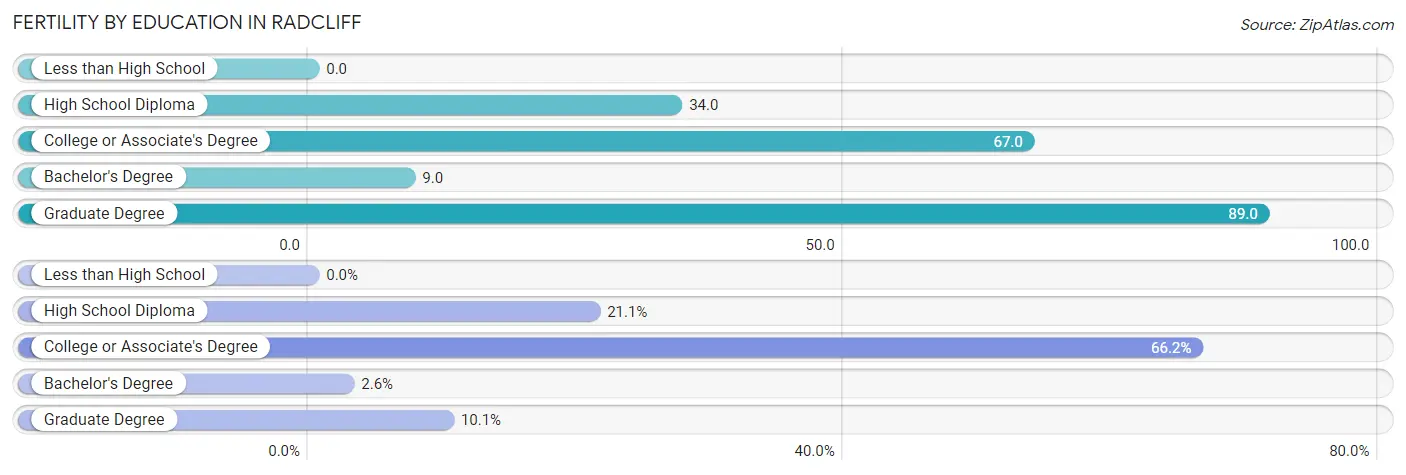
| Educational Attainment | Women with Births | Births / 1,000 Women |
| Less than High School | 0 (0.0%) | 0.0 |
| High School Diploma | 48 (21.0%) | 34.0 |
| College or Associate's Degree | 151 (66.2%) | 67.0 |
| Bachelor's Degree | 6 (2.6%) | 9.0 |
| Graduate Degree | 23 (10.1%) | 89.0 |
| Total | 228 (100.0%) | 41.0 |
Fertility by Education by Marriage Status in Radcliff
36.8% of women with births in Radcliff are unmarried. Women with the educational attainment of bachelor's degree are most likely to be married with 100.0% of them married at childbirth, while women with the educational attainment of graduate degree are least likely to be married with 100.0% of them unmarried at childbirth.
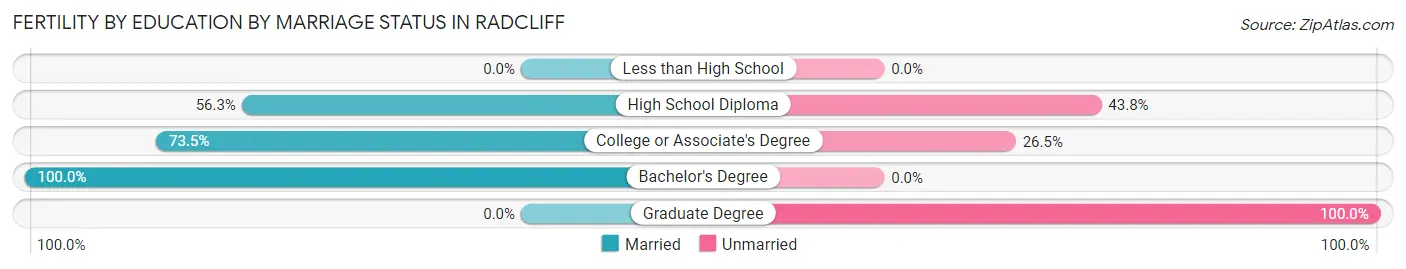
| Educational Attainment | Married | Unmarried |
| Less than High School | 0 (0.0%) | 0 (0.0%) |
| High School Diploma | 27 (56.2%) | 21 (43.8%) |
| College or Associate's Degree | 111 (73.5%) | 40 (26.5%) |
| Bachelor's Degree | 6 (100.0%) | 0 (0.0%) |
| Graduate Degree | 0 (0.0%) | 23 (100.0%) |
| Total | 144 (63.2%) | 84 (36.8%) |
Employment Characteristics in Radcliff
Employment by Class of Employer in Radcliff
Among the 9,762 employed individuals in Radcliff, private company employees (6,796 | 69.6%), federal government employees (1,486 | 15.2%), and not-for-profit organizations (462 | 4.7%) make up the most common classes of employment.
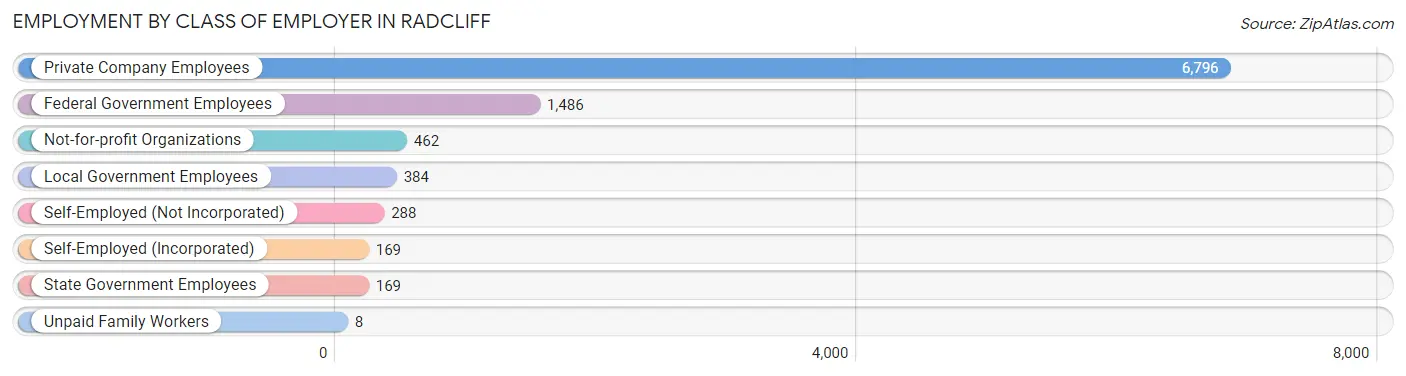
| Employer Class | # Employees | % Employees |
| Private Company Employees | 6,796 | 69.6% |
| Self-Employed (Incorporated) | 169 | 1.7% |
| Self-Employed (Not Incorporated) | 288 | 2.9% |
| Not-for-profit Organizations | 462 | 4.7% |
| Local Government Employees | 384 | 3.9% |
| State Government Employees | 169 | 1.7% |
| Federal Government Employees | 1,486 | 15.2% |
| Unpaid Family Workers | 8 | 0.1% |
| Total | 9,762 | 100.0% |
Employment Status by Age in Radcliff
According to the labor force statistics for Radcliff, out of the total population over 16 years of age (17,599), 63.1% or 11,105 individuals are in the labor force, with 9.1% or 1,011 of them unemployed. The age group with the highest labor force participation rate is 35 to 44 years, with 81.9% or 2,582 individuals in the labor force. Within the labor force, the 16 to 19 years age range has the highest percentage of unemployed individuals, with 27.8% or 212 of them being unemployed.
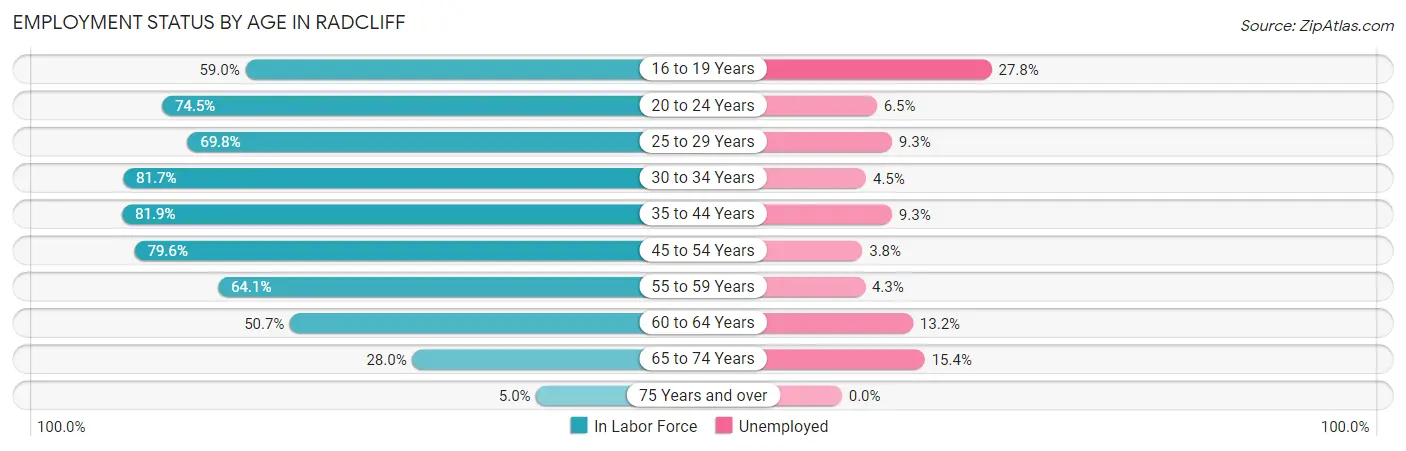
| Age Bracket | In Labor Force | Unemployed |
| 16 to 19 Years | 763 (59.0%) | 212 (27.8%) |
| 20 to 24 Years | 1,129 (74.5%) | 73 (6.5%) |
| 25 to 29 Years | 1,433 (69.8%) | 133 (9.3%) |
| 30 to 34 Years | 984 (81.7%) | 44 (4.5%) |
| 35 to 44 Years | 2,582 (81.9%) | 240 (9.3%) |
| 45 to 54 Years | 1,902 (79.6%) | 72 (3.8%) |
| 55 to 59 Years | 876 (64.1%) | 38 (4.3%) |
| 60 to 64 Years | 817 (50.7%) | 108 (13.2%) |
| 65 to 74 Years | 573 (28.0%) | 88 (15.4%) |
| 75 Years and over | 48 (5.0%) | 0 (0.0%) |
| Total | 11,105 (63.1%) | 1,011 (9.1%) |
Employment Status by Educational Attainment in Radcliff
According to labor force statistics for Radcliff, 73.0% of individuals (8,599) out of the total population between 25 and 64 years of age (11,779) are in the labor force, with 7.3% or 628 of them being unemployed. The group with the highest labor force participation rate are those with the educational attainment of bachelor's degree or higher, with 87.8% or 1,586 individuals in the labor force. Within the labor force, individuals with less than high school education have the highest percentage of unemployment, with 41.7% or 285 of them being unemployed.
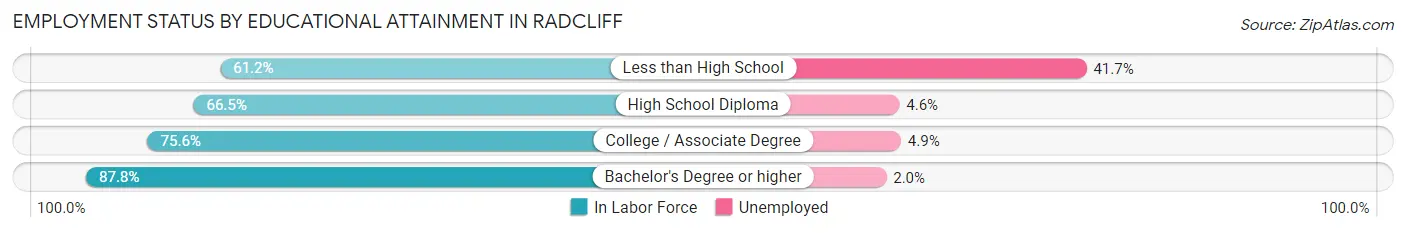
| Educational Attainment | In Labor Force | Unemployed |
| Less than High School | 683 (61.2%) | 465 (41.7%) |
| High School Diploma | 2,693 (66.5%) | 186 (4.6%) |
| College / Associate Degree | 3,635 (75.6%) | 236 (4.9%) |
| Bachelor's Degree or higher | 1,586 (87.8%) | 36 (2.0%) |
| Total | 8,599 (73.0%) | 860 (7.3%) |
Employment Occupations by Sex in Radcliff
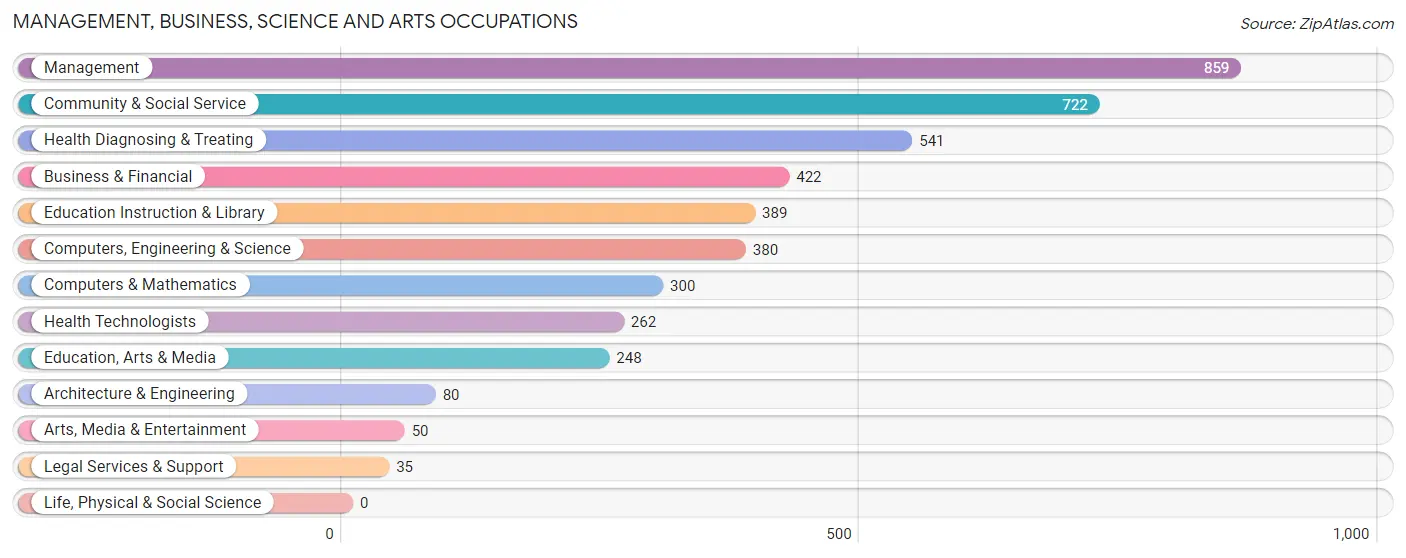
Management, Business, Science and Arts Occupations
The most common Management, Business, Science and Arts occupations in Radcliff are Management (859 | 8.9%), Community & Social Service (722 | 7.5%), Health Diagnosing & Treating (541 | 5.6%), Business & Financial (422 | 4.4%), and Education Instruction & Library (389 | 4.0%).
Management, Business, Science and Arts Occupations by Sex
Within the Management, Business, Science and Arts occupations in Radcliff, the most male-oriented occupations are Computers & Mathematics (81.3%), Computers, Engineering & Science (79.7%), and Architecture & Engineering (73.8%), while the most female-oriented occupations are Education, Arts & Media (93.1%), Health Technologists (90.1%), and Health Diagnosing & Treating (88.2%).
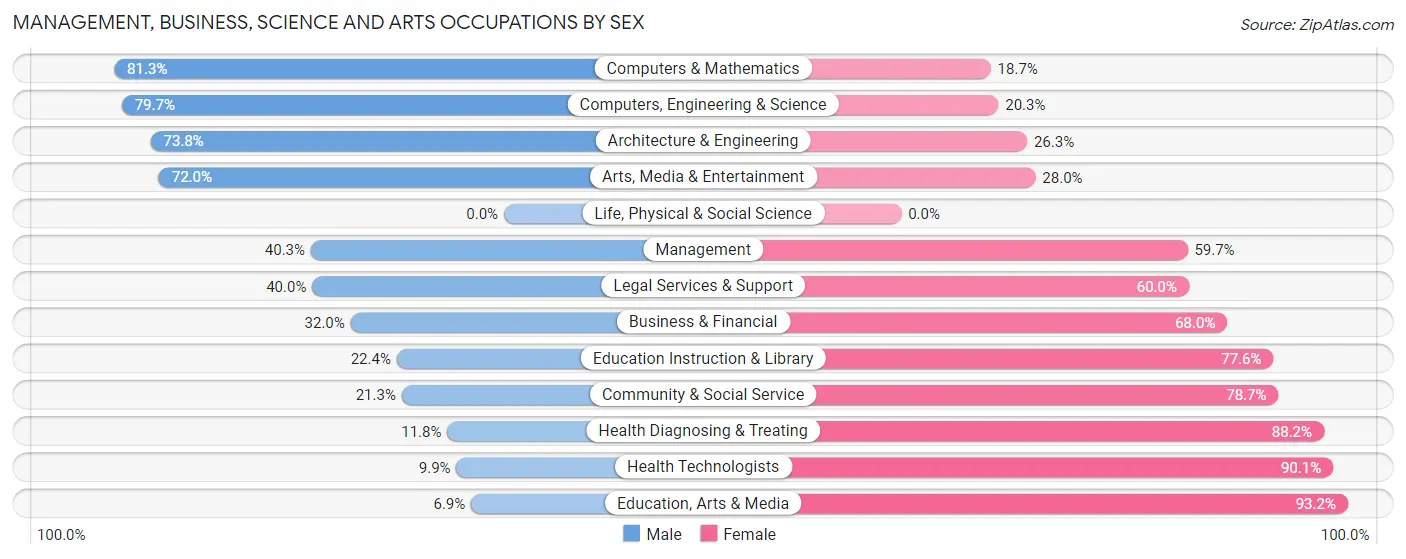
| Occupation | Male | Female |
| Management | 346 (40.3%) | 513 (59.7%) |
| Business & Financial | 135 (32.0%) | 287 (68.0%) |
| Computers, Engineering & Science | 303 (79.7%) | 77 (20.3%) |
| Computers & Mathematics | 244 (81.3%) | 56 (18.7%) |
| Architecture & Engineering | 59 (73.8%) | 21 (26.3%) |
| Life, Physical & Social Science | 0 (0.0%) | 0 (0.0%) |
| Community & Social Service | 154 (21.3%) | 568 (78.7%) |
| Education, Arts & Media | 17 (6.9%) | 231 (93.1%) |
| Legal Services & Support | 14 (40.0%) | 21 (60.0%) |
| Education Instruction & Library | 87 (22.4%) | 302 (77.6%) |
| Arts, Media & Entertainment | 36 (72.0%) | 14 (28.0%) |
| Health Diagnosing & Treating | 64 (11.8%) | 477 (88.2%) |
| Health Technologists | 26 (9.9%) | 236 (90.1%) |
| Total (Category) | 1,002 (34.3%) | 1,922 (65.7%) |
| Total (Overall) | 4,736 (49.0%) | 4,927 (51.0%) |
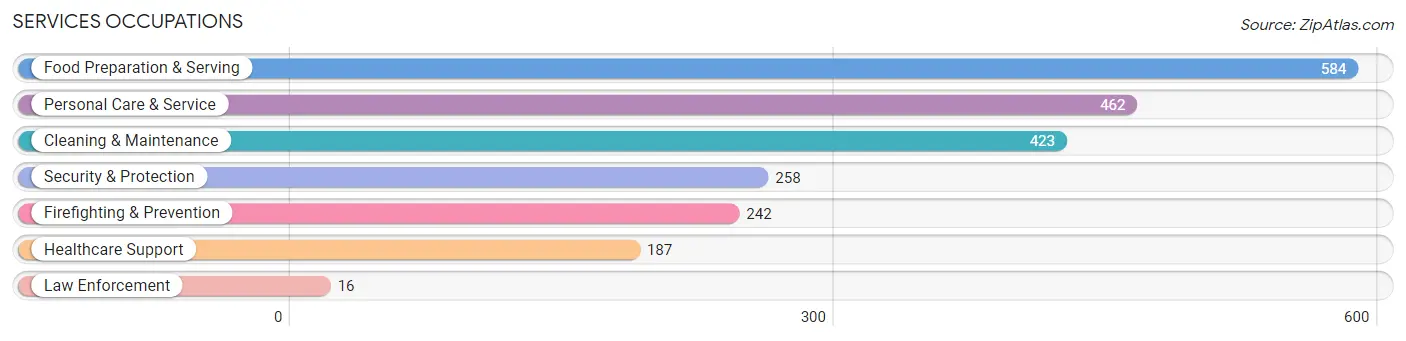
Services Occupations
The most common Services occupations in Radcliff are Food Preparation & Serving (584 | 6.0%), Personal Care & Service (462 | 4.8%), Cleaning & Maintenance (423 | 4.4%), Security & Protection (258 | 2.7%), and Firefighting & Prevention (242 | 2.5%).
Services Occupations by Sex
Within the Services occupations in Radcliff, the most male-oriented occupations are Law Enforcement (100.0%), Security & Protection (94.6%), and Firefighting & Prevention (94.2%), while the most female-oriented occupations are Healthcare Support (81.8%), Food Preparation & Serving (68.0%), and Personal Care & Service (46.1%).
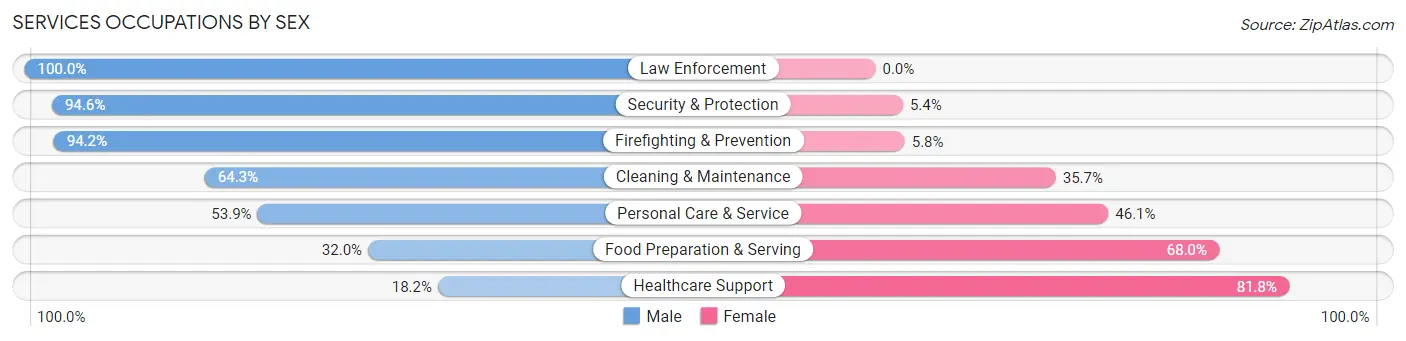
| Occupation | Male | Female |
| Healthcare Support | 34 (18.2%) | 153 (81.8%) |
| Security & Protection | 244 (94.6%) | 14 (5.4%) |
| Firefighting & Prevention | 228 (94.2%) | 14 (5.8%) |
| Law Enforcement | 16 (100.0%) | 0 (0.0%) |
| Food Preparation & Serving | 187 (32.0%) | 397 (68.0%) |
| Cleaning & Maintenance | 272 (64.3%) | 151 (35.7%) |
| Personal Care & Service | 249 (53.9%) | 213 (46.1%) |
| Total (Category) | 986 (51.5%) | 928 (48.5%) |
| Total (Overall) | 4,736 (49.0%) | 4,927 (51.0%) |
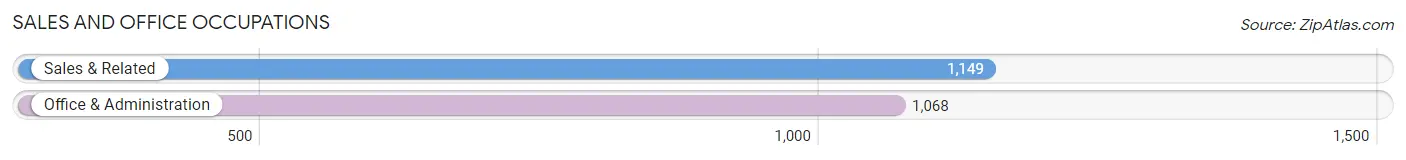
Sales and Office Occupations
The most common Sales and Office occupations in Radcliff are Sales & Related (1,149 | 11.9%), and Office & Administration (1,068 | 11.1%).
Sales and Office Occupations by Sex
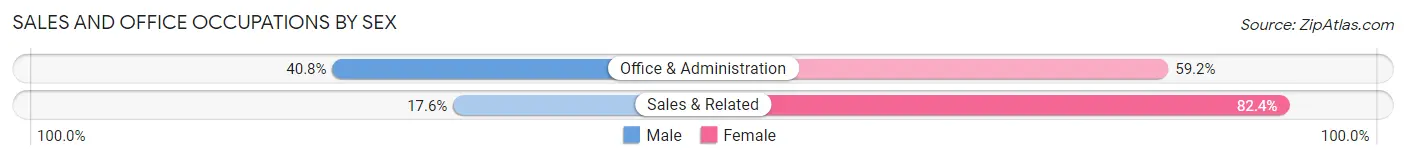
| Occupation | Male | Female |
| Sales & Related | 202 (17.6%) | 947 (82.4%) |
| Office & Administration | 436 (40.8%) | 632 (59.2%) |
| Total (Category) | 638 (28.8%) | 1,579 (71.2%) |
| Total (Overall) | 4,736 (49.0%) | 4,927 (51.0%) |
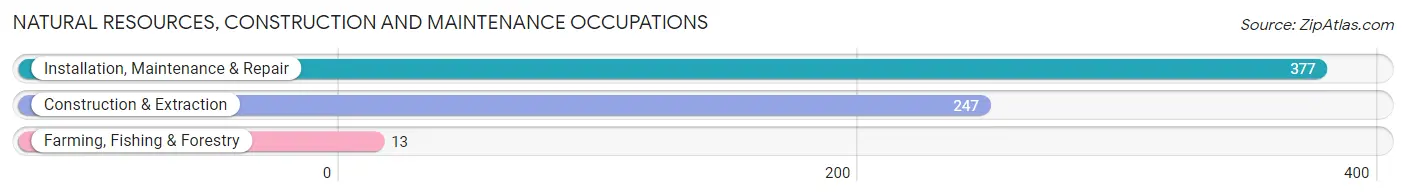
Natural Resources, Construction and Maintenance Occupations
The most common Natural Resources, Construction and Maintenance occupations in Radcliff are Installation, Maintenance & Repair (377 | 3.9%), Construction & Extraction (247 | 2.6%), and Farming, Fishing & Forestry (13 | 0.1%).
Natural Resources, Construction and Maintenance Occupations by Sex
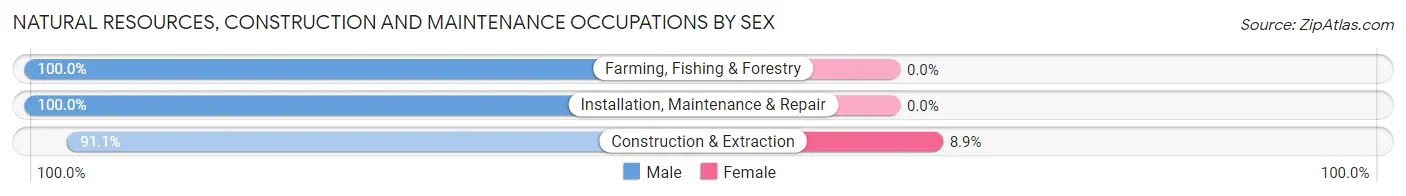
| Occupation | Male | Female |
| Farming, Fishing & Forestry | 13 (100.0%) | 0 (0.0%) |
| Construction & Extraction | 225 (91.1%) | 22 (8.9%) |
| Installation, Maintenance & Repair | 377 (100.0%) | 0 (0.0%) |
| Total (Category) | 615 (96.6%) | 22 (3.5%) |
| Total (Overall) | 4,736 (49.0%) | 4,927 (51.0%) |
Production, Transportation and Moving Occupations
The most common Production, Transportation and Moving occupations in Radcliff are Production (929 | 9.6%), Material Moving (706 | 7.3%), and Transportation (336 | 3.5%).
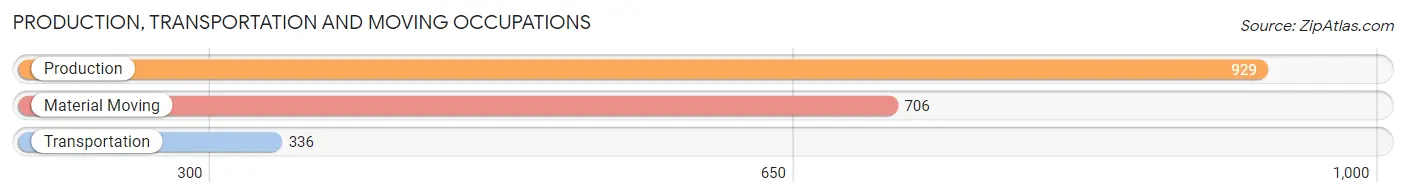
Production, Transportation and Moving Occupations by Sex
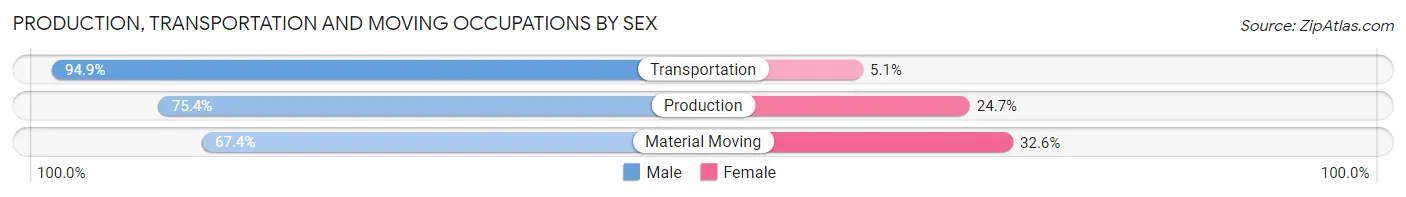
| Occupation | Male | Female |
| Production | 700 (75.3%) | 229 (24.6%) |
| Transportation | 319 (94.9%) | 17 (5.1%) |
| Material Moving | 476 (67.4%) | 230 (32.6%) |
| Total (Category) | 1,495 (75.8%) | 476 (24.1%) |
| Total (Overall) | 4,736 (49.0%) | 4,927 (51.0%) |
Employment Industries by Sex in Radcliff
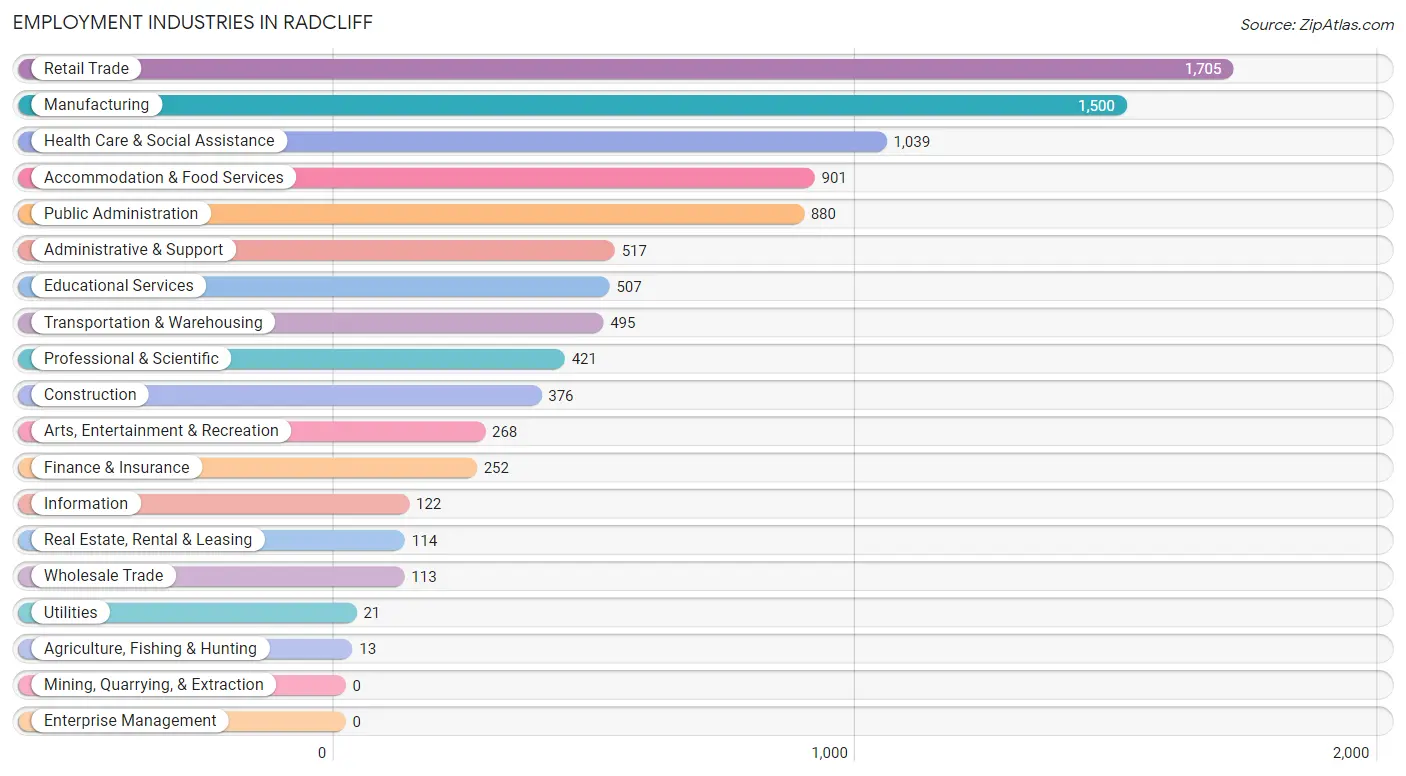
Employment Industries in Radcliff
The major employment industries in Radcliff include Retail Trade (1,705 | 17.6%), Manufacturing (1,500 | 15.5%), Health Care & Social Assistance (1,039 | 10.7%), Accommodation & Food Services (901 | 9.3%), and Public Administration (880 | 9.1%).
Employment Industries by Sex in Radcliff
The Radcliff industries that see more men than women are Agriculture, Fishing & Hunting (100.0%), Utilities (100.0%), and Construction (94.2%), whereas the industries that tend to have a higher number of women are Health Care & Social Assistance (88.3%), Finance & Insurance (88.1%), and Educational Services (73.8%).
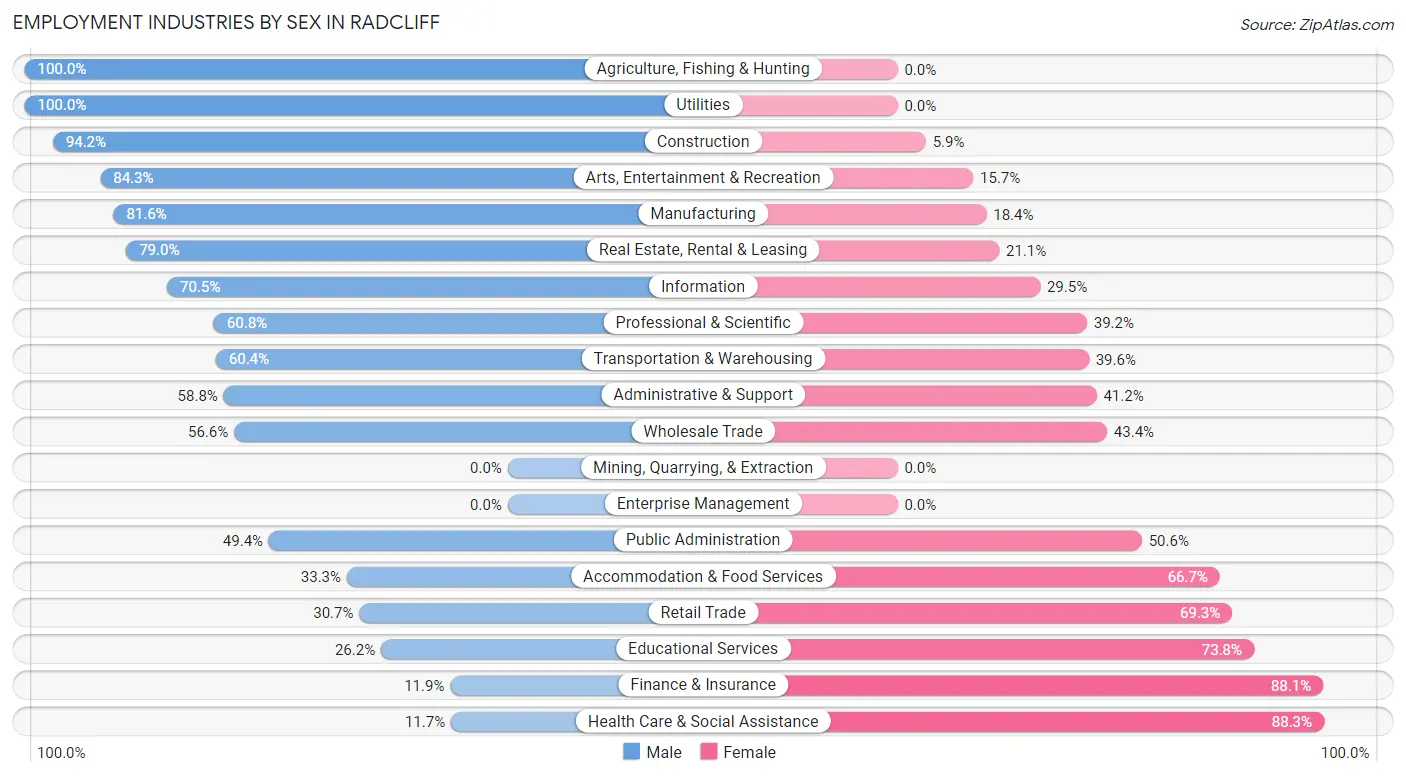
| Industry | Male | Female |
| Agriculture, Fishing & Hunting | 13 (100.0%) | 0 (0.0%) |
| Mining, Quarrying, & Extraction | 0 (0.0%) | 0 (0.0%) |
| Construction | 354 (94.2%) | 22 (5.9%) |
| Manufacturing | 1,224 (81.6%) | 276 (18.4%) |
| Wholesale Trade | 64 (56.6%) | 49 (43.4%) |
| Retail Trade | 524 (30.7%) | 1,181 (69.3%) |
| Transportation & Warehousing | 299 (60.4%) | 196 (39.6%) |
| Utilities | 21 (100.0%) | 0 (0.0%) |
| Information | 86 (70.5%) | 36 (29.5%) |
| Finance & Insurance | 30 (11.9%) | 222 (88.1%) |
| Real Estate, Rental & Leasing | 90 (78.9%) | 24 (21.0%) |
| Professional & Scientific | 256 (60.8%) | 165 (39.2%) |
| Enterprise Management | 0 (0.0%) | 0 (0.0%) |
| Administrative & Support | 304 (58.8%) | 213 (41.2%) |
| Educational Services | 133 (26.2%) | 374 (73.8%) |
| Health Care & Social Assistance | 122 (11.7%) | 917 (88.3%) |
| Arts, Entertainment & Recreation | 226 (84.3%) | 42 (15.7%) |
| Accommodation & Food Services | 300 (33.3%) | 601 (66.7%) |
| Public Administration | 435 (49.4%) | 445 (50.6%) |
| Total | 4,736 (49.0%) | 4,927 (51.0%) |
Education in Radcliff
School Enrollment in Radcliff
The most common levels of schooling among the 5,883 students in Radcliff are high school (1,434 | 24.4%), middle school (1,423 | 24.2%), and elementary school (1,087 | 18.5%).
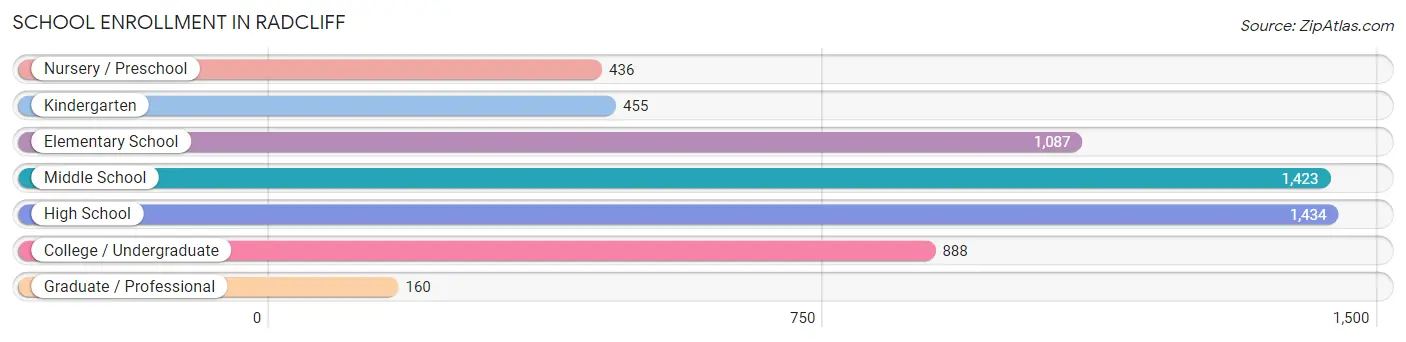
| School Level | # Students | % Students |
| Nursery / Preschool | 436 | 7.4% |
| Kindergarten | 455 | 7.7% |
| Elementary School | 1,087 | 18.5% |
| Middle School | 1,423 | 24.2% |
| High School | 1,434 | 24.4% |
| College / Undergraduate | 888 | 15.1% |
| Graduate / Professional | 160 | 2.7% |
| Total | 5,883 | 100.0% |
School Enrollment by Age by Funding Source in Radcliff
Out of a total of 5,883 students who are enrolled in schools in Radcliff, 382 (6.5%) attend a private institution, while the remaining 5,501 (93.5%) are enrolled in public schools. The age group of 25 to 34 year olds has the highest likelihood of being enrolled in private schools, with 38 (17.9% in the age bracket) enrolled. Conversely, the age group of 18 to 19 year olds has the lowest likelihood of being enrolled in a private school, with 375 (100.0% in the age bracket) attending a public institution.
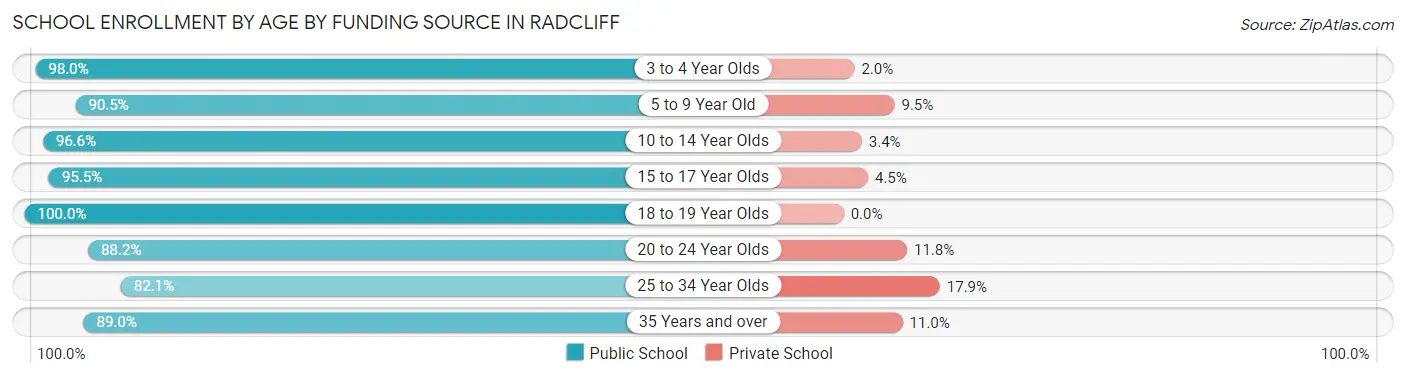
| Age Bracket | Public School | Private School |
| 3 to 4 Year Olds | 292 (98.0%) | 6 (2.0%) |
| 5 to 9 Year Old | 1,489 (90.5%) | 156 (9.5%) |
| 10 to 14 Year Olds | 1,623 (96.6%) | 57 (3.4%) |
| 15 to 17 Year Olds | 928 (95.5%) | 44 (4.5%) |
| 18 to 19 Year Olds | 375 (100.0%) | 0 (0.0%) |
| 20 to 24 Year Olds | 321 (88.2%) | 43 (11.8%) |
| 25 to 34 Year Olds | 174 (82.1%) | 38 (17.9%) |
| 35 Years and over | 300 (89.0%) | 37 (11.0%) |
| Total | 5,501 (93.5%) | 382 (6.5%) |
Educational Attainment by Field of Study in Radcliff
Business (653 | 27.3%), education (398 | 16.6%), liberal arts & history (200 | 8.4%), engineering (178 | 7.4%), and arts & humanities (163 | 6.8%) are the most common fields of study among 2,396 individuals in Radcliff who have obtained a bachelor's degree or higher.
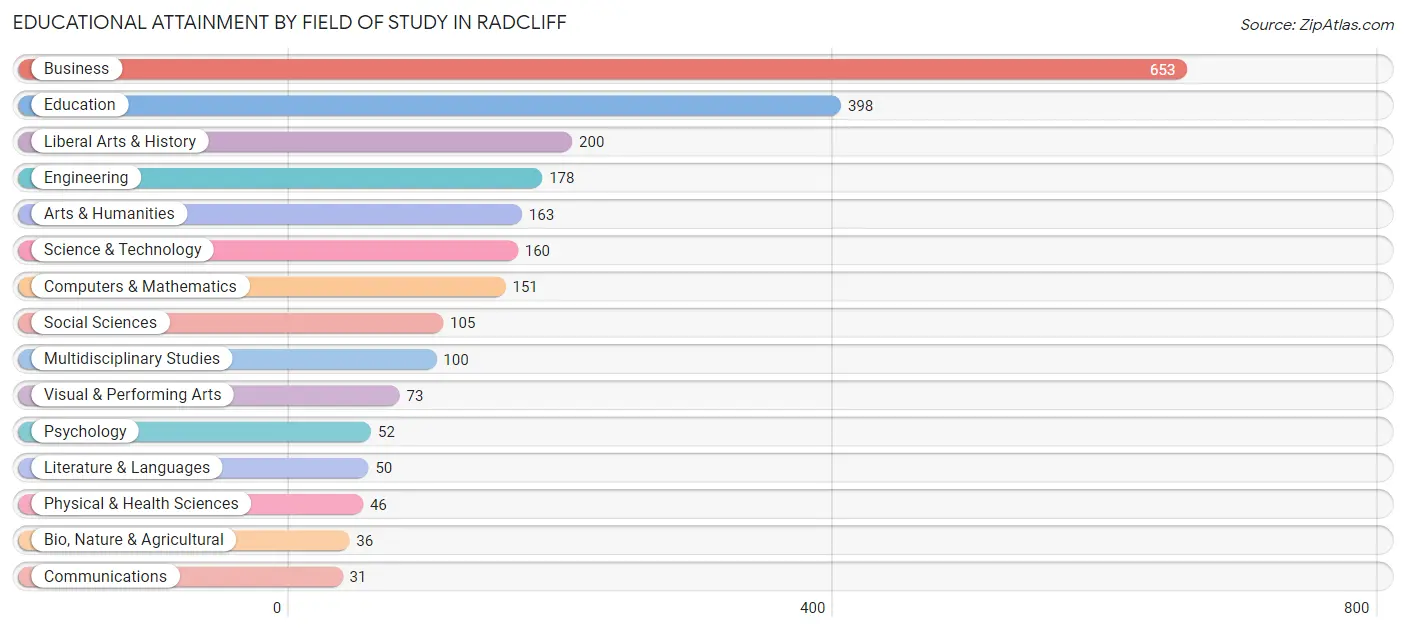
| Field of Study | # Graduates | % Graduates |
| Computers & Mathematics | 151 | 6.3% |
| Bio, Nature & Agricultural | 36 | 1.5% |
| Physical & Health Sciences | 46 | 1.9% |
| Psychology | 52 | 2.2% |
| Social Sciences | 105 | 4.4% |
| Engineering | 178 | 7.4% |
| Multidisciplinary Studies | 100 | 4.2% |
| Science & Technology | 160 | 6.7% |
| Business | 653 | 27.3% |
| Education | 398 | 16.6% |
| Literature & Languages | 50 | 2.1% |
| Liberal Arts & History | 200 | 8.4% |
| Visual & Performing Arts | 73 | 3.0% |
| Communications | 31 | 1.3% |
| Arts & Humanities | 163 | 6.8% |
| Total | 2,396 | 100.0% |
Transportation & Commute in Radcliff
Vehicle Availability by Sex in Radcliff
The most prevalent vehicle ownership categories in Radcliff are males with 2 vehicles (1,812, accounting for 37.8%) and females with 2 vehicles (1,724, making up 36.4%).
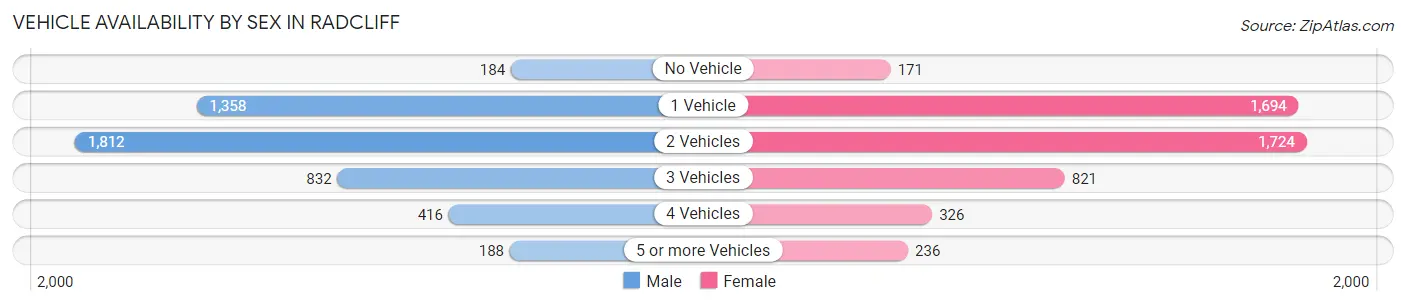
| Vehicles Available | Male | Female |
| No Vehicle | 184 (3.8%) | 171 (3.4%) |
| 1 Vehicle | 1,358 (28.3%) | 1,694 (34.1%) |
| 2 Vehicles | 1,812 (37.8%) | 1,724 (34.7%) |
| 3 Vehicles | 832 (17.4%) | 821 (16.5%) |
| 4 Vehicles | 416 (8.7%) | 326 (6.6%) |
| 5 or more Vehicles | 188 (3.9%) | 236 (4.8%) |
| Total | 4,790 (100.0%) | 4,972 (100.0%) |
Commute Time in Radcliff
The most frequently occuring commute durations in Radcliff are 15 to 19 minutes (1,538 commuters, 17.0%), 10 to 14 minutes (1,397 commuters, 15.4%), and 20 to 24 minutes (1,380 commuters, 15.3%).
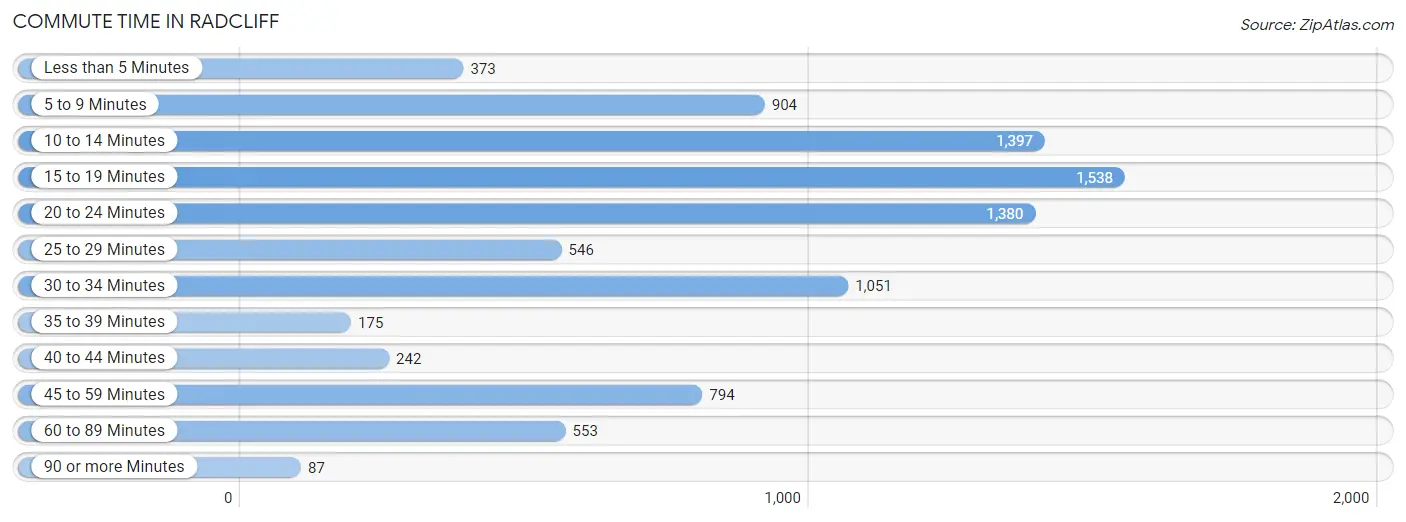
| Commute Time | # Commuters | % Commuters |
| Less than 5 Minutes | 373 | 4.1% |
| 5 to 9 Minutes | 904 | 10.0% |
| 10 to 14 Minutes | 1,397 | 15.4% |
| 15 to 19 Minutes | 1,538 | 17.0% |
| 20 to 24 Minutes | 1,380 | 15.3% |
| 25 to 29 Minutes | 546 | 6.0% |
| 30 to 34 Minutes | 1,051 | 11.6% |
| 35 to 39 Minutes | 175 | 1.9% |
| 40 to 44 Minutes | 242 | 2.7% |
| 45 to 59 Minutes | 794 | 8.8% |
| 60 to 89 Minutes | 553 | 6.1% |
| 90 or more Minutes | 87 | 1.0% |
Commute Time by Sex in Radcliff
The most common commute times in Radcliff are 20 to 24 minutes (941 commuters, 20.8%) for males and 10 to 14 minutes (880 commuters, 19.5%) for females.
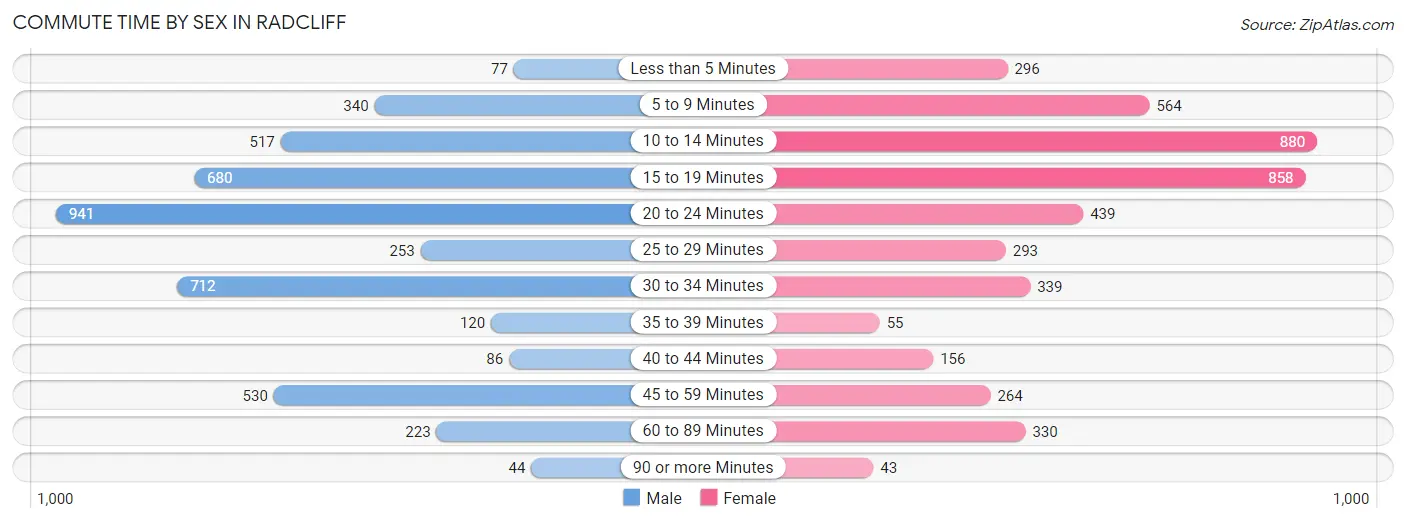
| Commute Time | Male | Female |
| Less than 5 Minutes | 77 (1.7%) | 296 (6.6%) |
| 5 to 9 Minutes | 340 (7.5%) | 564 (12.5%) |
| 10 to 14 Minutes | 517 (11.4%) | 880 (19.5%) |
| 15 to 19 Minutes | 680 (15.0%) | 858 (19.0%) |
| 20 to 24 Minutes | 941 (20.8%) | 439 (9.7%) |
| 25 to 29 Minutes | 253 (5.6%) | 293 (6.5%) |
| 30 to 34 Minutes | 712 (15.7%) | 339 (7.5%) |
| 35 to 39 Minutes | 120 (2.6%) | 55 (1.2%) |
| 40 to 44 Minutes | 86 (1.9%) | 156 (3.5%) |
| 45 to 59 Minutes | 530 (11.7%) | 264 (5.8%) |
| 60 to 89 Minutes | 223 (4.9%) | 330 (7.3%) |
| 90 or more Minutes | 44 (1.0%) | 43 (0.9%) |
Time of Departure to Work by Sex in Radcliff
The most frequent times of departure to work in Radcliff are 4:00 PM to 11:59 PM (630, 13.9%) for males and 7:00 AM to 7:29 AM (790, 17.5%) for females.
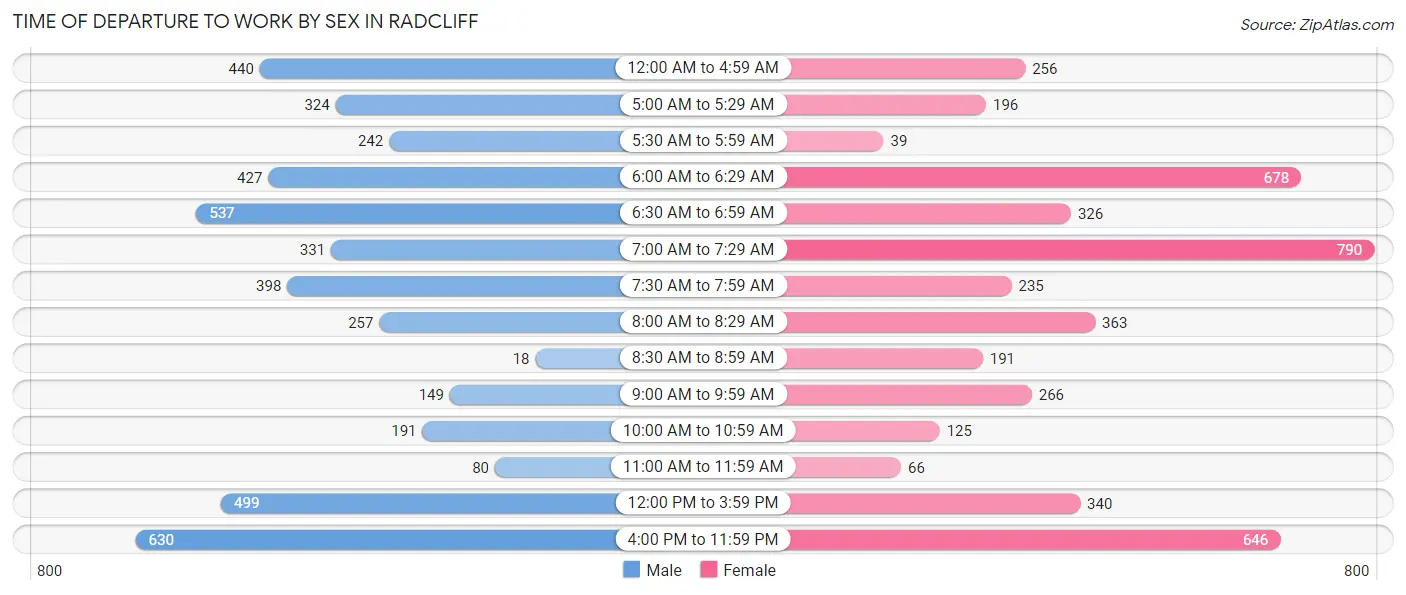
| Time of Departure | Male | Female |
| 12:00 AM to 4:59 AM | 440 (9.7%) | 256 (5.7%) |
| 5:00 AM to 5:29 AM | 324 (7.2%) | 196 (4.3%) |
| 5:30 AM to 5:59 AM | 242 (5.3%) | 39 (0.9%) |
| 6:00 AM to 6:29 AM | 427 (9.4%) | 678 (15.0%) |
| 6:30 AM to 6:59 AM | 537 (11.9%) | 326 (7.2%) |
| 7:00 AM to 7:29 AM | 331 (7.3%) | 790 (17.5%) |
| 7:30 AM to 7:59 AM | 398 (8.8%) | 235 (5.2%) |
| 8:00 AM to 8:29 AM | 257 (5.7%) | 363 (8.0%) |
| 8:30 AM to 8:59 AM | 18 (0.4%) | 191 (4.2%) |
| 9:00 AM to 9:59 AM | 149 (3.3%) | 266 (5.9%) |
| 10:00 AM to 10:59 AM | 191 (4.2%) | 125 (2.8%) |
| 11:00 AM to 11:59 AM | 80 (1.8%) | 66 (1.5%) |
| 12:00 PM to 3:59 PM | 499 (11.0%) | 340 (7.5%) |
| 4:00 PM to 11:59 PM | 630 (13.9%) | 646 (14.3%) |
| Total | 4,523 (100.0%) | 4,517 (100.0%) |
Housing Occupancy in Radcliff
Occupancy by Ownership in Radcliff
Of the total 8,847 dwellings in Radcliff, owner-occupied units account for 4,378 (49.5%), while renter-occupied units make up 4,469 (50.5%).
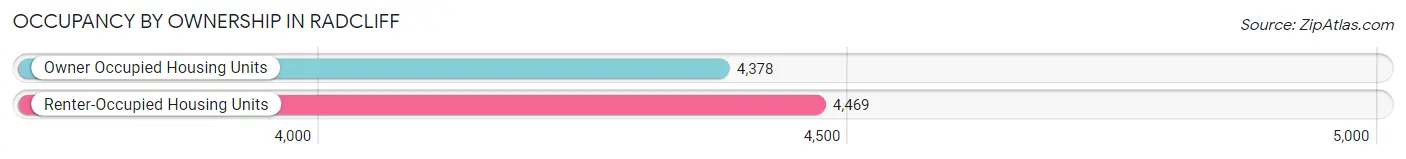
| Occupancy | # Housing Units | % Housing Units |
| Owner Occupied Housing Units | 4,378 | 49.5% |
| Renter-Occupied Housing Units | 4,469 | 50.5% |
| Total Occupied Housing Units | 8,847 | 100.0% |
Occupancy by Household Size in Radcliff
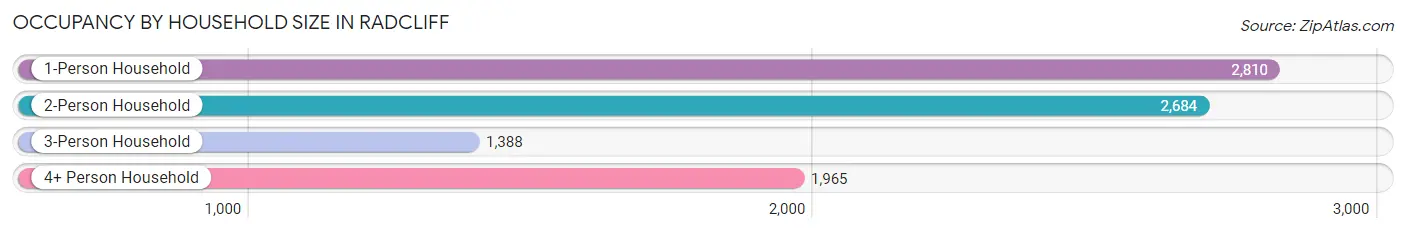
| Household Size | # Housing Units | % Housing Units |
| 1-Person Household | 2,810 | 31.8% |
| 2-Person Household | 2,684 | 30.3% |
| 3-Person Household | 1,388 | 15.7% |
| 4+ Person Household | 1,965 | 22.2% |
| Total Housing Units | 8,847 | 100.0% |
Occupancy by Ownership by Household Size in Radcliff
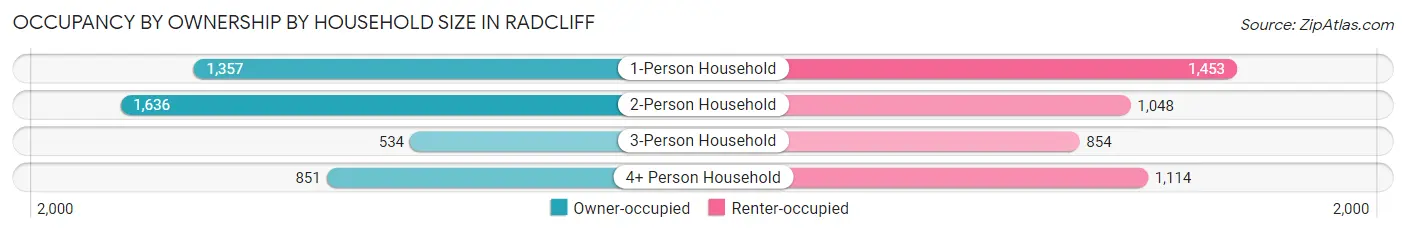
| Household Size | Owner-occupied | Renter-occupied |
| 1-Person Household | 1,357 (48.3%) | 1,453 (51.7%) |
| 2-Person Household | 1,636 (61.0%) | 1,048 (39.1%) |
| 3-Person Household | 534 (38.5%) | 854 (61.5%) |
| 4+ Person Household | 851 (43.3%) | 1,114 (56.7%) |
| Total Housing Units | 4,378 (49.5%) | 4,469 (50.5%) |
Occupancy by Educational Attainment in Radcliff
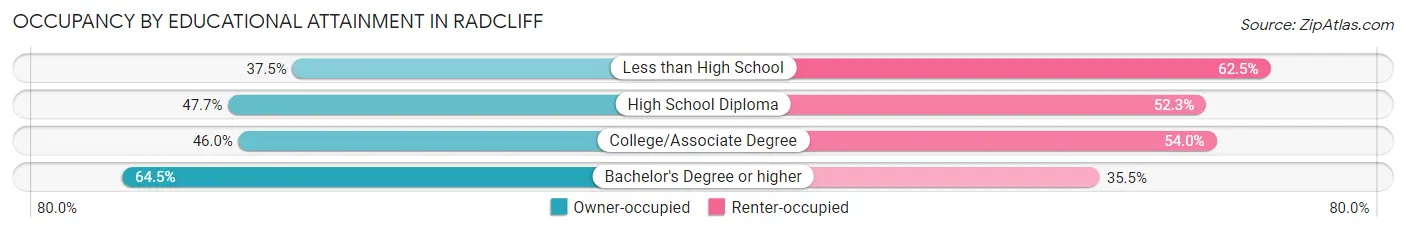
| Household Size | Owner-occupied | Renter-occupied |
| Less than High School | 252 (37.5%) | 420 (62.5%) |
| High School Diploma | 1,411 (47.7%) | 1,548 (52.3%) |
| College/Associate Degree | 1,620 (46.0%) | 1,899 (54.0%) |
| Bachelor's Degree or higher | 1,095 (64.5%) | 602 (35.5%) |
Occupancy by Age of Householder in Radcliff

| Age Bracket | # Households | % Households |
| Under 35 Years | 1,846 | 20.9% |
| 35 to 44 Years | 1,829 | 20.7% |
| 45 to 54 Years | 1,310 | 14.8% |
| 55 to 64 Years | 1,829 | 20.7% |
| 65 to 74 Years | 1,392 | 15.7% |
| 75 to 84 Years | 470 | 5.3% |
| 85 Years and Over | 171 | 1.9% |
| Total | 8,847 | 100.0% |
Housing Finances in Radcliff
Median Income by Occupancy in Radcliff
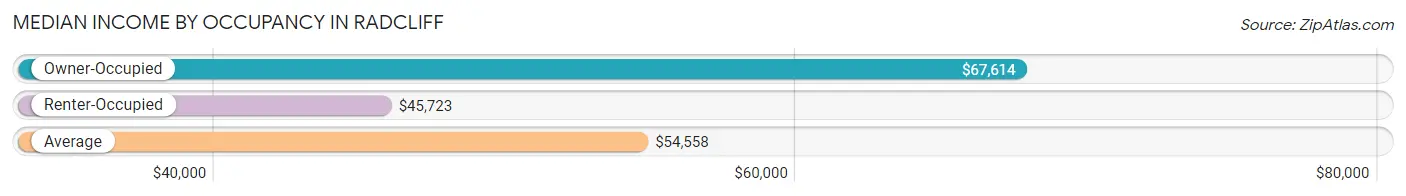
| Occupancy Type | # Households | Median Income |
| Owner-Occupied | 4,378 (49.5%) | $67,614 |
| Renter-Occupied | 4,469 (50.5%) | $45,723 |
| Average | 8,847 (100.0%) | $54,558 |
Occupancy by Householder Income Bracket in Radcliff
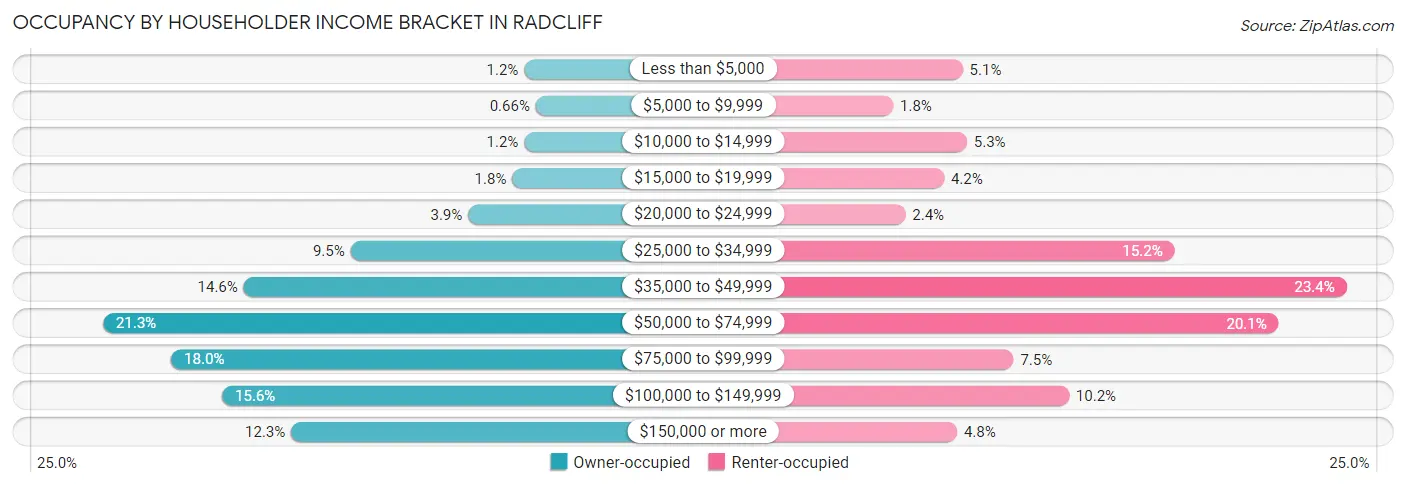
| Income Bracket | Owner-occupied | Renter-occupied |
| Less than $5,000 | 53 (1.2%) | 228 (5.1%) |
| $5,000 to $9,999 | 29 (0.7%) | 80 (1.8%) |
| $10,000 to $14,999 | 53 (1.2%) | 237 (5.3%) |
| $15,000 to $19,999 | 78 (1.8%) | 188 (4.2%) |
| $20,000 to $24,999 | 170 (3.9%) | 106 (2.4%) |
| $25,000 to $34,999 | 415 (9.5%) | 679 (15.2%) |
| $35,000 to $49,999 | 638 (14.6%) | 1,045 (23.4%) |
| $50,000 to $74,999 | 931 (21.3%) | 900 (20.1%) |
| $75,000 to $99,999 | 789 (18.0%) | 336 (7.5%) |
| $100,000 to $149,999 | 683 (15.6%) | 454 (10.2%) |
| $150,000 or more | 539 (12.3%) | 216 (4.8%) |
| Total | 4,378 (100.0%) | 4,469 (100.0%) |
Monthly Housing Cost Tiers in Radcliff
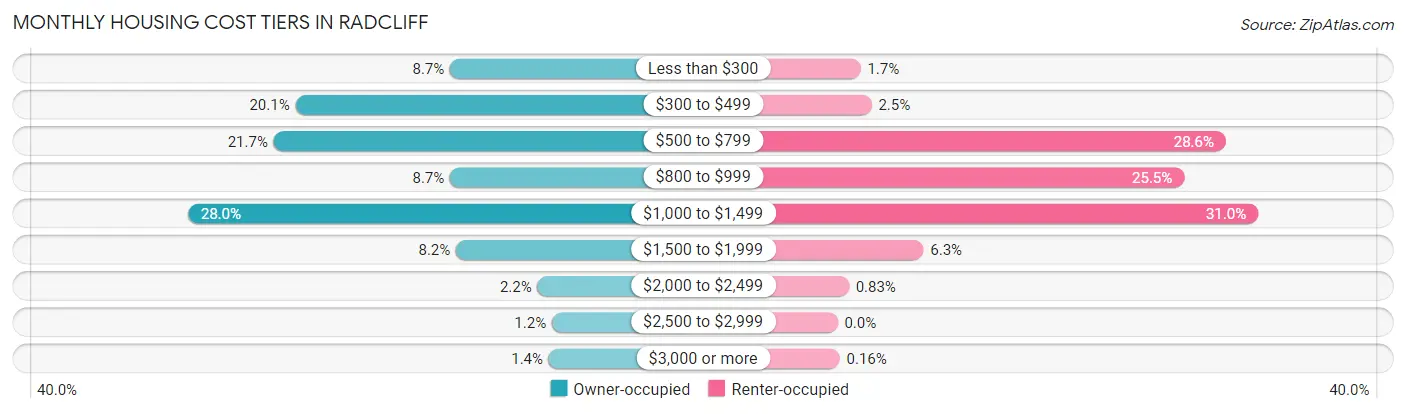
| Monthly Cost | Owner-occupied | Renter-occupied |
| Less than $300 | 379 (8.7%) | 76 (1.7%) |
| $300 to $499 | 878 (20.1%) | 112 (2.5%) |
| $500 to $799 | 948 (21.6%) | 1,278 (28.6%) |
| $800 to $999 | 379 (8.7%) | 1,141 (25.5%) |
| $1,000 to $1,499 | 1,225 (28.0%) | 1,384 (31.0%) |
| $1,500 to $1,999 | 360 (8.2%) | 283 (6.3%) |
| $2,000 to $2,499 | 97 (2.2%) | 37 (0.8%) |
| $2,500 to $2,999 | 51 (1.2%) | 0 (0.0%) |
| $3,000 or more | 61 (1.4%) | 7 (0.2%) |
| Total | 4,378 (100.0%) | 4,469 (100.0%) |
Physical Housing Characteristics in Radcliff
Housing Structures in Radcliff
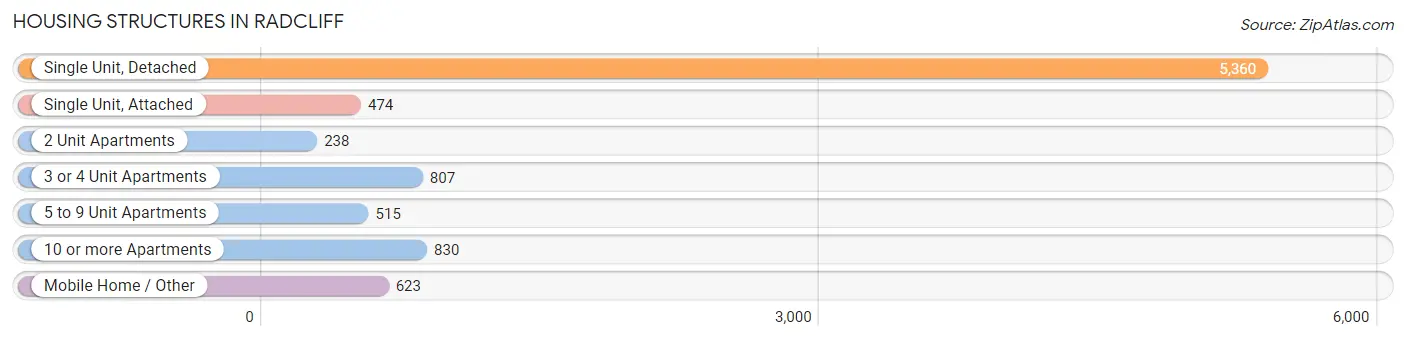
| Structure Type | # Housing Units | % Housing Units |
| Single Unit, Detached | 5,360 | 60.6% |
| Single Unit, Attached | 474 | 5.4% |
| 2 Unit Apartments | 238 | 2.7% |
| 3 or 4 Unit Apartments | 807 | 9.1% |
| 5 to 9 Unit Apartments | 515 | 5.8% |
| 10 or more Apartments | 830 | 9.4% |
| Mobile Home / Other | 623 | 7.0% |
| Total | 8,847 | 100.0% |
Housing Structures by Occupancy in Radcliff
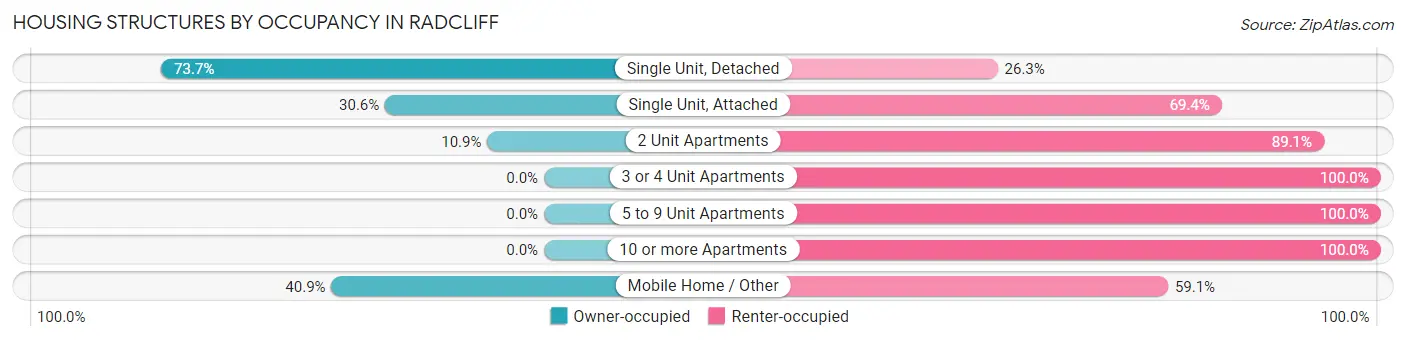
| Structure Type | Owner-occupied | Renter-occupied |
| Single Unit, Detached | 3,952 (73.7%) | 1,408 (26.3%) |
| Single Unit, Attached | 145 (30.6%) | 329 (69.4%) |
| 2 Unit Apartments | 26 (10.9%) | 212 (89.1%) |
| 3 or 4 Unit Apartments | 0 (0.0%) | 807 (100.0%) |
| 5 to 9 Unit Apartments | 0 (0.0%) | 515 (100.0%) |
| 10 or more Apartments | 0 (0.0%) | 830 (100.0%) |
| Mobile Home / Other | 255 (40.9%) | 368 (59.1%) |
| Total | 4,378 (49.5%) | 4,469 (50.5%) |
Housing Structures by Number of Rooms in Radcliff
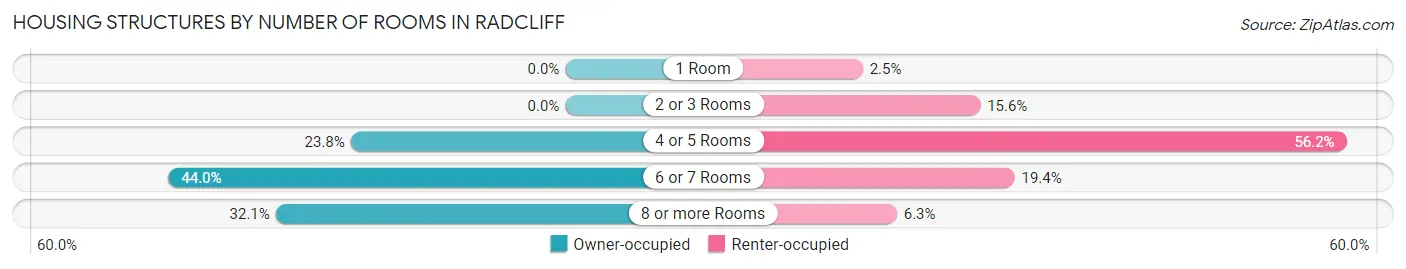
| Number of Rooms | Owner-occupied | Renter-occupied |
| 1 Room | 0 (0.0%) | 113 (2.5%) |
| 2 or 3 Rooms | 0 (0.0%) | 696 (15.6%) |
| 4 or 5 Rooms | 1,043 (23.8%) | 2,512 (56.2%) |
| 6 or 7 Rooms | 1,928 (44.0%) | 866 (19.4%) |
| 8 or more Rooms | 1,407 (32.1%) | 282 (6.3%) |
| Total | 4,378 (100.0%) | 4,469 (100.0%) |
Housing Structure by Heating Type in Radcliff
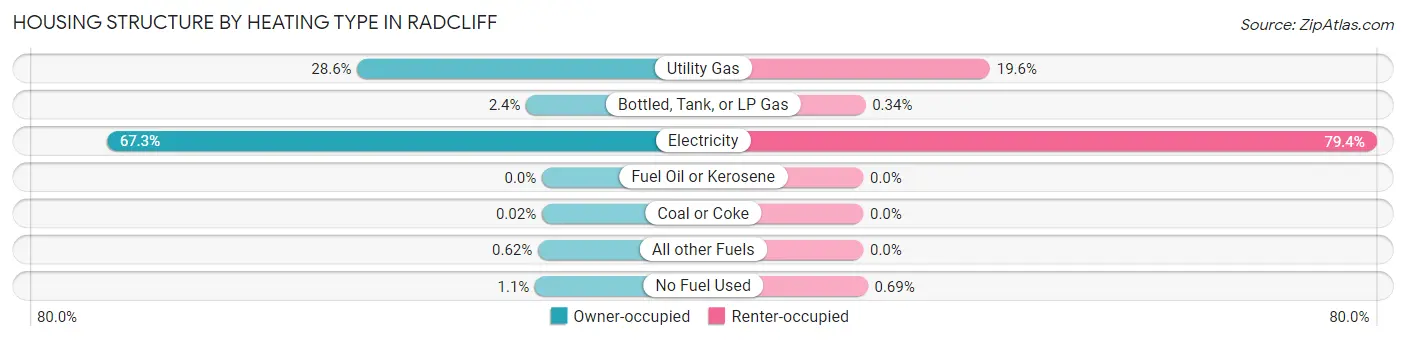
| Heating Type | Owner-occupied | Renter-occupied |
| Utility Gas | 1,250 (28.5%) | 876 (19.6%) |
| Bottled, Tank, or LP Gas | 107 (2.4%) | 15 (0.3%) |
| Electricity | 2,946 (67.3%) | 3,547 (79.4%) |
| Fuel Oil or Kerosene | 0 (0.0%) | 0 (0.0%) |
| Coal or Coke | 1 (0.0%) | 0 (0.0%) |
| All other Fuels | 27 (0.6%) | 0 (0.0%) |
| No Fuel Used | 47 (1.1%) | 31 (0.7%) |
| Total | 4,378 (100.0%) | 4,469 (100.0%) |
Household Vehicle Usage in Radcliff
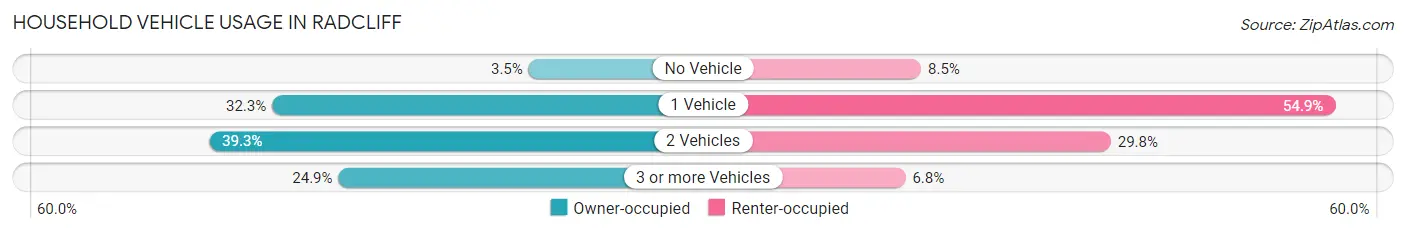
| Vehicles per Household | Owner-occupied | Renter-occupied |
| No Vehicle | 155 (3.5%) | 381 (8.5%) |
| 1 Vehicle | 1,413 (32.3%) | 2,454 (54.9%) |
| 2 Vehicles | 1,722 (39.3%) | 1,331 (29.8%) |
| 3 or more Vehicles | 1,088 (24.8%) | 303 (6.8%) |
| Total | 4,378 (100.0%) | 4,469 (100.0%) |
Real Estate & Mortgages in Radcliff
Real Estate and Mortgage Overview in Radcliff
| Characteristic | Without Mortgage | With Mortgage |
| Housing Units | 1,782 | 2,596 |
| Median Property Value | $134,200 | $160,100 |
| Median Household Income | $53,558 | $376 |
| Monthly Housing Costs | $410 | $61 |
| Real Estate Taxes | $1,012 | $123 |
Property Value by Mortgage Status in Radcliff
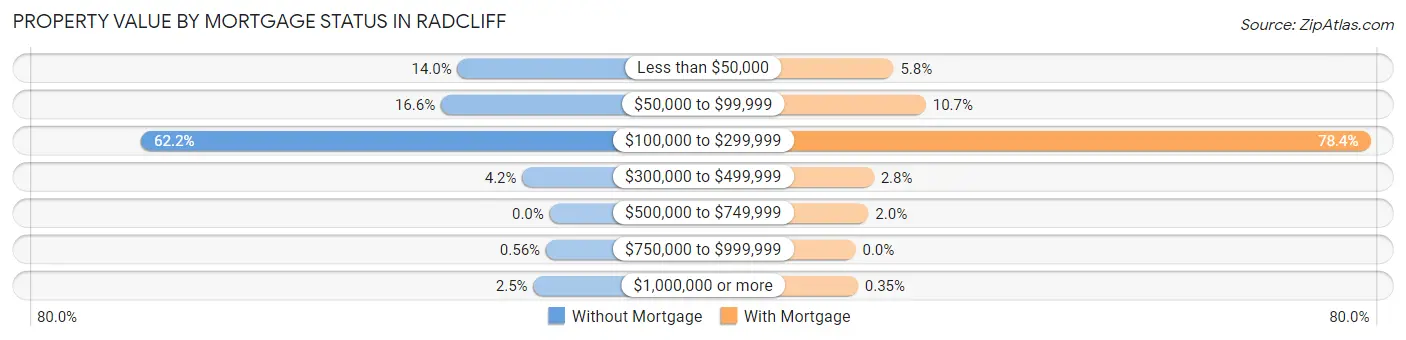
| Property Value | Without Mortgage | With Mortgage |
| Less than $50,000 | 250 (14.0%) | 150 (5.8%) |
| $50,000 to $99,999 | 295 (16.6%) | 278 (10.7%) |
| $100,000 to $299,999 | 1,109 (62.2%) | 2,036 (78.4%) |
| $300,000 to $499,999 | 74 (4.2%) | 72 (2.8%) |
| $500,000 to $749,999 | 0 (0.0%) | 51 (2.0%) |
| $750,000 to $999,999 | 10 (0.6%) | 0 (0.0%) |
| $1,000,000 or more | 44 (2.5%) | 9 (0.4%) |
| Total | 1,782 (100.0%) | 2,596 (100.0%) |
Household Income by Mortgage Status in Radcliff
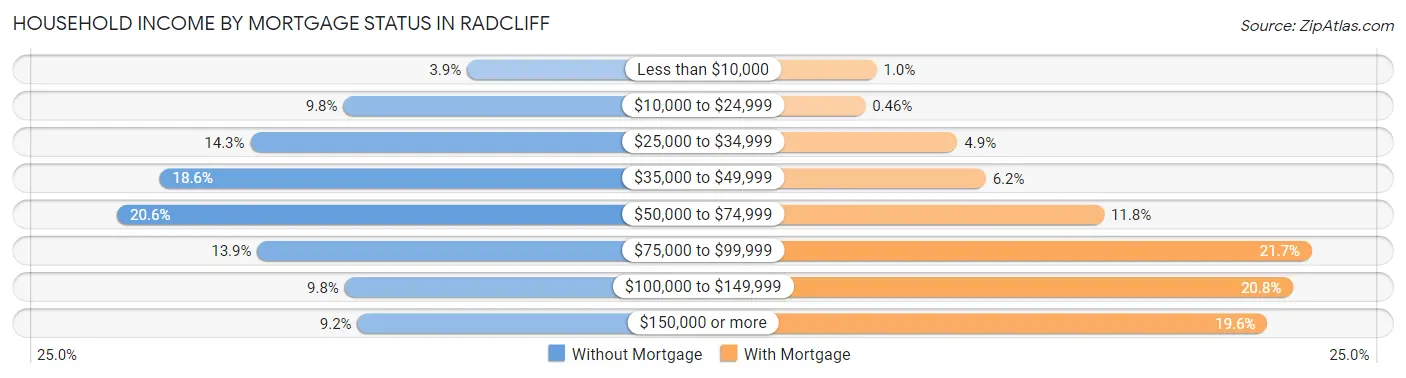
| Household Income | Without Mortgage | With Mortgage |
| Less than $10,000 | 70 (3.9%) | 26 (1.0%) |
| $10,000 to $24,999 | 175 (9.8%) | 12 (0.5%) |
| $25,000 to $34,999 | 254 (14.2%) | 126 (4.9%) |
| $35,000 to $49,999 | 331 (18.6%) | 161 (6.2%) |
| $50,000 to $74,999 | 367 (20.6%) | 307 (11.8%) |
| $75,000 to $99,999 | 248 (13.9%) | 564 (21.7%) |
| $100,000 to $149,999 | 174 (9.8%) | 541 (20.8%) |
| $150,000 or more | 163 (9.1%) | 509 (19.6%) |
| Total | 1,782 (100.0%) | 2,596 (100.0%) |
Property Value to Household Income Ratio in Radcliff
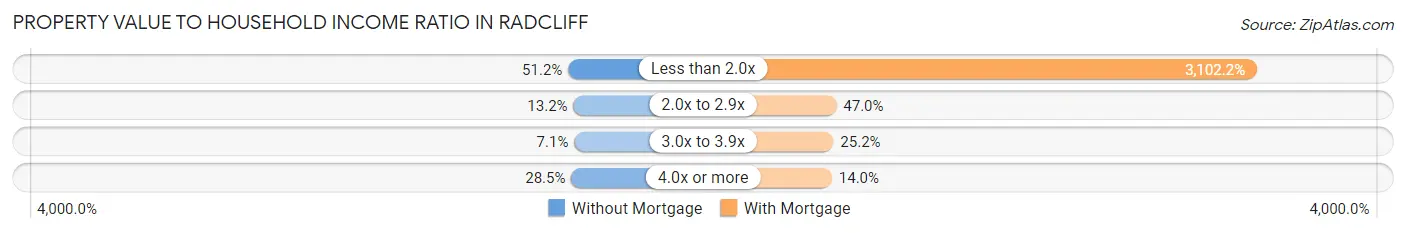
| Value-to-Income Ratio | Without Mortgage | With Mortgage |
| Less than 2.0x | 913 (51.2%) | 80,533 (3,102.2%) |
| 2.0x to 2.9x | 235 (13.2%) | 1,219 (47.0%) |
| 3.0x to 3.9x | 127 (7.1%) | 654 (25.2%) |
| 4.0x or more | 507 (28.4%) | 364 (14.0%) |
| Total | 1,782 (100.0%) | 2,596 (100.0%) |
Real Estate Taxes by Mortgage Status in Radcliff
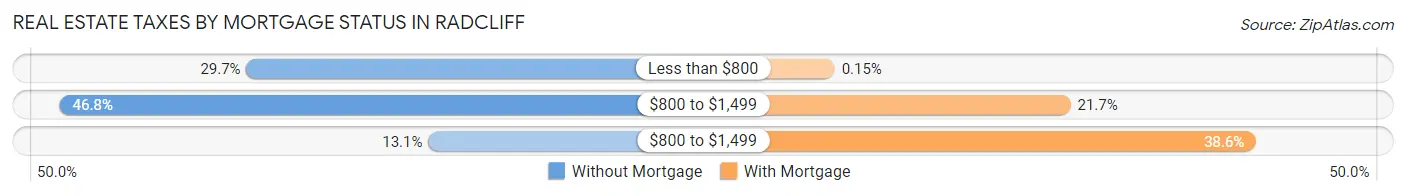
| Property Taxes | Without Mortgage | With Mortgage |
| Less than $800 | 530 (29.7%) | 4 (0.2%) |
| $800 to $1,499 | 834 (46.8%) | 563 (21.7%) |
| $800 to $1,499 | 234 (13.1%) | 1,003 (38.6%) |
| Total | 1,782 (100.0%) | 2,596 (100.0%) |
Health & Disability in Radcliff
Health Insurance Coverage by Age in Radcliff
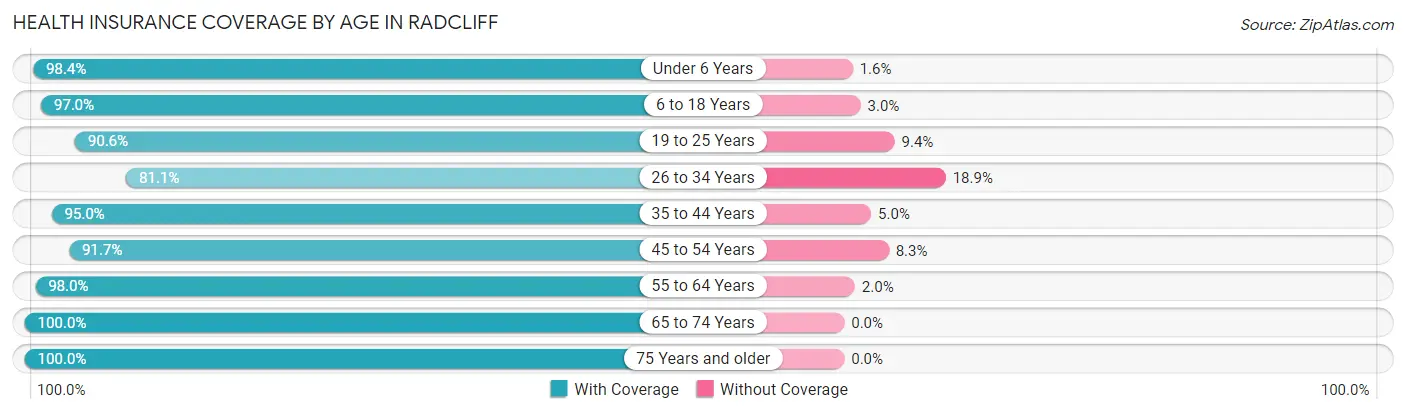
| Age Bracket | With Coverage | Without Coverage |
| Under 6 Years | 2,007 (98.4%) | 32 (1.6%) |
| 6 to 18 Years | 4,306 (97.0%) | 135 (3.0%) |
| 19 to 25 Years | 1,922 (90.6%) | 199 (9.4%) |
| 26 to 34 Years | 2,194 (81.1%) | 512 (18.9%) |
| 35 to 44 Years | 2,728 (95.0%) | 144 (5.0%) |
| 45 to 54 Years | 2,126 (91.7%) | 192 (8.3%) |
| 55 to 64 Years | 2,875 (98.0%) | 58 (2.0%) |
| 65 to 74 Years | 2,036 (100.0%) | 0 (0.0%) |
| 75 Years and older | 888 (100.0%) | 0 (0.0%) |
| Total | 21,082 (94.3%) | 1,272 (5.7%) |
Health Insurance Coverage by Citizenship Status in Radcliff
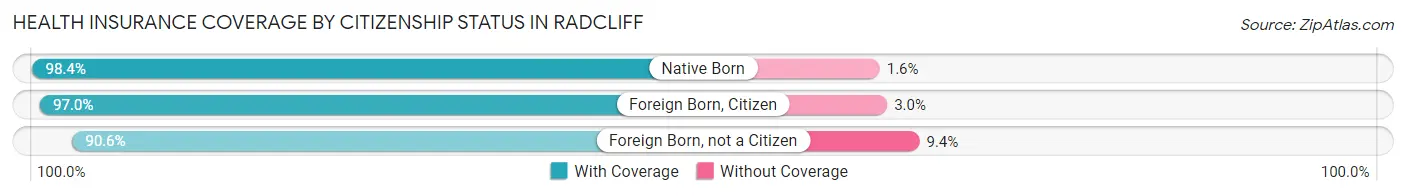
| Citizenship Status | With Coverage | Without Coverage |
| Native Born | 2,007 (98.4%) | 32 (1.6%) |
| Foreign Born, Citizen | 4,306 (97.0%) | 135 (3.0%) |
| Foreign Born, not a Citizen | 1,922 (90.6%) | 199 (9.4%) |
Health Insurance Coverage by Household Income in Radcliff
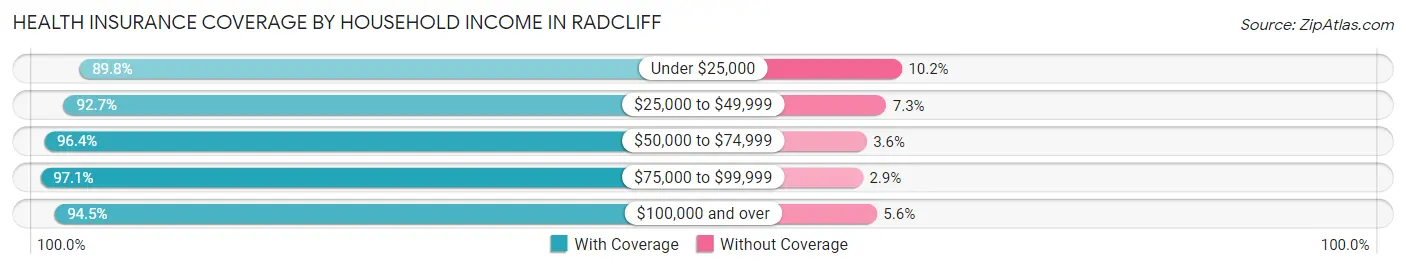
| Household Income | With Coverage | Without Coverage |
| Under $25,000 | 1,963 (89.8%) | 224 (10.2%) |
| $25,000 to $49,999 | 5,618 (92.7%) | 444 (7.3%) |
| $50,000 to $74,999 | 4,862 (96.4%) | 183 (3.6%) |
| $75,000 to $99,999 | 3,018 (97.1%) | 91 (2.9%) |
| $100,000 and over | 5,621 (94.5%) | 330 (5.6%) |
Public vs Private Health Insurance Coverage by Age in Radcliff
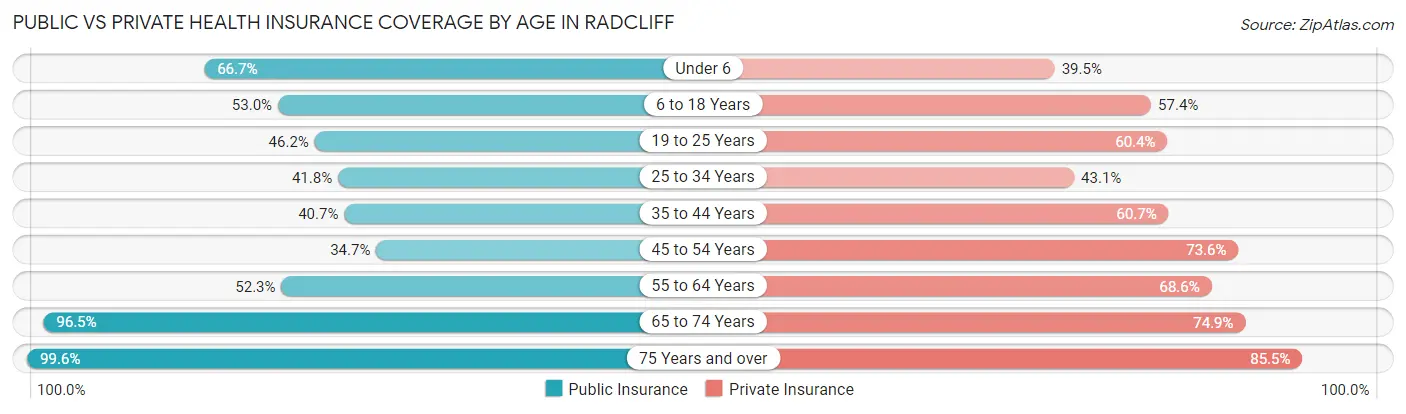
| Age Bracket | Public Insurance | Private Insurance |
| Under 6 | 1,359 (66.6%) | 806 (39.5%) |
| 6 to 18 Years | 2,353 (53.0%) | 2,550 (57.4%) |
| 19 to 25 Years | 979 (46.2%) | 1,282 (60.4%) |
| 25 to 34 Years | 1,132 (41.8%) | 1,167 (43.1%) |
| 35 to 44 Years | 1,168 (40.7%) | 1,742 (60.7%) |
| 45 to 54 Years | 805 (34.7%) | 1,706 (73.6%) |
| 55 to 64 Years | 1,535 (52.3%) | 2,013 (68.6%) |
| 65 to 74 Years | 1,965 (96.5%) | 1,525 (74.9%) |
| 75 Years and over | 884 (99.6%) | 759 (85.5%) |
| Total | 12,180 (54.5%) | 13,550 (60.6%) |
Disability Status by Sex by Age in Radcliff
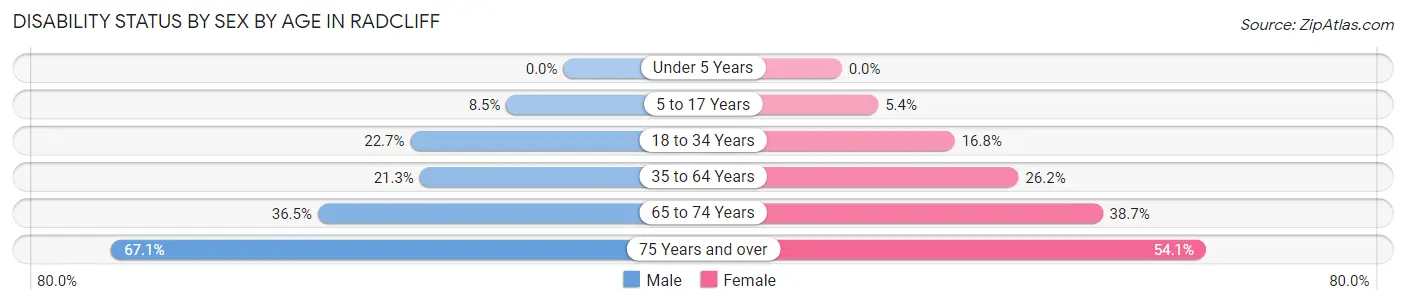
| Age Bracket | Male | Female |
| Under 5 Years | 0 (0.0%) | 0 (0.0%) |
| 5 to 17 Years | 184 (8.5%) | 122 (5.4%) |
| 18 to 34 Years | 547 (22.7%) | 470 (16.8%) |
| 35 to 64 Years | 849 (21.3%) | 1,087 (26.2%) |
| 65 to 74 Years | 377 (36.5%) | 388 (38.7%) |
| 75 Years and over | 241 (67.1%) | 286 (54.1%) |
Disability Class by Sex by Age in Radcliff
Disability Class: Hearing Difficulty
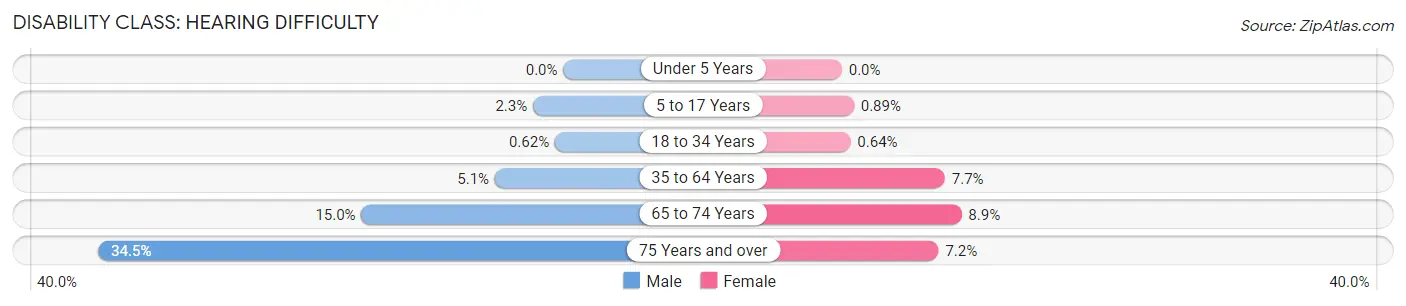
| Age Bracket | Male | Female |
| Under 5 Years | 0 (0.0%) | 0 (0.0%) |
| 5 to 17 Years | 49 (2.2%) | 20 (0.9%) |
| 18 to 34 Years | 15 (0.6%) | 18 (0.6%) |
| 35 to 64 Years | 202 (5.1%) | 317 (7.6%) |
| 65 to 74 Years | 155 (15.0%) | 89 (8.9%) |
| 75 Years and over | 124 (34.5%) | 38 (7.2%) |
Disability Class: Vision Difficulty
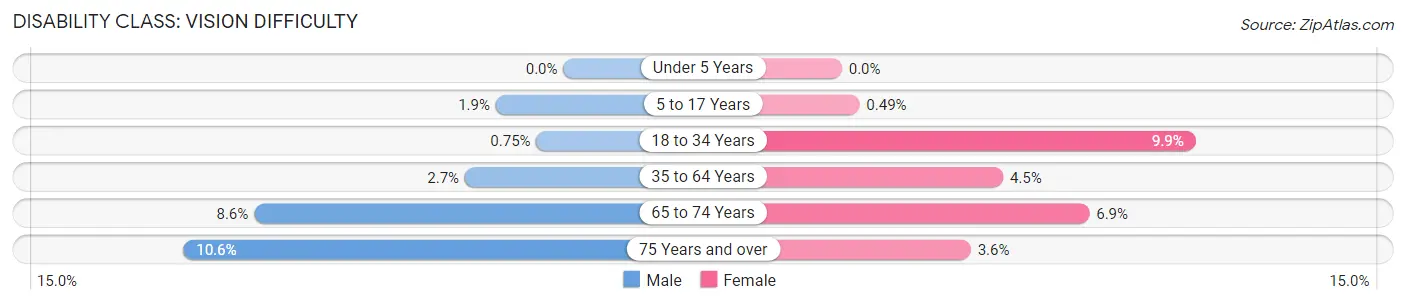
| Age Bracket | Male | Female |
| Under 5 Years | 0 (0.0%) | 0 (0.0%) |
| 5 to 17 Years | 41 (1.9%) | 11 (0.5%) |
| 18 to 34 Years | 18 (0.7%) | 276 (9.9%) |
| 35 to 64 Years | 109 (2.7%) | 186 (4.5%) |
| 65 to 74 Years | 89 (8.6%) | 69 (6.9%) |
| 75 Years and over | 38 (10.6%) | 19 (3.6%) |
Disability Class: Cognitive Difficulty
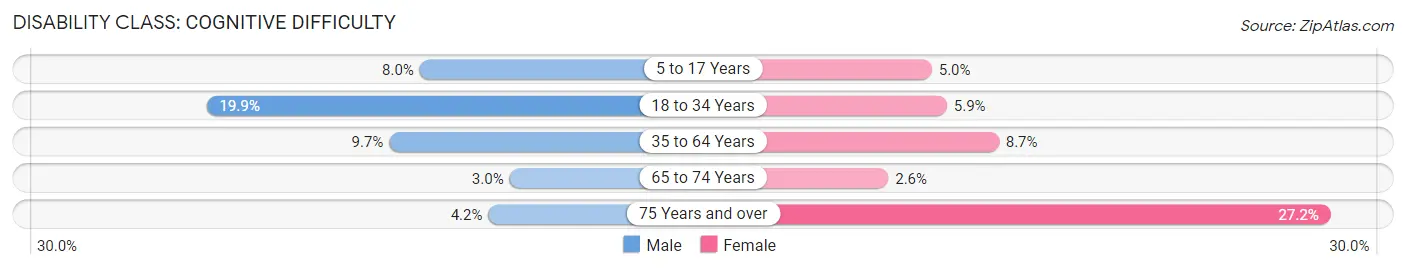
| Age Bracket | Male | Female |
| 5 to 17 Years | 174 (8.0%) | 113 (5.0%) |
| 18 to 34 Years | 478 (19.9%) | 164 (5.9%) |
| 35 to 64 Years | 386 (9.7%) | 362 (8.7%) |
| 65 to 74 Years | 31 (3.0%) | 26 (2.6%) |
| 75 Years and over | 15 (4.2%) | 144 (27.2%) |
Disability Class: Ambulatory Difficulty
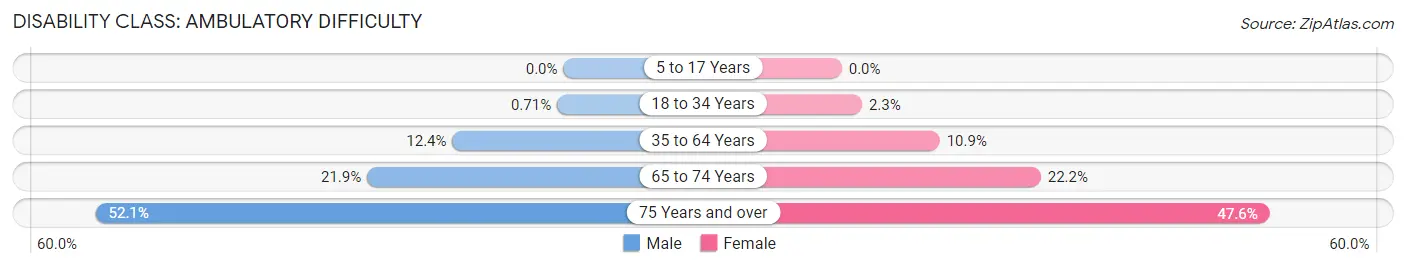
| Age Bracket | Male | Female |
| 5 to 17 Years | 0 (0.0%) | 0 (0.0%) |
| 18 to 34 Years | 17 (0.7%) | 63 (2.2%) |
| 35 to 64 Years | 492 (12.4%) | 452 (10.9%) |
| 65 to 74 Years | 226 (21.9%) | 222 (22.2%) |
| 75 Years and over | 187 (52.1%) | 252 (47.6%) |
Disability Class: Self-Care Difficulty
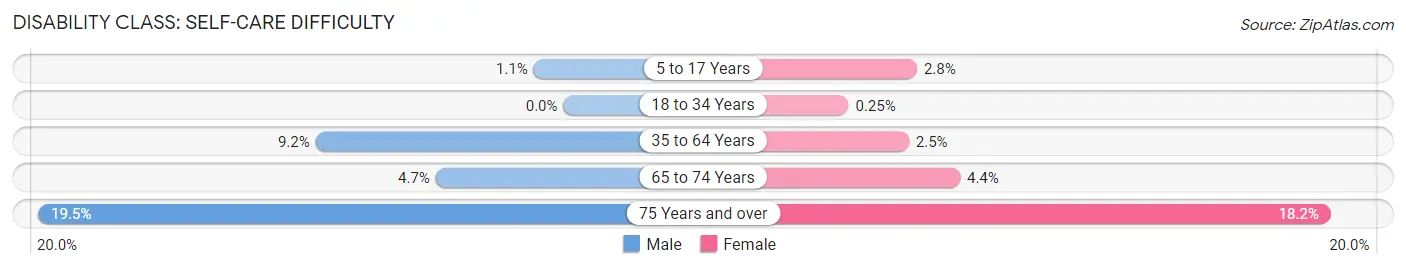
| Age Bracket | Male | Female |
| 5 to 17 Years | 24 (1.1%) | 63 (2.8%) |
| 18 to 34 Years | 0 (0.0%) | 7 (0.3%) |
| 35 to 64 Years | 366 (9.2%) | 103 (2.5%) |
| 65 to 74 Years | 49 (4.7%) | 44 (4.4%) |
| 75 Years and over | 70 (19.5%) | 96 (18.1%) |
Technology Access in Radcliff
Computing Device Access in Radcliff
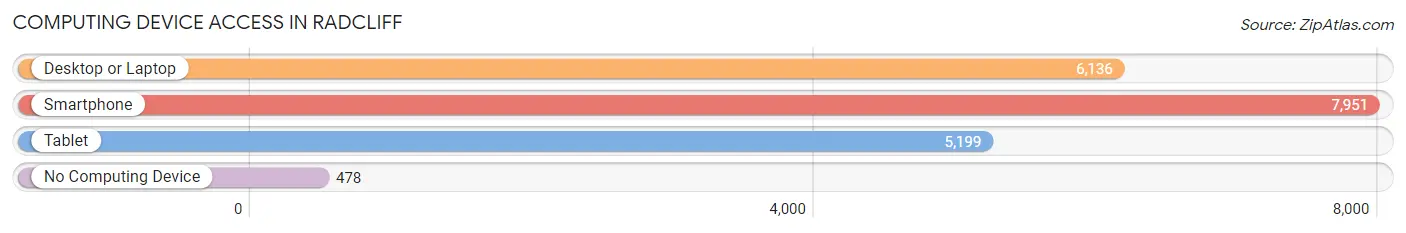
| Device Type | # Households | % Households |
| Desktop or Laptop | 6,136 | 69.4% |
| Smartphone | 7,951 | 89.9% |
| Tablet | 5,199 | 58.8% |
| No Computing Device | 478 | 5.4% |
| Total | 8,847 | 100.0% |
Internet Access in Radcliff
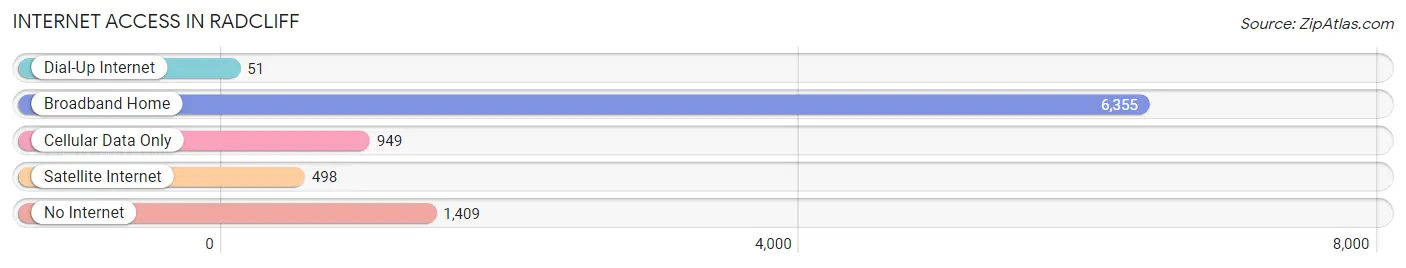
| Internet Type | # Households | % Households |
| Dial-Up Internet | 51 | 0.6% |
| Broadband Home | 6,355 | 71.8% |
| Cellular Data Only | 949 | 10.7% |
| Satellite Internet | 498 | 5.6% |
| No Internet | 1,409 | 15.9% |
| Total | 8,847 | 100.0% |
Radcliff Summary
Radcliff, Kentucky is a city located in Hardin County, Kentucky, United States. It is located just south of Fort Knox and is part of the Elizabethtown-Fort Knox Metropolitan Statistical Area. The population of Radcliff was 21,688 at the 2010 census, making it the largest city in Hardin County.
History
Radcliff was founded in 1879 by the Louisville and Nashville Railroad. The city was named after the railroad's chief engineer, John Radcliff. The city was incorporated in 1887.
In the early 1900s, Radcliff was a small farming community. The city began to grow in the 1950s when Fort Knox was expanded and the population of the city increased. The city continued to grow in the 1960s and 1970s as the military presence in the area increased.
Geography
Radcliff is located at 37°54'45" North, 85°54'45" West (37.912500, -85.912500). The city is situated in the rolling hills of central Kentucky, about 20 miles south of Louisville.
Radcliff is located in Hardin County, which is part of the Elizabethtown-Fort Knox Metropolitan Statistical Area. The city is bordered by the cities of Elizabethtown to the north, Vine Grove to the east, and Fort Knox to the south.
Economy
Radcliff's economy is largely based on the military presence in the area. The city is home to the U.S. Army Human Resources Command, which is the largest employer in the city. Other major employers in the city include the U.S. Army Cadet Command, the U.S. Army Accessions Command, and the U.S. Army Recruiting Command.
The city also has a number of small businesses, including restaurants, retail stores, and service providers.
Demographics
As of the 2010 census, the population of Radcliff was 21,688. The racial makeup of the city was 79.2% White, 11.7% African American, 0.7% Native American, 1.3% Asian, 0.1% Pacific Islander, 4.2% from other races, and 2.9% from two or more races. Hispanic or Latino of any race were 8.2% of the population.
The median household income in Radcliff was $41,945, and the median family income was $50,945. The per capita income for the city was $20,845. About 11.2% of families and 14.2% of the population were below the poverty line, including 19.2% of those under age 18 and 8.2% of those age 65 or over.
Common Questions
What is Per Capita Income in Radcliff?
Per Capita income in Radcliff is $29,343.
What is the Median Family Income in Radcliff?
Median Family Income in Radcliff is $61,927.
What is the Median Household income in Radcliff?
Median Household Income in Radcliff is $54,558.
What is Income or Wage Gap in Radcliff?
Income or Wage Gap in Radcliff is 29.9%.
Women in Radcliff earn 70.1 cents for every dollar earned by a man.
What is Family Income Deficit in Radcliff?
Family Income Deficit in Radcliff is $7,254.
Families that are below poverty line in Radcliff earn $7,254 less on average than the poverty threshold level.
What is Inequality or Gini Index in Radcliff?
Inequality or Gini Index in Radcliff is 0.45.
What is the Total Population of Radcliff?
Total Population of Radcliff is 22,981.
What is the Total Male Population of Radcliff?
Total Male Population of Radcliff is 10,969.
What is the Total Female Population of Radcliff?
Total Female Population of Radcliff is 12,012.
What is the Ratio of Males per 100 Females in Radcliff?
There are 91.32 Males per 100 Females in Radcliff.
What is the Ratio of Females per 100 Males in Radcliff?
There are 109.51 Females per 100 Males in Radcliff.
What is the Median Population Age in Radcliff?
Median Population Age in Radcliff is 35.1 Years.
What is the Average Family Size in Radcliff
Average Family Size in Radcliff is 3.2 People.
What is the Average Household Size in Radcliff
Average Household Size in Radcliff is 2.6 People.
How Large is the Labor Force in Radcliff?
There are 11,105 People in the Labor Forcein in Radcliff.
What is the Percentage of People in the Labor Force in Radcliff?
63.1% of People are in the Labor Force in Radcliff.
What is the Unemployment Rate in Radcliff?
Unemployment Rate in Radcliff is 9.1%.