Edgewood, KY Map & Demographics
Edgewood Map
Edgewood Overview
$61,078
PER CAPITA INCOME
$133,276
AVG FAMILY INCOME
$117,308
AVG HOUSEHOLD INCOME
43.8%
WAGE / INCOME GAP [ % ]
56.2¢/ $1
WAGE / INCOME GAP [ $ ]
0.45
INEQUALITY / GINI INDEX
8,447
TOTAL POPULATION
4,098
MALE POPULATION
4,349
FEMALE POPULATION
94.23
MALES / 100 FEMALES
106.12
FEMALES / 100 MALES
41.5
MEDIAN AGE
3.0
AVG FAMILY SIZE
2.5
AVG HOUSEHOLD SIZE
4,268
LABOR FORCE [ PEOPLE ]
62.7%
PERCENT IN LABOR FORCE
1.5%
UNEMPLOYMENT RATE
Edgewood Area Codes
Income in Edgewood
Income Overview in Edgewood
Per Capita Income in Edgewood is $61,078, while median incomes of families and households are $133,276 and $117,308 respectively.
| Characteristic | Number | Measure |
| Per Capita Income | 8,447 | $61,078 |
| Median Family Income | 2,470 | $133,276 |
| Mean Family Income | 2,470 | $183,293 |
| Median Household Income | 3,326 | $117,308 |
| Mean Household Income | 3,326 | $154,798 |
| Income Deficit | 2,470 | $0 |
| Wage / Income Gap (%) | 8,447 | 43.77% |
| Wage / Income Gap ($) | 8,447 | 56.23¢ per $1 |
| Gini / Inequality Index | 8,447 | 0.45 |
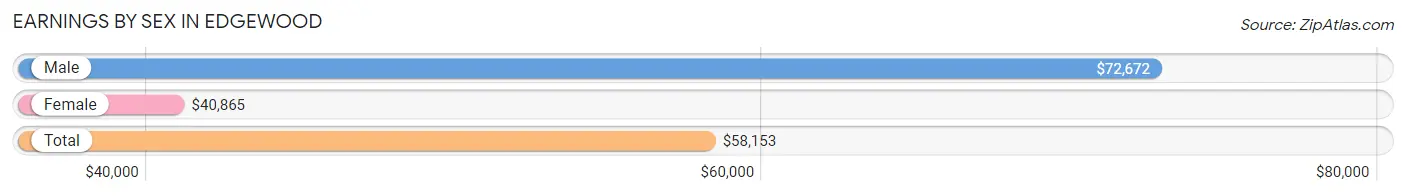
Earnings by Sex in Edgewood
Average Earnings in Edgewood are $58,153, $72,672 for men and $40,865 for women, a difference of 43.8%.
| Sex | Number | Average Earnings |
| Male | 2,379 (51.4%) | $72,672 |
| Female | 2,250 (48.6%) | $40,865 |
| Total | 4,629 (100.0%) | $58,153 |
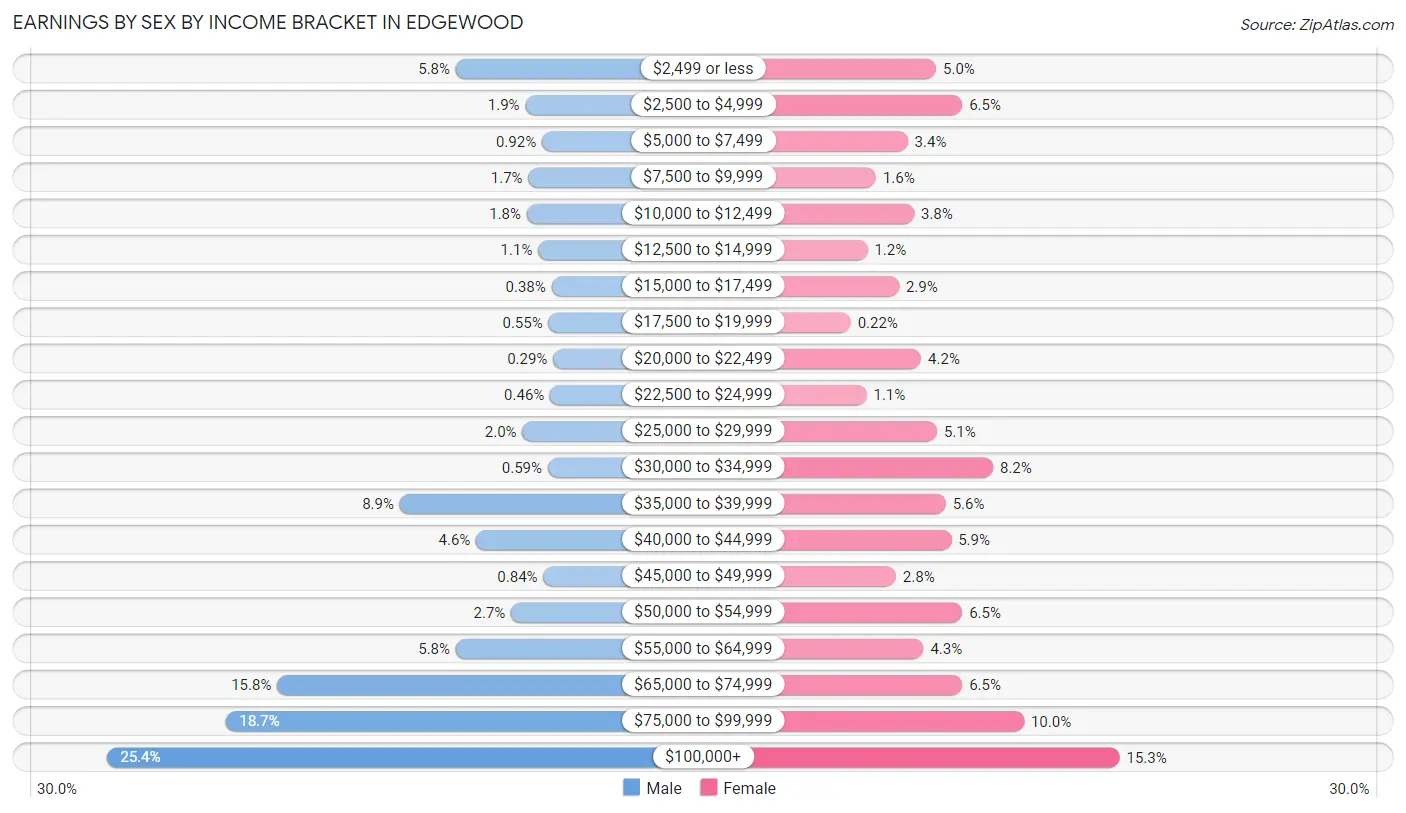
Earnings by Sex by Income Bracket in Edgewood
The most common earnings brackets in Edgewood are $100,000+ for men (603 | 25.4%) and $100,000+ for women (345 | 15.3%).
| Income | Male | Female |
| $2,499 or less | 137 (5.8%) | 113 (5.0%) |
| $2,500 to $4,999 | 44 (1.8%) | 146 (6.5%) |
| $5,000 to $7,499 | 22 (0.9%) | 77 (3.4%) |
| $7,500 to $9,999 | 40 (1.7%) | 37 (1.6%) |
| $10,000 to $12,499 | 42 (1.8%) | 85 (3.8%) |
| $12,500 to $14,999 | 27 (1.1%) | 26 (1.2%) |
| $15,000 to $17,499 | 9 (0.4%) | 66 (2.9%) |
| $17,500 to $19,999 | 13 (0.5%) | 5 (0.2%) |
| $20,000 to $22,499 | 7 (0.3%) | 94 (4.2%) |
| $22,500 to $24,999 | 11 (0.5%) | 25 (1.1%) |
| $25,000 to $29,999 | 48 (2.0%) | 114 (5.1%) |
| $30,000 to $34,999 | 14 (0.6%) | 185 (8.2%) |
| $35,000 to $39,999 | 212 (8.9%) | 125 (5.6%) |
| $40,000 to $44,999 | 110 (4.6%) | 132 (5.9%) |
| $45,000 to $49,999 | 20 (0.8%) | 62 (2.8%) |
| $50,000 to $54,999 | 63 (2.6%) | 146 (6.5%) |
| $55,000 to $64,999 | 137 (5.8%) | 97 (4.3%) |
| $65,000 to $74,999 | 376 (15.8%) | 146 (6.5%) |
| $75,000 to $99,999 | 444 (18.7%) | 224 (10.0%) |
| $100,000+ | 603 (25.4%) | 345 (15.3%) |
| Total | 2,379 (100.0%) | 2,250 (100.0%) |
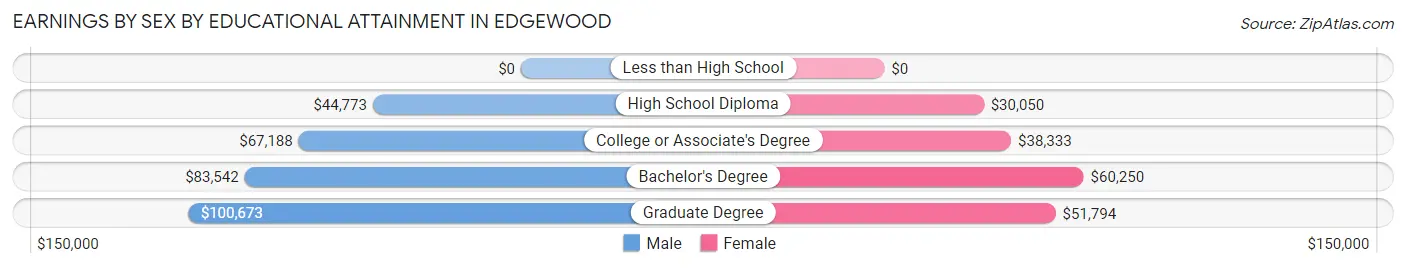
Earnings by Sex by Educational Attainment in Edgewood
Average earnings in Edgewood are $74,926 for men and $45,046 for women, a difference of 39.9%. Men with an educational attainment of graduate degree enjoy the highest average annual earnings of $100,673, while those with high school diploma education earn the least with $44,773. Women with an educational attainment of bachelor's degree earn the most with the average annual earnings of $60,250, while those with high school diploma education have the smallest earnings of $30,050.
| Educational Attainment | Male Income | Female Income |
| Less than High School | - | - |
| High School Diploma | $44,773 | $30,050 |
| College or Associate's Degree | $67,188 | $38,333 |
| Bachelor's Degree | $83,542 | $60,250 |
| Graduate Degree | $100,673 | $51,794 |
| Total | $74,926 | $45,046 |
Family Income in Edgewood
Family Income Brackets in Edgewood
According to the Edgewood family income data, there are 664 families falling into the $100,000 to $149,999 income range, which is the most common income bracket and makes up 26.9% of all families. Conversely, the $15,000 to $24,999 income bracket is the least frequent group with only 7 families (0.3%) belonging to this category.
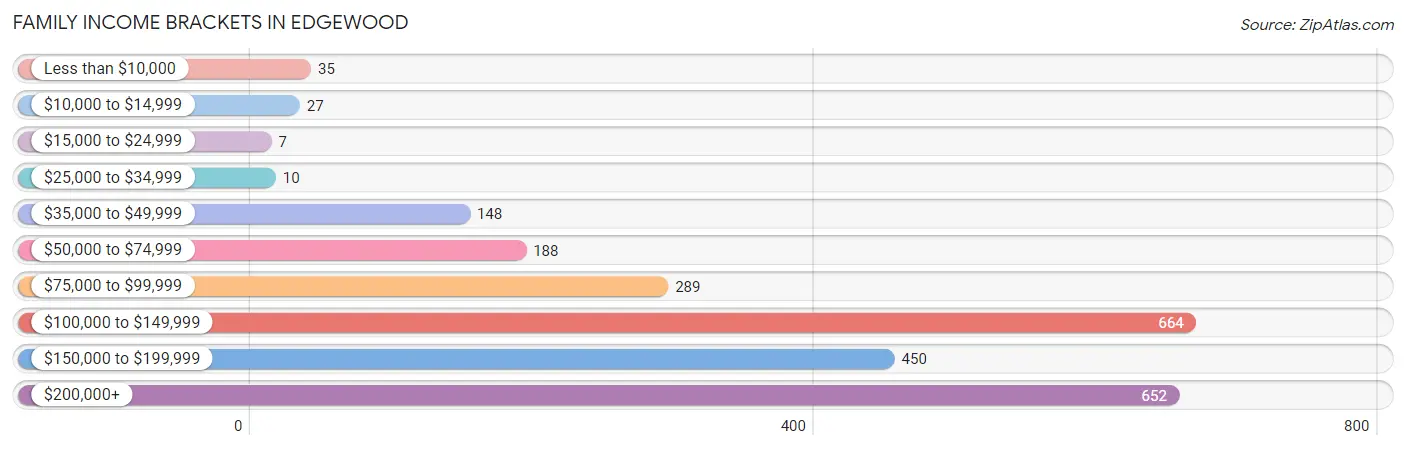
| Income Bracket | # Families | % Families |
| Less than $10,000 | 35 | 1.4% |
| $10,000 to $14,999 | 27 | 1.1% |
| $15,000 to $24,999 | 7 | 0.3% |
| $25,000 to $34,999 | 10 | 0.4% |
| $35,000 to $49,999 | 148 | 6.0% |
| $50,000 to $74,999 | 188 | 7.6% |
| $75,000 to $99,999 | 289 | 11.7% |
| $100,000 to $149,999 | 664 | 26.9% |
| $150,000 to $199,999 | 450 | 18.2% |
| $200,000+ | 652 | 26.4% |
Family Income by Famaliy Size in Edgewood
6-person families (110 | 4.4%) account for the highest median family income in Edgewood with $250,001 per family, while 2-person families (1,153 | 46.7%) have the highest median income of $59,810 per family member.
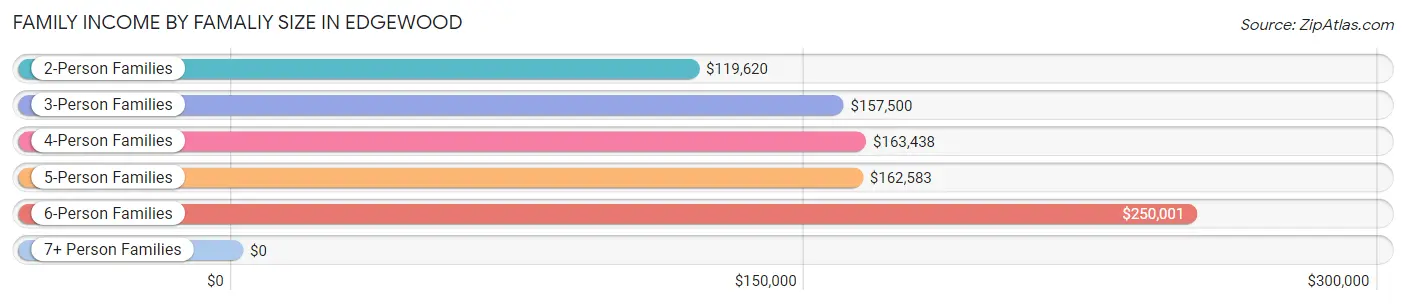
| Income Bracket | # Families | Median Income |
| 2-Person Families | 1,153 (46.7%) | $119,620 |
| 3-Person Families | 448 (18.1%) | $157,500 |
| 4-Person Families | 424 (17.2%) | $163,438 |
| 5-Person Families | 301 (12.2%) | $162,583 |
| 6-Person Families | 110 (4.4%) | $250,001 |
| 7+ Person Families | 34 (1.4%) | $0 |
| Total | 2,470 (100.0%) | $133,276 |
Family Income by Number of Earners in Edgewood
The median family income in Edgewood is $133,276, with families comprising 3+ earners (345) having the highest median family income of $201,563, while families with no earners (393) have the lowest median family income of $84,750, accounting for 14.0% and 15.9% of families, respectively.
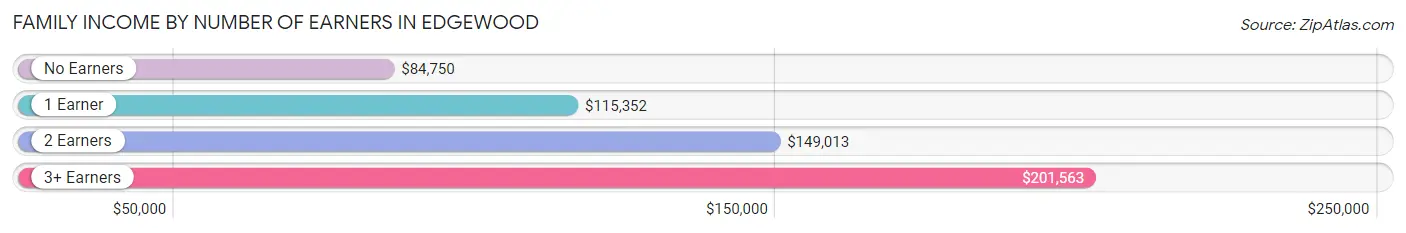
| Number of Earners | # Families | Median Income |
| No Earners | 393 (15.9%) | $84,750 |
| 1 Earner | 507 (20.5%) | $115,352 |
| 2 Earners | 1,225 (49.6%) | $149,013 |
| 3+ Earners | 345 (14.0%) | $201,563 |
| Total | 2,470 (100.0%) | $133,276 |
Household Income in Edgewood
Household Income Brackets in Edgewood
With 802 households falling in the category, the $100,000 to $149,999 income range is the most frequent in Edgewood, accounting for 24.1% of all households. In contrast, only 33 households (1.0%) fall into the less than $10,000 income bracket, making it the least populous group.
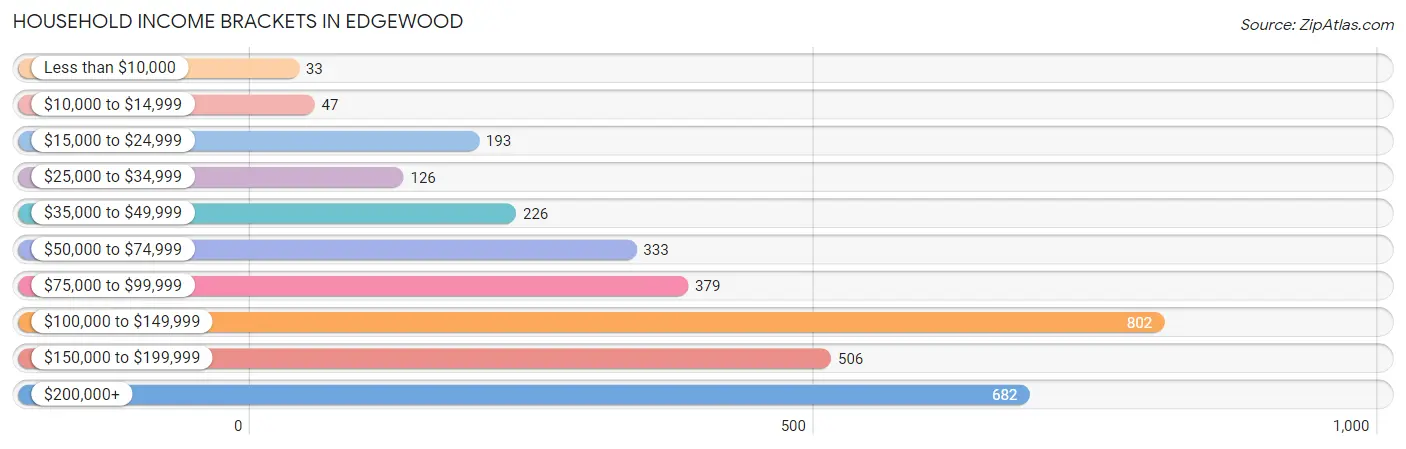
| Income Bracket | # Households | % Households |
| Less than $10,000 | 33 | 1.0% |
| $10,000 to $14,999 | 47 | 1.4% |
| $15,000 to $24,999 | 193 | 5.8% |
| $25,000 to $34,999 | 126 | 3.8% |
| $35,000 to $49,999 | 226 | 6.8% |
| $50,000 to $74,999 | 333 | 10.0% |
| $75,000 to $99,999 | 379 | 11.4% |
| $100,000 to $149,999 | 802 | 24.1% |
| $150,000 to $199,999 | 506 | 15.2% |
| $200,000+ | 682 | 20.5% |
Household Income by Householder Age in Edgewood
The median household income in Edgewood is $117,308, with the highest median household income of $153,688 found in the 45 to 64 years age bracket for the primary householder. A total of 905 households (27.2%) fall into this category. Meanwhile, the 15 to 24 years age bracket for the primary householder has the lowest median household income of $0, with 19 households (0.6%) in this group.
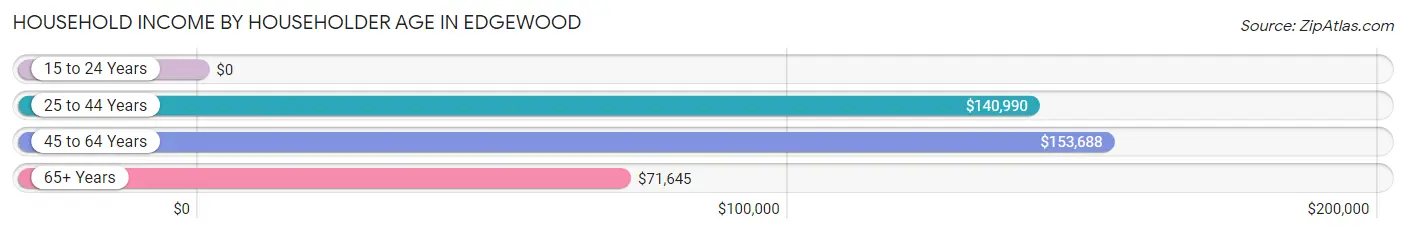
| Income Bracket | # Households | Median Income |
| 15 to 24 Years | 19 (0.6%) | $0 |
| 25 to 44 Years | 953 (28.6%) | $140,990 |
| 45 to 64 Years | 905 (27.2%) | $153,688 |
| 65+ Years | 1,449 (43.6%) | $71,645 |
| Total | 3,326 (100.0%) | $117,308 |
Poverty in Edgewood
Income Below Poverty by Sex and Age in Edgewood
With 2.5% poverty level for males and 3.5% for females among the residents of Edgewood, 6 to 11 year old males and 12 to 14 year old females are the most vulnerable to poverty, with 29 males (9.9%) and 14 females (8.2%) in their respective age groups living below the poverty level.
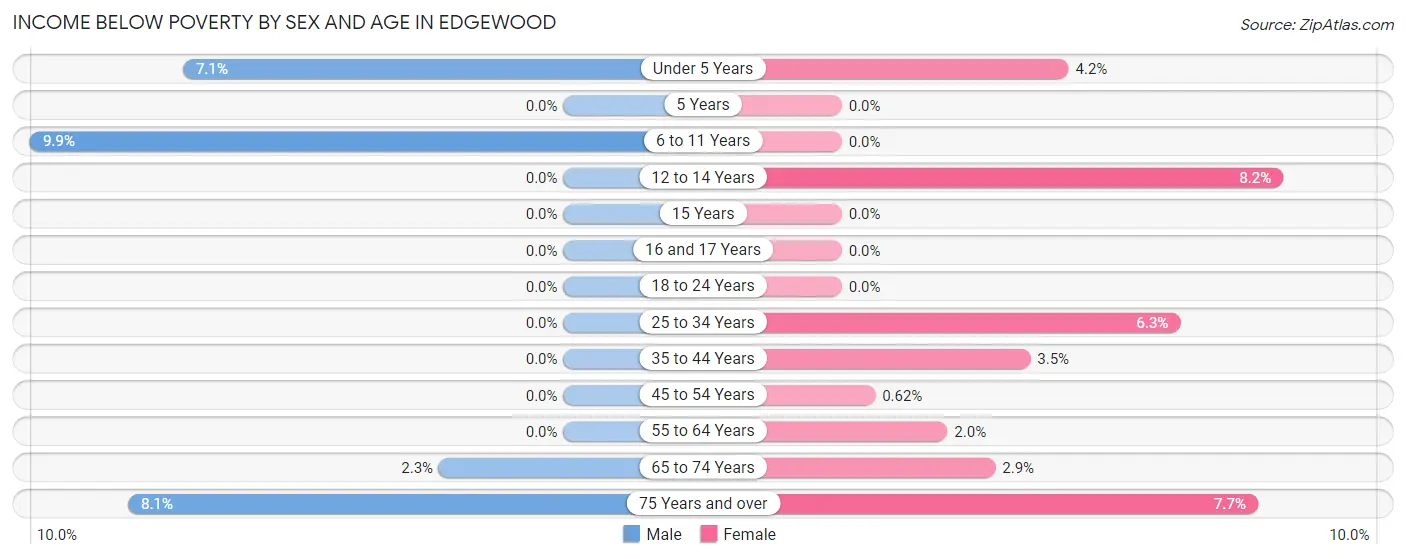
| Age Bracket | Male | Female |
| Under 5 Years | 23 (7.1%) | 12 (4.2%) |
| 5 Years | 0 (0.0%) | 0 (0.0%) |
| 6 to 11 Years | 29 (9.9%) | 0 (0.0%) |
| 12 to 14 Years | 0 (0.0%) | 14 (8.2%) |
| 15 Years | 0 (0.0%) | 0 (0.0%) |
| 16 and 17 Years | 0 (0.0%) | 0 (0.0%) |
| 18 to 24 Years | 0 (0.0%) | 0 (0.0%) |
| 25 to 34 Years | 0 (0.0%) | 45 (6.3%) |
| 35 to 44 Years | 0 (0.0%) | 14 (3.5%) |
| 45 to 54 Years | 0 (0.0%) | 3 (0.6%) |
| 55 to 64 Years | 0 (0.0%) | 10 (2.0%) |
| 65 to 74 Years | 14 (2.3%) | 18 (2.9%) |
| 75 Years and over | 35 (8.1%) | 37 (7.7%) |
| Total | 101 (2.5%) | 153 (3.5%) |
Income Above Poverty by Sex and Age in Edgewood
According to the poverty statistics in Edgewood, males aged 5 years and females aged 5 years are the age groups that are most secure financially, with 100.0% of males and 100.0% of females in these age groups living above the poverty line.
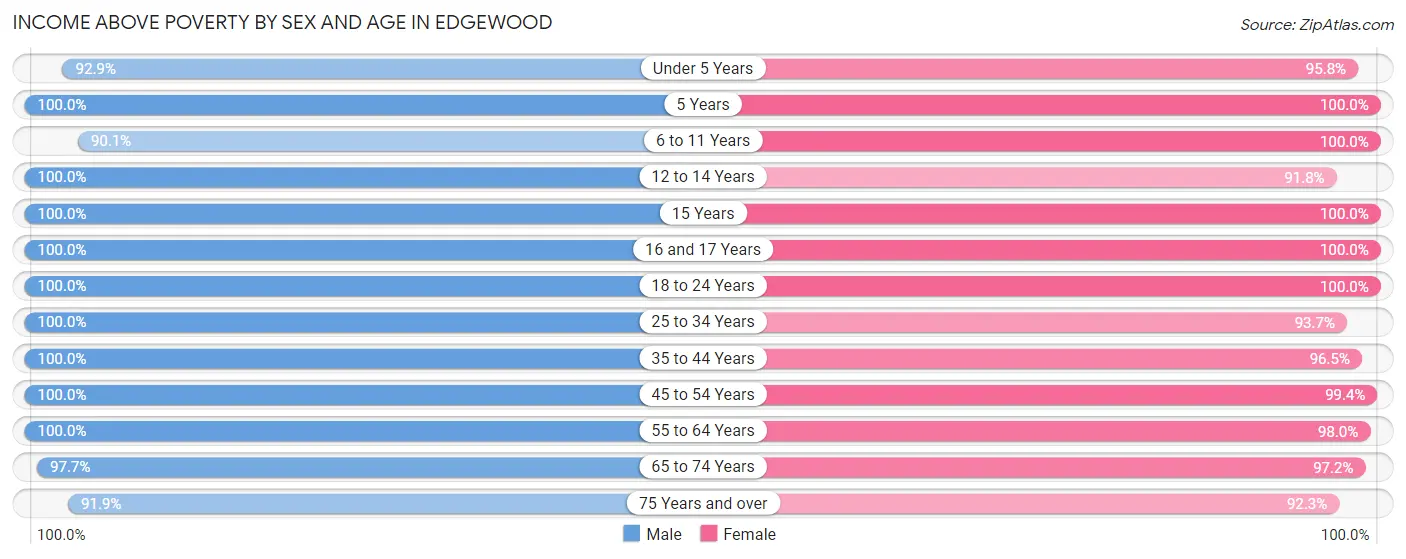
| Age Bracket | Male | Female |
| Under 5 Years | 303 (92.9%) | 273 (95.8%) |
| 5 Years | 13 (100.0%) | 86 (100.0%) |
| 6 to 11 Years | 264 (90.1%) | 275 (100.0%) |
| 12 to 14 Years | 147 (100.0%) | 157 (91.8%) |
| 15 Years | 21 (100.0%) | 23 (100.0%) |
| 16 and 17 Years | 100 (100.0%) | 178 (100.0%) |
| 18 to 24 Years | 276 (100.0%) | 109 (100.0%) |
| 25 to 34 Years | 515 (100.0%) | 672 (93.7%) |
| 35 to 44 Years | 476 (100.0%) | 386 (96.5%) |
| 45 to 54 Years | 445 (100.0%) | 481 (99.4%) |
| 55 to 64 Years | 448 (100.0%) | 501 (98.0%) |
| 65 to 74 Years | 591 (97.7%) | 613 (97.2%) |
| 75 Years and over | 398 (91.9%) | 442 (92.3%) |
| Total | 3,997 (97.5%) | 4,196 (96.5%) |
Income Below Poverty Among Married-Couple Families in Edgewood
The poverty statistics for married-couple families in Edgewood show that 2.2% or 49 of the total 2,246 families live below the poverty line. Families with no children have the highest poverty rate of 3.9%, comprising of 49 families. On the other hand, families with 1 or 2 children have the lowest poverty rate of 0.0%, which includes 0 families.
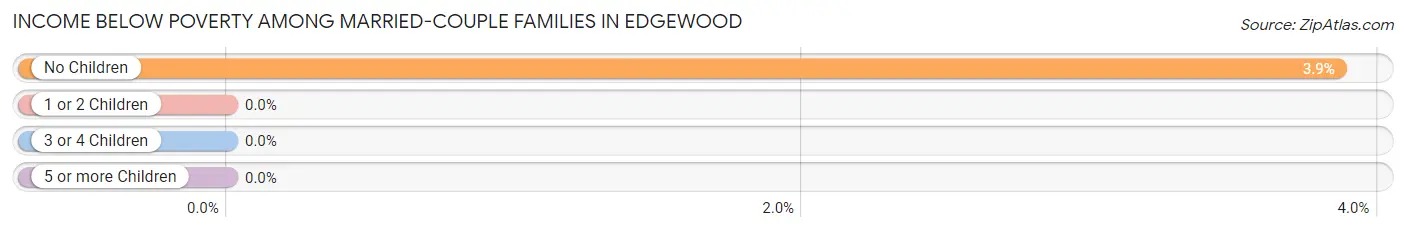
| Children | Above Poverty | Below Poverty |
| No Children | 1,220 (96.1%) | 49 (3.9%) |
| 1 or 2 Children | 699 (100.0%) | 0 (0.0%) |
| 3 or 4 Children | 278 (100.0%) | 0 (0.0%) |
| 5 or more Children | 0 (0.0%) | 0 (0.0%) |
| Total | 2,197 (97.8%) | 49 (2.2%) |
Income Below Poverty Among Single-Parent Households in Edgewood
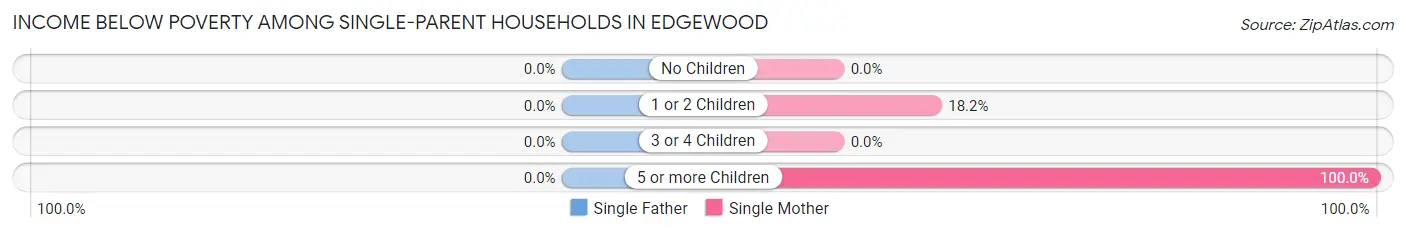
| Children | Single Father | Single Mother |
| No Children | 0 (0.0%) | 0 (0.0%) |
| 1 or 2 Children | 0 (0.0%) | 12 (18.2%) |
| 3 or 4 Children | 0 (0.0%) | 0 (0.0%) |
| 5 or more Children | 0 (0.0%) | 14 (100.0%) |
| Total | 0 (0.0%) | 26 (21.7%) |
Income Below Poverty Among Married-Couple vs Single-Parent Households in Edgewood
The poverty data for Edgewood shows that 49 of the married-couple family households (2.2%) and 26 of the single-parent households (11.6%) are living below the poverty level. Within the married-couple family households, those with no children have the highest poverty rate, with 49 households (3.9%) falling below the poverty line. Among the single-parent households, those with 5 or more children have the highest poverty rate, with 14 household (100.0%) living below poverty.
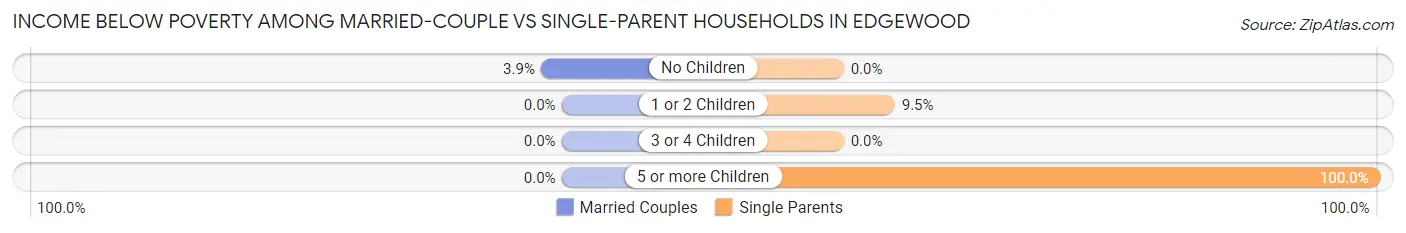
| Children | Married-Couple Families | Single-Parent Households |
| No Children | 49 (3.9%) | 0 (0.0%) |
| 1 or 2 Children | 0 (0.0%) | 12 (9.5%) |
| 3 or 4 Children | 0 (0.0%) | 0 (0.0%) |
| 5 or more Children | 0 (0.0%) | 14 (100.0%) |
| Total | 49 (2.2%) | 26 (11.6%) |
Race in Edgewood
The most populous races in Edgewood are White / Caucasian (8,000 | 94.7%), Black / African American (265 | 3.1%), and Asian (95 | 1.1%).
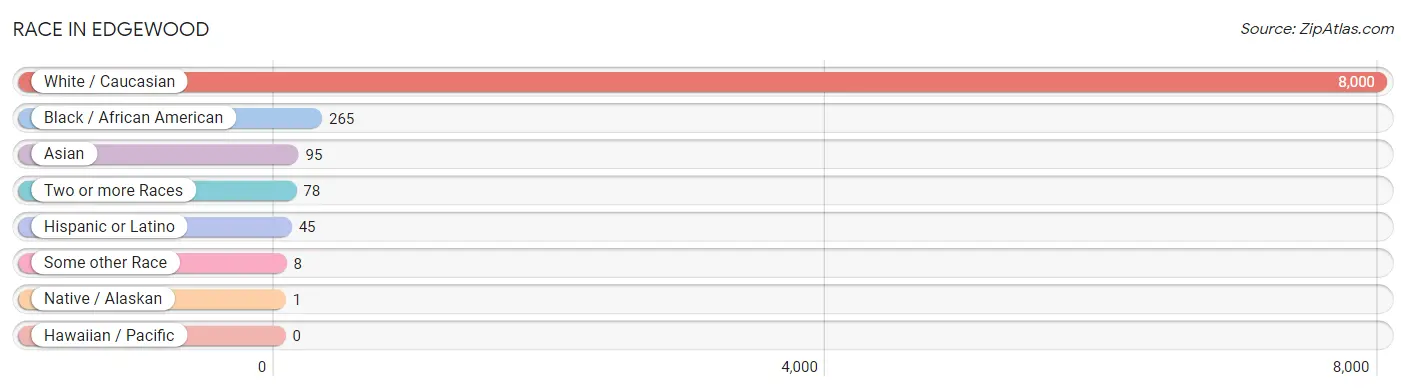
| Race | # Population | % Population |
| Asian | 95 | 1.1% |
| Black / African American | 265 | 3.1% |
| Hawaiian / Pacific | 0 | 0.0% |
| Hispanic or Latino | 45 | 0.5% |
| Native / Alaskan | 1 | 0.0% |
| White / Caucasian | 8,000 | 94.7% |
| Two or more Races | 78 | 0.9% |
| Some other Race | 8 | 0.1% |
| Total | 8,447 | 100.0% |
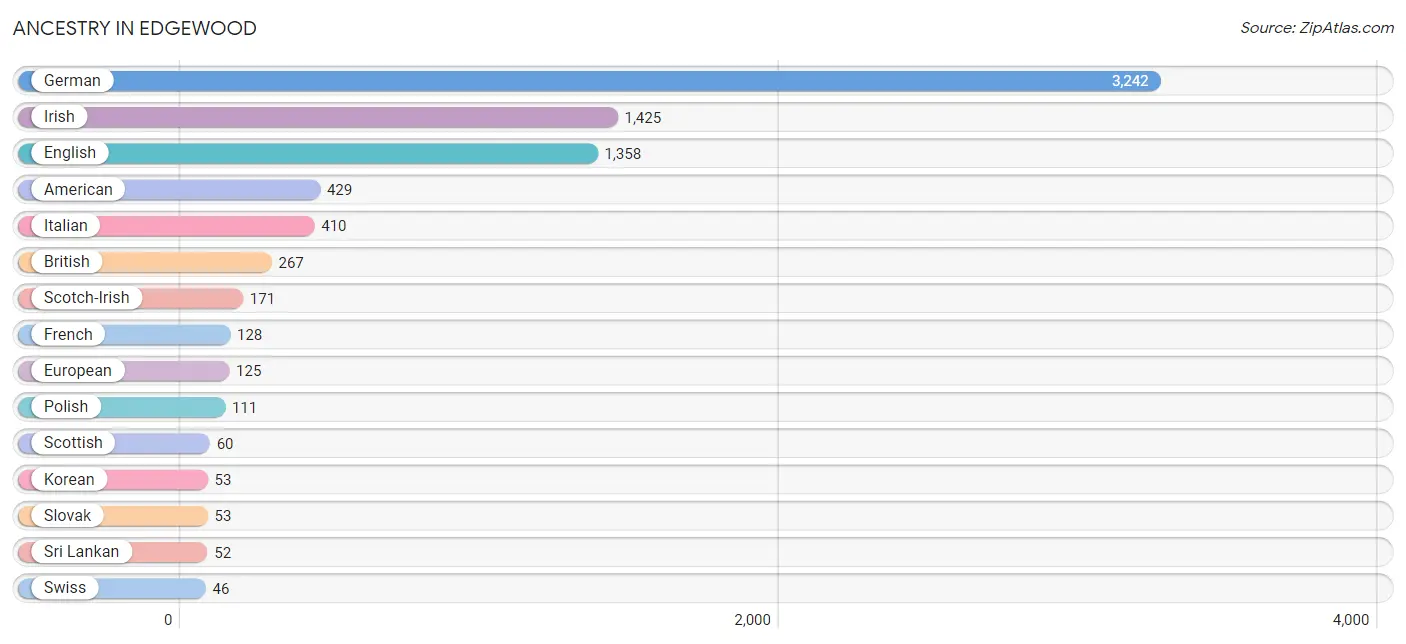
Ancestry in Edgewood
The most populous ancestries reported in Edgewood are German (3,242 | 38.4%), Irish (1,425 | 16.9%), English (1,358 | 16.1%), American (429 | 5.1%), and Italian (410 | 4.9%), together accounting for 81.3% of all Edgewood residents.
| Ancestry | # Population | % Population |
| American | 429 | 5.1% |
| Austrian | 34 | 0.4% |
| British | 267 | 3.2% |
| Canadian | 20 | 0.2% |
| Celtic | 9 | 0.1% |
| Cherokee | 1 | 0.0% |
| Czech | 21 | 0.3% |
| Czechoslovakian | 40 | 0.5% |
| Danish | 7 | 0.1% |
| Dutch | 29 | 0.3% |
| Eastern European | 14 | 0.2% |
| Ecuadorian | 7 | 0.1% |
| English | 1,358 | 16.1% |
| European | 125 | 1.5% |
| French | 128 | 1.5% |
| French Canadian | 22 | 0.3% |
| German | 3,242 | 38.4% |
| Greek | 12 | 0.1% |
| Hungarian | 44 | 0.5% |
| Indian (Asian) | 13 | 0.2% |
| Irish | 1,425 | 16.9% |
| Italian | 410 | 4.9% |
| Korean | 53 | 0.6% |
| Liberian | 45 | 0.5% |
| Mexican | 17 | 0.2% |
| Nigerian | 45 | 0.5% |
| Norwegian | 16 | 0.2% |
| Polish | 111 | 1.3% |
| Puerto Rican | 21 | 0.3% |
| Russian | 33 | 0.4% |
| Scandinavian | 9 | 0.1% |
| Scotch-Irish | 171 | 2.0% |
| Scottish | 60 | 0.7% |
| Slovak | 53 | 0.6% |
| South American | 7 | 0.1% |
| Sri Lankan | 52 | 0.6% |
| Subsaharan African | 45 | 0.5% |
| Swedish | 21 | 0.3% |
| Swiss | 46 | 0.5% |
| Thai | 5 | 0.1% |
| Welsh | 5 | 0.1% | View All 41 Rows |
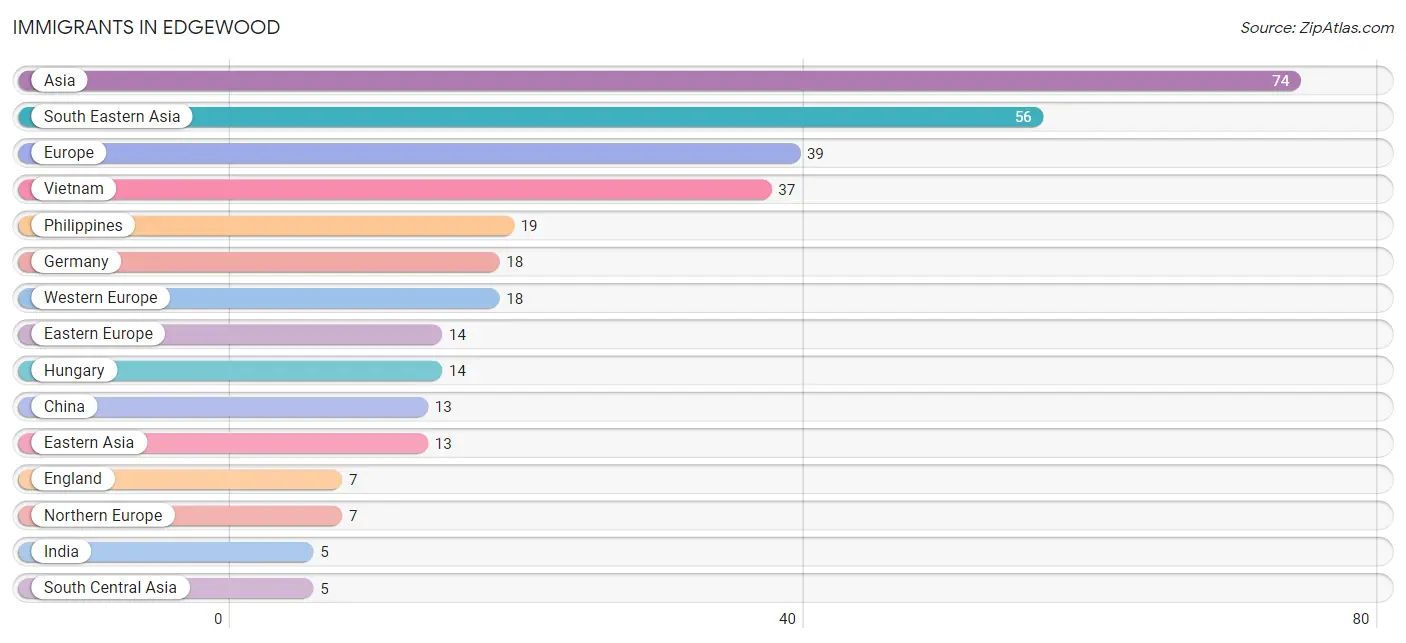
Immigrants in Edgewood
The most numerous immigrant groups reported in Edgewood came from Asia (74 | 0.9%), South Eastern Asia (56 | 0.7%), Europe (39 | 0.5%), Vietnam (37 | 0.4%), and Philippines (19 | 0.2%), together accounting for 2.7% of all Edgewood residents.
| Immigration Origin | # Population | % Population |
| Asia | 74 | 0.9% |
| China | 13 | 0.2% |
| Eastern Asia | 13 | 0.2% |
| Eastern Europe | 14 | 0.2% |
| England | 7 | 0.1% |
| Europe | 39 | 0.5% |
| Germany | 18 | 0.2% |
| Hungary | 14 | 0.2% |
| India | 5 | 0.1% |
| Northern Europe | 7 | 0.1% |
| Philippines | 19 | 0.2% |
| South Central Asia | 5 | 0.1% |
| South Eastern Asia | 56 | 0.7% |
| Vietnam | 37 | 0.4% |
| Western Europe | 18 | 0.2% | View All 15 Rows |
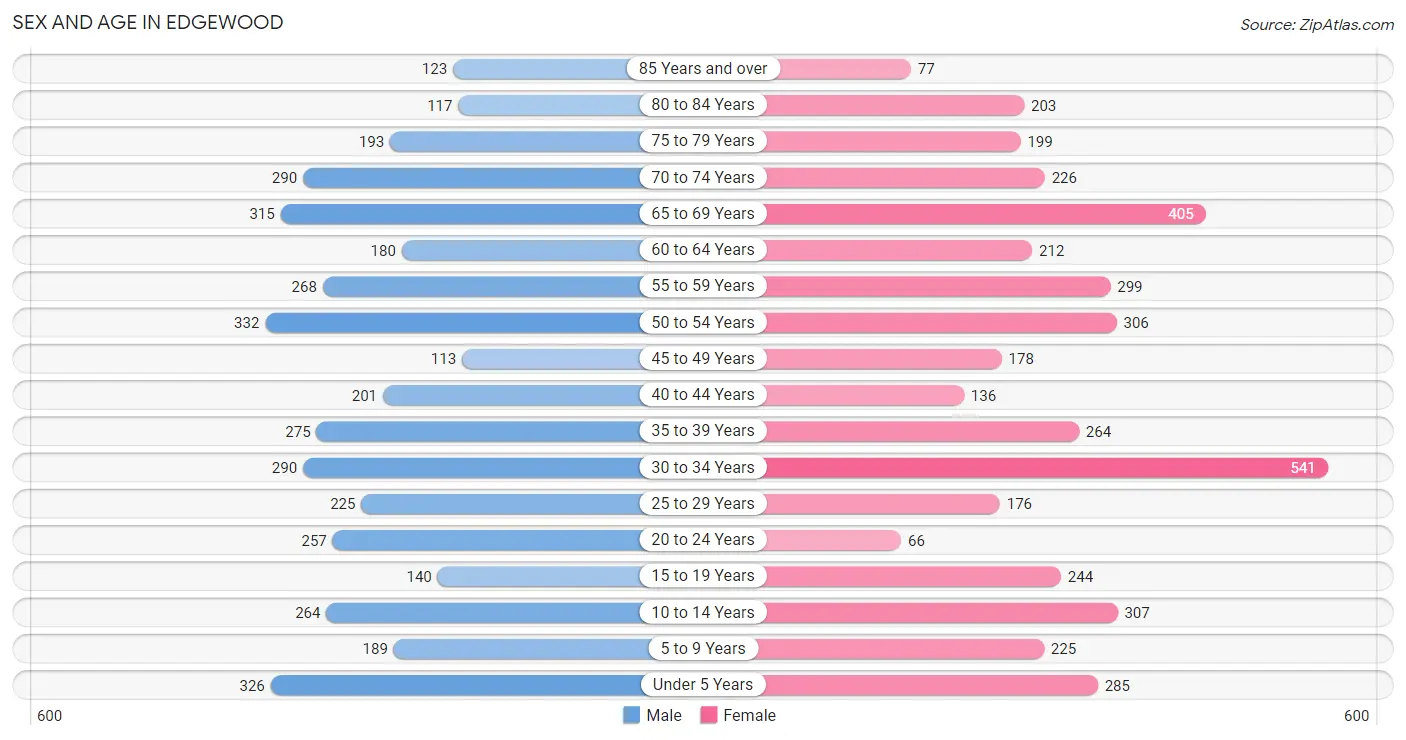
Sex and Age in Edgewood
Sex and Age in Edgewood
The most populous age groups in Edgewood are 50 to 54 Years (332 | 8.1%) for men and 30 to 34 Years (541 | 12.4%) for women.
| Age Bracket | Male | Female |
| Under 5 Years | 326 (8.0%) | 285 (6.6%) |
| 5 to 9 Years | 189 (4.6%) | 225 (5.2%) |
| 10 to 14 Years | 264 (6.4%) | 307 (7.1%) |
| 15 to 19 Years | 140 (3.4%) | 244 (5.6%) |
| 20 to 24 Years | 257 (6.3%) | 66 (1.5%) |
| 25 to 29 Years | 225 (5.5%) | 176 (4.1%) |
| 30 to 34 Years | 290 (7.1%) | 541 (12.4%) |
| 35 to 39 Years | 275 (6.7%) | 264 (6.1%) |
| 40 to 44 Years | 201 (4.9%) | 136 (3.1%) |
| 45 to 49 Years | 113 (2.8%) | 178 (4.1%) |
| 50 to 54 Years | 332 (8.1%) | 306 (7.0%) |
| 55 to 59 Years | 268 (6.5%) | 299 (6.9%) |
| 60 to 64 Years | 180 (4.4%) | 212 (4.9%) |
| 65 to 69 Years | 315 (7.7%) | 405 (9.3%) |
| 70 to 74 Years | 290 (7.1%) | 226 (5.2%) |
| 75 to 79 Years | 193 (4.7%) | 199 (4.6%) |
| 80 to 84 Years | 117 (2.9%) | 203 (4.7%) |
| 85 Years and over | 123 (3.0%) | 77 (1.8%) |
| Total | 4,098 (100.0%) | 4,349 (100.0%) |
Families and Households in Edgewood
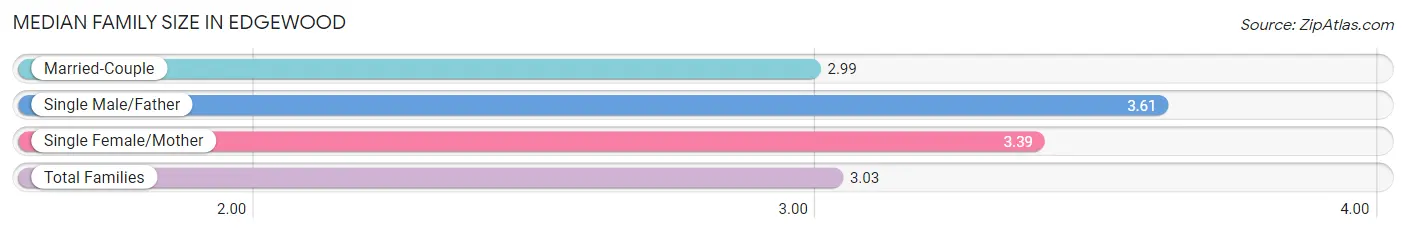
Median Family Size in Edgewood
The median family size in Edgewood is 3.03 persons per family, with single male/father families (104 | 4.2%) accounting for the largest median family size of 3.61 persons per family. On the other hand, married-couple families (2,246 | 90.9%) represent the smallest median family size with 2.99 persons per family.
| Family Type | # Families | Family Size |
| Married-Couple | 2,246 (90.9%) | 2.99 |
| Single Male/Father | 104 (4.2%) | 3.61 |
| Single Female/Mother | 120 (4.9%) | 3.39 |
| Total Families | 2,470 (100.0%) | 3.03 |
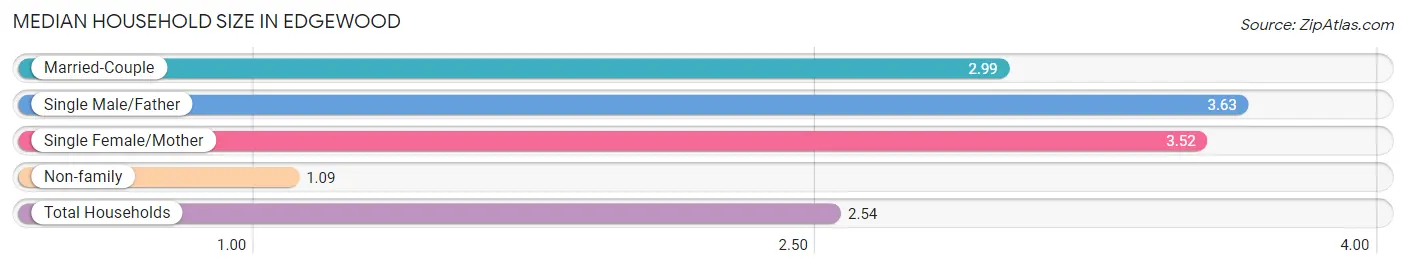
Median Household Size in Edgewood
The median household size in Edgewood is 2.54 persons per household, with single male/father households (104 | 3.1%) accounting for the largest median household size of 3.63 persons per household. non-family households (856 | 25.7%) represent the smallest median household size with 1.09 persons per household.
| Household Type | # Households | Household Size |
| Married-Couple | 2,246 (67.5%) | 2.99 |
| Single Male/Father | 104 (3.1%) | 3.63 |
| Single Female/Mother | 120 (3.6%) | 3.52 |
| Non-family | 856 (25.7%) | 1.09 |
| Total Households | 3,326 (100.0%) | 2.54 |
Household Size by Marriage Status in Edgewood
Out of a total of 3,326 households in Edgewood, 2,470 (74.3%) are family households, while 856 (25.7%) are nonfamily households. The most numerous type of family households are 2-person households, comprising 1,144, and the most common type of nonfamily households are 1-person households, comprising 774.
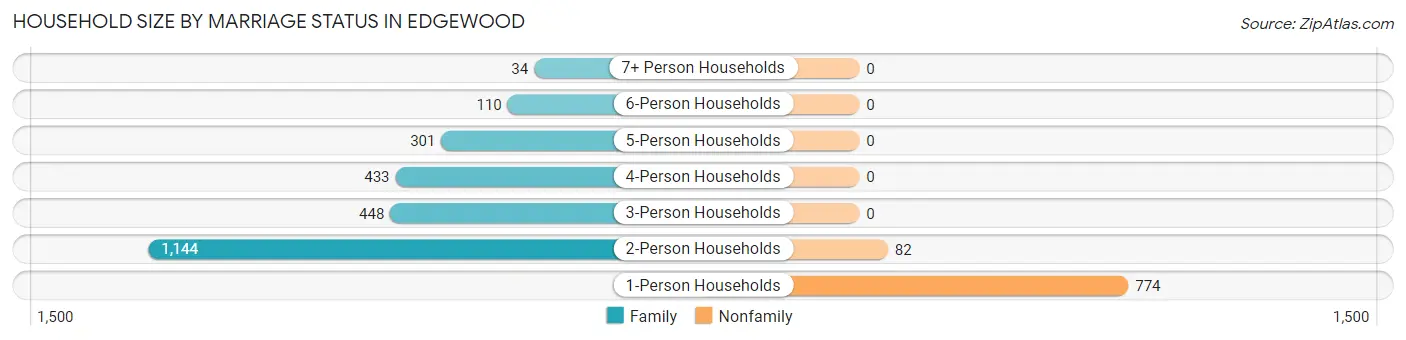
| Household Size | Family Households | Nonfamily Households |
| 1-Person Households | - | 774 (23.3%) |
| 2-Person Households | 1,144 (34.4%) | 82 (2.5%) |
| 3-Person Households | 448 (13.5%) | 0 (0.0%) |
| 4-Person Households | 433 (13.0%) | 0 (0.0%) |
| 5-Person Households | 301 (9.0%) | 0 (0.0%) |
| 6-Person Households | 110 (3.3%) | 0 (0.0%) |
| 7+ Person Households | 34 (1.0%) | 0 (0.0%) |
| Total | 2,470 (74.3%) | 856 (25.7%) |
Female Fertility in Edgewood
Fertility by Age in Edgewood
Average fertility rate in Edgewood is 109.0 births per 1,000 women. Women in the age bracket of 20 to 34 years have the highest fertility rate with 183.0 births per 1,000 women. Women in the age bracket of 20 to 34 years acount for 80.8% of all women with births.
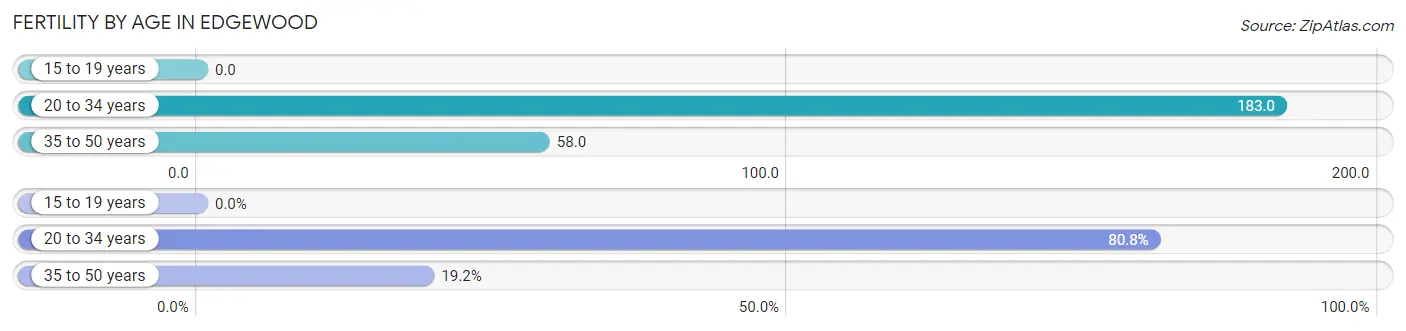
| Age Bracket | Women with Births | Births / 1,000 Women |
| 15 to 19 years | 0 (0.0%) | 0.0 |
| 20 to 34 years | 143 (80.8%) | 183.0 |
| 35 to 50 years | 34 (19.2%) | 58.0 |
| Total | 177 (100.0%) | 109.0 |
Fertility by Age by Marriage Status in Edgewood
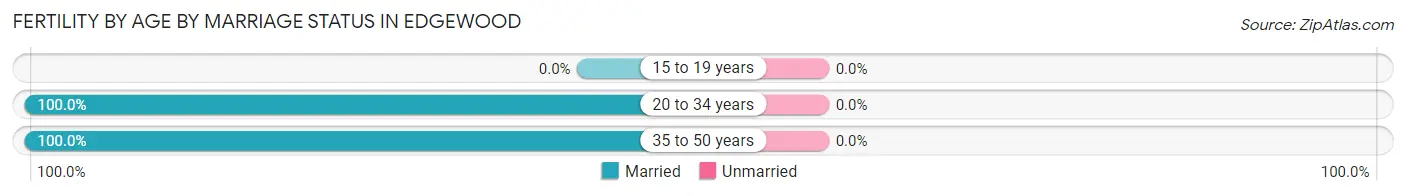
| Age Bracket | Married | Unmarried |
| 15 to 19 years | 0 (0.0%) | 0 (0.0%) |
| 20 to 34 years | 143 (100.0%) | 0 (0.0%) |
| 35 to 50 years | 34 (100.0%) | 0 (0.0%) |
| Total | 177 (100.0%) | 0 (0.0%) |
Fertility by Education in Edgewood
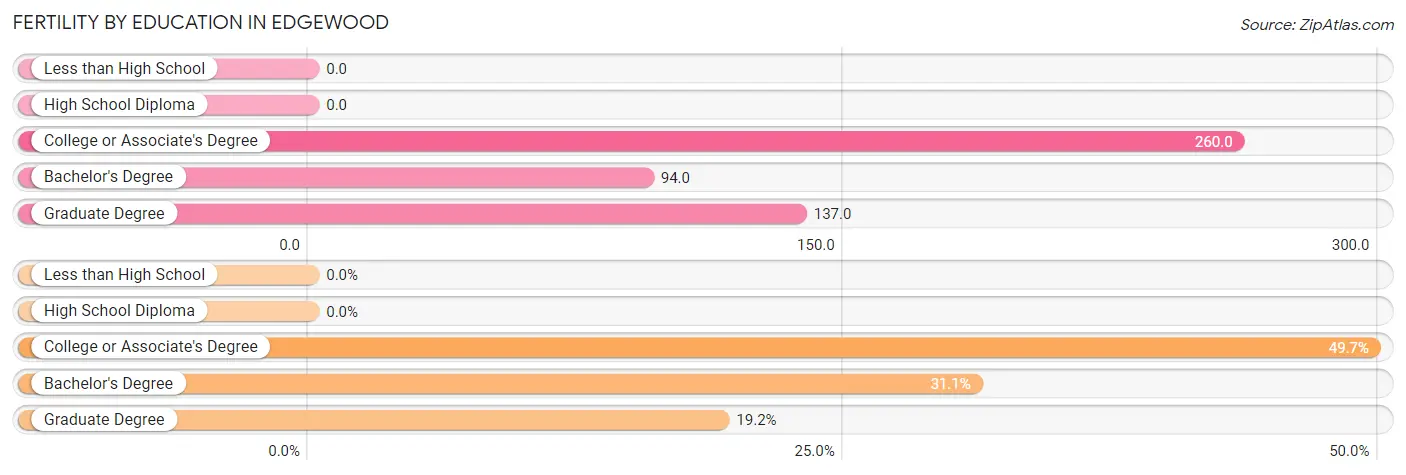
| Educational Attainment | Women with Births | Births / 1,000 Women |
| Less than High School | 0 (0.0%) | 0.0 |
| High School Diploma | 0 (0.0%) | 0.0 |
| College or Associate's Degree | 88 (49.7%) | 260.0 |
| Bachelor's Degree | 55 (31.1%) | 94.0 |
| Graduate Degree | 34 (19.2%) | 137.0 |
| Total | 177 (100.0%) | 109.0 |
Fertility by Education by Marriage Status in Edgewood
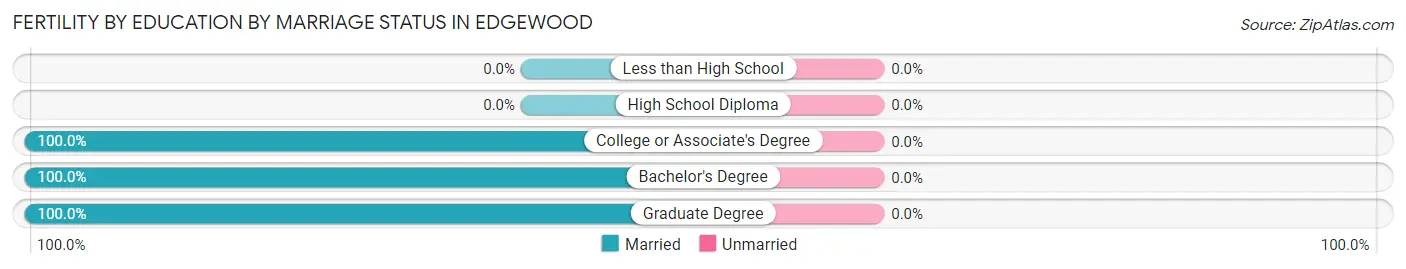
| Educational Attainment | Married | Unmarried |
| Less than High School | 0 (0.0%) | 0 (0.0%) |
| High School Diploma | 0 (0.0%) | 0 (0.0%) |
| College or Associate's Degree | 88 (100.0%) | 0 (0.0%) |
| Bachelor's Degree | 55 (100.0%) | 0 (0.0%) |
| Graduate Degree | 34 (100.0%) | 0 (0.0%) |
| Total | 177 (100.0%) | 0 (0.0%) |
Employment Characteristics in Edgewood
Employment by Class of Employer in Edgewood
Among the 4,161 employed individuals in Edgewood, private company employees (3,024 | 72.7%), not-for-profit organizations (661 | 15.9%), and self-employed (not incorporated) (147 | 3.5%) make up the most common classes of employment.
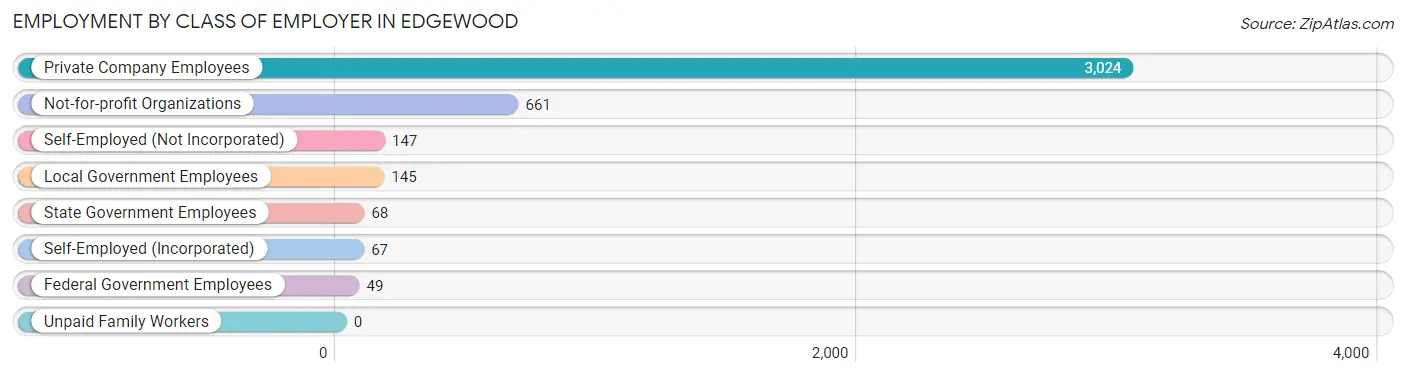
| Employer Class | # Employees | % Employees |
| Private Company Employees | 3,024 | 72.7% |
| Self-Employed (Incorporated) | 67 | 1.6% |
| Self-Employed (Not Incorporated) | 147 | 3.5% |
| Not-for-profit Organizations | 661 | 15.9% |
| Local Government Employees | 145 | 3.5% |
| State Government Employees | 68 | 1.6% |
| Federal Government Employees | 49 | 1.2% |
| Unpaid Family Workers | 0 | 0.0% |
| Total | 4,161 | 100.0% |
Employment Status by Age in Edgewood
According to the labor force statistics for Edgewood, out of the total population over 16 years of age (6,807), 62.7% or 4,268 individuals are in the labor force, with 1.5% or 64 of them unemployed. The age group with the highest labor force participation rate is 30 to 34 years, with 97.8% or 813 individuals in the labor force. Within the labor force, the 60 to 64 years age range has the highest percentage of unemployed individuals, with 7.0% or 21 of them being unemployed.
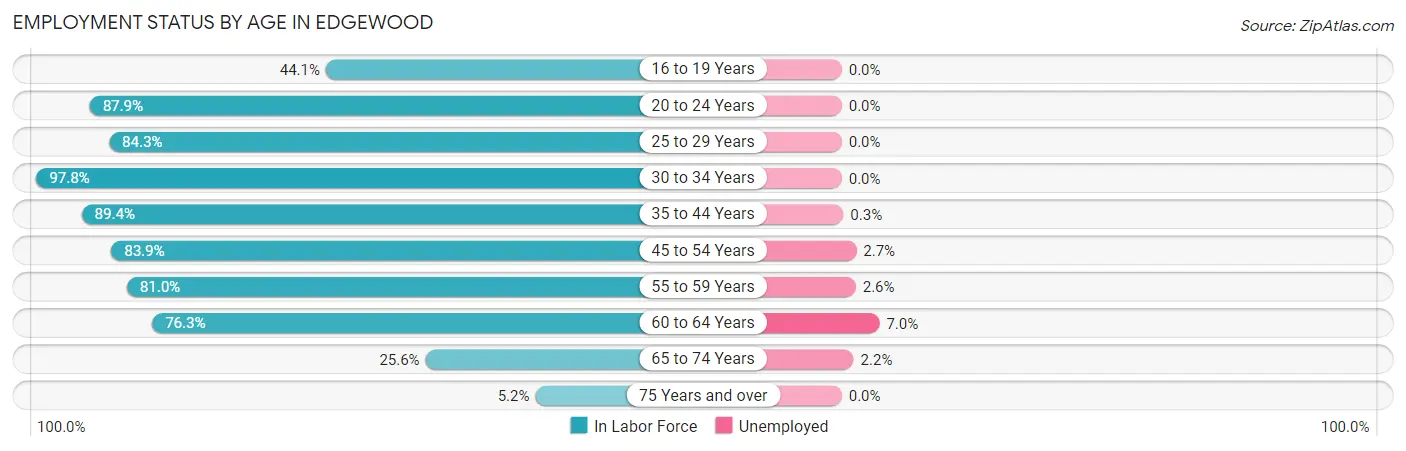
| Age Bracket | In Labor Force | Unemployed |
| 16 to 19 Years | 150 (44.1%) | 0 (0.0%) |
| 20 to 24 Years | 284 (87.9%) | 0 (0.0%) |
| 25 to 29 Years | 338 (84.3%) | 0 (0.0%) |
| 30 to 34 Years | 813 (97.8%) | 0 (0.0%) |
| 35 to 44 Years | 783 (89.4%) | 2 (0.3%) |
| 45 to 54 Years | 779 (83.9%) | 21 (2.7%) |
| 55 to 59 Years | 459 (81.0%) | 12 (2.6%) |
| 60 to 64 Years | 299 (76.3%) | 21 (7.0%) |
| 65 to 74 Years | 316 (25.6%) | 7 (2.2%) |
| 75 Years and over | 47 (5.2%) | 0 (0.0%) |
| Total | 4,268 (62.7%) | 64 (1.5%) |
Employment Status by Educational Attainment in Edgewood
According to labor force statistics for Edgewood, 86.9% of individuals (3,473) out of the total population between 25 and 64 years of age (3,996) are in the labor force, with 1.6% or 56 of them being unemployed. The group with the highest labor force participation rate are those with the educational attainment of bachelor's degree or higher, with 92.8% or 2,194 individuals in the labor force. Within the labor force, individuals with high school diploma education have the highest percentage of unemployment, with 4.4% or 18 of them being unemployed.
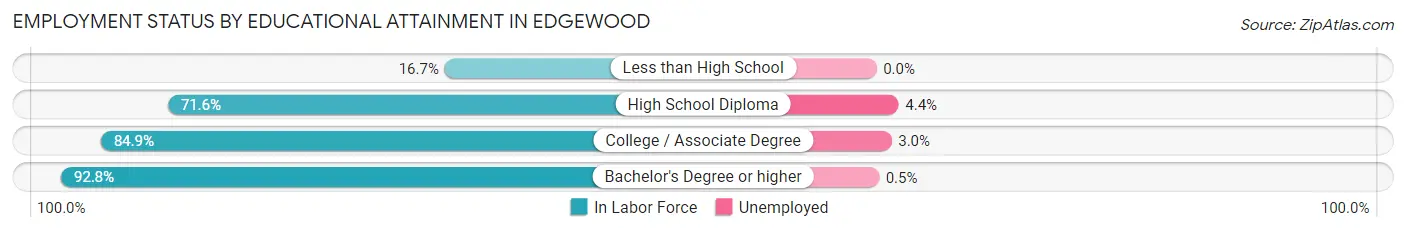
| Educational Attainment | In Labor Force | Unemployed |
| Less than High School | 8 (16.7%) | 0 (0.0%) |
| High School Diploma | 406 (71.6%) | 25 (4.4%) |
| College / Associate Degree | 863 (84.9%) | 31 (3.0%) |
| Bachelor's Degree or higher | 2,194 (92.8%) | 12 (0.5%) |
| Total | 3,473 (86.9%) | 64 (1.6%) |
Employment Occupations by Sex in Edgewood
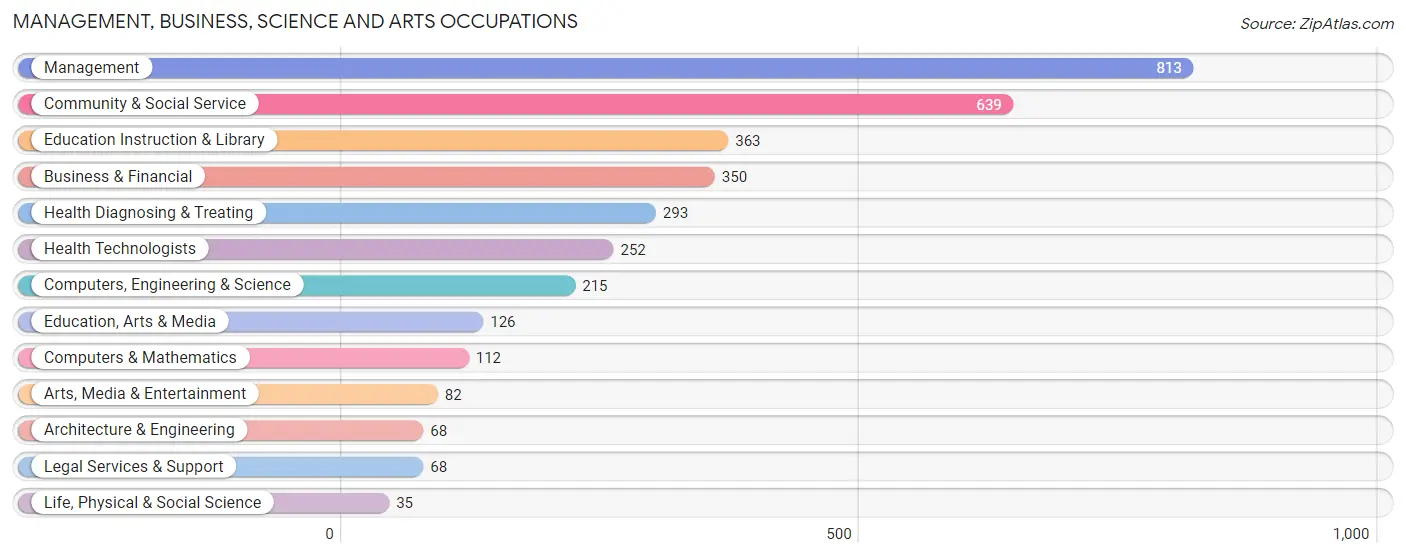
Management, Business, Science and Arts Occupations
The most common Management, Business, Science and Arts occupations in Edgewood are Management (813 | 19.3%), Community & Social Service (639 | 15.2%), Education Instruction & Library (363 | 8.6%), Business & Financial (350 | 8.3%), and Health Diagnosing & Treating (293 | 7.0%).
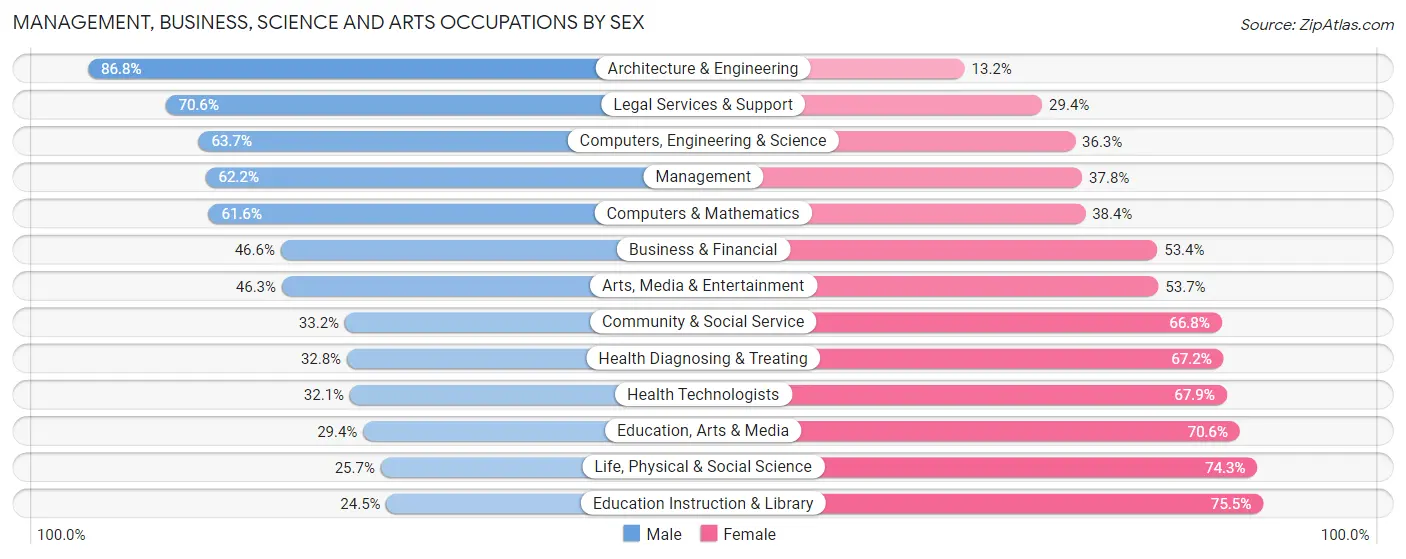
Management, Business, Science and Arts Occupations by Sex
Within the Management, Business, Science and Arts occupations in Edgewood, the most male-oriented occupations are Architecture & Engineering (86.8%), Legal Services & Support (70.6%), and Computers, Engineering & Science (63.7%), while the most female-oriented occupations are Education Instruction & Library (75.5%), Life, Physical & Social Science (74.3%), and Education, Arts & Media (70.6%).
| Occupation | Male | Female |
| Management | 506 (62.2%) | 307 (37.8%) |
| Business & Financial | 163 (46.6%) | 187 (53.4%) |
| Computers, Engineering & Science | 137 (63.7%) | 78 (36.3%) |
| Computers & Mathematics | 69 (61.6%) | 43 (38.4%) |
| Architecture & Engineering | 59 (86.8%) | 9 (13.2%) |
| Life, Physical & Social Science | 9 (25.7%) | 26 (74.3%) |
| Community & Social Service | 212 (33.2%) | 427 (66.8%) |
| Education, Arts & Media | 37 (29.4%) | 89 (70.6%) |
| Legal Services & Support | 48 (70.6%) | 20 (29.4%) |
| Education Instruction & Library | 89 (24.5%) | 274 (75.5%) |
| Arts, Media & Entertainment | 38 (46.3%) | 44 (53.7%) |
| Health Diagnosing & Treating | 96 (32.8%) | 197 (67.2%) |
| Health Technologists | 81 (32.1%) | 171 (67.9%) |
| Total (Category) | 1,114 (48.2%) | 1,196 (51.8%) |
| Total (Overall) | 2,198 (52.3%) | 2,008 (47.7%) |
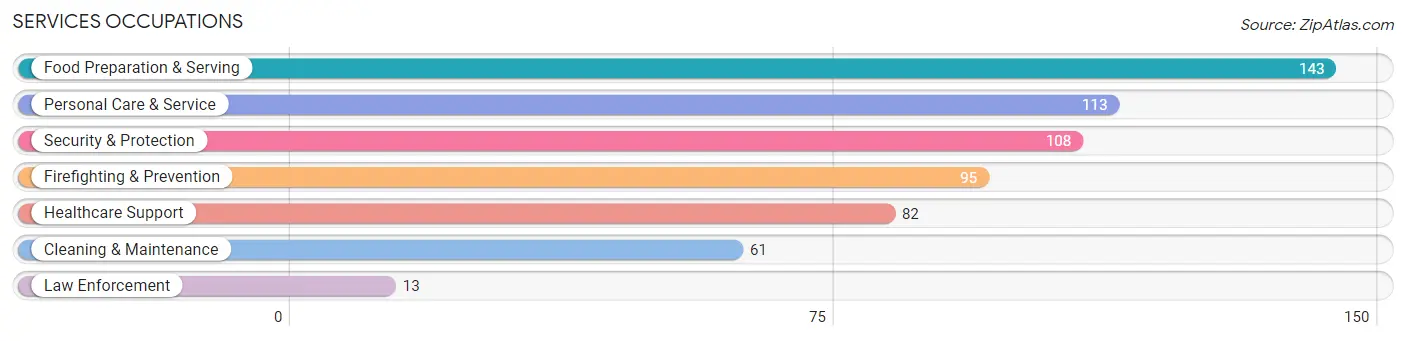
Services Occupations
The most common Services occupations in Edgewood are Food Preparation & Serving (143 | 3.4%), Personal Care & Service (113 | 2.7%), Security & Protection (108 | 2.6%), Firefighting & Prevention (95 | 2.3%), and Healthcare Support (82 | 1.9%).
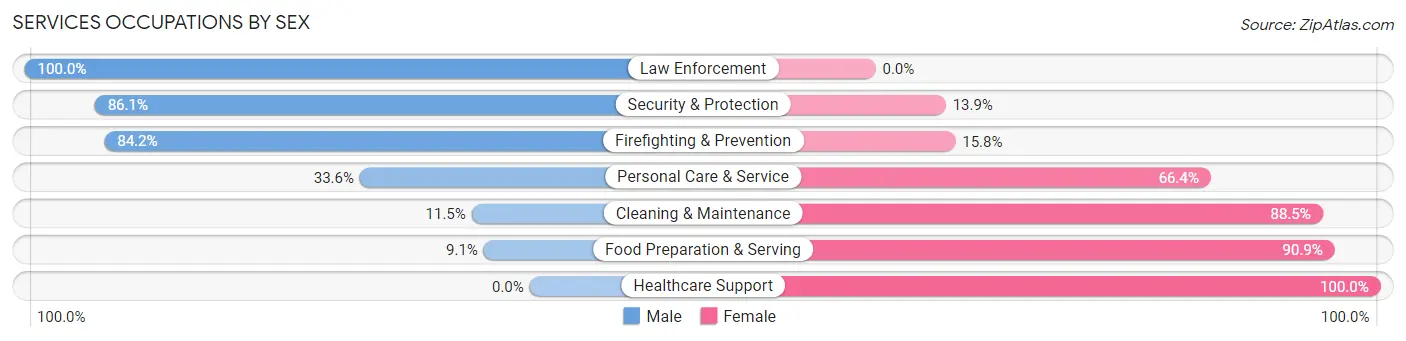
Services Occupations by Sex
Within the Services occupations in Edgewood, the most male-oriented occupations are Law Enforcement (100.0%), Security & Protection (86.1%), and Firefighting & Prevention (84.2%), while the most female-oriented occupations are Healthcare Support (100.0%), Food Preparation & Serving (90.9%), and Cleaning & Maintenance (88.5%).
| Occupation | Male | Female |
| Healthcare Support | 0 (0.0%) | 82 (100.0%) |
| Security & Protection | 93 (86.1%) | 15 (13.9%) |
| Firefighting & Prevention | 80 (84.2%) | 15 (15.8%) |
| Law Enforcement | 13 (100.0%) | 0 (0.0%) |
| Food Preparation & Serving | 13 (9.1%) | 130 (90.9%) |
| Cleaning & Maintenance | 7 (11.5%) | 54 (88.5%) |
| Personal Care & Service | 38 (33.6%) | 75 (66.4%) |
| Total (Category) | 151 (29.8%) | 356 (70.2%) |
| Total (Overall) | 2,198 (52.3%) | 2,008 (47.7%) |
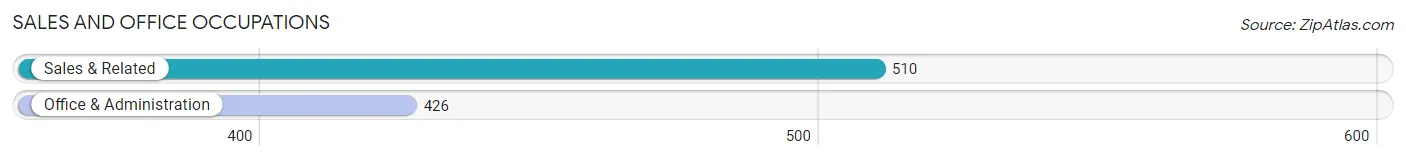
Sales and Office Occupations
The most common Sales and Office occupations in Edgewood are Sales & Related (510 | 12.1%), and Office & Administration (426 | 10.1%).
Sales and Office Occupations by Sex
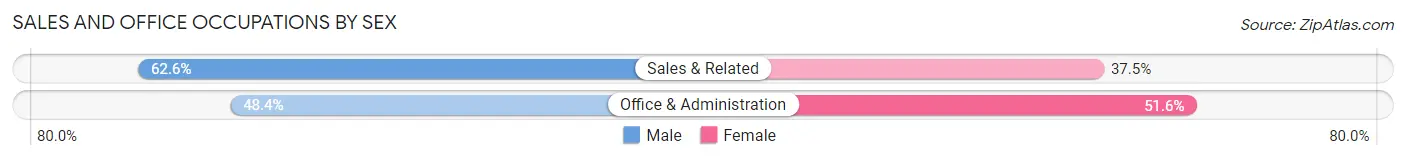
| Occupation | Male | Female |
| Sales & Related | 319 (62.5%) | 191 (37.4%) |
| Office & Administration | 206 (48.4%) | 220 (51.6%) |
| Total (Category) | 525 (56.1%) | 411 (43.9%) |
| Total (Overall) | 2,198 (52.3%) | 2,008 (47.7%) |
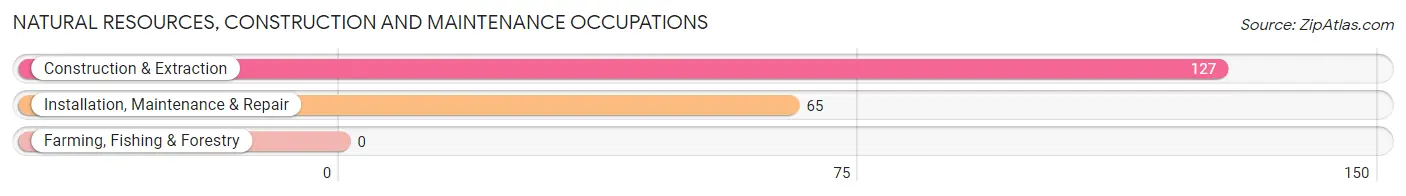
Natural Resources, Construction and Maintenance Occupations
The most common Natural Resources, Construction and Maintenance occupations in Edgewood are Construction & Extraction (127 | 3.0%), and Installation, Maintenance & Repair (65 | 1.5%).
Natural Resources, Construction and Maintenance Occupations by Sex
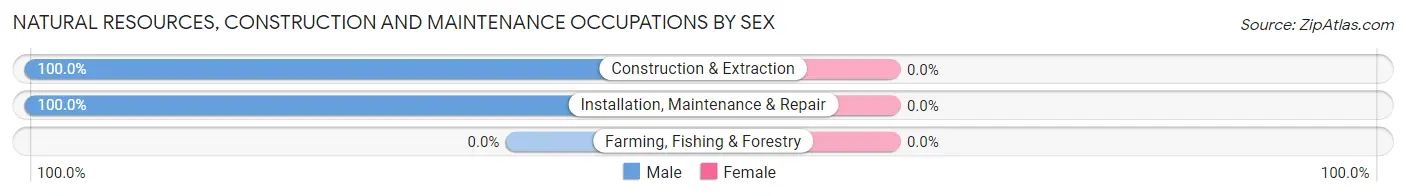
| Occupation | Male | Female |
| Farming, Fishing & Forestry | 0 (0.0%) | 0 (0.0%) |
| Construction & Extraction | 127 (100.0%) | 0 (0.0%) |
| Installation, Maintenance & Repair | 65 (100.0%) | 0 (0.0%) |
| Total (Category) | 192 (100.0%) | 0 (0.0%) |
| Total (Overall) | 2,198 (52.3%) | 2,008 (47.7%) |
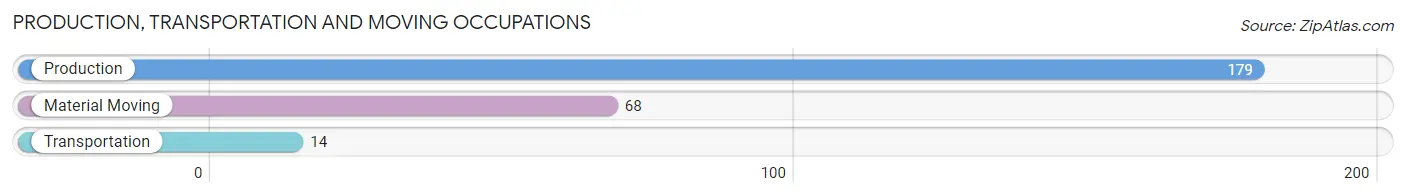
Production, Transportation and Moving Occupations
The most common Production, Transportation and Moving occupations in Edgewood are Production (179 | 4.3%), Material Moving (68 | 1.6%), and Transportation (14 | 0.3%).
Production, Transportation and Moving Occupations by Sex
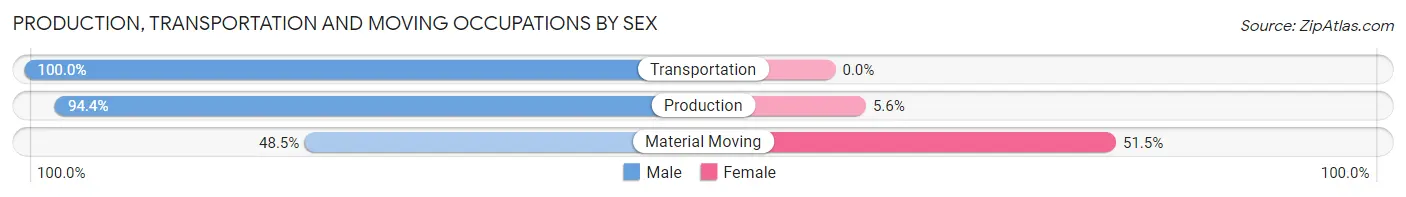
| Occupation | Male | Female |
| Production | 169 (94.4%) | 10 (5.6%) |
| Transportation | 14 (100.0%) | 0 (0.0%) |
| Material Moving | 33 (48.5%) | 35 (51.5%) |
| Total (Category) | 216 (82.8%) | 45 (17.2%) |
| Total (Overall) | 2,198 (52.3%) | 2,008 (47.7%) |
Employment Industries by Sex in Edgewood
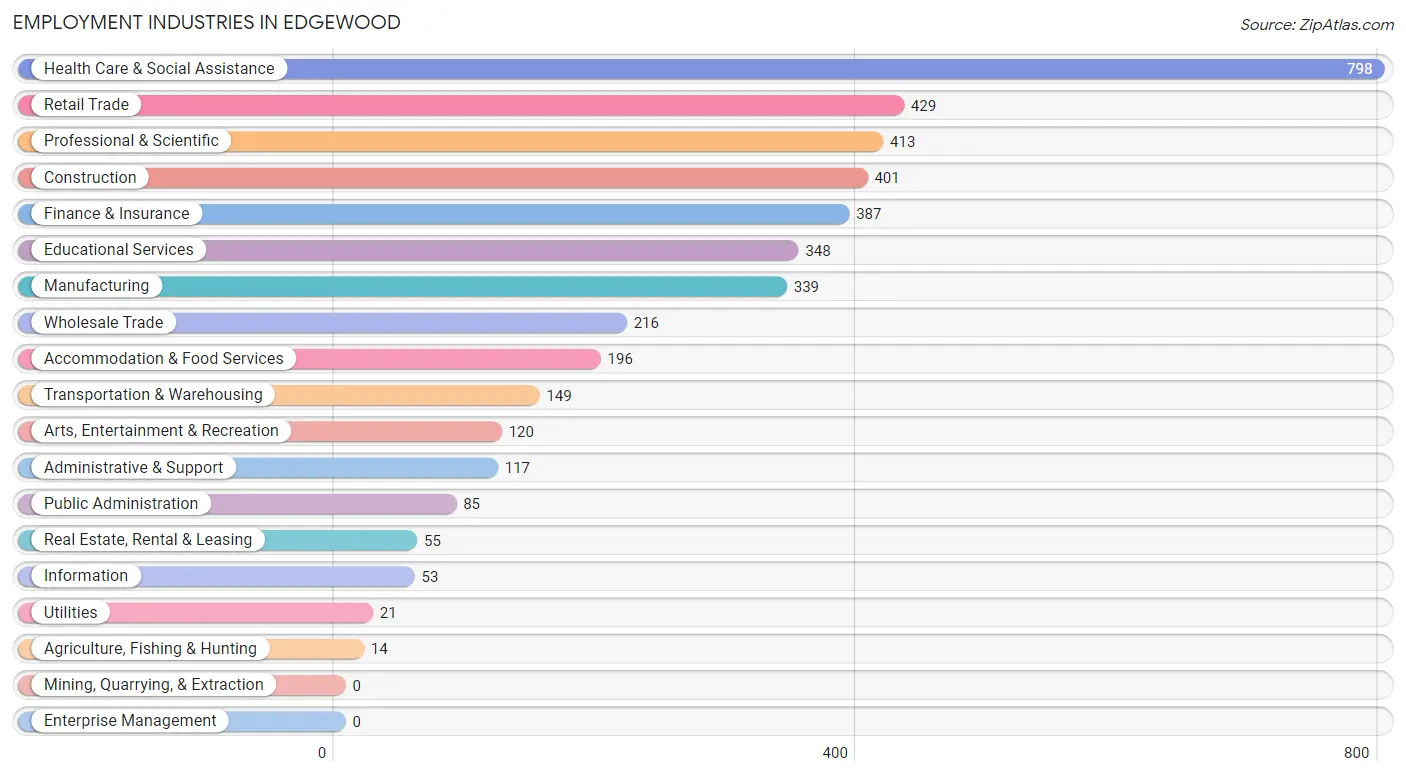
Employment Industries in Edgewood
The major employment industries in Edgewood include Health Care & Social Assistance (798 | 19.0%), Retail Trade (429 | 10.2%), Professional & Scientific (413 | 9.8%), Construction (401 | 9.5%), and Finance & Insurance (387 | 9.2%).
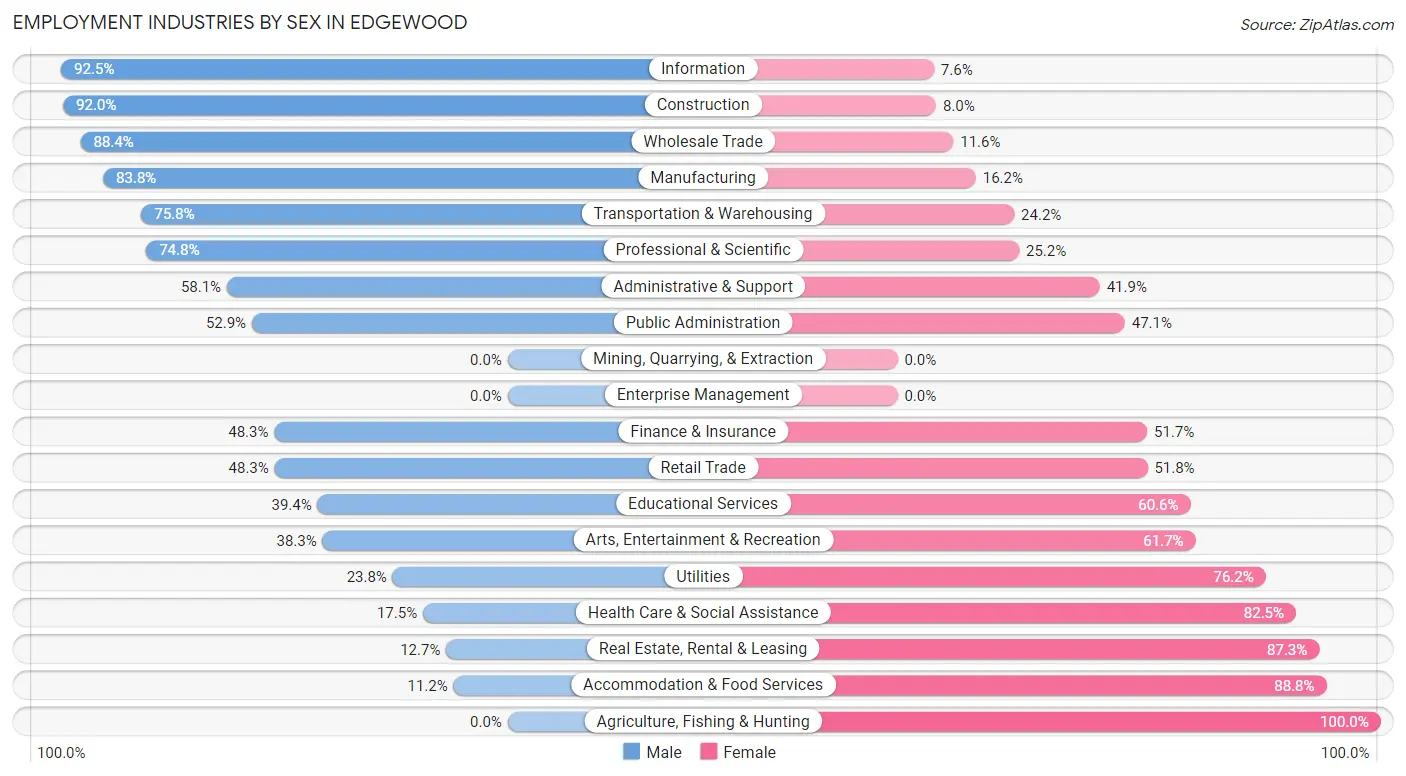
Employment Industries by Sex in Edgewood
The Edgewood industries that see more men than women are Information (92.4%), Construction (92.0%), and Wholesale Trade (88.4%), whereas the industries that tend to have a higher number of women are Agriculture, Fishing & Hunting (100.0%), Accommodation & Food Services (88.8%), and Real Estate, Rental & Leasing (87.3%).
| Industry | Male | Female |
| Agriculture, Fishing & Hunting | 0 (0.0%) | 14 (100.0%) |
| Mining, Quarrying, & Extraction | 0 (0.0%) | 0 (0.0%) |
| Construction | 369 (92.0%) | 32 (8.0%) |
| Manufacturing | 284 (83.8%) | 55 (16.2%) |
| Wholesale Trade | 191 (88.4%) | 25 (11.6%) |
| Retail Trade | 207 (48.2%) | 222 (51.7%) |
| Transportation & Warehousing | 113 (75.8%) | 36 (24.2%) |
| Utilities | 5 (23.8%) | 16 (76.2%) |
| Information | 49 (92.4%) | 4 (7.5%) |
| Finance & Insurance | 187 (48.3%) | 200 (51.7%) |
| Real Estate, Rental & Leasing | 7 (12.7%) | 48 (87.3%) |
| Professional & Scientific | 309 (74.8%) | 104 (25.2%) |
| Enterprise Management | 0 (0.0%) | 0 (0.0%) |
| Administrative & Support | 68 (58.1%) | 49 (41.9%) |
| Educational Services | 137 (39.4%) | 211 (60.6%) |
| Health Care & Social Assistance | 140 (17.5%) | 658 (82.5%) |
| Arts, Entertainment & Recreation | 46 (38.3%) | 74 (61.7%) |
| Accommodation & Food Services | 22 (11.2%) | 174 (88.8%) |
| Public Administration | 45 (52.9%) | 40 (47.1%) |
| Total | 2,198 (52.3%) | 2,008 (47.7%) |
Education in Edgewood
School Enrollment in Edgewood
The most common levels of schooling among the 2,011 students in Edgewood are middle school (491 | 24.4%), high school (368 | 18.3%), and college / undergraduate (331 | 16.5%).
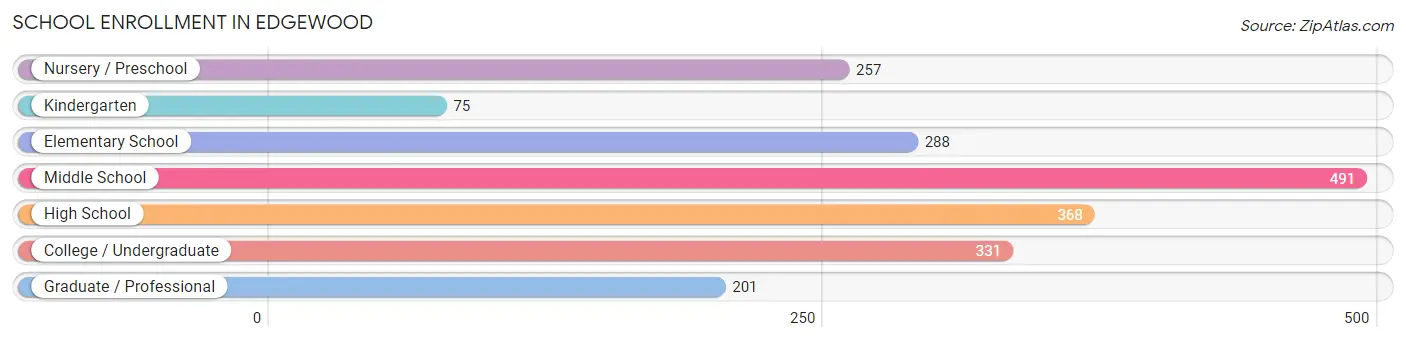
| School Level | # Students | % Students |
| Nursery / Preschool | 257 | 12.8% |
| Kindergarten | 75 | 3.7% |
| Elementary School | 288 | 14.3% |
| Middle School | 491 | 24.4% |
| High School | 368 | 18.3% |
| College / Undergraduate | 331 | 16.5% |
| Graduate / Professional | 201 | 10.0% |
| Total | 2,011 | 100.0% |
School Enrollment by Age by Funding Source in Edgewood
Out of a total of 2,011 students who are enrolled in schools in Edgewood, 804 (40.0%) attend a private institution, while the remaining 1,207 (60.0%) are enrolled in public schools. The age group of 15 to 17 year olds has the highest likelihood of being enrolled in private schools, with 187 (58.1% in the age bracket) enrolled. Conversely, the age group of 20 to 24 year olds has the lowest likelihood of being enrolled in a private school, with 101 (93.5% in the age bracket) attending a public institution.
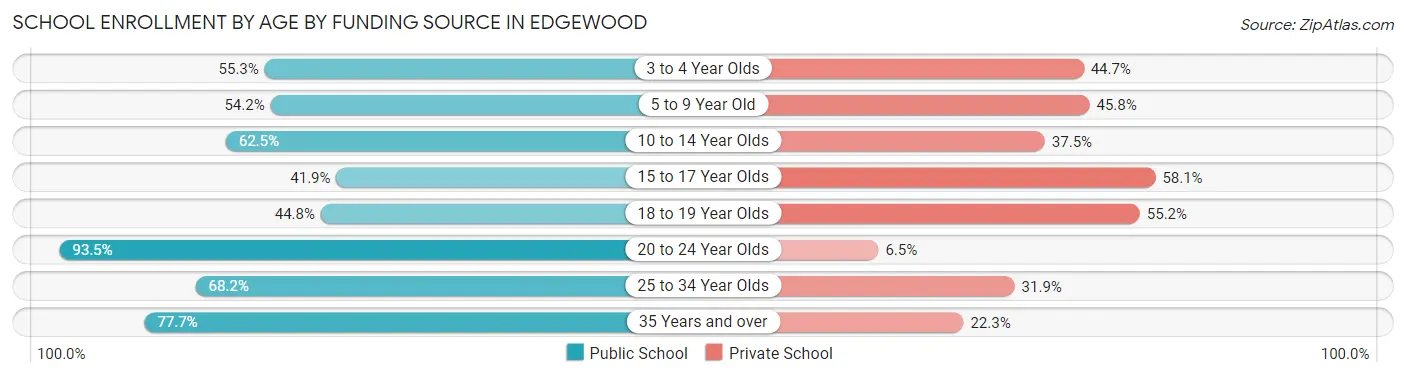
| Age Bracket | Public School | Private School |
| 3 to 4 Year Olds | 115 (55.3%) | 93 (44.7%) |
| 5 to 9 Year Old | 200 (54.2%) | 169 (45.8%) |
| 10 to 14 Year Olds | 357 (62.5%) | 214 (37.5%) |
| 15 to 17 Year Olds | 135 (41.9%) | 187 (58.1%) |
| 18 to 19 Year Olds | 13 (44.8%) | 16 (55.2%) |
| 20 to 24 Year Olds | 101 (93.5%) | 7 (6.5%) |
| 25 to 34 Year Olds | 199 (68.1%) | 93 (31.9%) |
| 35 Years and over | 87 (77.7%) | 25 (22.3%) |
| Total | 1,207 (60.0%) | 804 (40.0%) |
Educational Attainment by Field of Study in Edgewood
Business (1,004 | 28.8%), education (421 | 12.1%), science & technology (408 | 11.7%), liberal arts & history (285 | 8.2%), and communications (218 | 6.2%) are the most common fields of study among 3,489 individuals in Edgewood who have obtained a bachelor's degree or higher.
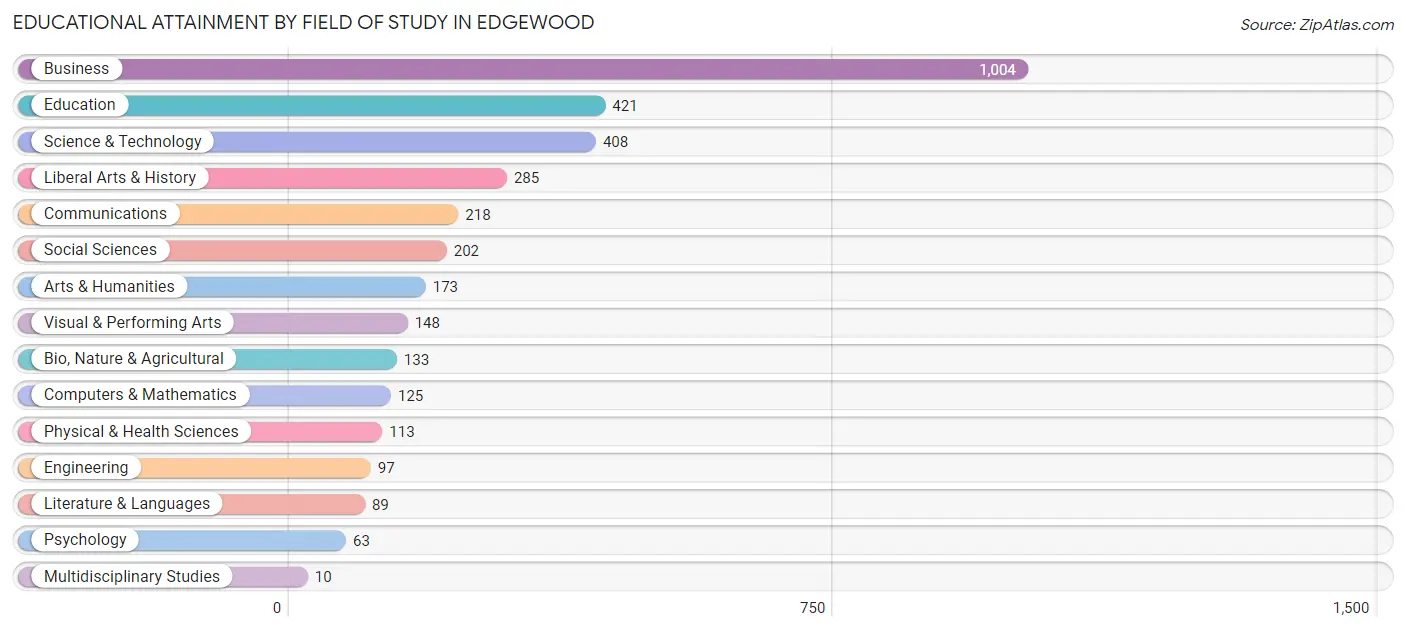
| Field of Study | # Graduates | % Graduates |
| Computers & Mathematics | 125 | 3.6% |
| Bio, Nature & Agricultural | 133 | 3.8% |
| Physical & Health Sciences | 113 | 3.2% |
| Psychology | 63 | 1.8% |
| Social Sciences | 202 | 5.8% |
| Engineering | 97 | 2.8% |
| Multidisciplinary Studies | 10 | 0.3% |
| Science & Technology | 408 | 11.7% |
| Business | 1,004 | 28.8% |
| Education | 421 | 12.1% |
| Literature & Languages | 89 | 2.5% |
| Liberal Arts & History | 285 | 8.2% |
| Visual & Performing Arts | 148 | 4.2% |
| Communications | 218 | 6.2% |
| Arts & Humanities | 173 | 5.0% |
| Total | 3,489 | 100.0% |
Transportation & Commute in Edgewood
Vehicle Availability by Sex in Edgewood
The most prevalent vehicle ownership categories in Edgewood are males with 2 vehicles (1,053, accounting for 48.7%) and females with 2 vehicles (938, making up 52.6%).
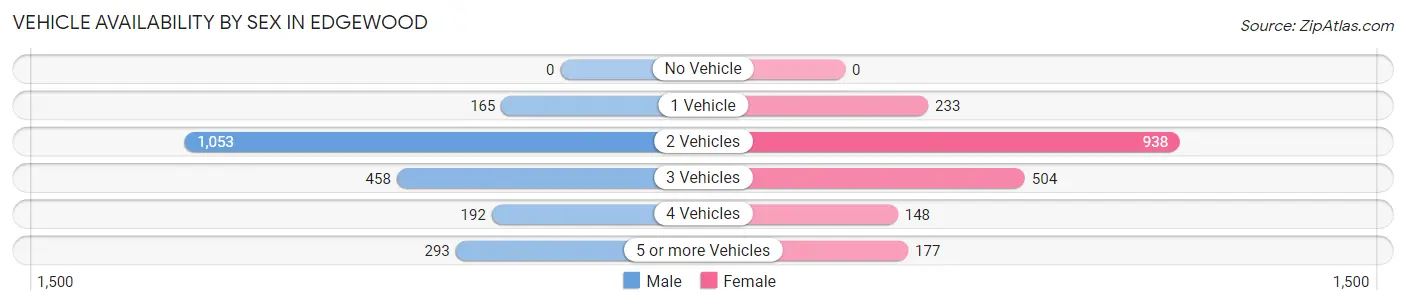
| Vehicles Available | Male | Female |
| No Vehicle | 0 (0.0%) | 0 (0.0%) |
| 1 Vehicle | 165 (7.6%) | 233 (11.7%) |
| 2 Vehicles | 1,053 (48.7%) | 938 (46.9%) |
| 3 Vehicles | 458 (21.2%) | 504 (25.2%) |
| 4 Vehicles | 192 (8.9%) | 148 (7.4%) |
| 5 or more Vehicles | 293 (13.6%) | 177 (8.8%) |
| Total | 2,161 (100.0%) | 2,000 (100.0%) |
Commute Time in Edgewood
The most frequently occuring commute durations in Edgewood are 20 to 24 minutes (926 commuters, 26.8%), 15 to 19 minutes (631 commuters, 18.3%), and 25 to 29 minutes (386 commuters, 11.2%).
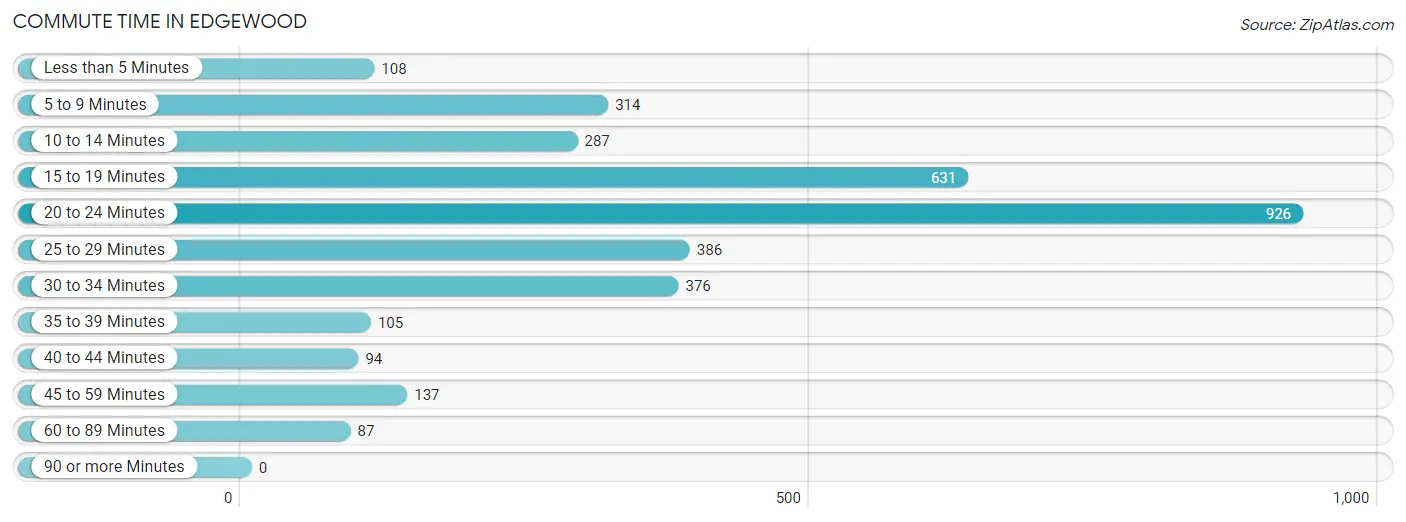
| Commute Time | # Commuters | % Commuters |
| Less than 5 Minutes | 108 | 3.1% |
| 5 to 9 Minutes | 314 | 9.1% |
| 10 to 14 Minutes | 287 | 8.3% |
| 15 to 19 Minutes | 631 | 18.3% |
| 20 to 24 Minutes | 926 | 26.8% |
| 25 to 29 Minutes | 386 | 11.2% |
| 30 to 34 Minutes | 376 | 10.9% |
| 35 to 39 Minutes | 105 | 3.0% |
| 40 to 44 Minutes | 94 | 2.7% |
| 45 to 59 Minutes | 137 | 4.0% |
| 60 to 89 Minutes | 87 | 2.5% |
| 90 or more Minutes | 0 | 0.0% |
Commute Time by Sex in Edgewood
The most common commute times in Edgewood are 20 to 24 minutes (627 commuters, 33.6%) for males and 15 to 19 minutes (330 commuters, 20.8%) for females.
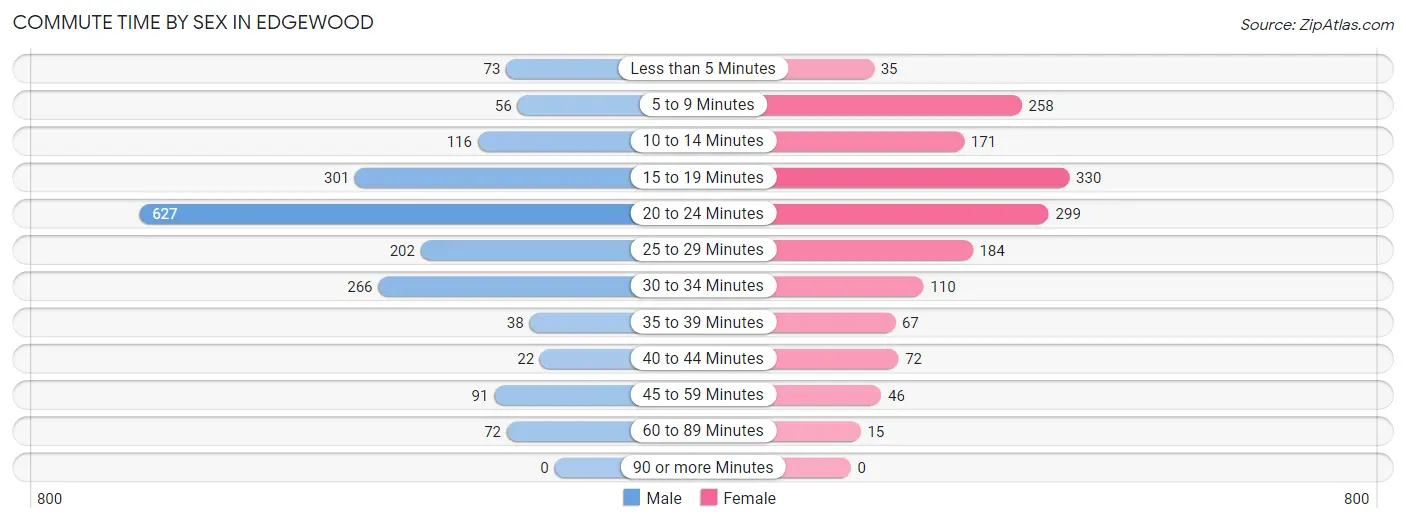
| Commute Time | Male | Female |
| Less than 5 Minutes | 73 (3.9%) | 35 (2.2%) |
| 5 to 9 Minutes | 56 (3.0%) | 258 (16.3%) |
| 10 to 14 Minutes | 116 (6.2%) | 171 (10.8%) |
| 15 to 19 Minutes | 301 (16.2%) | 330 (20.8%) |
| 20 to 24 Minutes | 627 (33.6%) | 299 (18.8%) |
| 25 to 29 Minutes | 202 (10.8%) | 184 (11.6%) |
| 30 to 34 Minutes | 266 (14.3%) | 110 (6.9%) |
| 35 to 39 Minutes | 38 (2.0%) | 67 (4.2%) |
| 40 to 44 Minutes | 22 (1.2%) | 72 (4.5%) |
| 45 to 59 Minutes | 91 (4.9%) | 46 (2.9%) |
| 60 to 89 Minutes | 72 (3.9%) | 15 (0.9%) |
| 90 or more Minutes | 0 (0.0%) | 0 (0.0%) |
Time of Departure to Work by Sex in Edgewood
The most frequent times of departure to work in Edgewood are 6:30 AM to 6:59 AM (352, 18.9%) for males and 7:00 AM to 7:29 AM (376, 23.7%) for females.
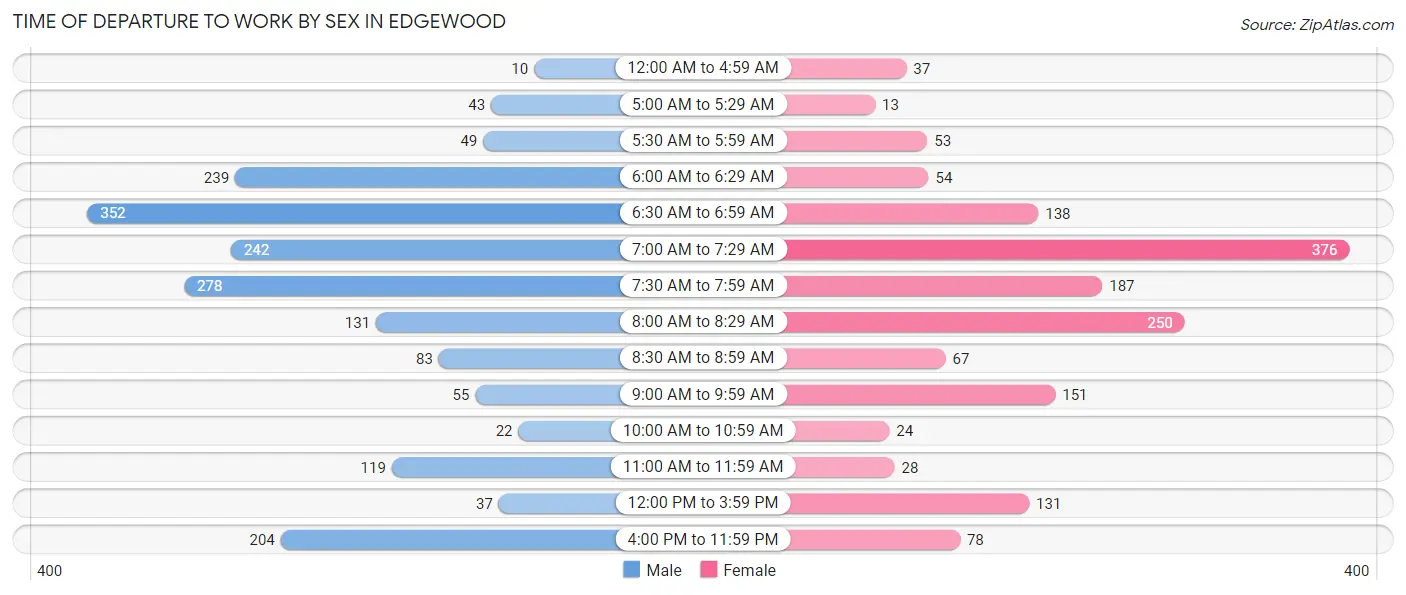
| Time of Departure | Male | Female |
| 12:00 AM to 4:59 AM | 10 (0.5%) | 37 (2.3%) |
| 5:00 AM to 5:29 AM | 43 (2.3%) | 13 (0.8%) |
| 5:30 AM to 5:59 AM | 49 (2.6%) | 53 (3.3%) |
| 6:00 AM to 6:29 AM | 239 (12.8%) | 54 (3.4%) |
| 6:30 AM to 6:59 AM | 352 (18.9%) | 138 (8.7%) |
| 7:00 AM to 7:29 AM | 242 (13.0%) | 376 (23.7%) |
| 7:30 AM to 7:59 AM | 278 (14.9%) | 187 (11.8%) |
| 8:00 AM to 8:29 AM | 131 (7.0%) | 250 (15.8%) |
| 8:30 AM to 8:59 AM | 83 (4.4%) | 67 (4.2%) |
| 9:00 AM to 9:59 AM | 55 (2.9%) | 151 (9.5%) |
| 10:00 AM to 10:59 AM | 22 (1.2%) | 24 (1.5%) |
| 11:00 AM to 11:59 AM | 119 (6.4%) | 28 (1.8%) |
| 12:00 PM to 3:59 PM | 37 (2.0%) | 131 (8.3%) |
| 4:00 PM to 11:59 PM | 204 (10.9%) | 78 (4.9%) |
| Total | 1,864 (100.0%) | 1,587 (100.0%) |
Housing Occupancy in Edgewood
Occupancy by Ownership in Edgewood
Of the total 3,326 dwellings in Edgewood, owner-occupied units account for 2,977 (89.5%), while renter-occupied units make up 349 (10.5%).
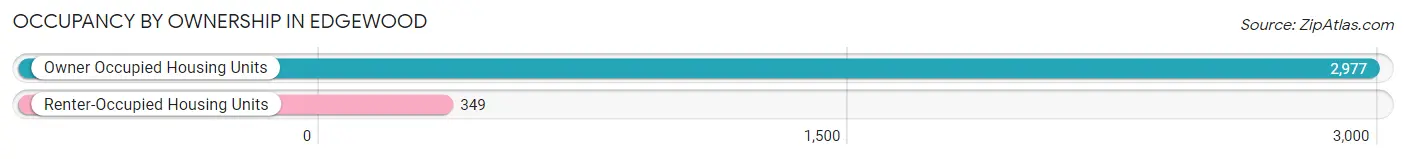
| Occupancy | # Housing Units | % Housing Units |
| Owner Occupied Housing Units | 2,977 | 89.5% |
| Renter-Occupied Housing Units | 349 | 10.5% |
| Total Occupied Housing Units | 3,326 | 100.0% |
Occupancy by Household Size in Edgewood
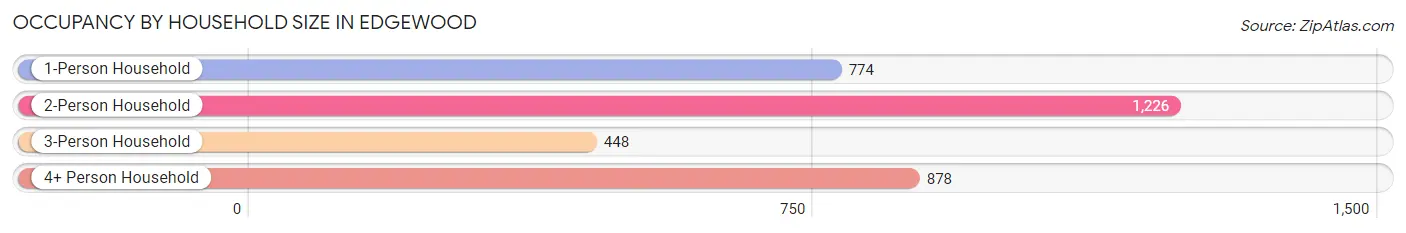
| Household Size | # Housing Units | % Housing Units |
| 1-Person Household | 774 | 23.3% |
| 2-Person Household | 1,226 | 36.9% |
| 3-Person Household | 448 | 13.5% |
| 4+ Person Household | 878 | 26.4% |
| Total Housing Units | 3,326 | 100.0% |
Occupancy by Ownership by Household Size in Edgewood
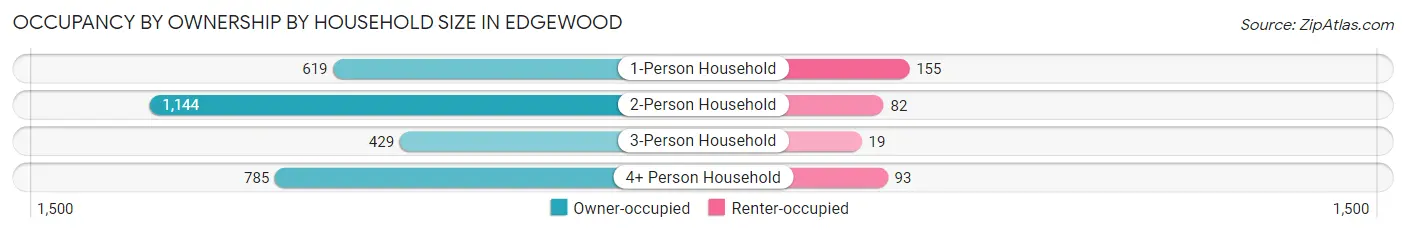
| Household Size | Owner-occupied | Renter-occupied |
| 1-Person Household | 619 (80.0%) | 155 (20.0%) |
| 2-Person Household | 1,144 (93.3%) | 82 (6.7%) |
| 3-Person Household | 429 (95.8%) | 19 (4.2%) |
| 4+ Person Household | 785 (89.4%) | 93 (10.6%) |
| Total Housing Units | 2,977 (89.5%) | 349 (10.5%) |
Occupancy by Educational Attainment in Edgewood
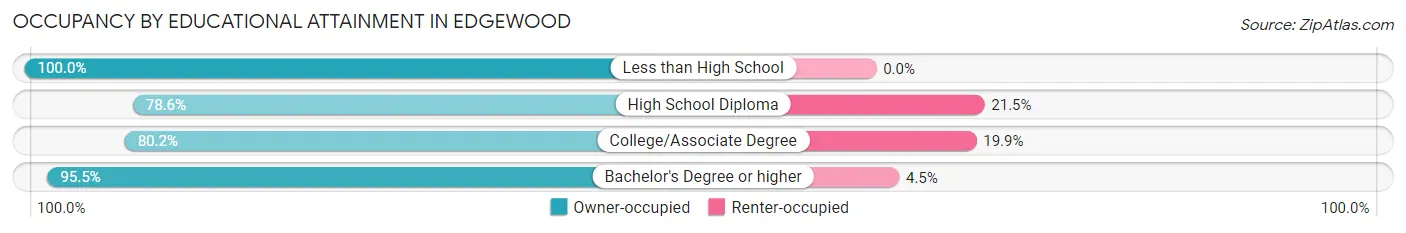
| Household Size | Owner-occupied | Renter-occupied |
| Less than High School | 14 (100.0%) | 0 (0.0%) |
| High School Diploma | 443 (78.5%) | 121 (21.4%) |
| College/Associate Degree | 541 (80.1%) | 134 (19.9%) |
| Bachelor's Degree or higher | 1,979 (95.5%) | 94 (4.5%) |
Occupancy by Age of Householder in Edgewood
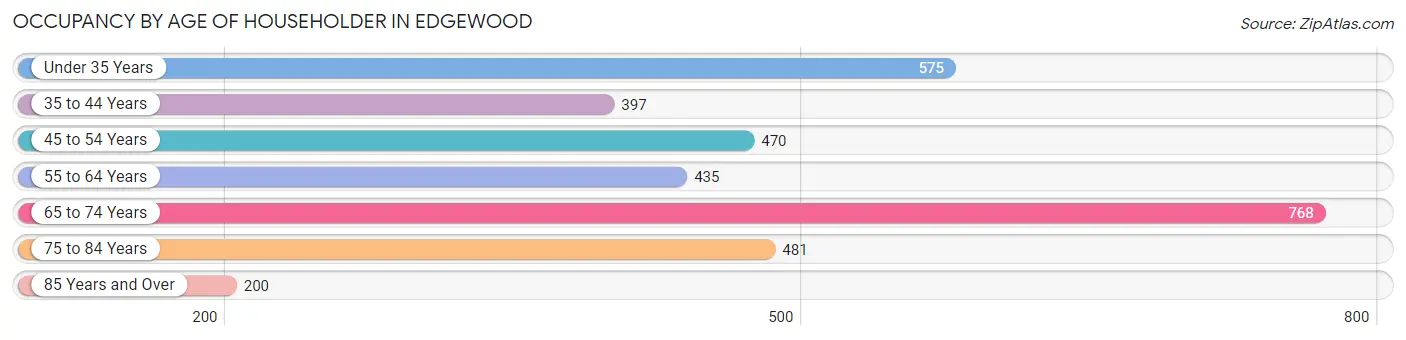
| Age Bracket | # Households | % Households |
| Under 35 Years | 575 | 17.3% |
| 35 to 44 Years | 397 | 11.9% |
| 45 to 54 Years | 470 | 14.1% |
| 55 to 64 Years | 435 | 13.1% |
| 65 to 74 Years | 768 | 23.1% |
| 75 to 84 Years | 481 | 14.5% |
| 85 Years and Over | 200 | 6.0% |
| Total | 3,326 | 100.0% |
Housing Finances in Edgewood
Median Income by Occupancy in Edgewood
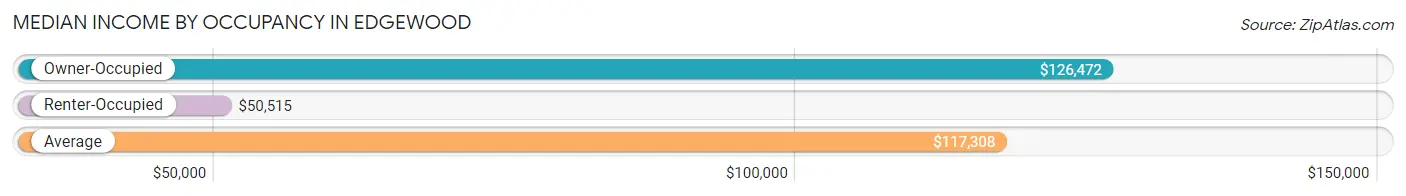
| Occupancy Type | # Households | Median Income |
| Owner-Occupied | 2,977 (89.5%) | $126,472 |
| Renter-Occupied | 349 (10.5%) | $50,515 |
| Average | 3,326 (100.0%) | $117,308 |
Occupancy by Householder Income Bracket in Edgewood
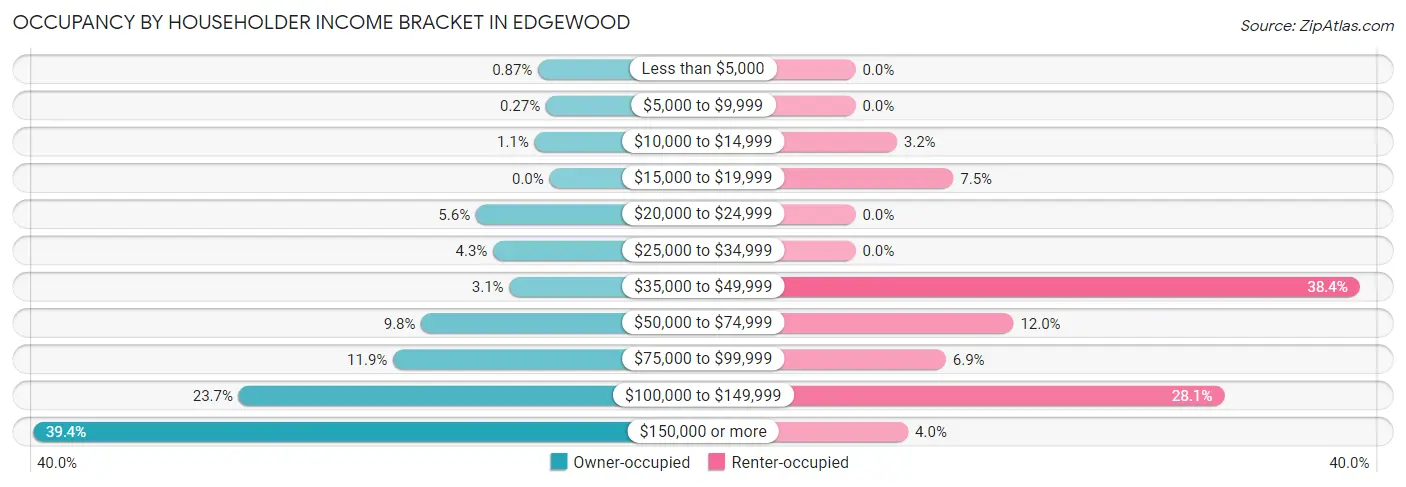
| Income Bracket | Owner-occupied | Renter-occupied |
| Less than $5,000 | 26 (0.9%) | 0 (0.0%) |
| $5,000 to $9,999 | 8 (0.3%) | 0 (0.0%) |
| $10,000 to $14,999 | 34 (1.1%) | 11 (3.2%) |
| $15,000 to $19,999 | 0 (0.0%) | 26 (7.4%) |
| $20,000 to $24,999 | 167 (5.6%) | 0 (0.0%) |
| $25,000 to $34,999 | 128 (4.3%) | 0 (0.0%) |
| $35,000 to $49,999 | 91 (3.1%) | 134 (38.4%) |
| $50,000 to $74,999 | 291 (9.8%) | 42 (12.0%) |
| $75,000 to $99,999 | 355 (11.9%) | 24 (6.9%) |
| $100,000 to $149,999 | 705 (23.7%) | 98 (28.1%) |
| $150,000 or more | 1,172 (39.4%) | 14 (4.0%) |
| Total | 2,977 (100.0%) | 349 (100.0%) |
Monthly Housing Cost Tiers in Edgewood
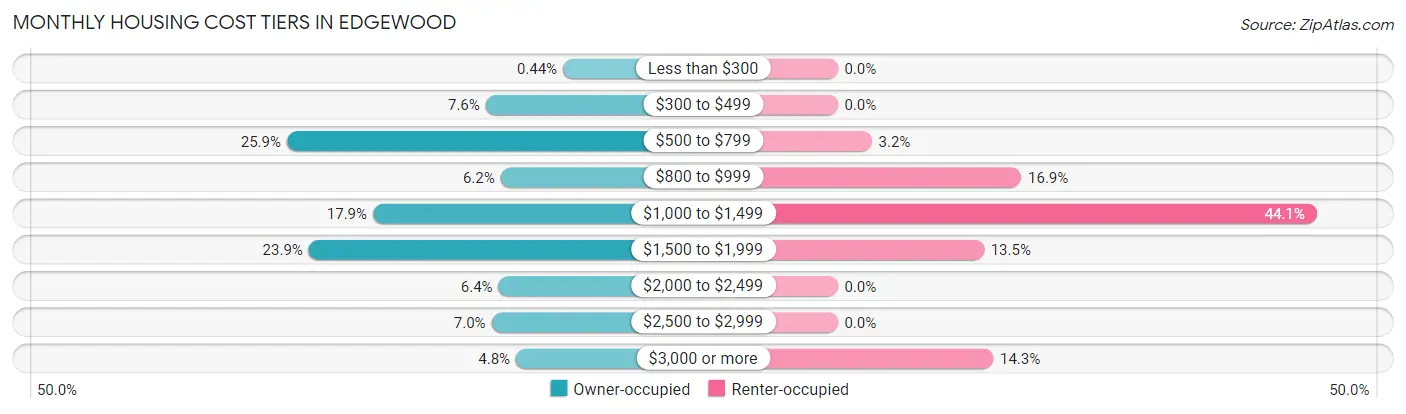
| Monthly Cost | Owner-occupied | Renter-occupied |
| Less than $300 | 13 (0.4%) | 0 (0.0%) |
| $300 to $499 | 225 (7.6%) | 0 (0.0%) |
| $500 to $799 | 770 (25.9%) | 11 (3.2%) |
| $800 to $999 | 184 (6.2%) | 59 (16.9%) |
| $1,000 to $1,499 | 534 (17.9%) | 154 (44.1%) |
| $1,500 to $1,999 | 710 (23.8%) | 47 (13.5%) |
| $2,000 to $2,499 | 190 (6.4%) | 0 (0.0%) |
| $2,500 to $2,999 | 209 (7.0%) | 0 (0.0%) |
| $3,000 or more | 142 (4.8%) | 50 (14.3%) |
| Total | 2,977 (100.0%) | 349 (100.0%) |
Physical Housing Characteristics in Edgewood
Housing Structures in Edgewood
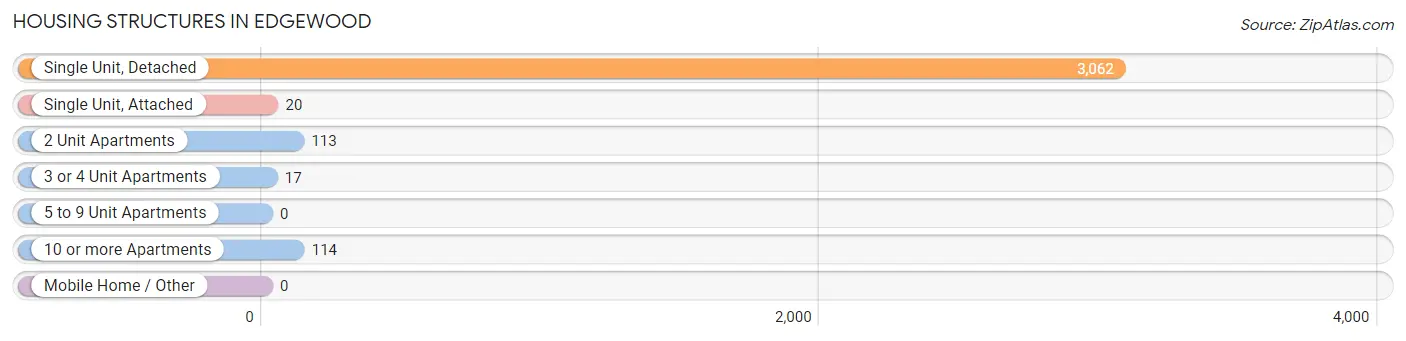
| Structure Type | # Housing Units | % Housing Units |
| Single Unit, Detached | 3,062 | 92.1% |
| Single Unit, Attached | 20 | 0.6% |
| 2 Unit Apartments | 113 | 3.4% |
| 3 or 4 Unit Apartments | 17 | 0.5% |
| 5 to 9 Unit Apartments | 0 | 0.0% |
| 10 or more Apartments | 114 | 3.4% |
| Mobile Home / Other | 0 | 0.0% |
| Total | 3,326 | 100.0% |
Housing Structures by Occupancy in Edgewood
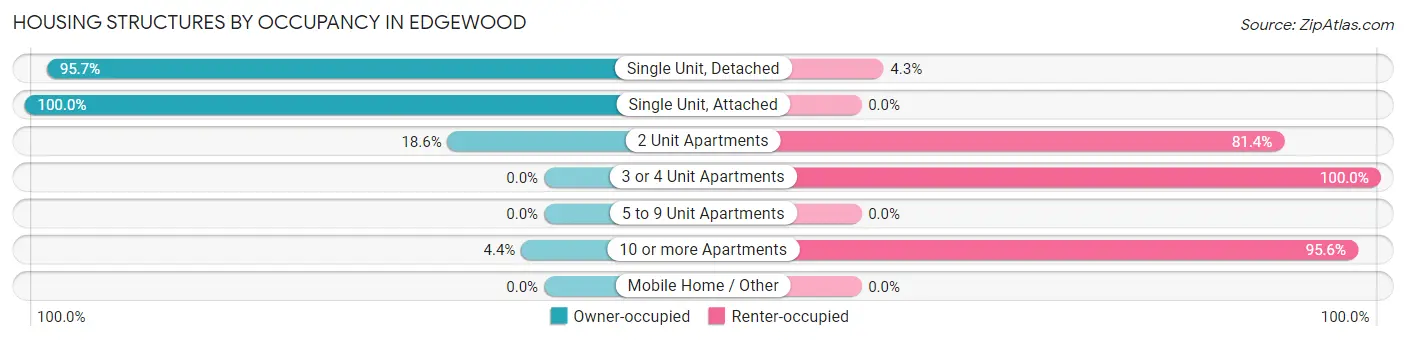
| Structure Type | Owner-occupied | Renter-occupied |
| Single Unit, Detached | 2,931 (95.7%) | 131 (4.3%) |
| Single Unit, Attached | 20 (100.0%) | 0 (0.0%) |
| 2 Unit Apartments | 21 (18.6%) | 92 (81.4%) |
| 3 or 4 Unit Apartments | 0 (0.0%) | 17 (100.0%) |
| 5 to 9 Unit Apartments | 0 (0.0%) | 0 (0.0%) |
| 10 or more Apartments | 5 (4.4%) | 109 (95.6%) |
| Mobile Home / Other | 0 (0.0%) | 0 (0.0%) |
| Total | 2,977 (89.5%) | 349 (10.5%) |
Housing Structures by Number of Rooms in Edgewood
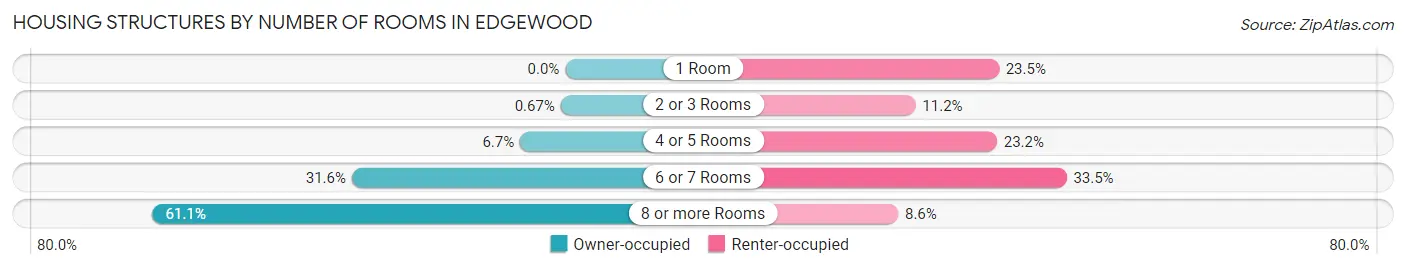
| Number of Rooms | Owner-occupied | Renter-occupied |
| 1 Room | 0 (0.0%) | 82 (23.5%) |
| 2 or 3 Rooms | 20 (0.7%) | 39 (11.2%) |
| 4 or 5 Rooms | 199 (6.7%) | 81 (23.2%) |
| 6 or 7 Rooms | 940 (31.6%) | 117 (33.5%) |
| 8 or more Rooms | 1,818 (61.1%) | 30 (8.6%) |
| Total | 2,977 (100.0%) | 349 (100.0%) |
Housing Structure by Heating Type in Edgewood
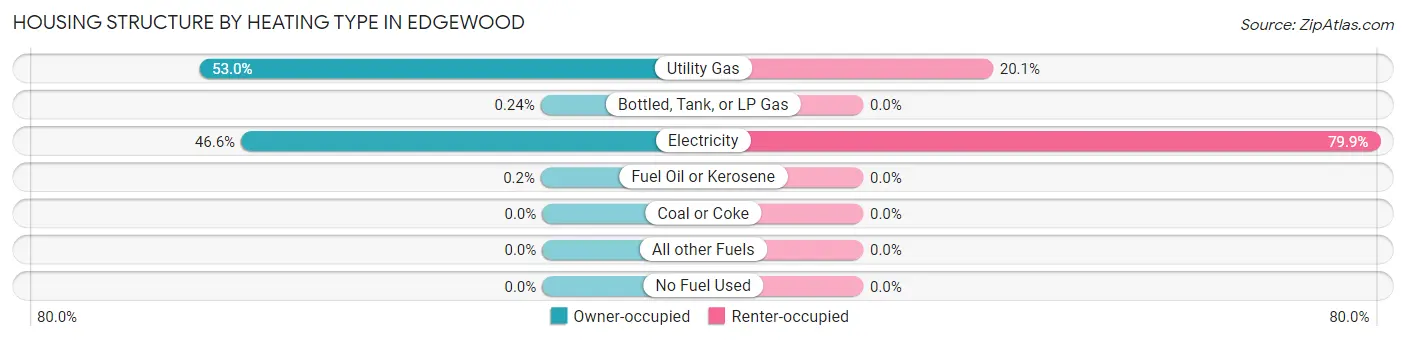
| Heating Type | Owner-occupied | Renter-occupied |
| Utility Gas | 1,578 (53.0%) | 70 (20.1%) |
| Bottled, Tank, or LP Gas | 7 (0.2%) | 0 (0.0%) |
| Electricity | 1,386 (46.6%) | 279 (79.9%) |
| Fuel Oil or Kerosene | 6 (0.2%) | 0 (0.0%) |
| Coal or Coke | 0 (0.0%) | 0 (0.0%) |
| All other Fuels | 0 (0.0%) | 0 (0.0%) |
| No Fuel Used | 0 (0.0%) | 0 (0.0%) |
| Total | 2,977 (100.0%) | 349 (100.0%) |
Household Vehicle Usage in Edgewood
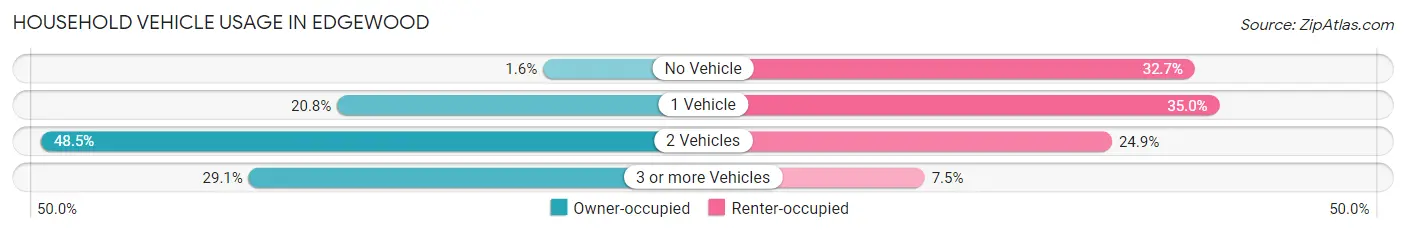
| Vehicles per Household | Owner-occupied | Renter-occupied |
| No Vehicle | 48 (1.6%) | 114 (32.7%) |
| 1 Vehicle | 620 (20.8%) | 122 (35.0%) |
| 2 Vehicles | 1,443 (48.5%) | 87 (24.9%) |
| 3 or more Vehicles | 866 (29.1%) | 26 (7.4%) |
| Total | 2,977 (100.0%) | 349 (100.0%) |
Real Estate & Mortgages in Edgewood
Real Estate and Mortgage Overview in Edgewood
| Characteristic | Without Mortgage | With Mortgage |
| Housing Units | 1,180 | 1,797 |
| Median Property Value | $253,900 | $295,400 |
| Median Household Income | $106,389 | $807 |
| Monthly Housing Costs | $572 | $142 |
| Real Estate Taxes | $2,807 | $7 |
Property Value by Mortgage Status in Edgewood
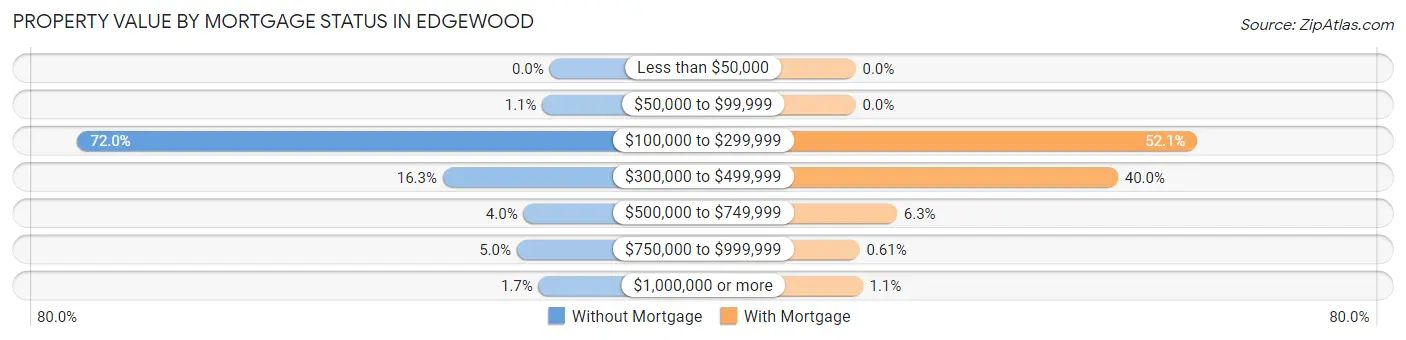
| Property Value | Without Mortgage | With Mortgage |
| Less than $50,000 | 0 (0.0%) | 0 (0.0%) |
| $50,000 to $99,999 | 13 (1.1%) | 0 (0.0%) |
| $100,000 to $299,999 | 849 (72.0%) | 936 (52.1%) |
| $300,000 to $499,999 | 192 (16.3%) | 718 (40.0%) |
| $500,000 to $749,999 | 47 (4.0%) | 113 (6.3%) |
| $750,000 to $999,999 | 59 (5.0%) | 11 (0.6%) |
| $1,000,000 or more | 20 (1.7%) | 19 (1.1%) |
| Total | 1,180 (100.0%) | 1,797 (100.0%) |
Household Income by Mortgage Status in Edgewood
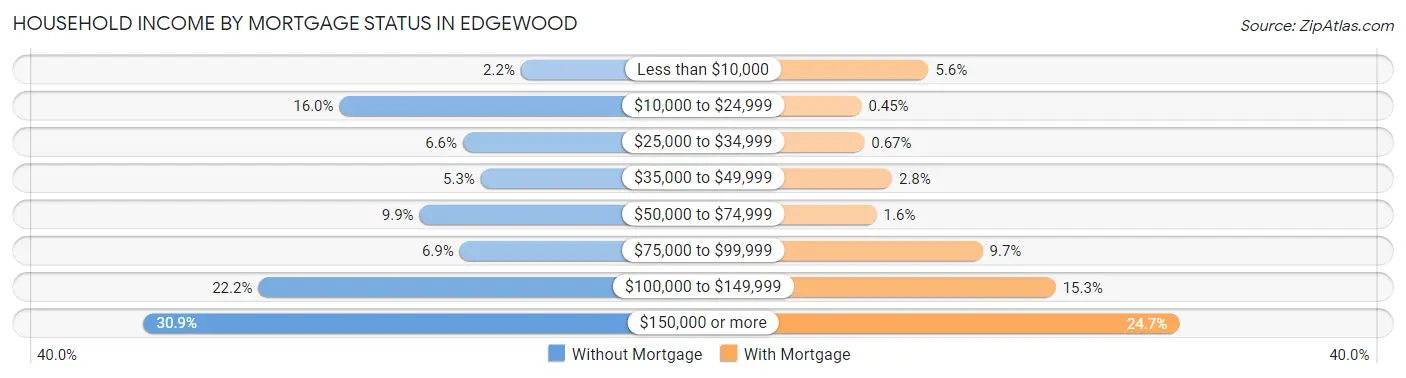
| Household Income | Without Mortgage | With Mortgage |
| Less than $10,000 | 26 (2.2%) | 100 (5.6%) |
| $10,000 to $24,999 | 189 (16.0%) | 8 (0.4%) |
| $25,000 to $34,999 | 78 (6.6%) | 12 (0.7%) |
| $35,000 to $49,999 | 62 (5.2%) | 50 (2.8%) |
| $50,000 to $74,999 | 117 (9.9%) | 29 (1.6%) |
| $75,000 to $99,999 | 81 (6.9%) | 174 (9.7%) |
| $100,000 to $149,999 | 262 (22.2%) | 274 (15.2%) |
| $150,000 or more | 365 (30.9%) | 443 (24.6%) |
| Total | 1,180 (100.0%) | 1,797 (100.0%) |
Property Value to Household Income Ratio in Edgewood
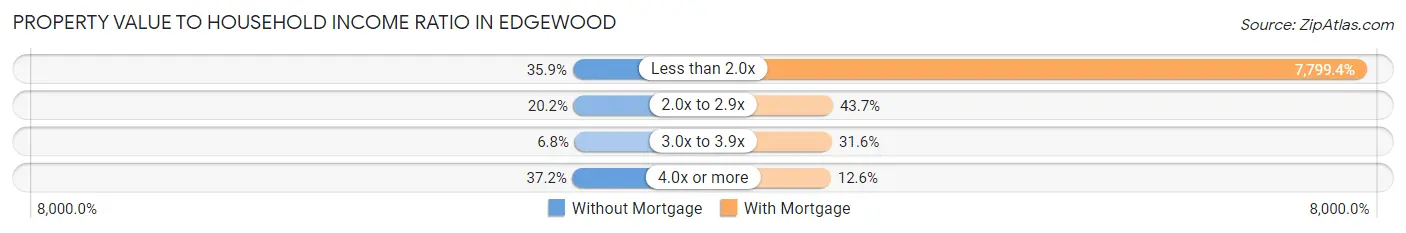
| Value-to-Income Ratio | Without Mortgage | With Mortgage |
| Less than 2.0x | 423 (35.8%) | 140,156 (7,799.4%) |
| 2.0x to 2.9x | 238 (20.2%) | 786 (43.7%) |
| 3.0x to 3.9x | 80 (6.8%) | 567 (31.6%) |
| 4.0x or more | 439 (37.2%) | 227 (12.6%) |
| Total | 1,180 (100.0%) | 1,797 (100.0%) |
Real Estate Taxes by Mortgage Status in Edgewood
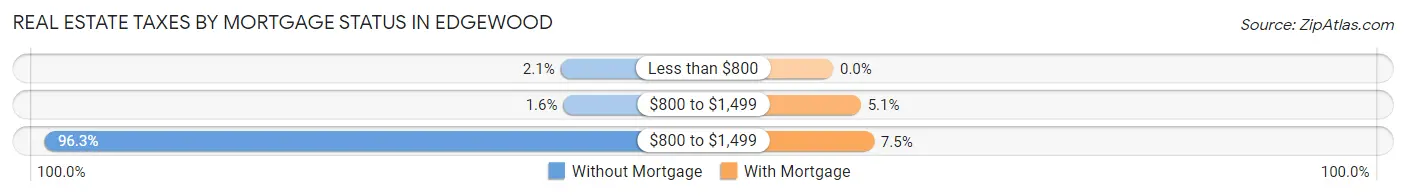
| Property Taxes | Without Mortgage | With Mortgage |
| Less than $800 | 25 (2.1%) | 0 (0.0%) |
| $800 to $1,499 | 19 (1.6%) | 91 (5.1%) |
| $800 to $1,499 | 1,136 (96.3%) | 134 (7.5%) |
| Total | 1,180 (100.0%) | 1,797 (100.0%) |
Health & Disability in Edgewood
Health Insurance Coverage by Age in Edgewood
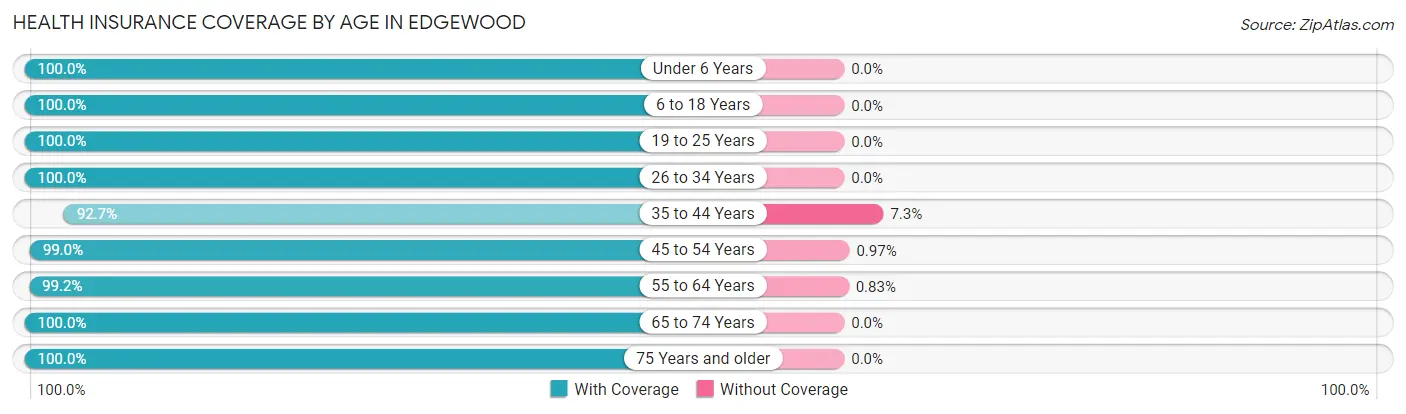
| Age Bracket | With Coverage | Without Coverage |
| Under 6 Years | 710 (100.0%) | 0 (0.0%) |
| 6 to 18 Years | 1,230 (100.0%) | 0 (0.0%) |
| 19 to 25 Years | 363 (100.0%) | 0 (0.0%) |
| 26 to 34 Years | 1,232 (100.0%) | 0 (0.0%) |
| 35 to 44 Years | 812 (92.7%) | 64 (7.3%) |
| 45 to 54 Years | 920 (99.0%) | 9 (1.0%) |
| 55 to 64 Years | 951 (99.2%) | 8 (0.8%) |
| 65 to 74 Years | 1,236 (100.0%) | 0 (0.0%) |
| 75 Years and older | 912 (100.0%) | 0 (0.0%) |
| Total | 8,366 (99.0%) | 81 (1.0%) |
Health Insurance Coverage by Citizenship Status in Edgewood
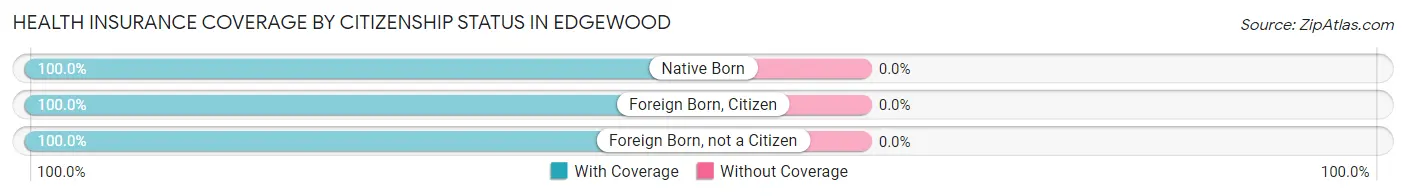
| Citizenship Status | With Coverage | Without Coverage |
| Native Born | 710 (100.0%) | 0 (0.0%) |
| Foreign Born, Citizen | 1,230 (100.0%) | 0 (0.0%) |
| Foreign Born, not a Citizen | 363 (100.0%) | 0 (0.0%) |
Health Insurance Coverage by Household Income in Edgewood
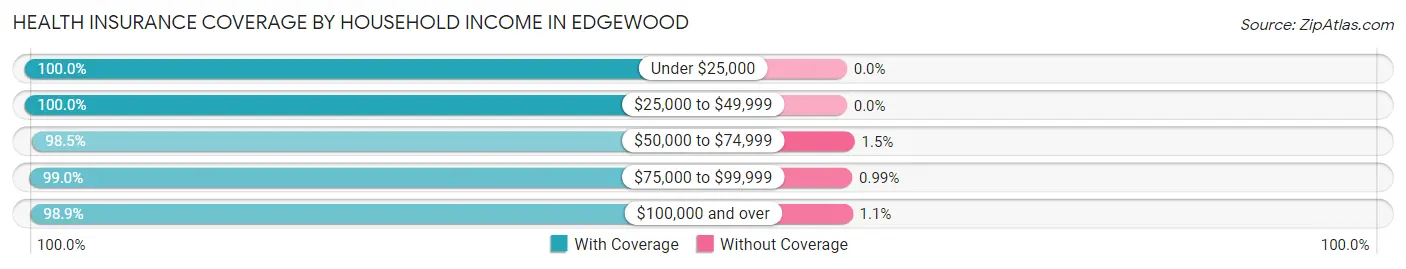
| Household Income | With Coverage | Without Coverage |
| Under $25,000 | 336 (100.0%) | 0 (0.0%) |
| $25,000 to $49,999 | 730 (100.0%) | 0 (0.0%) |
| $50,000 to $74,999 | 541 (98.5%) | 8 (1.5%) |
| $75,000 to $99,999 | 899 (99.0%) | 9 (1.0%) |
| $100,000 and over | 5,850 (98.9%) | 64 (1.1%) |
Public vs Private Health Insurance Coverage by Age in Edgewood
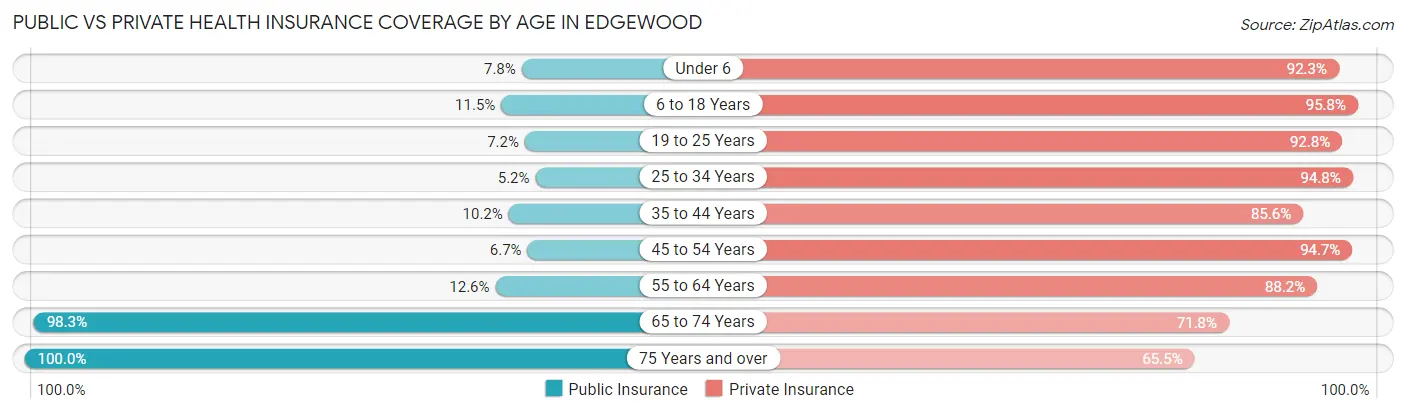
| Age Bracket | Public Insurance | Private Insurance |
| Under 6 | 55 (7.7%) | 655 (92.2%) |
| 6 to 18 Years | 142 (11.5%) | 1,178 (95.8%) |
| 19 to 25 Years | 26 (7.2%) | 337 (92.8%) |
| 25 to 34 Years | 64 (5.2%) | 1,168 (94.8%) |
| 35 to 44 Years | 89 (10.2%) | 750 (85.6%) |
| 45 to 54 Years | 62 (6.7%) | 880 (94.7%) |
| 55 to 64 Years | 121 (12.6%) | 846 (88.2%) |
| 65 to 74 Years | 1,215 (98.3%) | 888 (71.8%) |
| 75 Years and over | 912 (100.0%) | 597 (65.5%) |
| Total | 2,686 (31.8%) | 7,299 (86.4%) |
Disability Status by Sex by Age in Edgewood
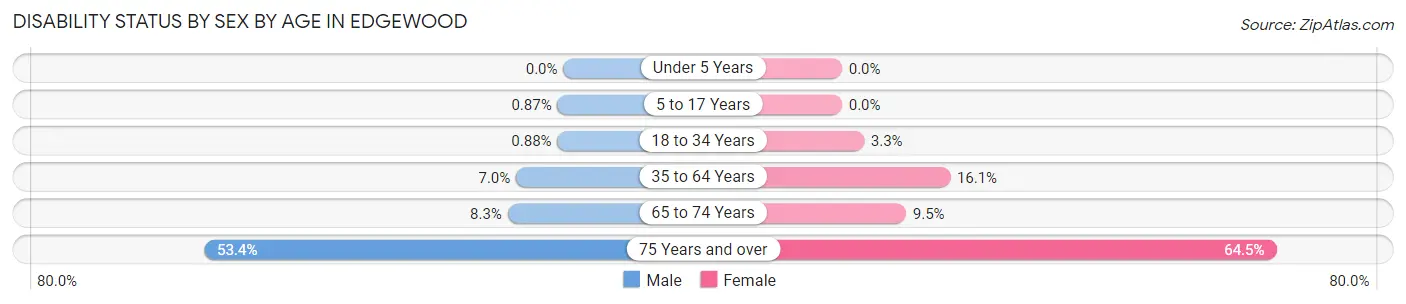
| Age Bracket | Male | Female |
| Under 5 Years | 0 (0.0%) | 0 (0.0%) |
| 5 to 17 Years | 5 (0.9%) | 0 (0.0%) |
| 18 to 34 Years | 7 (0.9%) | 27 (3.3%) |
| 35 to 64 Years | 96 (7.0%) | 224 (16.1%) |
| 65 to 74 Years | 50 (8.3%) | 60 (9.5%) |
| 75 Years and over | 231 (53.3%) | 309 (64.5%) |
Disability Class by Sex by Age in Edgewood
Disability Class: Hearing Difficulty
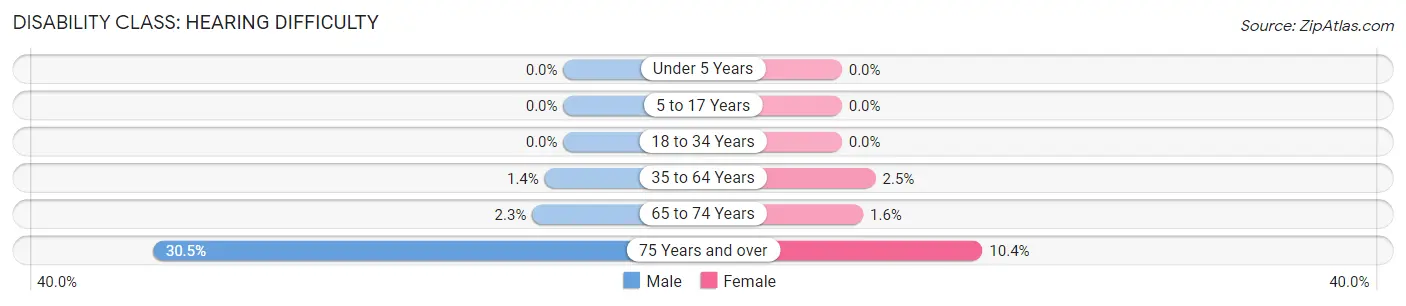
| Age Bracket | Male | Female |
| Under 5 Years | 0 (0.0%) | 0 (0.0%) |
| 5 to 17 Years | 0 (0.0%) | 0 (0.0%) |
| 18 to 34 Years | 0 (0.0%) | 0 (0.0%) |
| 35 to 64 Years | 19 (1.4%) | 35 (2.5%) |
| 65 to 74 Years | 14 (2.3%) | 10 (1.6%) |
| 75 Years and over | 132 (30.5%) | 50 (10.4%) |
Disability Class: Vision Difficulty
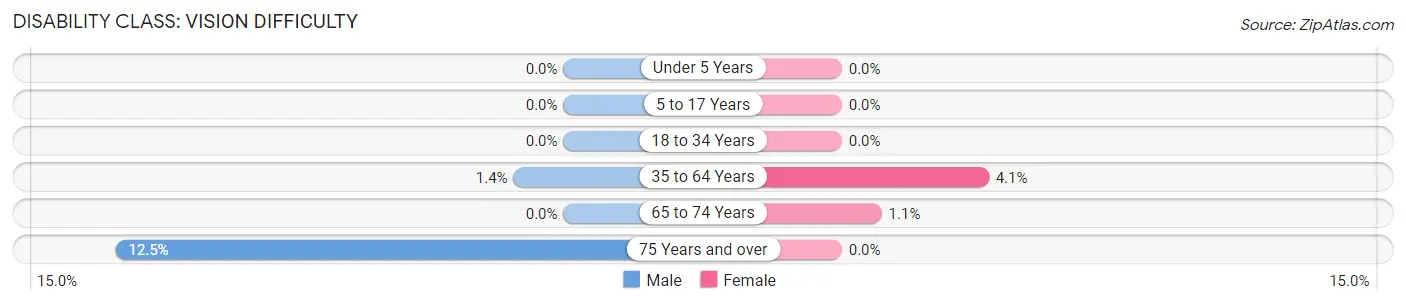
| Age Bracket | Male | Female |
| Under 5 Years | 0 (0.0%) | 0 (0.0%) |
| 5 to 17 Years | 0 (0.0%) | 0 (0.0%) |
| 18 to 34 Years | 0 (0.0%) | 0 (0.0%) |
| 35 to 64 Years | 19 (1.4%) | 57 (4.1%) |
| 65 to 74 Years | 0 (0.0%) | 7 (1.1%) |
| 75 Years and over | 54 (12.5%) | 0 (0.0%) |
Disability Class: Cognitive Difficulty
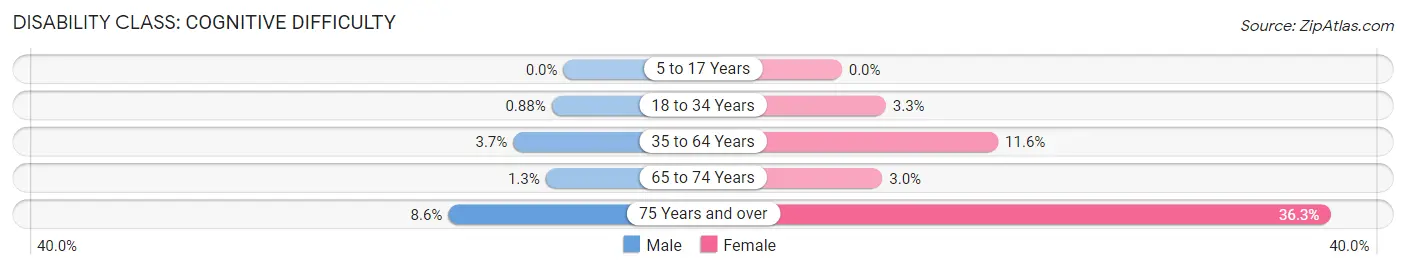
| Age Bracket | Male | Female |
| 5 to 17 Years | 0 (0.0%) | 0 (0.0%) |
| 18 to 34 Years | 7 (0.9%) | 27 (3.3%) |
| 35 to 64 Years | 51 (3.7%) | 162 (11.6%) |
| 65 to 74 Years | 8 (1.3%) | 19 (3.0%) |
| 75 Years and over | 37 (8.6%) | 174 (36.3%) |
Disability Class: Ambulatory Difficulty
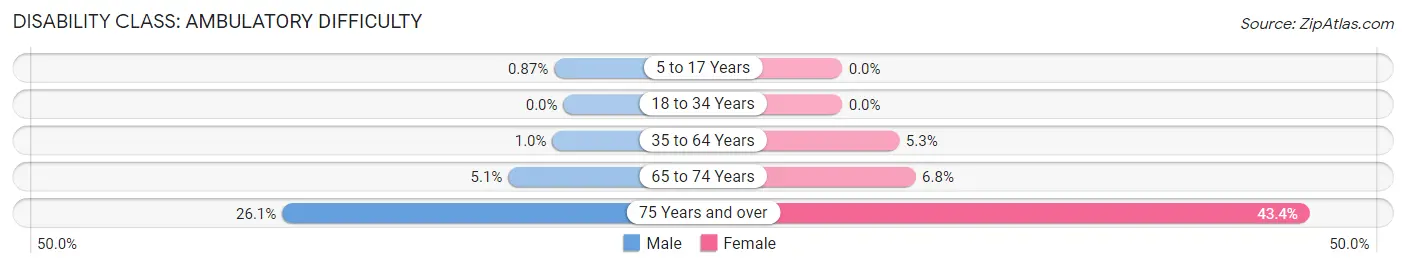
| Age Bracket | Male | Female |
| 5 to 17 Years | 5 (0.9%) | 0 (0.0%) |
| 18 to 34 Years | 0 (0.0%) | 0 (0.0%) |
| 35 to 64 Years | 14 (1.0%) | 74 (5.3%) |
| 65 to 74 Years | 31 (5.1%) | 43 (6.8%) |
| 75 Years and over | 113 (26.1%) | 208 (43.4%) |
Disability Class: Self-Care Difficulty
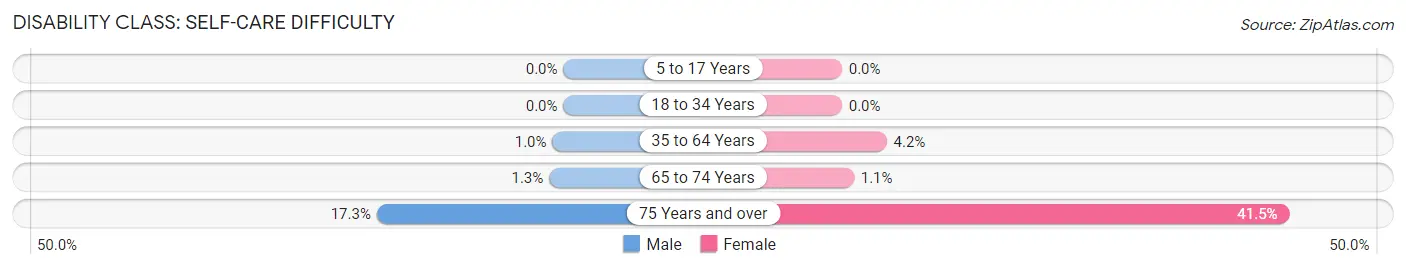
| Age Bracket | Male | Female |
| 5 to 17 Years | 0 (0.0%) | 0 (0.0%) |
| 18 to 34 Years | 0 (0.0%) | 0 (0.0%) |
| 35 to 64 Years | 14 (1.0%) | 58 (4.2%) |
| 65 to 74 Years | 8 (1.3%) | 7 (1.1%) |
| 75 Years and over | 75 (17.3%) | 199 (41.5%) |
Technology Access in Edgewood
Computing Device Access in Edgewood
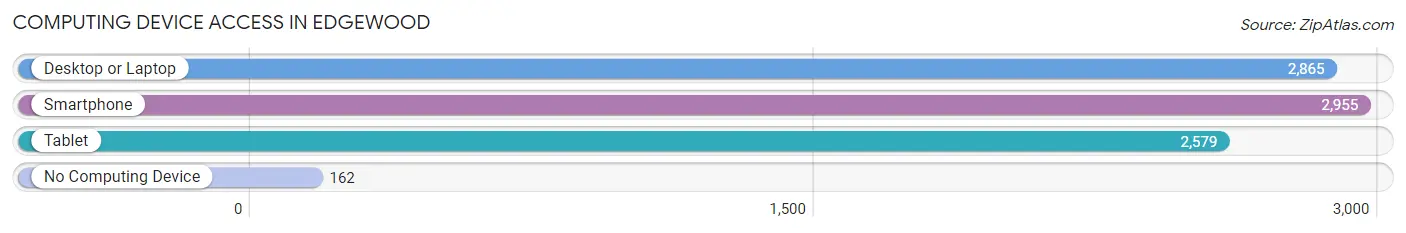
| Device Type | # Households | % Households |
| Desktop or Laptop | 2,865 | 86.1% |
| Smartphone | 2,955 | 88.8% |
| Tablet | 2,579 | 77.5% |
| No Computing Device | 162 | 4.9% |
| Total | 3,326 | 100.0% |
Internet Access in Edgewood
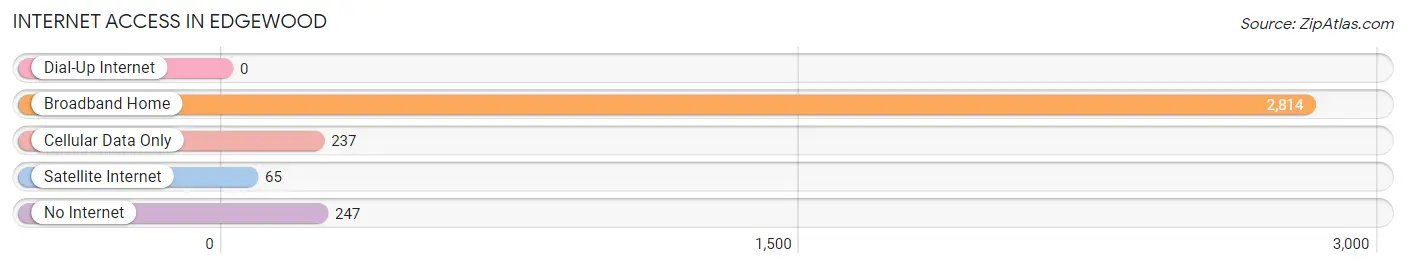
| Internet Type | # Households | % Households |
| Dial-Up Internet | 0 | 0.0% |
| Broadband Home | 2,814 | 84.6% |
| Cellular Data Only | 237 | 7.1% |
| Satellite Internet | 65 | 1.9% |
| No Internet | 247 | 7.4% |
| Total | 3,326 | 100.0% |
Edgewood Summary
Edgewood is a city located in Kenton County, Kentucky, United States. It is a suburb of Cincinnati, Ohio, and is part of the Cincinnati metropolitan area. The population was 8,619 at the 2010 census.
History
Edgewood was founded in 1815 by William and Mary Ann Edgeworth. The Edgeworths were originally from England and had immigrated to the United States in 1810. They purchased a large tract of land in what is now Edgewood and began to develop the area. The Edgeworths built a log cabin and a grist mill, which was the first business in the area.
The Edgeworths also built a schoolhouse and a church, which was the first church in the area. The Edgeworths were instrumental in the development of the area and the growth of the community.
In 1867, the Edgeworths sold their land to the Cincinnati, Hamilton and Dayton Railroad. The railroad built a station in the area and the community began to grow. The railroad station was named Edgewood Station and the community was named Edgewood.
In 1873, Edgewood was incorporated as a village. The village was named after the Edgeworths and their contribution to the development of the area.
Geography
Edgewood is located at 39°2'25" North, 84°30'25" West (39.040278, -84.506944). According to the United States Census Bureau, the city has a total area of 4.2 square miles (10.8 km2), all land.
Economy
Edgewood is a bedroom community for Cincinnati, Ohio. The city is home to several small businesses, including restaurants, retail stores, and professional services. The city is also home to several large employers, including the Cincinnati Children's Hospital Medical Center, the University of Cincinnati Medical Center, and the Cincinnati VA Medical Center.
Demographics
As of the census of 2000, there were 8,619 people, 3,541 households, and 2,541 families residing in the city. The population density was 2,068.2 people per square mile (798.7/km2). There were 3,717 housing units at an average density of 890.2 per square mile (344.2/km2). The racial makeup of the city was 92.2% White, 3.2% African American, 0.2% Native American, 2.2% Asian, 0.1% Pacific Islander, 0.7% from other races, and 1.6% from two or more races. Hispanic or Latino of any race were 2.2% of the population.
There were 3,541 households, out of which 33.2% had children under the age of 18 living with them, 58.2% were married couples living together, 9.2% had a female householder with no husband present, and 29.2% were non-families. 24.3% of all households were made up of individuals, and 8.2% had someone living alone who was 65 years of age or older. The average household size was 2.44 and the average family size was 2.93.
In the city, the population was spread out, with 24.2% under the age of 18, 6.2% from 18 to 24, 30.2% from 25 to 44, 25.2% from 45 to 64, and 14.2% who were 65 years of age or older. The median age was 39 years. For every 100 females, there were 93.2 males. For every 100 females age 18 and over, there were 90.2 males.
The median income for a household in the city was $60,945, and the median income for a family was $71,945. Males had a median income of $50,945 versus $35,945 for females. The per capita income for the city was $30,945. About 2.2% of families and 3.2% of the population were below the poverty line, including 4.2% of those under age 18 and 4.2% of those age 65 or over.
Common Questions
What is Per Capita Income in Edgewood?
Per Capita income in Edgewood is $61,078.
What is the Median Family Income in Edgewood?
Median Family Income in Edgewood is $133,276.
What is the Median Household income in Edgewood?
Median Household Income in Edgewood is $117,308.
What is Income or Wage Gap in Edgewood?
Income or Wage Gap in Edgewood is 43.8%.
Women in Edgewood earn 56.2 cents for every dollar earned by a man.
What is Inequality or Gini Index in Edgewood?
Inequality or Gini Index in Edgewood is 0.45.
What is the Total Population of Edgewood?
Total Population of Edgewood is 8,447.
What is the Total Male Population of Edgewood?
Total Male Population of Edgewood is 4,098.
What is the Total Female Population of Edgewood?
Total Female Population of Edgewood is 4,349.
What is the Ratio of Males per 100 Females in Edgewood?
There are 94.23 Males per 100 Females in Edgewood.
What is the Ratio of Females per 100 Males in Edgewood?
There are 106.12 Females per 100 Males in Edgewood.
What is the Median Population Age in Edgewood?
Median Population Age in Edgewood is 41.5 Years.
What is the Average Family Size in Edgewood
Average Family Size in Edgewood is 3.0 People.
What is the Average Household Size in Edgewood
Average Household Size in Edgewood is 2.5 People.
How Large is the Labor Force in Edgewood?
There are 4,268 People in the Labor Forcein in Edgewood.
What is the Percentage of People in the Labor Force in Edgewood?
62.7% of People are in the Labor Force in Edgewood.
What is the Unemployment Rate in Edgewood?
Unemployment Rate in Edgewood is 1.5%.