Lakeside Park, KY Map & Demographics
Lakeside Park Map
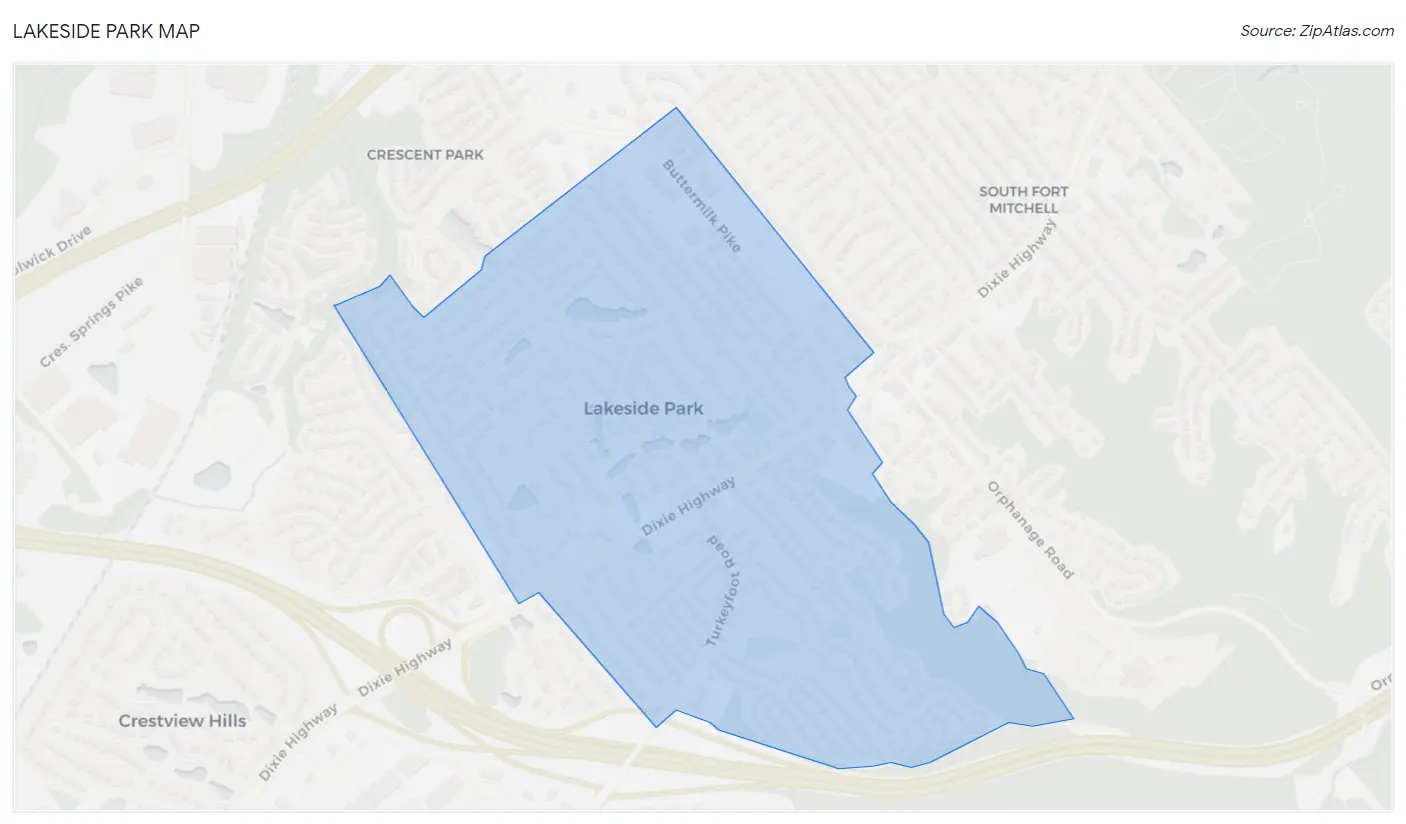
Lakeside Park Overview
$67,316
PER CAPITA INCOME
$145,417
AVG FAMILY INCOME
$104,523
AVG HOUSEHOLD INCOME
56.1%
WAGE / INCOME GAP [ % ]
43.9¢/ $1
WAGE / INCOME GAP [ $ ]
0.47
INEQUALITY / GINI INDEX
2,830
TOTAL POPULATION
1,373
MALE POPULATION
1,457
FEMALE POPULATION
94.23
MALES / 100 FEMALES
106.12
FEMALES / 100 MALES
46.7
MEDIAN AGE
3.2
AVG FAMILY SIZE
2.4
AVG HOUSEHOLD SIZE
1,658
LABOR FORCE [ PEOPLE ]
74.2%
PERCENT IN LABOR FORCE
Lakeside Park Area Codes
Income in Lakeside Park
Income Overview in Lakeside Park
Per Capita Income in Lakeside Park is $67,316, while median incomes of families and households are $145,417 and $104,523 respectively.
| Characteristic | Number | Measure |
| Per Capita Income | 2,830 | $67,316 |
| Median Family Income | 698 | $145,417 |
| Mean Family Income | 698 | $188,039 |
| Median Household Income | 1,153 | $104,523 |
| Mean Household Income | 1,153 | $161,704 |
| Income Deficit | 698 | $0 |
| Wage / Income Gap (%) | 2,830 | 56.08% |
| Wage / Income Gap ($) | 2,830 | 43.92¢ per $1 |
| Gini / Inequality Index | 2,830 | 0.47 |
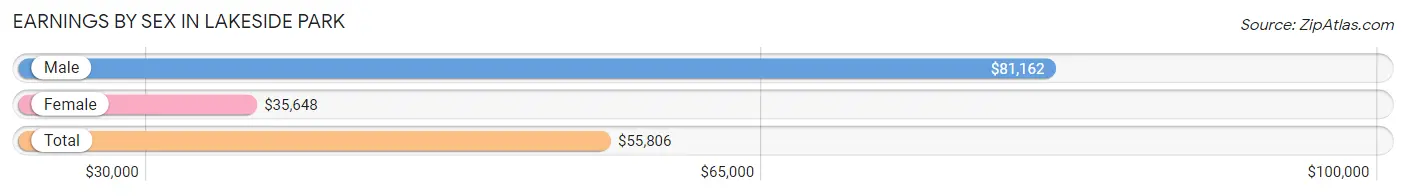
Earnings by Sex in Lakeside Park
Average Earnings in Lakeside Park are $55,806, $81,162 for men and $35,648 for women, a difference of 56.1%.
| Sex | Number | Average Earnings |
| Male | 864 (48.1%) | $81,162 |
| Female | 932 (51.9%) | $35,648 |
| Total | 1,796 (100.0%) | $55,806 |
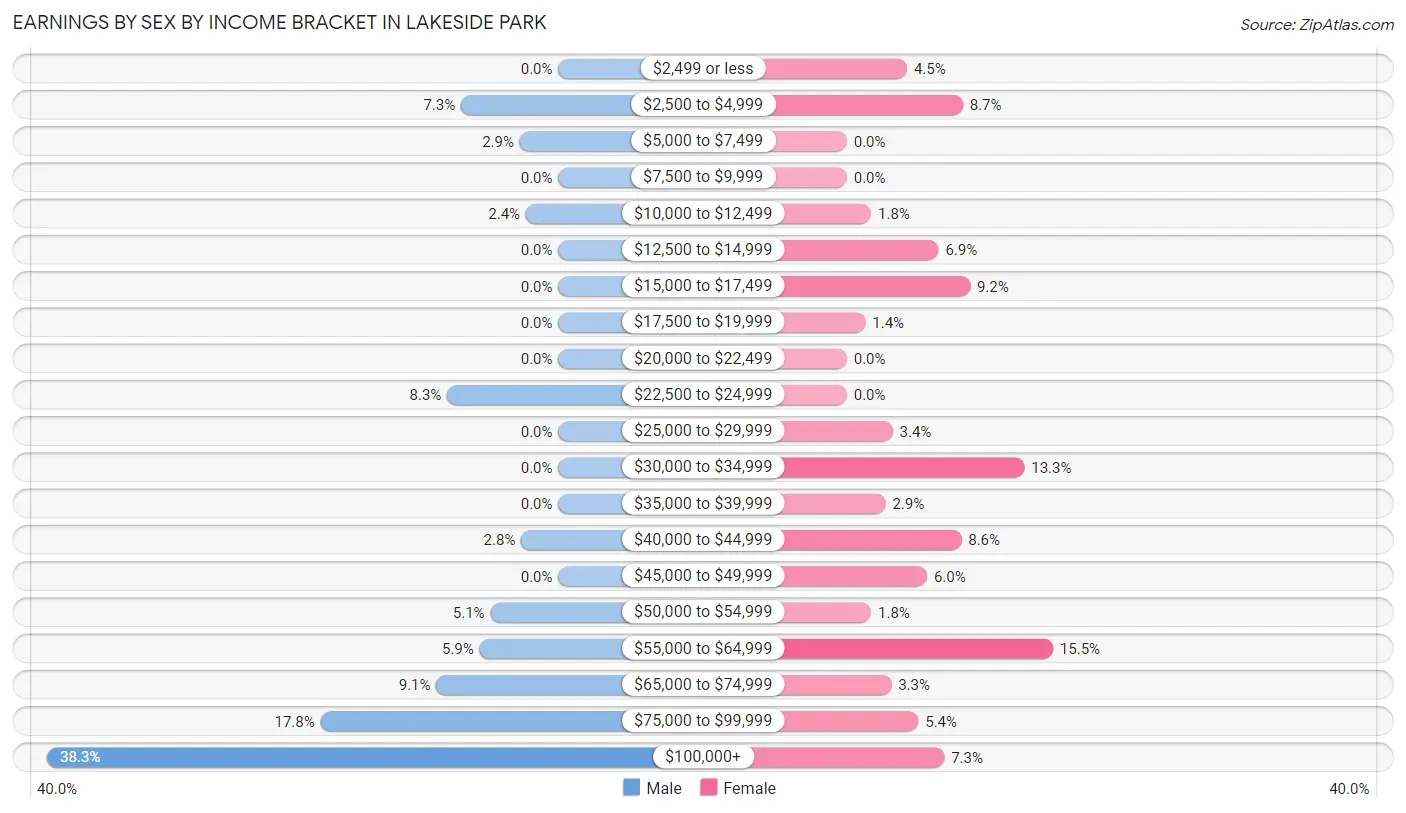
Earnings by Sex by Income Bracket in Lakeside Park
The most common earnings brackets in Lakeside Park are $100,000+ for men (331 | 38.3%) and $55,000 to $64,999 for women (144 | 15.4%).
| Income | Male | Female |
| $2,499 or less | 0 (0.0%) | 42 (4.5%) |
| $2,500 to $4,999 | 63 (7.3%) | 81 (8.7%) |
| $5,000 to $7,499 | 25 (2.9%) | 0 (0.0%) |
| $7,500 to $9,999 | 0 (0.0%) | 0 (0.0%) |
| $10,000 to $12,499 | 21 (2.4%) | 17 (1.8%) |
| $12,500 to $14,999 | 0 (0.0%) | 64 (6.9%) |
| $15,000 to $17,499 | 0 (0.0%) | 86 (9.2%) |
| $17,500 to $19,999 | 0 (0.0%) | 13 (1.4%) |
| $20,000 to $22,499 | 0 (0.0%) | 0 (0.0%) |
| $22,500 to $24,999 | 72 (8.3%) | 0 (0.0%) |
| $25,000 to $29,999 | 0 (0.0%) | 32 (3.4%) |
| $30,000 to $34,999 | 0 (0.0%) | 124 (13.3%) |
| $35,000 to $39,999 | 0 (0.0%) | 27 (2.9%) |
| $40,000 to $44,999 | 24 (2.8%) | 80 (8.6%) |
| $45,000 to $49,999 | 0 (0.0%) | 56 (6.0%) |
| $50,000 to $54,999 | 44 (5.1%) | 17 (1.8%) |
| $55,000 to $64,999 | 51 (5.9%) | 144 (15.4%) |
| $65,000 to $74,999 | 79 (9.1%) | 31 (3.3%) |
| $75,000 to $99,999 | 154 (17.8%) | 50 (5.4%) |
| $100,000+ | 331 (38.3%) | 68 (7.3%) |
| Total | 864 (100.0%) | 932 (100.0%) |
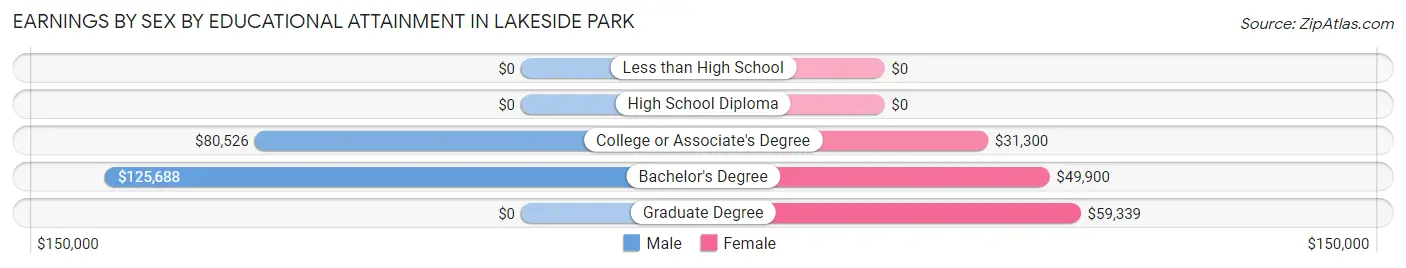
Earnings by Sex by Educational Attainment in Lakeside Park
Average earnings in Lakeside Park are $81,820 for men and $42,484 for women, a difference of 48.1%. Men with an educational attainment of bachelor's degree enjoy the highest average annual earnings of $125,688, while those with college or associate's degree education earn the least with $80,526. Women with an educational attainment of graduate degree earn the most with the average annual earnings of $59,339, while those with college or associate's degree education have the smallest earnings of $31,300.
| Educational Attainment | Male Income | Female Income |
| Less than High School | - | - |
| High School Diploma | - | - |
| College or Associate's Degree | $80,526 | $31,300 |
| Bachelor's Degree | $125,688 | $49,900 |
| Graduate Degree | - | - |
| Total | $81,820 | $42,484 |
Family Income in Lakeside Park
Family Income Brackets in Lakeside Park
According to the Lakeside Park family income data, there are 251 families falling into the $200,000+ income range, which is the most common income bracket and makes up 36.0% of all families.
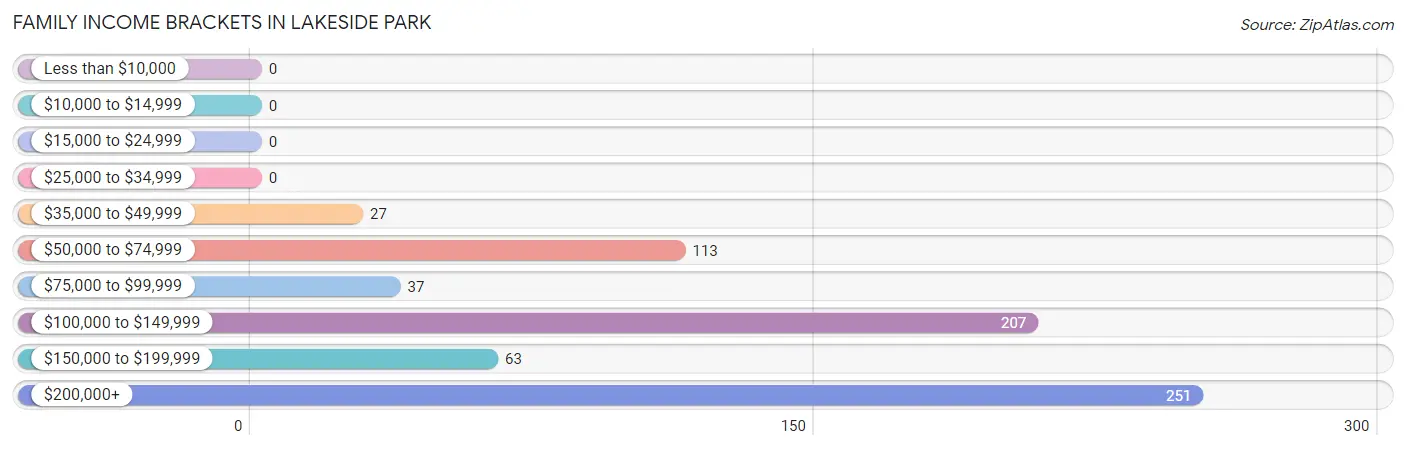
| Income Bracket | # Families | % Families |
| Less than $10,000 | 0 | 0.0% |
| $10,000 to $14,999 | 0 | 0.0% |
| $15,000 to $24,999 | 0 | 0.0% |
| $25,000 to $34,999 | 0 | 0.0% |
| $35,000 to $49,999 | 27 | 3.9% |
| $50,000 to $74,999 | 113 | 16.2% |
| $75,000 to $99,999 | 37 | 5.3% |
| $100,000 to $149,999 | 207 | 29.7% |
| $150,000 to $199,999 | 63 | 9.0% |
| $200,000+ | 251 | 36.0% |
Family Income by Famaliy Size in Lakeside Park
5-person families (97 | 13.9%) account for the highest median family income in Lakeside Park with $232,036 per family, while 2-person families (321 | 46.0%) have the highest median income of $85,156 per family member.
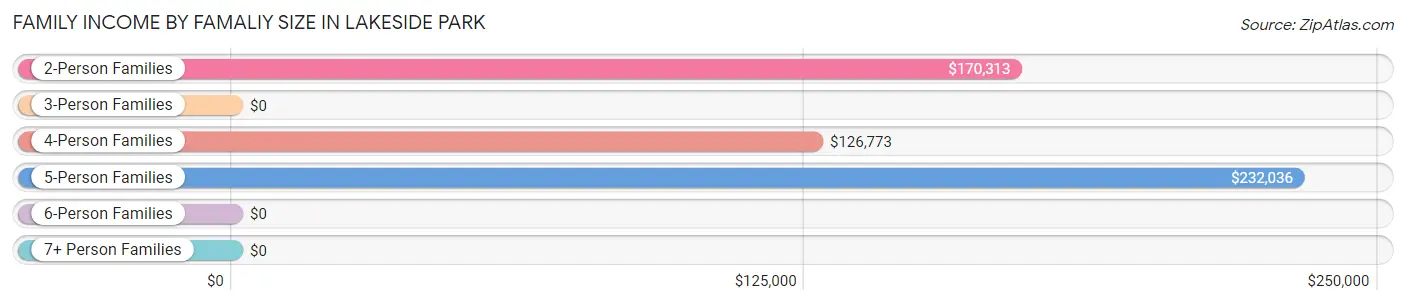
| Income Bracket | # Families | Median Income |
| 2-Person Families | 321 (46.0%) | $170,313 |
| 3-Person Families | 157 (22.5%) | $0 |
| 4-Person Families | 93 (13.3%) | $126,773 |
| 5-Person Families | 97 (13.9%) | $232,036 |
| 6-Person Families | 30 (4.3%) | $0 |
| 7+ Person Families | 0 (0.0%) | $0 |
| Total | 698 (100.0%) | $145,417 |
Family Income by Number of Earners in Lakeside Park
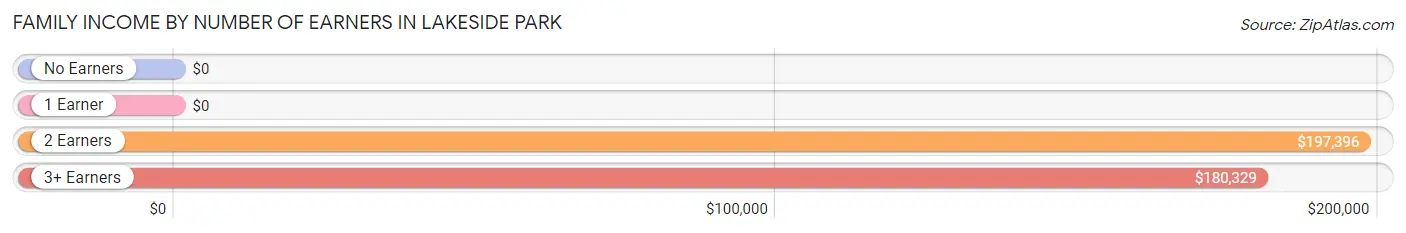
| Number of Earners | # Families | Median Income |
| No Earners | 57 (8.2%) | $0 |
| 1 Earner | 195 (27.9%) | $0 |
| 2 Earners | 325 (46.6%) | $197,396 |
| 3+ Earners | 121 (17.3%) | $180,329 |
| Total | 698 (100.0%) | $145,417 |
Household Income in Lakeside Park
Household Income Brackets in Lakeside Park
With 311 households falling in the category, the $200,000+ income range is the most frequent in Lakeside Park, accounting for 27.0% of all households.
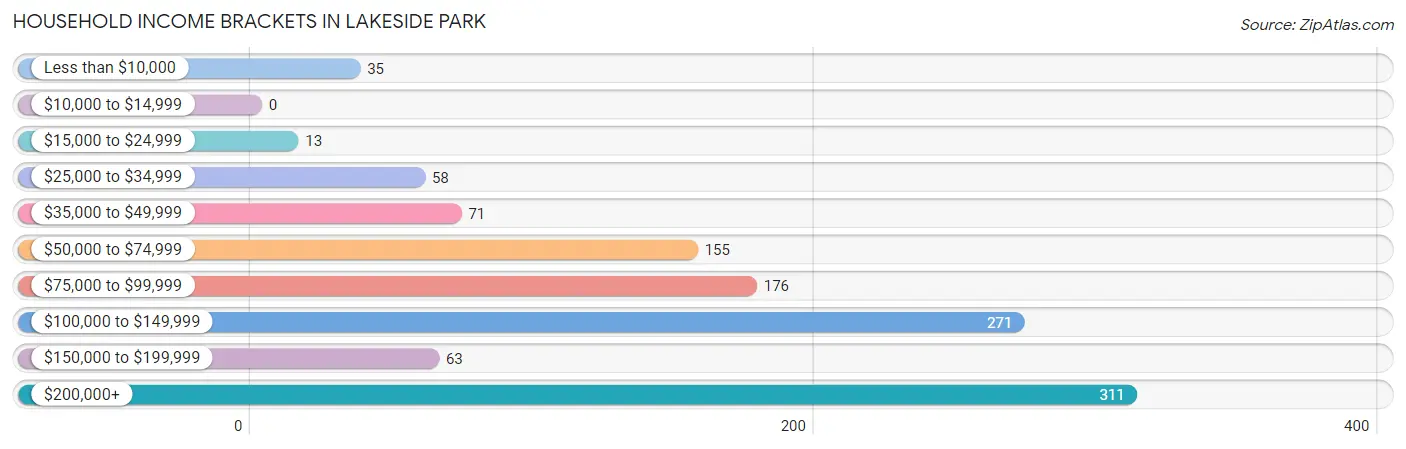
| Income Bracket | # Households | % Households |
| Less than $10,000 | 35 | 3.0% |
| $10,000 to $14,999 | 0 | 0.0% |
| $15,000 to $24,999 | 13 | 1.1% |
| $25,000 to $34,999 | 58 | 5.0% |
| $35,000 to $49,999 | 71 | 6.2% |
| $50,000 to $74,999 | 155 | 13.4% |
| $75,000 to $99,999 | 176 | 15.3% |
| $100,000 to $149,999 | 271 | 23.5% |
| $150,000 to $199,999 | 63 | 5.5% |
| $200,000+ | 311 | 27.0% |
Household Income by Householder Age in Lakeside Park
The median household income in Lakeside Park is $104,523, with the highest median household income of $130,438 found in the 25 to 44 years age bracket for the primary householder. A total of 247 households (21.4%) fall into this category.
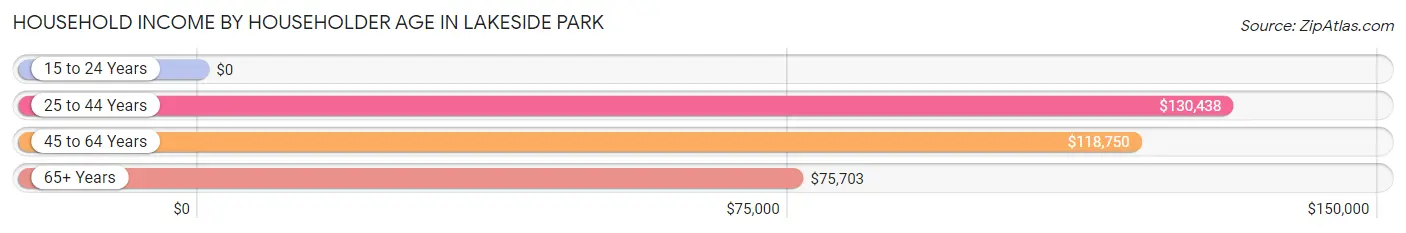
| Income Bracket | # Households | Median Income |
| 15 to 24 Years | 0 (0.0%) | $0 |
| 25 to 44 Years | 247 (21.4%) | $130,438 |
| 45 to 64 Years | 671 (58.2%) | $118,750 |
| 65+ Years | 235 (20.4%) | $75,703 |
| Total | 1,153 (100.0%) | $104,523 |
Poverty in Lakeside Park
Income Below Poverty by Sex and Age in Lakeside Park
With 2.1% poverty level for males and 1.2% for females among the residents of Lakeside Park, 55 to 64 year old males and 75 year old and over females are the most vulnerable to poverty, with 26 males (10.3%) and 8 females (6.4%) in their respective age groups living below the poverty level.
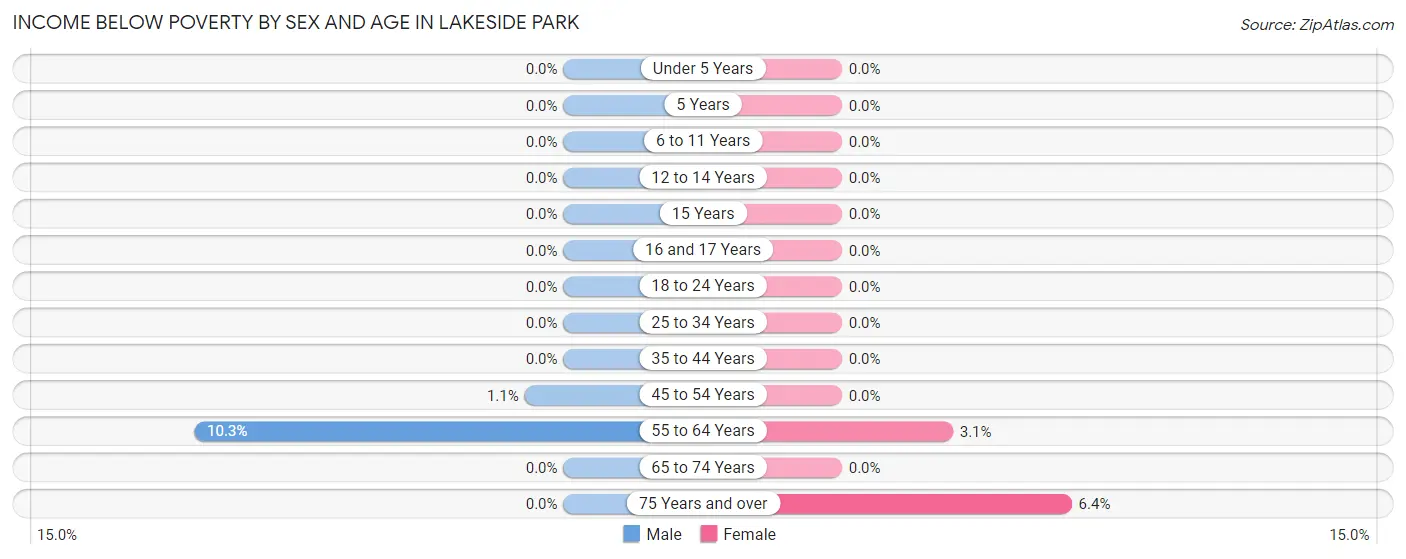
| Age Bracket | Male | Female |
| Under 5 Years | 0 (0.0%) | 0 (0.0%) |
| 5 Years | 0 (0.0%) | 0 (0.0%) |
| 6 to 11 Years | 0 (0.0%) | 0 (0.0%) |
| 12 to 14 Years | 0 (0.0%) | 0 (0.0%) |
| 15 Years | 0 (0.0%) | 0 (0.0%) |
| 16 and 17 Years | 0 (0.0%) | 0 (0.0%) |
| 18 to 24 Years | 0 (0.0%) | 0 (0.0%) |
| 25 to 34 Years | 0 (0.0%) | 0 (0.0%) |
| 35 to 44 Years | 0 (0.0%) | 0 (0.0%) |
| 45 to 54 Years | 3 (1.1%) | 0 (0.0%) |
| 55 to 64 Years | 26 (10.3%) | 10 (3.1%) |
| 65 to 74 Years | 0 (0.0%) | 0 (0.0%) |
| 75 Years and over | 0 (0.0%) | 8 (6.4%) |
| Total | 29 (2.1%) | 18 (1.2%) |
Income Above Poverty by Sex and Age in Lakeside Park
According to the poverty statistics in Lakeside Park, males aged under 5 years and females aged 5 years are the age groups that are most secure financially, with 100.0% of males and 100.0% of females in these age groups living above the poverty line.
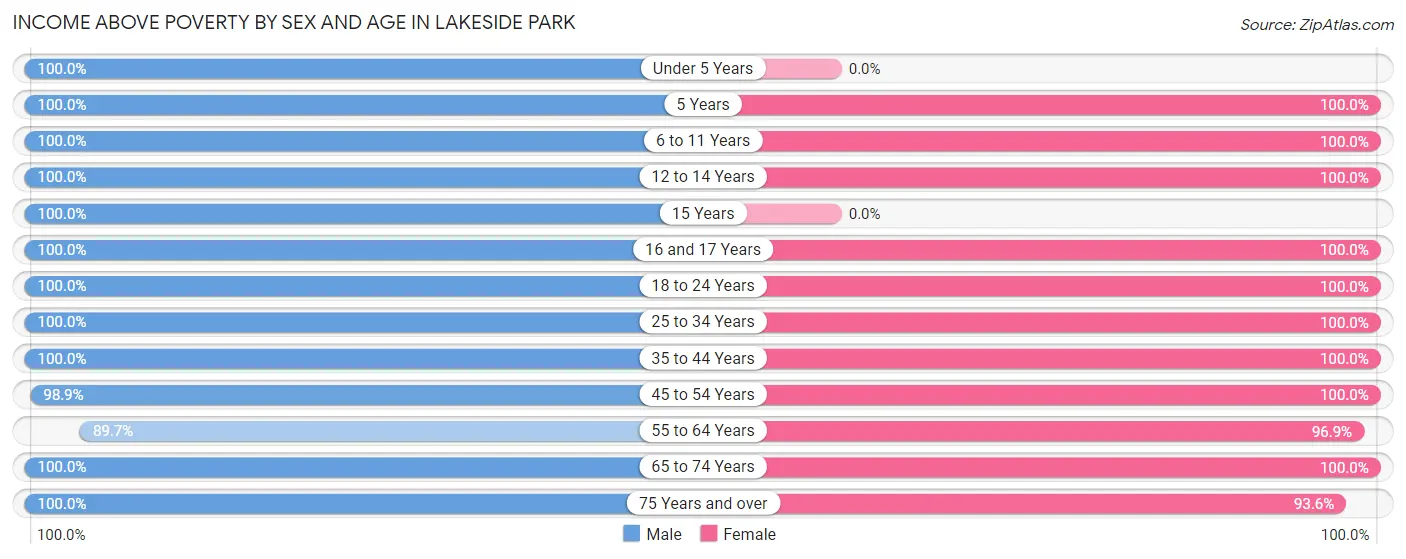
| Age Bracket | Male | Female |
| Under 5 Years | 37 (100.0%) | 0 (0.0%) |
| 5 Years | 49 (100.0%) | 63 (100.0%) |
| 6 to 11 Years | 148 (100.0%) | 115 (100.0%) |
| 12 to 14 Years | 74 (100.0%) | 32 (100.0%) |
| 15 Years | 78 (100.0%) | 0 (0.0%) |
| 16 and 17 Years | 13 (100.0%) | 54 (100.0%) |
| 18 to 24 Years | 60 (100.0%) | 183 (100.0%) |
| 25 to 34 Years | 55 (100.0%) | 113 (100.0%) |
| 35 to 44 Years | 81 (100.0%) | 150 (100.0%) |
| 45 to 54 Years | 274 (98.9%) | 270 (100.0%) |
| 55 to 64 Years | 227 (89.7%) | 314 (96.9%) |
| 65 to 74 Years | 180 (100.0%) | 28 (100.0%) |
| 75 Years and over | 68 (100.0%) | 117 (93.6%) |
| Total | 1,344 (97.9%) | 1,439 (98.8%) |
Income Below Poverty Among Married-Couple Families in Lakeside Park
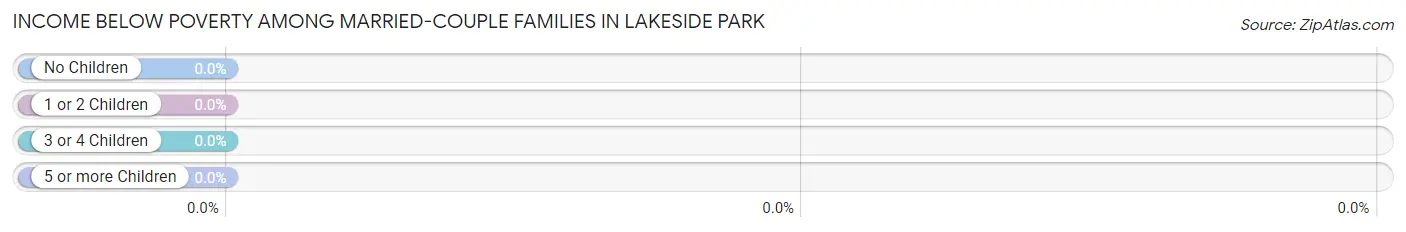
| Children | Above Poverty | Below Poverty |
| No Children | 398 (100.0%) | 0 (0.0%) |
| 1 or 2 Children | 86 (100.0%) | 0 (0.0%) |
| 3 or 4 Children | 100 (100.0%) | 0 (0.0%) |
| 5 or more Children | 0 (0.0%) | 0 (0.0%) |
| Total | 584 (100.0%) | 0 (0.0%) |
Income Below Poverty Among Single-Parent Households in Lakeside Park
| Children | Single Father | Single Mother |
| No Children | 0 (0.0%) | 0 (0.0%) |
| 1 or 2 Children | 0 (0.0%) | 0 (0.0%) |
| 3 or 4 Children | 0 (0.0%) | 0 (0.0%) |
| 5 or more Children | 0 (0.0%) | 0 (0.0%) |
| Total | 0 (0.0%) | 0 (0.0%) |
Income Below Poverty Among Married-Couple vs Single-Parent Households in Lakeside Park
| Children | Married-Couple Families | Single-Parent Households |
| No Children | 0 (0.0%) | 0 (0.0%) |
| 1 or 2 Children | 0 (0.0%) | 0 (0.0%) |
| 3 or 4 Children | 0 (0.0%) | 0 (0.0%) |
| 5 or more Children | 0 (0.0%) | 0 (0.0%) |
| Total | 0 (0.0%) | 0 (0.0%) |
Race in Lakeside Park
The most populous races in Lakeside Park are White / Caucasian (2,529 | 89.4%), Two or more Races (140 | 5.0%), and Asian (138 | 4.9%).
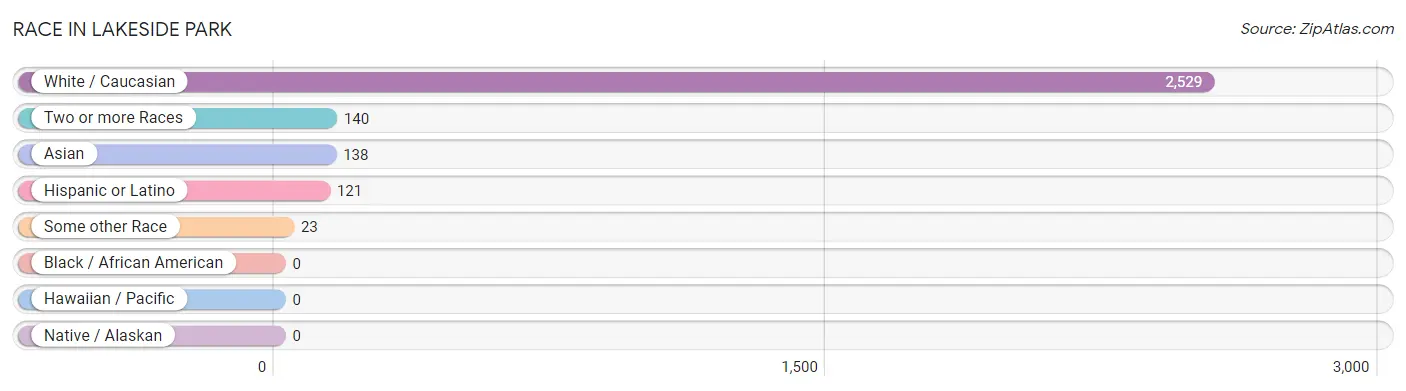
| Race | # Population | % Population |
| Asian | 138 | 4.9% |
| Black / African American | 0 | 0.0% |
| Hawaiian / Pacific | 0 | 0.0% |
| Hispanic or Latino | 121 | 4.3% |
| Native / Alaskan | 0 | 0.0% |
| White / Caucasian | 2,529 | 89.4% |
| Two or more Races | 140 | 5.0% |
| Some other Race | 23 | 0.8% |
| Total | 2,830 | 100.0% |
Ancestry in Lakeside Park
The most populous ancestries reported in Lakeside Park are German (1,053 | 37.2%), Irish (638 | 22.5%), American (280 | 9.9%), Scottish (188 | 6.6%), and English (137 | 4.8%), together accounting for 81.1% of all Lakeside Park residents.
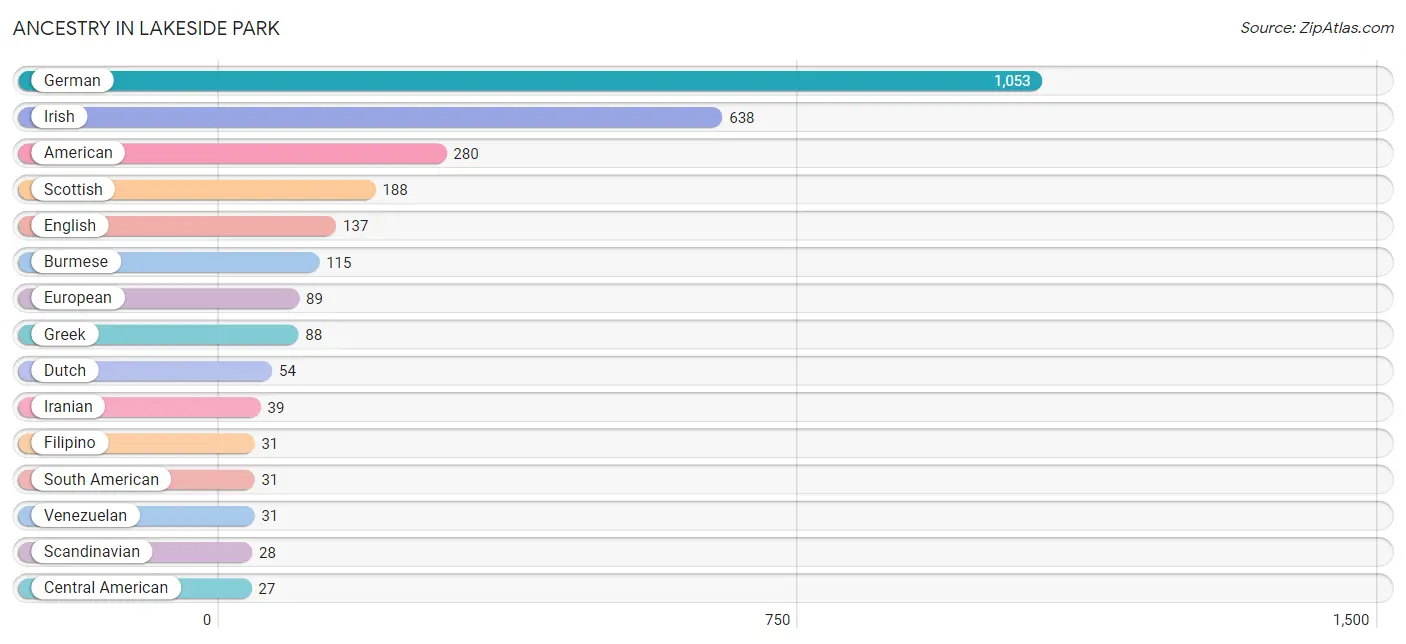
| Ancestry | # Population | % Population |
| American | 280 | 9.9% |
| Burmese | 115 | 4.1% |
| Central American | 27 | 0.9% |
| Dutch | 54 | 1.9% |
| English | 137 | 4.8% |
| European | 89 | 3.1% |
| Filipino | 31 | 1.1% |
| French | 19 | 0.7% |
| German | 1,053 | 37.2% |
| Greek | 88 | 3.1% |
| Hungarian | 15 | 0.5% |
| Indian (Asian) | 16 | 0.6% |
| Iranian | 39 | 1.4% |
| Irish | 638 | 22.5% |
| Italian | 25 | 0.9% |
| Salvadoran | 27 | 0.9% |
| Scandinavian | 28 | 1.0% |
| Scottish | 188 | 6.6% |
| Slavic | 20 | 0.7% |
| South American | 31 | 1.1% |
| Venezuelan | 31 | 1.1% | View All 21 Rows |
Immigrants in Lakeside Park
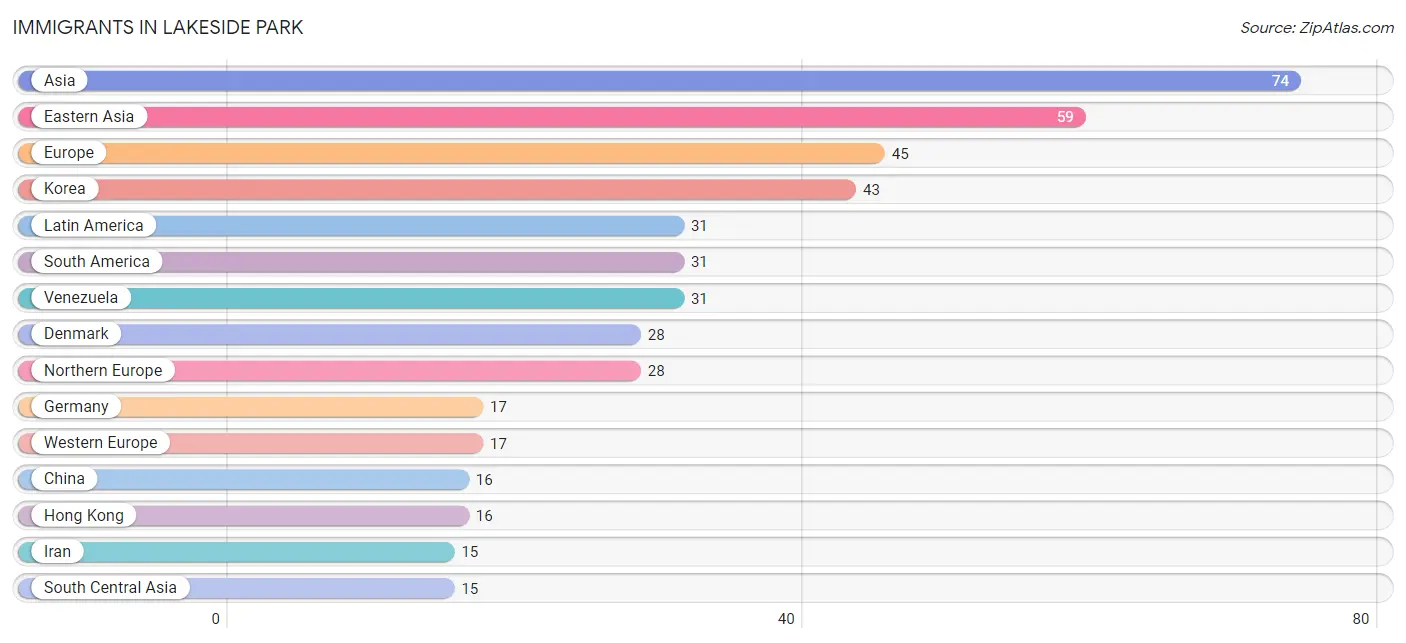
The most numerous immigrant groups reported in Lakeside Park came from Asia (74 | 2.6%), Eastern Asia (59 | 2.1%), Europe (45 | 1.6%), Korea (43 | 1.5%), and Latin America (31 | 1.1%), together accounting for 8.9% of all Lakeside Park residents.
| Immigration Origin | # Population | % Population |
| Asia | 74 | 2.6% |
| China | 16 | 0.6% |
| Denmark | 28 | 1.0% |
| Eastern Asia | 59 | 2.1% |
| Europe | 45 | 1.6% |
| Germany | 17 | 0.6% |
| Hong Kong | 16 | 0.6% |
| Iran | 15 | 0.5% |
| Korea | 43 | 1.5% |
| Latin America | 31 | 1.1% |
| Northern Europe | 28 | 1.0% |
| South America | 31 | 1.1% |
| South Central Asia | 15 | 0.5% |
| Venezuela | 31 | 1.1% |
| Western Europe | 17 | 0.6% | View All 15 Rows |
Sex and Age in Lakeside Park
Sex and Age in Lakeside Park
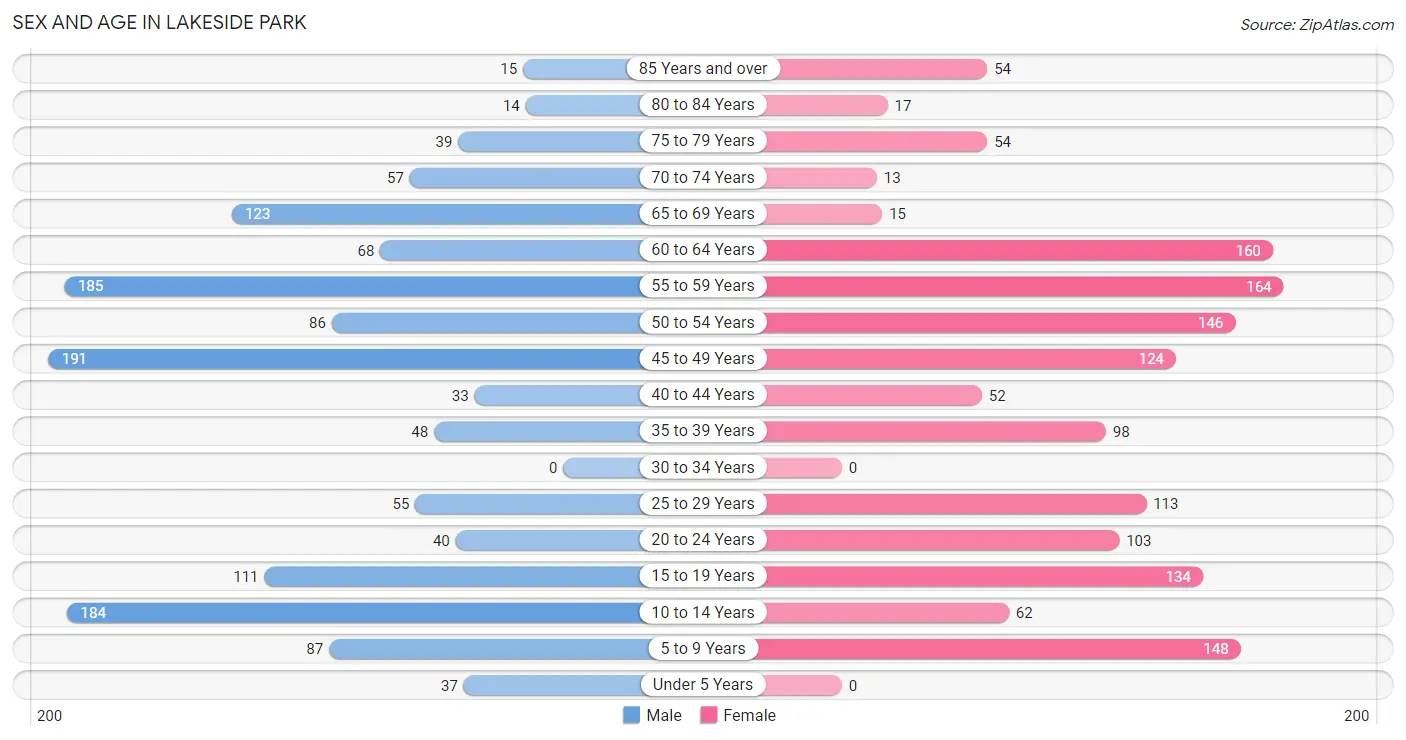
The most populous age groups in Lakeside Park are 45 to 49 Years (191 | 13.9%) for men and 55 to 59 Years (164 | 11.3%) for women.
| Age Bracket | Male | Female |
| Under 5 Years | 37 (2.7%) | 0 (0.0%) |
| 5 to 9 Years | 87 (6.3%) | 148 (10.2%) |
| 10 to 14 Years | 184 (13.4%) | 62 (4.3%) |
| 15 to 19 Years | 111 (8.1%) | 134 (9.2%) |
| 20 to 24 Years | 40 (2.9%) | 103 (7.1%) |
| 25 to 29 Years | 55 (4.0%) | 113 (7.8%) |
| 30 to 34 Years | 0 (0.0%) | 0 (0.0%) |
| 35 to 39 Years | 48 (3.5%) | 98 (6.7%) |
| 40 to 44 Years | 33 (2.4%) | 52 (3.6%) |
| 45 to 49 Years | 191 (13.9%) | 124 (8.5%) |
| 50 to 54 Years | 86 (6.3%) | 146 (10.0%) |
| 55 to 59 Years | 185 (13.5%) | 164 (11.3%) |
| 60 to 64 Years | 68 (5.0%) | 160 (11.0%) |
| 65 to 69 Years | 123 (9.0%) | 15 (1.0%) |
| 70 to 74 Years | 57 (4.2%) | 13 (0.9%) |
| 75 to 79 Years | 39 (2.8%) | 54 (3.7%) |
| 80 to 84 Years | 14 (1.0%) | 17 (1.2%) |
| 85 Years and over | 15 (1.1%) | 54 (3.7%) |
| Total | 1,373 (100.0%) | 1,457 (100.0%) |
Families and Households in Lakeside Park
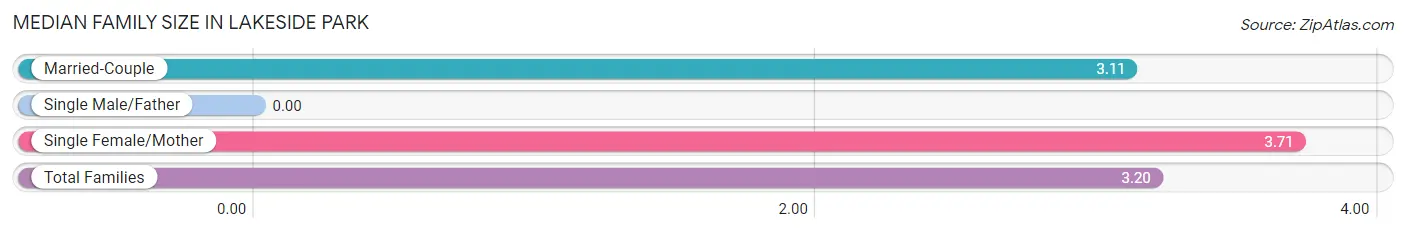
Median Family Size in Lakeside Park
| Family Type | # Families | Family Size |
| Married-Couple | 584 (83.7%) | 3.11 |
| Single Male/Father | 0 (0.0%) | - |
| Single Female/Mother | 114 (16.3%) | 3.71 |
| Total Families | 698 (100.0%) | 3.20 |
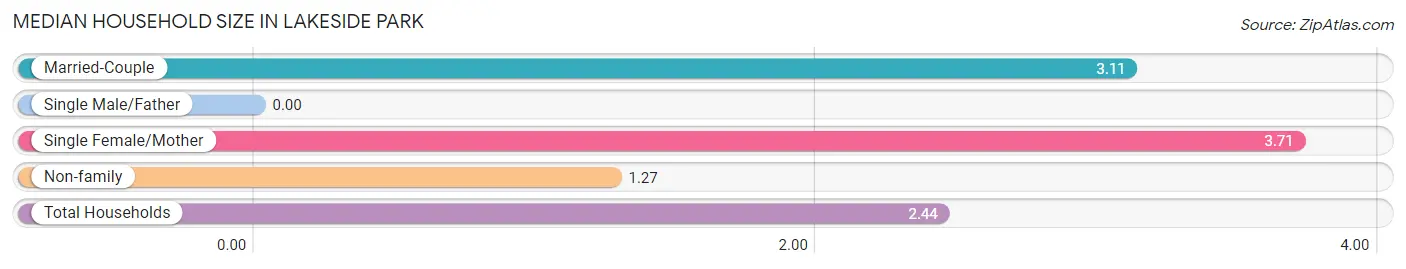
Median Household Size in Lakeside Park
| Household Type | # Households | Household Size |
| Married-Couple | 584 (50.6%) | 3.11 |
| Single Male/Father | 0 (0.0%) | - |
| Single Female/Mother | 114 (9.9%) | 3.71 |
| Non-family | 455 (39.5%) | 1.27 |
| Total Households | 1,153 (100.0%) | 2.44 |
Household Size by Marriage Status in Lakeside Park
Out of a total of 1,153 households in Lakeside Park, 698 (60.5%) are family households, while 455 (39.5%) are nonfamily households. The most numerous type of family households are 2-person households, comprising 321, and the most common type of nonfamily households are 1-person households, comprising 336.
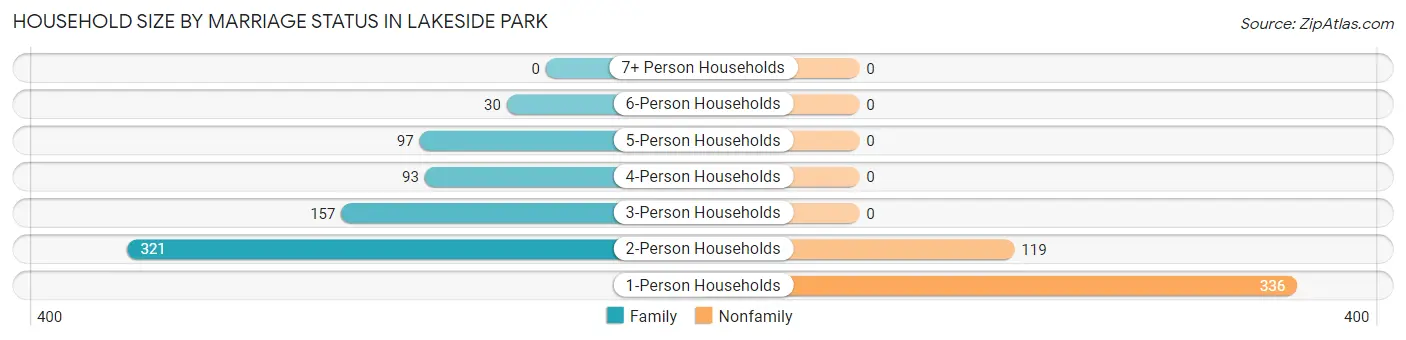
| Household Size | Family Households | Nonfamily Households |
| 1-Person Households | - | 336 (29.1%) |
| 2-Person Households | 321 (27.8%) | 119 (10.3%) |
| 3-Person Households | 157 (13.6%) | 0 (0.0%) |
| 4-Person Households | 93 (8.1%) | 0 (0.0%) |
| 5-Person Households | 97 (8.4%) | 0 (0.0%) |
| 6-Person Households | 30 (2.6%) | 0 (0.0%) |
| 7+ Person Households | 0 (0.0%) | 0 (0.0%) |
| Total | 698 (60.5%) | 455 (39.5%) |
Female Fertility in Lakeside Park
Fertility by Age in Lakeside Park
Average fertility rate in Lakeside Park is 27.0 births per 1,000 women. Women in the age bracket of 20 to 34 years have the highest fertility rate with 79.0 births per 1,000 women. Women in the age bracket of 20 to 34 years acount for 100.0% of all women with births.
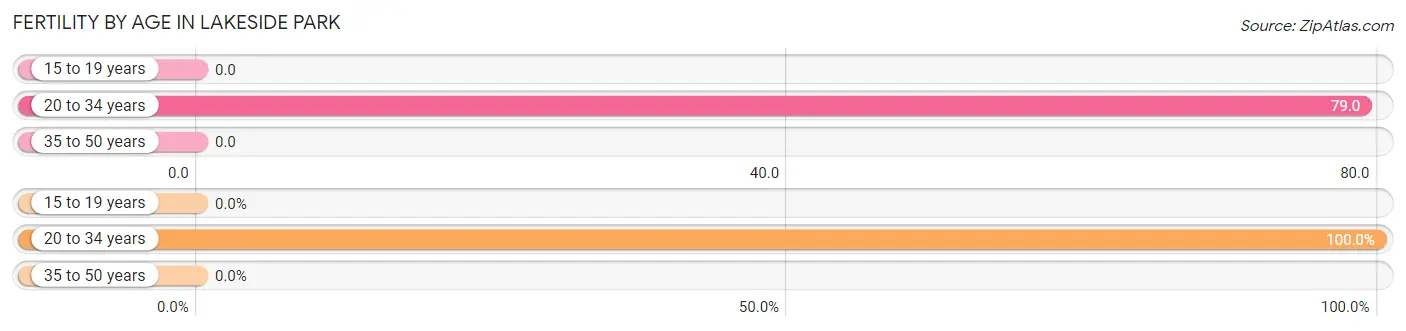
| Age Bracket | Women with Births | Births / 1,000 Women |
| 15 to 19 years | 0 (0.0%) | 0.0 |
| 20 to 34 years | 17 (100.0%) | 79.0 |
| 35 to 50 years | 0 (0.0%) | 0.0 |
| Total | 17 (100.0%) | 27.0 |
Fertility by Age by Marriage Status in Lakeside Park
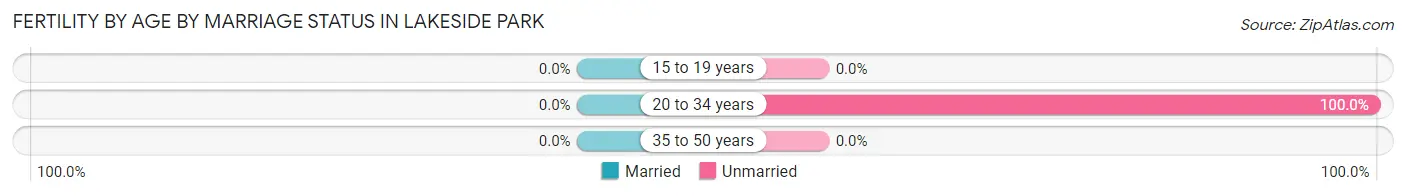
| Age Bracket | Married | Unmarried |
| 15 to 19 years | 0 (0.0%) | 0 (0.0%) |
| 20 to 34 years | 0 (0.0%) | 17 (100.0%) |
| 35 to 50 years | 0 (0.0%) | 0 (0.0%) |
| Total | 0 (0.0%) | 17 (100.0%) |
Fertility by Education in Lakeside Park
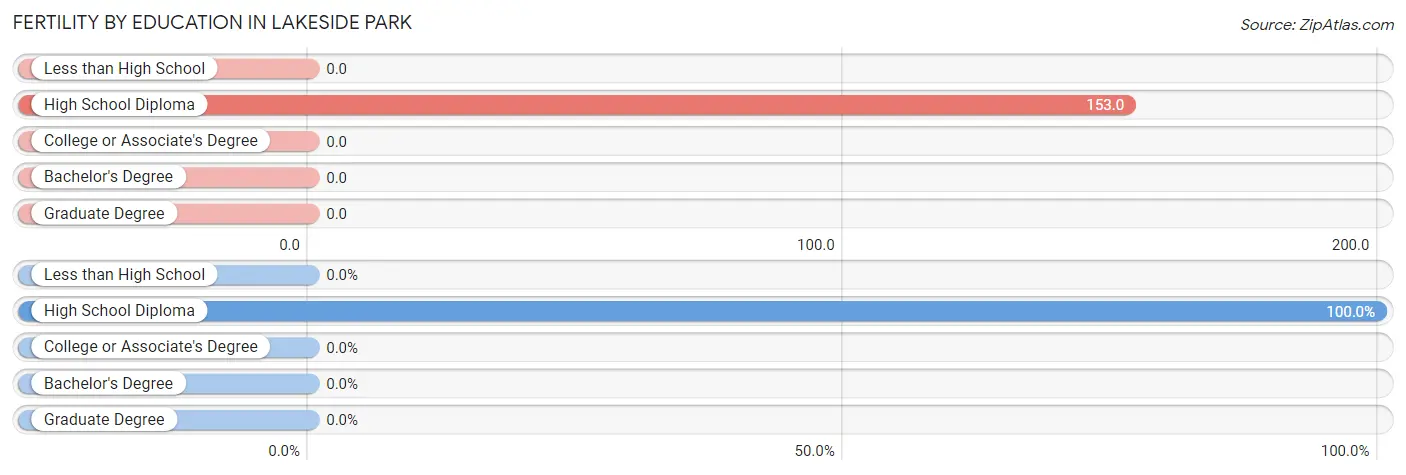
| Educational Attainment | Women with Births | Births / 1,000 Women |
| Less than High School | 0 (0.0%) | 0.0 |
| High School Diploma | 17 (100.0%) | 153.0 |
| College or Associate's Degree | 0 (0.0%) | 0.0 |
| Bachelor's Degree | 0 (0.0%) | 0.0 |
| Graduate Degree | 0 (0.0%) | 0.0 |
| Total | 17 (100.0%) | 27.0 |
Fertility by Education by Marriage Status in Lakeside Park
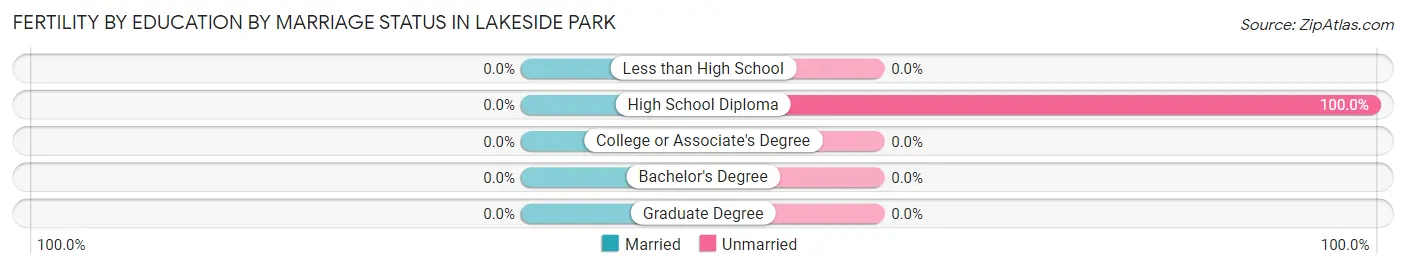
| Educational Attainment | Married | Unmarried |
| Less than High School | 0 (0.0%) | 0 (0.0%) |
| High School Diploma | 0 (0.0%) | 17 (100.0%) |
| College or Associate's Degree | 0 (0.0%) | 0 (0.0%) |
| Bachelor's Degree | 0 (0.0%) | 0 (0.0%) |
| Graduate Degree | 0 (0.0%) | 0 (0.0%) |
| Total | 0 (0.0%) | 17 (100.0%) |
Employment Characteristics in Lakeside Park
Employment by Class of Employer in Lakeside Park
Among the 1,620 employed individuals in Lakeside Park, private company employees (1,080 | 66.7%), not-for-profit organizations (154 | 9.5%), and self-employed (incorporated) (123 | 7.6%) make up the most common classes of employment.
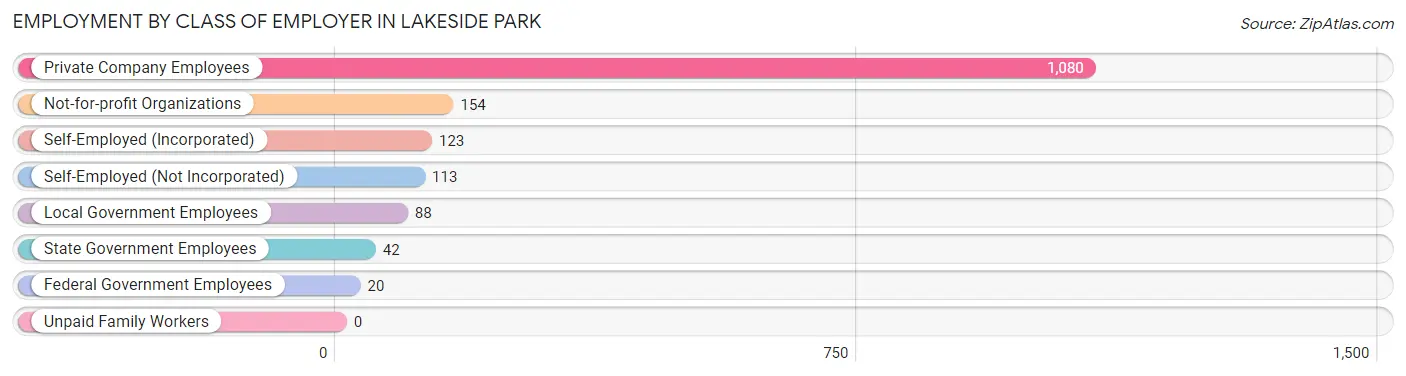
| Employer Class | # Employees | % Employees |
| Private Company Employees | 1,080 | 66.7% |
| Self-Employed (Incorporated) | 123 | 7.6% |
| Self-Employed (Not Incorporated) | 113 | 7.0% |
| Not-for-profit Organizations | 154 | 9.5% |
| Local Government Employees | 88 | 5.4% |
| State Government Employees | 42 | 2.6% |
| Federal Government Employees | 20 | 1.2% |
| Unpaid Family Workers | 0 | 0.0% |
| Total | 1,620 | 100.0% |
Employment Status by Age in Lakeside Park
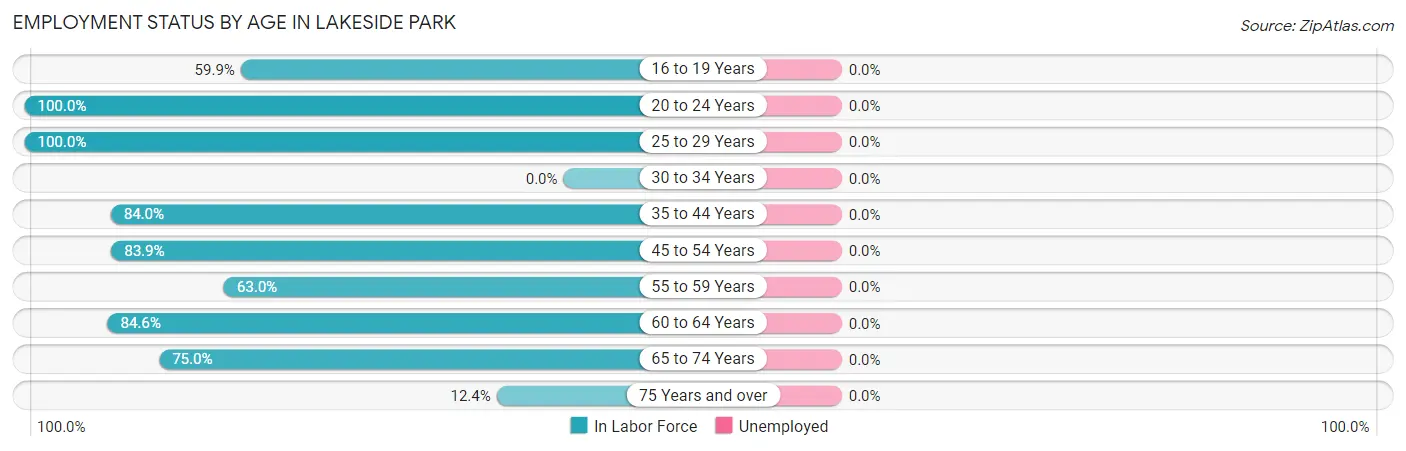
| Age Bracket | In Labor Force | Unemployed |
| 16 to 19 Years | 100 (59.9%) | 0 (0.0%) |
| 20 to 24 Years | 143 (100.0%) | 0 (0.0%) |
| 25 to 29 Years | 168 (100.0%) | 0 (0.0%) |
| 30 to 34 Years | 0 (0.0%) | 0 (0.0%) |
| 35 to 44 Years | 194 (84.0%) | 0 (0.0%) |
| 45 to 54 Years | 459 (83.9%) | 0 (0.0%) |
| 55 to 59 Years | 220 (63.0%) | 0 (0.0%) |
| 60 to 64 Years | 193 (84.6%) | 0 (0.0%) |
| 65 to 74 Years | 156 (75.0%) | 0 (0.0%) |
| 75 Years and over | 24 (12.4%) | 0 (0.0%) |
| Total | 1,658 (74.2%) | 0 (0.0%) |
Employment Status by Educational Attainment in Lakeside Park
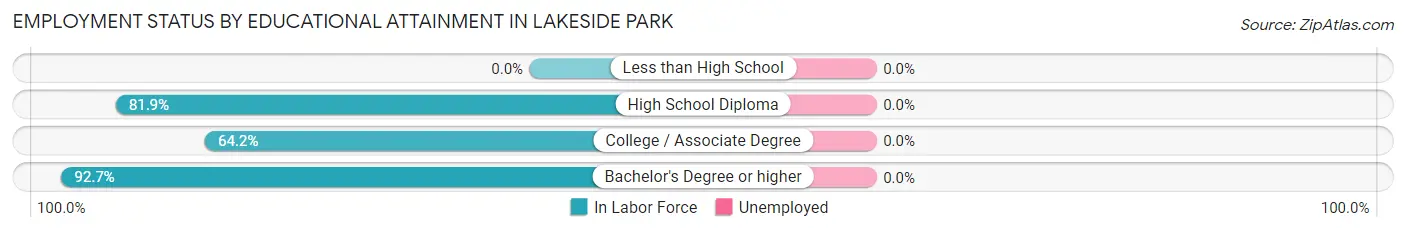
| Educational Attainment | In Labor Force | Unemployed |
| Less than High School | 0 (0.0%) | 0 (0.0%) |
| High School Diploma | 59 (81.9%) | 0 (0.0%) |
| College / Associate Degree | 383 (64.2%) | 0 (0.0%) |
| Bachelor's Degree or higher | 792 (92.7%) | 0 (0.0%) |
| Total | 1,234 (81.0%) | 0 (0.0%) |
Employment Occupations by Sex in Lakeside Park
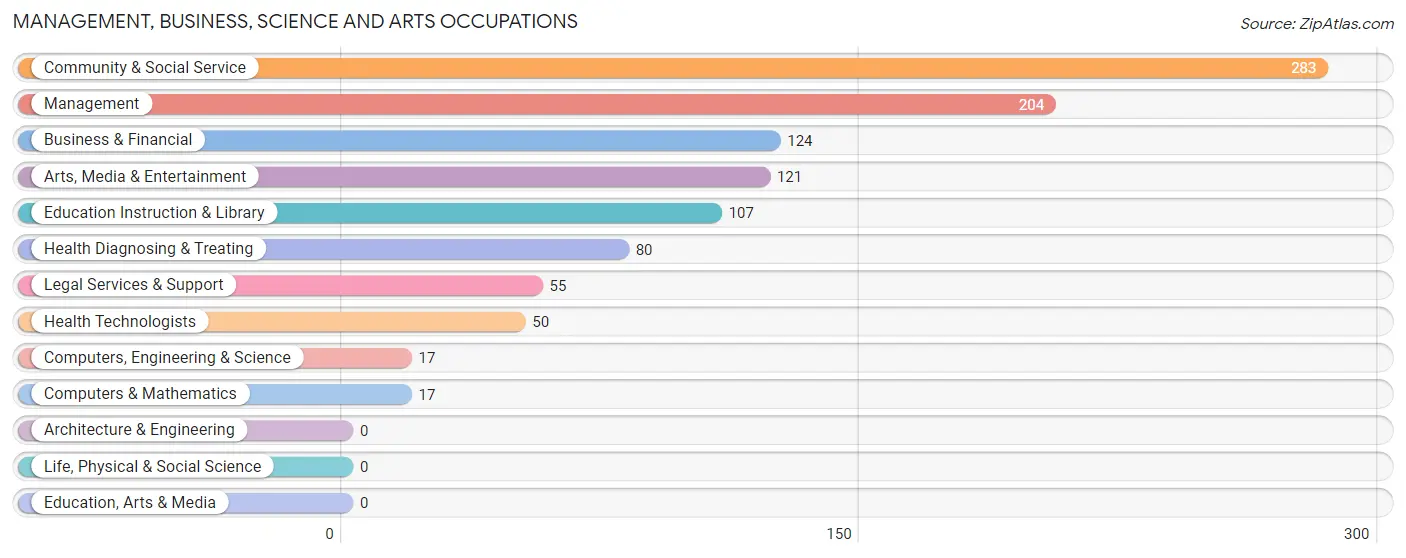
Management, Business, Science and Arts Occupations
The most common Management, Business, Science and Arts occupations in Lakeside Park are Community & Social Service (283 | 17.1%), Management (204 | 12.3%), Business & Financial (124 | 7.5%), Arts, Media & Entertainment (121 | 7.3%), and Education Instruction & Library (107 | 6.5%).
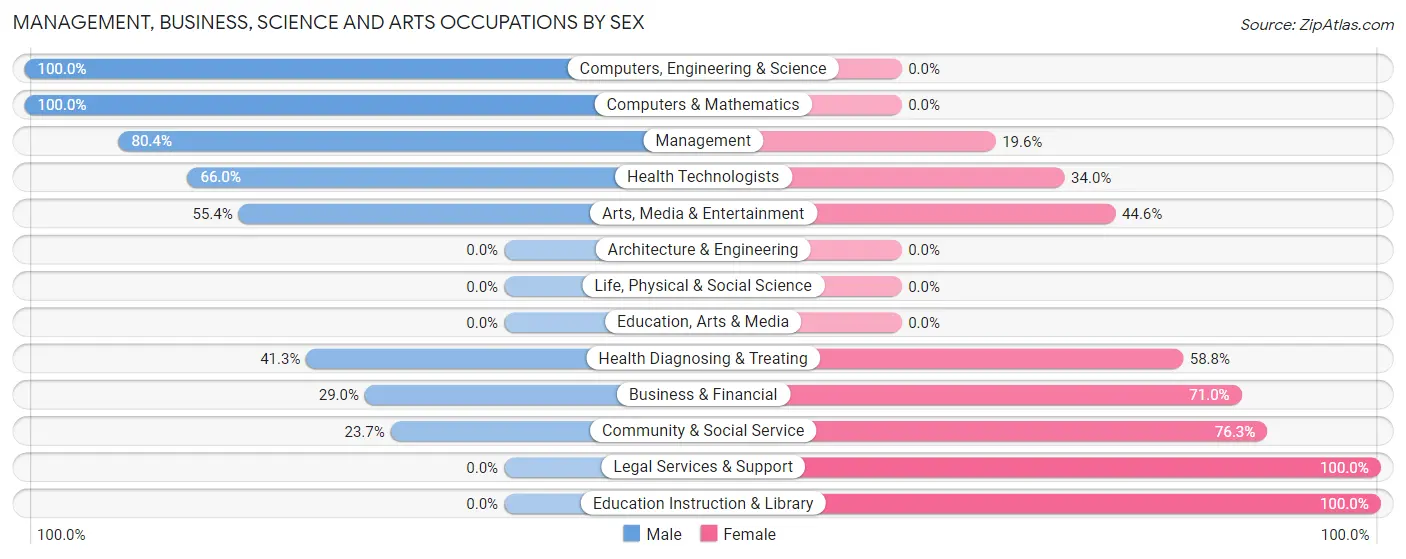
Management, Business, Science and Arts Occupations by Sex
Within the Management, Business, Science and Arts occupations in Lakeside Park, the most male-oriented occupations are Computers, Engineering & Science (100.0%), Computers & Mathematics (100.0%), and Management (80.4%), while the most female-oriented occupations are Legal Services & Support (100.0%), Education Instruction & Library (100.0%), and Community & Social Service (76.3%).
| Occupation | Male | Female |
| Management | 164 (80.4%) | 40 (19.6%) |
| Business & Financial | 36 (29.0%) | 88 (71.0%) |
| Computers, Engineering & Science | 17 (100.0%) | 0 (0.0%) |
| Computers & Mathematics | 17 (100.0%) | 0 (0.0%) |
| Architecture & Engineering | 0 (0.0%) | 0 (0.0%) |
| Life, Physical & Social Science | 0 (0.0%) | 0 (0.0%) |
| Community & Social Service | 67 (23.7%) | 216 (76.3%) |
| Education, Arts & Media | 0 (0.0%) | 0 (0.0%) |
| Legal Services & Support | 0 (0.0%) | 55 (100.0%) |
| Education Instruction & Library | 0 (0.0%) | 107 (100.0%) |
| Arts, Media & Entertainment | 67 (55.4%) | 54 (44.6%) |
| Health Diagnosing & Treating | 33 (41.2%) | 47 (58.8%) |
| Health Technologists | 33 (66.0%) | 17 (34.0%) |
| Total (Category) | 317 (44.8%) | 391 (55.2%) |
| Total (Overall) | 864 (52.1%) | 793 (47.9%) |
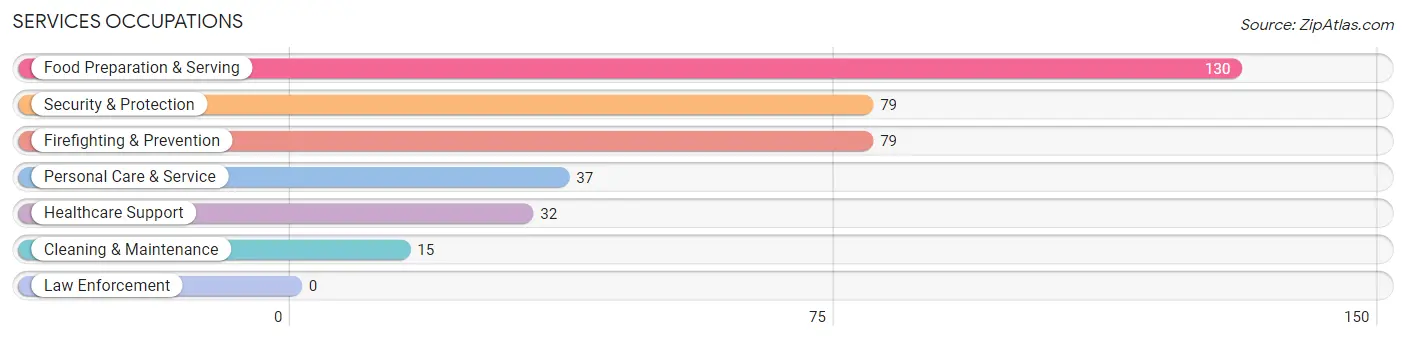
Services Occupations
The most common Services occupations in Lakeside Park are Food Preparation & Serving (130 | 7.9%), Security & Protection (79 | 4.8%), Firefighting & Prevention (79 | 4.8%), Personal Care & Service (37 | 2.2%), and Healthcare Support (32 | 1.9%).
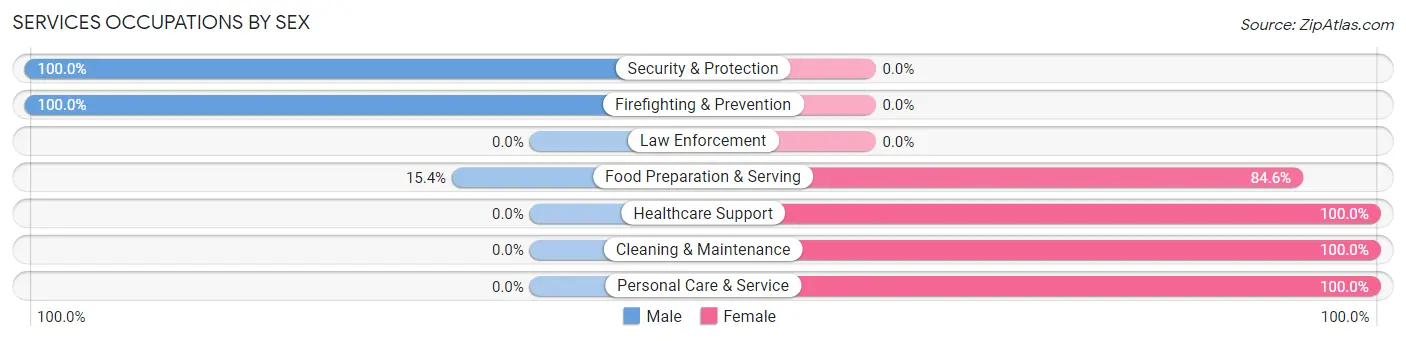
Services Occupations by Sex
Within the Services occupations in Lakeside Park, the most male-oriented occupations are Security & Protection (100.0%), Firefighting & Prevention (100.0%), and Food Preparation & Serving (15.4%), while the most female-oriented occupations are Healthcare Support (100.0%), Cleaning & Maintenance (100.0%), and Personal Care & Service (100.0%).
| Occupation | Male | Female |
| Healthcare Support | 0 (0.0%) | 32 (100.0%) |
| Security & Protection | 79 (100.0%) | 0 (0.0%) |
| Firefighting & Prevention | 79 (100.0%) | 0 (0.0%) |
| Law Enforcement | 0 (0.0%) | 0 (0.0%) |
| Food Preparation & Serving | 20 (15.4%) | 110 (84.6%) |
| Cleaning & Maintenance | 0 (0.0%) | 15 (100.0%) |
| Personal Care & Service | 0 (0.0%) | 37 (100.0%) |
| Total (Category) | 99 (33.8%) | 194 (66.2%) |
| Total (Overall) | 864 (52.1%) | 793 (47.9%) |
Sales and Office Occupations
The most common Sales and Office occupations in Lakeside Park are Sales & Related (391 | 23.6%), and Office & Administration (76 | 4.6%).
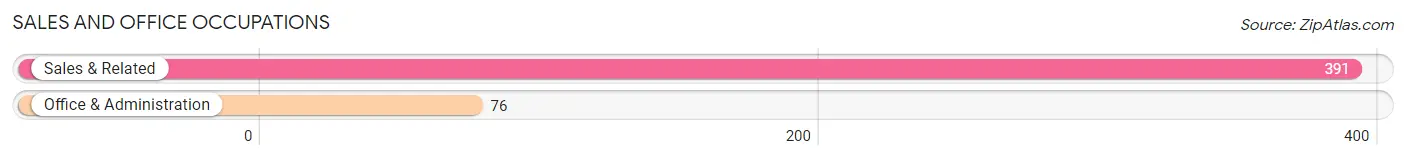
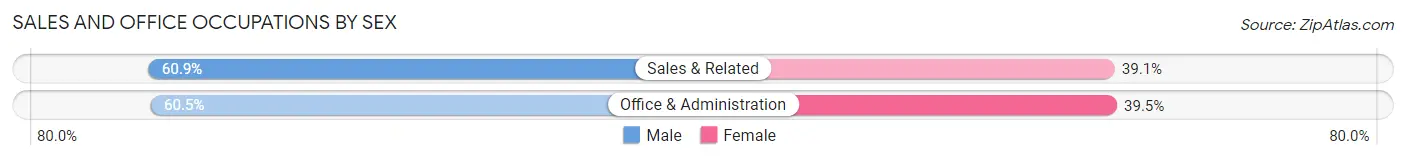
Sales and Office Occupations by Sex
| Occupation | Male | Female |
| Sales & Related | 238 (60.9%) | 153 (39.1%) |
| Office & Administration | 46 (60.5%) | 30 (39.5%) |
| Total (Category) | 284 (60.8%) | 183 (39.2%) |
| Total (Overall) | 864 (52.1%) | 793 (47.9%) |
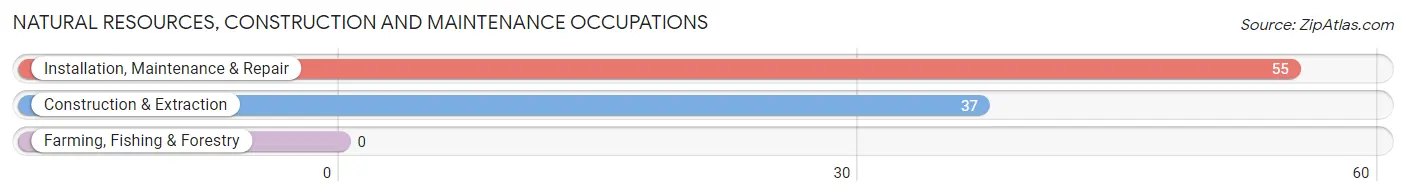
Natural Resources, Construction and Maintenance Occupations
The most common Natural Resources, Construction and Maintenance occupations in Lakeside Park are Installation, Maintenance & Repair (55 | 3.3%), and Construction & Extraction (37 | 2.2%).
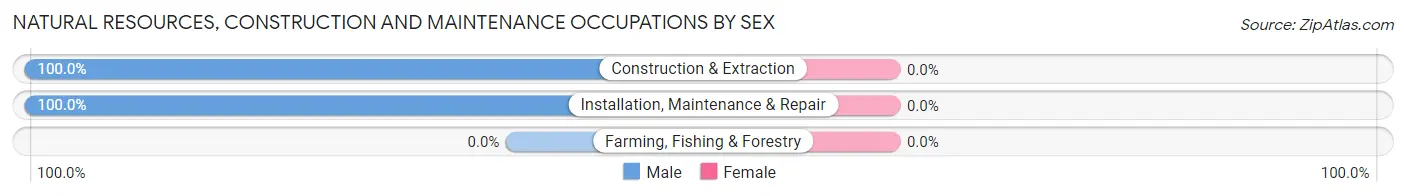
Natural Resources, Construction and Maintenance Occupations by Sex
| Occupation | Male | Female |
| Farming, Fishing & Forestry | 0 (0.0%) | 0 (0.0%) |
| Construction & Extraction | 37 (100.0%) | 0 (0.0%) |
| Installation, Maintenance & Repair | 55 (100.0%) | 0 (0.0%) |
| Total (Category) | 92 (100.0%) | 0 (0.0%) |
| Total (Overall) | 864 (52.1%) | 793 (47.9%) |
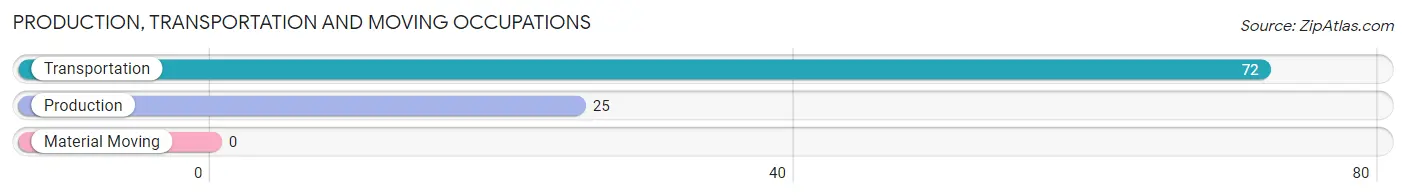
Production, Transportation and Moving Occupations
The most common Production, Transportation and Moving occupations in Lakeside Park are Transportation (72 | 4.3%), and Production (25 | 1.5%).
Production, Transportation and Moving Occupations by Sex
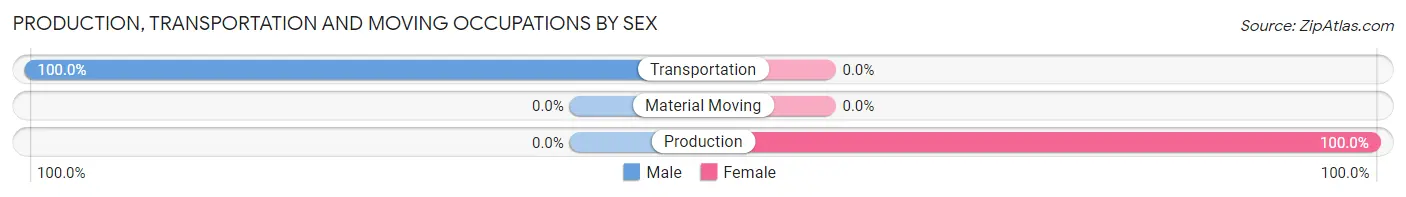
| Occupation | Male | Female |
| Production | 0 (0.0%) | 25 (100.0%) |
| Transportation | 72 (100.0%) | 0 (0.0%) |
| Material Moving | 0 (0.0%) | 0 (0.0%) |
| Total (Category) | 72 (74.2%) | 25 (25.8%) |
| Total (Overall) | 864 (52.1%) | 793 (47.9%) |
Employment Industries by Sex in Lakeside Park
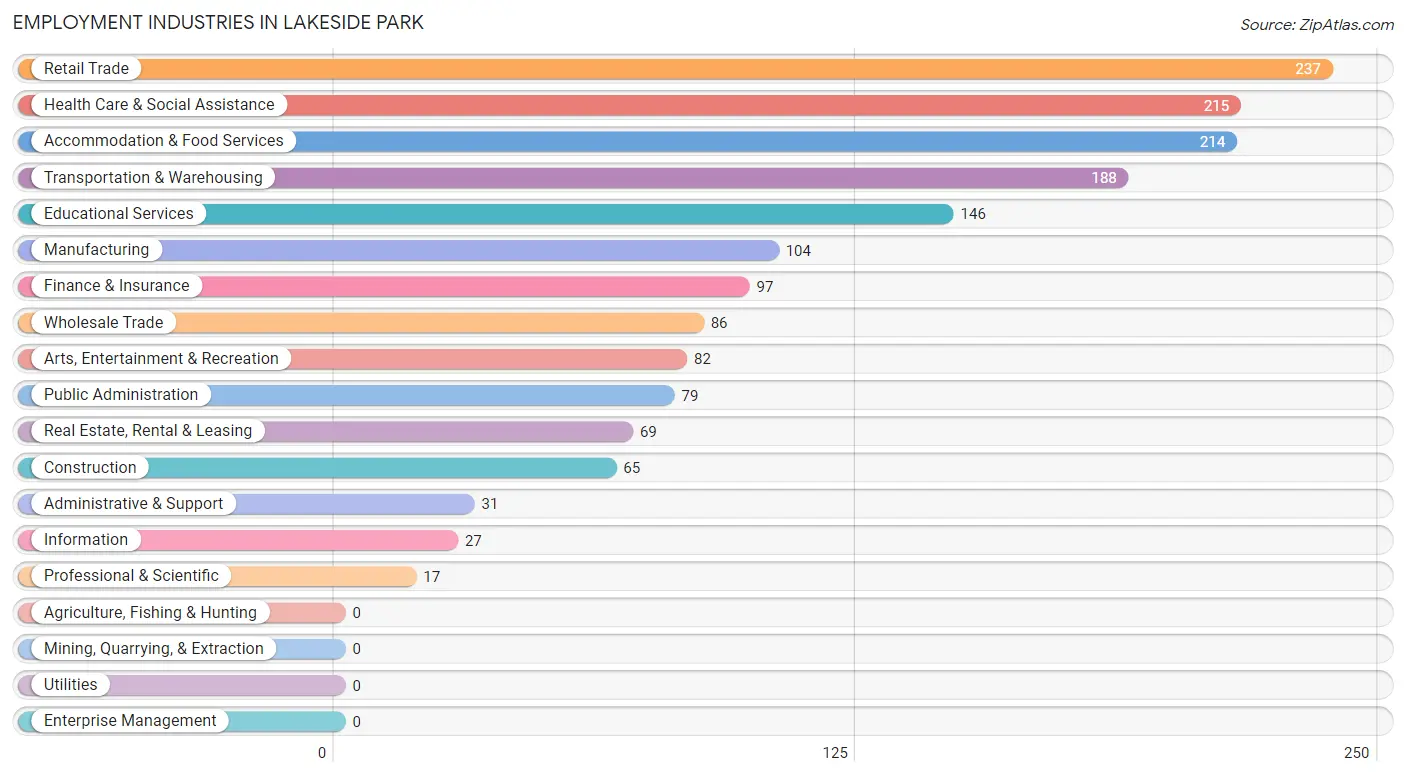
Employment Industries in Lakeside Park
The major employment industries in Lakeside Park include Retail Trade (237 | 14.3%), Health Care & Social Assistance (215 | 13.0%), Accommodation & Food Services (214 | 12.9%), Transportation & Warehousing (188 | 11.4%), and Educational Services (146 | 8.8%).
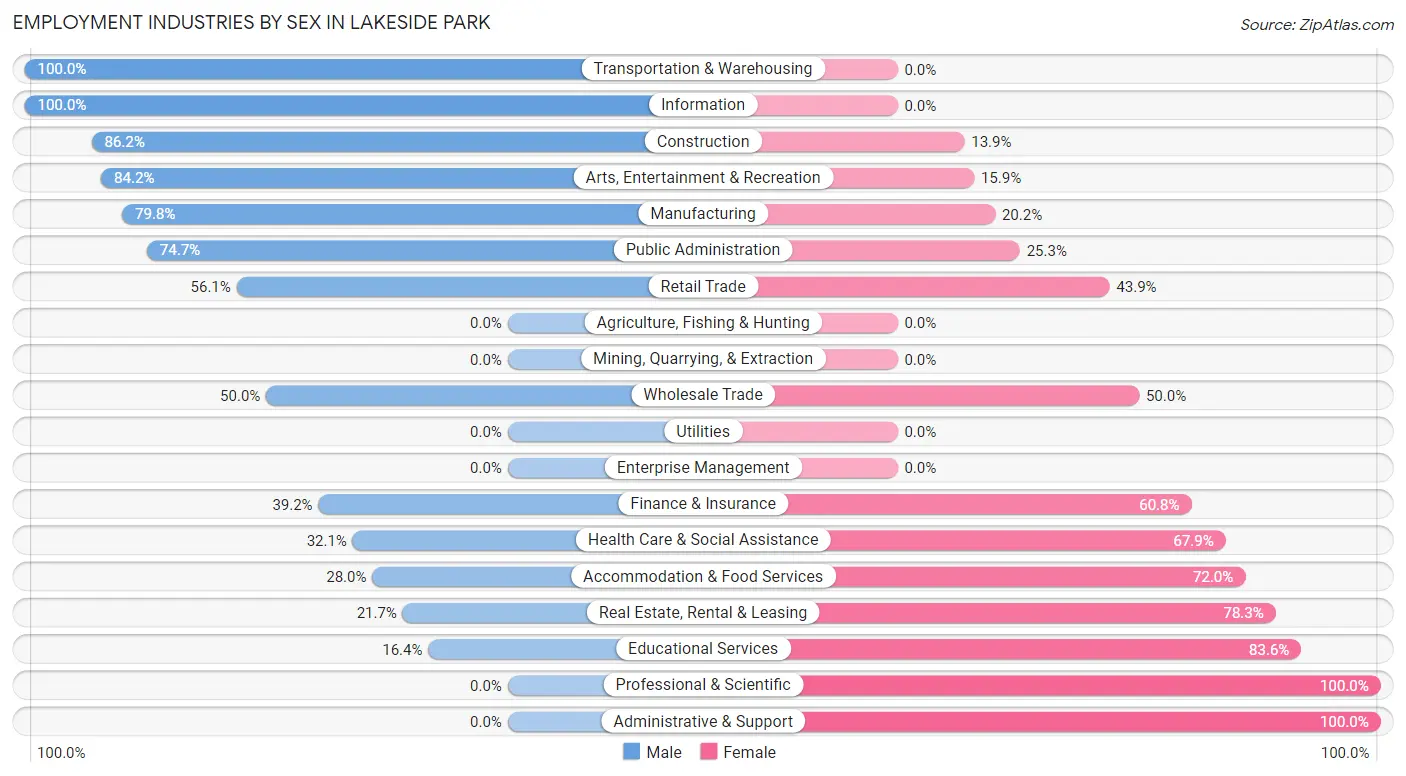
Employment Industries by Sex in Lakeside Park
The Lakeside Park industries that see more men than women are Transportation & Warehousing (100.0%), Information (100.0%), and Construction (86.2%), whereas the industries that tend to have a higher number of women are Professional & Scientific (100.0%), Administrative & Support (100.0%), and Educational Services (83.6%).
| Industry | Male | Female |
| Agriculture, Fishing & Hunting | 0 (0.0%) | 0 (0.0%) |
| Mining, Quarrying, & Extraction | 0 (0.0%) | 0 (0.0%) |
| Construction | 56 (86.2%) | 9 (13.9%) |
| Manufacturing | 83 (79.8%) | 21 (20.2%) |
| Wholesale Trade | 43 (50.0%) | 43 (50.0%) |
| Retail Trade | 133 (56.1%) | 104 (43.9%) |
| Transportation & Warehousing | 188 (100.0%) | 0 (0.0%) |
| Utilities | 0 (0.0%) | 0 (0.0%) |
| Information | 27 (100.0%) | 0 (0.0%) |
| Finance & Insurance | 38 (39.2%) | 59 (60.8%) |
| Real Estate, Rental & Leasing | 15 (21.7%) | 54 (78.3%) |
| Professional & Scientific | 0 (0.0%) | 17 (100.0%) |
| Enterprise Management | 0 (0.0%) | 0 (0.0%) |
| Administrative & Support | 0 (0.0%) | 31 (100.0%) |
| Educational Services | 24 (16.4%) | 122 (83.6%) |
| Health Care & Social Assistance | 69 (32.1%) | 146 (67.9%) |
| Arts, Entertainment & Recreation | 69 (84.2%) | 13 (15.9%) |
| Accommodation & Food Services | 60 (28.0%) | 154 (72.0%) |
| Public Administration | 59 (74.7%) | 20 (25.3%) |
| Total | 864 (52.1%) | 793 (47.9%) |
Education in Lakeside Park
School Enrollment in Lakeside Park
The most common levels of schooling among the 861 students in Lakeside Park are high school (281 | 32.6%), middle school (182 | 21.1%), and elementary school (134 | 15.6%).
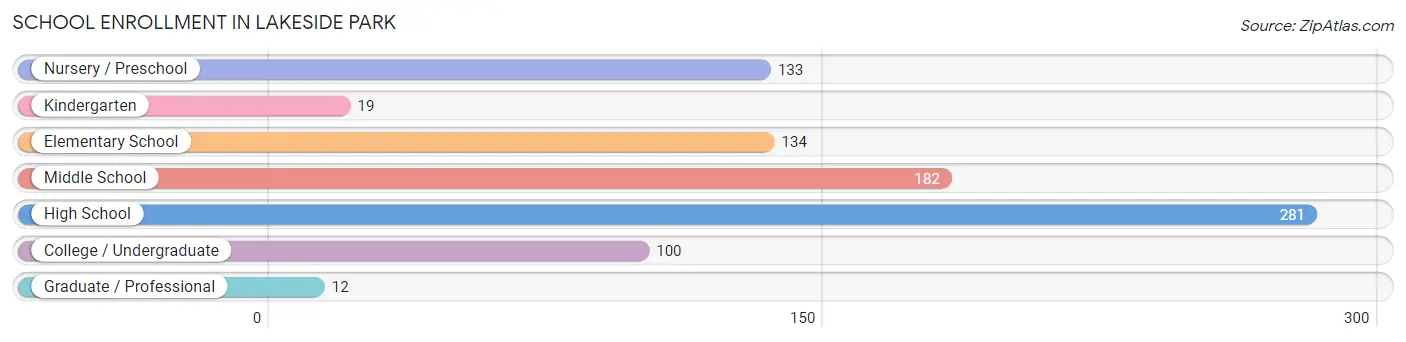
| School Level | # Students | % Students |
| Nursery / Preschool | 133 | 15.4% |
| Kindergarten | 19 | 2.2% |
| Elementary School | 134 | 15.6% |
| Middle School | 182 | 21.1% |
| High School | 281 | 32.6% |
| College / Undergraduate | 100 | 11.6% |
| Graduate / Professional | 12 | 1.4% |
| Total | 861 | 100.0% |
School Enrollment by Age by Funding Source in Lakeside Park
Out of a total of 861 students who are enrolled in schools in Lakeside Park, 643 (74.7%) attend a private institution, while the remaining 218 (25.3%) are enrolled in public schools. The age group of 3 to 4 year olds has the highest likelihood of being enrolled in private schools, with 21 (100.0% in the age bracket) enrolled. Conversely, the age group of 20 to 24 year olds has the lowest likelihood of being enrolled in a private school, with 83 (83.0% in the age bracket) attending a public institution.
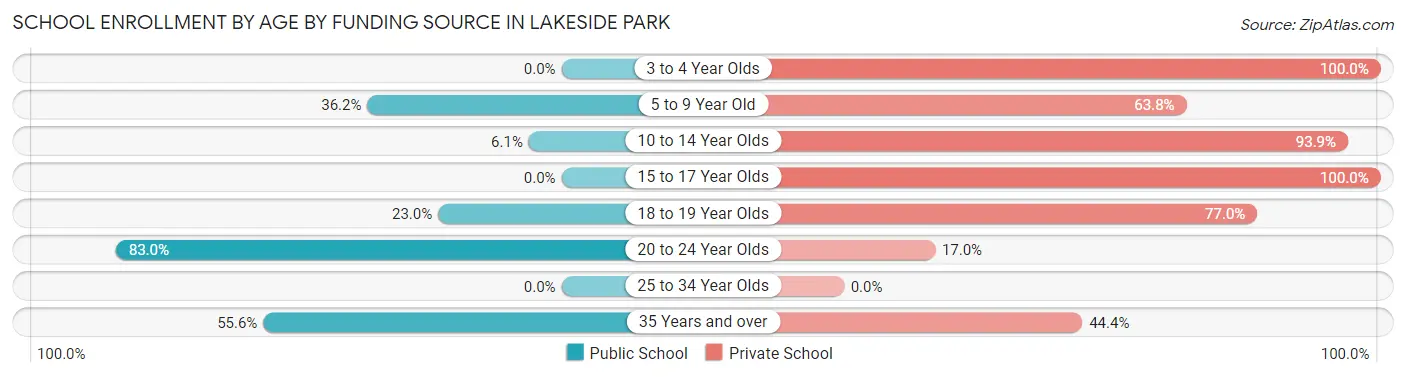
| Age Bracket | Public School | Private School |
| 3 to 4 Year Olds | 0 (0.0%) | 21 (100.0%) |
| 5 to 9 Year Old | 85 (36.2%) | 150 (63.8%) |
| 10 to 14 Year Olds | 15 (6.1%) | 231 (93.9%) |
| 15 to 17 Year Olds | 0 (0.0%) | 145 (100.0%) |
| 18 to 19 Year Olds | 20 (23.0%) | 67 (77.0%) |
| 20 to 24 Year Olds | 83 (83.0%) | 17 (17.0%) |
| 25 to 34 Year Olds | 0 (0.0%) | 0 (0.0%) |
| 35 Years and over | 15 (55.6%) | 12 (44.4%) |
| Total | 218 (25.3%) | 643 (74.7%) |
Educational Attainment by Field of Study in Lakeside Park
Social sciences (225 | 20.9%), education (206 | 19.1%), business (145 | 13.5%), liberal arts & history (85 | 7.9%), and arts & humanities (82 | 7.6%) are the most common fields of study among 1,076 individuals in Lakeside Park who have obtained a bachelor's degree or higher.
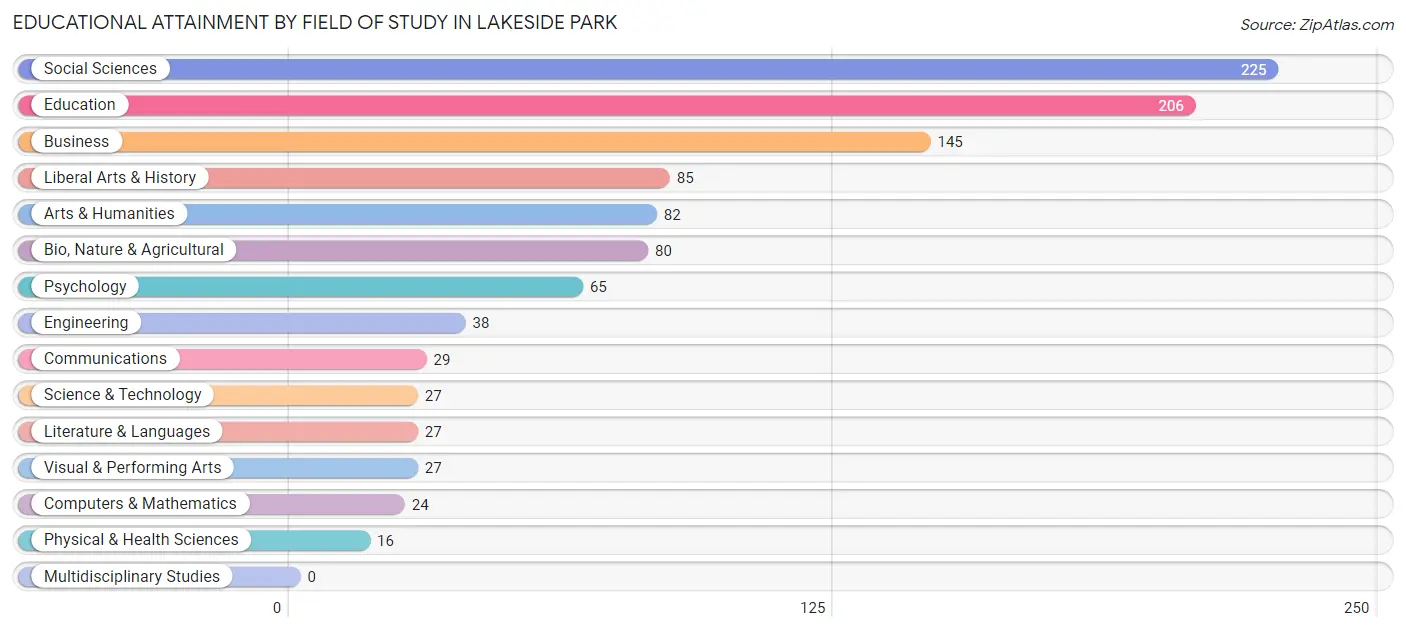
| Field of Study | # Graduates | % Graduates |
| Computers & Mathematics | 24 | 2.2% |
| Bio, Nature & Agricultural | 80 | 7.4% |
| Physical & Health Sciences | 16 | 1.5% |
| Psychology | 65 | 6.0% |
| Social Sciences | 225 | 20.9% |
| Engineering | 38 | 3.5% |
| Multidisciplinary Studies | 0 | 0.0% |
| Science & Technology | 27 | 2.5% |
| Business | 145 | 13.5% |
| Education | 206 | 19.1% |
| Literature & Languages | 27 | 2.5% |
| Liberal Arts & History | 85 | 7.9% |
| Visual & Performing Arts | 27 | 2.5% |
| Communications | 29 | 2.7% |
| Arts & Humanities | 82 | 7.6% |
| Total | 1,076 | 100.0% |
Transportation & Commute in Lakeside Park
Vehicle Availability by Sex in Lakeside Park
The most prevalent vehicle ownership categories in Lakeside Park are males with 2 vehicles (409, accounting for 49.5%) and females with 2 vehicles (341, making up 51.6%).
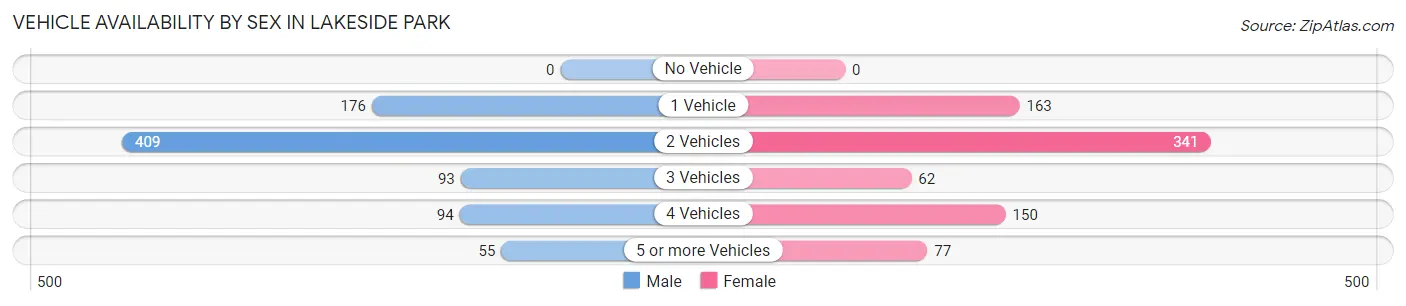
| Vehicles Available | Male | Female |
| No Vehicle | 0 (0.0%) | 0 (0.0%) |
| 1 Vehicle | 176 (21.3%) | 163 (20.5%) |
| 2 Vehicles | 409 (49.5%) | 341 (43.0%) |
| 3 Vehicles | 93 (11.3%) | 62 (7.8%) |
| 4 Vehicles | 94 (11.4%) | 150 (18.9%) |
| 5 or more Vehicles | 55 (6.7%) | 77 (9.7%) |
| Total | 827 (100.0%) | 793 (100.0%) |
Commute Time in Lakeside Park
The most frequently occuring commute durations in Lakeside Park are 15 to 19 minutes (484 commuters, 31.3%), 10 to 14 minutes (297 commuters, 19.2%), and 20 to 24 minutes (201 commuters, 13.0%).
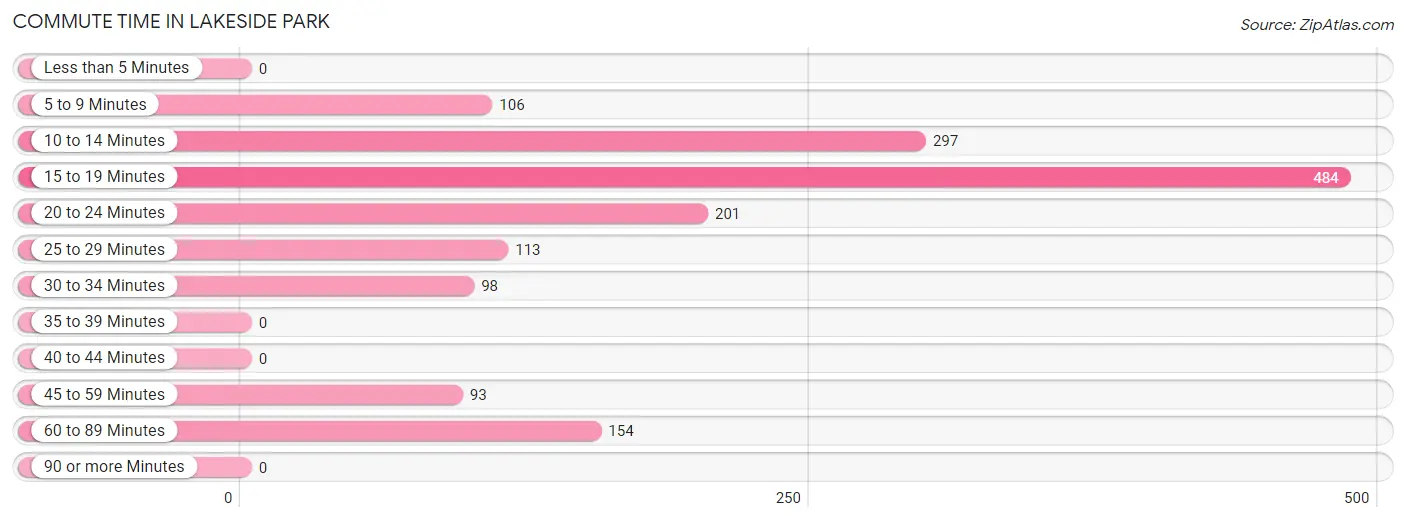
| Commute Time | # Commuters | % Commuters |
| Less than 5 Minutes | 0 | 0.0% |
| 5 to 9 Minutes | 106 | 6.9% |
| 10 to 14 Minutes | 297 | 19.2% |
| 15 to 19 Minutes | 484 | 31.3% |
| 20 to 24 Minutes | 201 | 13.0% |
| 25 to 29 Minutes | 113 | 7.3% |
| 30 to 34 Minutes | 98 | 6.3% |
| 35 to 39 Minutes | 0 | 0.0% |
| 40 to 44 Minutes | 0 | 0.0% |
| 45 to 59 Minutes | 93 | 6.0% |
| 60 to 89 Minutes | 154 | 10.0% |
| 90 or more Minutes | 0 | 0.0% |
Commute Time by Sex in Lakeside Park
The most common commute times in Lakeside Park are 15 to 19 minutes (289 commuters, 36.5%) for males and 10 to 14 minutes (218 commuters, 28.9%) for females.
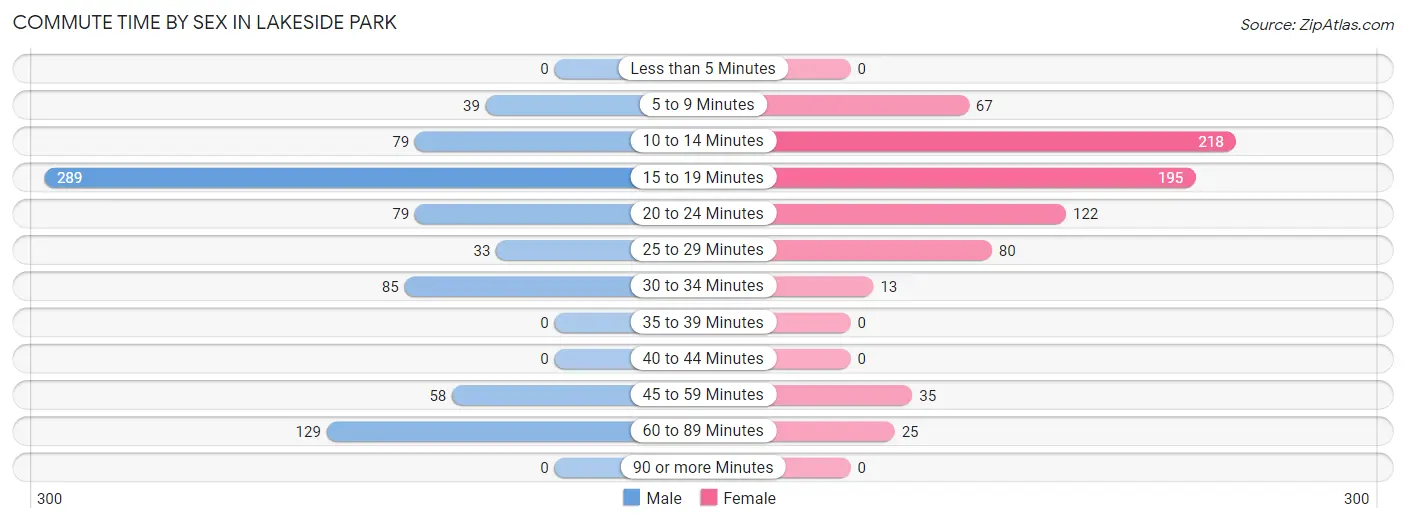
| Commute Time | Male | Female |
| Less than 5 Minutes | 0 (0.0%) | 0 (0.0%) |
| 5 to 9 Minutes | 39 (4.9%) | 67 (8.9%) |
| 10 to 14 Minutes | 79 (10.0%) | 218 (28.9%) |
| 15 to 19 Minutes | 289 (36.5%) | 195 (25.8%) |
| 20 to 24 Minutes | 79 (10.0%) | 122 (16.2%) |
| 25 to 29 Minutes | 33 (4.2%) | 80 (10.6%) |
| 30 to 34 Minutes | 85 (10.7%) | 13 (1.7%) |
| 35 to 39 Minutes | 0 (0.0%) | 0 (0.0%) |
| 40 to 44 Minutes | 0 (0.0%) | 0 (0.0%) |
| 45 to 59 Minutes | 58 (7.3%) | 35 (4.6%) |
| 60 to 89 Minutes | 129 (16.3%) | 25 (3.3%) |
| 90 or more Minutes | 0 (0.0%) | 0 (0.0%) |
Time of Departure to Work by Sex in Lakeside Park
The most frequent times of departure to work in Lakeside Park are 8:00 AM to 8:29 AM (174, 22.0%) for males and 4:00 PM to 11:59 PM (129, 17.1%) for females.
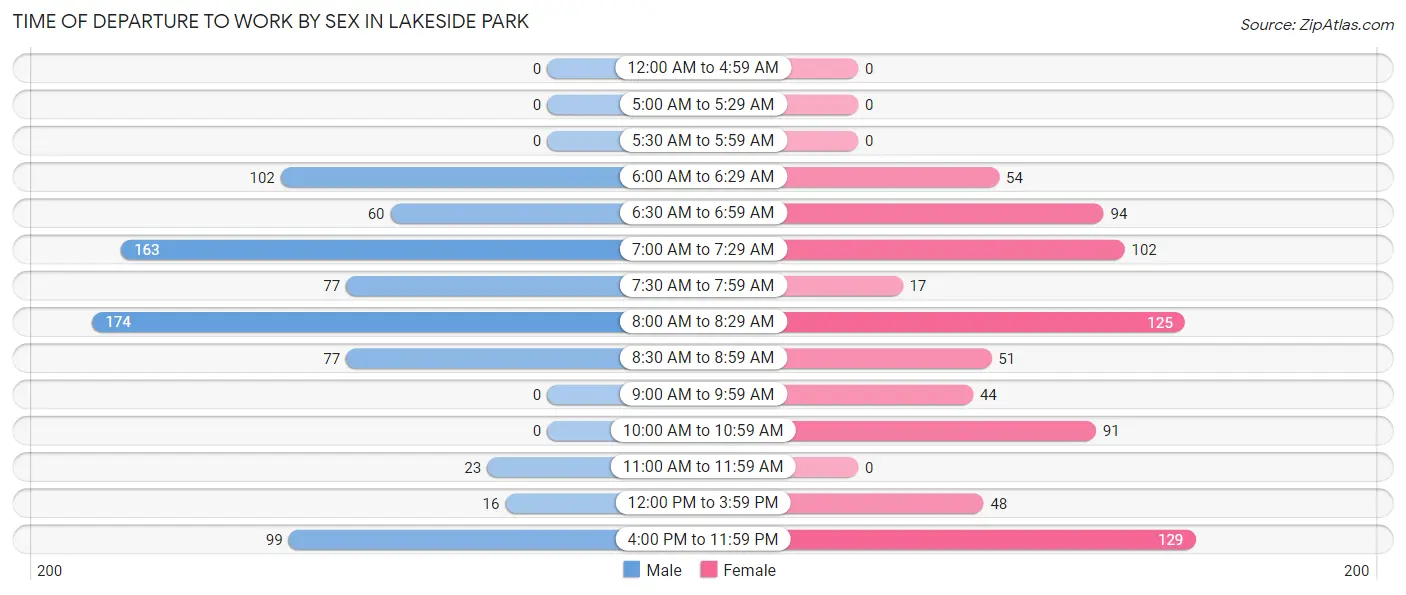
| Time of Departure | Male | Female |
| 12:00 AM to 4:59 AM | 0 (0.0%) | 0 (0.0%) |
| 5:00 AM to 5:29 AM | 0 (0.0%) | 0 (0.0%) |
| 5:30 AM to 5:59 AM | 0 (0.0%) | 0 (0.0%) |
| 6:00 AM to 6:29 AM | 102 (12.9%) | 54 (7.1%) |
| 6:30 AM to 6:59 AM | 60 (7.6%) | 94 (12.4%) |
| 7:00 AM to 7:29 AM | 163 (20.6%) | 102 (13.5%) |
| 7:30 AM to 7:59 AM | 77 (9.7%) | 17 (2.2%) |
| 8:00 AM to 8:29 AM | 174 (22.0%) | 125 (16.6%) |
| 8:30 AM to 8:59 AM | 77 (9.7%) | 51 (6.8%) |
| 9:00 AM to 9:59 AM | 0 (0.0%) | 44 (5.8%) |
| 10:00 AM to 10:59 AM | 0 (0.0%) | 91 (12.0%) |
| 11:00 AM to 11:59 AM | 23 (2.9%) | 0 (0.0%) |
| 12:00 PM to 3:59 PM | 16 (2.0%) | 48 (6.4%) |
| 4:00 PM to 11:59 PM | 99 (12.5%) | 129 (17.1%) |
| Total | 791 (100.0%) | 755 (100.0%) |
Housing Occupancy in Lakeside Park
Occupancy by Ownership in Lakeside Park
Of the total 1,153 dwellings in Lakeside Park, owner-occupied units account for 947 (82.1%), while renter-occupied units make up 206 (17.9%).
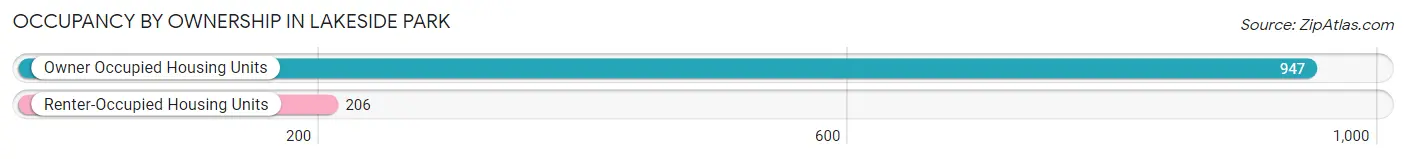
| Occupancy | # Housing Units | % Housing Units |
| Owner Occupied Housing Units | 947 | 82.1% |
| Renter-Occupied Housing Units | 206 | 17.9% |
| Total Occupied Housing Units | 1,153 | 100.0% |
Occupancy by Household Size in Lakeside Park
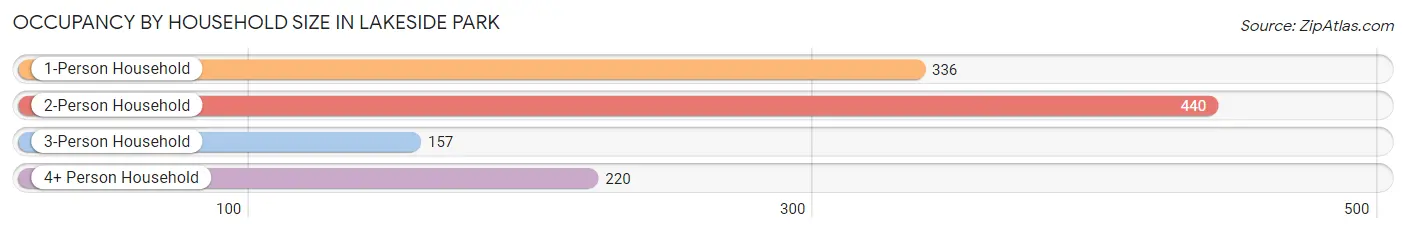
| Household Size | # Housing Units | % Housing Units |
| 1-Person Household | 336 | 29.1% |
| 2-Person Household | 440 | 38.2% |
| 3-Person Household | 157 | 13.6% |
| 4+ Person Household | 220 | 19.1% |
| Total Housing Units | 1,153 | 100.0% |
Occupancy by Ownership by Household Size in Lakeside Park
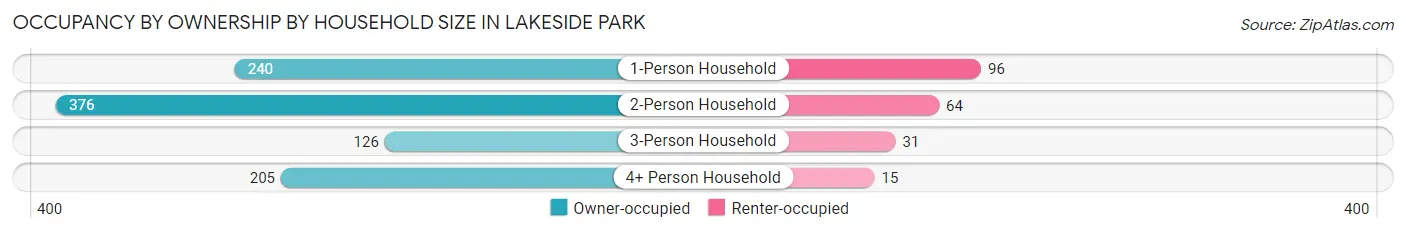
| Household Size | Owner-occupied | Renter-occupied |
| 1-Person Household | 240 (71.4%) | 96 (28.6%) |
| 2-Person Household | 376 (85.5%) | 64 (14.5%) |
| 3-Person Household | 126 (80.2%) | 31 (19.8%) |
| 4+ Person Household | 205 (93.2%) | 15 (6.8%) |
| Total Housing Units | 947 (82.1%) | 206 (17.9%) |
Occupancy by Educational Attainment in Lakeside Park
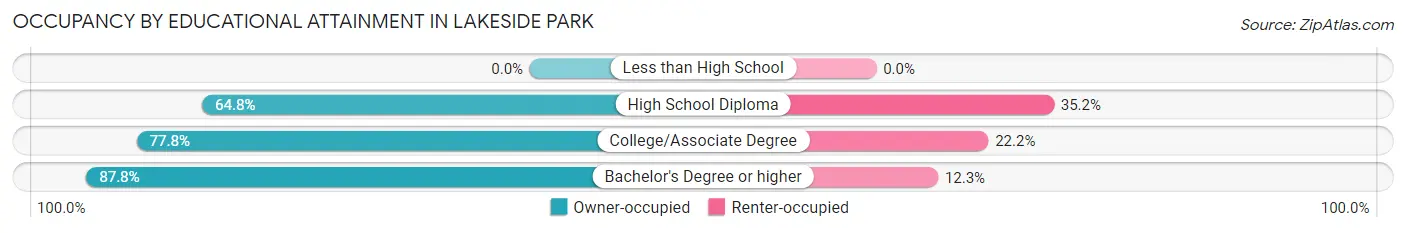
| Household Size | Owner-occupied | Renter-occupied |
| Less than High School | 0 (0.0%) | 0 (0.0%) |
| High School Diploma | 46 (64.8%) | 25 (35.2%) |
| College/Associate Degree | 378 (77.8%) | 108 (22.2%) |
| Bachelor's Degree or higher | 523 (87.7%) | 73 (12.2%) |
Occupancy by Age of Householder in Lakeside Park
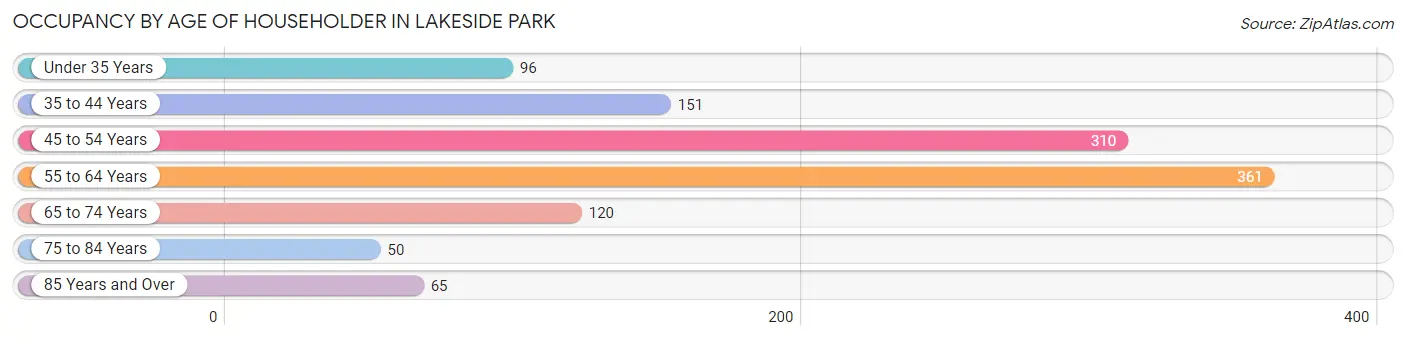
| Age Bracket | # Households | % Households |
| Under 35 Years | 96 | 8.3% |
| 35 to 44 Years | 151 | 13.1% |
| 45 to 54 Years | 310 | 26.9% |
| 55 to 64 Years | 361 | 31.3% |
| 65 to 74 Years | 120 | 10.4% |
| 75 to 84 Years | 50 | 4.3% |
| 85 Years and Over | 65 | 5.6% |
| Total | 1,153 | 100.0% |
Housing Finances in Lakeside Park
Median Income by Occupancy in Lakeside Park
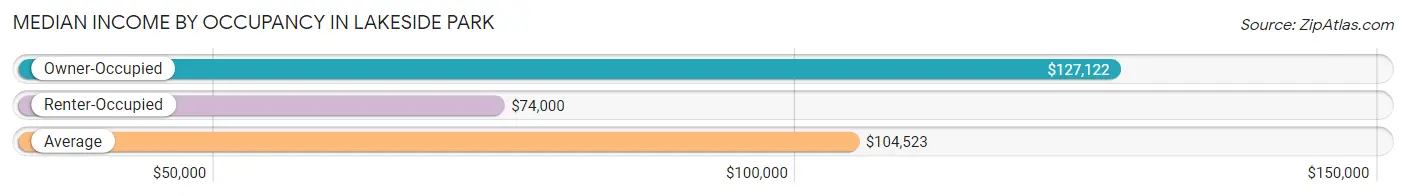
| Occupancy Type | # Households | Median Income |
| Owner-Occupied | 947 (82.1%) | $127,122 |
| Renter-Occupied | 206 (17.9%) | $74,000 |
| Average | 1,153 (100.0%) | $104,523 |
Occupancy by Householder Income Bracket in Lakeside Park
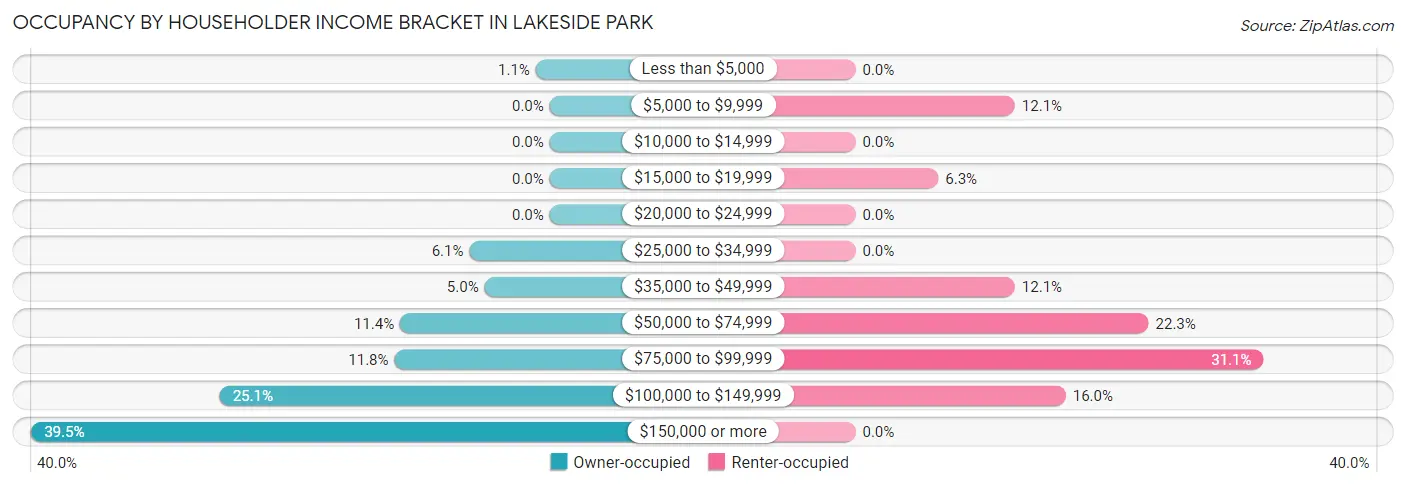
| Income Bracket | Owner-occupied | Renter-occupied |
| Less than $5,000 | 10 (1.1%) | 0 (0.0%) |
| $5,000 to $9,999 | 0 (0.0%) | 25 (12.1%) |
| $10,000 to $14,999 | 0 (0.0%) | 0 (0.0%) |
| $15,000 to $19,999 | 0 (0.0%) | 13 (6.3%) |
| $20,000 to $24,999 | 0 (0.0%) | 0 (0.0%) |
| $25,000 to $34,999 | 58 (6.1%) | 0 (0.0%) |
| $35,000 to $49,999 | 47 (5.0%) | 25 (12.1%) |
| $50,000 to $74,999 | 108 (11.4%) | 46 (22.3%) |
| $75,000 to $99,999 | 112 (11.8%) | 64 (31.1%) |
| $100,000 to $149,999 | 238 (25.1%) | 33 (16.0%) |
| $150,000 or more | 374 (39.5%) | 0 (0.0%) |
| Total | 947 (100.0%) | 206 (100.0%) |
Monthly Housing Cost Tiers in Lakeside Park
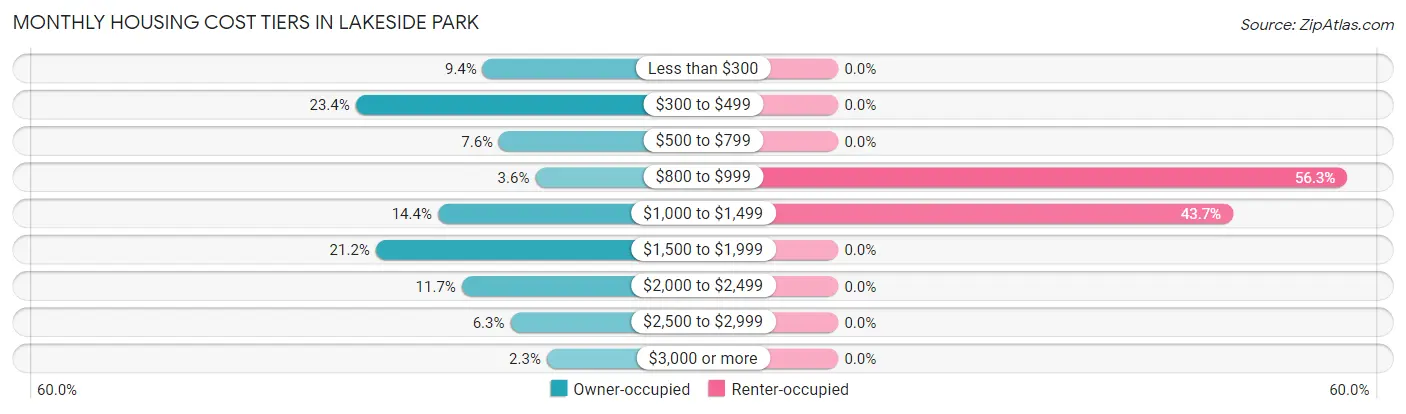
| Monthly Cost | Owner-occupied | Renter-occupied |
| Less than $300 | 89 (9.4%) | 0 (0.0%) |
| $300 to $499 | 222 (23.4%) | 0 (0.0%) |
| $500 to $799 | 72 (7.6%) | 0 (0.0%) |
| $800 to $999 | 34 (3.6%) | 116 (56.3%) |
| $1,000 to $1,499 | 136 (14.4%) | 90 (43.7%) |
| $1,500 to $1,999 | 201 (21.2%) | 0 (0.0%) |
| $2,000 to $2,499 | 111 (11.7%) | 0 (0.0%) |
| $2,500 to $2,999 | 60 (6.3%) | 0 (0.0%) |
| $3,000 or more | 22 (2.3%) | 0 (0.0%) |
| Total | 947 (100.0%) | 206 (100.0%) |
Physical Housing Characteristics in Lakeside Park
Housing Structures in Lakeside Park
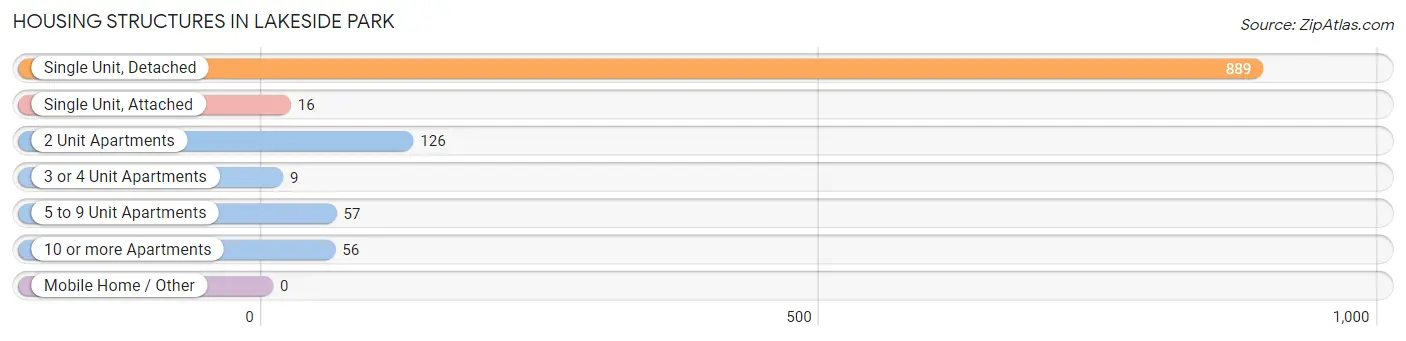
| Structure Type | # Housing Units | % Housing Units |
| Single Unit, Detached | 889 | 77.1% |
| Single Unit, Attached | 16 | 1.4% |
| 2 Unit Apartments | 126 | 10.9% |
| 3 or 4 Unit Apartments | 9 | 0.8% |
| 5 to 9 Unit Apartments | 57 | 4.9% |
| 10 or more Apartments | 56 | 4.9% |
| Mobile Home / Other | 0 | 0.0% |
| Total | 1,153 | 100.0% |
Housing Structures by Occupancy in Lakeside Park
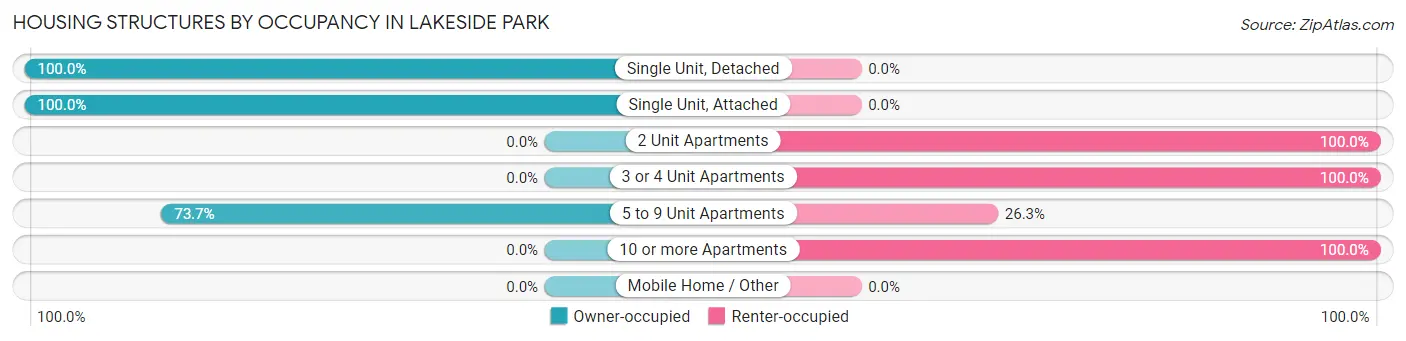
| Structure Type | Owner-occupied | Renter-occupied |
| Single Unit, Detached | 889 (100.0%) | 0 (0.0%) |
| Single Unit, Attached | 16 (100.0%) | 0 (0.0%) |
| 2 Unit Apartments | 0 (0.0%) | 126 (100.0%) |
| 3 or 4 Unit Apartments | 0 (0.0%) | 9 (100.0%) |
| 5 to 9 Unit Apartments | 42 (73.7%) | 15 (26.3%) |
| 10 or more Apartments | 0 (0.0%) | 56 (100.0%) |
| Mobile Home / Other | 0 (0.0%) | 0 (0.0%) |
| Total | 947 (82.1%) | 206 (17.9%) |
Housing Structures by Number of Rooms in Lakeside Park
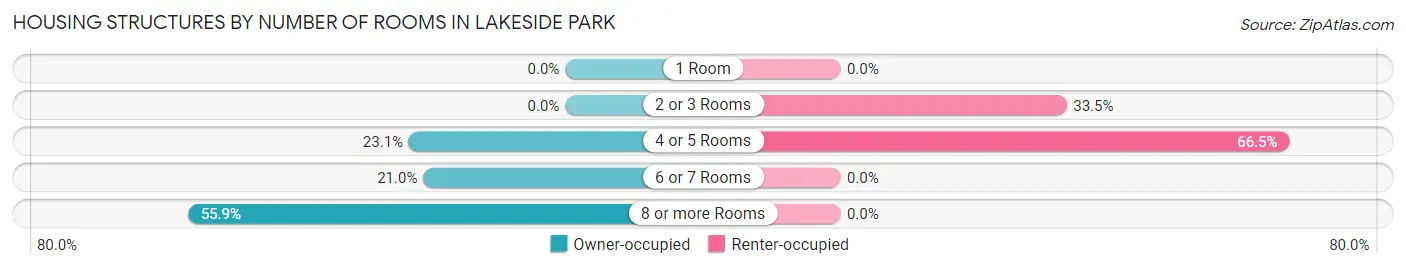
| Number of Rooms | Owner-occupied | Renter-occupied |
| 1 Room | 0 (0.0%) | 0 (0.0%) |
| 2 or 3 Rooms | 0 (0.0%) | 69 (33.5%) |
| 4 or 5 Rooms | 219 (23.1%) | 137 (66.5%) |
| 6 or 7 Rooms | 199 (21.0%) | 0 (0.0%) |
| 8 or more Rooms | 529 (55.9%) | 0 (0.0%) |
| Total | 947 (100.0%) | 206 (100.0%) |
Housing Structure by Heating Type in Lakeside Park
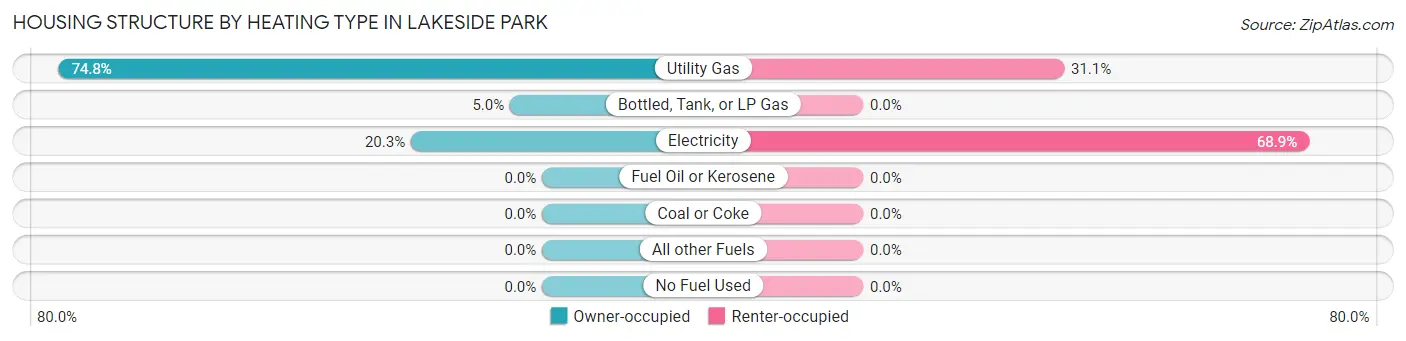
| Heating Type | Owner-occupied | Renter-occupied |
| Utility Gas | 708 (74.8%) | 64 (31.1%) |
| Bottled, Tank, or LP Gas | 47 (5.0%) | 0 (0.0%) |
| Electricity | 192 (20.3%) | 142 (68.9%) |
| Fuel Oil or Kerosene | 0 (0.0%) | 0 (0.0%) |
| Coal or Coke | 0 (0.0%) | 0 (0.0%) |
| All other Fuels | 0 (0.0%) | 0 (0.0%) |
| No Fuel Used | 0 (0.0%) | 0 (0.0%) |
| Total | 947 (100.0%) | 206 (100.0%) |
Household Vehicle Usage in Lakeside Park
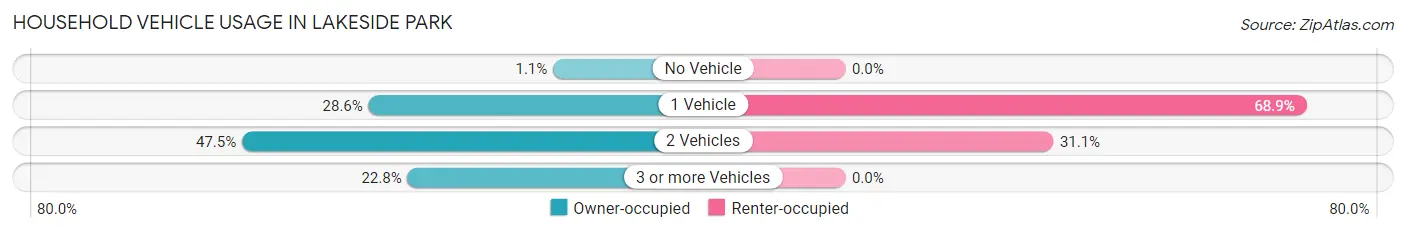
| Vehicles per Household | Owner-occupied | Renter-occupied |
| No Vehicle | 10 (1.1%) | 0 (0.0%) |
| 1 Vehicle | 271 (28.6%) | 142 (68.9%) |
| 2 Vehicles | 450 (47.5%) | 64 (31.1%) |
| 3 or more Vehicles | 216 (22.8%) | 0 (0.0%) |
| Total | 947 (100.0%) | 206 (100.0%) |
Real Estate & Mortgages in Lakeside Park
Real Estate and Mortgage Overview in Lakeside Park
| Characteristic | Without Mortgage | With Mortgage |
| Housing Units | 394 | 553 |
| Median Property Value | $150,600 | $384,000 |
| Median Household Income | - | - |
| Monthly Housing Costs | $438 | $22 |
| Real Estate Taxes | $2,352 | $0 |
Property Value by Mortgage Status in Lakeside Park
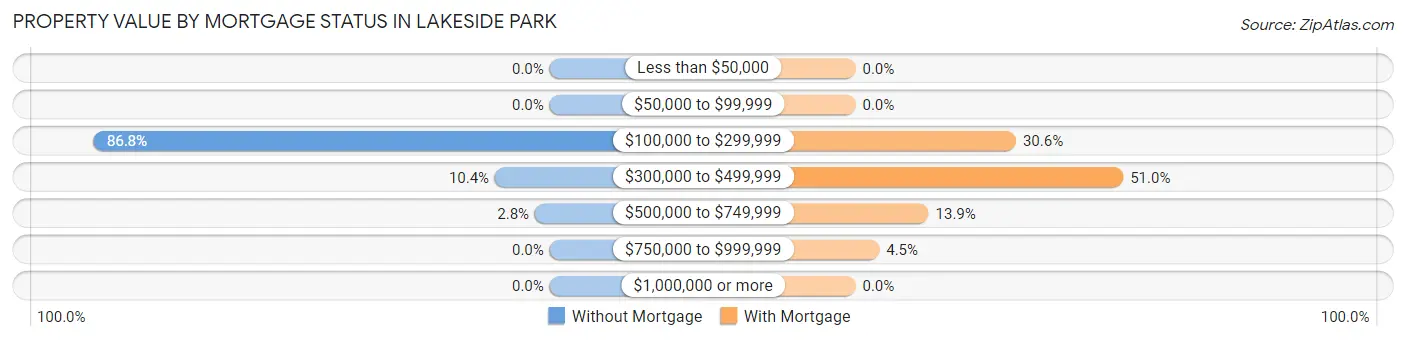
| Property Value | Without Mortgage | With Mortgage |
| Less than $50,000 | 0 (0.0%) | 0 (0.0%) |
| $50,000 to $99,999 | 0 (0.0%) | 0 (0.0%) |
| $100,000 to $299,999 | 342 (86.8%) | 169 (30.6%) |
| $300,000 to $499,999 | 41 (10.4%) | 282 (51.0%) |
| $500,000 to $749,999 | 11 (2.8%) | 77 (13.9%) |
| $750,000 to $999,999 | 0 (0.0%) | 25 (4.5%) |
| $1,000,000 or more | 0 (0.0%) | 0 (0.0%) |
| Total | 394 (100.0%) | 553 (100.0%) |
Household Income by Mortgage Status in Lakeside Park
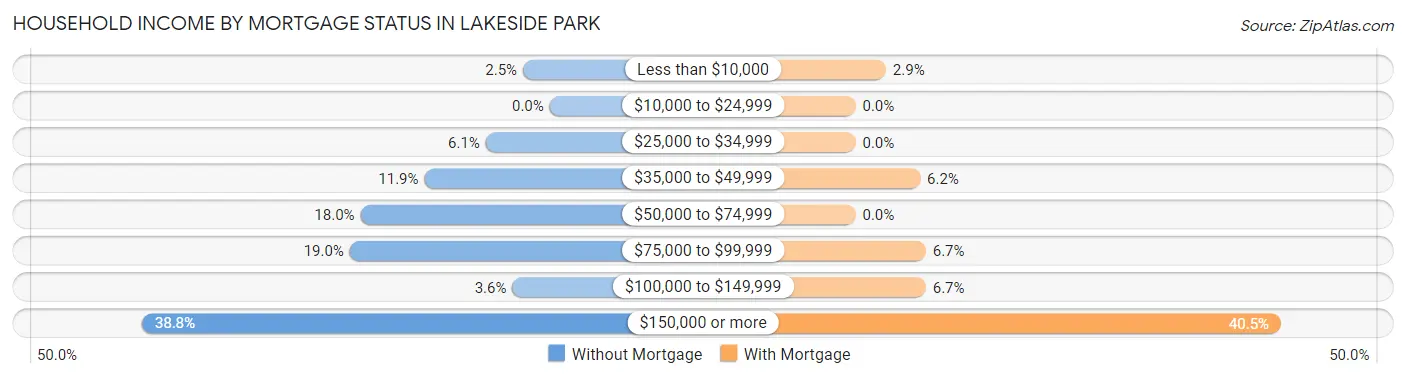
| Household Income | Without Mortgage | With Mortgage |
| Less than $10,000 | 10 (2.5%) | 16 (2.9%) |
| $10,000 to $24,999 | 0 (0.0%) | 0 (0.0%) |
| $25,000 to $34,999 | 24 (6.1%) | 0 (0.0%) |
| $35,000 to $49,999 | 47 (11.9%) | 34 (6.1%) |
| $50,000 to $74,999 | 71 (18.0%) | 0 (0.0%) |
| $75,000 to $99,999 | 75 (19.0%) | 37 (6.7%) |
| $100,000 to $149,999 | 14 (3.5%) | 37 (6.7%) |
| $150,000 or more | 153 (38.8%) | 224 (40.5%) |
| Total | 394 (100.0%) | 553 (100.0%) |
Property Value to Household Income Ratio in Lakeside Park
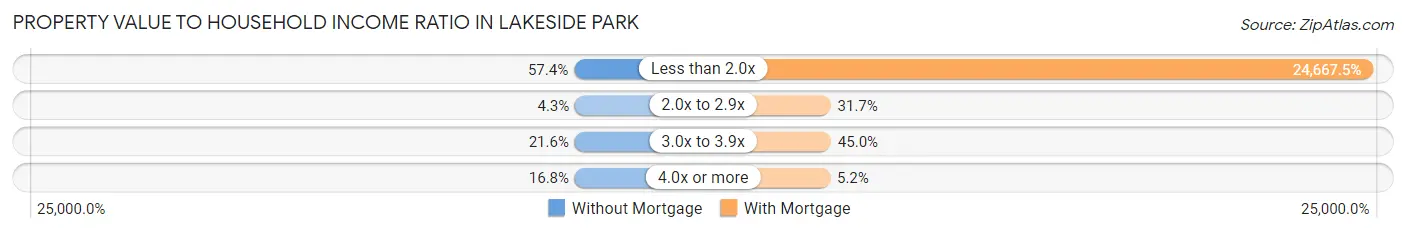
| Value-to-Income Ratio | Without Mortgage | With Mortgage |
| Less than 2.0x | 226 (57.4%) | 136,411 (24,667.4%) |
| 2.0x to 2.9x | 17 (4.3%) | 175 (31.7%) |
| 3.0x to 3.9x | 85 (21.6%) | 249 (45.0%) |
| 4.0x or more | 66 (16.8%) | 29 (5.2%) |
| Total | 394 (100.0%) | 553 (100.0%) |
Real Estate Taxes by Mortgage Status in Lakeside Park
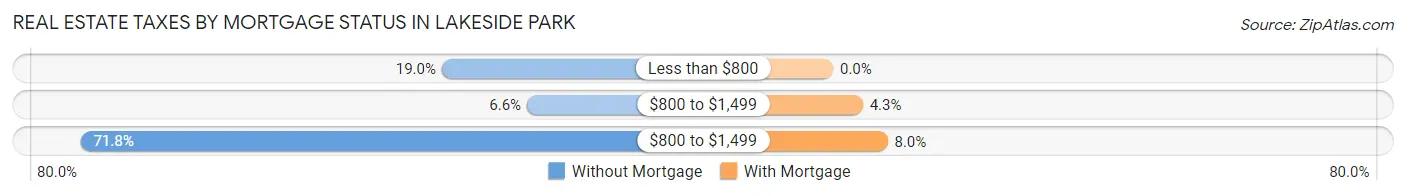
| Property Taxes | Without Mortgage | With Mortgage |
| Less than $800 | 75 (19.0%) | 0 (0.0%) |
| $800 to $1,499 | 26 (6.6%) | 24 (4.3%) |
| $800 to $1,499 | 283 (71.8%) | 44 (8.0%) |
| Total | 394 (100.0%) | 553 (100.0%) |
Health & Disability in Lakeside Park
Health Insurance Coverage by Age in Lakeside Park
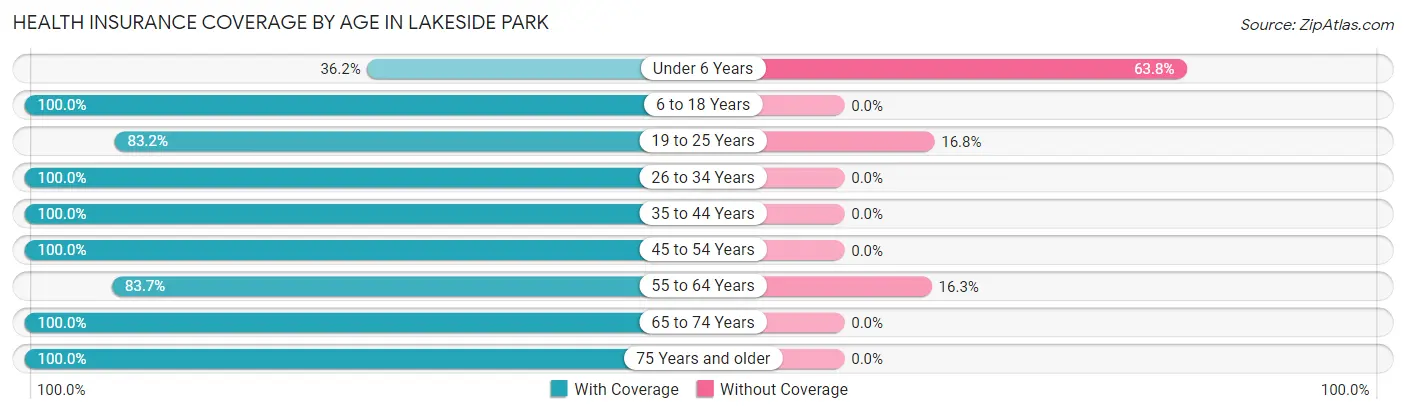
| Age Bracket | With Coverage | Without Coverage |
| Under 6 Years | 54 (36.2%) | 95 (63.8%) |
| 6 to 18 Years | 614 (100.0%) | 0 (0.0%) |
| 19 to 25 Years | 119 (83.2%) | 24 (16.8%) |
| 26 to 34 Years | 168 (100.0%) | 0 (0.0%) |
| 35 to 44 Years | 231 (100.0%) | 0 (0.0%) |
| 45 to 54 Years | 547 (100.0%) | 0 (0.0%) |
| 55 to 64 Years | 483 (83.7%) | 94 (16.3%) |
| 65 to 74 Years | 208 (100.0%) | 0 (0.0%) |
| 75 Years and older | 193 (100.0%) | 0 (0.0%) |
| Total | 2,617 (92.5%) | 213 (7.5%) |
Health Insurance Coverage by Citizenship Status in Lakeside Park
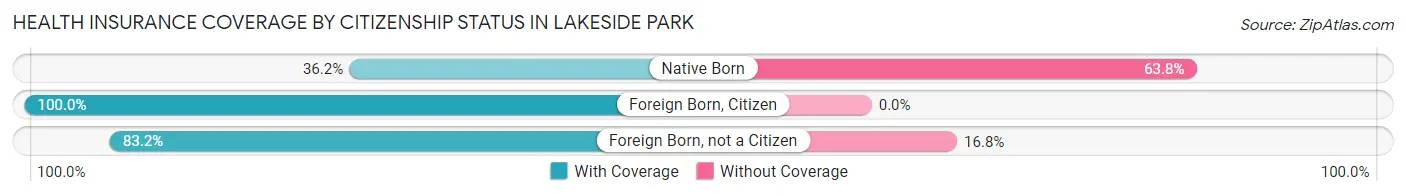
| Citizenship Status | With Coverage | Without Coverage |
| Native Born | 54 (36.2%) | 95 (63.8%) |
| Foreign Born, Citizen | 614 (100.0%) | 0 (0.0%) |
| Foreign Born, not a Citizen | 119 (83.2%) | 24 (16.8%) |
Health Insurance Coverage by Household Income in Lakeside Park
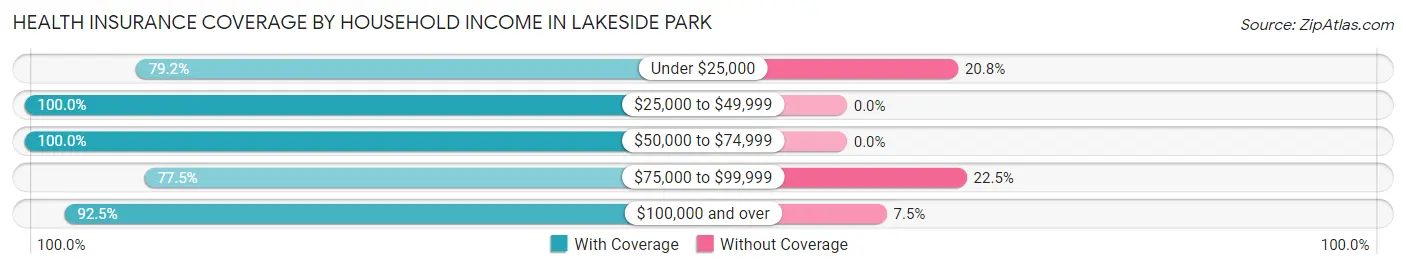
| Household Income | With Coverage | Without Coverage |
| Under $25,000 | 38 (79.2%) | 10 (20.8%) |
| $25,000 to $49,999 | 157 (100.0%) | 0 (0.0%) |
| $50,000 to $74,999 | 462 (100.0%) | 0 (0.0%) |
| $75,000 to $99,999 | 221 (77.5%) | 64 (22.5%) |
| $100,000 and over | 1,724 (92.5%) | 139 (7.5%) |
Public vs Private Health Insurance Coverage by Age in Lakeside Park
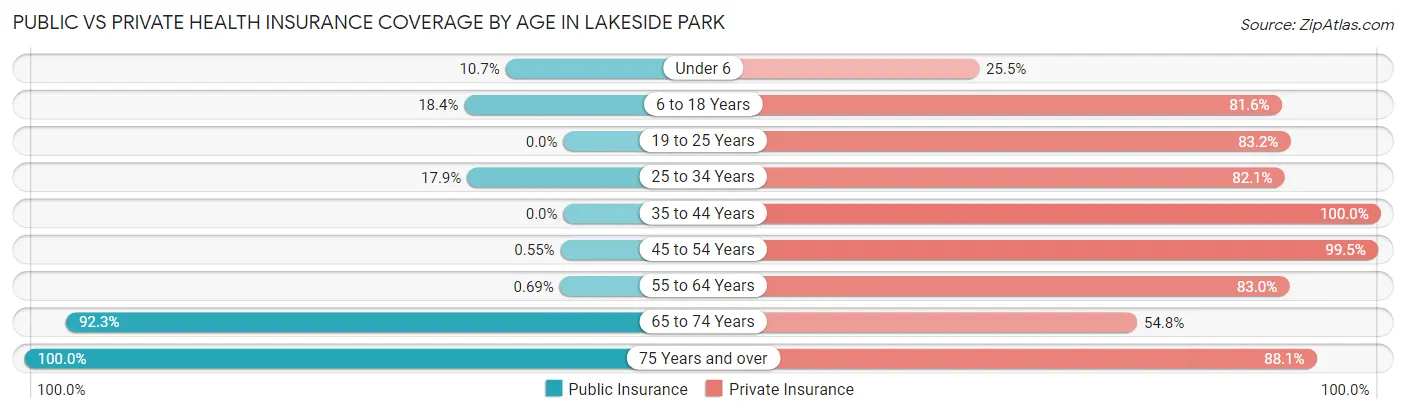
| Age Bracket | Public Insurance | Private Insurance |
| Under 6 | 16 (10.7%) | 38 (25.5%) |
| 6 to 18 Years | 113 (18.4%) | 501 (81.6%) |
| 19 to 25 Years | 0 (0.0%) | 119 (83.2%) |
| 25 to 34 Years | 30 (17.9%) | 138 (82.1%) |
| 35 to 44 Years | 0 (0.0%) | 231 (100.0%) |
| 45 to 54 Years | 3 (0.5%) | 544 (99.5%) |
| 55 to 64 Years | 4 (0.7%) | 479 (83.0%) |
| 65 to 74 Years | 192 (92.3%) | 114 (54.8%) |
| 75 Years and over | 193 (100.0%) | 170 (88.1%) |
| Total | 551 (19.5%) | 2,334 (82.5%) |
Disability Status by Sex by Age in Lakeside Park
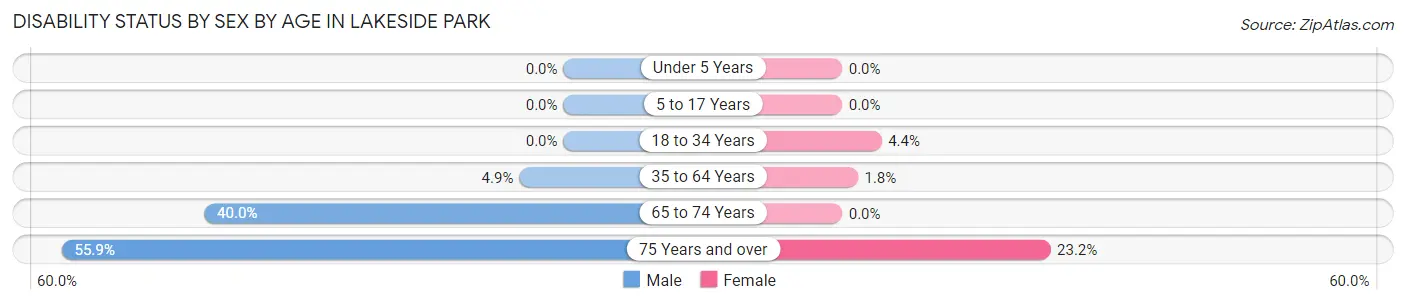
| Age Bracket | Male | Female |
| Under 5 Years | 0 (0.0%) | 0 (0.0%) |
| 5 to 17 Years | 0 (0.0%) | 0 (0.0%) |
| 18 to 34 Years | 0 (0.0%) | 13 (4.4%) |
| 35 to 64 Years | 30 (4.9%) | 13 (1.8%) |
| 65 to 74 Years | 72 (40.0%) | 0 (0.0%) |
| 75 Years and over | 38 (55.9%) | 29 (23.2%) |
Disability Class by Sex by Age in Lakeside Park
Disability Class: Hearing Difficulty
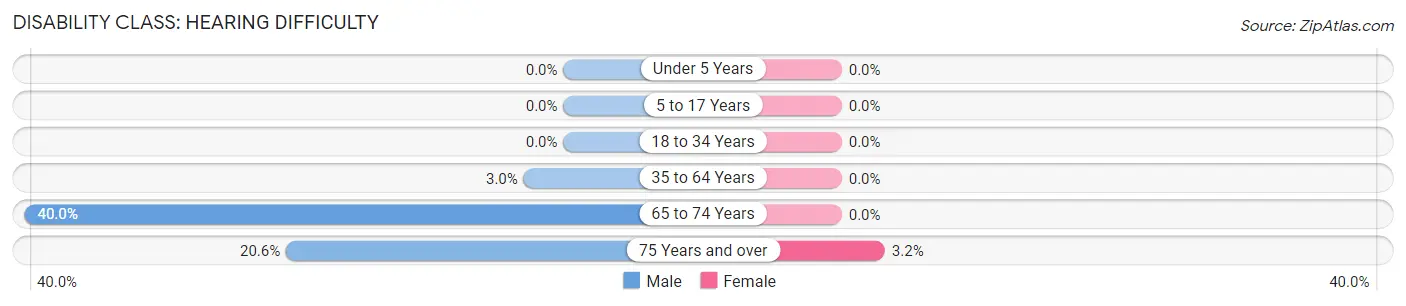
| Age Bracket | Male | Female |
| Under 5 Years | 0 (0.0%) | 0 (0.0%) |
| 5 to 17 Years | 0 (0.0%) | 0 (0.0%) |
| 18 to 34 Years | 0 (0.0%) | 0 (0.0%) |
| 35 to 64 Years | 18 (2.9%) | 0 (0.0%) |
| 65 to 74 Years | 72 (40.0%) | 0 (0.0%) |
| 75 Years and over | 14 (20.6%) | 4 (3.2%) |
Disability Class: Vision Difficulty
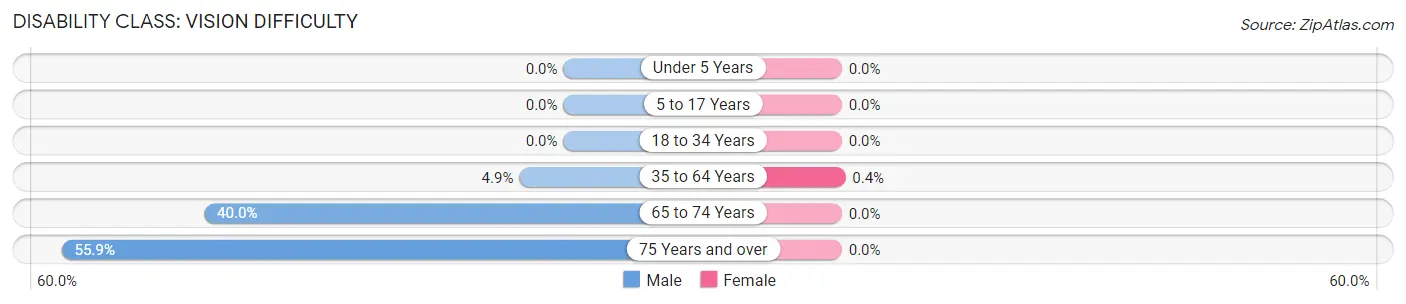
| Age Bracket | Male | Female |
| Under 5 Years | 0 (0.0%) | 0 (0.0%) |
| 5 to 17 Years | 0 (0.0%) | 0 (0.0%) |
| 18 to 34 Years | 0 (0.0%) | 0 (0.0%) |
| 35 to 64 Years | 30 (4.9%) | 3 (0.4%) |
| 65 to 74 Years | 72 (40.0%) | 0 (0.0%) |
| 75 Years and over | 38 (55.9%) | 0 (0.0%) |
Disability Class: Cognitive Difficulty
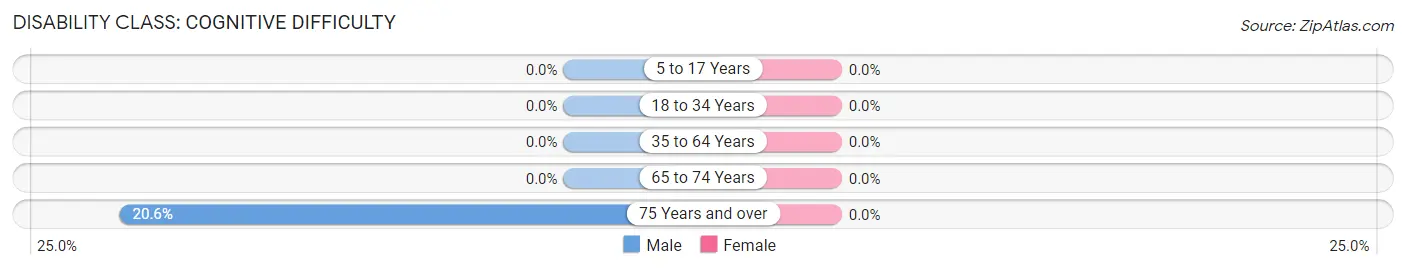
| Age Bracket | Male | Female |
| 5 to 17 Years | 0 (0.0%) | 0 (0.0%) |
| 18 to 34 Years | 0 (0.0%) | 0 (0.0%) |
| 35 to 64 Years | 0 (0.0%) | 0 (0.0%) |
| 65 to 74 Years | 0 (0.0%) | 0 (0.0%) |
| 75 Years and over | 14 (20.6%) | 0 (0.0%) |
Disability Class: Ambulatory Difficulty
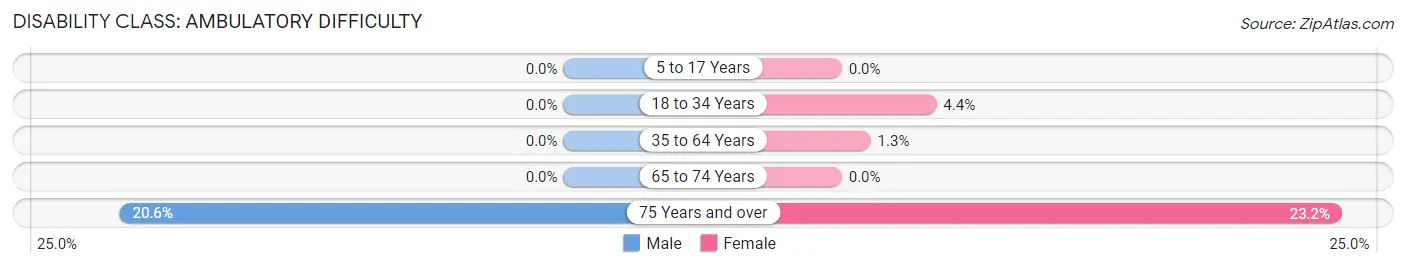
| Age Bracket | Male | Female |
| 5 to 17 Years | 0 (0.0%) | 0 (0.0%) |
| 18 to 34 Years | 0 (0.0%) | 13 (4.4%) |
| 35 to 64 Years | 0 (0.0%) | 10 (1.3%) |
| 65 to 74 Years | 0 (0.0%) | 0 (0.0%) |
| 75 Years and over | 14 (20.6%) | 29 (23.2%) |
Disability Class: Self-Care Difficulty
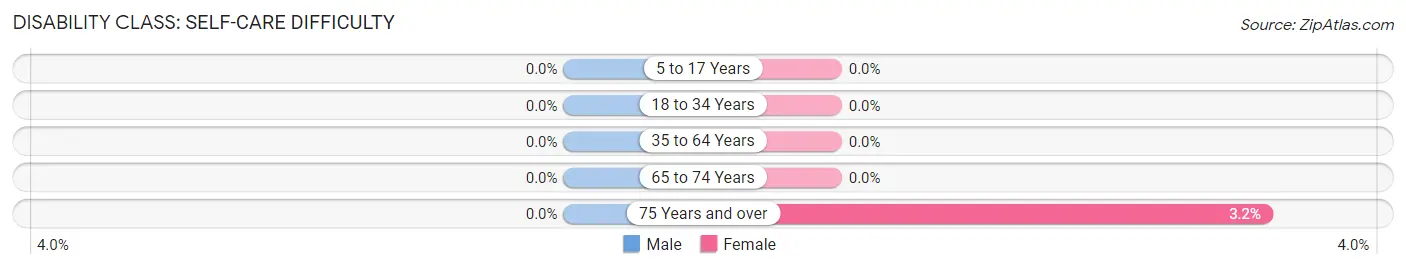
| Age Bracket | Male | Female |
| 5 to 17 Years | 0 (0.0%) | 0 (0.0%) |
| 18 to 34 Years | 0 (0.0%) | 0 (0.0%) |
| 35 to 64 Years | 0 (0.0%) | 0 (0.0%) |
| 65 to 74 Years | 0 (0.0%) | 0 (0.0%) |
| 75 Years and over | 0 (0.0%) | 4 (3.2%) |
Technology Access in Lakeside Park
Computing Device Access in Lakeside Park
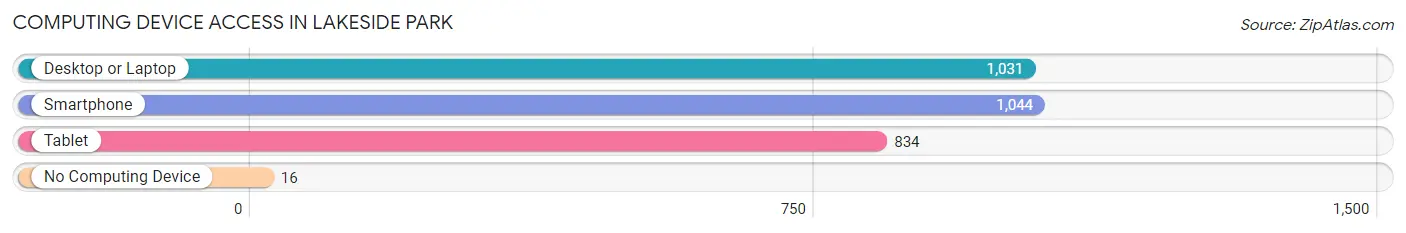
| Device Type | # Households | % Households |
| Desktop or Laptop | 1,031 | 89.4% |
| Smartphone | 1,044 | 90.5% |
| Tablet | 834 | 72.3% |
| No Computing Device | 16 | 1.4% |
| Total | 1,153 | 100.0% |
Internet Access in Lakeside Park
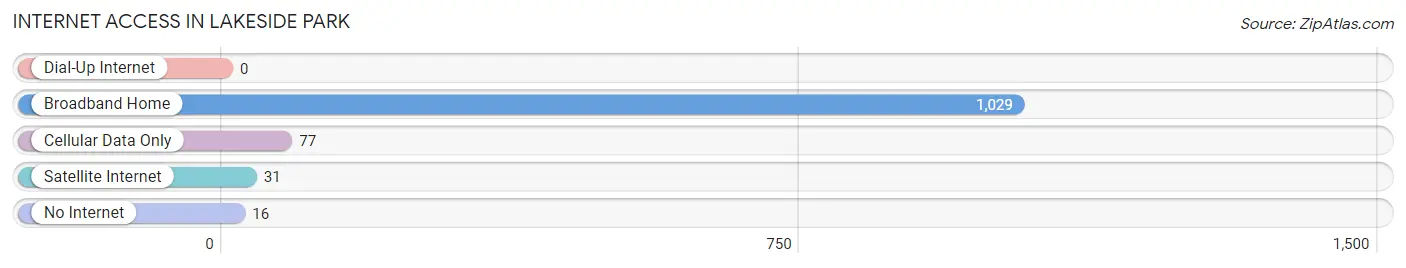
| Internet Type | # Households | % Households |
| Dial-Up Internet | 0 | 0.0% |
| Broadband Home | 1,029 | 89.2% |
| Cellular Data Only | 77 | 6.7% |
| Satellite Internet | 31 | 2.7% |
| No Internet | 16 | 1.4% |
| Total | 1,153 | 100.0% |
Lakeside Park Summary
Lakeside Park is a city located in Kenton County, Kentucky, United States. It is a suburb of Cincinnati, Ohio, and is part of the Greater Cincinnati metropolitan area. The population was 8,945 at the 2010 census.
History
Lakeside Park was founded in 1883 by the Lakeside Land Company. The company was formed by a group of Cincinnati businessmen who wanted to create a summer resort community on the banks of the Ohio River. The town was named after the nearby Lakeside Amusement Park, which was built in 1887. The park was a popular destination for Cincinnatians, and it remained open until the 1970s.
In the early 1900s, Lakeside Park began to grow as a residential community. The town was incorporated in 1912, and the first mayor was elected in 1913. The town continued to grow throughout the 20th century, and by the 2000 census, the population had grown to 8,945.
Geography
Lakeside Park is located in northern Kenton County, at 39°2′17″N 84°31′17″W (39.038118, -84.521345). It is bordered to the north by the city of Fort Mitchell, to the east by the city of Crescent Springs, to the south by the city of Edgewood, and to the west by the Ohio River.
According to the United States Census Bureau, the city has a total area of 4.2 square miles (10.9 km2), of which 4.1 square miles (10.6 km2) is land and 0.1 square miles (0.3 km2) (2.45%) is water.
Economy
Lakeside Park is a primarily residential community, and the majority of its residents are employed in the nearby cities of Cincinnati and Covington. The city does have a few businesses, including a few restaurants, a grocery store, and a few small retail stores.
Demographics
As of the census of 2000, there were 8,945 people, 3,845 households, and 2,541 families residing in the city. The population density was 2,179.2 people per square mile (841.3/km2). There were 4,039 housing units at an average density of 990.2 per square mile (382.2/km2). The racial makeup of the city was 96.45% White, 0.90% African American, 0.09% Native American, 1.45% Asian, 0.02% Pacific Islander, 0.30% from other races, and 0.79% from two or more races. Hispanic or Latino of any race were 0.90% of the population.
There were 3,845 households, out of which 28.2% had children under the age of 18 living with them, 54.2% were married couples living together, 8.7% had a female householder with no husband present, and 34.2% were non-families. 29.2% of all households were made up of individuals, and 10.2% had someone living alone who was 65 years of age or older. The average household size was 2.32 and the average family size was 2.89.
In the city, the population was spread out, with 22.3% under the age of 18, 5.7% from 18 to 24, 28.7% from 25 to 44, 27.2% from 45 to 64, and 16.1% who were 65 years of age or older. The median age was 41 years. For every 100 females, there were 92.2 males. For every 100 females age 18 and over, there were 88.3 males.
The median income for a household in the city was $54,917, and the median income for a family was $64,917. Males had a median income of $45,917 versus $31,917 for females. The per capita income for the city was $27,917. About 2.7% of families and 3.7% of the population were below the poverty line, including 4.7% of those under age 18 and 4.2% of those age 65 or over.
Common Questions
What is Per Capita Income in Lakeside Park?
Per Capita income in Lakeside Park is $67,316.
What is the Median Family Income in Lakeside Park?
Median Family Income in Lakeside Park is $145,417.
What is the Median Household income in Lakeside Park?
Median Household Income in Lakeside Park is $104,523.
What is Income or Wage Gap in Lakeside Park?
Income or Wage Gap in Lakeside Park is 56.1%.
Women in Lakeside Park earn 43.9 cents for every dollar earned by a man.
What is Inequality or Gini Index in Lakeside Park?
Inequality or Gini Index in Lakeside Park is 0.47.
What is the Total Population of Lakeside Park?
Total Population of Lakeside Park is 2,830.
What is the Total Male Population of Lakeside Park?
Total Male Population of Lakeside Park is 1,373.
What is the Total Female Population of Lakeside Park?
Total Female Population of Lakeside Park is 1,457.
What is the Ratio of Males per 100 Females in Lakeside Park?
There are 94.23 Males per 100 Females in Lakeside Park.
What is the Ratio of Females per 100 Males in Lakeside Park?
There are 106.12 Females per 100 Males in Lakeside Park.
What is the Median Population Age in Lakeside Park?
Median Population Age in Lakeside Park is 46.7 Years.
What is the Average Family Size in Lakeside Park
Average Family Size in Lakeside Park is 3.2 People.
What is the Average Household Size in Lakeside Park
Average Household Size in Lakeside Park is 2.4 People.
How Large is the Labor Force in Lakeside Park?
There are 1,658 People in the Labor Forcein in Lakeside Park.
What is the Percentage of People in the Labor Force in Lakeside Park?
74.2% of People are in the Labor Force in Lakeside Park.