Green Spring, KY Map & Demographics
Green Spring Map
Green Spring Overview
$63,395
PER CAPITA INCOME
$165,625
AVG FAMILY INCOME
$160,893
AVG HOUSEHOLD INCOME
9.2%
WAGE / INCOME GAP [ % ]
90.8¢/ $1
WAGE / INCOME GAP [ $ ]
0.33
INEQUALITY / GINI INDEX
579
TOTAL POPULATION
297
MALE POPULATION
282
FEMALE POPULATION
105.32
MALES / 100 FEMALES
94.95
FEMALES / 100 MALES
56.2
MEDIAN AGE
2.7
AVG FAMILY SIZE
2.5
AVG HOUSEHOLD SIZE
276
LABOR FORCE [ PEOPLE ]
55.1%
PERCENT IN LABOR FORCE
2.2%
UNEMPLOYMENT RATE
Green Spring Area Codes
Income in Green Spring
Income Overview in Green Spring
Per Capita Income in Green Spring is $63,395, while median incomes of families and households are $165,625 and $160,893 respectively.
| Characteristic | Number | Measure |
| Per Capita Income | 579 | $63,395 |
| Median Family Income | 199 | $165,625 |
| Mean Family Income | 199 | $164,174 |
| Median Household Income | 227 | $160,893 |
| Mean Household Income | 227 | $164,181 |
| Income Deficit | 199 | $0 |
| Wage / Income Gap (%) | 579 | 9.19% |
| Wage / Income Gap ($) | 579 | 90.81¢ per $1 |
| Gini / Inequality Index | 579 | 0.33 |
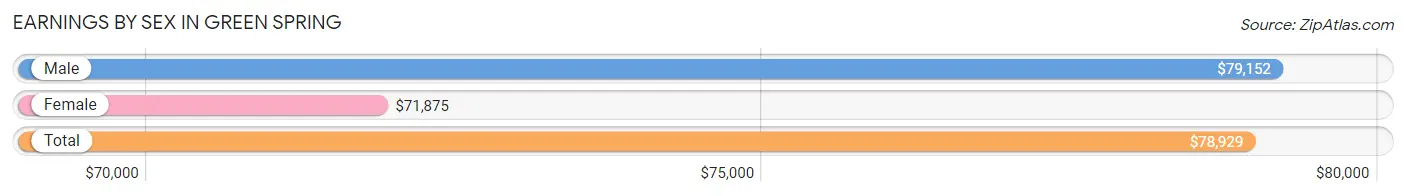
Earnings by Sex in Green Spring
Average Earnings in Green Spring are $78,929, $79,152 for men and $71,875 for women, a difference of 9.2%.
| Sex | Number | Average Earnings |
| Male | 173 (54.1%) | $79,152 |
| Female | 147 (45.9%) | $71,875 |
| Total | 320 (100.0%) | $78,929 |
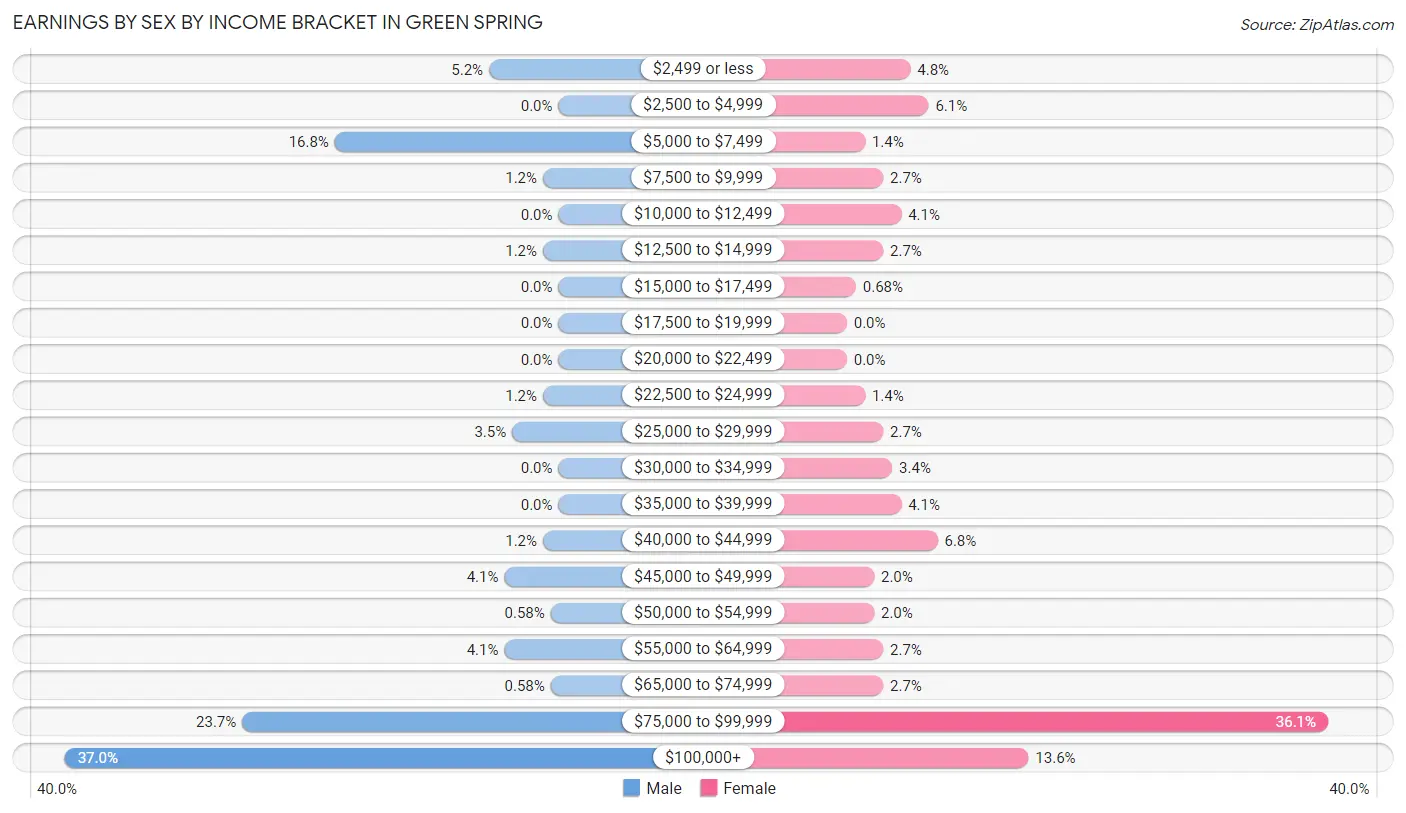
Earnings by Sex by Income Bracket in Green Spring
The most common earnings brackets in Green Spring are $100,000+ for men (64 | 37.0%) and $75,000 to $99,999 for women (53 | 36.0%).
| Income | Male | Female |
| $2,499 or less | 9 (5.2%) | 7 (4.8%) |
| $2,500 to $4,999 | 0 (0.0%) | 9 (6.1%) |
| $5,000 to $7,499 | 29 (16.8%) | 2 (1.4%) |
| $7,500 to $9,999 | 2 (1.2%) | 4 (2.7%) |
| $10,000 to $12,499 | 0 (0.0%) | 6 (4.1%) |
| $12,500 to $14,999 | 2 (1.2%) | 4 (2.7%) |
| $15,000 to $17,499 | 0 (0.0%) | 1 (0.7%) |
| $17,500 to $19,999 | 0 (0.0%) | 0 (0.0%) |
| $20,000 to $22,499 | 0 (0.0%) | 0 (0.0%) |
| $22,500 to $24,999 | 2 (1.2%) | 2 (1.4%) |
| $25,000 to $29,999 | 6 (3.5%) | 4 (2.7%) |
| $30,000 to $34,999 | 0 (0.0%) | 5 (3.4%) |
| $35,000 to $39,999 | 0 (0.0%) | 6 (4.1%) |
| $40,000 to $44,999 | 2 (1.2%) | 10 (6.8%) |
| $45,000 to $49,999 | 7 (4.1%) | 3 (2.0%) |
| $50,000 to $54,999 | 1 (0.6%) | 3 (2.0%) |
| $55,000 to $64,999 | 7 (4.1%) | 4 (2.7%) |
| $65,000 to $74,999 | 1 (0.6%) | 4 (2.7%) |
| $75,000 to $99,999 | 41 (23.7%) | 53 (36.0%) |
| $100,000+ | 64 (37.0%) | 20 (13.6%) |
| Total | 173 (100.0%) | 147 (100.0%) |
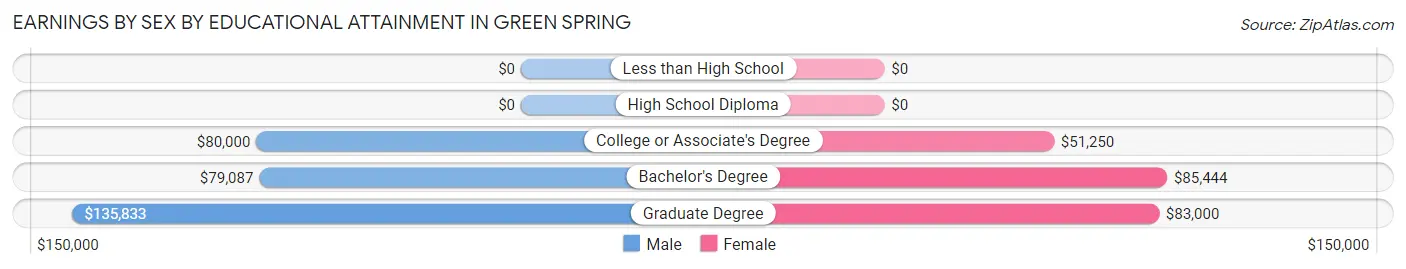
Earnings by Sex by Educational Attainment in Green Spring
Average earnings in Green Spring are $94,750 for men and $82,857 for women, a difference of 12.6%. Men with an educational attainment of graduate degree enjoy the highest average annual earnings of $135,833, while those with bachelor's degree education earn the least with $79,087. Women with an educational attainment of bachelor's degree earn the most with the average annual earnings of $85,444, while those with college or associate's degree education have the smallest earnings of $51,250.
| Educational Attainment | Male Income | Female Income |
| Less than High School | - | - |
| High School Diploma | - | - |
| College or Associate's Degree | $80,000 | $51,250 |
| Bachelor's Degree | $79,087 | $85,444 |
| Graduate Degree | $135,833 | $83,000 |
| Total | $94,750 | $82,857 |
Family Income in Green Spring
Family Income Brackets in Green Spring
According to the Green Spring family income data, there are 62 families falling into the $150,000 to $199,999 income range, which is the most common income bracket and makes up 31.2% of all families.
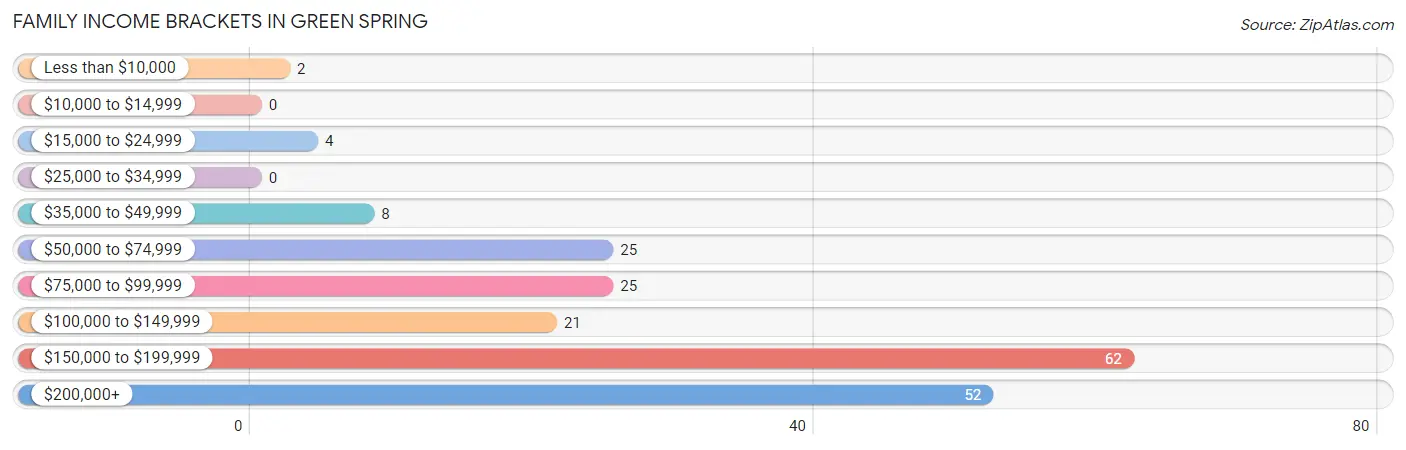
| Income Bracket | # Families | % Families |
| Less than $10,000 | 2 | 1.0% |
| $10,000 to $14,999 | 0 | 0.0% |
| $15,000 to $24,999 | 4 | 2.0% |
| $25,000 to $34,999 | 0 | 0.0% |
| $35,000 to $49,999 | 8 | 4.0% |
| $50,000 to $74,999 | 25 | 12.6% |
| $75,000 to $99,999 | 25 | 12.6% |
| $100,000 to $149,999 | 21 | 10.6% |
| $150,000 to $199,999 | 62 | 31.2% |
| $200,000+ | 52 | 26.1% |
Family Income by Famaliy Size in Green Spring
4-person families (14 | 7.0%) account for the highest median family income in Green Spring with $215,000 per family, while 2-person families (112 | 56.3%) have the highest median income of $59,375 per family member.
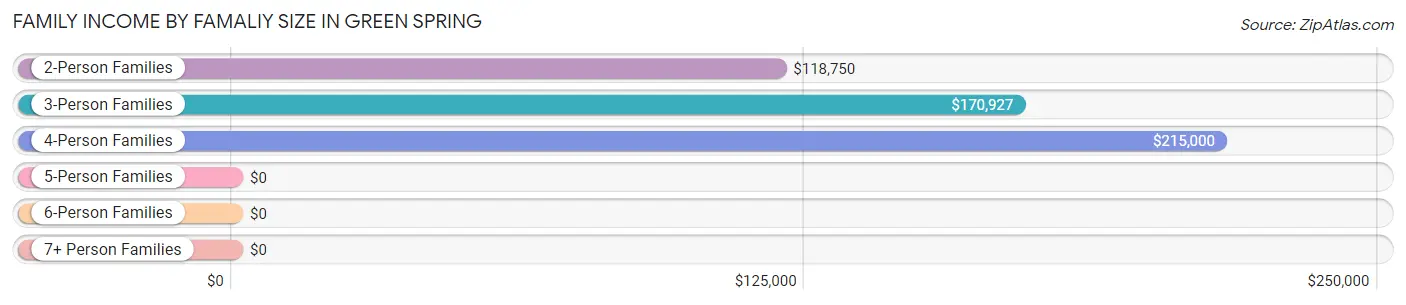
| Income Bracket | # Families | Median Income |
| 2-Person Families | 112 (56.3%) | $118,750 |
| 3-Person Families | 57 (28.6%) | $170,927 |
| 4-Person Families | 14 (7.0%) | $215,000 |
| 5-Person Families | 10 (5.0%) | $0 |
| 6-Person Families | 4 (2.0%) | $0 |
| 7+ Person Families | 2 (1.0%) | $0 |
| Total | 199 (100.0%) | $165,625 |
Family Income by Number of Earners in Green Spring
The median family income in Green Spring is $165,625, with families comprising 2 earners (53) having the highest median family income of $171,875, while families with no earners (46) have the lowest median family income of $81,250, accounting for 26.6% and 23.1% of families, respectively.
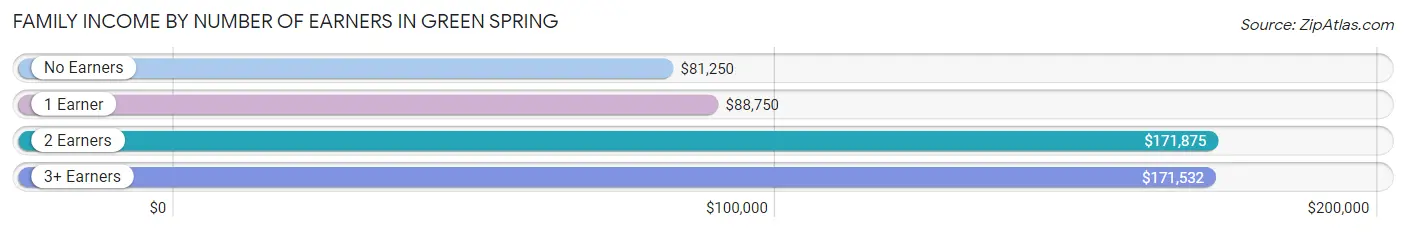
| Number of Earners | # Families | Median Income |
| No Earners | 46 (23.1%) | $81,250 |
| 1 Earner | 48 (24.1%) | $88,750 |
| 2 Earners | 53 (26.6%) | $171,875 |
| 3+ Earners | 52 (26.1%) | $171,532 |
| Total | 199 (100.0%) | $165,625 |
Household Income in Green Spring
Household Income Brackets in Green Spring
With 72 households falling in the category, the $150,000 to $199,999 income range is the most frequent in Green Spring, accounting for 31.7% of all households.
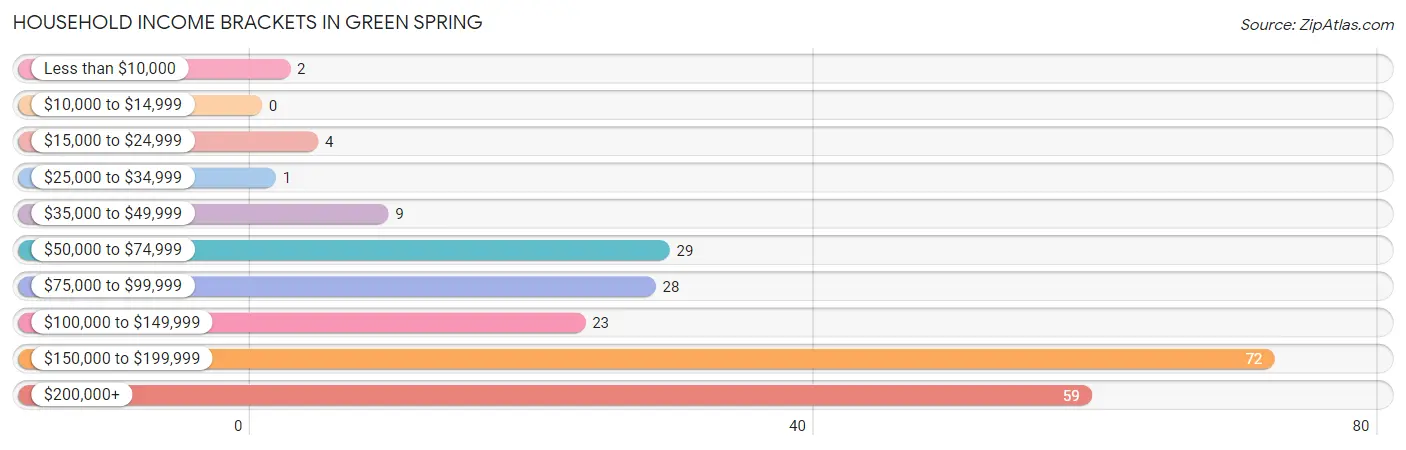
| Income Bracket | # Households | % Households |
| Less than $10,000 | 2 | 0.9% |
| $10,000 to $14,999 | 0 | 0.0% |
| $15,000 to $24,999 | 4 | 1.8% |
| $25,000 to $34,999 | 1 | 0.4% |
| $35,000 to $49,999 | 9 | 4.0% |
| $50,000 to $74,999 | 29 | 12.8% |
| $75,000 to $99,999 | 28 | 12.3% |
| $100,000 to $149,999 | 23 | 10.1% |
| $150,000 to $199,999 | 72 | 31.7% |
| $200,000+ | 59 | 26.0% |
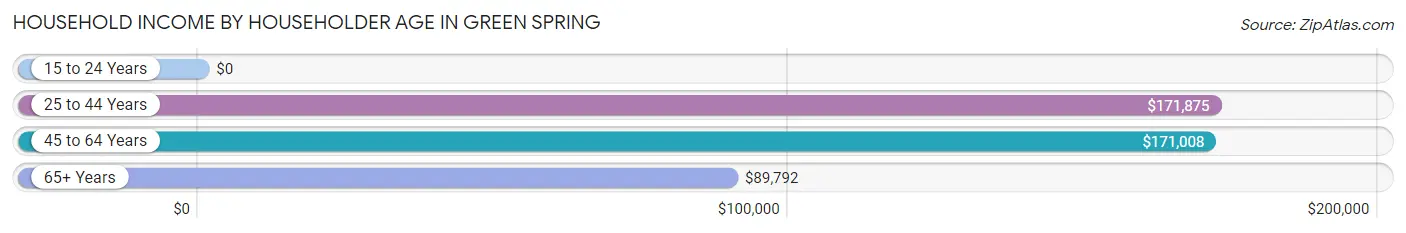
Household Income by Householder Age in Green Spring
The median household income in Green Spring is $160,893, with the highest median household income of $171,875 found in the 25 to 44 years age bracket for the primary householder. A total of 25 households (11.0%) fall into this category.
| Income Bracket | # Households | Median Income |
| 15 to 24 Years | 0 (0.0%) | $0 |
| 25 to 44 Years | 25 (11.0%) | $171,875 |
| 45 to 64 Years | 105 (46.3%) | $171,008 |
| 65+ Years | 97 (42.7%) | $89,792 |
| Total | 227 (100.0%) | $160,893 |
Poverty in Green Spring
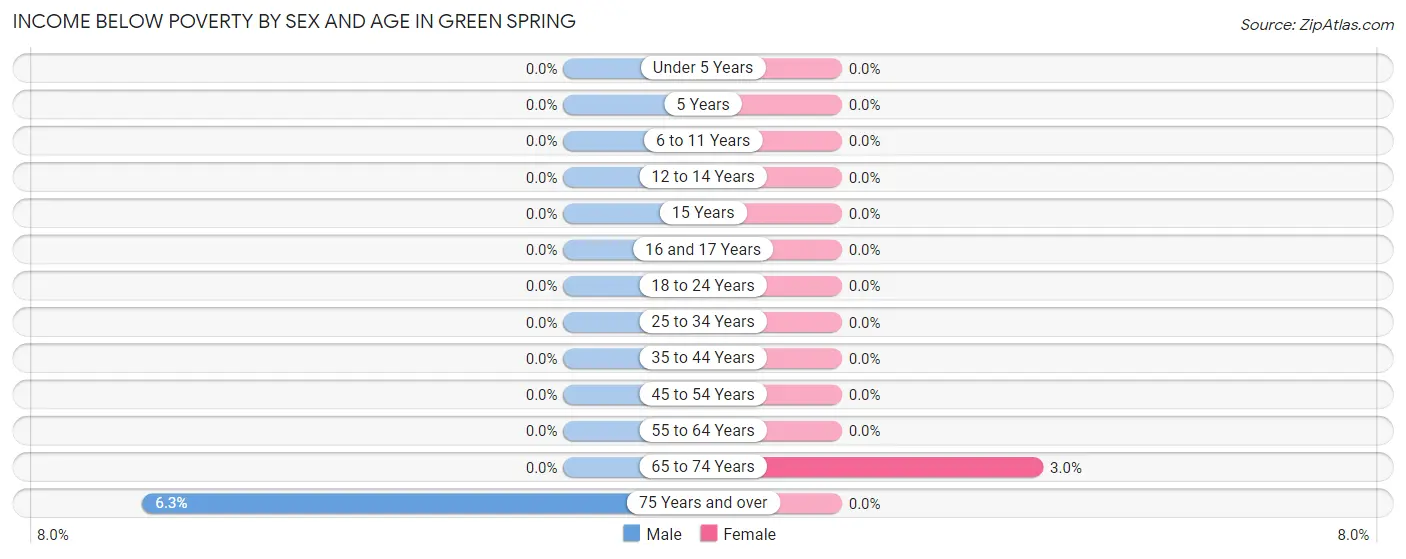
Income Below Poverty by Sex and Age in Green Spring
With 0.7% poverty level for males and 0.7% for females among the residents of Green Spring, 75 year old and over males and 65 to 74 year old females are the most vulnerable to poverty, with 2 males (6.2%) and 2 females (3.0%) in their respective age groups living below the poverty level.
| Age Bracket | Male | Female |
| Under 5 Years | 0 (0.0%) | 0 (0.0%) |
| 5 Years | 0 (0.0%) | 0 (0.0%) |
| 6 to 11 Years | 0 (0.0%) | 0 (0.0%) |
| 12 to 14 Years | 0 (0.0%) | 0 (0.0%) |
| 15 Years | 0 (0.0%) | 0 (0.0%) |
| 16 and 17 Years | 0 (0.0%) | 0 (0.0%) |
| 18 to 24 Years | 0 (0.0%) | 0 (0.0%) |
| 25 to 34 Years | 0 (0.0%) | 0 (0.0%) |
| 35 to 44 Years | 0 (0.0%) | 0 (0.0%) |
| 45 to 54 Years | 0 (0.0%) | 0 (0.0%) |
| 55 to 64 Years | 0 (0.0%) | 0 (0.0%) |
| 65 to 74 Years | 0 (0.0%) | 2 (3.0%) |
| 75 Years and over | 2 (6.2%) | 0 (0.0%) |
| Total | 2 (0.7%) | 2 (0.7%) |
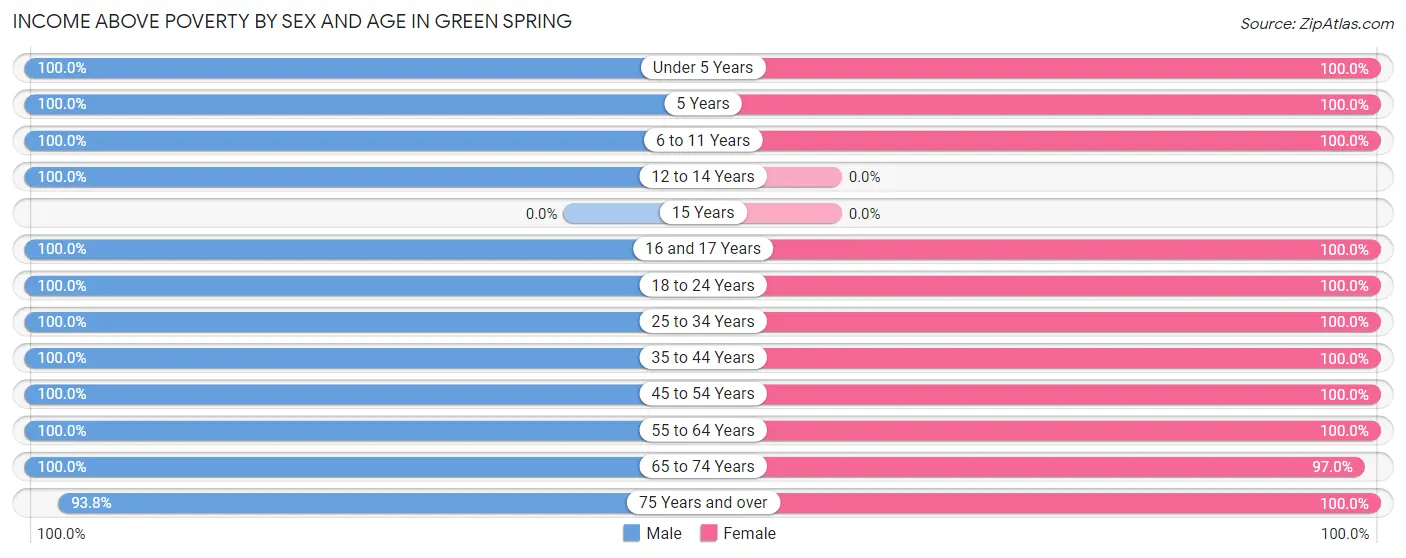
Income Above Poverty by Sex and Age in Green Spring
According to the poverty statistics in Green Spring, males aged under 5 years and females aged under 5 years are the age groups that are most secure financially, with 100.0% of males and 100.0% of females in these age groups living above the poverty line.
| Age Bracket | Male | Female |
| Under 5 Years | 6 (100.0%) | 12 (100.0%) |
| 5 Years | 2 (100.0%) | 2 (100.0%) |
| 6 to 11 Years | 23 (100.0%) | 19 (100.0%) |
| 12 to 14 Years | 14 (100.0%) | 0 (0.0%) |
| 15 Years | 0 (0.0%) | 0 (0.0%) |
| 16 and 17 Years | 7 (100.0%) | 8 (100.0%) |
| 18 to 24 Years | 34 (100.0%) | 11 (100.0%) |
| 25 to 34 Years | 7 (100.0%) | 9 (100.0%) |
| 35 to 44 Years | 18 (100.0%) | 22 (100.0%) |
| 45 to 54 Years | 23 (100.0%) | 26 (100.0%) |
| 55 to 64 Years | 78 (100.0%) | 85 (100.0%) |
| 65 to 74 Years | 53 (100.0%) | 65 (97.0%) |
| 75 Years and over | 30 (93.8%) | 21 (100.0%) |
| Total | 295 (99.3%) | 280 (99.3%) |
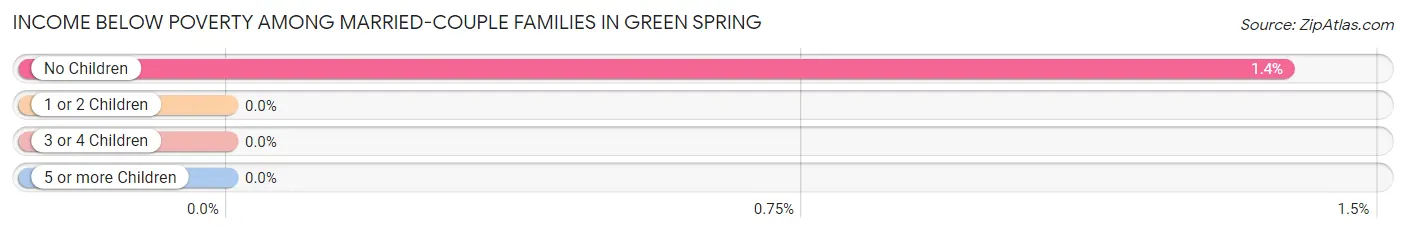
Income Below Poverty Among Married-Couple Families in Green Spring
The poverty statistics for married-couple families in Green Spring show that 1.1% or 2 of the total 182 families live below the poverty line. Families with no children have the highest poverty rate of 1.4%, comprising of 2 families. On the other hand, families with 1 or 2 children have the lowest poverty rate of 0.0%, which includes 0 families.
| Children | Above Poverty | Below Poverty |
| No Children | 143 (98.6%) | 2 (1.4%) |
| 1 or 2 Children | 26 (100.0%) | 0 (0.0%) |
| 3 or 4 Children | 9 (100.0%) | 0 (0.0%) |
| 5 or more Children | 2 (100.0%) | 0 (0.0%) |
| Total | 180 (98.9%) | 2 (1.1%) |
Income Below Poverty Among Single-Parent Households in Green Spring
| Children | Single Father | Single Mother |
| No Children | 0 (0.0%) | 0 (0.0%) |
| 1 or 2 Children | 0 (0.0%) | 0 (0.0%) |
| 3 or 4 Children | 0 (0.0%) | 0 (0.0%) |
| 5 or more Children | 0 (0.0%) | 0 (0.0%) |
| Total | 0 (0.0%) | 0 (0.0%) |
Income Below Poverty Among Married-Couple vs Single-Parent Households in Green Spring
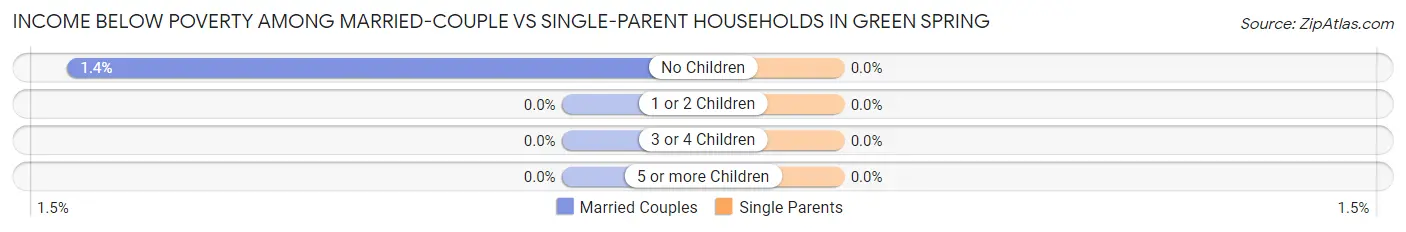
| Children | Married-Couple Families | Single-Parent Households |
| No Children | 2 (1.4%) | 0 (0.0%) |
| 1 or 2 Children | 0 (0.0%) | 0 (0.0%) |
| 3 or 4 Children | 0 (0.0%) | 0 (0.0%) |
| 5 or more Children | 0 (0.0%) | 0 (0.0%) |
| Total | 2 (1.1%) | 0 (0.0%) |
Race in Green Spring
The most populous races in Green Spring are White / Caucasian (565 | 97.6%), Black / African American (11 | 1.9%), and Asian (3 | 0.5%).
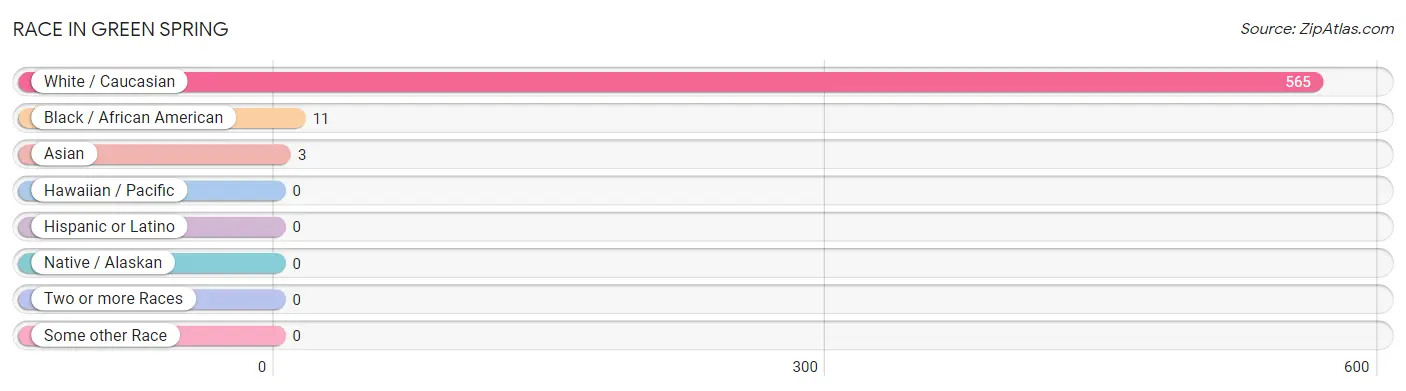
| Race | # Population | % Population |
| Asian | 3 | 0.5% |
| Black / African American | 11 | 1.9% |
| Hawaiian / Pacific | 0 | 0.0% |
| Hispanic or Latino | 0 | 0.0% |
| Native / Alaskan | 0 | 0.0% |
| White / Caucasian | 565 | 97.6% |
| Two or more Races | 0 | 0.0% |
| Some other Race | 0 | 0.0% |
| Total | 579 | 100.0% |
Ancestry in Green Spring
The most populous ancestries reported in Green Spring are German (159 | 27.5%), English (152 | 26.3%), Irish (147 | 25.4%), Polish (60 | 10.4%), and Hungarian (31 | 5.3%), together accounting for 94.8% of all Green Spring residents.
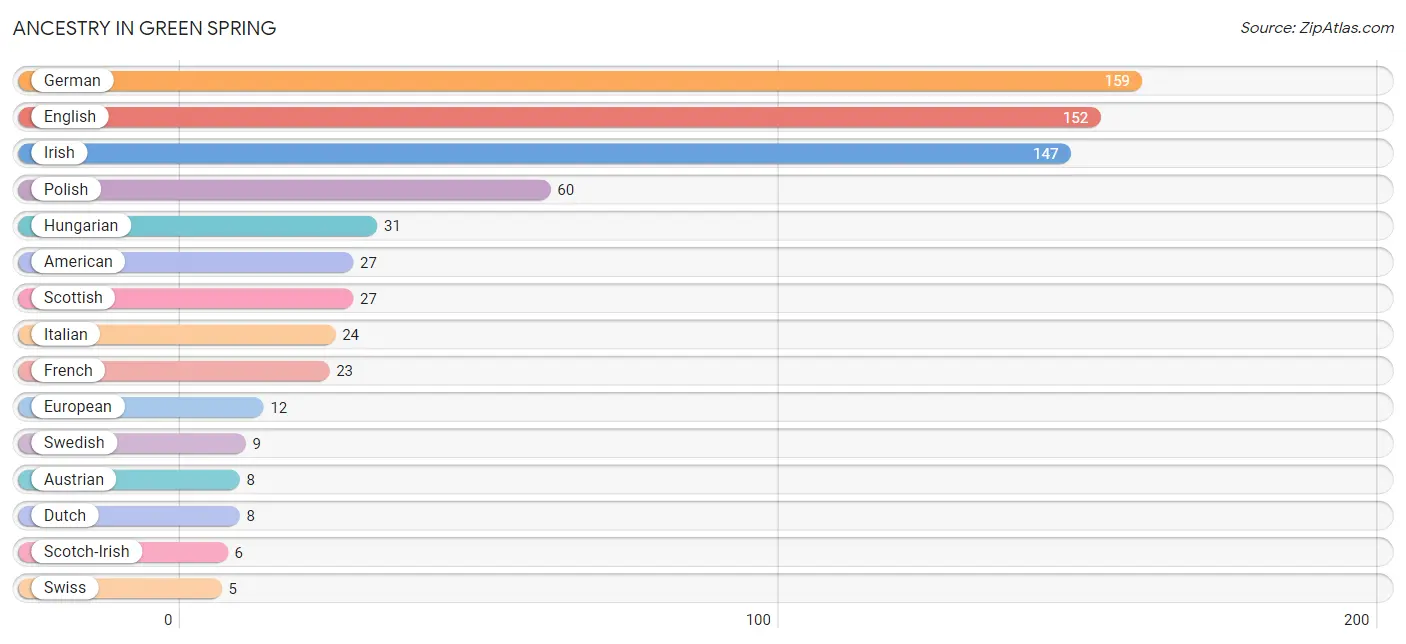
| Ancestry | # Population | % Population |
| American | 27 | 4.7% |
| Austrian | 8 | 1.4% |
| Belgian | 2 | 0.4% |
| British | 2 | 0.4% |
| Croatian | 2 | 0.4% |
| Dutch | 8 | 1.4% |
| Eastern European | 4 | 0.7% |
| English | 152 | 26.3% |
| European | 12 | 2.1% |
| French | 23 | 4.0% |
| German | 159 | 27.5% |
| Greek | 3 | 0.5% |
| Hungarian | 31 | 5.3% |
| Irish | 147 | 25.4% |
| Italian | 24 | 4.2% |
| Latvian | 1 | 0.2% |
| Norwegian | 2 | 0.4% |
| Polish | 60 | 10.4% |
| Romanian | 2 | 0.4% |
| Russian | 2 | 0.4% |
| Scandinavian | 2 | 0.4% |
| Scotch-Irish | 6 | 1.0% |
| Scottish | 27 | 4.7% |
| Swedish | 9 | 1.5% |
| Swiss | 5 | 0.9% |
| Thai | 3 | 0.5% |
| Ukrainian | 1 | 0.2% | View All 27 Rows |
Immigrants in Green Spring
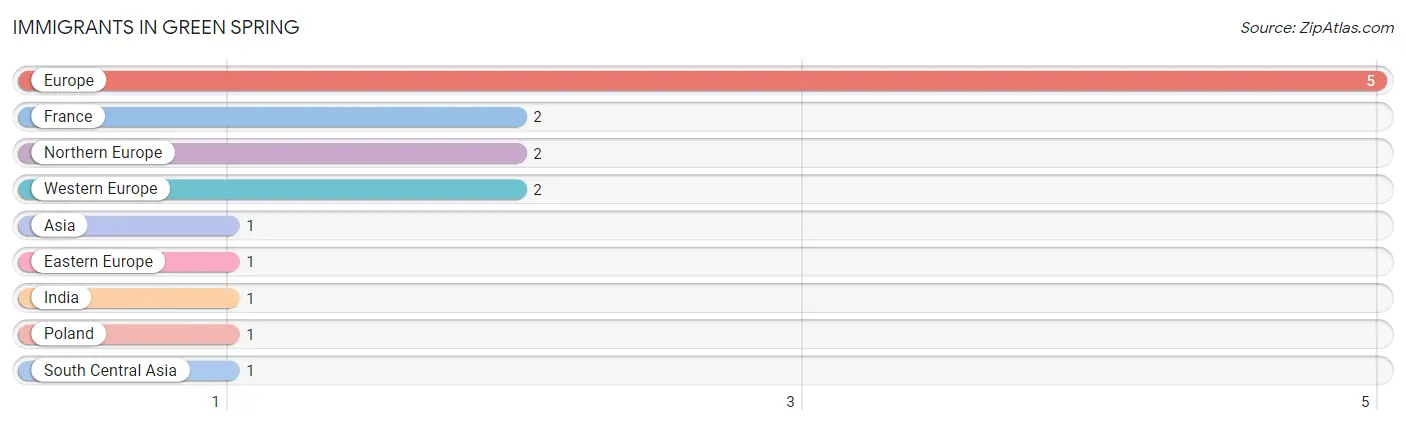
The most numerous immigrant groups reported in Green Spring came from Europe (5 | 0.9%), France (2 | 0.4%), Northern Europe (2 | 0.4%), Western Europe (2 | 0.4%), and Asia (1 | 0.2%), together accounting for 2.1% of all Green Spring residents.
| Immigration Origin | # Population | % Population |
| Asia | 1 | 0.2% |
| Eastern Europe | 1 | 0.2% |
| Europe | 5 | 0.9% |
| France | 2 | 0.4% |
| India | 1 | 0.2% |
| Northern Europe | 2 | 0.4% |
| Poland | 1 | 0.2% |
| South Central Asia | 1 | 0.2% |
| Western Europe | 2 | 0.4% | View All 9 Rows |
Sex and Age in Green Spring
Sex and Age in Green Spring
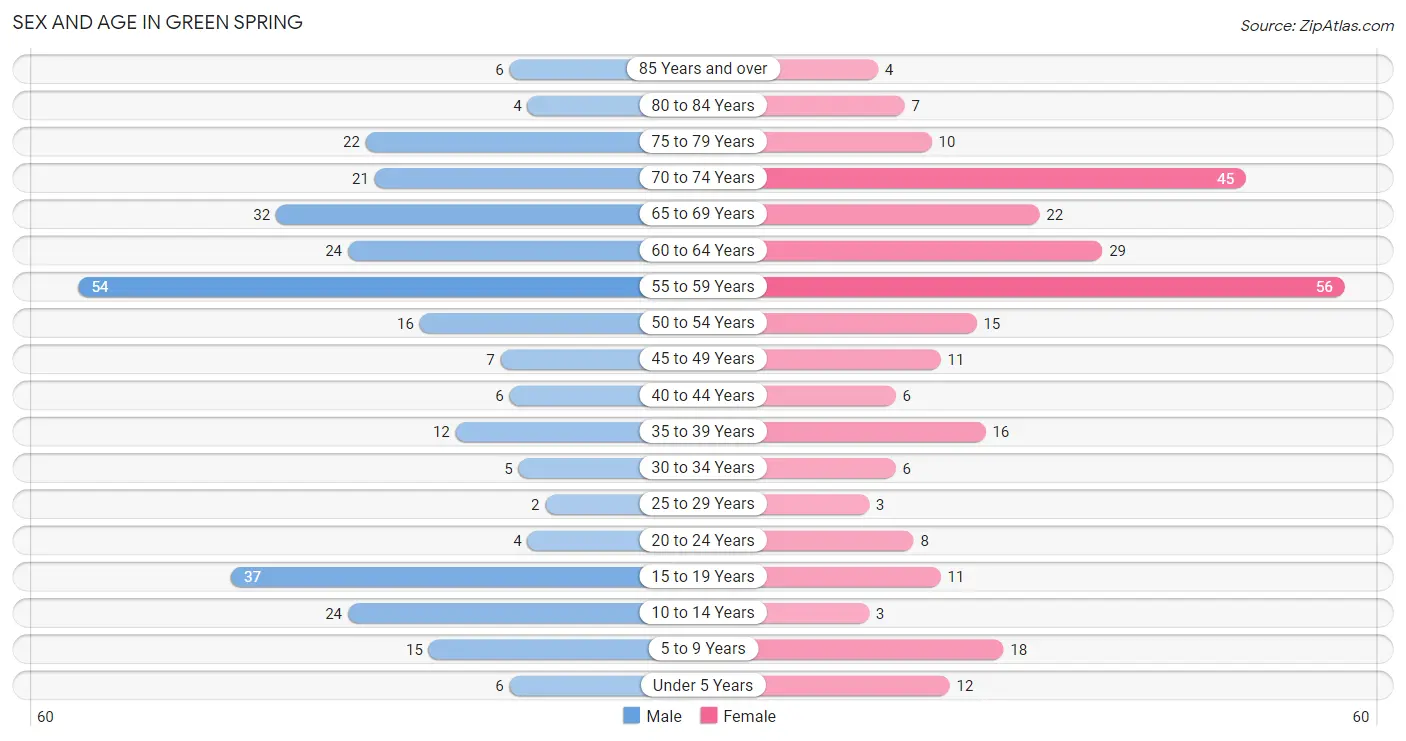
The most populous age groups in Green Spring are 55 to 59 Years (54 | 18.2%) for men and 55 to 59 Years (56 | 19.9%) for women.
| Age Bracket | Male | Female |
| Under 5 Years | 6 (2.0%) | 12 (4.3%) |
| 5 to 9 Years | 15 (5.1%) | 18 (6.4%) |
| 10 to 14 Years | 24 (8.1%) | 3 (1.1%) |
| 15 to 19 Years | 37 (12.5%) | 11 (3.9%) |
| 20 to 24 Years | 4 (1.3%) | 8 (2.8%) |
| 25 to 29 Years | 2 (0.7%) | 3 (1.1%) |
| 30 to 34 Years | 5 (1.7%) | 6 (2.1%) |
| 35 to 39 Years | 12 (4.0%) | 16 (5.7%) |
| 40 to 44 Years | 6 (2.0%) | 6 (2.1%) |
| 45 to 49 Years | 7 (2.4%) | 11 (3.9%) |
| 50 to 54 Years | 16 (5.4%) | 15 (5.3%) |
| 55 to 59 Years | 54 (18.2%) | 56 (19.9%) |
| 60 to 64 Years | 24 (8.1%) | 29 (10.3%) |
| 65 to 69 Years | 32 (10.8%) | 22 (7.8%) |
| 70 to 74 Years | 21 (7.1%) | 45 (16.0%) |
| 75 to 79 Years | 22 (7.4%) | 10 (3.5%) |
| 80 to 84 Years | 4 (1.3%) | 7 (2.5%) |
| 85 Years and over | 6 (2.0%) | 4 (1.4%) |
| Total | 297 (100.0%) | 282 (100.0%) |
Families and Households in Green Spring
Median Family Size in Green Spring
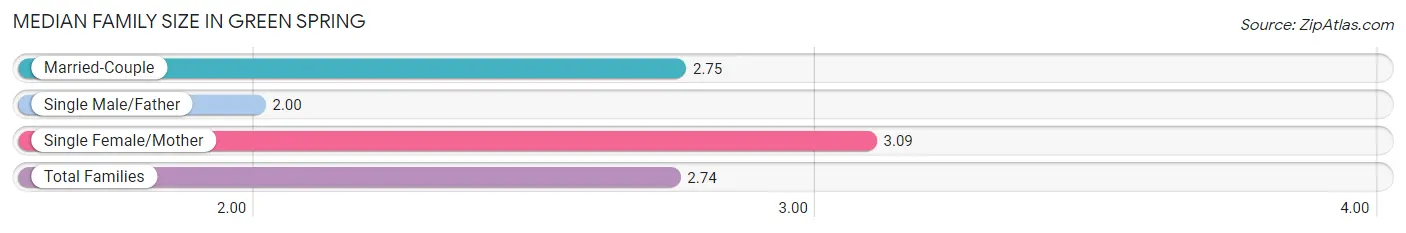
The median family size in Green Spring is 2.74 persons per family, with single female/mother families (11 | 5.5%) accounting for the largest median family size of 3.09 persons per family. On the other hand, single male/father families (6 | 3.0%) represent the smallest median family size with 2.00 persons per family.
| Family Type | # Families | Family Size |
| Married-Couple | 182 (91.5%) | 2.75 |
| Single Male/Father | 6 (3.0%) | 2.00 |
| Single Female/Mother | 11 (5.5%) | 3.09 |
| Total Families | 199 (100.0%) | 2.74 |
Median Household Size in Green Spring
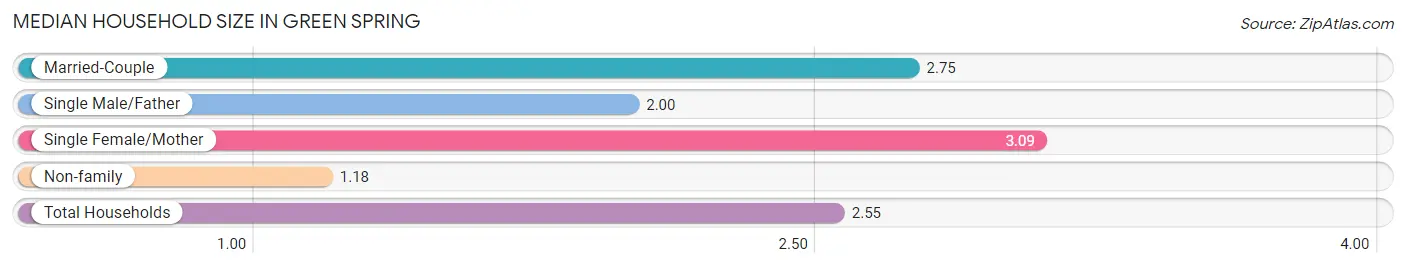
The median household size in Green Spring is 2.55 persons per household, with single female/mother households (11 | 4.9%) accounting for the largest median household size of 3.09 persons per household. non-family households (28 | 12.3%) represent the smallest median household size with 1.18 persons per household.
| Household Type | # Households | Household Size |
| Married-Couple | 182 (80.2%) | 2.75 |
| Single Male/Father | 6 (2.6%) | 2.00 |
| Single Female/Mother | 11 (4.9%) | 3.09 |
| Non-family | 28 (12.3%) | 1.18 |
| Total Households | 227 (100.0%) | 2.55 |
Household Size by Marriage Status in Green Spring
Out of a total of 227 households in Green Spring, 199 (87.7%) are family households, while 28 (12.3%) are nonfamily households. The most numerous type of family households are 2-person households, comprising 112, and the most common type of nonfamily households are 1-person households, comprising 23.
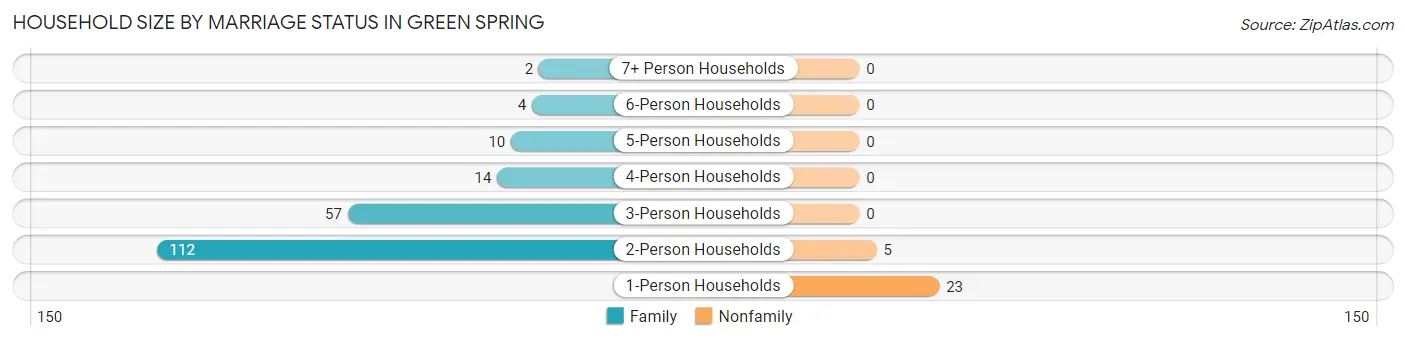
| Household Size | Family Households | Nonfamily Households |
| 1-Person Households | - | 23 (10.1%) |
| 2-Person Households | 112 (49.3%) | 5 (2.2%) |
| 3-Person Households | 57 (25.1%) | 0 (0.0%) |
| 4-Person Households | 14 (6.2%) | 0 (0.0%) |
| 5-Person Households | 10 (4.4%) | 0 (0.0%) |
| 6-Person Households | 4 (1.8%) | 0 (0.0%) |
| 7+ Person Households | 2 (0.9%) | 0 (0.0%) |
| Total | 199 (87.7%) | 28 (12.3%) |
Female Fertility in Green Spring
Fertility by Age in Green Spring
Average fertility rate in Green Spring is 115.0 births per 1,000 women. Women in the age bracket of 35 to 50 years have the highest fertility rate with 152.0 births per 1,000 women. Women in the age bracket of 35 to 50 years acount for 71.4% of all women with births.
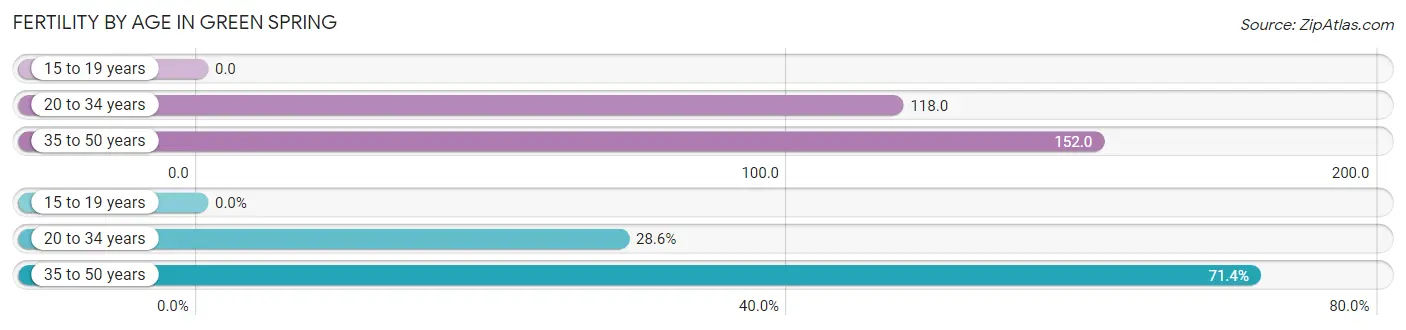
| Age Bracket | Women with Births | Births / 1,000 Women |
| 15 to 19 years | 0 (0.0%) | 0.0 |
| 20 to 34 years | 2 (28.6%) | 118.0 |
| 35 to 50 years | 5 (71.4%) | 152.0 |
| Total | 7 (100.0%) | 115.0 |
Fertility by Age by Marriage Status in Green Spring
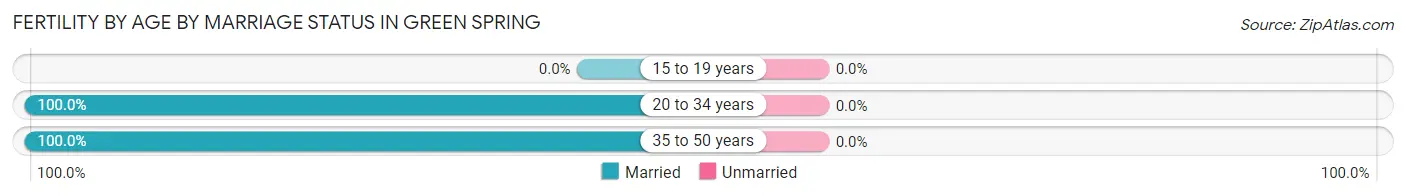
| Age Bracket | Married | Unmarried |
| 15 to 19 years | 0 (0.0%) | 0 (0.0%) |
| 20 to 34 years | 2 (100.0%) | 0 (0.0%) |
| 35 to 50 years | 5 (100.0%) | 0 (0.0%) |
| Total | 7 (100.0%) | 0 (0.0%) |
Fertility by Education in Green Spring
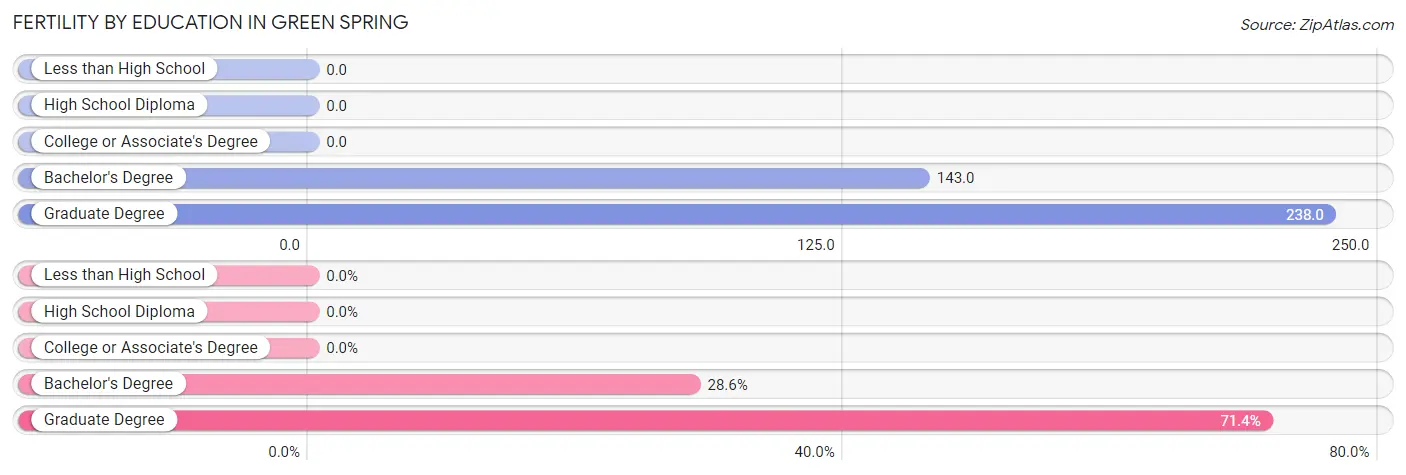
| Educational Attainment | Women with Births | Births / 1,000 Women |
| Less than High School | 0 (0.0%) | 0.0 |
| High School Diploma | 0 (0.0%) | 0.0 |
| College or Associate's Degree | 0 (0.0%) | 0.0 |
| Bachelor's Degree | 2 (28.6%) | 143.0 |
| Graduate Degree | 5 (71.4%) | 238.0 |
| Total | 7 (100.0%) | 115.0 |
Fertility by Education by Marriage Status in Green Spring
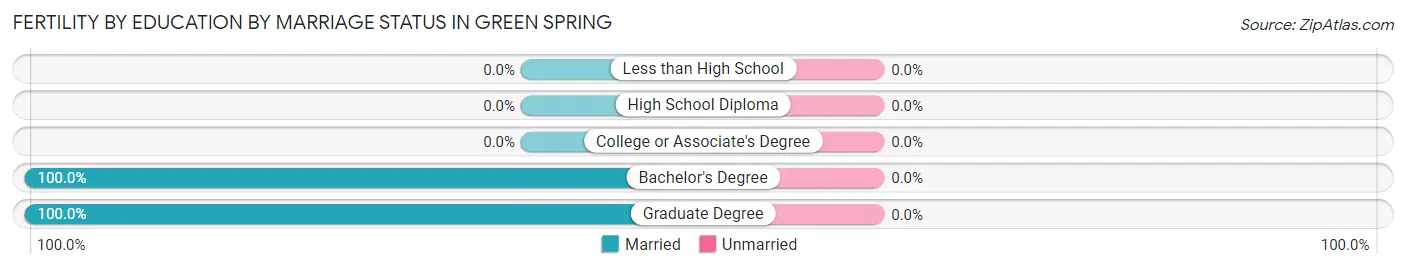
| Educational Attainment | Married | Unmarried |
| Less than High School | 0 (0.0%) | 0 (0.0%) |
| High School Diploma | 0 (0.0%) | 0 (0.0%) |
| College or Associate's Degree | 0 (0.0%) | 0 (0.0%) |
| Bachelor's Degree | 2 (100.0%) | 0 (0.0%) |
| Graduate Degree | 5 (100.0%) | 0 (0.0%) |
| Total | 7 (100.0%) | 0 (0.0%) |
Employment Characteristics in Green Spring
Employment by Class of Employer in Green Spring
Among the 264 employed individuals in Green Spring, private company employees (175 | 66.3%), not-for-profit organizations (46 | 17.4%), and self-employed (not incorporated) (13 | 4.9%) make up the most common classes of employment.
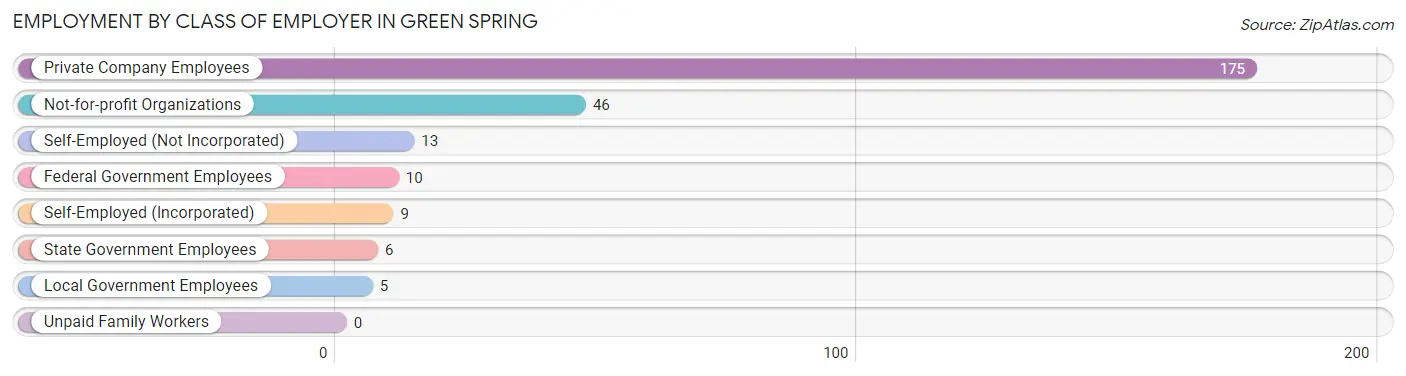
| Employer Class | # Employees | % Employees |
| Private Company Employees | 175 | 66.3% |
| Self-Employed (Incorporated) | 9 | 3.4% |
| Self-Employed (Not Incorporated) | 13 | 4.9% |
| Not-for-profit Organizations | 46 | 17.4% |
| Local Government Employees | 5 | 1.9% |
| State Government Employees | 6 | 2.3% |
| Federal Government Employees | 10 | 3.8% |
| Unpaid Family Workers | 0 | 0.0% |
| Total | 264 | 100.0% |
Employment Status by Age in Green Spring
According to the labor force statistics for Green Spring, out of the total population over 16 years of age (501), 55.1% or 276 individuals are in the labor force, with 2.2% or 6 of them unemployed. The age group with the highest labor force participation rate is 55 to 59 years, with 87.3% or 96 individuals in the labor force. Within the labor force, the 20 to 24 years age range has the highest percentage of unemployed individuals, with 16.7% or 1 of them being unemployed.
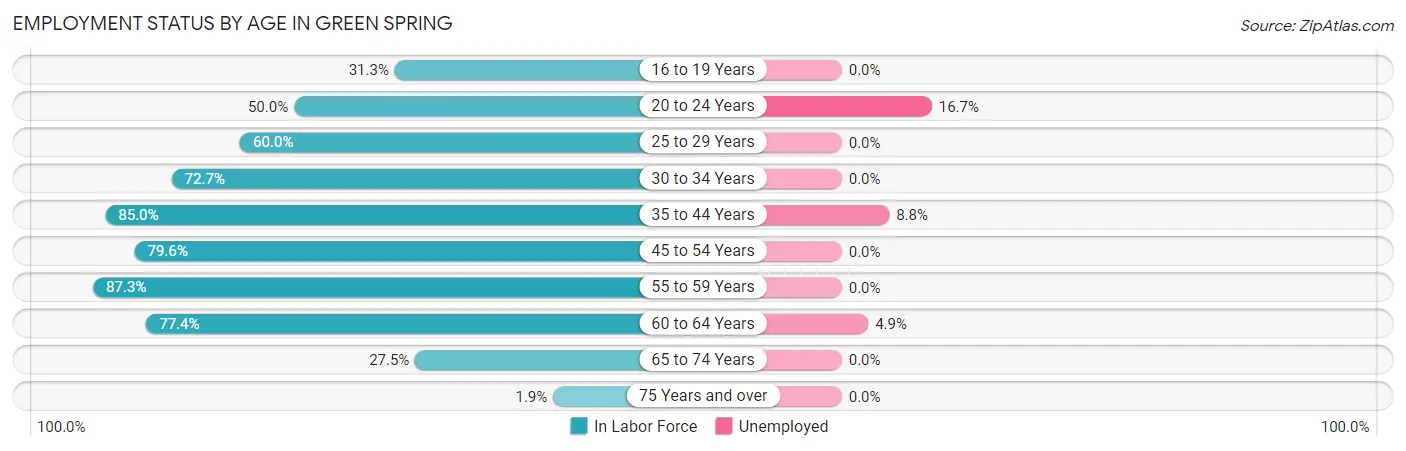
| Age Bracket | In Labor Force | Unemployed |
| 16 to 19 Years | 15 (31.3%) | 0 (0.0%) |
| 20 to 24 Years | 6 (50.0%) | 1 (16.7%) |
| 25 to 29 Years | 3 (60.0%) | 0 (0.0%) |
| 30 to 34 Years | 8 (72.7%) | 0 (0.0%) |
| 35 to 44 Years | 34 (85.0%) | 3 (8.8%) |
| 45 to 54 Years | 39 (79.6%) | 0 (0.0%) |
| 55 to 59 Years | 96 (87.3%) | 0 (0.0%) |
| 60 to 64 Years | 41 (77.4%) | 2 (4.9%) |
| 65 to 74 Years | 33 (27.5%) | 0 (0.0%) |
| 75 Years and over | 1 (1.9%) | 0 (0.0%) |
| Total | 276 (55.1%) | 6 (2.2%) |
Employment Status by Educational Attainment in Green Spring
According to labor force statistics for Green Spring, 82.5% of individuals (221) out of the total population between 25 and 64 years of age (268) are in the labor force, with 2.3% or 5 of them being unemployed. The group with the highest labor force participation rate are those with the educational attainment of bachelor's degree or higher, with 91.0% or 193 individuals in the labor force. Within the labor force, individuals with high school diploma education have the highest percentage of unemployment, with 50.0% or 3 of them being unemployed.
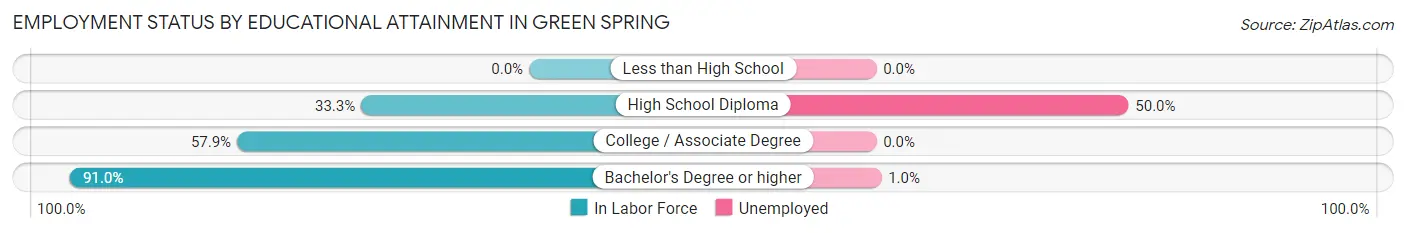
| Educational Attainment | In Labor Force | Unemployed |
| Less than High School | 0 (0.0%) | 0 (0.0%) |
| High School Diploma | 6 (33.3%) | 9 (50.0%) |
| College / Associate Degree | 22 (57.9%) | 0 (0.0%) |
| Bachelor's Degree or higher | 193 (91.0%) | 2 (1.0%) |
| Total | 221 (82.5%) | 6 (2.3%) |
Employment Occupations by Sex in Green Spring
Management, Business, Science and Arts Occupations
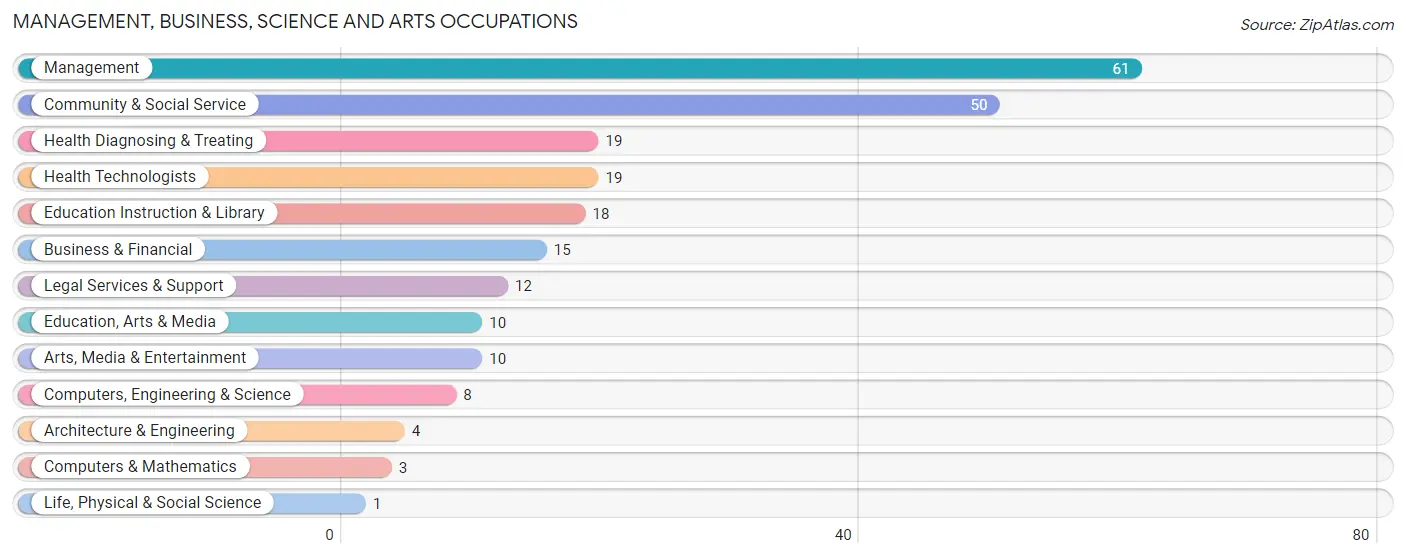
The most common Management, Business, Science and Arts occupations in Green Spring are Management (61 | 22.6%), Community & Social Service (50 | 18.5%), Health Diagnosing & Treating (19 | 7.0%), Health Technologists (19 | 7.0%), and Education Instruction & Library (18 | 6.7%).
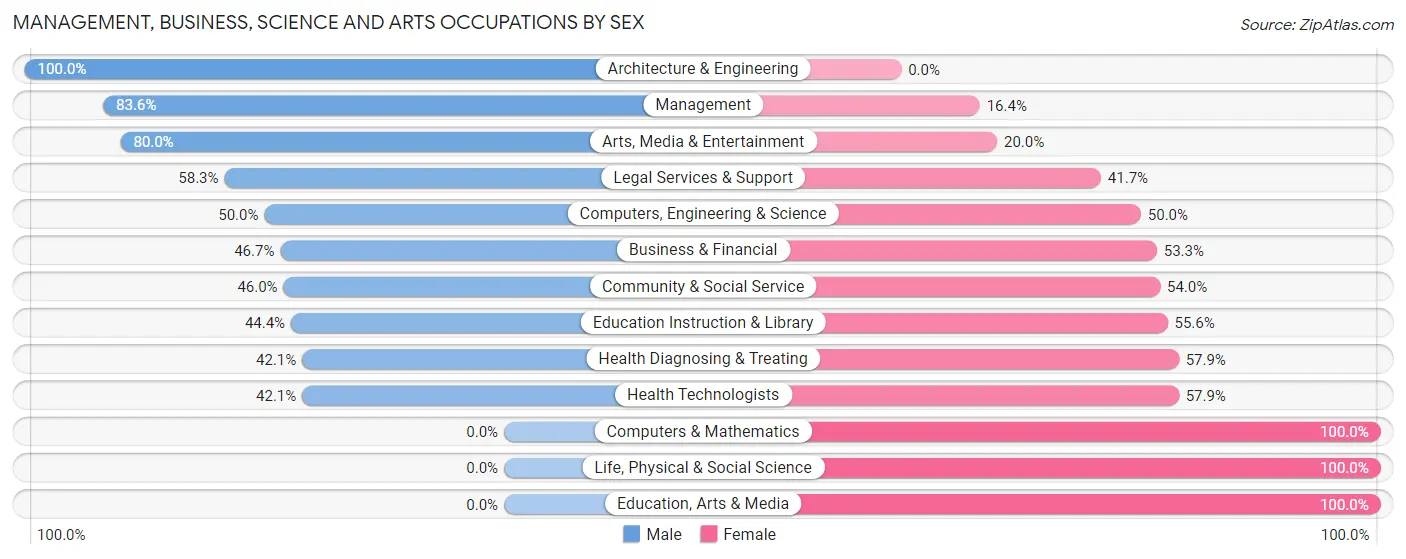
Management, Business, Science and Arts Occupations by Sex
Within the Management, Business, Science and Arts occupations in Green Spring, the most male-oriented occupations are Architecture & Engineering (100.0%), Management (83.6%), and Arts, Media & Entertainment (80.0%), while the most female-oriented occupations are Computers & Mathematics (100.0%), Life, Physical & Social Science (100.0%), and Education, Arts & Media (100.0%).
| Occupation | Male | Female |
| Management | 51 (83.6%) | 10 (16.4%) |
| Business & Financial | 7 (46.7%) | 8 (53.3%) |
| Computers, Engineering & Science | 4 (50.0%) | 4 (50.0%) |
| Computers & Mathematics | 0 (0.0%) | 3 (100.0%) |
| Architecture & Engineering | 4 (100.0%) | 0 (0.0%) |
| Life, Physical & Social Science | 0 (0.0%) | 1 (100.0%) |
| Community & Social Service | 23 (46.0%) | 27 (54.0%) |
| Education, Arts & Media | 0 (0.0%) | 10 (100.0%) |
| Legal Services & Support | 7 (58.3%) | 5 (41.7%) |
| Education Instruction & Library | 8 (44.4%) | 10 (55.6%) |
| Arts, Media & Entertainment | 8 (80.0%) | 2 (20.0%) |
| Health Diagnosing & Treating | 8 (42.1%) | 11 (57.9%) |
| Health Technologists | 8 (42.1%) | 11 (57.9%) |
| Total (Category) | 93 (60.8%) | 60 (39.2%) |
| Total (Overall) | 141 (52.2%) | 129 (47.8%) |
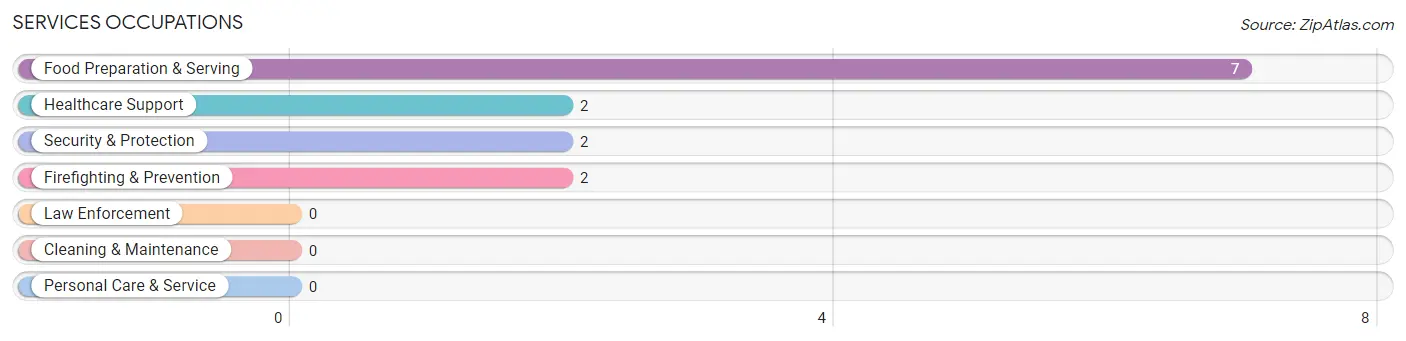
Services Occupations
The most common Services occupations in Green Spring are Food Preparation & Serving (7 | 2.6%), Healthcare Support (2 | 0.7%), Security & Protection (2 | 0.7%), and Firefighting & Prevention (2 | 0.7%).
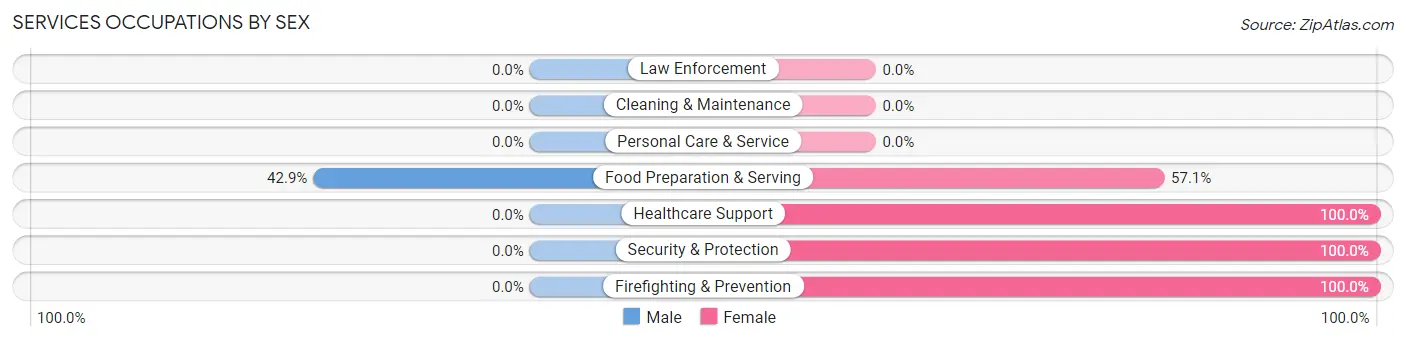
Services Occupations by Sex
| Occupation | Male | Female |
| Healthcare Support | 0 (0.0%) | 2 (100.0%) |
| Security & Protection | 0 (0.0%) | 2 (100.0%) |
| Firefighting & Prevention | 0 (0.0%) | 2 (100.0%) |
| Law Enforcement | 0 (0.0%) | 0 (0.0%) |
| Food Preparation & Serving | 3 (42.9%) | 4 (57.1%) |
| Cleaning & Maintenance | 0 (0.0%) | 0 (0.0%) |
| Personal Care & Service | 0 (0.0%) | 0 (0.0%) |
| Total (Category) | 3 (27.3%) | 8 (72.7%) |
| Total (Overall) | 141 (52.2%) | 129 (47.8%) |
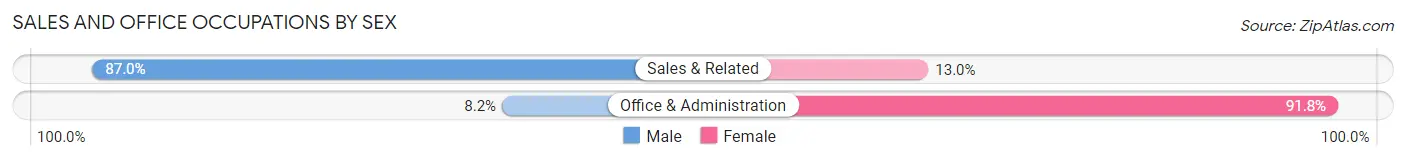
Sales and Office Occupations
The most common Sales and Office occupations in Green Spring are Office & Administration (61 | 22.6%), and Sales & Related (23 | 8.5%).

Sales and Office Occupations by Sex
| Occupation | Male | Female |
| Sales & Related | 20 (87.0%) | 3 (13.0%) |
| Office & Administration | 5 (8.2%) | 56 (91.8%) |
| Total (Category) | 25 (29.8%) | 59 (70.2%) |
| Total (Overall) | 141 (52.2%) | 129 (47.8%) |
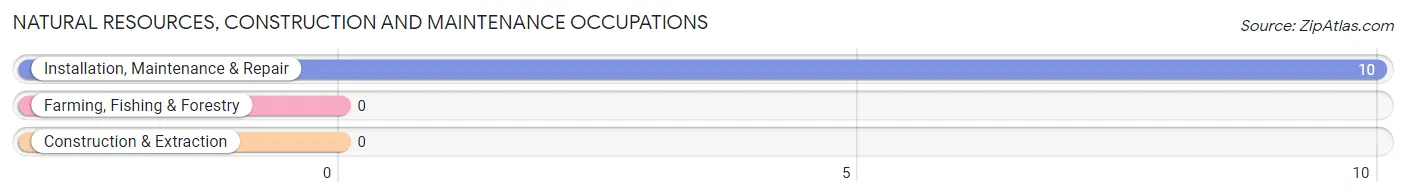
Natural Resources, Construction and Maintenance Occupations
The most common Natural Resources, Construction and Maintenance occupations in Green Spring are , and Installation, Maintenance & Repair (10 | 3.7%).
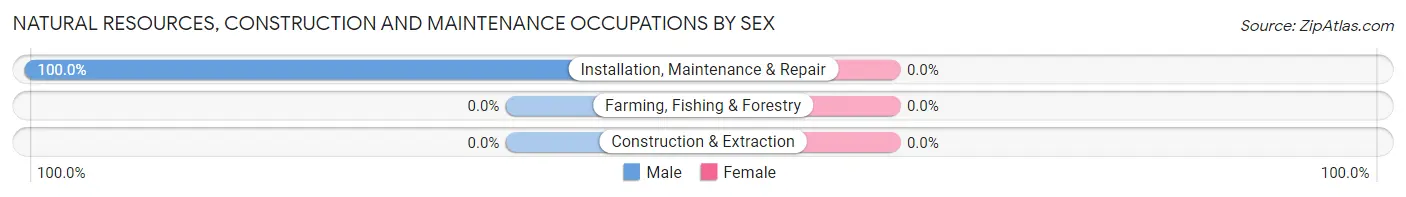
Natural Resources, Construction and Maintenance Occupations by Sex
| Occupation | Male | Female |
| Farming, Fishing & Forestry | 0 (0.0%) | 0 (0.0%) |
| Construction & Extraction | 0 (0.0%) | 0 (0.0%) |
| Installation, Maintenance & Repair | 10 (100.0%) | 0 (0.0%) |
| Total (Category) | 10 (100.0%) | 0 (0.0%) |
| Total (Overall) | 141 (52.2%) | 129 (47.8%) |
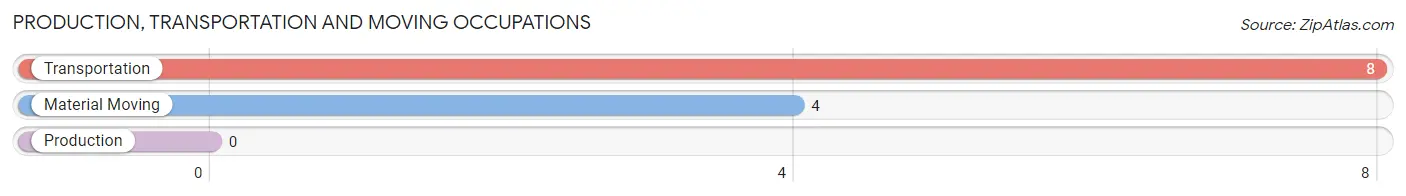
Production, Transportation and Moving Occupations
The most common Production, Transportation and Moving occupations in Green Spring are Transportation (8 | 3.0%), and Material Moving (4 | 1.5%).
Production, Transportation and Moving Occupations by Sex
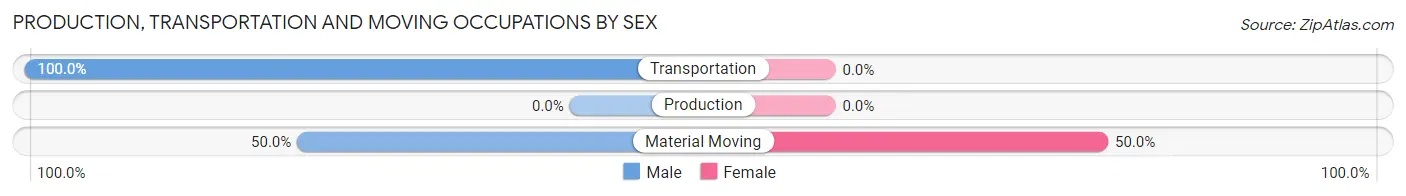
| Occupation | Male | Female |
| Production | 0 (0.0%) | 0 (0.0%) |
| Transportation | 8 (100.0%) | 0 (0.0%) |
| Material Moving | 2 (50.0%) | 2 (50.0%) |
| Total (Category) | 10 (83.3%) | 2 (16.7%) |
| Total (Overall) | 141 (52.2%) | 129 (47.8%) |
Employment Industries by Sex in Green Spring
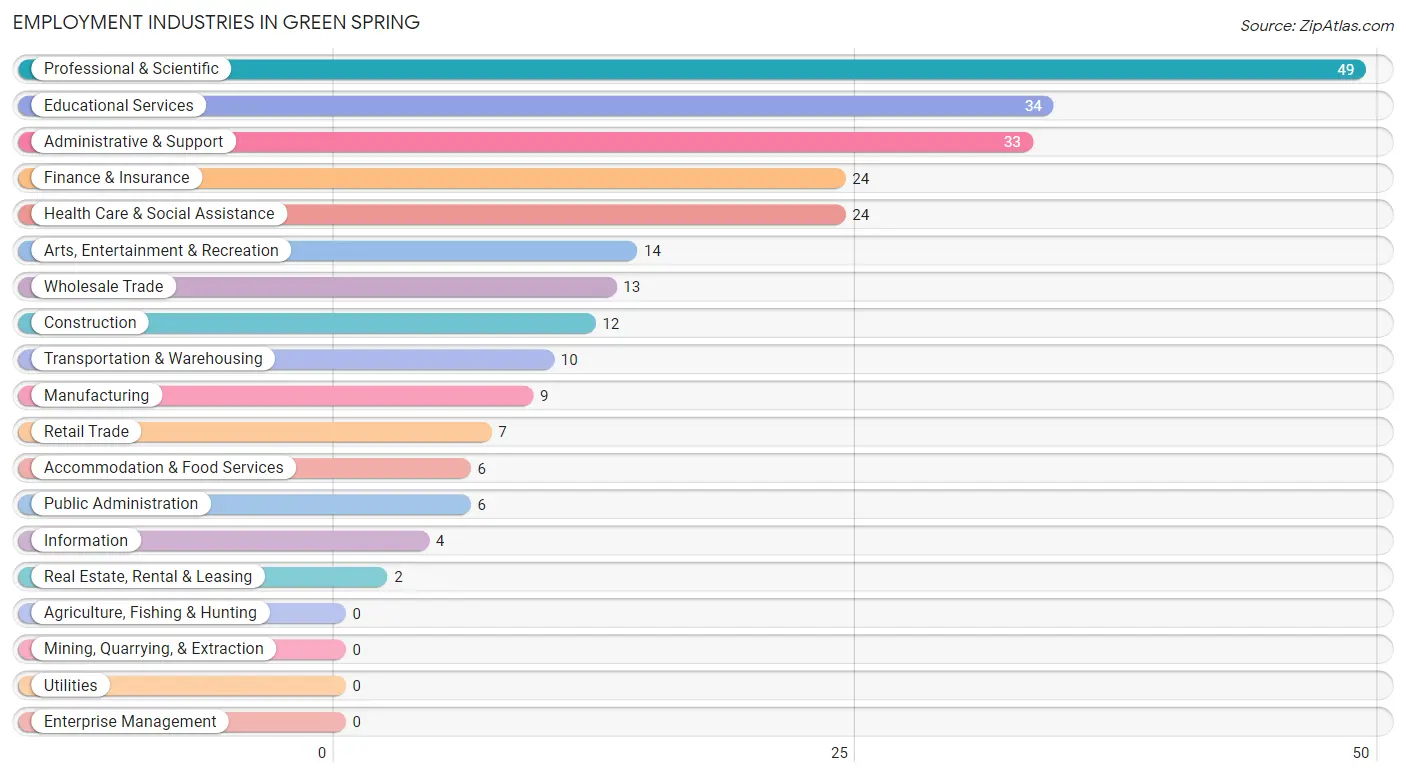
Employment Industries in Green Spring
The major employment industries in Green Spring include Professional & Scientific (49 | 18.1%), Educational Services (34 | 12.6%), Administrative & Support (33 | 12.2%), Finance & Insurance (24 | 8.9%), and Health Care & Social Assistance (24 | 8.9%).
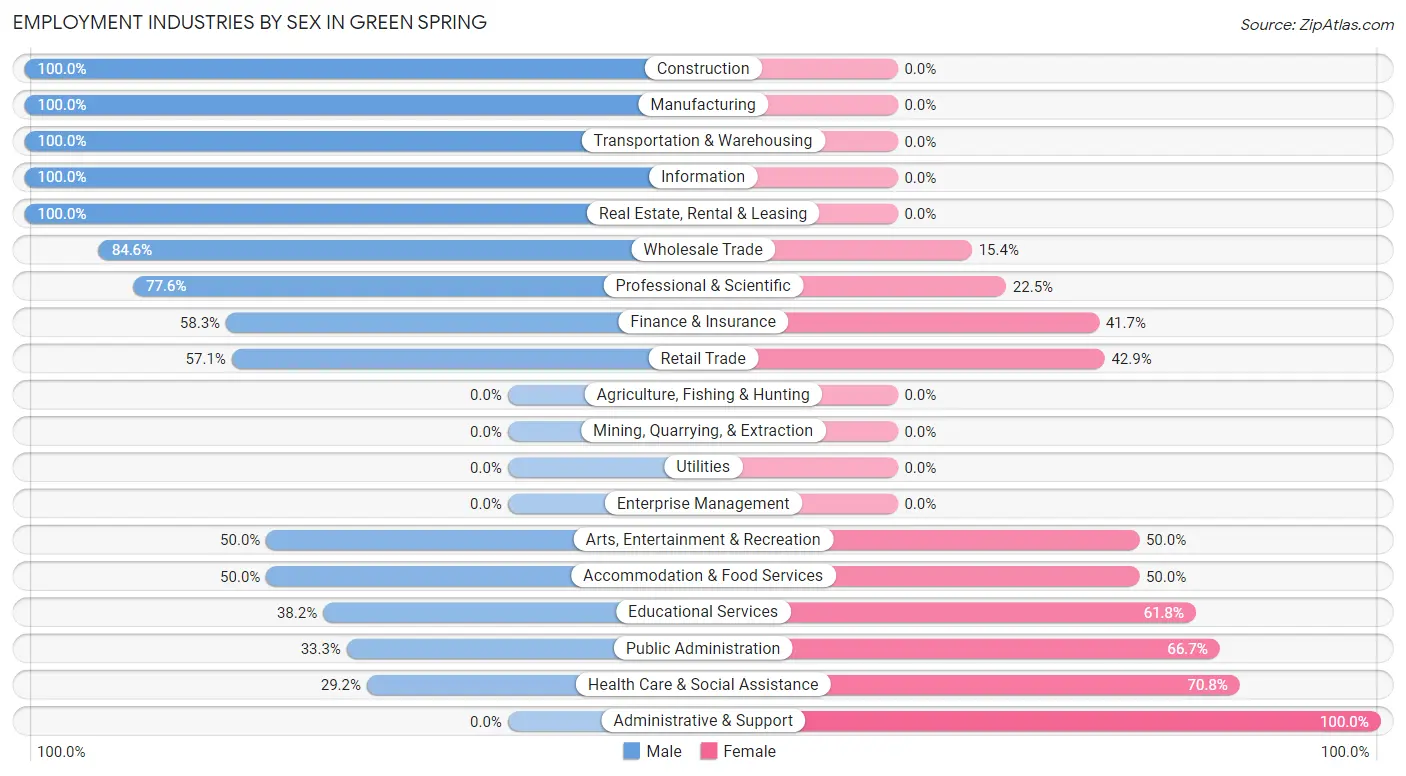
Employment Industries by Sex in Green Spring
The Green Spring industries that see more men than women are Construction (100.0%), Manufacturing (100.0%), and Transportation & Warehousing (100.0%), whereas the industries that tend to have a higher number of women are Administrative & Support (100.0%), Health Care & Social Assistance (70.8%), and Public Administration (66.7%).
| Industry | Male | Female |
| Agriculture, Fishing & Hunting | 0 (0.0%) | 0 (0.0%) |
| Mining, Quarrying, & Extraction | 0 (0.0%) | 0 (0.0%) |
| Construction | 12 (100.0%) | 0 (0.0%) |
| Manufacturing | 9 (100.0%) | 0 (0.0%) |
| Wholesale Trade | 11 (84.6%) | 2 (15.4%) |
| Retail Trade | 4 (57.1%) | 3 (42.9%) |
| Transportation & Warehousing | 10 (100.0%) | 0 (0.0%) |
| Utilities | 0 (0.0%) | 0 (0.0%) |
| Information | 4 (100.0%) | 0 (0.0%) |
| Finance & Insurance | 14 (58.3%) | 10 (41.7%) |
| Real Estate, Rental & Leasing | 2 (100.0%) | 0 (0.0%) |
| Professional & Scientific | 38 (77.5%) | 11 (22.5%) |
| Enterprise Management | 0 (0.0%) | 0 (0.0%) |
| Administrative & Support | 0 (0.0%) | 33 (100.0%) |
| Educational Services | 13 (38.2%) | 21 (61.8%) |
| Health Care & Social Assistance | 7 (29.2%) | 17 (70.8%) |
| Arts, Entertainment & Recreation | 7 (50.0%) | 7 (50.0%) |
| Accommodation & Food Services | 3 (50.0%) | 3 (50.0%) |
| Public Administration | 2 (33.3%) | 4 (66.7%) |
| Total | 141 (52.2%) | 129 (47.8%) |
Education in Green Spring
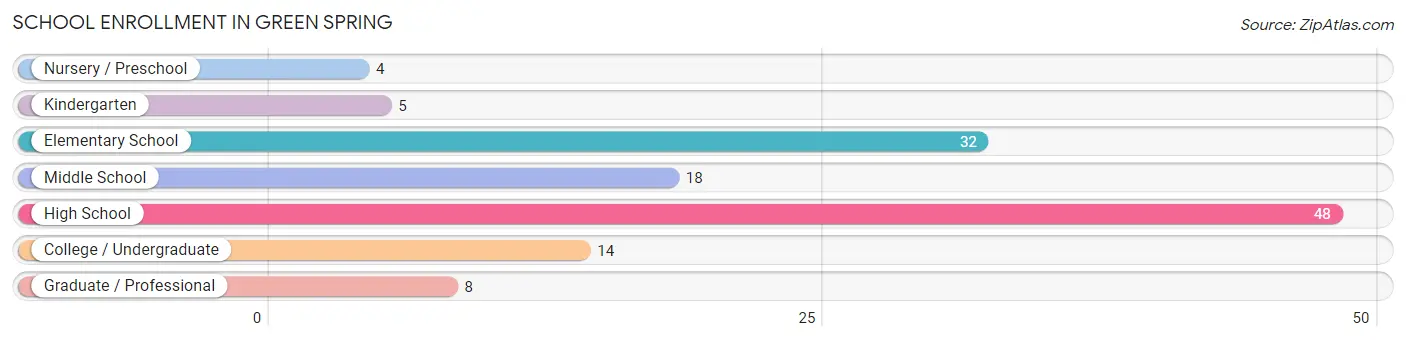
School Enrollment in Green Spring
The most common levels of schooling among the 129 students in Green Spring are high school (48 | 37.2%), elementary school (32 | 24.8%), and middle school (18 | 14.0%).
| School Level | # Students | % Students |
| Nursery / Preschool | 4 | 3.1% |
| Kindergarten | 5 | 3.9% |
| Elementary School | 32 | 24.8% |
| Middle School | 18 | 14.0% |
| High School | 48 | 37.2% |
| College / Undergraduate | 14 | 10.8% |
| Graduate / Professional | 8 | 6.2% |
| Total | 129 | 100.0% |
School Enrollment by Age by Funding Source in Green Spring
Out of a total of 129 students who are enrolled in schools in Green Spring, 80 (62.0%) attend a private institution, while the remaining 49 (38.0%) are enrolled in public schools. The age group of 18 to 19 year olds has the highest likelihood of being enrolled in private schools, with 29 (90.6% in the age bracket) enrolled. Conversely, the age group of 3 to 4 year olds has the lowest likelihood of being enrolled in a private school, with 2 (100.0% in the age bracket) attending a public institution.
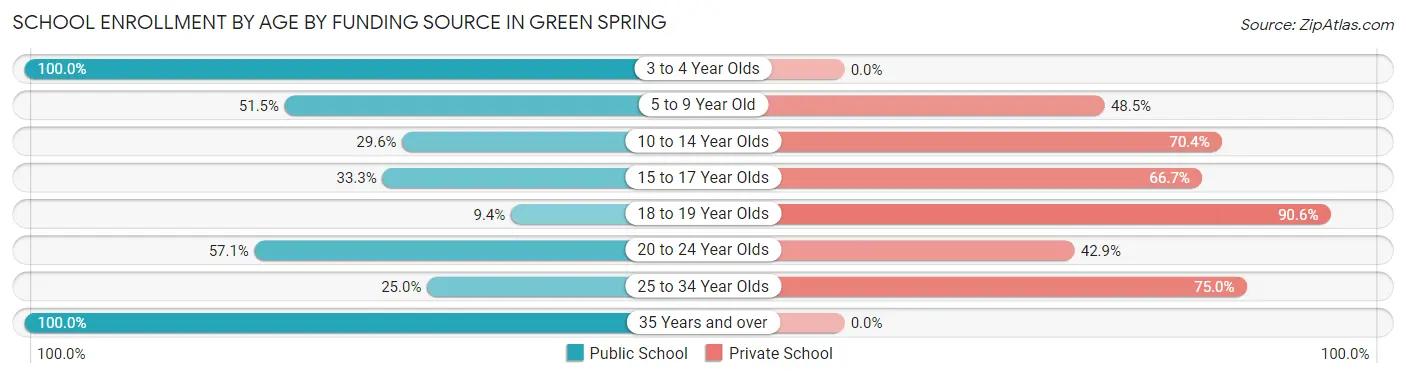
| Age Bracket | Public School | Private School |
| 3 to 4 Year Olds | 2 (100.0%) | 0 (0.0%) |
| 5 to 9 Year Old | 17 (51.5%) | 16 (48.5%) |
| 10 to 14 Year Olds | 8 (29.6%) | 19 (70.4%) |
| 15 to 17 Year Olds | 5 (33.3%) | 10 (66.7%) |
| 18 to 19 Year Olds | 3 (9.4%) | 29 (90.6%) |
| 20 to 24 Year Olds | 4 (57.1%) | 3 (42.9%) |
| 25 to 34 Year Olds | 1 (25.0%) | 3 (75.0%) |
| 35 Years and over | 9 (100.0%) | 0 (0.0%) |
| Total | 49 (38.0%) | 80 (62.0%) |
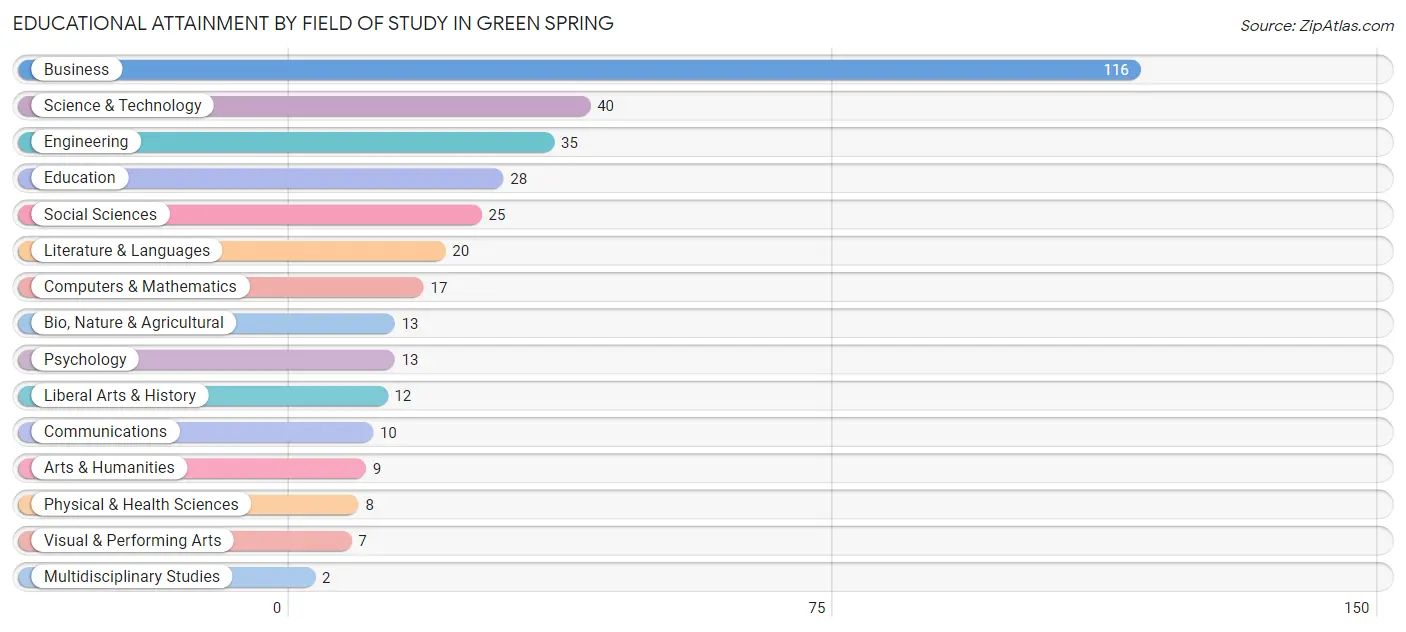
Educational Attainment by Field of Study in Green Spring
Business (116 | 32.7%), science & technology (40 | 11.3%), engineering (35 | 9.9%), education (28 | 7.9%), and social sciences (25 | 7.0%) are the most common fields of study among 355 individuals in Green Spring who have obtained a bachelor's degree or higher.
| Field of Study | # Graduates | % Graduates |
| Computers & Mathematics | 17 | 4.8% |
| Bio, Nature & Agricultural | 13 | 3.7% |
| Physical & Health Sciences | 8 | 2.2% |
| Psychology | 13 | 3.7% |
| Social Sciences | 25 | 7.0% |
| Engineering | 35 | 9.9% |
| Multidisciplinary Studies | 2 | 0.6% |
| Science & Technology | 40 | 11.3% |
| Business | 116 | 32.7% |
| Education | 28 | 7.9% |
| Literature & Languages | 20 | 5.6% |
| Liberal Arts & History | 12 | 3.4% |
| Visual & Performing Arts | 7 | 2.0% |
| Communications | 10 | 2.8% |
| Arts & Humanities | 9 | 2.5% |
| Total | 355 | 100.0% |
Transportation & Commute in Green Spring
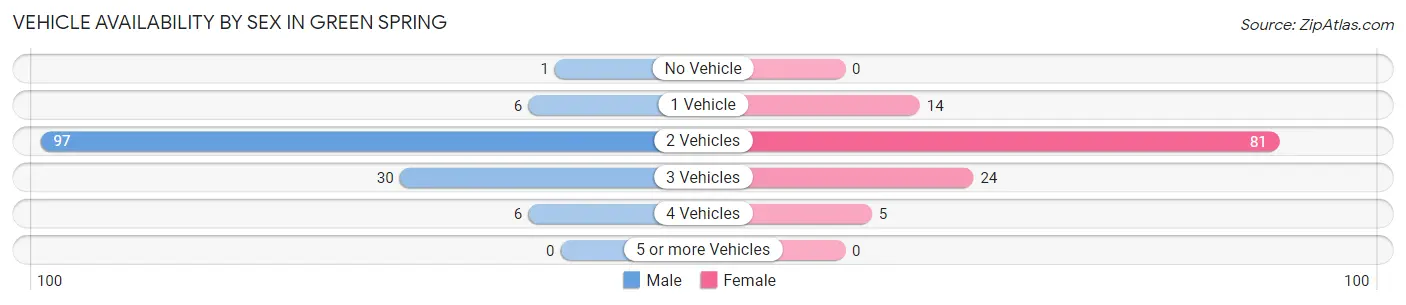
Vehicle Availability by Sex in Green Spring
The most prevalent vehicle ownership categories in Green Spring are males with 2 vehicles (97, accounting for 69.3%) and females with 2 vehicles (81, making up 78.2%).
| Vehicles Available | Male | Female |
| No Vehicle | 1 (0.7%) | 0 (0.0%) |
| 1 Vehicle | 6 (4.3%) | 14 (11.3%) |
| 2 Vehicles | 97 (69.3%) | 81 (65.3%) |
| 3 Vehicles | 30 (21.4%) | 24 (19.4%) |
| 4 Vehicles | 6 (4.3%) | 5 (4.0%) |
| 5 or more Vehicles | 0 (0.0%) | 0 (0.0%) |
| Total | 140 (100.0%) | 124 (100.0%) |
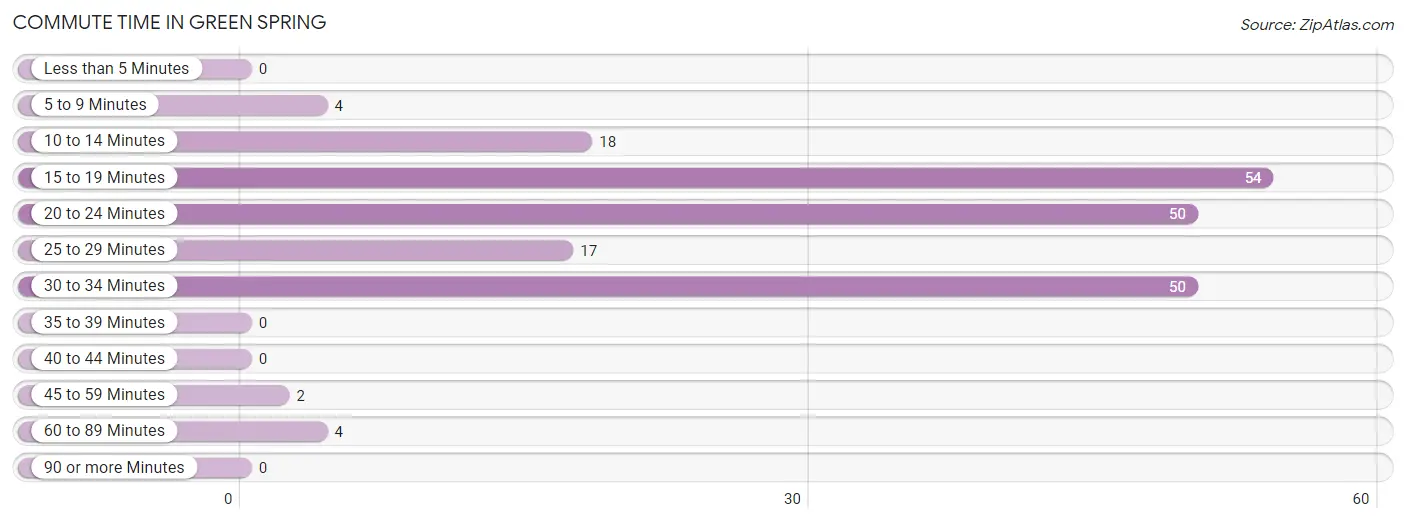
Commute Time in Green Spring
The most frequently occuring commute durations in Green Spring are 15 to 19 minutes (54 commuters, 27.1%), 20 to 24 minutes (50 commuters, 25.1%), and 30 to 34 minutes (50 commuters, 25.1%).
| Commute Time | # Commuters | % Commuters |
| Less than 5 Minutes | 0 | 0.0% |
| 5 to 9 Minutes | 4 | 2.0% |
| 10 to 14 Minutes | 18 | 9.0% |
| 15 to 19 Minutes | 54 | 27.1% |
| 20 to 24 Minutes | 50 | 25.1% |
| 25 to 29 Minutes | 17 | 8.5% |
| 30 to 34 Minutes | 50 | 25.1% |
| 35 to 39 Minutes | 0 | 0.0% |
| 40 to 44 Minutes | 0 | 0.0% |
| 45 to 59 Minutes | 2 | 1.0% |
| 60 to 89 Minutes | 4 | 2.0% |
| 90 or more Minutes | 0 | 0.0% |
Commute Time by Sex in Green Spring
The most common commute times in Green Spring are 30 to 34 minutes (35 commuters, 30.2%) for males and 15 to 19 minutes (24 commuters, 28.9%) for females.
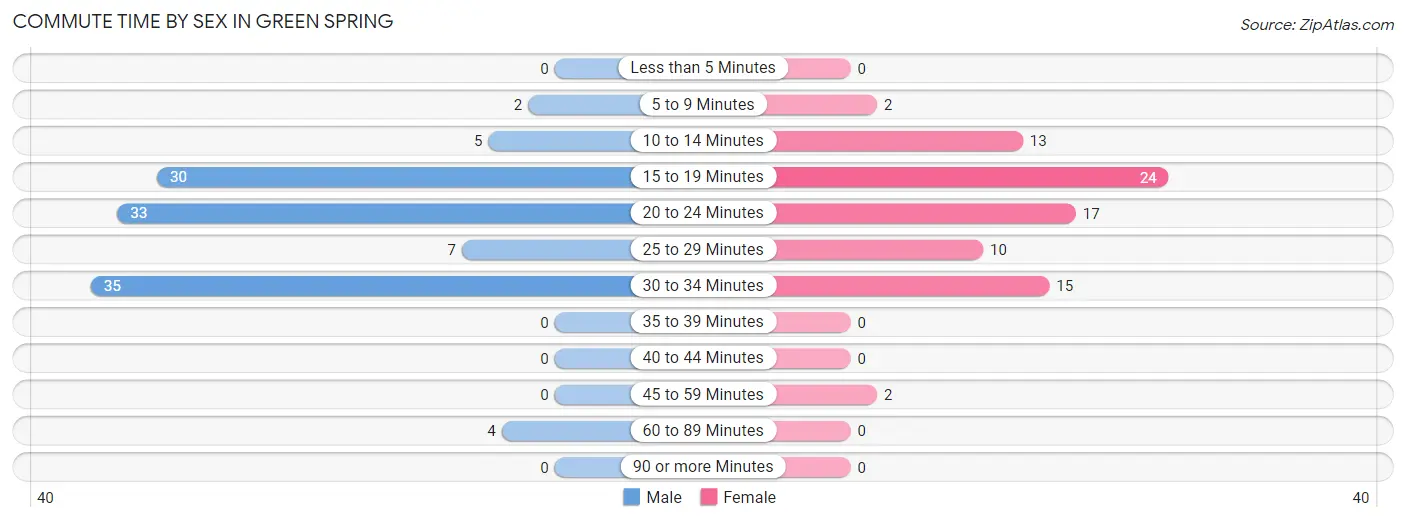
| Commute Time | Male | Female |
| Less than 5 Minutes | 0 (0.0%) | 0 (0.0%) |
| 5 to 9 Minutes | 2 (1.7%) | 2 (2.4%) |
| 10 to 14 Minutes | 5 (4.3%) | 13 (15.7%) |
| 15 to 19 Minutes | 30 (25.9%) | 24 (28.9%) |
| 20 to 24 Minutes | 33 (28.4%) | 17 (20.5%) |
| 25 to 29 Minutes | 7 (6.0%) | 10 (12.0%) |
| 30 to 34 Minutes | 35 (30.2%) | 15 (18.1%) |
| 35 to 39 Minutes | 0 (0.0%) | 0 (0.0%) |
| 40 to 44 Minutes | 0 (0.0%) | 0 (0.0%) |
| 45 to 59 Minutes | 0 (0.0%) | 2 (2.4%) |
| 60 to 89 Minutes | 4 (3.5%) | 0 (0.0%) |
| 90 or more Minutes | 0 (0.0%) | 0 (0.0%) |
Time of Departure to Work by Sex in Green Spring
The most frequent times of departure to work in Green Spring are 6:30 AM to 6:59 AM (32, 27.6%) for males and 7:30 AM to 7:59 AM (23, 27.7%) for females.
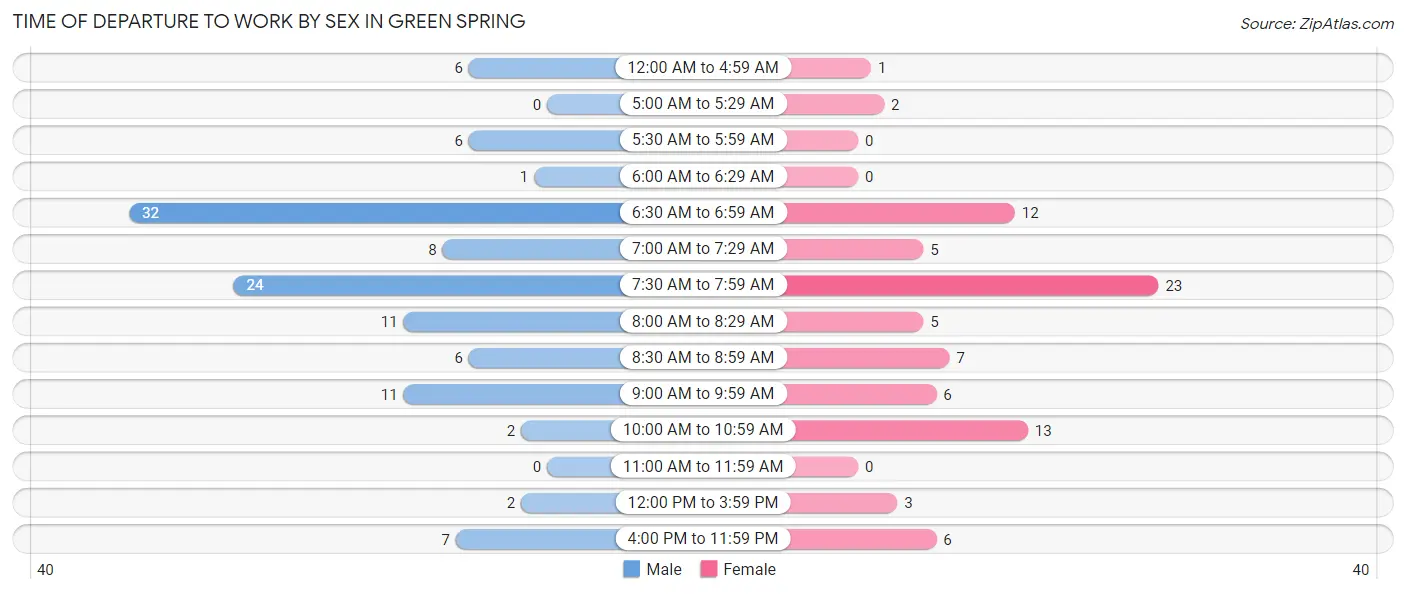
| Time of Departure | Male | Female |
| 12:00 AM to 4:59 AM | 6 (5.2%) | 1 (1.2%) |
| 5:00 AM to 5:29 AM | 0 (0.0%) | 2 (2.4%) |
| 5:30 AM to 5:59 AM | 6 (5.2%) | 0 (0.0%) |
| 6:00 AM to 6:29 AM | 1 (0.9%) | 0 (0.0%) |
| 6:30 AM to 6:59 AM | 32 (27.6%) | 12 (14.5%) |
| 7:00 AM to 7:29 AM | 8 (6.9%) | 5 (6.0%) |
| 7:30 AM to 7:59 AM | 24 (20.7%) | 23 (27.7%) |
| 8:00 AM to 8:29 AM | 11 (9.5%) | 5 (6.0%) |
| 8:30 AM to 8:59 AM | 6 (5.2%) | 7 (8.4%) |
| 9:00 AM to 9:59 AM | 11 (9.5%) | 6 (7.2%) |
| 10:00 AM to 10:59 AM | 2 (1.7%) | 13 (15.7%) |
| 11:00 AM to 11:59 AM | 0 (0.0%) | 0 (0.0%) |
| 12:00 PM to 3:59 PM | 2 (1.7%) | 3 (3.6%) |
| 4:00 PM to 11:59 PM | 7 (6.0%) | 6 (7.2%) |
| Total | 116 (100.0%) | 83 (100.0%) |
Housing Occupancy in Green Spring
Occupancy by Ownership in Green Spring
Of the total 227 dwellings in Green Spring, owner-occupied units account for 187 (82.4%), while renter-occupied units make up 40 (17.6%).
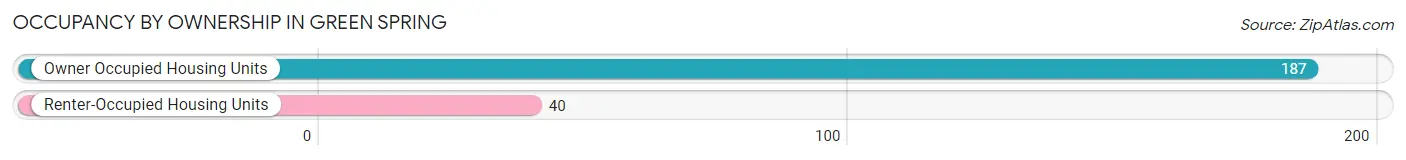
| Occupancy | # Housing Units | % Housing Units |
| Owner Occupied Housing Units | 187 | 82.4% |
| Renter-Occupied Housing Units | 40 | 17.6% |
| Total Occupied Housing Units | 227 | 100.0% |
Occupancy by Household Size in Green Spring
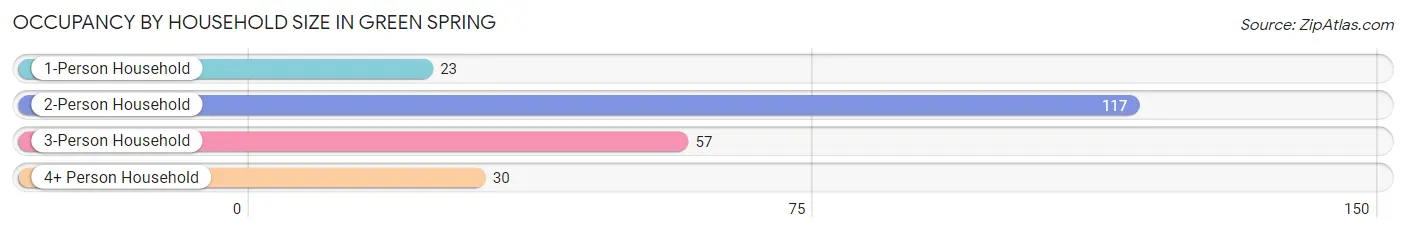
| Household Size | # Housing Units | % Housing Units |
| 1-Person Household | 23 | 10.1% |
| 2-Person Household | 117 | 51.5% |
| 3-Person Household | 57 | 25.1% |
| 4+ Person Household | 30 | 13.2% |
| Total Housing Units | 227 | 100.0% |
Occupancy by Ownership by Household Size in Green Spring
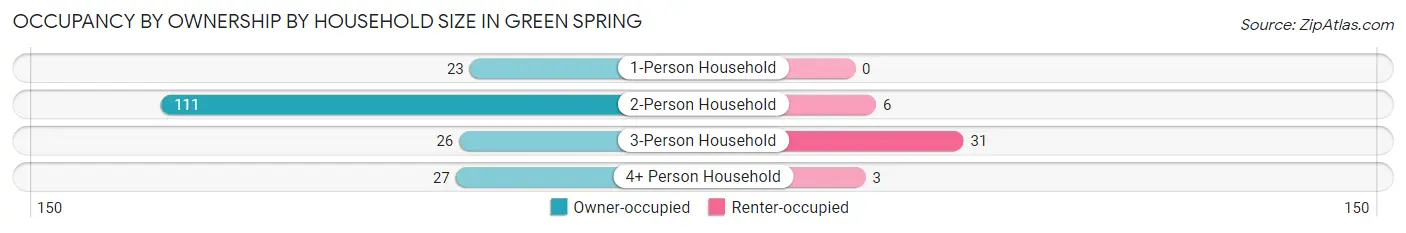
| Household Size | Owner-occupied | Renter-occupied |
| 1-Person Household | 23 (100.0%) | 0 (0.0%) |
| 2-Person Household | 111 (94.9%) | 6 (5.1%) |
| 3-Person Household | 26 (45.6%) | 31 (54.4%) |
| 4+ Person Household | 27 (90.0%) | 3 (10.0%) |
| Total Housing Units | 187 (82.4%) | 40 (17.6%) |
Occupancy by Educational Attainment in Green Spring
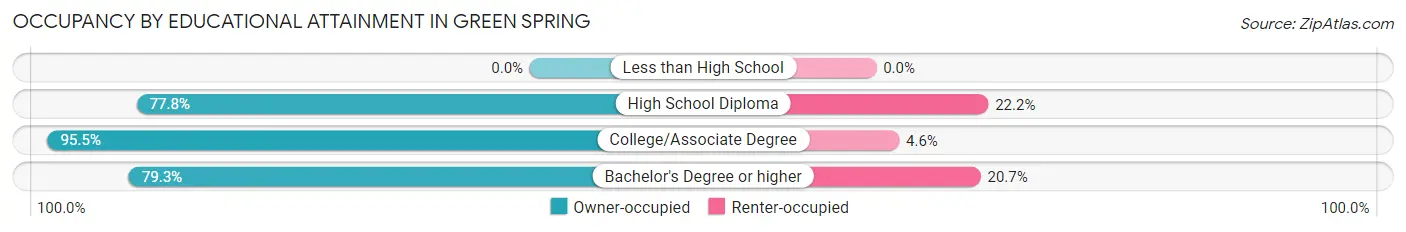
| Household Size | Owner-occupied | Renter-occupied |
| Less than High School | 0 (0.0%) | 0 (0.0%) |
| High School Diploma | 7 (77.8%) | 2 (22.2%) |
| College/Associate Degree | 42 (95.5%) | 2 (4.5%) |
| Bachelor's Degree or higher | 138 (79.3%) | 36 (20.7%) |
Occupancy by Age of Householder in Green Spring
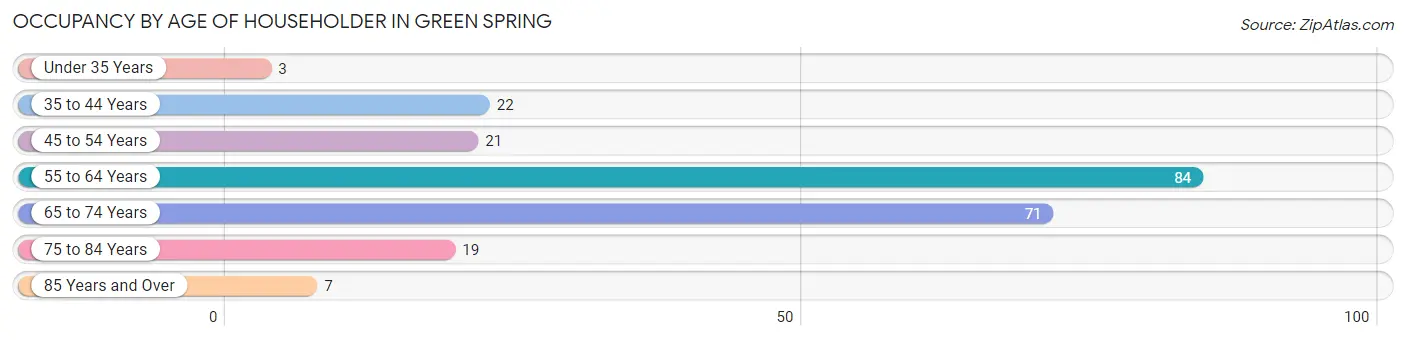
| Age Bracket | # Households | % Households |
| Under 35 Years | 3 | 1.3% |
| 35 to 44 Years | 22 | 9.7% |
| 45 to 54 Years | 21 | 9.2% |
| 55 to 64 Years | 84 | 37.0% |
| 65 to 74 Years | 71 | 31.3% |
| 75 to 84 Years | 19 | 8.4% |
| 85 Years and Over | 7 | 3.1% |
| Total | 227 | 100.0% |
Housing Finances in Green Spring
Median Income by Occupancy in Green Spring
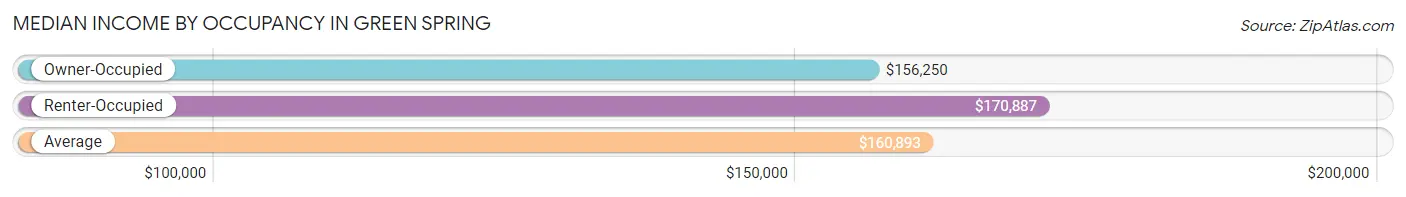
| Occupancy Type | # Households | Median Income |
| Owner-Occupied | 187 (82.4%) | $156,250 |
| Renter-Occupied | 40 (17.6%) | $170,887 |
| Average | 227 (100.0%) | $160,893 |
Occupancy by Householder Income Bracket in Green Spring
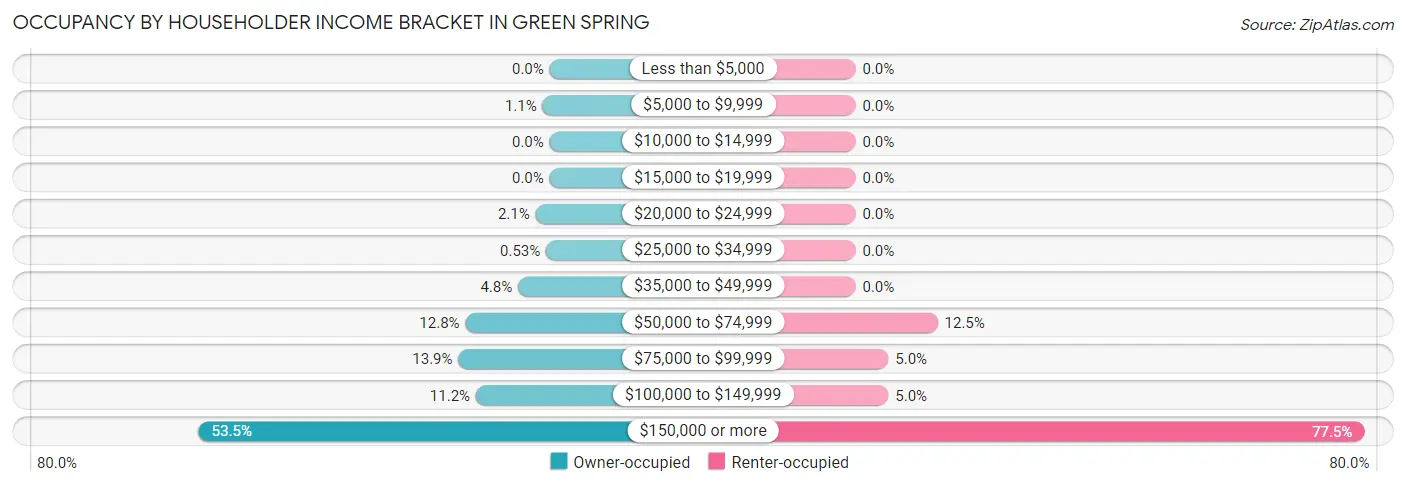
| Income Bracket | Owner-occupied | Renter-occupied |
| Less than $5,000 | 0 (0.0%) | 0 (0.0%) |
| $5,000 to $9,999 | 2 (1.1%) | 0 (0.0%) |
| $10,000 to $14,999 | 0 (0.0%) | 0 (0.0%) |
| $15,000 to $19,999 | 0 (0.0%) | 0 (0.0%) |
| $20,000 to $24,999 | 4 (2.1%) | 0 (0.0%) |
| $25,000 to $34,999 | 1 (0.5%) | 0 (0.0%) |
| $35,000 to $49,999 | 9 (4.8%) | 0 (0.0%) |
| $50,000 to $74,999 | 24 (12.8%) | 5 (12.5%) |
| $75,000 to $99,999 | 26 (13.9%) | 2 (5.0%) |
| $100,000 to $149,999 | 21 (11.2%) | 2 (5.0%) |
| $150,000 or more | 100 (53.5%) | 31 (77.5%) |
| Total | 187 (100.0%) | 40 (100.0%) |
Monthly Housing Cost Tiers in Green Spring
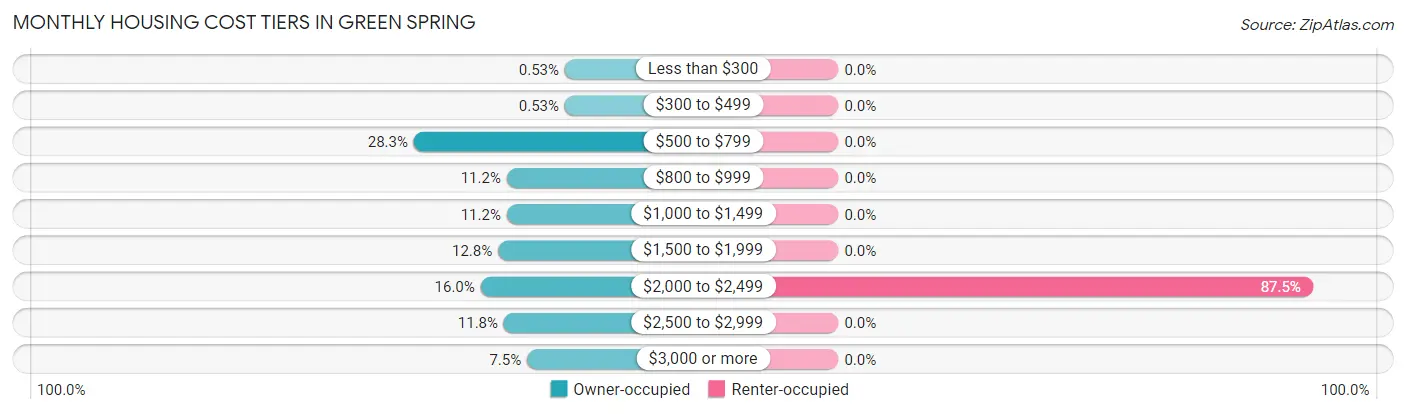
| Monthly Cost | Owner-occupied | Renter-occupied |
| Less than $300 | 1 (0.5%) | 0 (0.0%) |
| $300 to $499 | 1 (0.5%) | 0 (0.0%) |
| $500 to $799 | 53 (28.3%) | 0 (0.0%) |
| $800 to $999 | 21 (11.2%) | 0 (0.0%) |
| $1,000 to $1,499 | 21 (11.2%) | 0 (0.0%) |
| $1,500 to $1,999 | 24 (12.8%) | 0 (0.0%) |
| $2,000 to $2,499 | 30 (16.0%) | 35 (87.5%) |
| $2,500 to $2,999 | 22 (11.8%) | 0 (0.0%) |
| $3,000 or more | 14 (7.5%) | 0 (0.0%) |
| Total | 187 (100.0%) | 40 (100.0%) |
Physical Housing Characteristics in Green Spring
Housing Structures in Green Spring
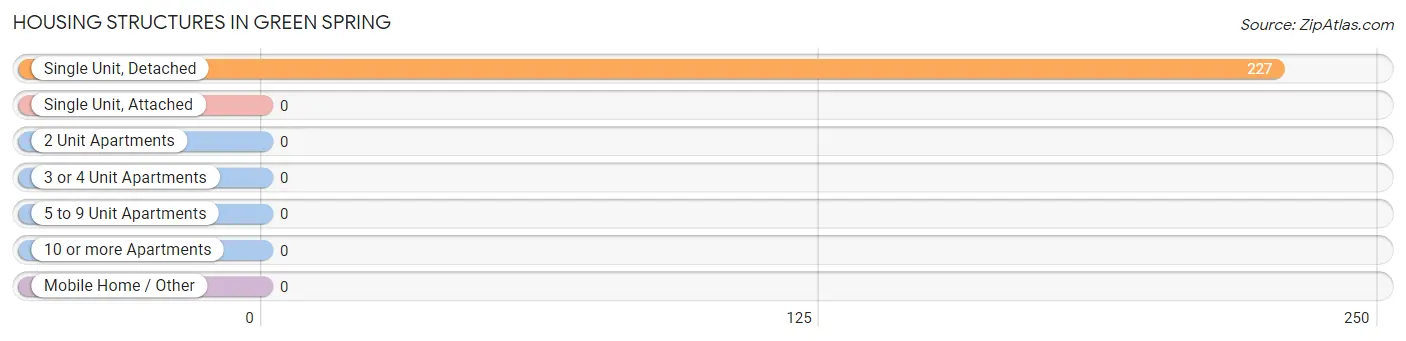
| Structure Type | # Housing Units | % Housing Units |
| Single Unit, Detached | 227 | 100.0% |
| Single Unit, Attached | 0 | 0.0% |
| 2 Unit Apartments | 0 | 0.0% |
| 3 or 4 Unit Apartments | 0 | 0.0% |
| 5 to 9 Unit Apartments | 0 | 0.0% |
| 10 or more Apartments | 0 | 0.0% |
| Mobile Home / Other | 0 | 0.0% |
| Total | 227 | 100.0% |
Housing Structures by Occupancy in Green Spring
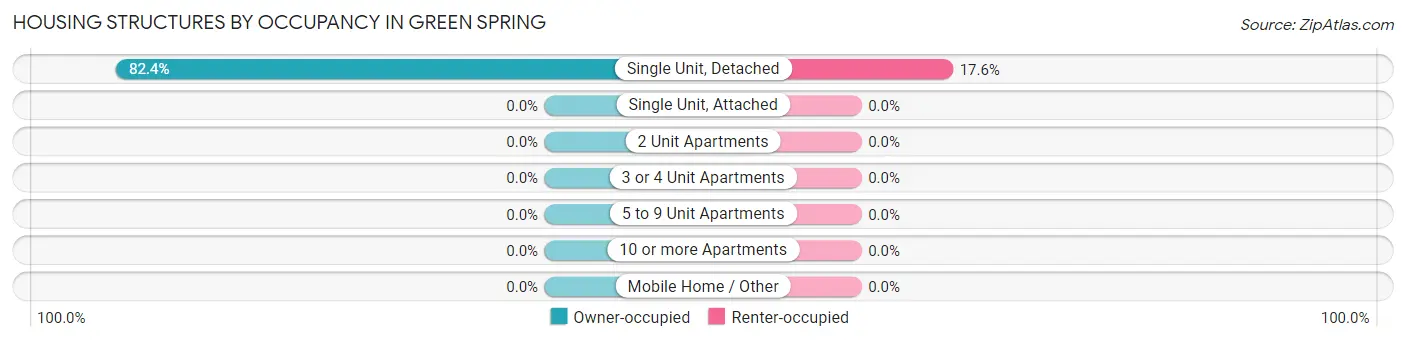
| Structure Type | Owner-occupied | Renter-occupied |
| Single Unit, Detached | 187 (82.4%) | 40 (17.6%) |
| Single Unit, Attached | 0 (0.0%) | 0 (0.0%) |
| 2 Unit Apartments | 0 (0.0%) | 0 (0.0%) |
| 3 or 4 Unit Apartments | 0 (0.0%) | 0 (0.0%) |
| 5 to 9 Unit Apartments | 0 (0.0%) | 0 (0.0%) |
| 10 or more Apartments | 0 (0.0%) | 0 (0.0%) |
| Mobile Home / Other | 0 (0.0%) | 0 (0.0%) |
| Total | 187 (82.4%) | 40 (17.6%) |
Housing Structures by Number of Rooms in Green Spring
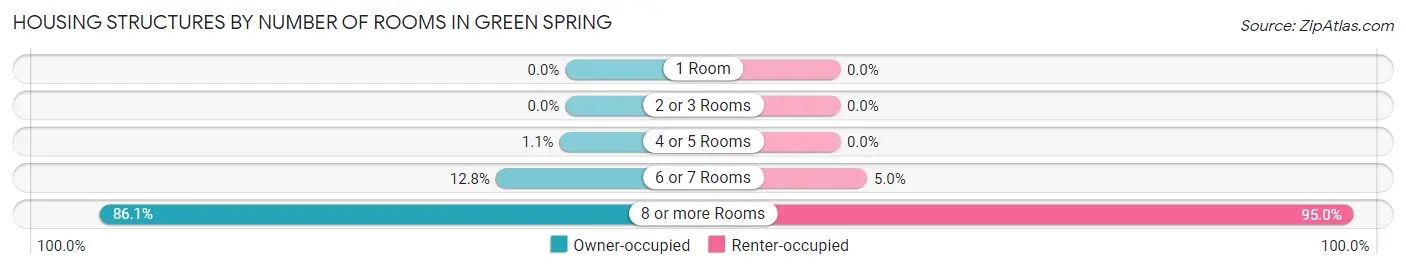
| Number of Rooms | Owner-occupied | Renter-occupied |
| 1 Room | 0 (0.0%) | 0 (0.0%) |
| 2 or 3 Rooms | 0 (0.0%) | 0 (0.0%) |
| 4 or 5 Rooms | 2 (1.1%) | 0 (0.0%) |
| 6 or 7 Rooms | 24 (12.8%) | 2 (5.0%) |
| 8 or more Rooms | 161 (86.1%) | 38 (95.0%) |
| Total | 187 (100.0%) | 40 (100.0%) |
Housing Structure by Heating Type in Green Spring
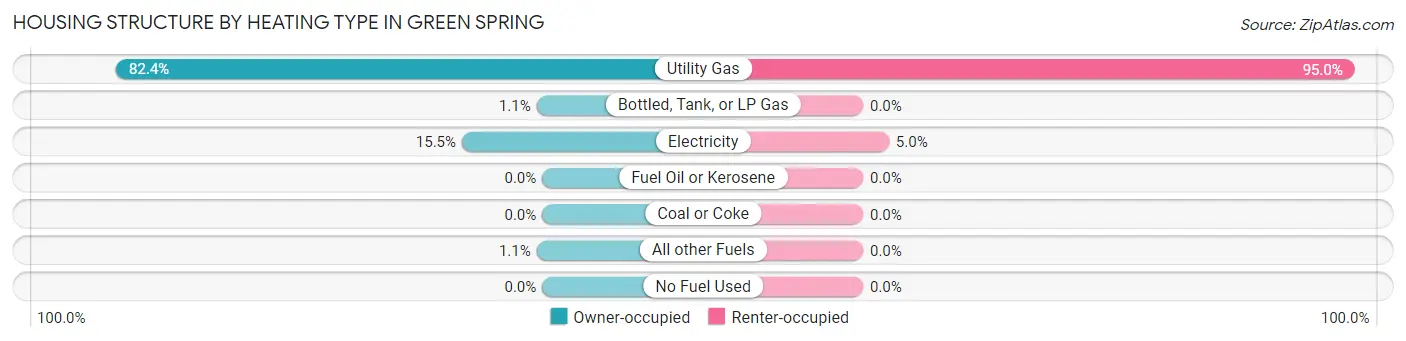
| Heating Type | Owner-occupied | Renter-occupied |
| Utility Gas | 154 (82.4%) | 38 (95.0%) |
| Bottled, Tank, or LP Gas | 2 (1.1%) | 0 (0.0%) |
| Electricity | 29 (15.5%) | 2 (5.0%) |
| Fuel Oil or Kerosene | 0 (0.0%) | 0 (0.0%) |
| Coal or Coke | 0 (0.0%) | 0 (0.0%) |
| All other Fuels | 2 (1.1%) | 0 (0.0%) |
| No Fuel Used | 0 (0.0%) | 0 (0.0%) |
| Total | 187 (100.0%) | 40 (100.0%) |
Household Vehicle Usage in Green Spring
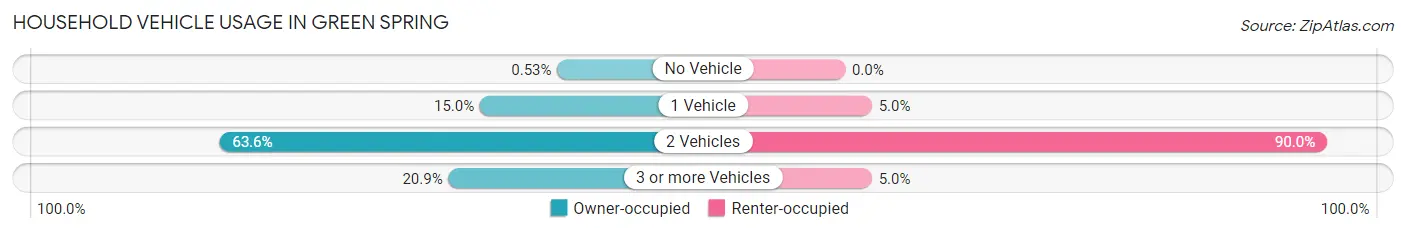
| Vehicles per Household | Owner-occupied | Renter-occupied |
| No Vehicle | 1 (0.5%) | 0 (0.0%) |
| 1 Vehicle | 28 (15.0%) | 2 (5.0%) |
| 2 Vehicles | 119 (63.6%) | 36 (90.0%) |
| 3 or more Vehicles | 39 (20.9%) | 2 (5.0%) |
| Total | 187 (100.0%) | 40 (100.0%) |
Real Estate & Mortgages in Green Spring
Real Estate and Mortgage Overview in Green Spring
| Characteristic | Without Mortgage | With Mortgage |
| Housing Units | 76 | 111 |
| Median Property Value | $380,000 | $364,900 |
| Median Household Income | $123,750 | $64 |
| Monthly Housing Costs | $738 | $14 |
| Real Estate Taxes | $3,696 | $0 |
Property Value by Mortgage Status in Green Spring
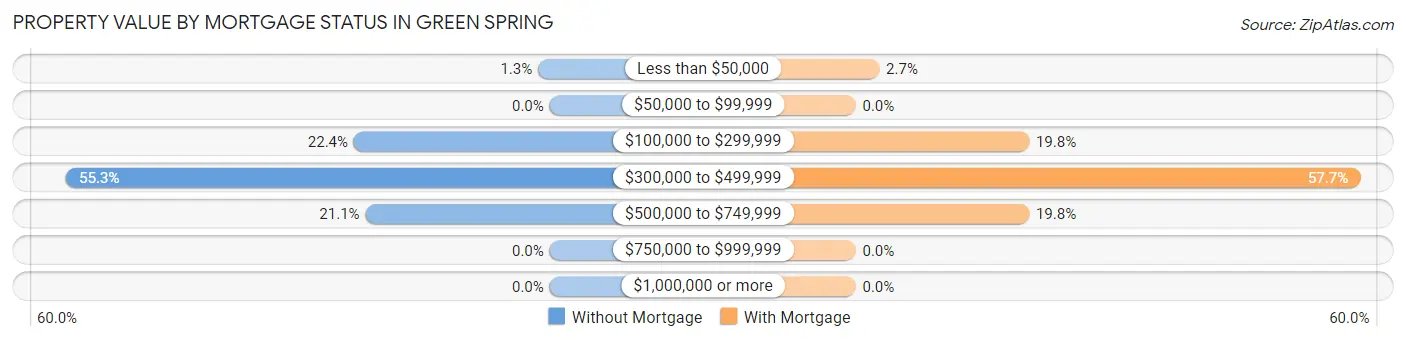
| Property Value | Without Mortgage | With Mortgage |
| Less than $50,000 | 1 (1.3%) | 3 (2.7%) |
| $50,000 to $99,999 | 0 (0.0%) | 0 (0.0%) |
| $100,000 to $299,999 | 17 (22.4%) | 22 (19.8%) |
| $300,000 to $499,999 | 42 (55.3%) | 64 (57.7%) |
| $500,000 to $749,999 | 16 (21.0%) | 22 (19.8%) |
| $750,000 to $999,999 | 0 (0.0%) | 0 (0.0%) |
| $1,000,000 or more | 0 (0.0%) | 0 (0.0%) |
| Total | 76 (100.0%) | 111 (100.0%) |
Household Income by Mortgage Status in Green Spring
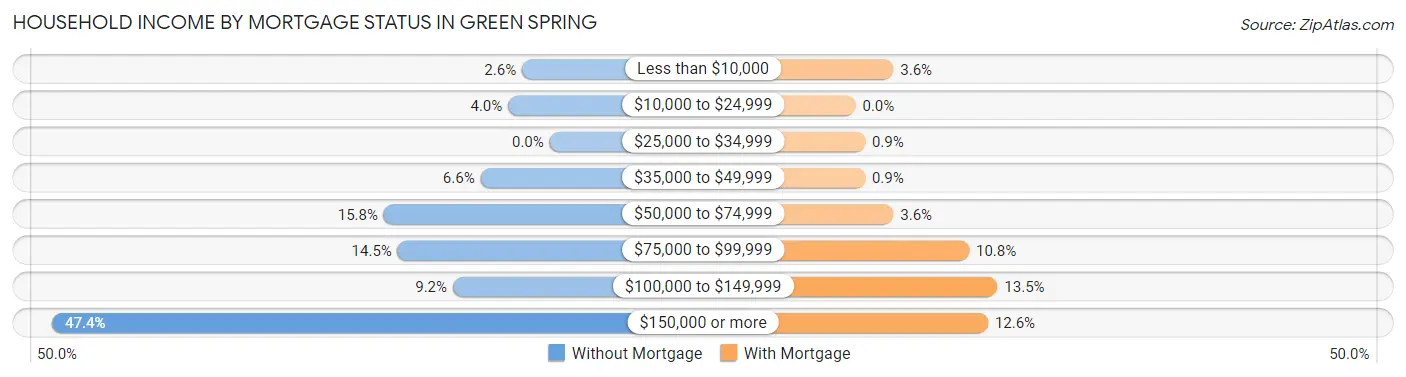
| Household Income | Without Mortgage | With Mortgage |
| Less than $10,000 | 2 (2.6%) | 4 (3.6%) |
| $10,000 to $24,999 | 3 (4.0%) | 0 (0.0%) |
| $25,000 to $34,999 | 0 (0.0%) | 1 (0.9%) |
| $35,000 to $49,999 | 5 (6.6%) | 1 (0.9%) |
| $50,000 to $74,999 | 12 (15.8%) | 4 (3.6%) |
| $75,000 to $99,999 | 11 (14.5%) | 12 (10.8%) |
| $100,000 to $149,999 | 7 (9.2%) | 15 (13.5%) |
| $150,000 or more | 36 (47.4%) | 14 (12.6%) |
| Total | 76 (100.0%) | 111 (100.0%) |
Property Value to Household Income Ratio in Green Spring
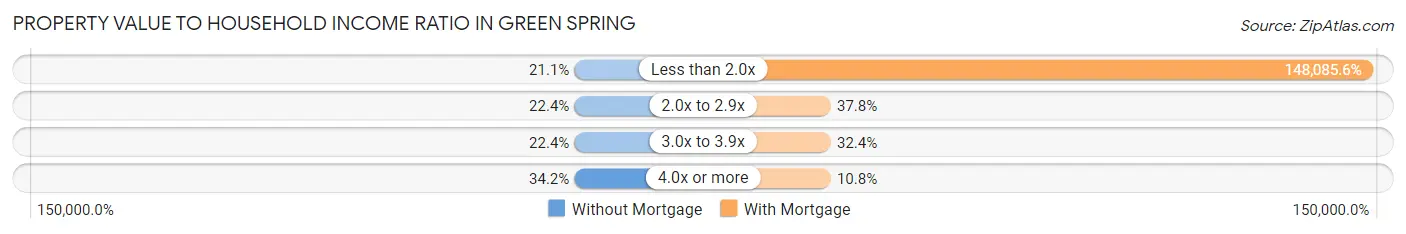
| Value-to-Income Ratio | Without Mortgage | With Mortgage |
| Less than 2.0x | 16 (21.0%) | 164,375 (148,085.6%) |
| 2.0x to 2.9x | 17 (22.4%) | 42 (37.8%) |
| 3.0x to 3.9x | 17 (22.4%) | 36 (32.4%) |
| 4.0x or more | 26 (34.2%) | 12 (10.8%) |
| Total | 76 (100.0%) | 111 (100.0%) |
Real Estate Taxes by Mortgage Status in Green Spring
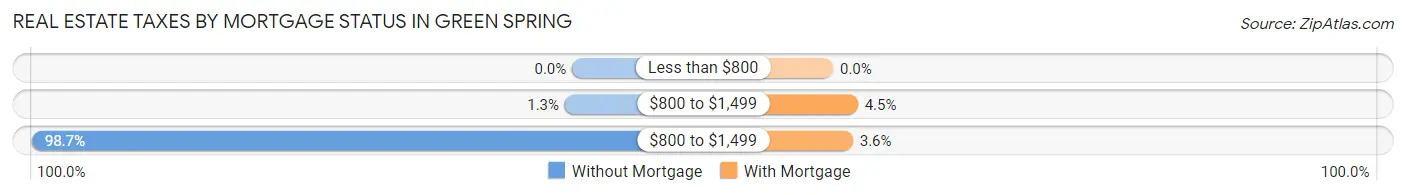
| Property Taxes | Without Mortgage | With Mortgage |
| Less than $800 | 0 (0.0%) | 0 (0.0%) |
| $800 to $1,499 | 1 (1.3%) | 5 (4.5%) |
| $800 to $1,499 | 75 (98.7%) | 4 (3.6%) |
| Total | 76 (100.0%) | 111 (100.0%) |
Health & Disability in Green Spring
Health Insurance Coverage by Age in Green Spring
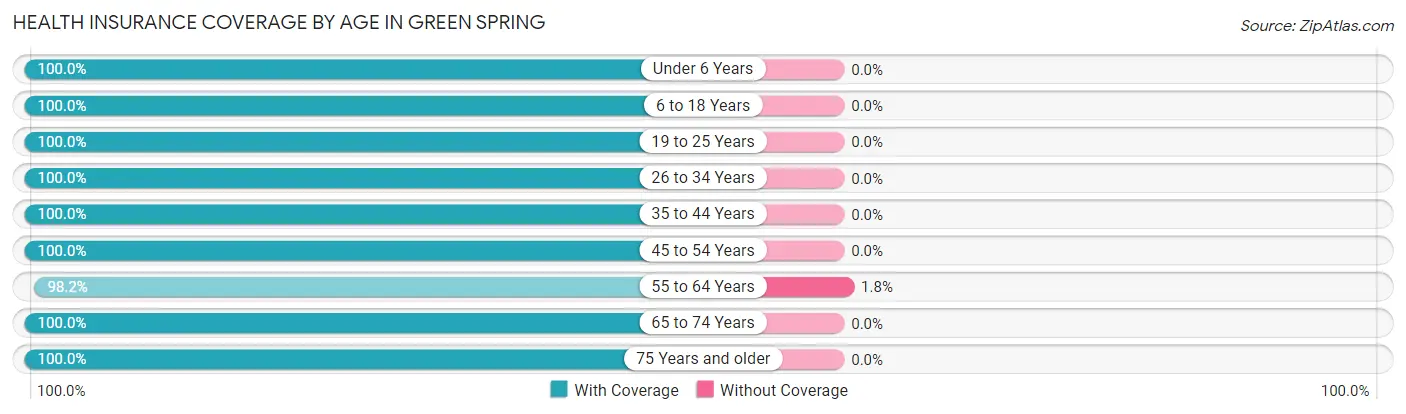
| Age Bracket | With Coverage | Without Coverage |
| Under 6 Years | 22 (100.0%) | 0 (0.0%) |
| 6 to 18 Years | 101 (100.0%) | 0 (0.0%) |
| 19 to 25 Years | 19 (100.0%) | 0 (0.0%) |
| 26 to 34 Years | 12 (100.0%) | 0 (0.0%) |
| 35 to 44 Years | 40 (100.0%) | 0 (0.0%) |
| 45 to 54 Years | 49 (100.0%) | 0 (0.0%) |
| 55 to 64 Years | 160 (98.2%) | 3 (1.8%) |
| 65 to 74 Years | 120 (100.0%) | 0 (0.0%) |
| 75 Years and older | 53 (100.0%) | 0 (0.0%) |
| Total | 576 (99.5%) | 3 (0.5%) |
Health Insurance Coverage by Citizenship Status in Green Spring
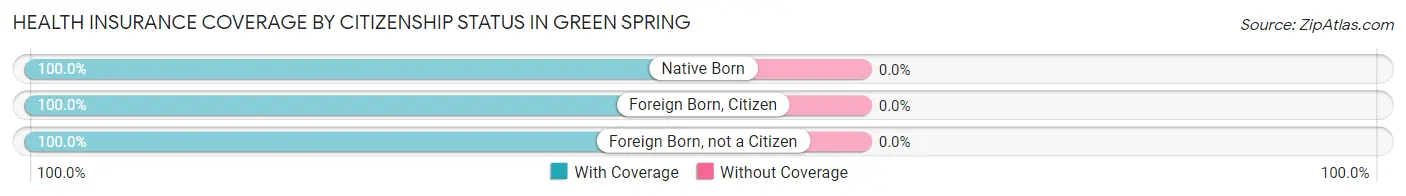
| Citizenship Status | With Coverage | Without Coverage |
| Native Born | 22 (100.0%) | 0 (0.0%) |
| Foreign Born, Citizen | 101 (100.0%) | 0 (0.0%) |
| Foreign Born, not a Citizen | 19 (100.0%) | 0 (0.0%) |
Health Insurance Coverage by Household Income in Green Spring
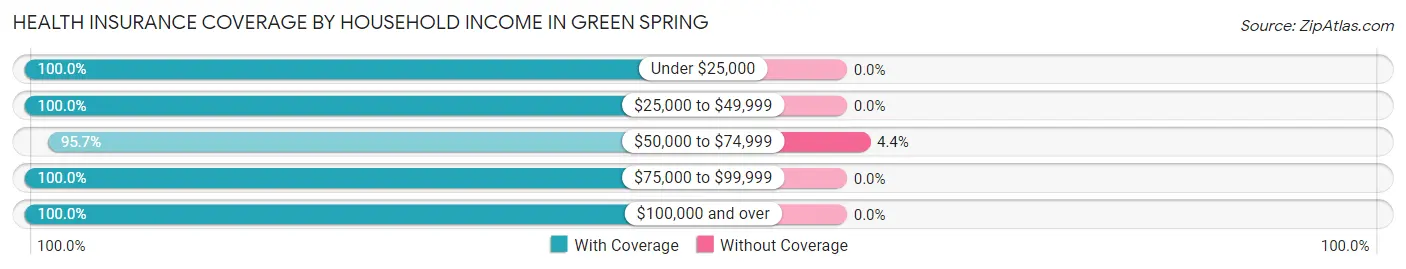
| Household Income | With Coverage | Without Coverage |
| Under $25,000 | 14 (100.0%) | 0 (0.0%) |
| $25,000 to $49,999 | 22 (100.0%) | 0 (0.0%) |
| $50,000 to $74,999 | 66 (95.7%) | 3 (4.3%) |
| $75,000 to $99,999 | 71 (100.0%) | 0 (0.0%) |
| $100,000 and over | 403 (100.0%) | 0 (0.0%) |
Public vs Private Health Insurance Coverage by Age in Green Spring
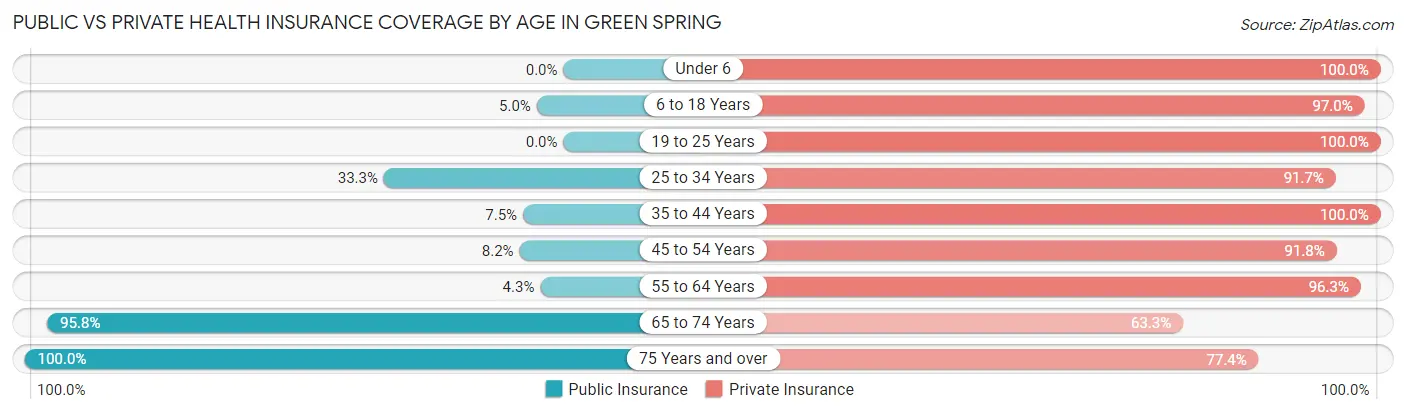
| Age Bracket | Public Insurance | Private Insurance |
| Under 6 | 0 (0.0%) | 22 (100.0%) |
| 6 to 18 Years | 5 (5.0%) | 98 (97.0%) |
| 19 to 25 Years | 0 (0.0%) | 19 (100.0%) |
| 25 to 34 Years | 4 (33.3%) | 11 (91.7%) |
| 35 to 44 Years | 3 (7.5%) | 40 (100.0%) |
| 45 to 54 Years | 4 (8.2%) | 45 (91.8%) |
| 55 to 64 Years | 7 (4.3%) | 157 (96.3%) |
| 65 to 74 Years | 115 (95.8%) | 76 (63.3%) |
| 75 Years and over | 53 (100.0%) | 41 (77.4%) |
| Total | 191 (33.0%) | 509 (87.9%) |
Disability Status by Sex by Age in Green Spring
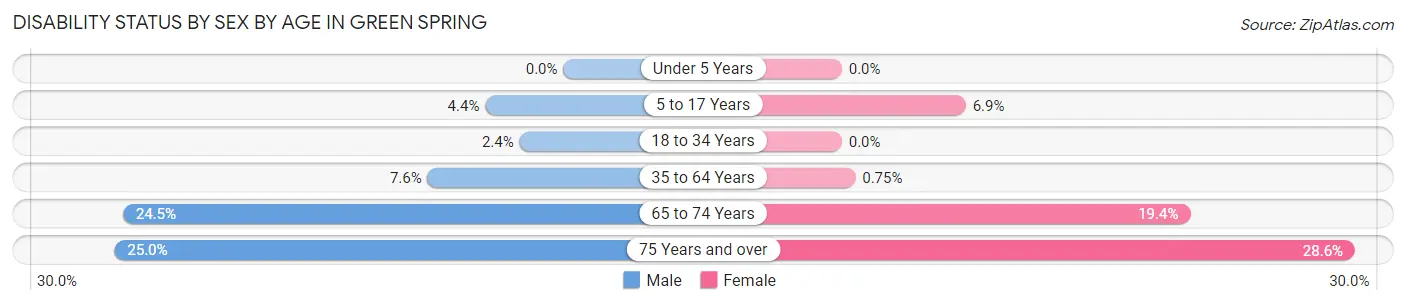
| Age Bracket | Male | Female |
| Under 5 Years | 0 (0.0%) | 0 (0.0%) |
| 5 to 17 Years | 2 (4.3%) | 2 (6.9%) |
| 18 to 34 Years | 1 (2.4%) | 0 (0.0%) |
| 35 to 64 Years | 9 (7.6%) | 1 (0.7%) |
| 65 to 74 Years | 13 (24.5%) | 13 (19.4%) |
| 75 Years and over | 8 (25.0%) | 6 (28.6%) |
Disability Class by Sex by Age in Green Spring
Disability Class: Hearing Difficulty
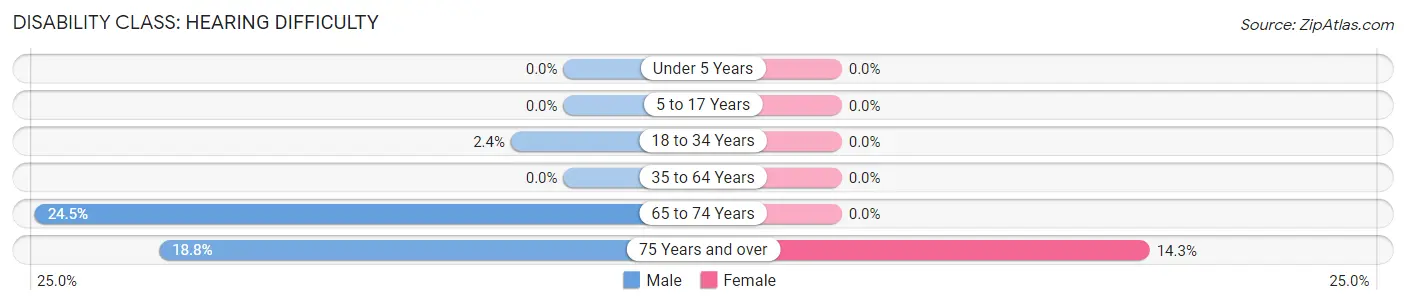
| Age Bracket | Male | Female |
| Under 5 Years | 0 (0.0%) | 0 (0.0%) |
| 5 to 17 Years | 0 (0.0%) | 0 (0.0%) |
| 18 to 34 Years | 1 (2.4%) | 0 (0.0%) |
| 35 to 64 Years | 0 (0.0%) | 0 (0.0%) |
| 65 to 74 Years | 13 (24.5%) | 0 (0.0%) |
| 75 Years and over | 6 (18.8%) | 3 (14.3%) |
Disability Class: Vision Difficulty
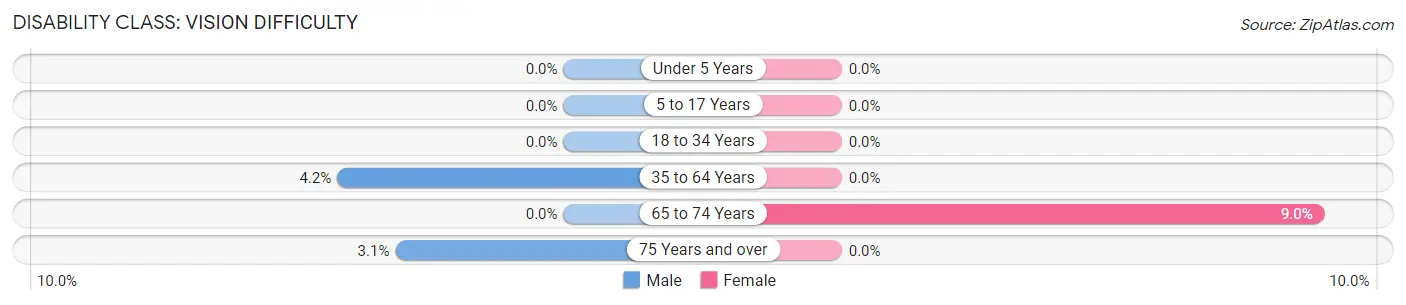
| Age Bracket | Male | Female |
| Under 5 Years | 0 (0.0%) | 0 (0.0%) |
| 5 to 17 Years | 0 (0.0%) | 0 (0.0%) |
| 18 to 34 Years | 0 (0.0%) | 0 (0.0%) |
| 35 to 64 Years | 5 (4.2%) | 0 (0.0%) |
| 65 to 74 Years | 0 (0.0%) | 6 (9.0%) |
| 75 Years and over | 1 (3.1%) | 0 (0.0%) |
Disability Class: Cognitive Difficulty
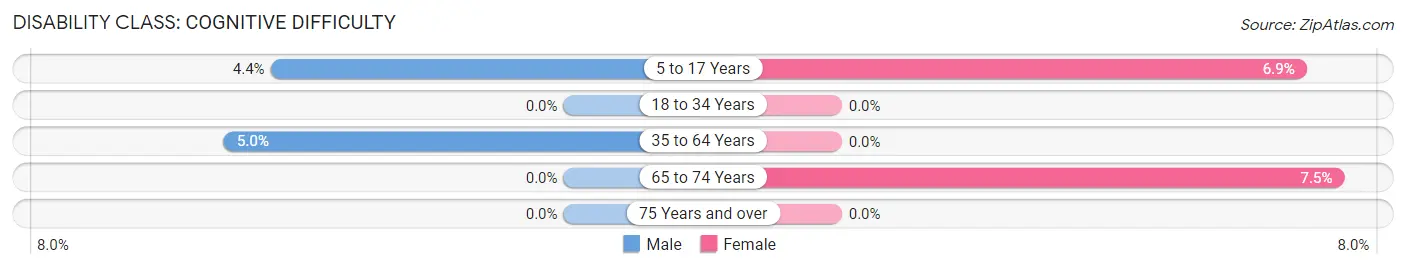
| Age Bracket | Male | Female |
| 5 to 17 Years | 2 (4.3%) | 2 (6.9%) |
| 18 to 34 Years | 0 (0.0%) | 0 (0.0%) |
| 35 to 64 Years | 6 (5.0%) | 0 (0.0%) |
| 65 to 74 Years | 0 (0.0%) | 5 (7.5%) |
| 75 Years and over | 0 (0.0%) | 0 (0.0%) |
Disability Class: Ambulatory Difficulty
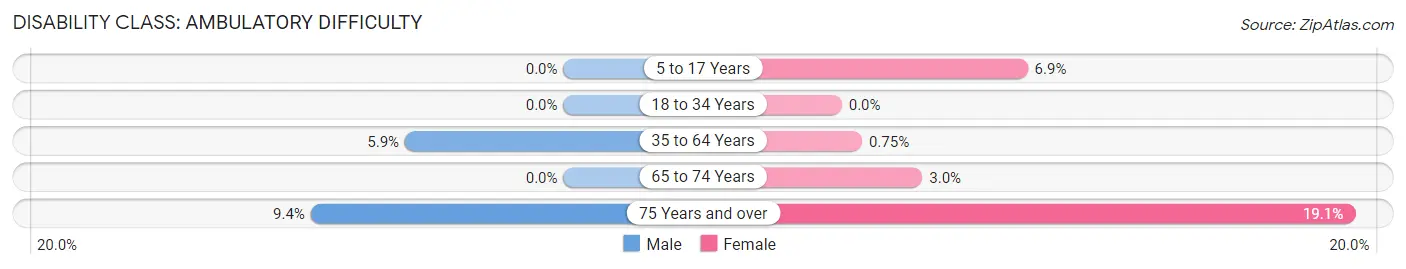
| Age Bracket | Male | Female |
| 5 to 17 Years | 0 (0.0%) | 2 (6.9%) |
| 18 to 34 Years | 0 (0.0%) | 0 (0.0%) |
| 35 to 64 Years | 7 (5.9%) | 1 (0.7%) |
| 65 to 74 Years | 0 (0.0%) | 2 (3.0%) |
| 75 Years and over | 3 (9.4%) | 4 (19.1%) |
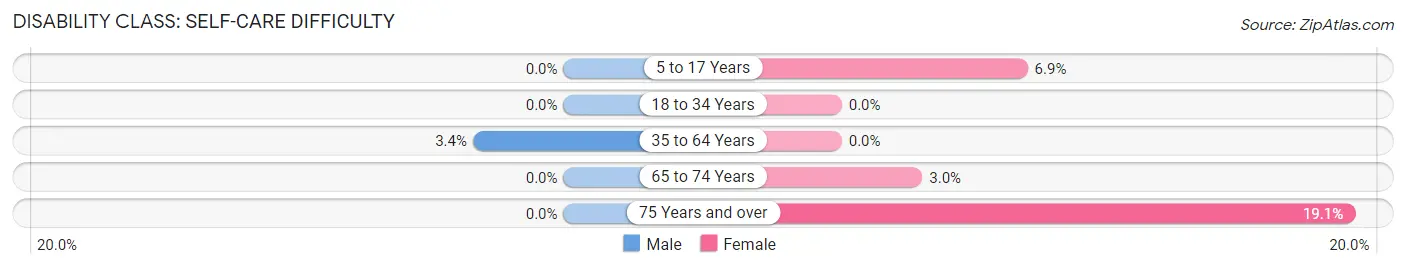
Disability Class: Self-Care Difficulty
| Age Bracket | Male | Female |
| 5 to 17 Years | 0 (0.0%) | 2 (6.9%) |
| 18 to 34 Years | 0 (0.0%) | 0 (0.0%) |
| 35 to 64 Years | 4 (3.4%) | 0 (0.0%) |
| 65 to 74 Years | 0 (0.0%) | 2 (3.0%) |
| 75 Years and over | 0 (0.0%) | 4 (19.1%) |
Technology Access in Green Spring
Computing Device Access in Green Spring
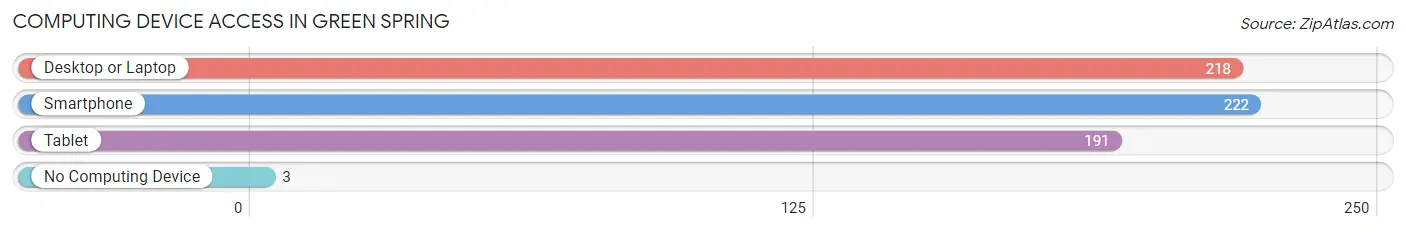
| Device Type | # Households | % Households |
| Desktop or Laptop | 218 | 96.0% |
| Smartphone | 222 | 97.8% |
| Tablet | 191 | 84.1% |
| No Computing Device | 3 | 1.3% |
| Total | 227 | 100.0% |
Internet Access in Green Spring
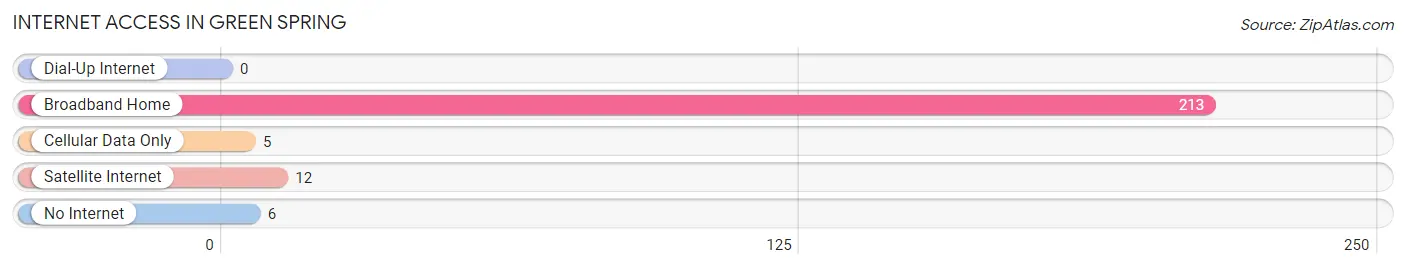
| Internet Type | # Households | % Households |
| Dial-Up Internet | 0 | 0.0% |
| Broadband Home | 213 | 93.8% |
| Cellular Data Only | 5 | 2.2% |
| Satellite Internet | 12 | 5.3% |
| No Internet | 6 | 2.6% |
| Total | 227 | 100.0% |
Green Spring Summary
Spring Green, Kentucky is a small town located in the heart of the Appalachian Mountains in the eastern part of the state. It is situated in the foothills of the Cumberland Plateau, and is surrounded by the Daniel Boone National Forest. The town is located in the county of Wolfe, and is part of the larger region known as the Eastern Kentucky Coalfield.
History
The area that is now Spring Green was first settled in the late 1700s by a group of settlers from North Carolina. The town was originally known as “Spring Green Station”, and was a stop on the stagecoach line that ran between Lexington and Hazard. The town was officially incorporated in 1883, and was named after the nearby spring that provided the town with its water supply.
In the late 1800s, the town began to grow and prosper due to the coal mining industry that had taken root in the area. The coal industry provided jobs and economic stability to the town, and it quickly became a hub for the surrounding communities. The town also became a popular tourist destination, as it was located near the Red River Gorge and Natural Bridge State Park.
Geography
Spring Green is located in the eastern part of the state of Kentucky, in the foothills of the Cumberland Plateau. The town is situated in the county of Wolfe, and is part of the larger region known as the Eastern Kentucky Coalfield. The town is located at an elevation of 1,000 feet, and is surrounded by the Daniel Boone National Forest.
The town is located near the Red River Gorge and Natural Bridge State Park, which are popular tourist destinations. The town is also located near the Kentucky River, which provides recreational opportunities such as fishing and boating.
Economy
The economy of Spring Green is largely based on the coal mining industry. The town is home to several coal mines, and the industry provides jobs and economic stability to the town. The town is also home to several small businesses, such as restaurants, shops, and other services.
The town is also a popular tourist destination, as it is located near the Red River Gorge and Natural Bridge State Park. The town is also home to several festivals and events throughout the year, such as the Spring Green Festival and the Wolfe County Fair.
Demographics
As of the 2010 census, the population of Spring Green was 1,845. The town has a population density of 5.3 people per square mile. The median age of the population is 41.7 years, and the median household income is $30,938.
The racial makeup of the town is 97.3% White, 0.7% African American, 0.2% Native American, 0.2% Asian, 0.1% Pacific Islander, 0.2% from other races, and 1.3% from two or more races. The town is also home to a large population of Hispanic and Latino residents, who make up 4.2% of the population.
Conclusion
Spring Green, Kentucky is a small town located in the heart of the Appalachian Mountains in the eastern part of the state. The town is situated in the county of Wolfe, and is part of the larger region known as the Eastern Kentucky Coalfield. The town is home to a population of 1,845, and is largely supported by the coal mining industry. The town is also a popular tourist destination, as it is located near the Red River Gorge and Natural Bridge State Park. The town is also home to several festivals and events throughout the year, such as the Spring Green Festival and the Wolfe County Fair.
Common Questions
What is Per Capita Income in Green Spring?
Per Capita income in Green Spring is $63,395.
What is the Median Family Income in Green Spring?
Median Family Income in Green Spring is $165,625.
What is the Median Household income in Green Spring?
Median Household Income in Green Spring is $160,893.
What is Income or Wage Gap in Green Spring?
Income or Wage Gap in Green Spring is 9.2%.
Women in Green Spring earn 90.8 cents for every dollar earned by a man.
What is Inequality or Gini Index in Green Spring?
Inequality or Gini Index in Green Spring is 0.33.
What is the Total Population of Green Spring?
Total Population of Green Spring is 579.
What is the Total Male Population of Green Spring?
Total Male Population of Green Spring is 297.
What is the Total Female Population of Green Spring?
Total Female Population of Green Spring is 282.
What is the Ratio of Males per 100 Females in Green Spring?
There are 105.32 Males per 100 Females in Green Spring.
What is the Ratio of Females per 100 Males in Green Spring?
There are 94.95 Females per 100 Males in Green Spring.
What is the Median Population Age in Green Spring?
Median Population Age in Green Spring is 56.2 Years.
What is the Average Family Size in Green Spring
Average Family Size in Green Spring is 2.7 People.
What is the Average Household Size in Green Spring
Average Household Size in Green Spring is 2.5 People.
How Large is the Labor Force in Green Spring?
There are 276 People in the Labor Forcein in Green Spring.
What is the Percentage of People in the Labor Force in Green Spring?
55.1% of People are in the Labor Force in Green Spring.
What is the Unemployment Rate in Green Spring?
Unemployment Rate in Green Spring is 2.2%.