Island, KY Map & Demographics
Island Map
Island Overview
$25,163
PER CAPITA INCOME
$63,819
AVG FAMILY INCOME
$47,857
AVG HOUSEHOLD INCOME
31.2%
WAGE / INCOME GAP [ % ]
68.8¢/ $1
WAGE / INCOME GAP [ $ ]
$3,529
FAMILY INCOME DEFICIT
0.36
INEQUALITY / GINI INDEX
615
TOTAL POPULATION
249
MALE POPULATION
366
FEMALE POPULATION
68.03
MALES / 100 FEMALES
146.99
FEMALES / 100 MALES
43.6
MEDIAN AGE
2.7
AVG FAMILY SIZE
2.4
AVG HOUSEHOLD SIZE
241
LABOR FORCE [ PEOPLE ]
47.8%
PERCENT IN LABOR FORCE
15.4%
UNEMPLOYMENT RATE
Island Zip Codes
Island Area Codes
Income in Island
Income Overview in Island
Per Capita Income in Island is $25,163, while median incomes of families and households are $63,819 and $47,857 respectively.
| Characteristic | Number | Measure |
| Per Capita Income | 615 | $25,163 |
| Median Family Income | 195 | $63,819 |
| Mean Family Income | 195 | $71,975 |
| Median Household Income | 260 | $47,857 |
| Mean Household Income | 260 | $61,841 |
| Income Deficit | 195 | $3,529 |
| Wage / Income Gap (%) | 615 | 31.21% |
| Wage / Income Gap ($) | 615 | 68.79¢ per $1 |
| Gini / Inequality Index | 615 | 0.36 |
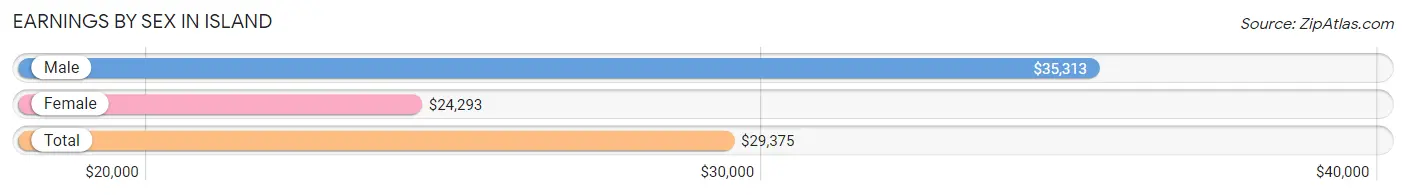
Earnings by Sex in Island
Average Earnings in Island are $29,375, $35,313 for men and $24,293 for women, a difference of 31.2%.
| Sex | Number | Average Earnings |
| Male | 105 (44.1%) | $35,313 |
| Female | 133 (55.9%) | $24,293 |
| Total | 238 (100.0%) | $29,375 |
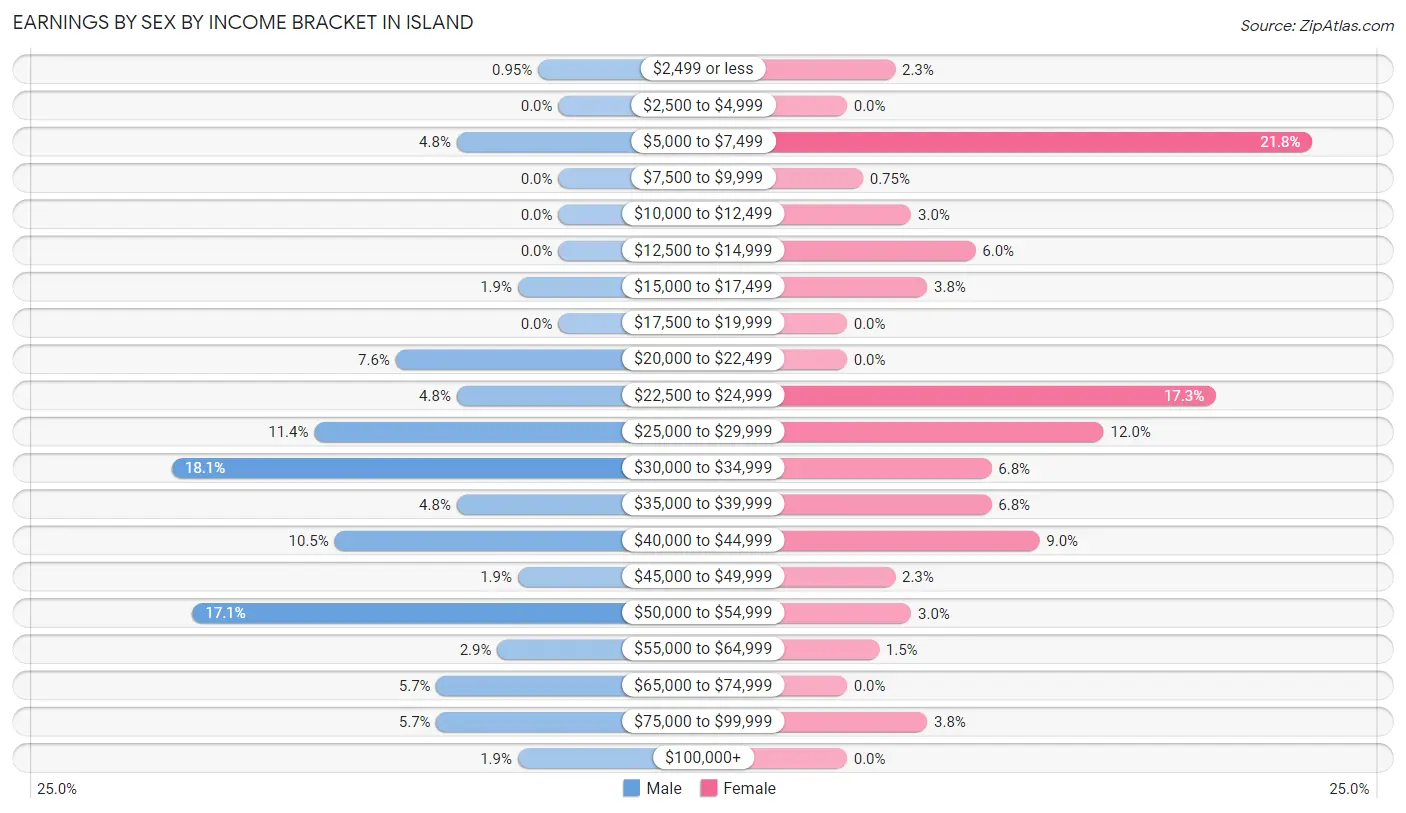
Earnings by Sex by Income Bracket in Island
The most common earnings brackets in Island are $30,000 to $34,999 for men (19 | 18.1%) and $5,000 to $7,499 for women (29 | 21.8%).
| Income | Male | Female |
| $2,499 or less | 1 (0.9%) | 3 (2.3%) |
| $2,500 to $4,999 | 0 (0.0%) | 0 (0.0%) |
| $5,000 to $7,499 | 5 (4.8%) | 29 (21.8%) |
| $7,500 to $9,999 | 0 (0.0%) | 1 (0.7%) |
| $10,000 to $12,499 | 0 (0.0%) | 4 (3.0%) |
| $12,500 to $14,999 | 0 (0.0%) | 8 (6.0%) |
| $15,000 to $17,499 | 2 (1.9%) | 5 (3.8%) |
| $17,500 to $19,999 | 0 (0.0%) | 0 (0.0%) |
| $20,000 to $22,499 | 8 (7.6%) | 0 (0.0%) |
| $22,500 to $24,999 | 5 (4.8%) | 23 (17.3%) |
| $25,000 to $29,999 | 12 (11.4%) | 16 (12.0%) |
| $30,000 to $34,999 | 19 (18.1%) | 9 (6.8%) |
| $35,000 to $39,999 | 5 (4.8%) | 9 (6.8%) |
| $40,000 to $44,999 | 11 (10.5%) | 12 (9.0%) |
| $45,000 to $49,999 | 2 (1.9%) | 3 (2.3%) |
| $50,000 to $54,999 | 18 (17.1%) | 4 (3.0%) |
| $55,000 to $64,999 | 3 (2.9%) | 2 (1.5%) |
| $65,000 to $74,999 | 6 (5.7%) | 0 (0.0%) |
| $75,000 to $99,999 | 6 (5.7%) | 5 (3.8%) |
| $100,000+ | 2 (1.9%) | 0 (0.0%) |
| Total | 105 (100.0%) | 133 (100.0%) |
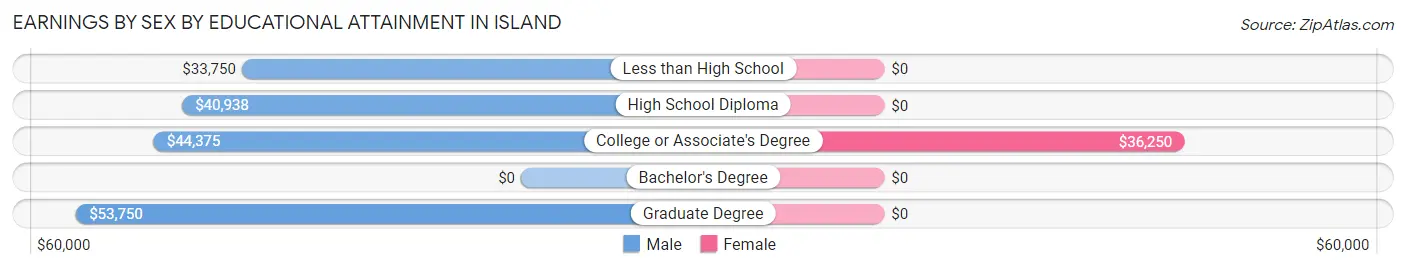
Earnings by Sex by Educational Attainment in Island
Average earnings in Island are $40,625 for men and $24,239 for women, a difference of 40.3%. Men with an educational attainment of graduate degree enjoy the highest average annual earnings of $53,750, while those with less than high school education earn the least with $33,750. Women with an educational attainment of college or associate's degree earn the most with the average annual earnings of $36,250, while those with college or associate's degree education have the smallest earnings of $36,250.
| Educational Attainment | Male Income | Female Income |
| Less than High School | $33,750 | $0 |
| High School Diploma | $40,938 | $0 |
| College or Associate's Degree | $44,375 | $36,250 |
| Bachelor's Degree | - | - |
| Graduate Degree | $53,750 | $0 |
| Total | $40,625 | $24,239 |
Family Income in Island
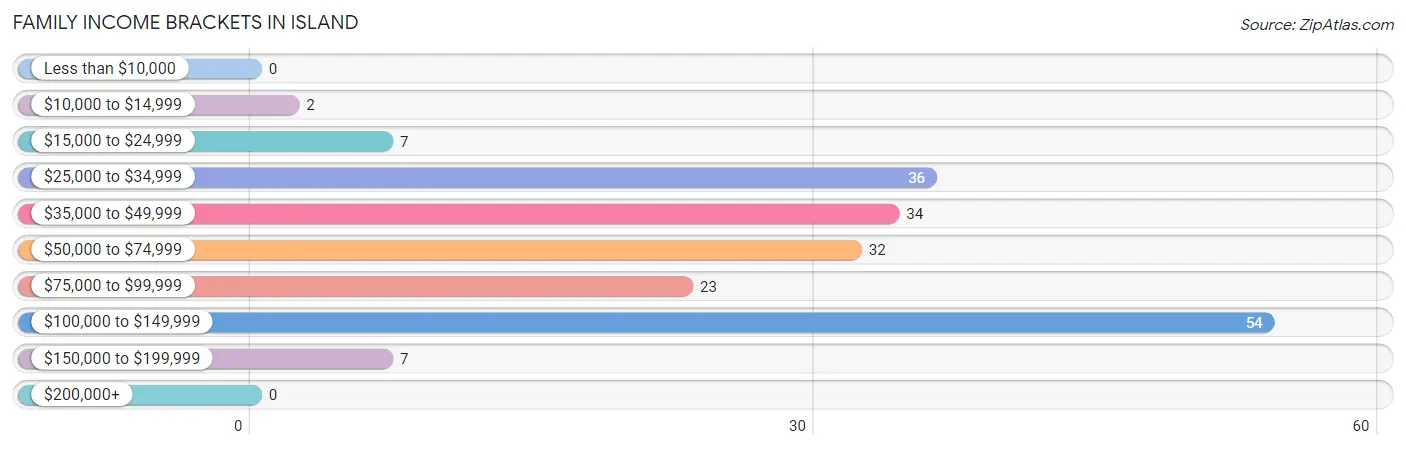
Family Income Brackets in Island
According to the Island family income data, there are 54 families falling into the $100,000 to $149,999 income range, which is the most common income bracket and makes up 27.7% of all families.
| Income Bracket | # Families | % Families |
| Less than $10,000 | 0 | 0.0% |
| $10,000 to $14,999 | 2 | 1.0% |
| $15,000 to $24,999 | 7 | 3.6% |
| $25,000 to $34,999 | 36 | 18.5% |
| $35,000 to $49,999 | 34 | 17.4% |
| $50,000 to $74,999 | 32 | 16.4% |
| $75,000 to $99,999 | 23 | 11.8% |
| $100,000 to $149,999 | 54 | 27.7% |
| $150,000 to $199,999 | 7 | 3.6% |
| $200,000+ | 0 | 0.0% |
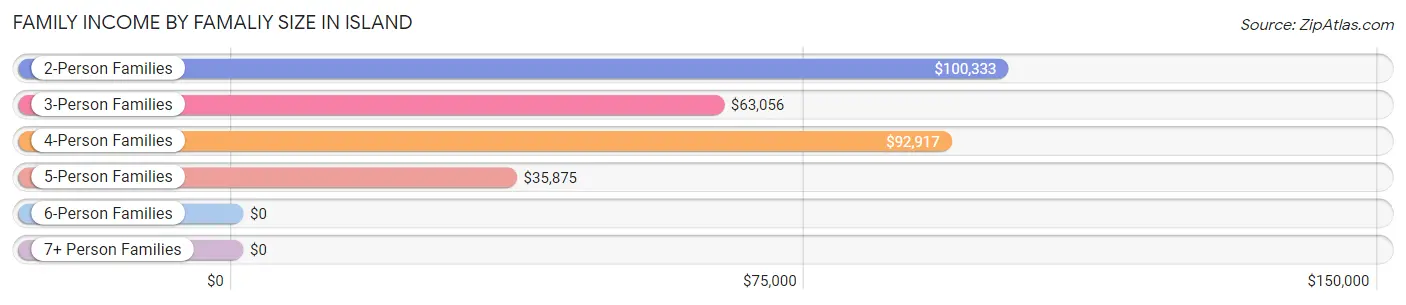
Family Income by Famaliy Size in Island
2-person families (90 | 46.2%) account for the highest median family income in Island with $100,333 per family, while 2-person families (90 | 46.2%) have the highest median income of $50,166 per family member.
| Income Bracket | # Families | Median Income |
| 2-Person Families | 90 (46.2%) | $100,333 |
| 3-Person Families | 56 (28.7%) | $63,056 |
| 4-Person Families | 27 (13.9%) | $92,917 |
| 5-Person Families | 17 (8.7%) | $35,875 |
| 6-Person Families | 0 (0.0%) | $0 |
| 7+ Person Families | 5 (2.6%) | $0 |
| Total | 195 (100.0%) | $63,819 |
Family Income by Number of Earners in Island
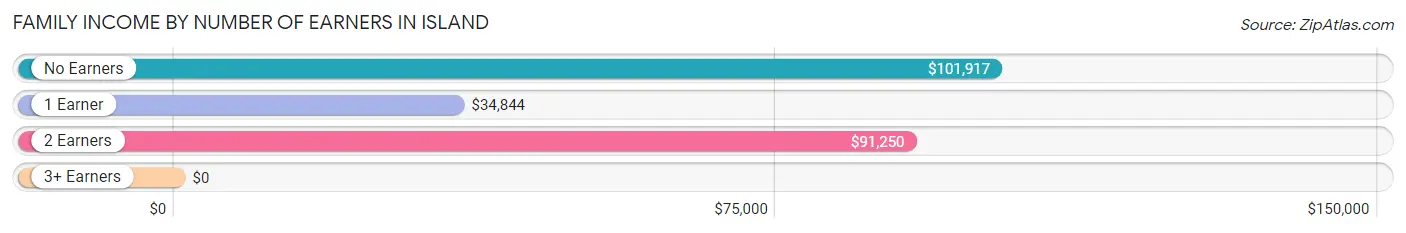
| Number of Earners | # Families | Median Income |
| No Earners | 61 (31.3%) | $101,917 |
| 1 Earner | 79 (40.5%) | $34,844 |
| 2 Earners | 52 (26.7%) | $91,250 |
| 3+ Earners | 3 (1.5%) | $0 |
| Total | 195 (100.0%) | $63,819 |
Household Income in Island
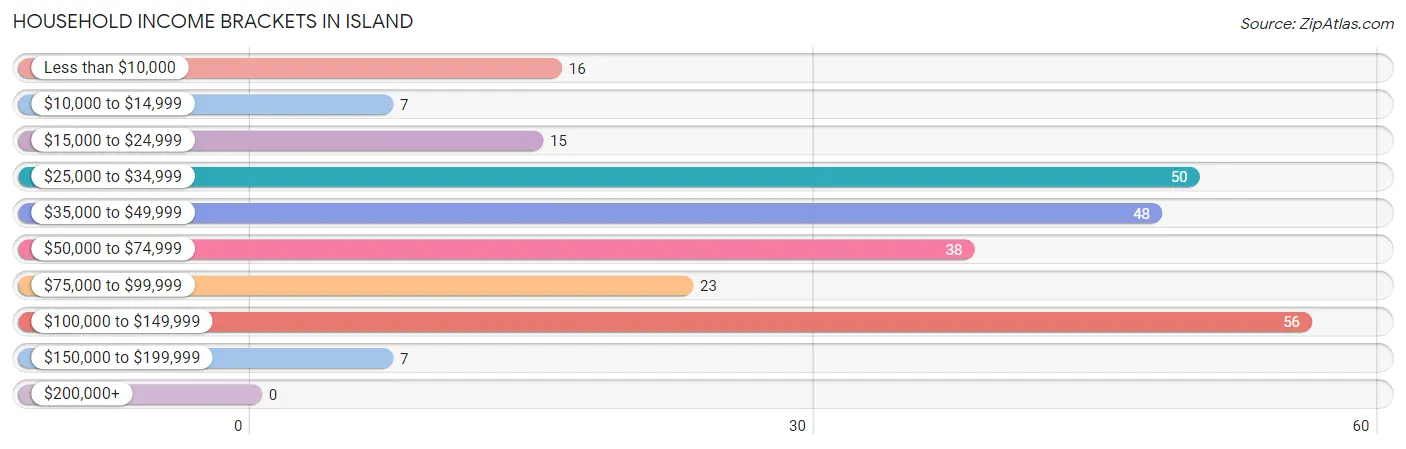
Household Income Brackets in Island
With 56 households falling in the category, the $100,000 to $149,999 income range is the most frequent in Island, accounting for 21.5% of all households.
| Income Bracket | # Households | % Households |
| Less than $10,000 | 16 | 6.2% |
| $10,000 to $14,999 | 7 | 2.7% |
| $15,000 to $24,999 | 15 | 5.8% |
| $25,000 to $34,999 | 50 | 19.2% |
| $35,000 to $49,999 | 48 | 18.5% |
| $50,000 to $74,999 | 38 | 14.6% |
| $75,000 to $99,999 | 23 | 8.8% |
| $100,000 to $149,999 | 56 | 21.5% |
| $150,000 to $199,999 | 7 | 2.7% |
| $200,000+ | 0 | 0.0% |
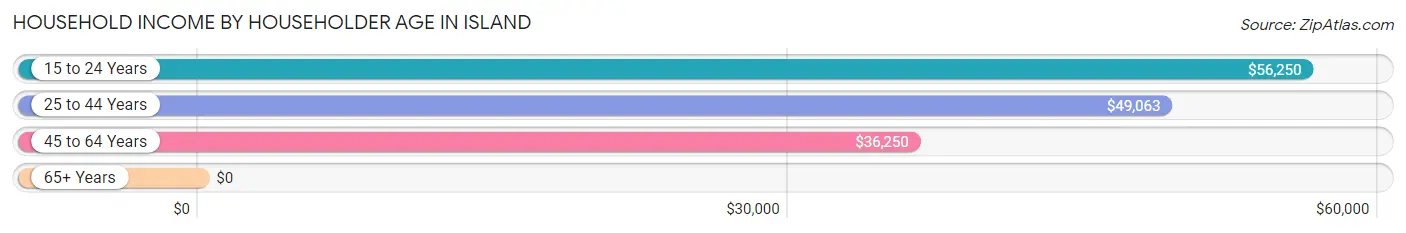
Household Income by Householder Age in Island
The median household income in Island is $47,857, with the highest median household income of $56,250 found in the 15 to 24 years age bracket for the primary householder. A total of 12 households (4.6%) fall into this category. Meanwhile, the 65+ years age bracket for the primary householder has the lowest median household income of $0, with 107 households (41.1%) in this group.
| Income Bracket | # Households | Median Income |
| 15 to 24 Years | 12 (4.6%) | $56,250 |
| 25 to 44 Years | 77 (29.6%) | $49,063 |
| 45 to 64 Years | 64 (24.6%) | $36,250 |
| 65+ Years | 107 (41.1%) | $0 |
| Total | 260 (100.0%) | $47,857 |
Poverty in Island
Income Below Poverty by Sex and Age in Island
With 10.0% poverty level for males and 13.1% for females among the residents of Island, 16 and 17 year old males and 16 and 17 year old females are the most vulnerable to poverty, with 4 males (100.0%) and 4 females (100.0%) in their respective age groups living below the poverty level.
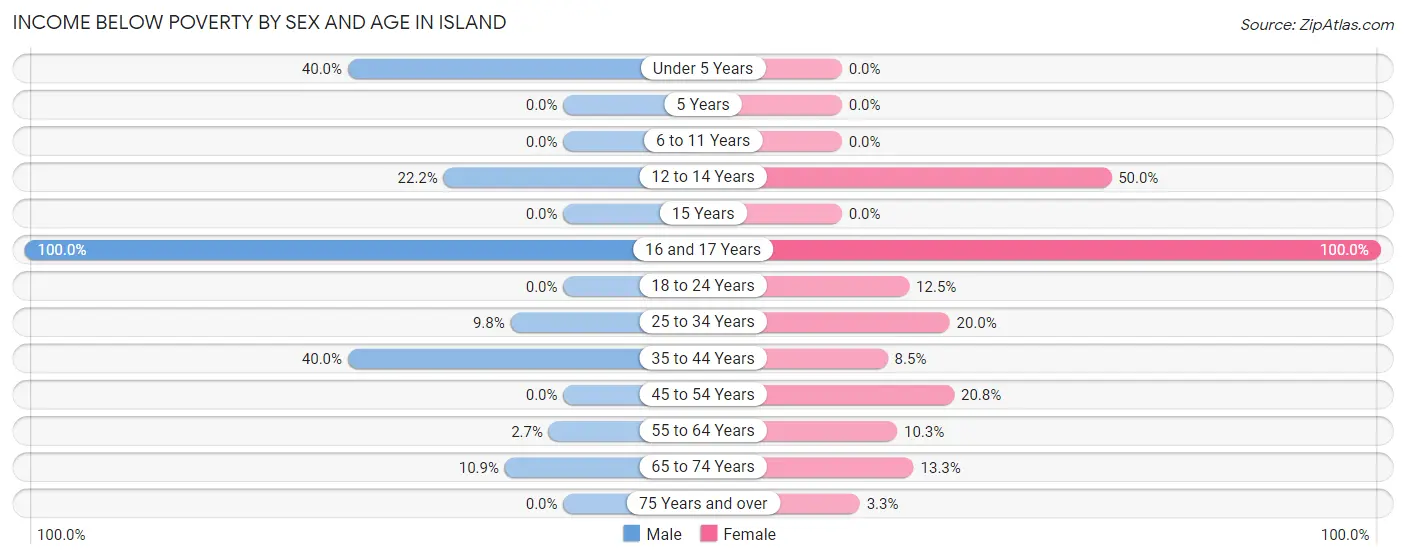
| Age Bracket | Male | Female |
| Under 5 Years | 2 (40.0%) | 0 (0.0%) |
| 5 Years | 0 (0.0%) | 0 (0.0%) |
| 6 to 11 Years | 0 (0.0%) | 0 (0.0%) |
| 12 to 14 Years | 2 (22.2%) | 7 (50.0%) |
| 15 Years | 0 (0.0%) | 0 (0.0%) |
| 16 and 17 Years | 4 (100.0%) | 4 (100.0%) |
| 18 to 24 Years | 0 (0.0%) | 2 (12.5%) |
| 25 to 34 Years | 5 (9.8%) | 10 (20.0%) |
| 35 to 44 Years | 6 (40.0%) | 4 (8.5%) |
| 45 to 54 Years | 0 (0.0%) | 10 (20.8%) |
| 55 to 64 Years | 1 (2.7%) | 4 (10.3%) |
| 65 to 74 Years | 5 (10.9%) | 6 (13.3%) |
| 75 Years and over | 0 (0.0%) | 1 (3.3%) |
| Total | 25 (10.0%) | 48 (13.1%) |
Income Above Poverty by Sex and Age in Island
According to the poverty statistics in Island, males aged 5 years and females aged under 5 years are the age groups that are most secure financially, with 100.0% of males and 100.0% of females in these age groups living above the poverty line.
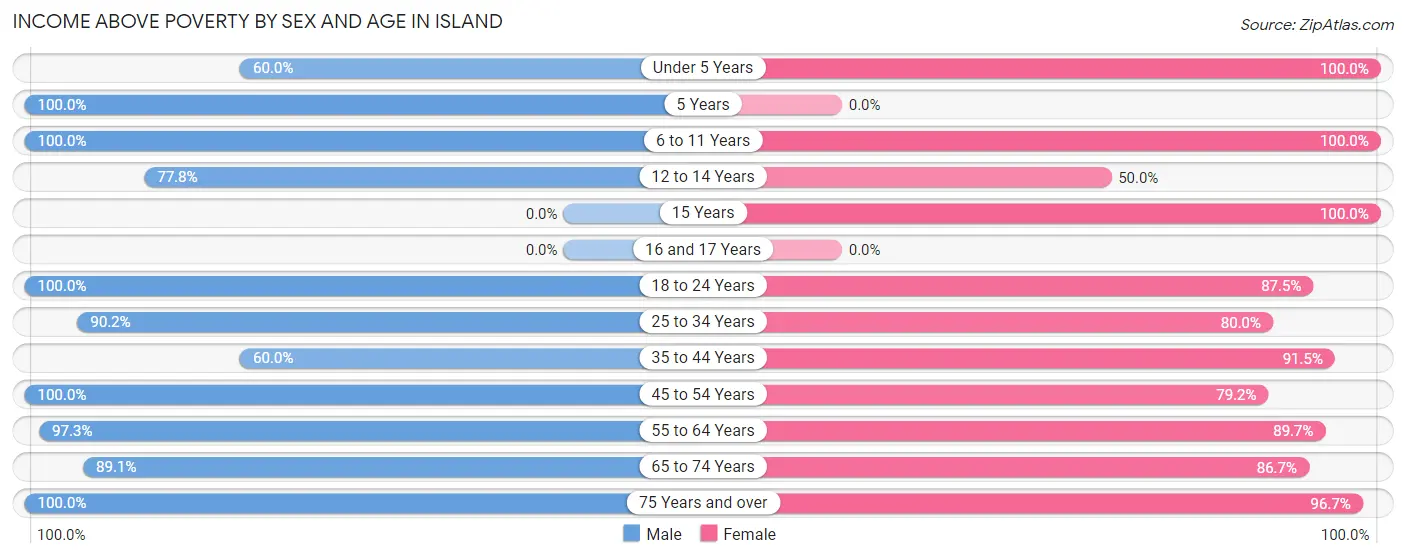
| Age Bracket | Male | Female |
| Under 5 Years | 3 (60.0%) | 34 (100.0%) |
| 5 Years | 4 (100.0%) | 0 (0.0%) |
| 6 to 11 Years | 6 (100.0%) | 33 (100.0%) |
| 12 to 14 Years | 7 (77.8%) | 7 (50.0%) |
| 15 Years | 0 (0.0%) | 6 (100.0%) |
| 16 and 17 Years | 0 (0.0%) | 0 (0.0%) |
| 18 to 24 Years | 14 (100.0%) | 14 (87.5%) |
| 25 to 34 Years | 46 (90.2%) | 40 (80.0%) |
| 35 to 44 Years | 9 (60.0%) | 43 (91.5%) |
| 45 to 54 Years | 27 (100.0%) | 38 (79.2%) |
| 55 to 64 Years | 36 (97.3%) | 35 (89.7%) |
| 65 to 74 Years | 41 (89.1%) | 39 (86.7%) |
| 75 Years and over | 31 (100.0%) | 29 (96.7%) |
| Total | 224 (90.0%) | 318 (86.9%) |
Income Below Poverty Among Married-Couple Families in Island
The poverty statistics for married-couple families in Island show that 4.1% or 6 of the total 146 families live below the poverty line. Families with 3 or 4 children have the highest poverty rate of 83.3%, comprising of 5 families. On the other hand, families with 1 or 2 children have the lowest poverty rate of 0.0%, which includes 0 families.
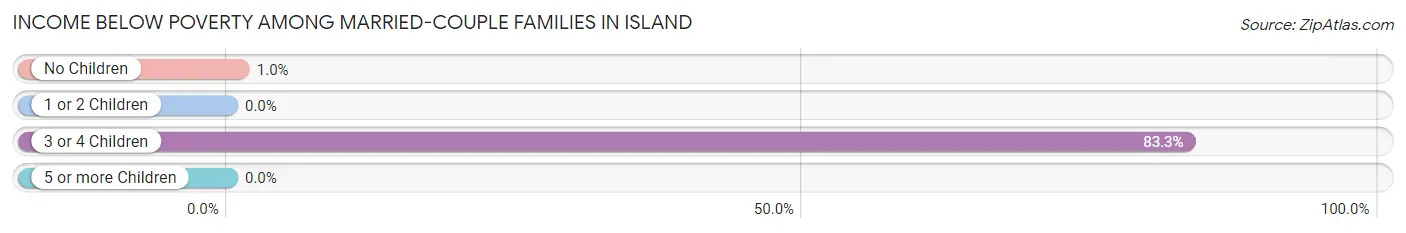
| Children | Above Poverty | Below Poverty |
| No Children | 96 (99.0%) | 1 (1.0%) |
| 1 or 2 Children | 38 (100.0%) | 0 (0.0%) |
| 3 or 4 Children | 1 (16.7%) | 5 (83.3%) |
| 5 or more Children | 5 (100.0%) | 0 (0.0%) |
| Total | 140 (95.9%) | 6 (4.1%) |
Income Below Poverty Among Single-Parent Households in Island
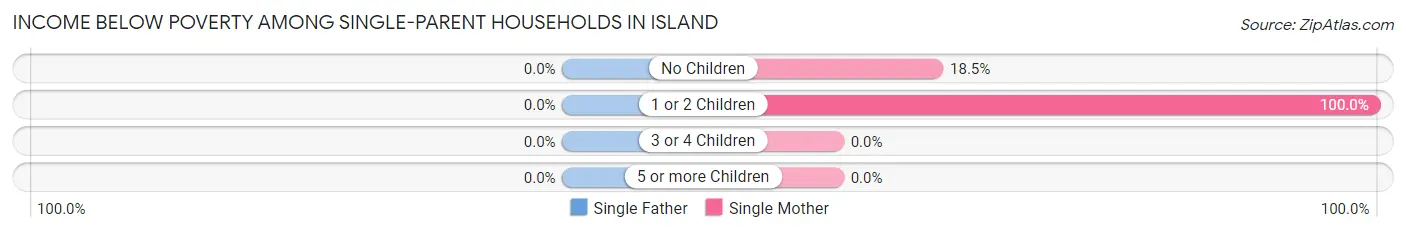
| Children | Single Father | Single Mother |
| No Children | 0 (0.0%) | 5 (18.5%) |
| 1 or 2 Children | 0 (0.0%) | 3 (100.0%) |
| 3 or 4 Children | 0 (0.0%) | 0 (0.0%) |
| 5 or more Children | 0 (0.0%) | 0 (0.0%) |
| Total | 0 (0.0%) | 8 (20.0%) |
Income Below Poverty Among Married-Couple vs Single-Parent Households in Island
The poverty data for Island shows that 6 of the married-couple family households (4.1%) and 8 of the single-parent households (16.3%) are living below the poverty level. Within the married-couple family households, those with 3 or 4 children have the highest poverty rate, with 5 households (83.3%) falling below the poverty line. Among the single-parent households, those with 1 or 2 children have the highest poverty rate, with 3 household (42.9%) living below poverty.
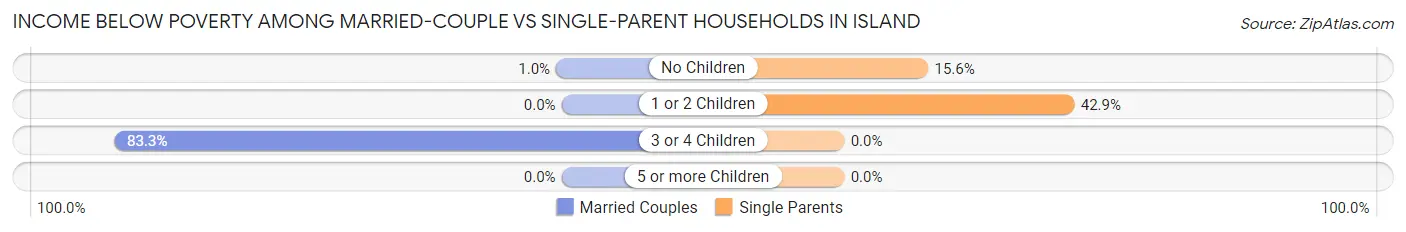
| Children | Married-Couple Families | Single-Parent Households |
| No Children | 1 (1.0%) | 5 (15.6%) |
| 1 or 2 Children | 0 (0.0%) | 3 (42.9%) |
| 3 or 4 Children | 5 (83.3%) | 0 (0.0%) |
| 5 or more Children | 0 (0.0%) | 0 (0.0%) |
| Total | 6 (4.1%) | 8 (16.3%) |
Race in Island
The most populous races in Island are White / Caucasian (574 | 93.3%), Two or more Races (25 | 4.1%), and Hispanic or Latino (13 | 2.1%).
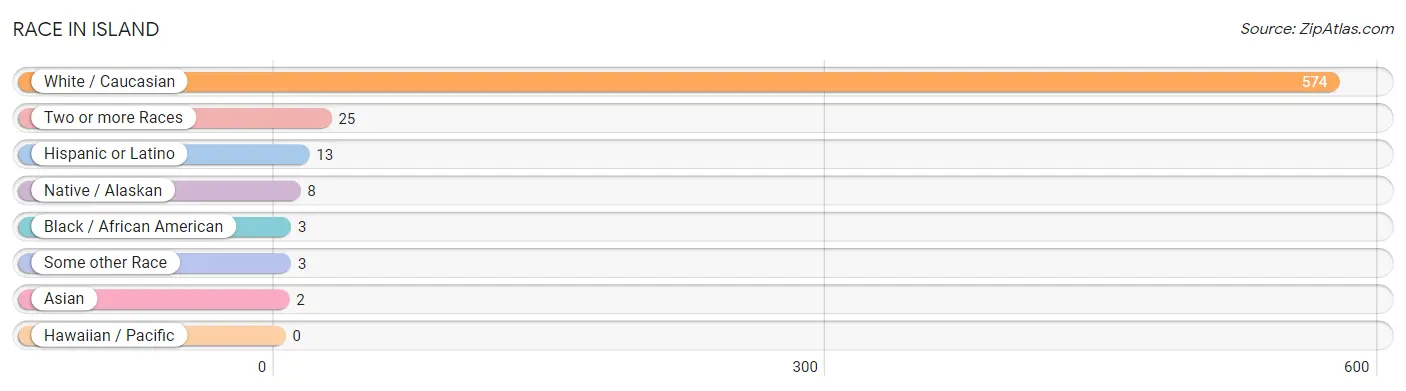
| Race | # Population | % Population |
| Asian | 2 | 0.3% |
| Black / African American | 3 | 0.5% |
| Hawaiian / Pacific | 0 | 0.0% |
| Hispanic or Latino | 13 | 2.1% |
| Native / Alaskan | 8 | 1.3% |
| White / Caucasian | 574 | 93.3% |
| Two or more Races | 25 | 4.1% |
| Some other Race | 3 | 0.5% |
| Total | 615 | 100.0% |
Ancestry in Island
The most populous ancestries reported in Island are American (146 | 23.7%), English (120 | 19.5%), German (65 | 10.6%), Irish (20 | 3.3%), and Sioux (8 | 1.3%), together accounting for 58.4% of all Island residents.
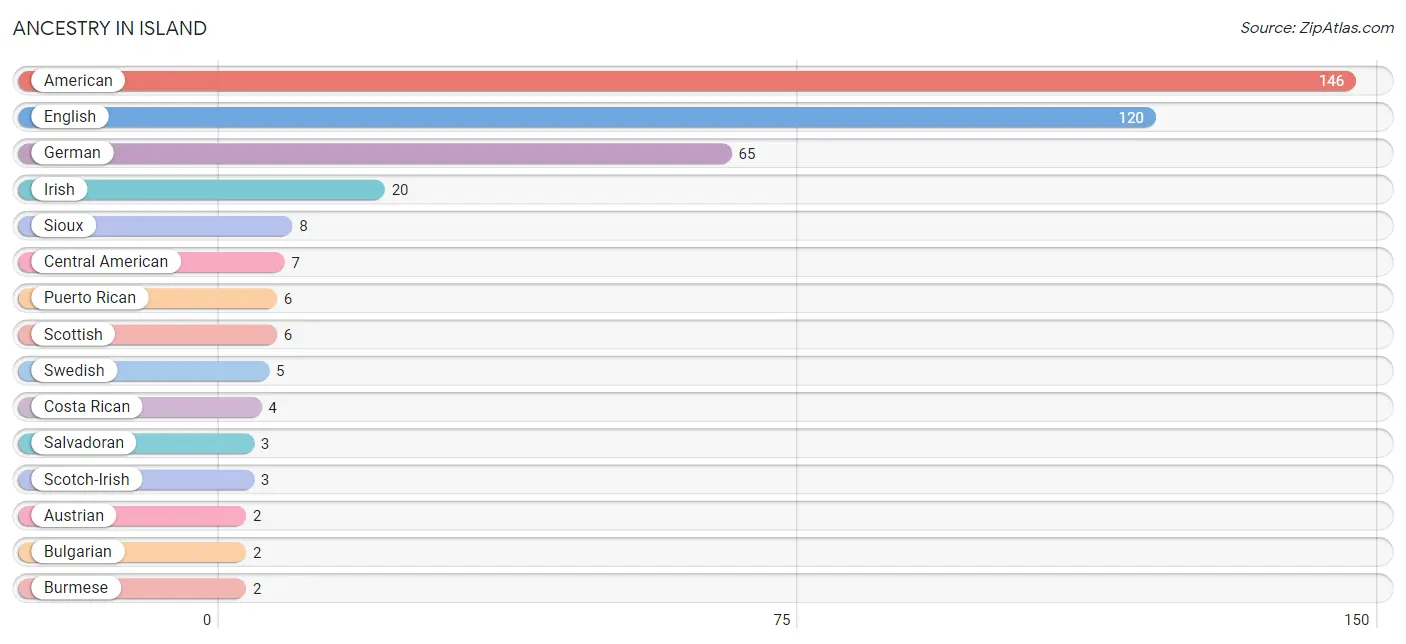
| Ancestry | # Population | % Population |
| American | 146 | 23.7% |
| Austrian | 2 | 0.3% |
| Bulgarian | 2 | 0.3% |
| Burmese | 2 | 0.3% |
| Central American | 7 | 1.1% |
| Costa Rican | 4 | 0.6% |
| English | 120 | 19.5% |
| French | 2 | 0.3% |
| German | 65 | 10.6% |
| Irish | 20 | 3.3% |
| Puerto Rican | 6 | 1.0% |
| Salvadoran | 3 | 0.5% |
| Scandinavian | 2 | 0.3% |
| Scotch-Irish | 3 | 0.5% |
| Scottish | 6 | 1.0% |
| Sioux | 8 | 1.3% |
| Swedish | 5 | 0.8% | View All 17 Rows |
Immigrants in Island
The most numerous immigrant groups reported in Island came from Central America (7 | 1.1%), Latin America (7 | 1.1%), Costa Rica (4 | 0.6%), El Salvador (3 | 0.5%), and Asia (2 | 0.3%), together accounting for 3.7% of all Island residents.
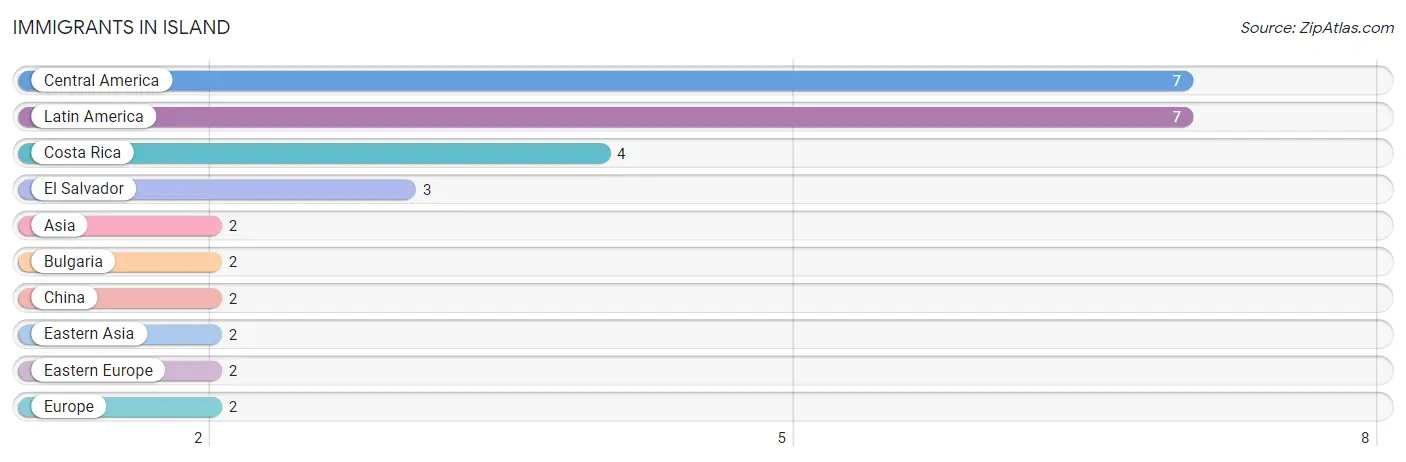
| Immigration Origin | # Population | % Population |
| Asia | 2 | 0.3% |
| Bulgaria | 2 | 0.3% |
| Central America | 7 | 1.1% |
| China | 2 | 0.3% |
| Costa Rica | 4 | 0.6% |
| Eastern Asia | 2 | 0.3% |
| Eastern Europe | 2 | 0.3% |
| El Salvador | 3 | 0.5% |
| Europe | 2 | 0.3% |
| Latin America | 7 | 1.1% | View All 10 Rows |
Sex and Age in Island
Sex and Age in Island
The most populous age groups in Island are 70 to 74 Years (37 | 14.9%) for men and 50 to 54 Years (40 | 10.9%) for women.
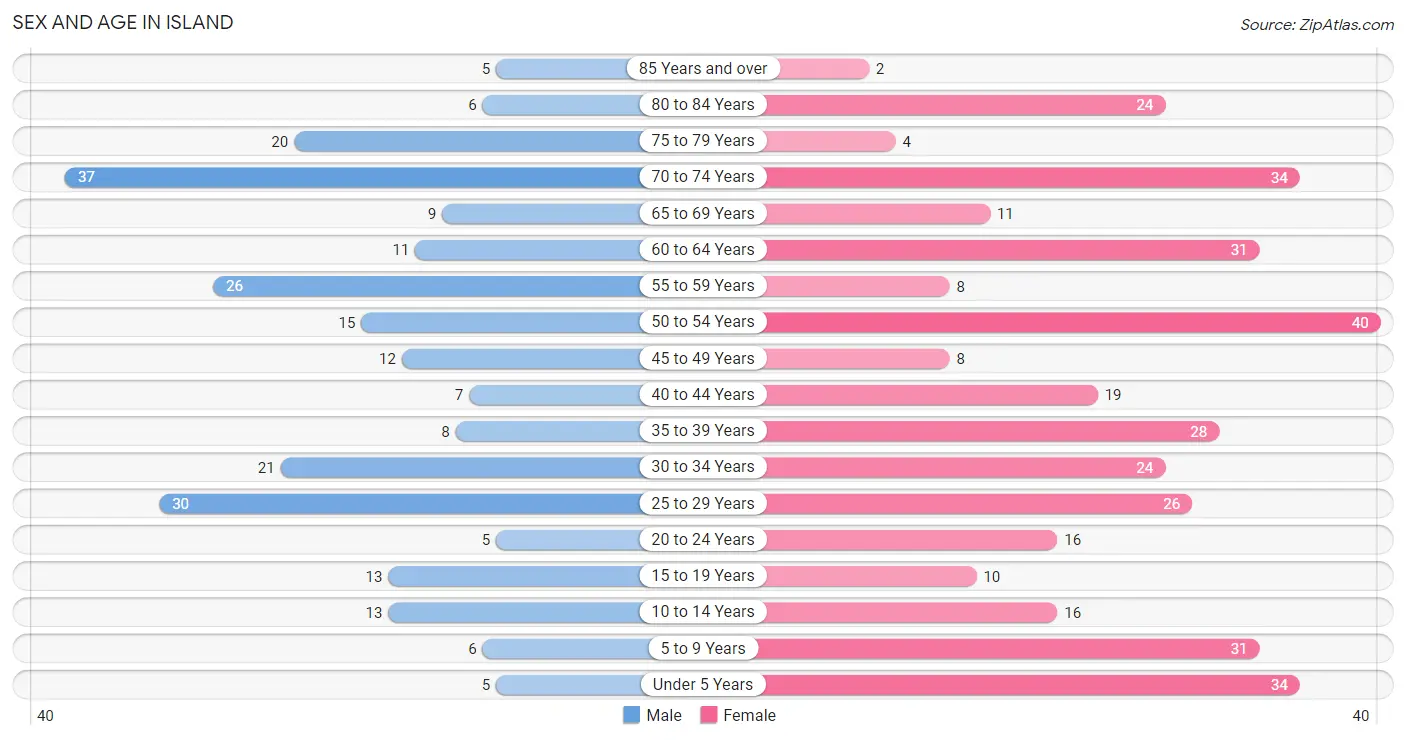
| Age Bracket | Male | Female |
| Under 5 Years | 5 (2.0%) | 34 (9.3%) |
| 5 to 9 Years | 6 (2.4%) | 31 (8.5%) |
| 10 to 14 Years | 13 (5.2%) | 16 (4.4%) |
| 15 to 19 Years | 13 (5.2%) | 10 (2.7%) |
| 20 to 24 Years | 5 (2.0%) | 16 (4.4%) |
| 25 to 29 Years | 30 (12.0%) | 26 (7.1%) |
| 30 to 34 Years | 21 (8.4%) | 24 (6.6%) |
| 35 to 39 Years | 8 (3.2%) | 28 (7.6%) |
| 40 to 44 Years | 7 (2.8%) | 19 (5.2%) |
| 45 to 49 Years | 12 (4.8%) | 8 (2.2%) |
| 50 to 54 Years | 15 (6.0%) | 40 (10.9%) |
| 55 to 59 Years | 26 (10.4%) | 8 (2.2%) |
| 60 to 64 Years | 11 (4.4%) | 31 (8.5%) |
| 65 to 69 Years | 9 (3.6%) | 11 (3.0%) |
| 70 to 74 Years | 37 (14.9%) | 34 (9.3%) |
| 75 to 79 Years | 20 (8.0%) | 4 (1.1%) |
| 80 to 84 Years | 6 (2.4%) | 24 (6.6%) |
| 85 Years and over | 5 (2.0%) | 2 (0.5%) |
| Total | 249 (100.0%) | 366 (100.0%) |
Families and Households in Island
Median Family Size in Island
The median family size in Island is 2.74 persons per family, with married-couple families (146 | 74.9%) accounting for the largest median family size of 2.84 persons per family. On the other hand, single male/father families (9 | 4.6%) represent the smallest median family size with 2.00 persons per family.
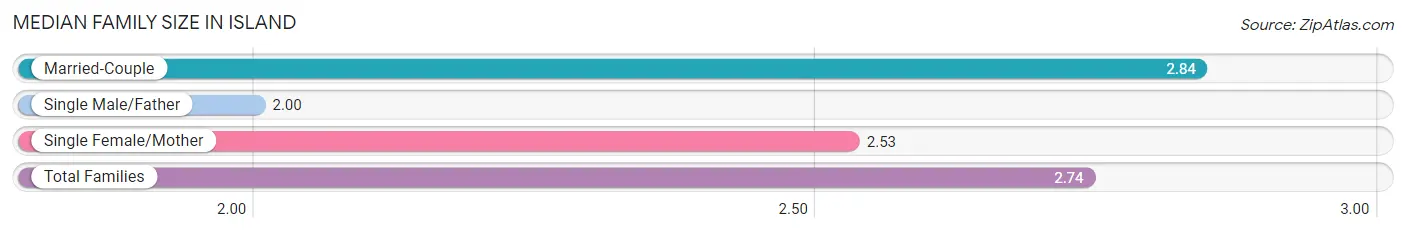
| Family Type | # Families | Family Size |
| Married-Couple | 146 (74.9%) | 2.84 |
| Single Male/Father | 9 (4.6%) | 2.00 |
| Single Female/Mother | 40 (20.5%) | 2.53 |
| Total Families | 195 (100.0%) | 2.74 |
Median Household Size in Island
The median household size in Island is 2.37 persons per household, with married-couple households (146 | 56.1%) accounting for the largest median household size of 2.86 persons per household. non-family households (65 | 25.0%) represent the smallest median household size with 1.17 persons per household.
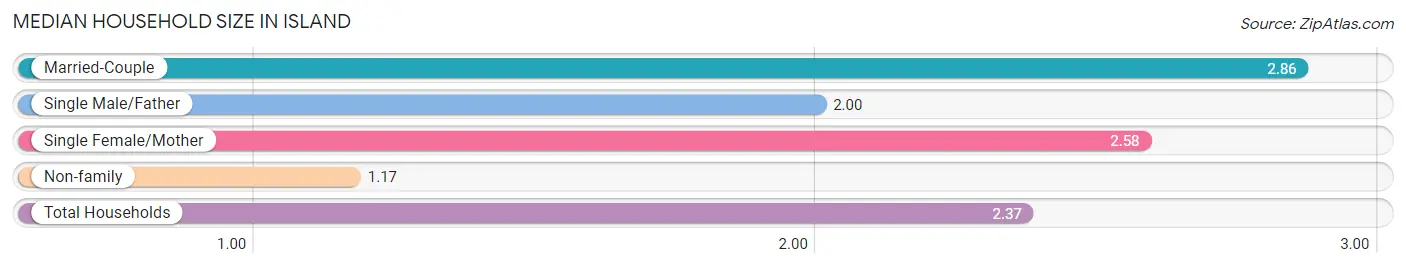
| Household Type | # Households | Household Size |
| Married-Couple | 146 (56.1%) | 2.86 |
| Single Male/Father | 9 (3.5%) | 2.00 |
| Single Female/Mother | 40 (15.4%) | 2.58 |
| Non-family | 65 (25.0%) | 1.17 |
| Total Households | 260 (100.0%) | 2.37 |
Household Size by Marriage Status in Island
Out of a total of 260 households in Island, 195 (75.0%) are family households, while 65 (25.0%) are nonfamily households. The most numerous type of family households are 2-person households, comprising 90, and the most common type of nonfamily households are 1-person households, comprising 52.
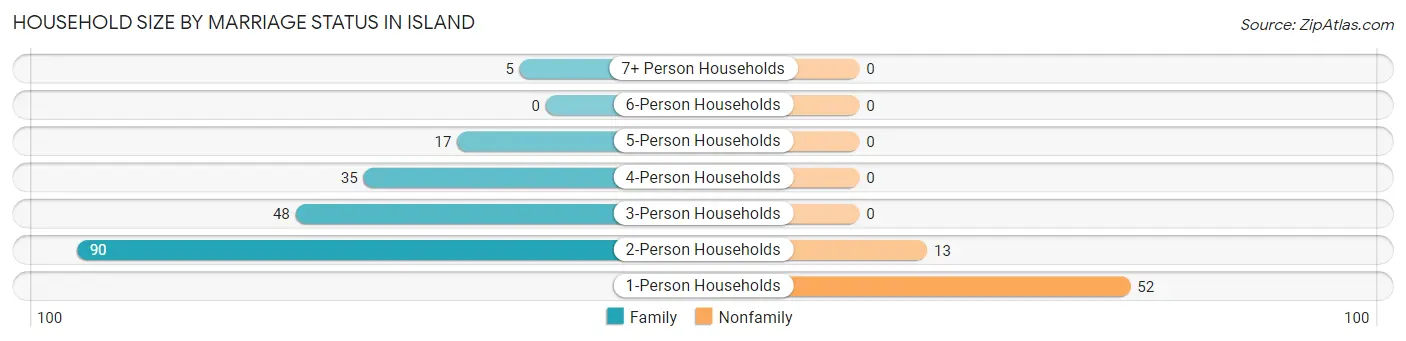
| Household Size | Family Households | Nonfamily Households |
| 1-Person Households | - | 52 (20.0%) |
| 2-Person Households | 90 (34.6%) | 13 (5.0%) |
| 3-Person Households | 48 (18.5%) | 0 (0.0%) |
| 4-Person Households | 35 (13.5%) | 0 (0.0%) |
| 5-Person Households | 17 (6.5%) | 0 (0.0%) |
| 6-Person Households | 0 (0.0%) | 0 (0.0%) |
| 7+ Person Households | 5 (1.9%) | 0 (0.0%) |
| Total | 195 (75.0%) | 65 (25.0%) |
Female Fertility in Island
Fertility by Age in Island
Average fertility rate in Island is 44.0 births per 1,000 women. Women in the age bracket of 35 to 50 years have the highest fertility rate with 100.0 births per 1,000 women. Women in the age bracket of 35 to 50 years acount for 100.0% of all women with births.
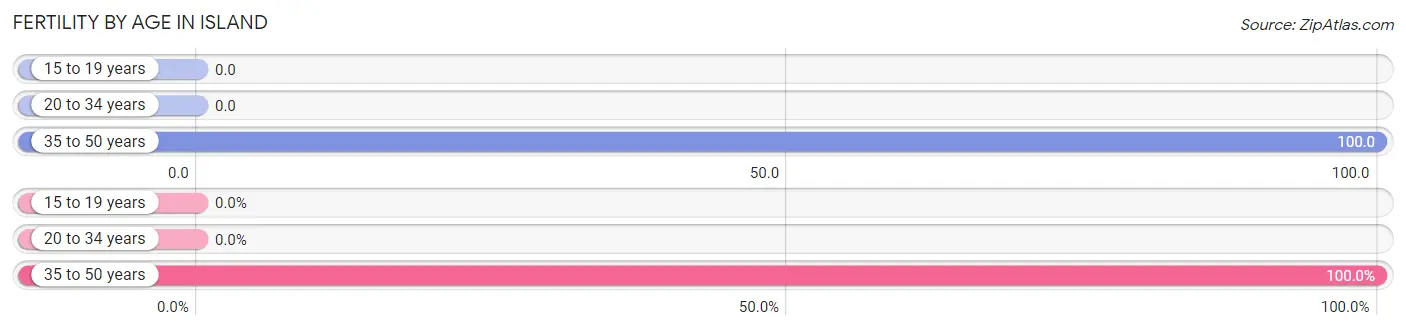
| Age Bracket | Women with Births | Births / 1,000 Women |
| 15 to 19 years | 0 (0.0%) | 0.0 |
| 20 to 34 years | 0 (0.0%) | 0.0 |
| 35 to 50 years | 6 (100.0%) | 100.0 |
| Total | 6 (100.0%) | 44.0 |
Fertility by Age by Marriage Status in Island
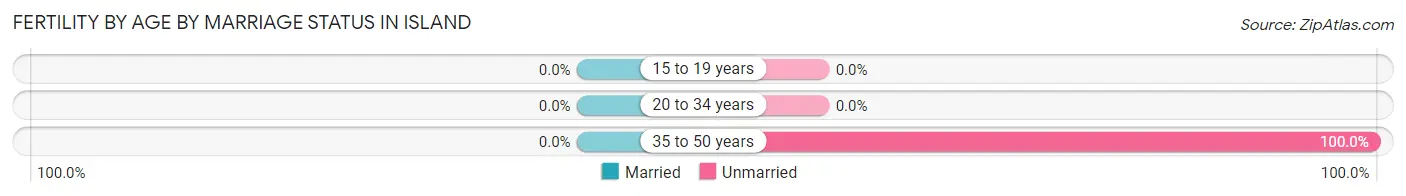
| Age Bracket | Married | Unmarried |
| 15 to 19 years | 0 (0.0%) | 0 (0.0%) |
| 20 to 34 years | 0 (0.0%) | 0 (0.0%) |
| 35 to 50 years | 0 (0.0%) | 6 (100.0%) |
| Total | 0 (0.0%) | 6 (100.0%) |
Fertility by Education in Island
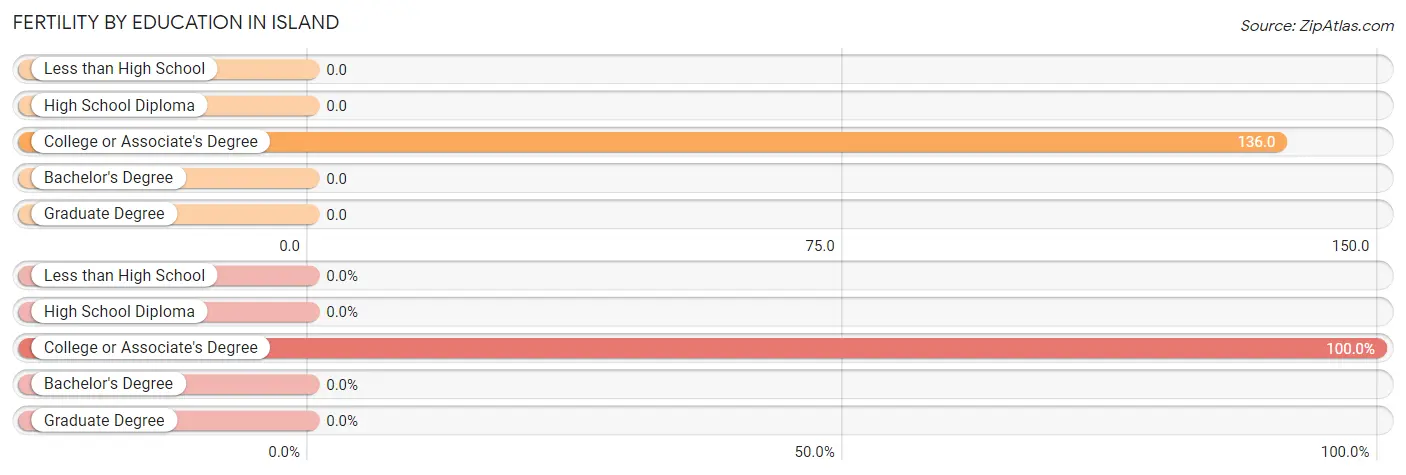
| Educational Attainment | Women with Births | Births / 1,000 Women |
| Less than High School | 0 (0.0%) | 0.0 |
| High School Diploma | 0 (0.0%) | 0.0 |
| College or Associate's Degree | 6 (100.0%) | 136.0 |
| Bachelor's Degree | 0 (0.0%) | 0.0 |
| Graduate Degree | 0 (0.0%) | 0.0 |
| Total | 6 (100.0%) | 44.0 |
Fertility by Education by Marriage Status in Island
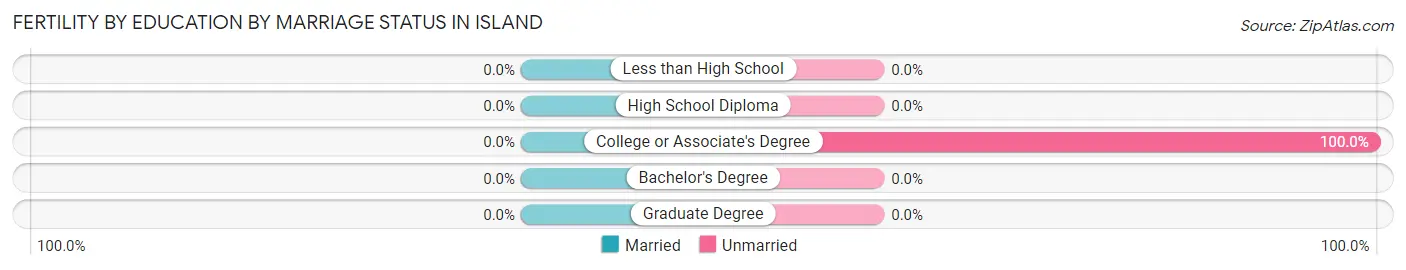
| Educational Attainment | Married | Unmarried |
| Less than High School | 0 (0.0%) | 0 (0.0%) |
| High School Diploma | 0 (0.0%) | 0 (0.0%) |
| College or Associate's Degree | 0 (0.0%) | 6 (100.0%) |
| Bachelor's Degree | 0 (0.0%) | 0 (0.0%) |
| Graduate Degree | 0 (0.0%) | 0 (0.0%) |
| Total | 0 (0.0%) | 6 (100.0%) |
Employment Characteristics in Island
Employment by Class of Employer in Island
Among the 204 employed individuals in Island, private company employees (143 | 70.1%), local government employees (23 | 11.3%), and not-for-profit organizations (22 | 10.8%) make up the most common classes of employment.
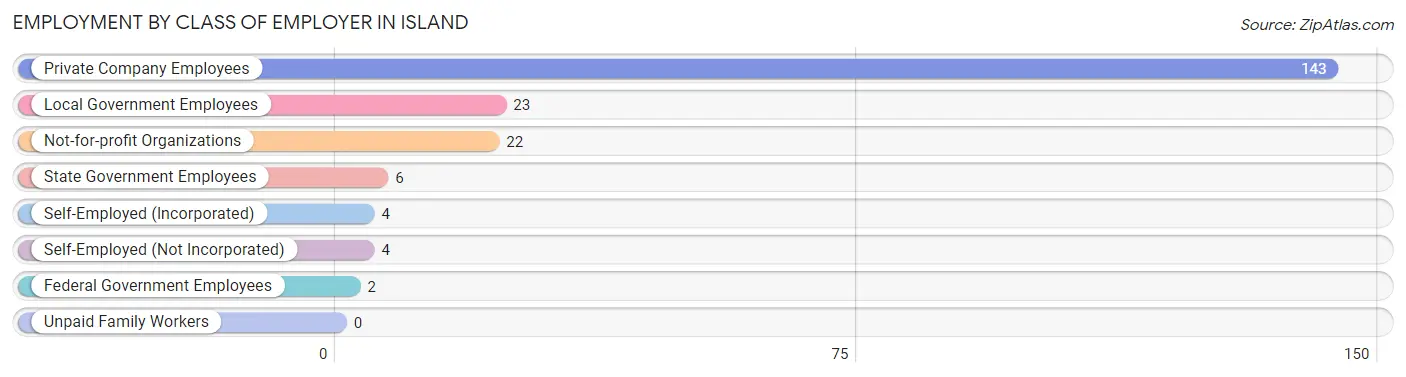
| Employer Class | # Employees | % Employees |
| Private Company Employees | 143 | 70.1% |
| Self-Employed (Incorporated) | 4 | 2.0% |
| Self-Employed (Not Incorporated) | 4 | 2.0% |
| Not-for-profit Organizations | 22 | 10.8% |
| Local Government Employees | 23 | 11.3% |
| State Government Employees | 6 | 2.9% |
| Federal Government Employees | 2 | 1.0% |
| Unpaid Family Workers | 0 | 0.0% |
| Total | 204 | 100.0% |
Employment Status by Age in Island
According to the labor force statistics for Island, out of the total population over 16 years of age (504), 47.8% or 241 individuals are in the labor force, with 15.4% or 37 of them unemployed. The age group with the highest labor force participation rate is 30 to 34 years, with 86.7% or 39 individuals in the labor force. Within the labor force, the 30 to 34 years age range has the highest percentage of unemployed individuals, with 41.0% or 16 of them being unemployed.
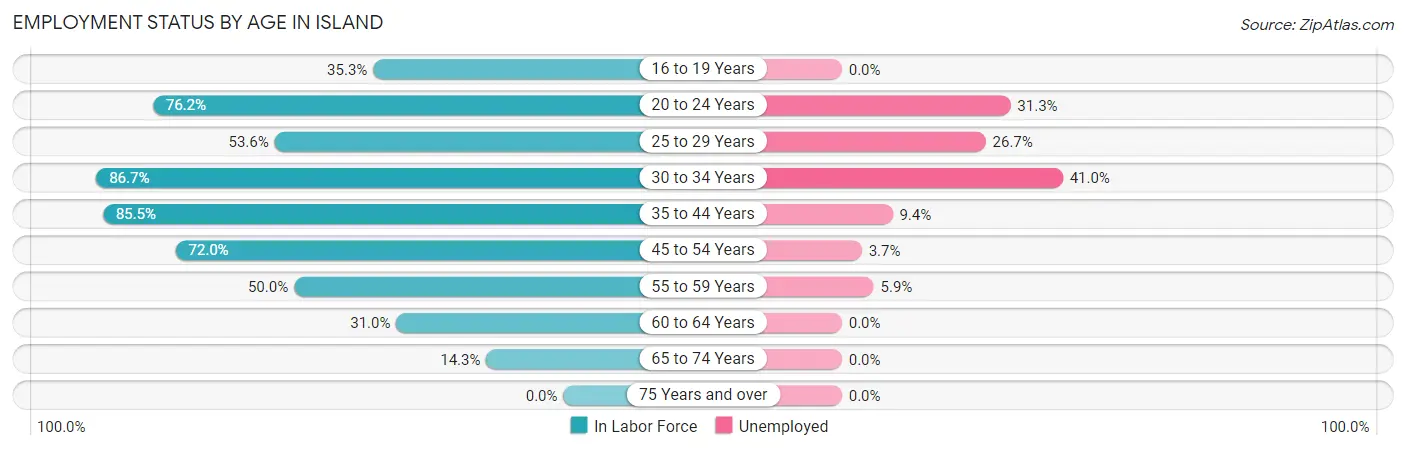
| Age Bracket | In Labor Force | Unemployed |
| 16 to 19 Years | 6 (35.3%) | 0 (0.0%) |
| 20 to 24 Years | 16 (76.2%) | 5 (31.3%) |
| 25 to 29 Years | 30 (53.6%) | 8 (26.7%) |
| 30 to 34 Years | 39 (86.7%) | 16 (41.0%) |
| 35 to 44 Years | 53 (85.5%) | 5 (9.4%) |
| 45 to 54 Years | 54 (72.0%) | 2 (3.7%) |
| 55 to 59 Years | 17 (50.0%) | 1 (5.9%) |
| 60 to 64 Years | 13 (31.0%) | 0 (0.0%) |
| 65 to 74 Years | 13 (14.3%) | 0 (0.0%) |
| 75 Years and over | 0 (0.0%) | 0 (0.0%) |
| Total | 241 (47.8%) | 37 (15.4%) |
Employment Status by Educational Attainment in Island
According to labor force statistics for Island, 65.6% of individuals (206) out of the total population between 25 and 64 years of age (314) are in the labor force, with 15.5% or 32 of them being unemployed. The group with the highest labor force participation rate are those with the educational attainment of bachelor's degree or higher, with 91.3% or 21 individuals in the labor force. Within the labor force, individuals with high school diploma education have the highest percentage of unemployment, with 25.0% or 26 of them being unemployed.
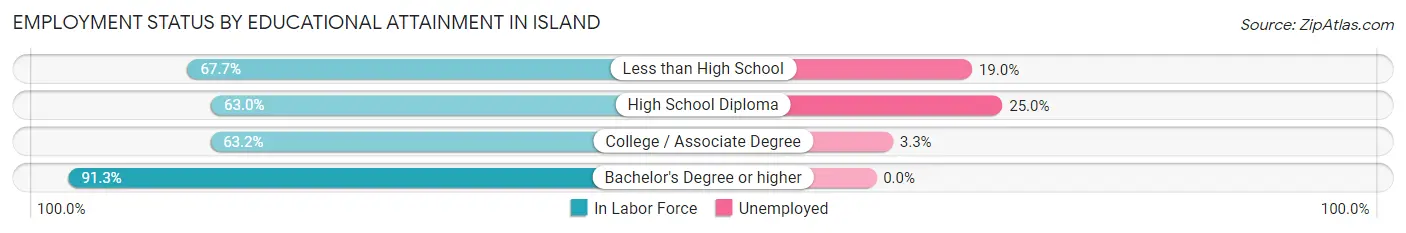
| Educational Attainment | In Labor Force | Unemployed |
| Less than High School | 21 (67.7%) | 6 (19.0%) |
| High School Diploma | 104 (63.0%) | 41 (25.0%) |
| College / Associate Degree | 60 (63.2%) | 3 (3.3%) |
| Bachelor's Degree or higher | 21 (91.3%) | 0 (0.0%) |
| Total | 206 (65.6%) | 49 (15.5%) |
Employment Occupations by Sex in Island
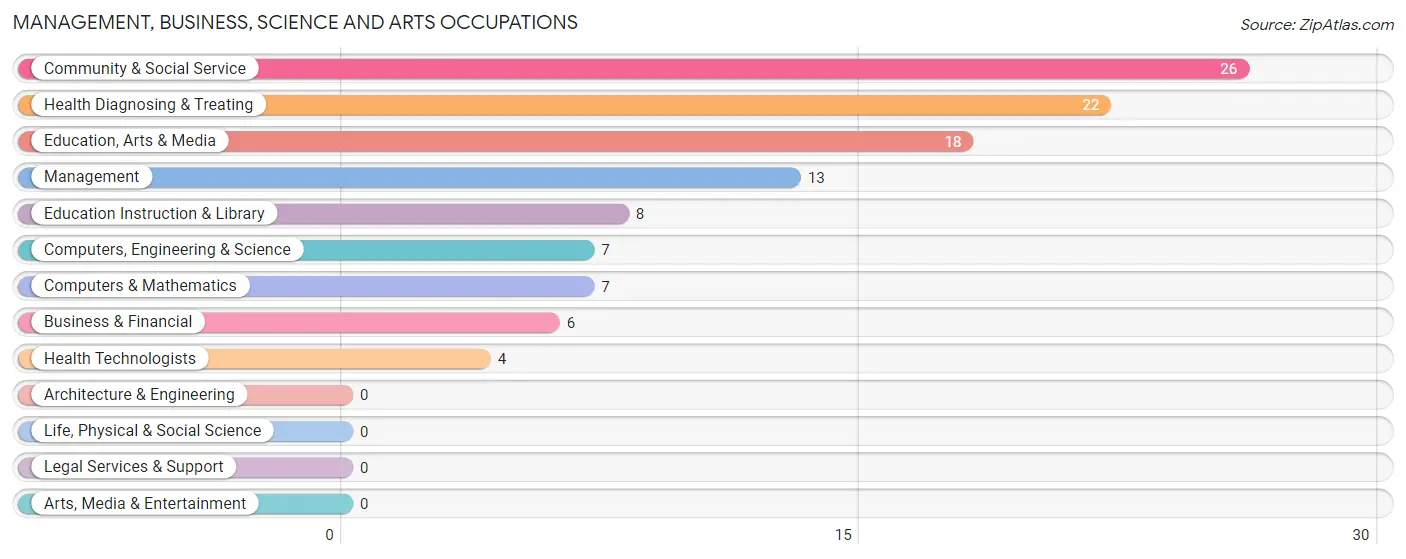
Management, Business, Science and Arts Occupations
The most common Management, Business, Science and Arts occupations in Island are Community & Social Service (26 | 12.8%), Health Diagnosing & Treating (22 | 10.8%), Education, Arts & Media (18 | 8.8%), Management (13 | 6.4%), and Education Instruction & Library (8 | 3.9%).
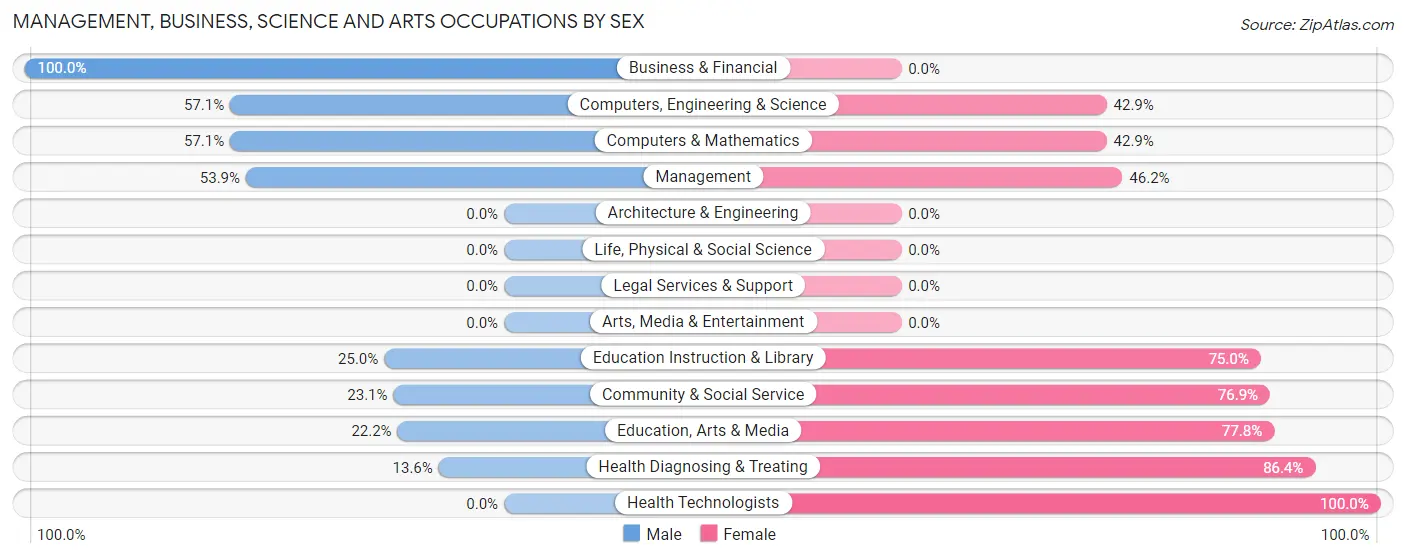
Management, Business, Science and Arts Occupations by Sex
Within the Management, Business, Science and Arts occupations in Island, the most male-oriented occupations are Business & Financial (100.0%), Computers, Engineering & Science (57.1%), and Computers & Mathematics (57.1%), while the most female-oriented occupations are Health Technologists (100.0%), Health Diagnosing & Treating (86.4%), and Education, Arts & Media (77.8%).
| Occupation | Male | Female |
| Management | 7 (53.8%) | 6 (46.2%) |
| Business & Financial | 6 (100.0%) | 0 (0.0%) |
| Computers, Engineering & Science | 4 (57.1%) | 3 (42.9%) |
| Computers & Mathematics | 4 (57.1%) | 3 (42.9%) |
| Architecture & Engineering | 0 (0.0%) | 0 (0.0%) |
| Life, Physical & Social Science | 0 (0.0%) | 0 (0.0%) |
| Community & Social Service | 6 (23.1%) | 20 (76.9%) |
| Education, Arts & Media | 4 (22.2%) | 14 (77.8%) |
| Legal Services & Support | 0 (0.0%) | 0 (0.0%) |
| Education Instruction & Library | 2 (25.0%) | 6 (75.0%) |
| Arts, Media & Entertainment | 0 (0.0%) | 0 (0.0%) |
| Health Diagnosing & Treating | 3 (13.6%) | 19 (86.4%) |
| Health Technologists | 0 (0.0%) | 4 (100.0%) |
| Total (Category) | 26 (35.1%) | 48 (64.9%) |
| Total (Overall) | 103 (50.5%) | 101 (49.5%) |
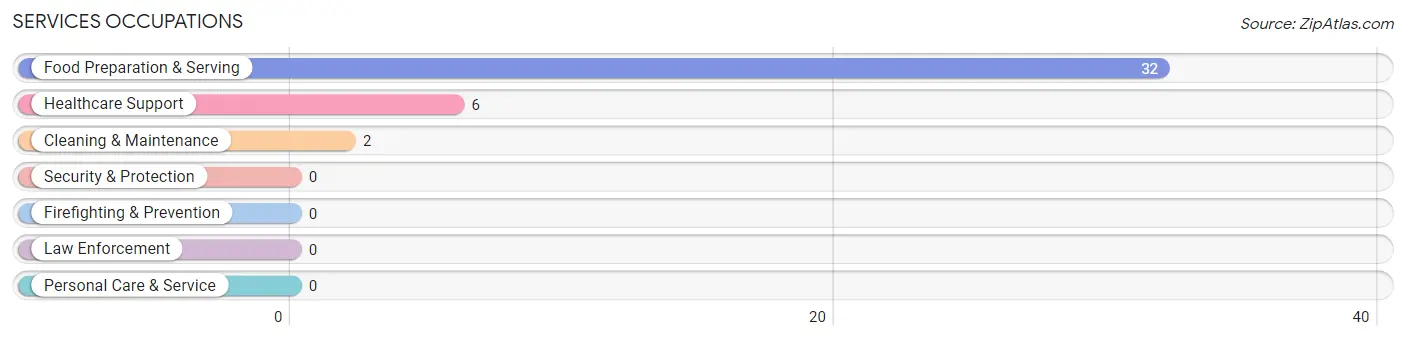
Services Occupations
The most common Services occupations in Island are Food Preparation & Serving (32 | 15.7%), Healthcare Support (6 | 2.9%), and Cleaning & Maintenance (2 | 1.0%).
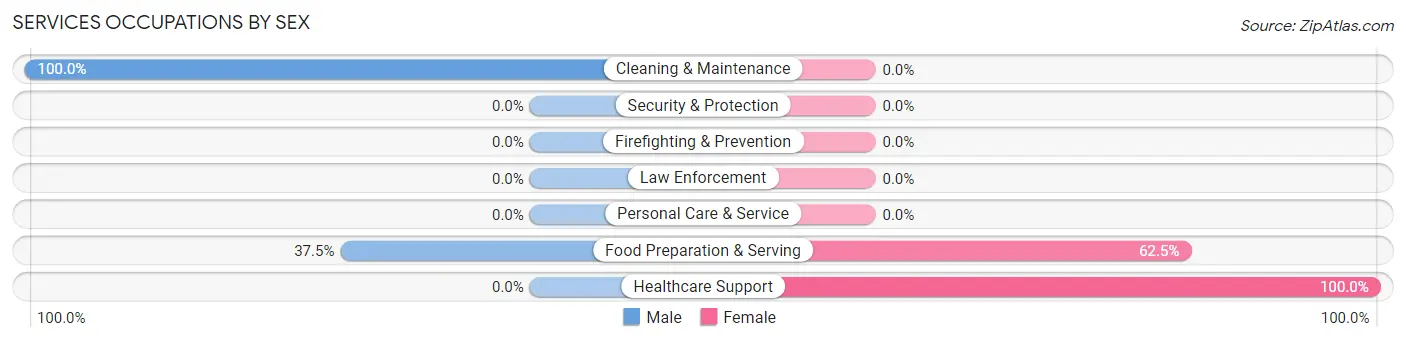
Services Occupations by Sex
Within the Services occupations in Island, the most male-oriented occupations are Cleaning & Maintenance (100.0%), and Food Preparation & Serving (37.5%), while the most female-oriented occupations are Healthcare Support (100.0%), and Food Preparation & Serving (62.5%).
| Occupation | Male | Female |
| Healthcare Support | 0 (0.0%) | 6 (100.0%) |
| Security & Protection | 0 (0.0%) | 0 (0.0%) |
| Firefighting & Prevention | 0 (0.0%) | 0 (0.0%) |
| Law Enforcement | 0 (0.0%) | 0 (0.0%) |
| Food Preparation & Serving | 12 (37.5%) | 20 (62.5%) |
| Cleaning & Maintenance | 2 (100.0%) | 0 (0.0%) |
| Personal Care & Service | 0 (0.0%) | 0 (0.0%) |
| Total (Category) | 14 (35.0%) | 26 (65.0%) |
| Total (Overall) | 103 (50.5%) | 101 (49.5%) |
Sales and Office Occupations
The most common Sales and Office occupations in Island are Sales & Related (7 | 3.4%), and Office & Administration (7 | 3.4%).
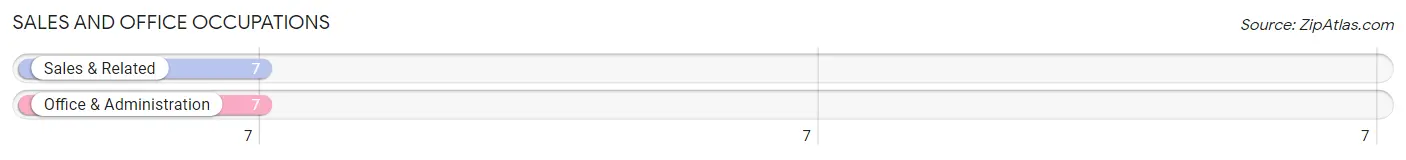
Sales and Office Occupations by Sex
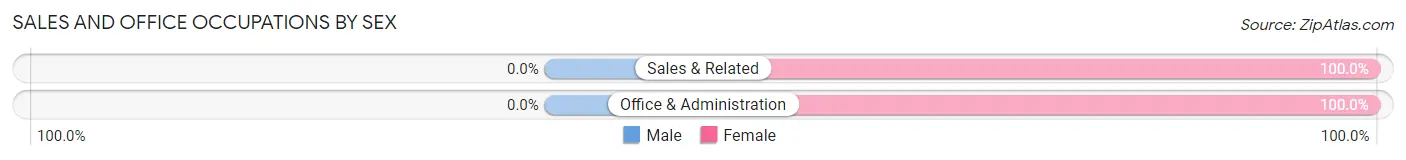
| Occupation | Male | Female |
| Sales & Related | 0 (0.0%) | 7 (100.0%) |
| Office & Administration | 0 (0.0%) | 7 (100.0%) |
| Total (Category) | 0 (0.0%) | 14 (100.0%) |
| Total (Overall) | 103 (50.5%) | 101 (49.5%) |
Natural Resources, Construction and Maintenance Occupations
The most common Natural Resources, Construction and Maintenance occupations in Island are Construction & Extraction (14 | 6.9%), Installation, Maintenance & Repair (14 | 6.9%), and Farming, Fishing & Forestry (8 | 3.9%).
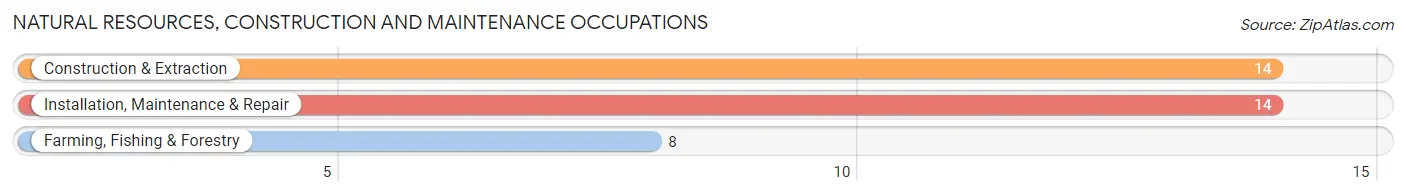
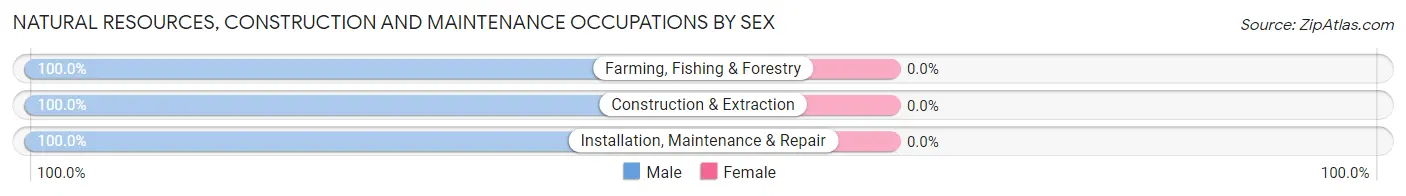
Natural Resources, Construction and Maintenance Occupations by Sex
| Occupation | Male | Female |
| Farming, Fishing & Forestry | 8 (100.0%) | 0 (0.0%) |
| Construction & Extraction | 14 (100.0%) | 0 (0.0%) |
| Installation, Maintenance & Repair | 14 (100.0%) | 0 (0.0%) |
| Total (Category) | 36 (100.0%) | 0 (0.0%) |
| Total (Overall) | 103 (50.5%) | 101 (49.5%) |
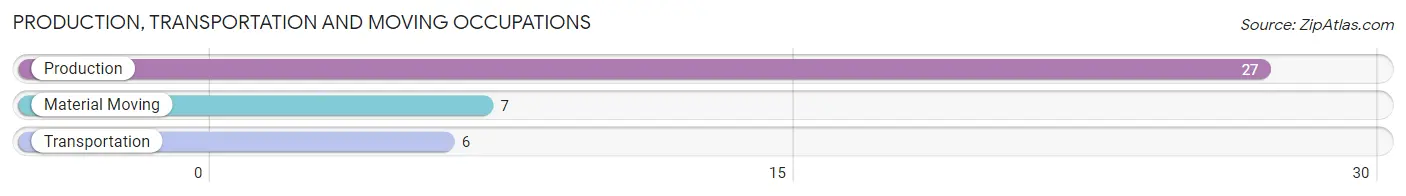
Production, Transportation and Moving Occupations
The most common Production, Transportation and Moving occupations in Island are Production (27 | 13.2%), Material Moving (7 | 3.4%), and Transportation (6 | 2.9%).
Production, Transportation and Moving Occupations by Sex
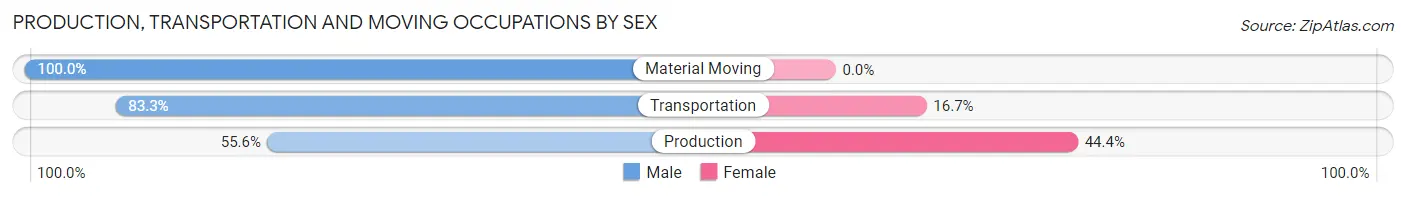
| Occupation | Male | Female |
| Production | 15 (55.6%) | 12 (44.4%) |
| Transportation | 5 (83.3%) | 1 (16.7%) |
| Material Moving | 7 (100.0%) | 0 (0.0%) |
| Total (Category) | 27 (67.5%) | 13 (32.5%) |
| Total (Overall) | 103 (50.5%) | 101 (49.5%) |
Employment Industries by Sex in Island
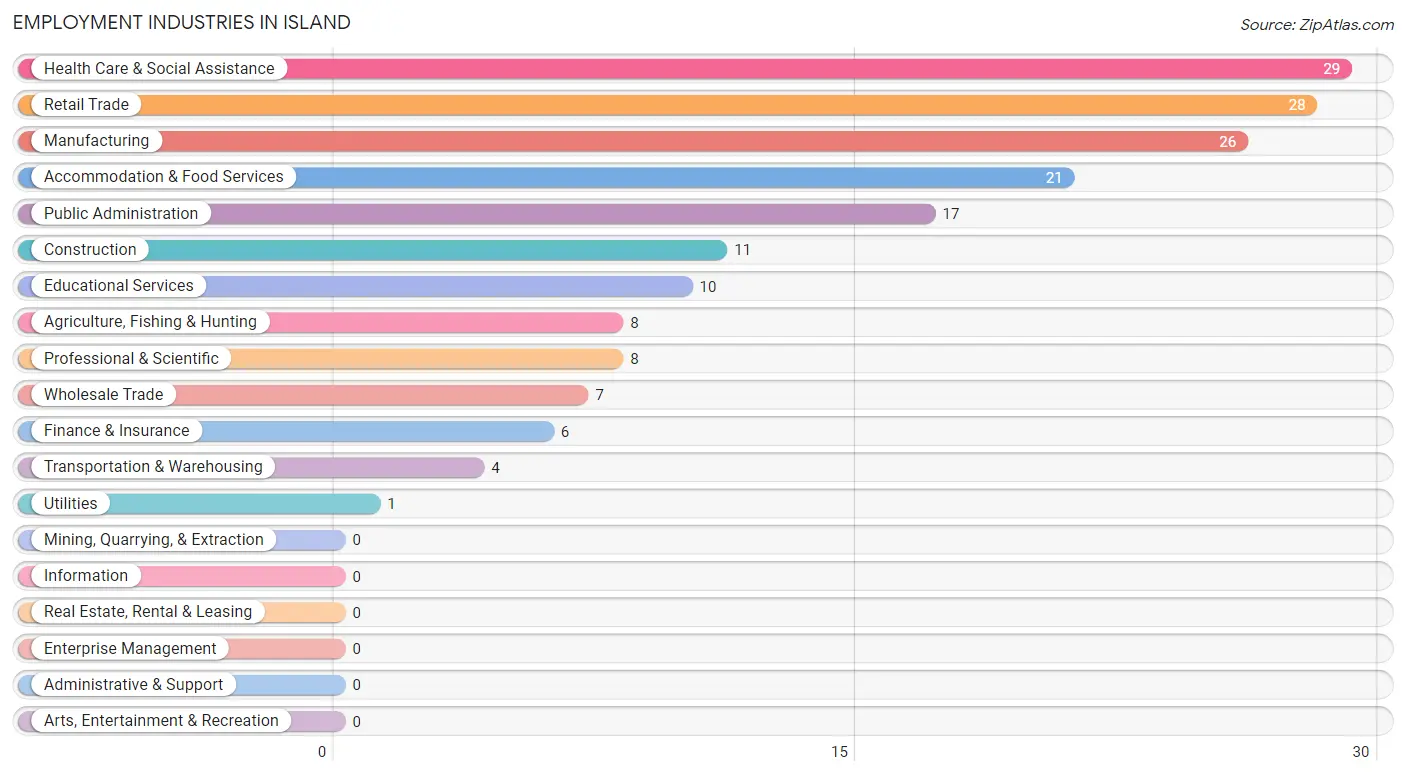
Employment Industries in Island
The major employment industries in Island include Health Care & Social Assistance (29 | 14.2%), Retail Trade (28 | 13.7%), Manufacturing (26 | 12.8%), Accommodation & Food Services (21 | 10.3%), and Public Administration (17 | 8.3%).
Employment Industries by Sex in Island
The Island industries that see more men than women are Agriculture, Fishing & Hunting (100.0%), Construction (100.0%), and Wholesale Trade (100.0%), whereas the industries that tend to have a higher number of women are Finance & Insurance (100.0%), Health Care & Social Assistance (89.7%), and Educational Services (80.0%).
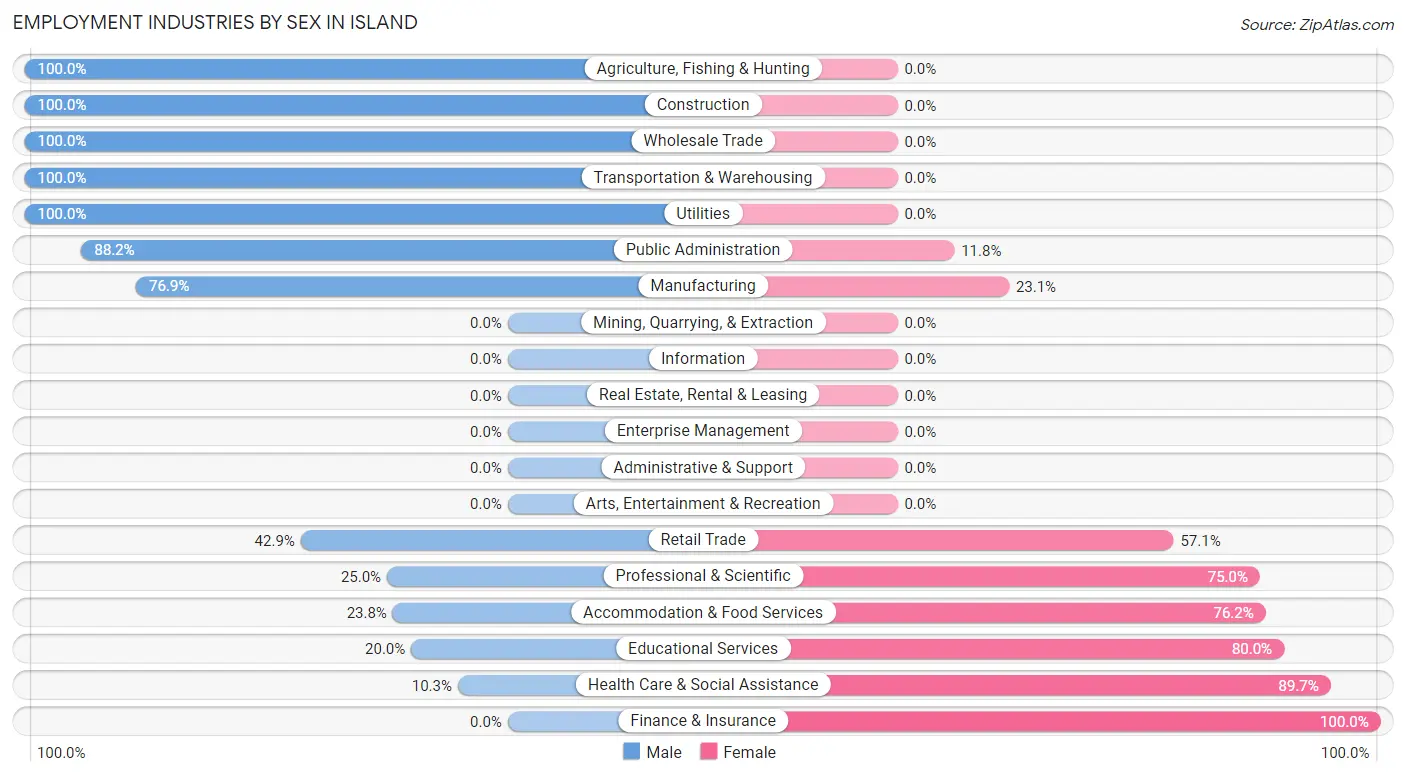
| Industry | Male | Female |
| Agriculture, Fishing & Hunting | 8 (100.0%) | 0 (0.0%) |
| Mining, Quarrying, & Extraction | 0 (0.0%) | 0 (0.0%) |
| Construction | 11 (100.0%) | 0 (0.0%) |
| Manufacturing | 20 (76.9%) | 6 (23.1%) |
| Wholesale Trade | 7 (100.0%) | 0 (0.0%) |
| Retail Trade | 12 (42.9%) | 16 (57.1%) |
| Transportation & Warehousing | 4 (100.0%) | 0 (0.0%) |
| Utilities | 1 (100.0%) | 0 (0.0%) |
| Information | 0 (0.0%) | 0 (0.0%) |
| Finance & Insurance | 0 (0.0%) | 6 (100.0%) |
| Real Estate, Rental & Leasing | 0 (0.0%) | 0 (0.0%) |
| Professional & Scientific | 2 (25.0%) | 6 (75.0%) |
| Enterprise Management | 0 (0.0%) | 0 (0.0%) |
| Administrative & Support | 0 (0.0%) | 0 (0.0%) |
| Educational Services | 2 (20.0%) | 8 (80.0%) |
| Health Care & Social Assistance | 3 (10.3%) | 26 (89.7%) |
| Arts, Entertainment & Recreation | 0 (0.0%) | 0 (0.0%) |
| Accommodation & Food Services | 5 (23.8%) | 16 (76.2%) |
| Public Administration | 15 (88.2%) | 2 (11.8%) |
| Total | 103 (50.5%) | 101 (49.5%) |
Education in Island
School Enrollment in Island
The most common levels of schooling among the 103 students in Island are elementary school (34 | 33.0%), high school (27 | 26.2%), and nursery / preschool (18 | 17.5%).
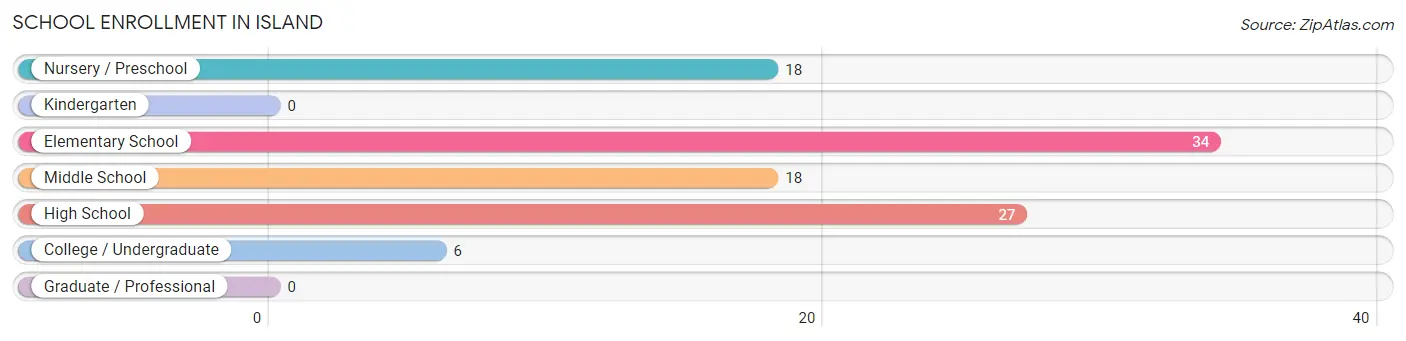
| School Level | # Students | % Students |
| Nursery / Preschool | 18 | 17.5% |
| Kindergarten | 0 | 0.0% |
| Elementary School | 34 | 33.0% |
| Middle School | 18 | 17.5% |
| High School | 27 | 26.2% |
| College / Undergraduate | 6 | 5.8% |
| Graduate / Professional | 0 | 0.0% |
| Total | 103 | 100.0% |
School Enrollment by Age by Funding Source in Island
Out of a total of 103 students who are enrolled in schools in Island, 6 (5.8%) attend a private institution, while the remaining 97 (94.2%) are enrolled in public schools. The age group of 5 to 9 year old has the highest likelihood of being enrolled in private schools, with 4 (10.8% in the age bracket) enrolled. Conversely, the age group of 3 to 4 year olds has the lowest likelihood of being enrolled in a private school, with 14 (100.0% in the age bracket) attending a public institution.
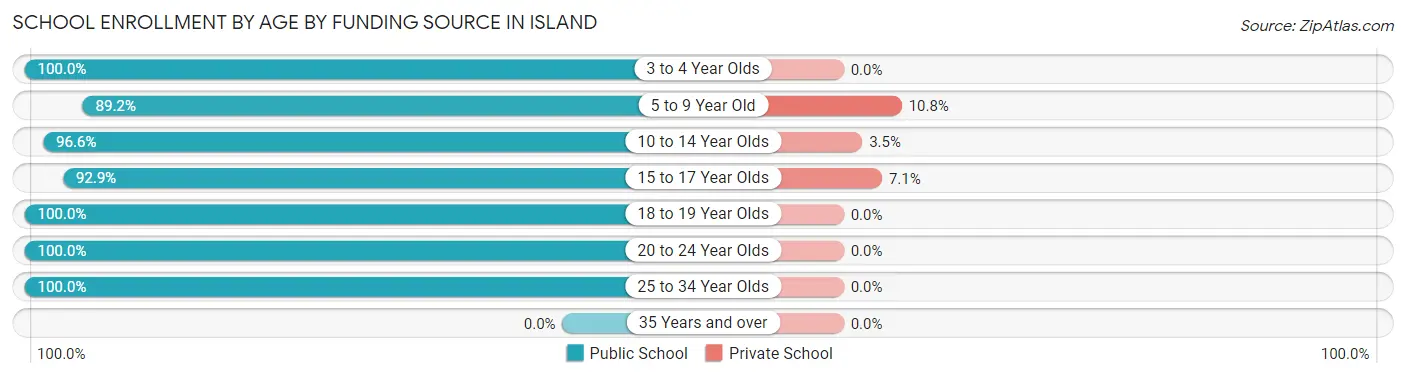
| Age Bracket | Public School | Private School |
| 3 to 4 Year Olds | 14 (100.0%) | 0 (0.0%) |
| 5 to 9 Year Old | 33 (89.2%) | 4 (10.8%) |
| 10 to 14 Year Olds | 28 (96.6%) | 1 (3.5%) |
| 15 to 17 Year Olds | 13 (92.9%) | 1 (7.1%) |
| 18 to 19 Year Olds | 3 (100.0%) | 0 (0.0%) |
| 20 to 24 Year Olds | 2 (100.0%) | 0 (0.0%) |
| 25 to 34 Year Olds | 4 (100.0%) | 0 (0.0%) |
| 35 Years and over | 0 (0.0%) | 0 (0.0%) |
| Total | 97 (94.2%) | 6 (5.8%) |
Educational Attainment by Field of Study in Island
Arts & humanities (18 | 43.9%), business (12 | 29.3%), education (6 | 14.6%), computers & mathematics (3 | 7.3%), and bio, nature & agricultural (2 | 4.9%) are the most common fields of study among 41 individuals in Island who have obtained a bachelor's degree or higher.
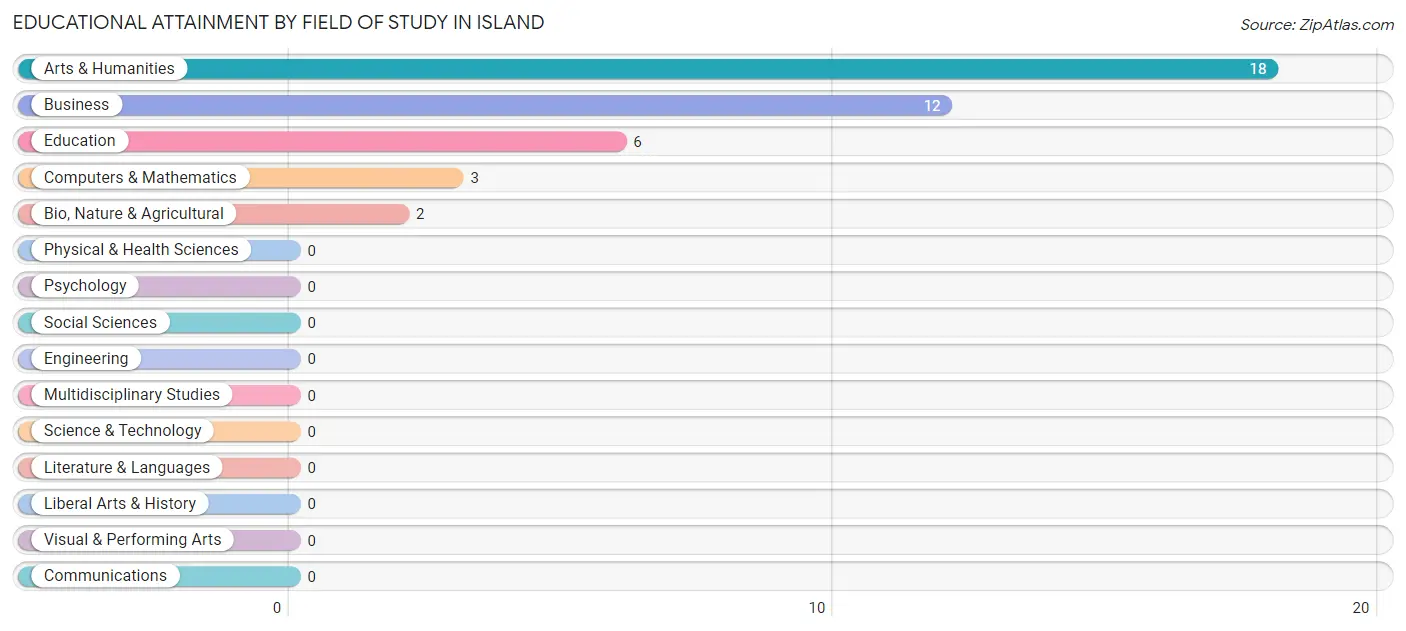
| Field of Study | # Graduates | % Graduates |
| Computers & Mathematics | 3 | 7.3% |
| Bio, Nature & Agricultural | 2 | 4.9% |
| Physical & Health Sciences | 0 | 0.0% |
| Psychology | 0 | 0.0% |
| Social Sciences | 0 | 0.0% |
| Engineering | 0 | 0.0% |
| Multidisciplinary Studies | 0 | 0.0% |
| Science & Technology | 0 | 0.0% |
| Business | 12 | 29.3% |
| Education | 6 | 14.6% |
| Literature & Languages | 0 | 0.0% |
| Liberal Arts & History | 0 | 0.0% |
| Visual & Performing Arts | 0 | 0.0% |
| Communications | 0 | 0.0% |
| Arts & Humanities | 18 | 43.9% |
| Total | 41 | 100.0% |
Transportation & Commute in Island
Vehicle Availability by Sex in Island
The most prevalent vehicle ownership categories in Island are males with 2 vehicles (47, accounting for 45.6%) and females with 2 vehicles (37, making up 46.5%).
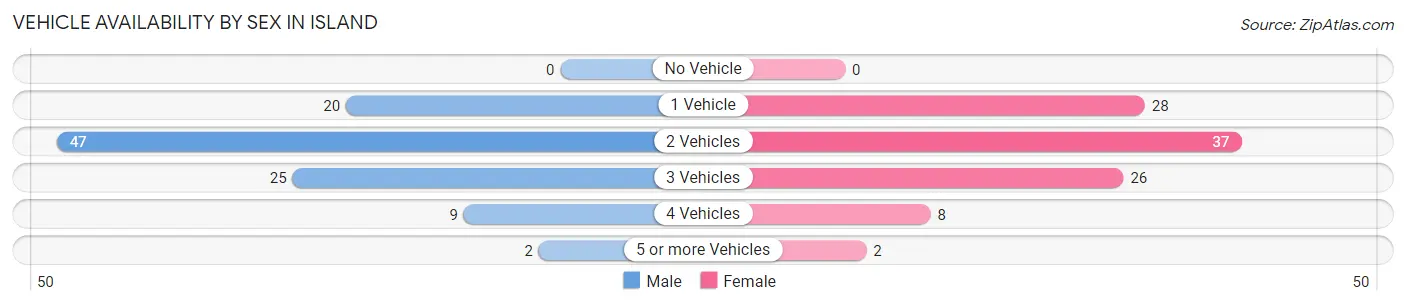
| Vehicles Available | Male | Female |
| No Vehicle | 0 (0.0%) | 0 (0.0%) |
| 1 Vehicle | 20 (19.4%) | 28 (27.7%) |
| 2 Vehicles | 47 (45.6%) | 37 (36.6%) |
| 3 Vehicles | 25 (24.3%) | 26 (25.7%) |
| 4 Vehicles | 9 (8.7%) | 8 (7.9%) |
| 5 or more Vehicles | 2 (1.9%) | 2 (2.0%) |
| Total | 103 (100.0%) | 101 (100.0%) |
Commute Time in Island
The most frequently occuring commute durations in Island are 5 to 9 minutes (36 commuters, 18.6%), 30 to 34 minutes (27 commuters, 13.9%), and 20 to 24 minutes (24 commuters, 12.4%).
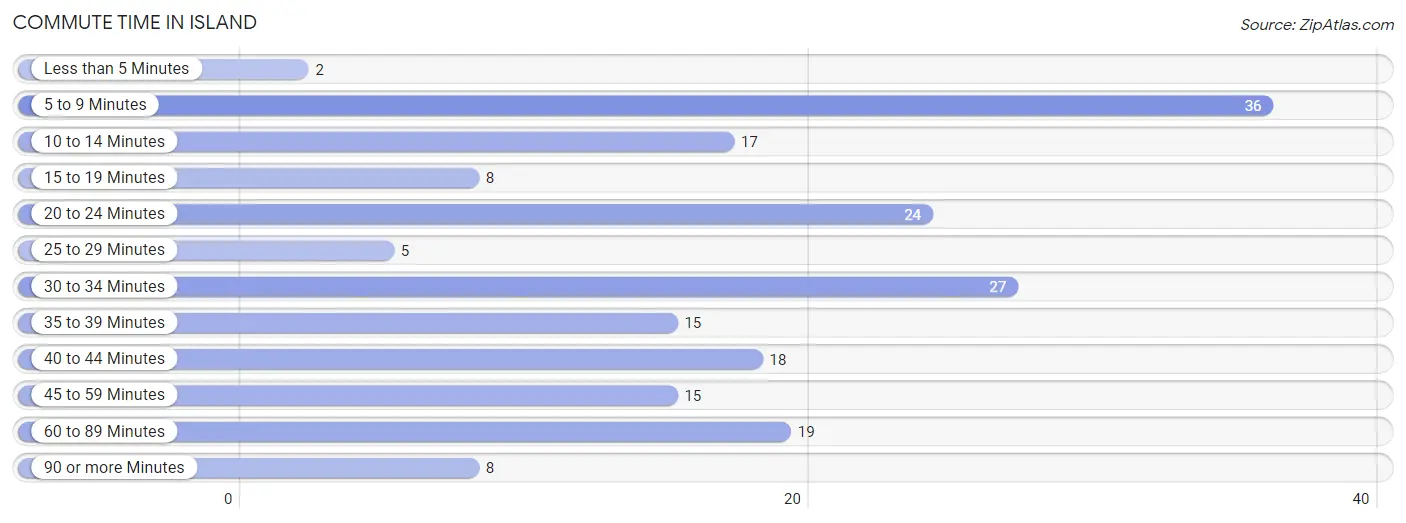
| Commute Time | # Commuters | % Commuters |
| Less than 5 Minutes | 2 | 1.0% |
| 5 to 9 Minutes | 36 | 18.6% |
| 10 to 14 Minutes | 17 | 8.8% |
| 15 to 19 Minutes | 8 | 4.1% |
| 20 to 24 Minutes | 24 | 12.4% |
| 25 to 29 Minutes | 5 | 2.6% |
| 30 to 34 Minutes | 27 | 13.9% |
| 35 to 39 Minutes | 15 | 7.7% |
| 40 to 44 Minutes | 18 | 9.3% |
| 45 to 59 Minutes | 15 | 7.7% |
| 60 to 89 Minutes | 19 | 9.8% |
| 90 or more Minutes | 8 | 4.1% |
Commute Time by Sex in Island
The most common commute times in Island are 60 to 89 minutes (19 commuters, 19.6%) for males and 30 to 34 minutes (21 commuters, 21.6%) for females.
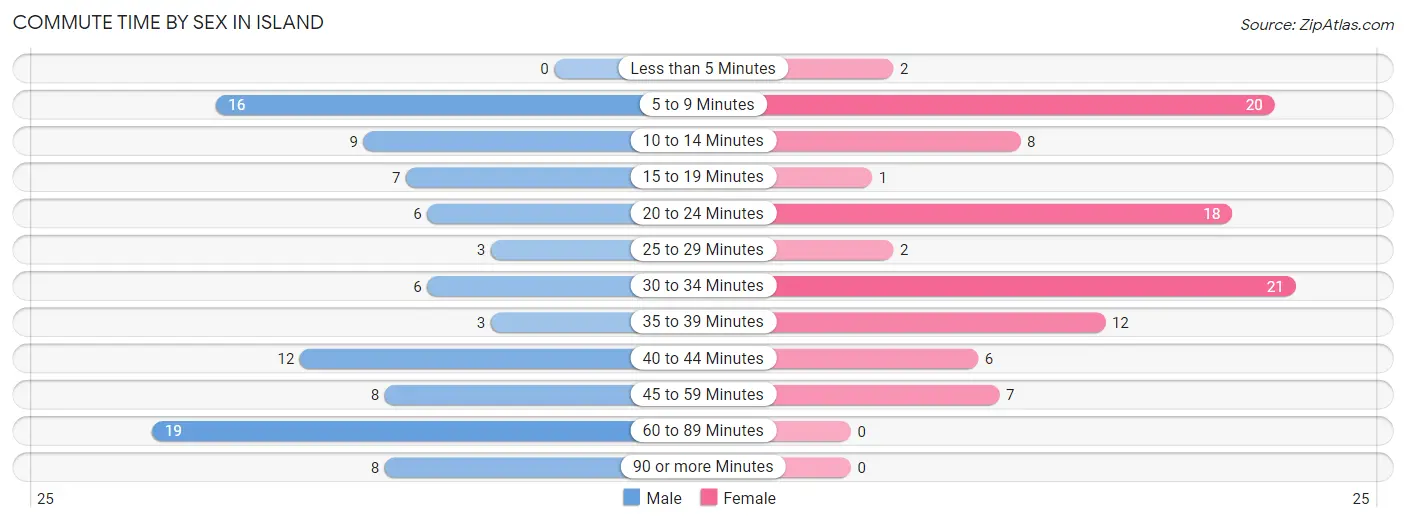
| Commute Time | Male | Female |
| Less than 5 Minutes | 0 (0.0%) | 2 (2.1%) |
| 5 to 9 Minutes | 16 (16.5%) | 20 (20.6%) |
| 10 to 14 Minutes | 9 (9.3%) | 8 (8.3%) |
| 15 to 19 Minutes | 7 (7.2%) | 1 (1.0%) |
| 20 to 24 Minutes | 6 (6.2%) | 18 (18.6%) |
| 25 to 29 Minutes | 3 (3.1%) | 2 (2.1%) |
| 30 to 34 Minutes | 6 (6.2%) | 21 (21.6%) |
| 35 to 39 Minutes | 3 (3.1%) | 12 (12.4%) |
| 40 to 44 Minutes | 12 (12.4%) | 6 (6.2%) |
| 45 to 59 Minutes | 8 (8.3%) | 7 (7.2%) |
| 60 to 89 Minutes | 19 (19.6%) | 0 (0.0%) |
| 90 or more Minutes | 8 (8.3%) | 0 (0.0%) |
Time of Departure to Work by Sex in Island
The most frequent times of departure to work in Island are 5:30 AM to 5:59 AM (14, 14.4%) for males and 6:30 AM to 6:59 AM (18, 18.6%) for females.
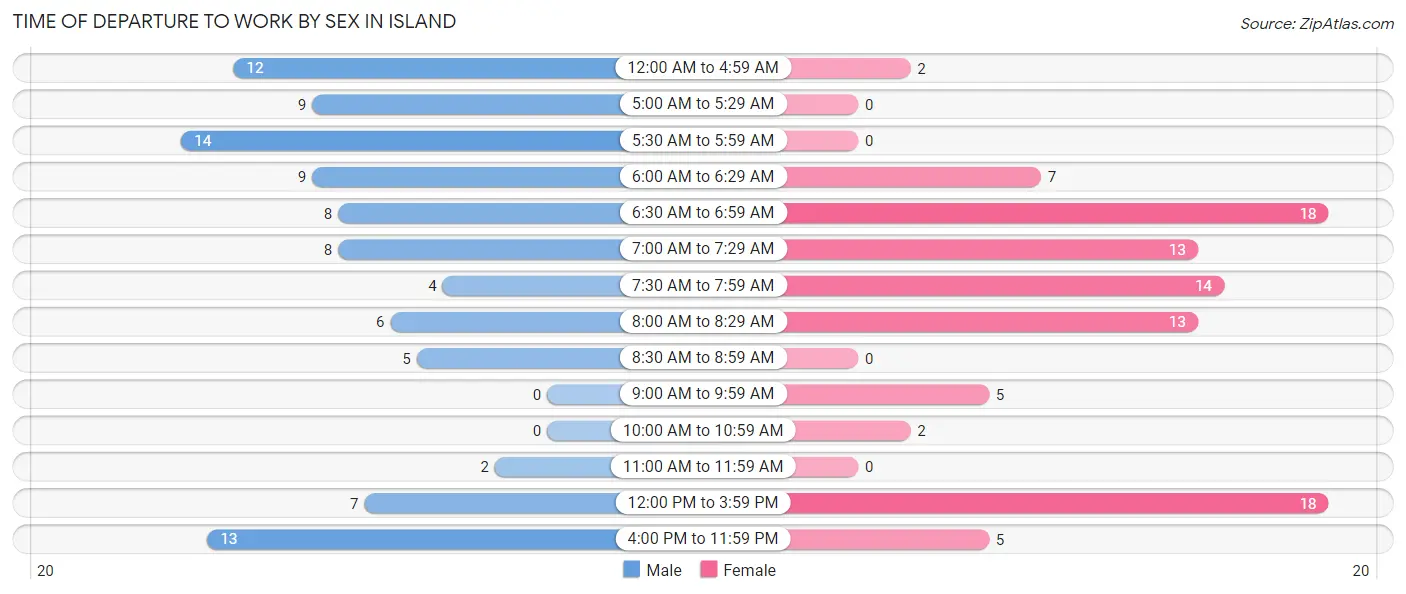
| Time of Departure | Male | Female |
| 12:00 AM to 4:59 AM | 12 (12.4%) | 2 (2.1%) |
| 5:00 AM to 5:29 AM | 9 (9.3%) | 0 (0.0%) |
| 5:30 AM to 5:59 AM | 14 (14.4%) | 0 (0.0%) |
| 6:00 AM to 6:29 AM | 9 (9.3%) | 7 (7.2%) |
| 6:30 AM to 6:59 AM | 8 (8.3%) | 18 (18.6%) |
| 7:00 AM to 7:29 AM | 8 (8.3%) | 13 (13.4%) |
| 7:30 AM to 7:59 AM | 4 (4.1%) | 14 (14.4%) |
| 8:00 AM to 8:29 AM | 6 (6.2%) | 13 (13.4%) |
| 8:30 AM to 8:59 AM | 5 (5.1%) | 0 (0.0%) |
| 9:00 AM to 9:59 AM | 0 (0.0%) | 5 (5.1%) |
| 10:00 AM to 10:59 AM | 0 (0.0%) | 2 (2.1%) |
| 11:00 AM to 11:59 AM | 2 (2.1%) | 0 (0.0%) |
| 12:00 PM to 3:59 PM | 7 (7.2%) | 18 (18.6%) |
| 4:00 PM to 11:59 PM | 13 (13.4%) | 5 (5.1%) |
| Total | 97 (100.0%) | 97 (100.0%) |
Housing Occupancy in Island
Occupancy by Ownership in Island
Of the total 260 dwellings in Island, owner-occupied units account for 193 (74.2%), while renter-occupied units make up 67 (25.8%).
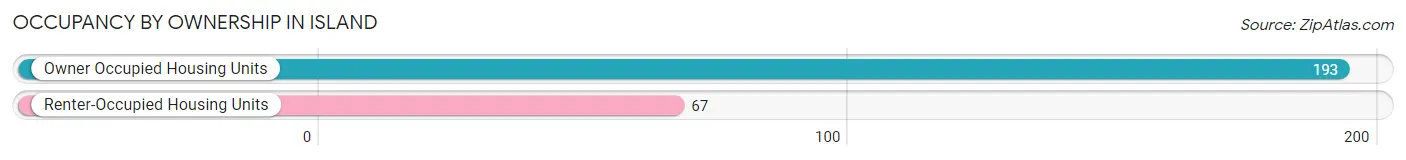
| Occupancy | # Housing Units | % Housing Units |
| Owner Occupied Housing Units | 193 | 74.2% |
| Renter-Occupied Housing Units | 67 | 25.8% |
| Total Occupied Housing Units | 260 | 100.0% |
Occupancy by Household Size in Island
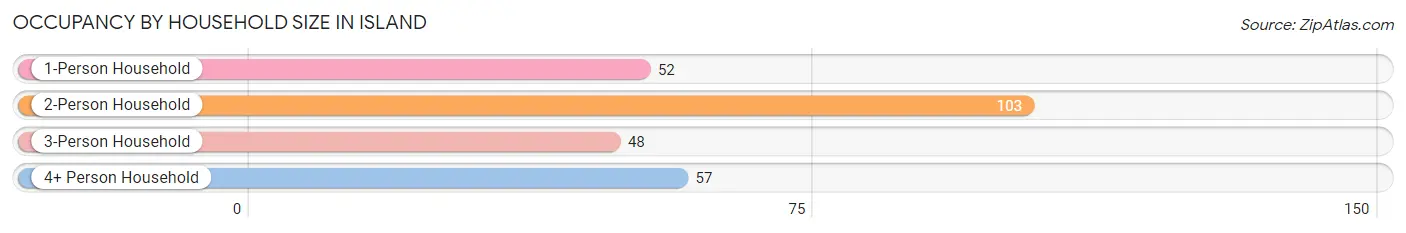
| Household Size | # Housing Units | % Housing Units |
| 1-Person Household | 52 | 20.0% |
| 2-Person Household | 103 | 39.6% |
| 3-Person Household | 48 | 18.5% |
| 4+ Person Household | 57 | 21.9% |
| Total Housing Units | 260 | 100.0% |
Occupancy by Ownership by Household Size in Island
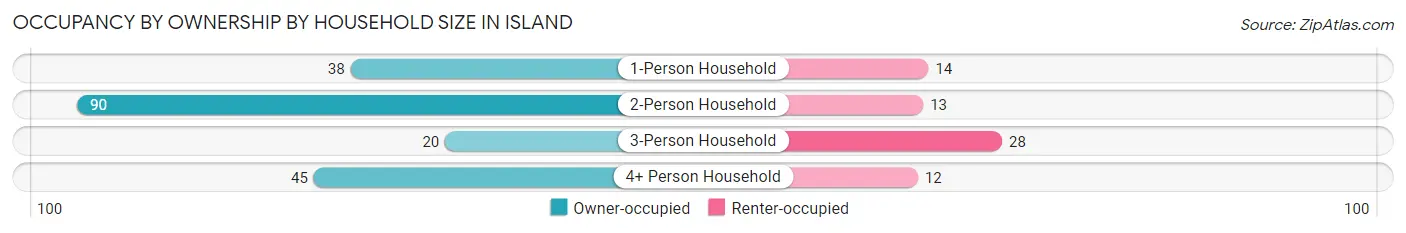
| Household Size | Owner-occupied | Renter-occupied |
| 1-Person Household | 38 (73.1%) | 14 (26.9%) |
| 2-Person Household | 90 (87.4%) | 13 (12.6%) |
| 3-Person Household | 20 (41.7%) | 28 (58.3%) |
| 4+ Person Household | 45 (78.9%) | 12 (21.0%) |
| Total Housing Units | 193 (74.2%) | 67 (25.8%) |
Occupancy by Educational Attainment in Island
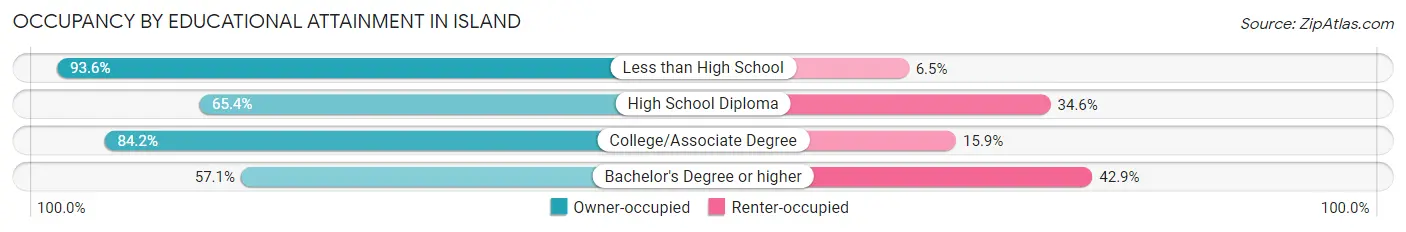
| Household Size | Owner-occupied | Renter-occupied |
| Less than High School | 29 (93.5%) | 2 (6.5%) |
| High School Diploma | 87 (65.4%) | 46 (34.6%) |
| College/Associate Degree | 69 (84.2%) | 13 (15.9%) |
| Bachelor's Degree or higher | 8 (57.1%) | 6 (42.9%) |
Occupancy by Age of Householder in Island
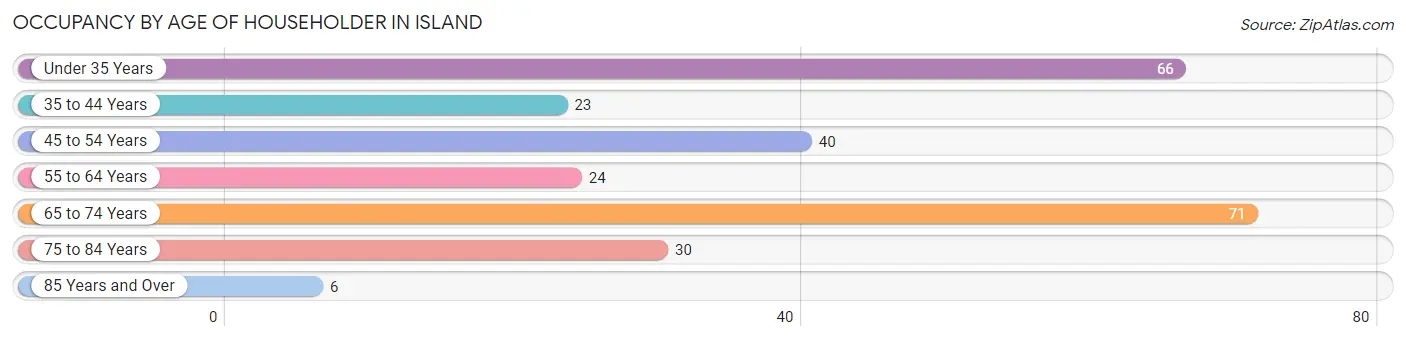
| Age Bracket | # Households | % Households |
| Under 35 Years | 66 | 25.4% |
| 35 to 44 Years | 23 | 8.8% |
| 45 to 54 Years | 40 | 15.4% |
| 55 to 64 Years | 24 | 9.2% |
| 65 to 74 Years | 71 | 27.3% |
| 75 to 84 Years | 30 | 11.5% |
| 85 Years and Over | 6 | 2.3% |
| Total | 260 | 100.0% |
Housing Finances in Island
Median Income by Occupancy in Island
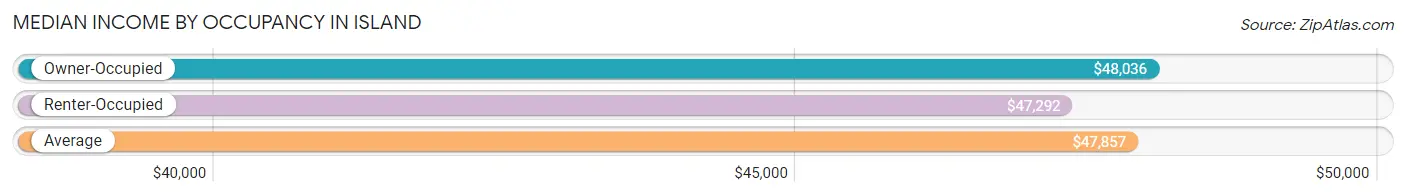
| Occupancy Type | # Households | Median Income |
| Owner-Occupied | 193 (74.2%) | $48,036 |
| Renter-Occupied | 67 (25.8%) | $47,292 |
| Average | 260 (100.0%) | $47,857 |
Occupancy by Householder Income Bracket in Island
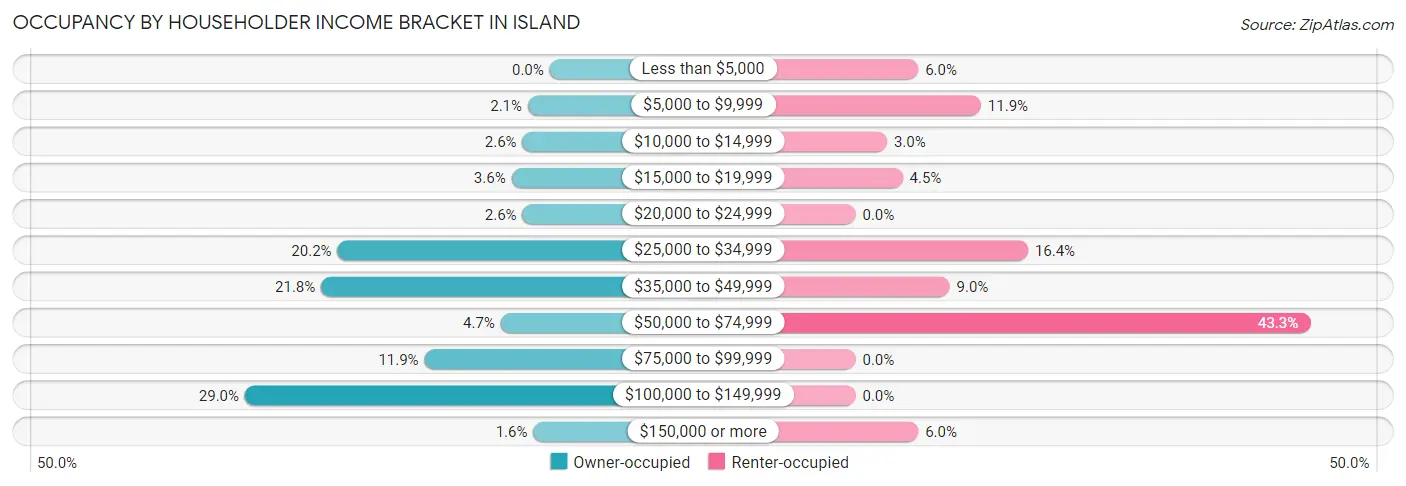
| Income Bracket | Owner-occupied | Renter-occupied |
| Less than $5,000 | 0 (0.0%) | 4 (6.0%) |
| $5,000 to $9,999 | 4 (2.1%) | 8 (11.9%) |
| $10,000 to $14,999 | 5 (2.6%) | 2 (3.0%) |
| $15,000 to $19,999 | 7 (3.6%) | 3 (4.5%) |
| $20,000 to $24,999 | 5 (2.6%) | 0 (0.0%) |
| $25,000 to $34,999 | 39 (20.2%) | 11 (16.4%) |
| $35,000 to $49,999 | 42 (21.8%) | 6 (9.0%) |
| $50,000 to $74,999 | 9 (4.7%) | 29 (43.3%) |
| $75,000 to $99,999 | 23 (11.9%) | 0 (0.0%) |
| $100,000 to $149,999 | 56 (29.0%) | 0 (0.0%) |
| $150,000 or more | 3 (1.5%) | 4 (6.0%) |
| Total | 193 (100.0%) | 67 (100.0%) |
Monthly Housing Cost Tiers in Island
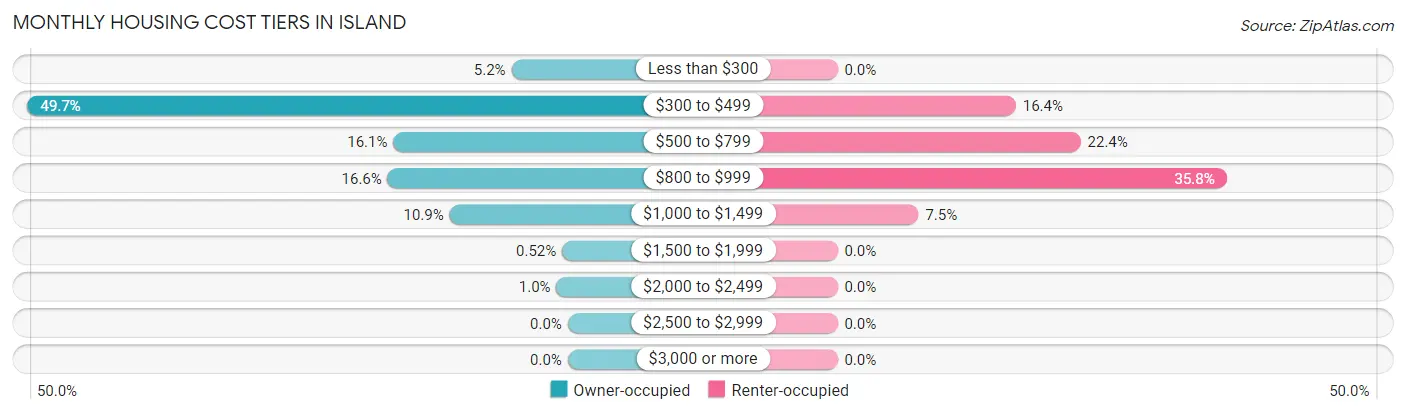
| Monthly Cost | Owner-occupied | Renter-occupied |
| Less than $300 | 10 (5.2%) | 0 (0.0%) |
| $300 to $499 | 96 (49.7%) | 11 (16.4%) |
| $500 to $799 | 31 (16.1%) | 15 (22.4%) |
| $800 to $999 | 32 (16.6%) | 24 (35.8%) |
| $1,000 to $1,499 | 21 (10.9%) | 5 (7.5%) |
| $1,500 to $1,999 | 1 (0.5%) | 0 (0.0%) |
| $2,000 to $2,499 | 2 (1.0%) | 0 (0.0%) |
| $2,500 to $2,999 | 0 (0.0%) | 0 (0.0%) |
| $3,000 or more | 0 (0.0%) | 0 (0.0%) |
| Total | 193 (100.0%) | 67 (100.0%) |
Physical Housing Characteristics in Island
Housing Structures in Island
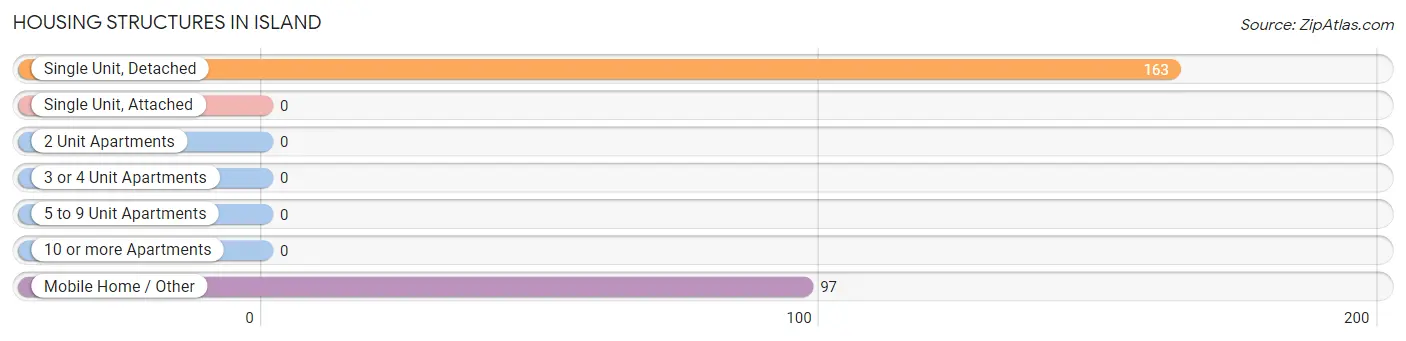
| Structure Type | # Housing Units | % Housing Units |
| Single Unit, Detached | 163 | 62.7% |
| Single Unit, Attached | 0 | 0.0% |
| 2 Unit Apartments | 0 | 0.0% |
| 3 or 4 Unit Apartments | 0 | 0.0% |
| 5 to 9 Unit Apartments | 0 | 0.0% |
| 10 or more Apartments | 0 | 0.0% |
| Mobile Home / Other | 97 | 37.3% |
| Total | 260 | 100.0% |
Housing Structures by Occupancy in Island
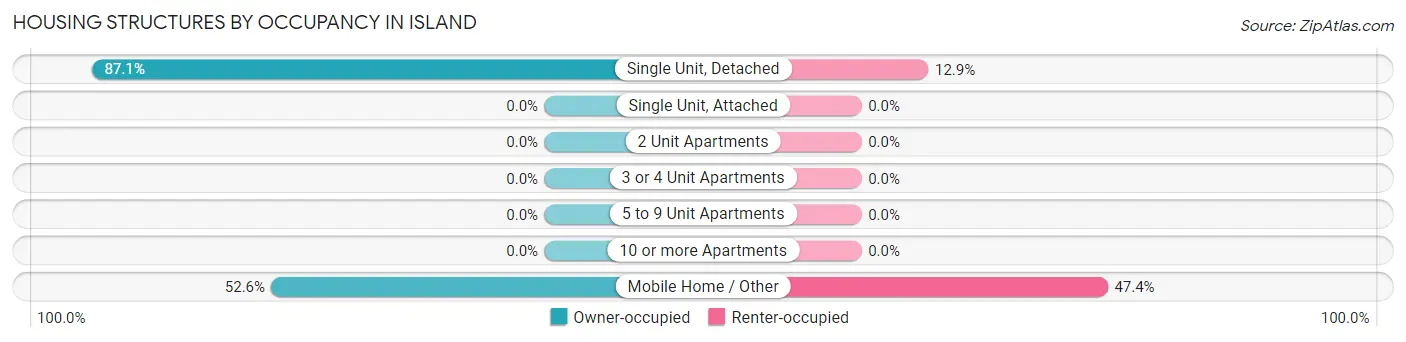
| Structure Type | Owner-occupied | Renter-occupied |
| Single Unit, Detached | 142 (87.1%) | 21 (12.9%) |
| Single Unit, Attached | 0 (0.0%) | 0 (0.0%) |
| 2 Unit Apartments | 0 (0.0%) | 0 (0.0%) |
| 3 or 4 Unit Apartments | 0 (0.0%) | 0 (0.0%) |
| 5 to 9 Unit Apartments | 0 (0.0%) | 0 (0.0%) |
| 10 or more Apartments | 0 (0.0%) | 0 (0.0%) |
| Mobile Home / Other | 51 (52.6%) | 46 (47.4%) |
| Total | 193 (74.2%) | 67 (25.8%) |
Housing Structures by Number of Rooms in Island
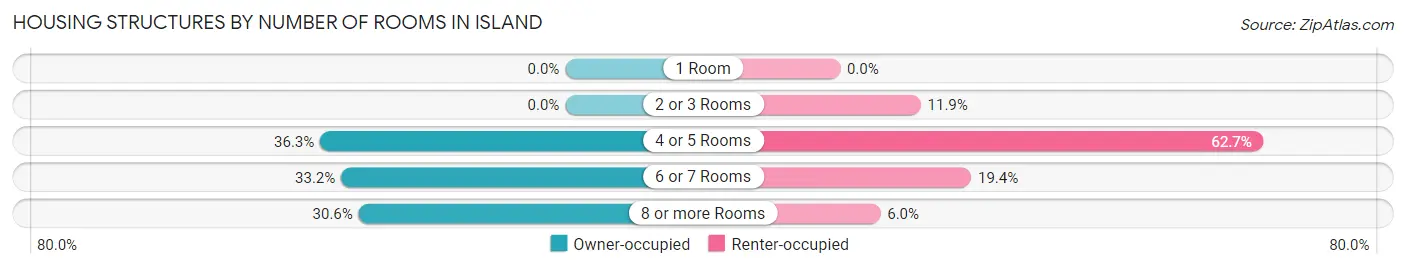
| Number of Rooms | Owner-occupied | Renter-occupied |
| 1 Room | 0 (0.0%) | 0 (0.0%) |
| 2 or 3 Rooms | 0 (0.0%) | 8 (11.9%) |
| 4 or 5 Rooms | 70 (36.3%) | 42 (62.7%) |
| 6 or 7 Rooms | 64 (33.2%) | 13 (19.4%) |
| 8 or more Rooms | 59 (30.6%) | 4 (6.0%) |
| Total | 193 (100.0%) | 67 (100.0%) |
Housing Structure by Heating Type in Island
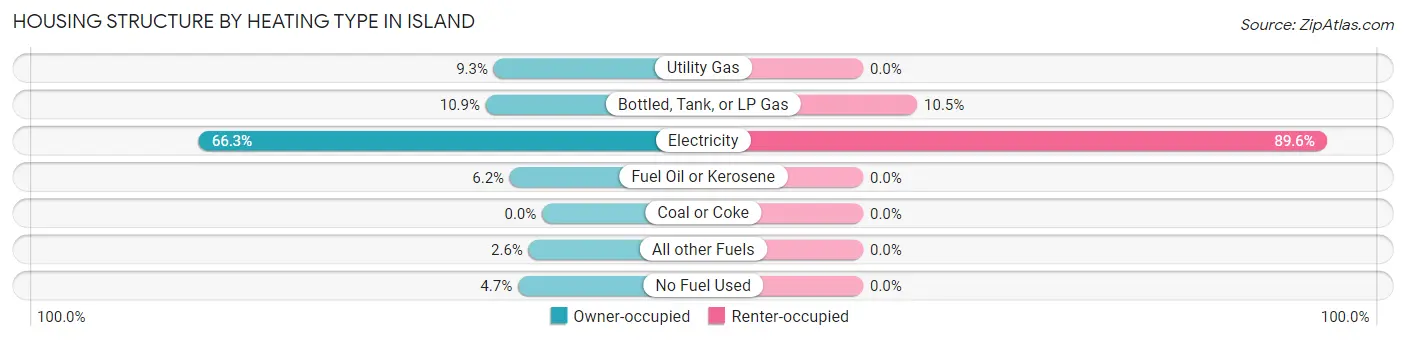
| Heating Type | Owner-occupied | Renter-occupied |
| Utility Gas | 18 (9.3%) | 0 (0.0%) |
| Bottled, Tank, or LP Gas | 21 (10.9%) | 7 (10.4%) |
| Electricity | 128 (66.3%) | 60 (89.5%) |
| Fuel Oil or Kerosene | 12 (6.2%) | 0 (0.0%) |
| Coal or Coke | 0 (0.0%) | 0 (0.0%) |
| All other Fuels | 5 (2.6%) | 0 (0.0%) |
| No Fuel Used | 9 (4.7%) | 0 (0.0%) |
| Total | 193 (100.0%) | 67 (100.0%) |
Household Vehicle Usage in Island

| Vehicles per Household | Owner-occupied | Renter-occupied |
| No Vehicle | 0 (0.0%) | 8 (11.9%) |
| 1 Vehicle | 49 (25.4%) | 17 (25.4%) |
| 2 Vehicles | 99 (51.3%) | 38 (56.7%) |
| 3 or more Vehicles | 45 (23.3%) | 4 (6.0%) |
| Total | 193 (100.0%) | 67 (100.0%) |
Real Estate & Mortgages in Island
Real Estate and Mortgage Overview in Island
| Characteristic | Without Mortgage | With Mortgage |
| Housing Units | 130 | 63 |
| Median Property Value | $64,700 | $80,600 |
| Median Household Income | $46,250 | $2 |
| Monthly Housing Costs | $344 | $0 |
| Real Estate Taxes | $283 | $0 |
Property Value by Mortgage Status in Island
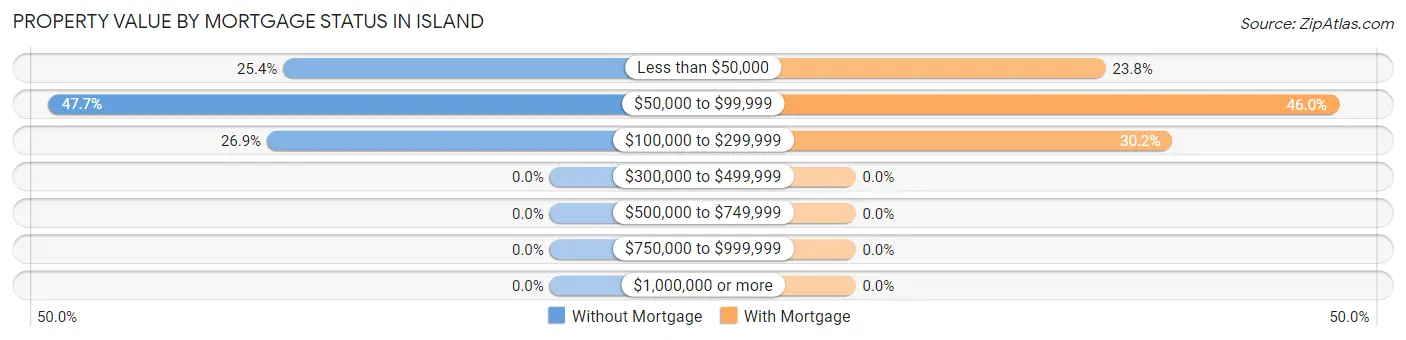
| Property Value | Without Mortgage | With Mortgage |
| Less than $50,000 | 33 (25.4%) | 15 (23.8%) |
| $50,000 to $99,999 | 62 (47.7%) | 29 (46.0%) |
| $100,000 to $299,999 | 35 (26.9%) | 19 (30.2%) |
| $300,000 to $499,999 | 0 (0.0%) | 0 (0.0%) |
| $500,000 to $749,999 | 0 (0.0%) | 0 (0.0%) |
| $750,000 to $999,999 | 0 (0.0%) | 0 (0.0%) |
| $1,000,000 or more | 0 (0.0%) | 0 (0.0%) |
| Total | 130 (100.0%) | 63 (100.0%) |
Household Income by Mortgage Status in Island
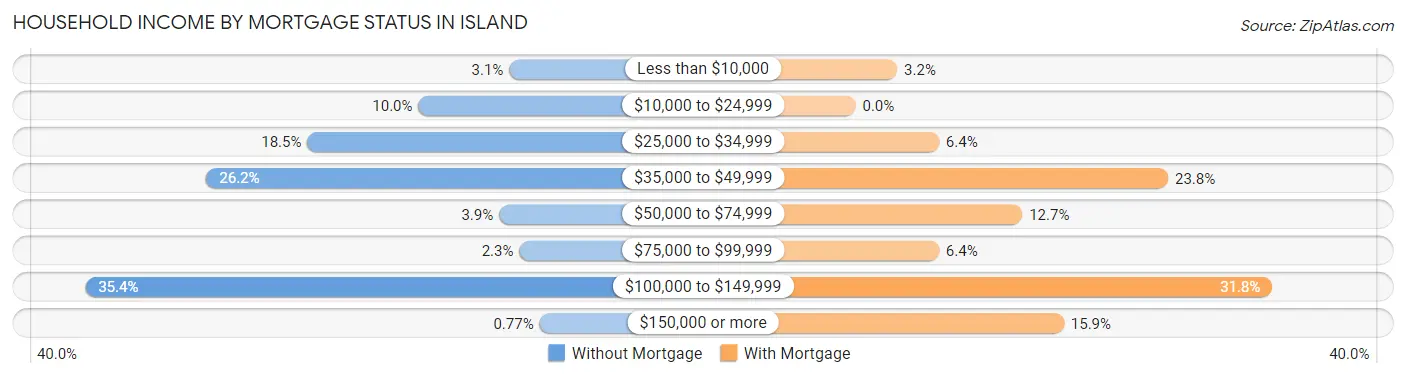
| Household Income | Without Mortgage | With Mortgage |
| Less than $10,000 | 4 (3.1%) | 2 (3.2%) |
| $10,000 to $24,999 | 13 (10.0%) | 0 (0.0%) |
| $25,000 to $34,999 | 24 (18.5%) | 4 (6.4%) |
| $35,000 to $49,999 | 34 (26.2%) | 15 (23.8%) |
| $50,000 to $74,999 | 5 (3.8%) | 8 (12.7%) |
| $75,000 to $99,999 | 3 (2.3%) | 4 (6.4%) |
| $100,000 to $149,999 | 46 (35.4%) | 20 (31.8%) |
| $150,000 or more | 1 (0.8%) | 10 (15.9%) |
| Total | 130 (100.0%) | 63 (100.0%) |
Property Value to Household Income Ratio in Island
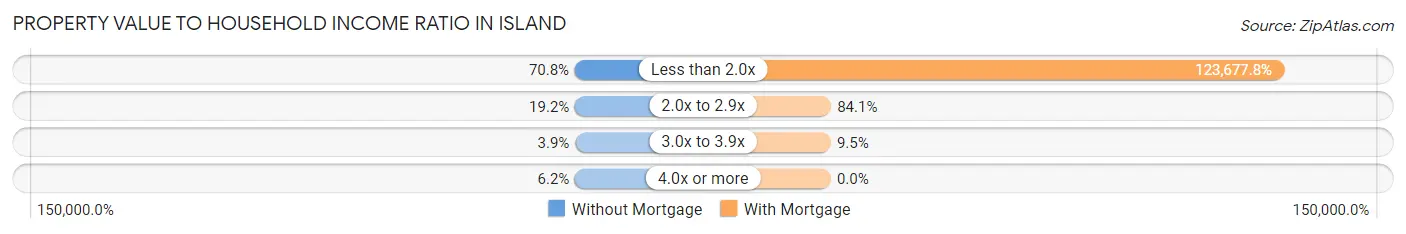
| Value-to-Income Ratio | Without Mortgage | With Mortgage |
| Less than 2.0x | 92 (70.8%) | 77,917 (123,677.8%) |
| 2.0x to 2.9x | 25 (19.2%) | 53 (84.1%) |
| 3.0x to 3.9x | 5 (3.8%) | 6 (9.5%) |
| 4.0x or more | 8 (6.1%) | 0 (0.0%) |
| Total | 130 (100.0%) | 63 (100.0%) |
Real Estate Taxes by Mortgage Status in Island
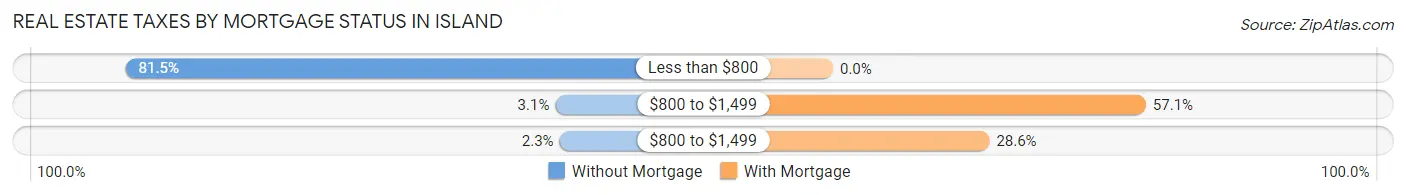
| Property Taxes | Without Mortgage | With Mortgage |
| Less than $800 | 106 (81.5%) | 0 (0.0%) |
| $800 to $1,499 | 4 (3.1%) | 36 (57.1%) |
| $800 to $1,499 | 3 (2.3%) | 18 (28.6%) |
| Total | 130 (100.0%) | 63 (100.0%) |
Health & Disability in Island
Health Insurance Coverage by Age in Island
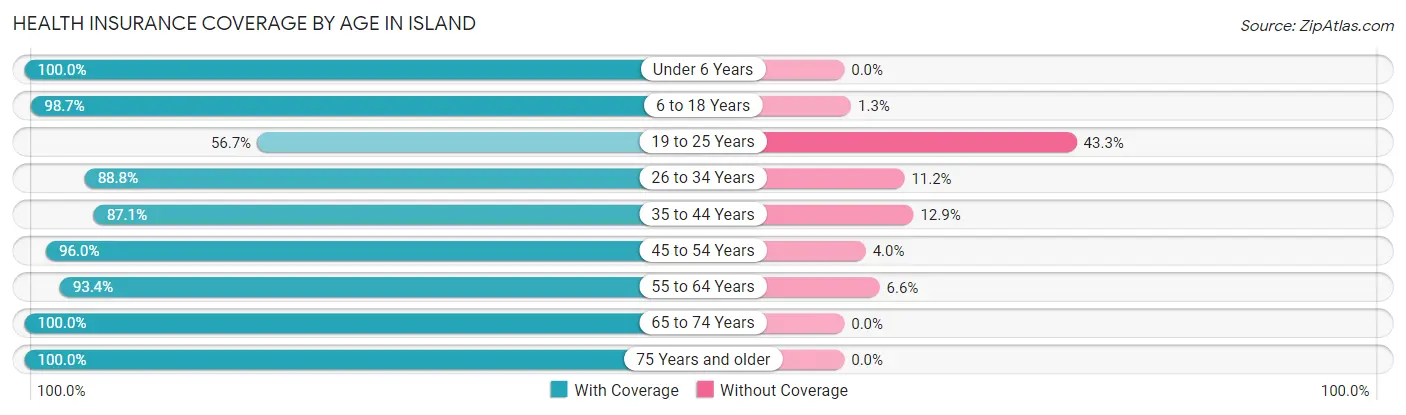
| Age Bracket | With Coverage | Without Coverage |
| Under 6 Years | 43 (100.0%) | 0 (0.0%) |
| 6 to 18 Years | 78 (98.7%) | 1 (1.3%) |
| 19 to 25 Years | 17 (56.7%) | 13 (43.3%) |
| 26 to 34 Years | 87 (88.8%) | 11 (11.2%) |
| 35 to 44 Years | 54 (87.1%) | 8 (12.9%) |
| 45 to 54 Years | 72 (96.0%) | 3 (4.0%) |
| 55 to 64 Years | 71 (93.4%) | 5 (6.6%) |
| 65 to 74 Years | 91 (100.0%) | 0 (0.0%) |
| 75 Years and older | 61 (100.0%) | 0 (0.0%) |
| Total | 574 (93.3%) | 41 (6.7%) |
Health Insurance Coverage by Citizenship Status in Island
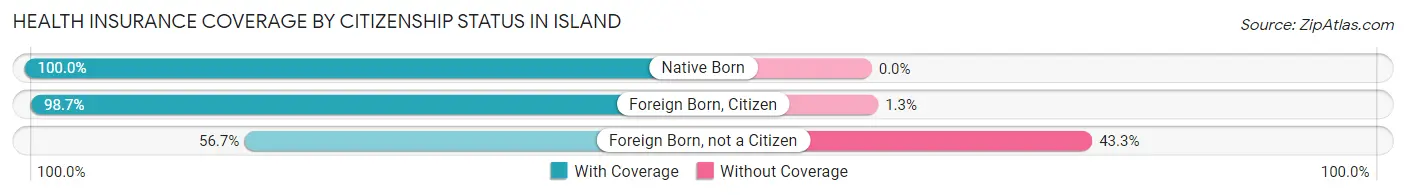
| Citizenship Status | With Coverage | Without Coverage |
| Native Born | 43 (100.0%) | 0 (0.0%) |
| Foreign Born, Citizen | 78 (98.7%) | 1 (1.3%) |
| Foreign Born, not a Citizen | 17 (56.7%) | 13 (43.3%) |
Health Insurance Coverage by Household Income in Island
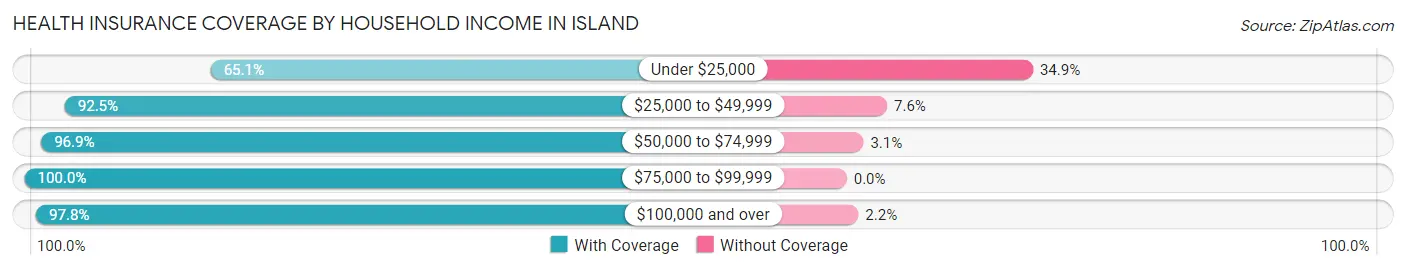
| Household Income | With Coverage | Without Coverage |
| Under $25,000 | 28 (65.1%) | 15 (34.9%) |
| $25,000 to $49,999 | 245 (92.4%) | 20 (7.5%) |
| $50,000 to $74,999 | 93 (96.9%) | 3 (3.1%) |
| $75,000 to $99,999 | 73 (100.0%) | 0 (0.0%) |
| $100,000 and over | 135 (97.8%) | 3 (2.2%) |
Public vs Private Health Insurance Coverage by Age in Island
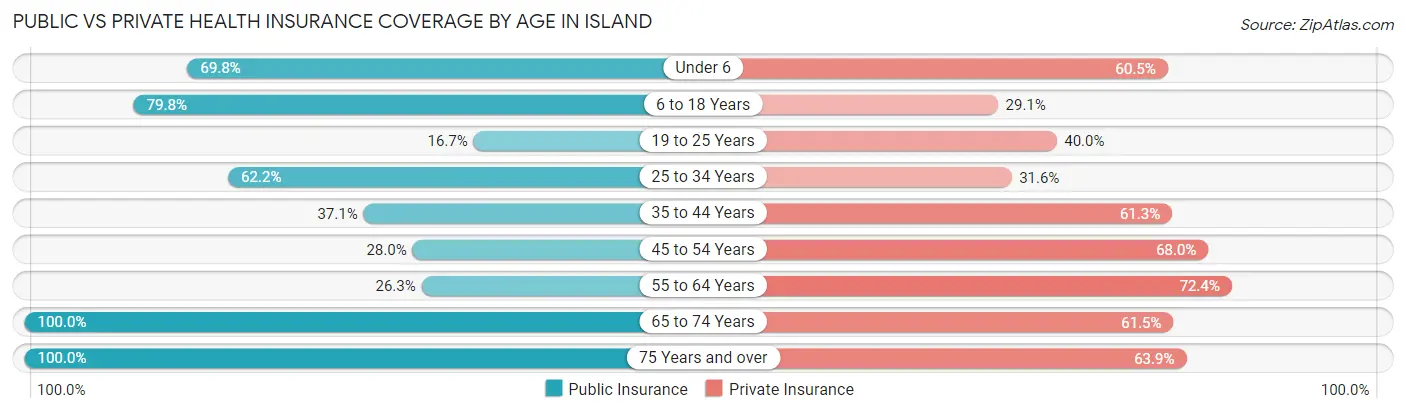
| Age Bracket | Public Insurance | Private Insurance |
| Under 6 | 30 (69.8%) | 26 (60.5%) |
| 6 to 18 Years | 63 (79.7%) | 23 (29.1%) |
| 19 to 25 Years | 5 (16.7%) | 12 (40.0%) |
| 25 to 34 Years | 61 (62.2%) | 31 (31.6%) |
| 35 to 44 Years | 23 (37.1%) | 38 (61.3%) |
| 45 to 54 Years | 21 (28.0%) | 51 (68.0%) |
| 55 to 64 Years | 20 (26.3%) | 55 (72.4%) |
| 65 to 74 Years | 91 (100.0%) | 56 (61.5%) |
| 75 Years and over | 61 (100.0%) | 39 (63.9%) |
| Total | 375 (61.0%) | 331 (53.8%) |
Disability Status by Sex by Age in Island
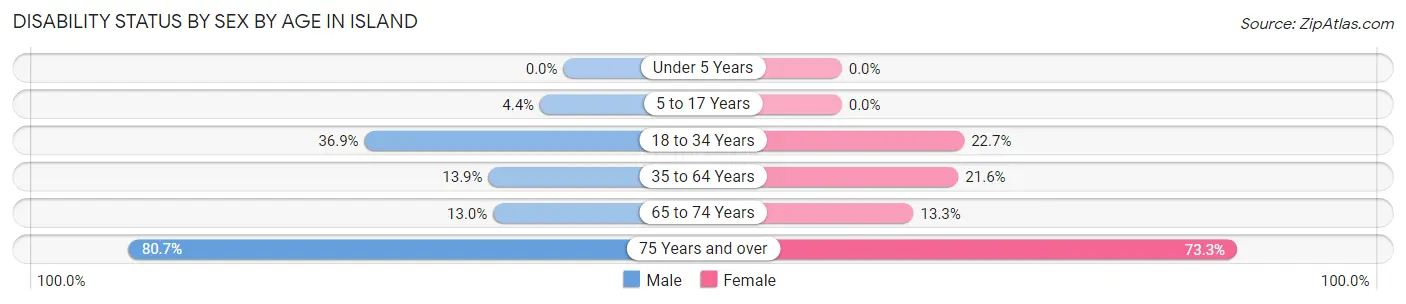
| Age Bracket | Male | Female |
| Under 5 Years | 0 (0.0%) | 0 (0.0%) |
| 5 to 17 Years | 1 (4.3%) | 0 (0.0%) |
| 18 to 34 Years | 24 (36.9%) | 15 (22.7%) |
| 35 to 64 Years | 11 (13.9%) | 29 (21.6%) |
| 65 to 74 Years | 6 (13.0%) | 6 (13.3%) |
| 75 Years and over | 25 (80.6%) | 22 (73.3%) |
Disability Class by Sex by Age in Island
Disability Class: Hearing Difficulty
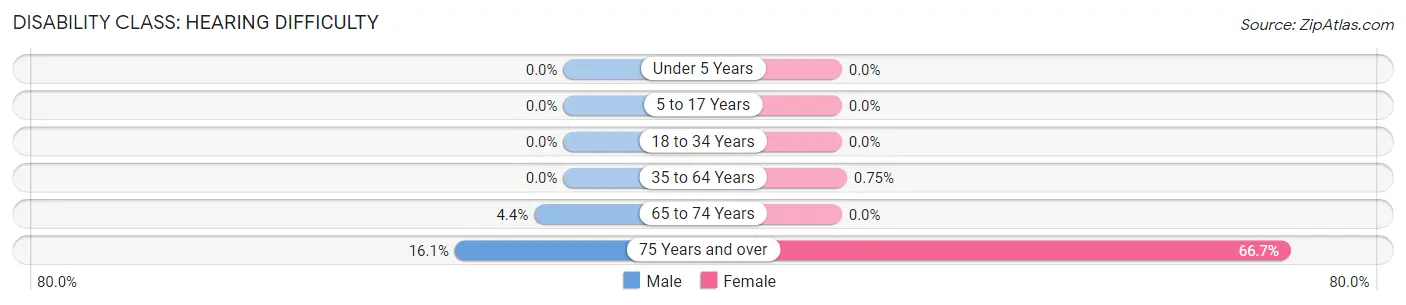
| Age Bracket | Male | Female |
| Under 5 Years | 0 (0.0%) | 0 (0.0%) |
| 5 to 17 Years | 0 (0.0%) | 0 (0.0%) |
| 18 to 34 Years | 0 (0.0%) | 0 (0.0%) |
| 35 to 64 Years | 0 (0.0%) | 1 (0.7%) |
| 65 to 74 Years | 2 (4.3%) | 0 (0.0%) |
| 75 Years and over | 5 (16.1%) | 20 (66.7%) |
Disability Class: Vision Difficulty
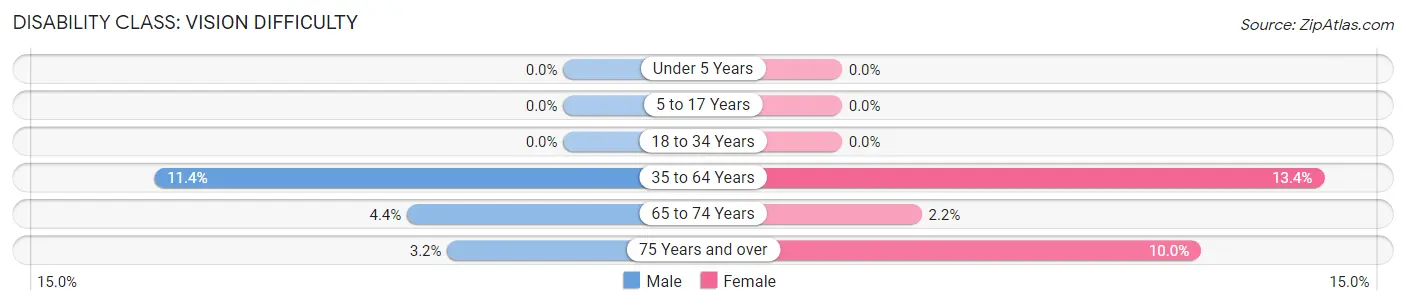
| Age Bracket | Male | Female |
| Under 5 Years | 0 (0.0%) | 0 (0.0%) |
| 5 to 17 Years | 0 (0.0%) | 0 (0.0%) |
| 18 to 34 Years | 0 (0.0%) | 0 (0.0%) |
| 35 to 64 Years | 9 (11.4%) | 18 (13.4%) |
| 65 to 74 Years | 2 (4.3%) | 1 (2.2%) |
| 75 Years and over | 1 (3.2%) | 3 (10.0%) |
Disability Class: Cognitive Difficulty
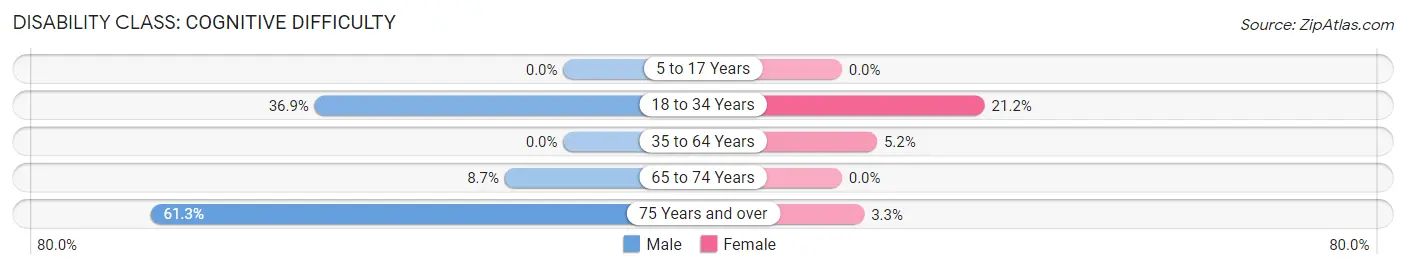
| Age Bracket | Male | Female |
| 5 to 17 Years | 0 (0.0%) | 0 (0.0%) |
| 18 to 34 Years | 24 (36.9%) | 14 (21.2%) |
| 35 to 64 Years | 0 (0.0%) | 7 (5.2%) |
| 65 to 74 Years | 4 (8.7%) | 0 (0.0%) |
| 75 Years and over | 19 (61.3%) | 1 (3.3%) |
Disability Class: Ambulatory Difficulty
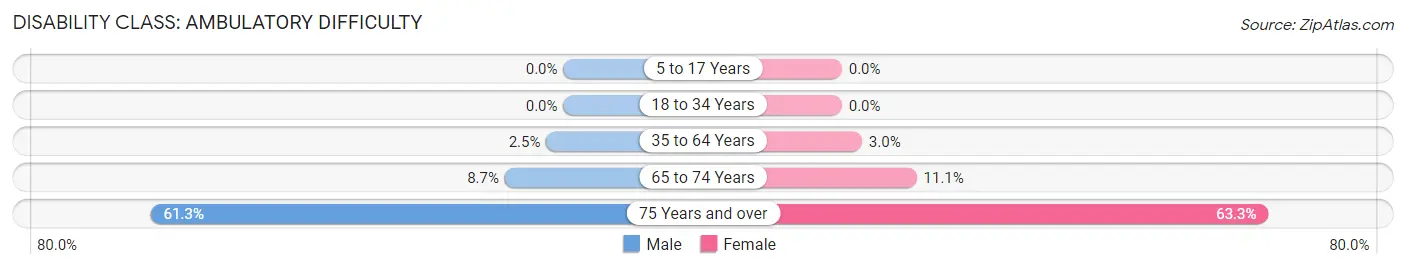
| Age Bracket | Male | Female |
| 5 to 17 Years | 0 (0.0%) | 0 (0.0%) |
| 18 to 34 Years | 0 (0.0%) | 0 (0.0%) |
| 35 to 64 Years | 2 (2.5%) | 4 (3.0%) |
| 65 to 74 Years | 4 (8.7%) | 5 (11.1%) |
| 75 Years and over | 19 (61.3%) | 19 (63.3%) |
Disability Class: Self-Care Difficulty
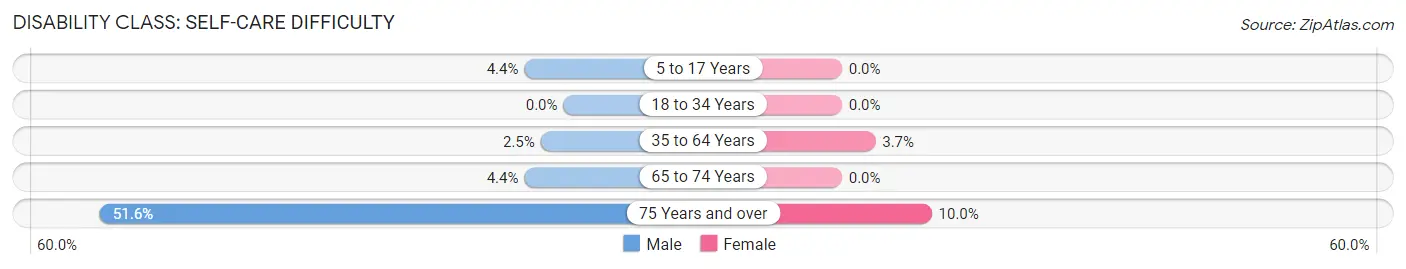
| Age Bracket | Male | Female |
| 5 to 17 Years | 1 (4.3%) | 0 (0.0%) |
| 18 to 34 Years | 0 (0.0%) | 0 (0.0%) |
| 35 to 64 Years | 2 (2.5%) | 5 (3.7%) |
| 65 to 74 Years | 2 (4.3%) | 0 (0.0%) |
| 75 Years and over | 16 (51.6%) | 3 (10.0%) |
Technology Access in Island
Computing Device Access in Island
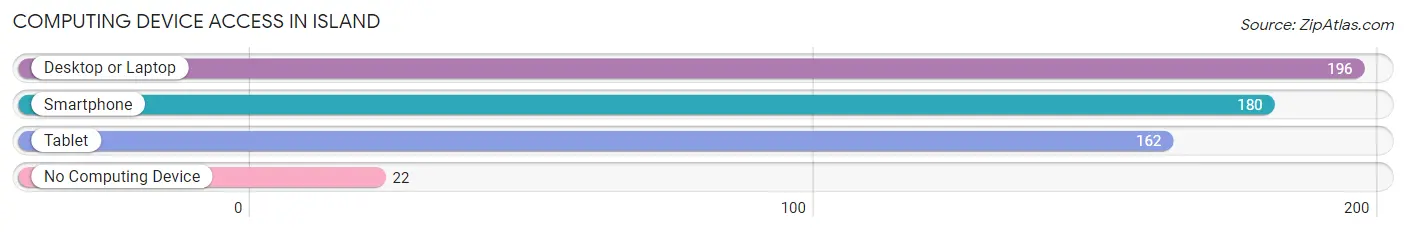
| Device Type | # Households | % Households |
| Desktop or Laptop | 196 | 75.4% |
| Smartphone | 180 | 69.2% |
| Tablet | 162 | 62.3% |
| No Computing Device | 22 | 8.5% |
| Total | 260 | 100.0% |
Internet Access in Island
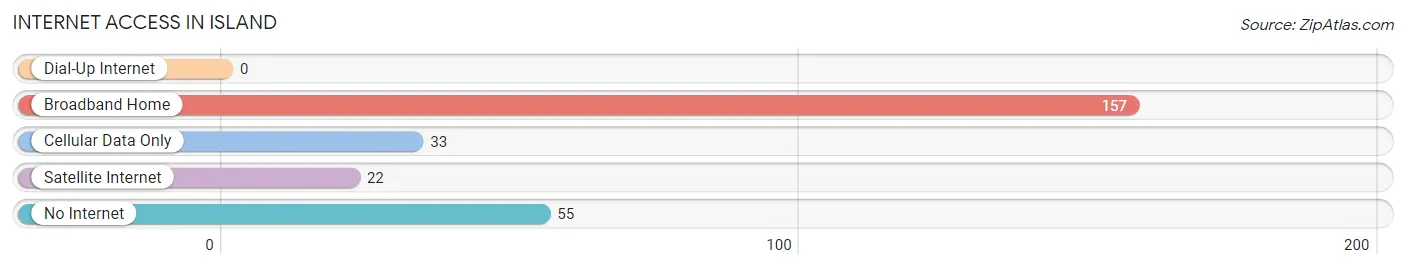
| Internet Type | # Households | % Households |
| Dial-Up Internet | 0 | 0.0% |
| Broadband Home | 157 | 60.4% |
| Cellular Data Only | 33 | 12.7% |
| Satellite Internet | 22 | 8.5% |
| No Internet | 55 | 21.1% |
| Total | 260 | 100.0% |
Island Summary
Island, Kentucky is a small unincorporated community located in the western part of the state, in McLean County. It is situated on the banks of the Green River, and is surrounded by rolling hills and farmland. The population of Island, Kentucky was estimated to be around 200 people in 2020.
Geography
Island, Kentucky is located in the western part of the state, in McLean County. It is situated on the banks of the Green River, and is surrounded by rolling hills and farmland. The area is known for its scenic beauty, and is home to a variety of wildlife, including deer, wild turkeys, and bald eagles. The climate in Island, Kentucky is generally mild, with temperatures ranging from the mid-50s in the winter to the mid-80s in the summer.
Economy
The economy of Island, Kentucky is largely based on agriculture. The area is home to several farms, which produce a variety of crops, including corn, soybeans, wheat, and hay. The area is also home to several small businesses, including a gas station, a grocery store, and a few restaurants.
Demographics
The population of Island, Kentucky was estimated to be around 200 people in 2020. The majority of the population is white, with a small percentage of African Americans and Native Americans. The median household income in Island, Kentucky is around $35,000, and the median age is around 40 years old.
History
Island, Kentucky was first settled in the early 1800s by a group of settlers from Virginia. The area was originally known as “Island Station”, and was a stop on the Louisville and Nashville Railroad. The area was later renamed “Island”, and the community grew steadily over the years. In the late 1800s, the area was home to several businesses, including a general store, a blacksmith shop, and a post office.
In the early 1900s, the area was home to several coal mines, which provided employment for many of the residents. The coal industry declined in the mid-1900s, and the area began to decline as well. In the late 1900s, the area began to experience a resurgence, as new businesses began to move into the area. Today, Island, Kentucky is a small, rural community with a population of around 200 people.
Common Questions
What is Per Capita Income in Island?
Per Capita income in Island is $25,163.
What is the Median Family Income in Island?
Median Family Income in Island is $63,819.
What is the Median Household income in Island?
Median Household Income in Island is $47,857.
What is Income or Wage Gap in Island?
Income or Wage Gap in Island is 31.2%.
Women in Island earn 68.8 cents for every dollar earned by a man.
What is Family Income Deficit in Island?
Family Income Deficit in Island is $3,529.
Families that are below poverty line in Island earn $3,529 less on average than the poverty threshold level.
What is Inequality or Gini Index in Island?
Inequality or Gini Index in Island is 0.36.
What is the Total Population of Island?
Total Population of Island is 615.
What is the Total Male Population of Island?
Total Male Population of Island is 249.
What is the Total Female Population of Island?
Total Female Population of Island is 366.
What is the Ratio of Males per 100 Females in Island?
There are 68.03 Males per 100 Females in Island.
What is the Ratio of Females per 100 Males in Island?
There are 146.99 Females per 100 Males in Island.
What is the Median Population Age in Island?
Median Population Age in Island is 43.6 Years.
What is the Average Family Size in Island
Average Family Size in Island is 2.7 People.
What is the Average Household Size in Island
Average Household Size in Island is 2.4 People.
How Large is the Labor Force in Island?
There are 241 People in the Labor Forcein in Island.
What is the Percentage of People in the Labor Force in Island?
47.8% of People are in the Labor Force in Island.
What is the Unemployment Rate in Island?
Unemployment Rate in Island is 15.4%.